Page 1 Biology 3 - Ysgol Bro...
40
www.bangor.ac.uk/GCSErevision 1 The Circulatory System 2 Investigating Stomata 21 Blood 3 Comparing Water Loss From Leaves 22 Red and White Blood Cells 4 Using a Simple Potometer to Measure Transpiration Rate 23 Platelets and Plasma 5 Structure of a Leaf 24 The Heart 6 The Transpiration Stream 25 Blood vessels 8 The Active Uptake of Mineral Ions by Plant Roots 26 The Eye 9 Plant Transport Systems 27 The Nervous System 10 Healthy Plant Growth 29 The Reflex Arc 11 Microorganisms and Disease 30 The Structure of a Reflex Arc 12 The Immune Response 31 Homeostasis and the Kidneys 13 Immunity 32 Structure of the Kidney 14 Vaccination 33 How do the kidneys remove urea and excess mineral salts? 15 Antibiotics 35 Water Balance and Osmoregulation 16 Investigating the effect of antibiotics on bacteria growing on agar plates 36 Kidney Failure 17 Growing Bacteria 37 Kidney Transplants 18 Investigating the effect of temperature on the growth of bacteria 38 Investigating water loss in plants 19 Penicillin 39 Estimating the rate of transpiration from a plant cutting 20 Using Microbes for Food Production 40 GCSE Science: Biology 3 Revision Book Content
-
Upload
truongduong -
Category
Documents
-
view
214 -
download
0
Transcript of Page 1 Biology 3 - Ysgol Bro...
www.bangor.ac.uk/GCSErevision 1
The Circulatory System 2 Investigating Stomata 21
Blood 3 Comparing Water Loss From Leaves 22
Red and White Blood Cells 4 Using a Simple Potometer to Measure Transpiration Rate 23
Platelets and Plasma 5 Structure of a Leaf 24
The Heart 6 The Transpiration Stream 25
Blood vessels 8 The Active Uptake of Mineral Ions by Plant Roots 26
The Eye 9 Plant Transport Systems 27
The Nervous System 10 Healthy Plant Growth 29
The Reflex Arc 11 Microorganisms and Disease 30 The Structure of a Reflex Arc 12 The Immune Response 31 Homeostasis and the Kidneys 13 Immunity 32 Structure of the Kidney 14 Vaccination 33 How do the kidneys remove urea and excess mineral salts? 15 Antibiotics 35
Water Balance and Osmoregulation 16 Investigating the effect of antibiotics on bacteria growing on agar plates 36
Kidney Failure 17 Growing Bacteria 37
Kidney Transplants 18 Investigating the effect of temperature on the growth of bacteria 38
Investigating water loss in plants 19 Penicillin 39
Estimating the rate of transpiration from a plant cutting 20 Using Microbes for Food Production 40
GCSE Science:
Biology 3 Revision Book
Content

Blood and Circulation
2 www.bangor.ac.uk/GCSErevision
Harvey’s Approach Prior to Harvey’s discovery, it was thought that the blood was formed in the liver, and was used up as it went around the body.
Harvey used a scientific approach, which included:
• Dissection of humans and other animals.
• A detailed study of the structure of the heart.
• Observation of living hearts in fish. • Experiments on human circulation. • Mathematical models.
Pri
Fig. 1 William Harvey
A Historical Perspective In the early 1600s William Harvey, a physician to King Charles I. suggested that blood circulated around the body, flowing from the heart through arteries and returning through veins.
Fig. 2 Harvey’s experiment on human circulation.
The Pulmonary circulation Blood pumped form the heart to the lungs and back to the heart.
The Systemic Circulation Blood pumped form the heart to the body and then back to the heart.
The Human Circulatory System - A double circulatory system. The blood must pass through the heart twice before completing one whole circuit of the body.
Oxygen enters the blood in the lungs.
Oxygen enters the blood in the lungs.
Right side
Left side
Fig. 3 Diagram showing a double circulatory system.
Oxygenated blood
Deoxygenated blood

Blood and Circulation
www.bangor.ac.uk/GCSErevision 3
Blood
Blood is made up of
Red blood cells carry oxygen
White blood cells defend the body against pathogens
Platelets clotting of blood
Plasma carries dissolved substances
Red blood cell
Fig.3 – Illustration of blood smear
Platelet White blood cell
Fig 2. Micrograph of a blood smear. The centre of red blood cells appear paler because they have no nucleus and therefore more light from the microscope passes through them.
Fig. 1 – Illustration of the components of blood.
Examining blood smears (These are diagrams you should be able to label).

Blood and Circulation
4 www.bangor.ac.uk
Blood
Red Blood Cells. These cells carry oxygen around the body. They are flattened, biconcave, disc shaped cells; they are red in colour because of a pigment called haemoglobin. This joins with oxygen to transport it around the body. Red blood cells don’t have a nucleus. Iron is needed to produce haemoglobin. If there is a shortage of iron a person won’t have enough red blood cells, this is called anaemia, less oxygen will be carried around the body.
Fig. 1 – micrograph of red blood cells
White blood cells These cells defend the body against pathogens (microbes that cause disease). They are bigger than red blood cells, and have a nucleus, but don’t contain a pigment so are colourless. If you have an infection the number of white blood cells in you body increases rapidly. There are many types pf white blood cells, but you only need to learn about two of them:
• Phagocytes – ingest and digest ‘foreign’ cells. • Lymphocytes – produce antibodies and antitoxins.
Comparing red and white blood cells (You should be able to draw, label and compare a red and white blood cell) Red blood cells Fig. 2 – side view (left )and front view (right) of red blood cell (not to scale)
White blood cells Fig. 3 –white blood cell (phagocyte) (not to scale)
No nucleus present Nucleus present Regular disc shaped Irregular shape Smaller than white blood cells Larger than red blood cells
cell membrane
cell membrane
nucleus
Blood and Circulation
www.bangor.ac.uk/GCSErevision 5
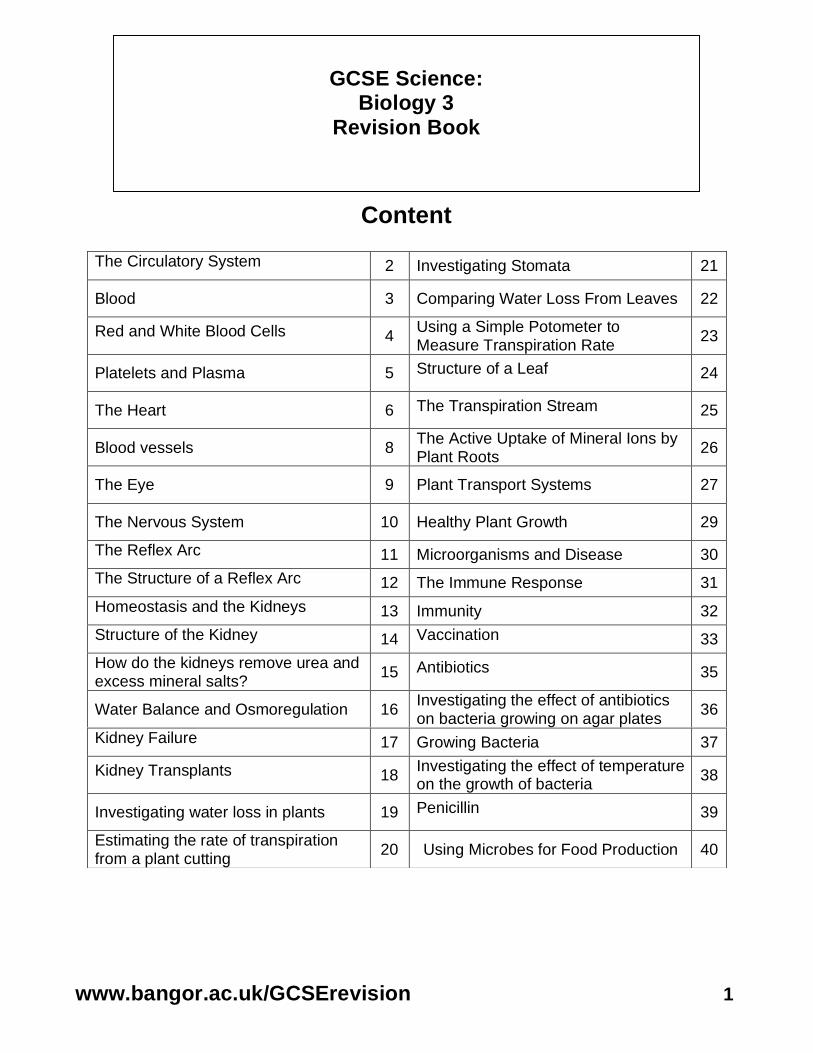
. Platelets Platelets clot the blood. When the skin is cut you bleed. Platelets make the blood clot, forming a thick jelly. This hardens to form a scab, preventing bleeding and blood loss. The scab keeps the wound clean as new skin grows underneath. This prevents pathogens from entering the body and bacterial infection.
Fig. 1 – micrograph showing red blood cells clotting.
Fig 2. – Illustration of blood clotting in a wound
Plasma Plasma carries dissolved substances. This is the liquid part of blood. It is pale yellow in colour and is 90% water. Plasma carries many dissolved substances around the body:
• Small soluble food molecules, e.g. glucose, amino acids, etc. • Waste chemicals produced by the body, e.g. carbon dioxide from
respiration and urea produced by the liver. • Hormones carried from the endocrine glands to their target organs,
e.g. insulin. • Antibodies produced by lymphocytes (white blood cells). • Mineral salts, e.g. sodium ions.
Blood and Circulation
6 www.bangor.ac.uk/GCSErevision
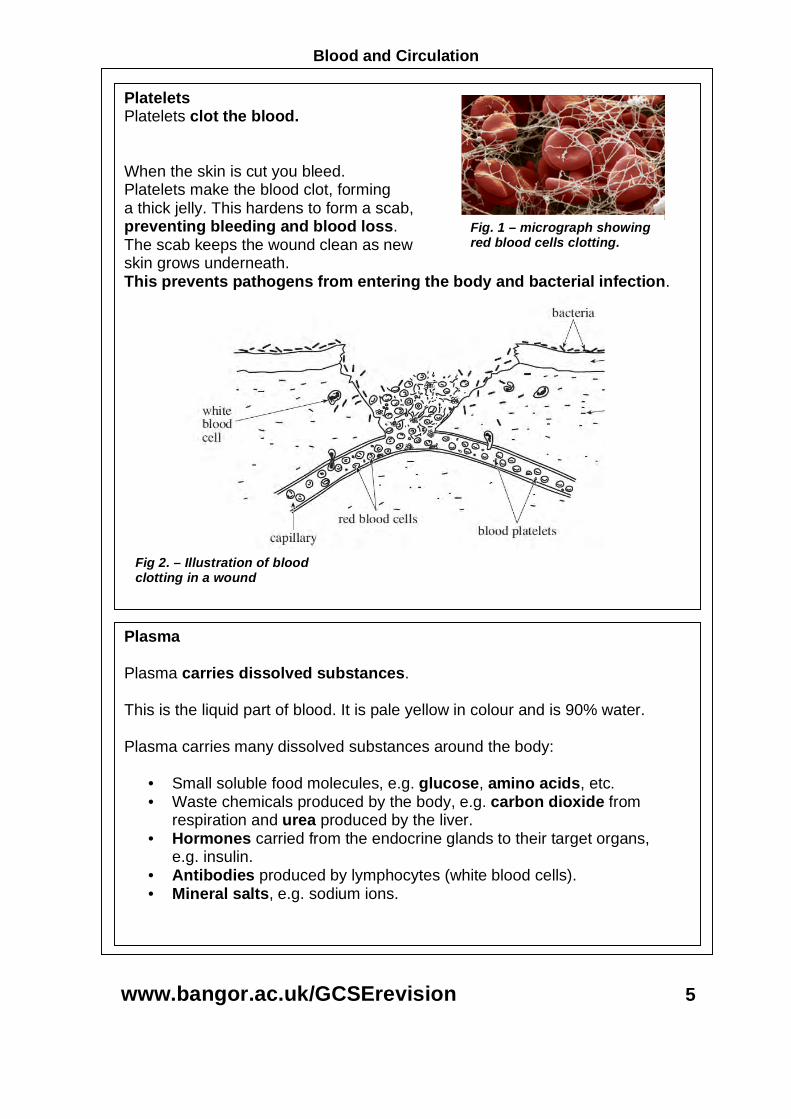
The Heart
Structure of The Heart The function of the heart is to pump blood. The heart is made of a special muscle called cardiac muscle.
There are blood vessels on the outside of the heart – the coronary arteries. These supply oxygen and glucose to the heart muscle. Without a steady supply of oxygenated blood the heart muscle couldn’t keep contracting and pumping blood. If a blood clot blocks a coronary artery, the heart muscles won’t get enough oxygen and will stop working – this is a heart attack.
Fig. 1 – Illustration showing the outside of a human heart. The blood vessels shown are the coronary arteries.
Valves prevent backflow of blood when ventricles relax.
Aorta artery carrying blood to the body.
Pulmonary vein carrying oxygenated blood from the lungs to the heart.
Left ventricle
Valve prevents backflow of blood to atrium when the ventricle contracts.
Left ventricle
Pulmonary artery carrying deoxygenated blood from the lungs to the heart.
Vena Cava vein carrying blood from the body back to the heart.
Right atrium
Right ventricle
Fig. 2 – illustration showing internal structure of the heart.
Blood and Circulation
www.bangor.ac.uk/GCSErevision 7
Facts you must learn about the heart:
• The heart is divided into 2 halves. • Blood flows in one direction through each half of the heart. • There are valves between the atria and ventricles. These can close to
stop backflow of blood when the ventricles contract. • There are valves at the bottom of the bottom of the pulmonary artery and
aorta to prevent backflow of blood to the ventricles when they relax. • There are tendons attached to the valves so they don’t get pushed inside
out. • The right side of the heart pumps blood to the lungs. • The left side of the heart pumps blood to the body. • The atria (more than one atrium) have thin walls because they only pump
blood to the ventricles. • The ventricles have thick muscular walls, because when they contract
they have to pump blood out of the heart. • The left ventricle has a thicker muscular wall than the right ventricle
because it pumps blood to all parts of the body – the right ventricle only pumps blood to the lungs.
Flow of Blood Through the Heart
• The vena cava carries blood from the organs of the body to the right atrium.
• Blood passes through a valve to the right ventricle. • The right ventricle contracts, pumping blood through the valve into the
pulmonary artery. • The pulmonary artery carries the blood to the lungs where it is
oxygenated. • The pulmonary vein carries blood back from the lungs to the left
atrium. • Blood passes through the valve into the left ventricle. • The left ventricle contracts, pumping blood through the valve into the
aorta. • The aorta carries blood form the heart to the organs of the body.
QWC questions sometimes ask you to describe the flow of blood through the heart. Always check to see where you need to start and finish. Remember, you will lose marks by including irrelevant information!

Blood and Circulation
8 www.bangor.ac.uk/GCSErevision
Blood Vessels
Fig.1 – (Left to right) Illustration of an artery, capillary and vein (not drawn to scale).
• Arteries have thick walls because they carry blood under pressure away from the heart.
• Veins have thins walls because they carry blood under low pressure back to the heart.
Artery
Arteriole
Capillaries
Vein
Venule
Fig. 2 Illustration showing structural relationship between blood vessels.
Capillary Body cells
1 2
Fig. 3 Diffusion between cells and capillaries. 1 Oxygen and glucose. 2. Carbon dioxide.
Capillaries are the smallest blood vessels that carry blood through the organs of the body.
• They form extensive networks so that no cell is far away from a capillary. • Their walls are very thin to allow materials to diffuse easily between the
blood and the body cells.

Nervous System
www.bangor.ac.uk/GCSErevision 9
Internal Structure of the Eye
Tear gland behind the eyelid.
Pupil Eyelid - blinks to protect the eye.
Iris - a coloured muscle. Sclera
Fig. 1 – Front view of an eye in bright light (left) and in dim light (right). The iris controls how much light enters the eye by changing the size of the pupil. This reflex action protects the retina.
Lens – changes shape to focus light onto retina.
Optic nerve – carries impulses from retina to brain. Blind spot – where the
optic nerve leaves the eye, there are no light sensitive cells here.
Retina – light sensitive layer an image is formed here, impulses sent to optic nerve.
Choroid – a pigmented layer which absorbs light to prevent reflection, also contains blood vessels
Cornea – clear part of sclera allows light to enter and refracts light entering.
Iris – muscles that alter size of pupil to control amount of light entering.
Pupil – hole in centre of the iris which allows light to enter.
Fig. 2 – vertical section through the eye.
Sclera – protective, tough white outer coat.
The Eye The eye is a sense organ that contains light receptors.

Nervous System
10 www.bangor.ac.uk/GCSErevision
The Nervous System
Humans have 5 sense organs connected to the nervous system. Each sense organ is made up of special cells called receptors. The receptors can respond to a certain stimulus. The receptors collect information from out surroundings and pass the information as electrical impulses along neurones to the central nervous system. The central nervous system (the brain or spinal cord) can then store the information or decide on a reaction.
Central nervous system:
• Brain • Spinal
cord
Reflex Actions Examples of reflex actions: Reflex Explanation Blinking Protection of the eye Change in pupil diameter Protection of the retina Withdrawal / pulling away Prevent harm to the body Sneezing Expel substances form the nose Knee jerk Helps maintain posture
Fig. 1 Illustration of central nervous system
Reflex actions are: • protective, • automatic, • fast.
Fig. 2 – Illustration of a knee jerk reflex. When the hammer strikes the tendon below the knee cap tension increases in the leg muscle, causing it to contract. This reflex helps keep us upright.

Nervous System
www.bangor.ac.uk/GCSErevision 11
The Reflex Arc
1. Stimulus = heat
2. Receptor = skin
3. Sensory neurone 4. Co-ordinator = spinal cord
5. Motor neurone
6. Effector = muscle
Fig. 1 – A typical withdrawal reflex
All reflex actions follow the same order:
1. Stimulus
2. Receptor
3. Sensory neurone
4. Co-ordinator
5. Motor neurone
6. Effector
7. Response
The co-ordinator is always either the brain or the spinal cord. The effector is always a muscle or a gland.

Nervous System
12 www.bangor.ac.uk/GCSErevision
The Structure of a Reflex Arc
Describing the path taken by a nerve impulse from the receptor to the effector. (This is always a potential QWC question).
• The stimulus (heat) is detected by receptors in the skin. • The receptor responds and sends and electrical impulse along a
sensory neurone to the co-ordinator (the spinal cord). • The electrical impulse is passed to a relay neurone inside the spinal
cord and then on to the motor neurone. • Between each neurone is a tiny gap called a synapse. • The motor neurone carries the impulse to the effector (the muscle). • The muscle contracts and pulls the hand away from the stimulus; this is
the response.
1. Stimulus = heat
2. Receptor = skin
3. Sensory nerve
4. Co-ordinator = spinal cord
5. Motor nerve 6. Effector = muscle
Synapse
Relay neurone
Fig. 1 – The structure of a reflex arc showing relative positions of each neurone.
Role of the Kidneys in Homeostasis
www.bangor.ac.uk/GCSErevision 13
Homeostasis and the Kidneys
Homeostasis means keeping the internal environment constant
Conditions inside the body must be kept stable. Examples to learn:
• Water content of the body must be kept constant, • Waste chemicals must be removed from the body, • Body temperature must remain constant. (See Biology 1) • Glucose levels must remain constant. (See Biology 1)
The Kidneys The kidneys have three functions in the body:
1. Control of water content of the blood. 2. Removal of urea from the blood. 3. Removal of excess mineral salts from the blood.
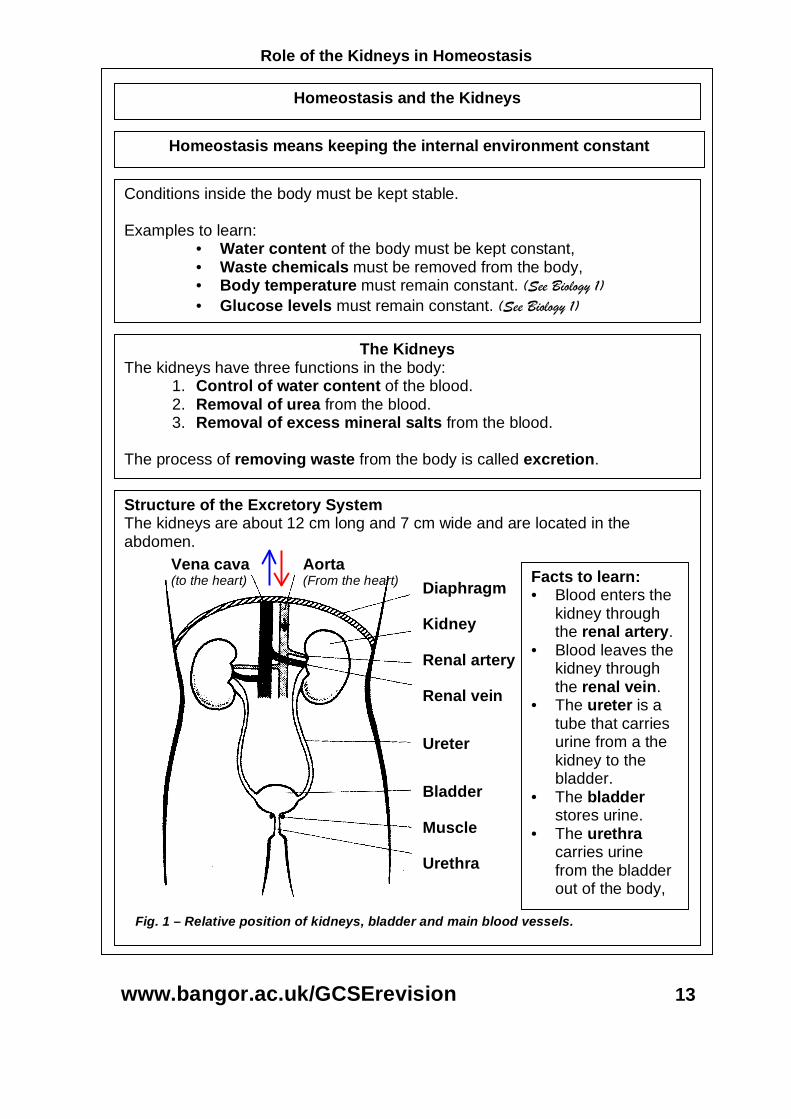
The process of removing waste from the body is called excretion. Structure of the Excretory System The kidneys are about 12 cm long and 7 cm wide and are located in the abdomen.
Fig. 1 – Relative position of kidneys, bladder and main blood vessels.
Vena cava (to the heart)
Aorta (From the heart) Diaphragm
Kidney
Renal artery
Renal vein
Ureter
Bladder
Muscle
Urethra
Facts to learn: • Blood enters the
kidney through the renal artery.
• Blood leaves the kidney through the renal vein.
• The ureter is a tube that carries urine from a the kidney to the bladder.
• The bladder stores urine.
• The urethra carries urine from the bladder out of the body,
Role of the Kidneys in Homeostasis
14 www.bangor.ac.uk/GCSErevision
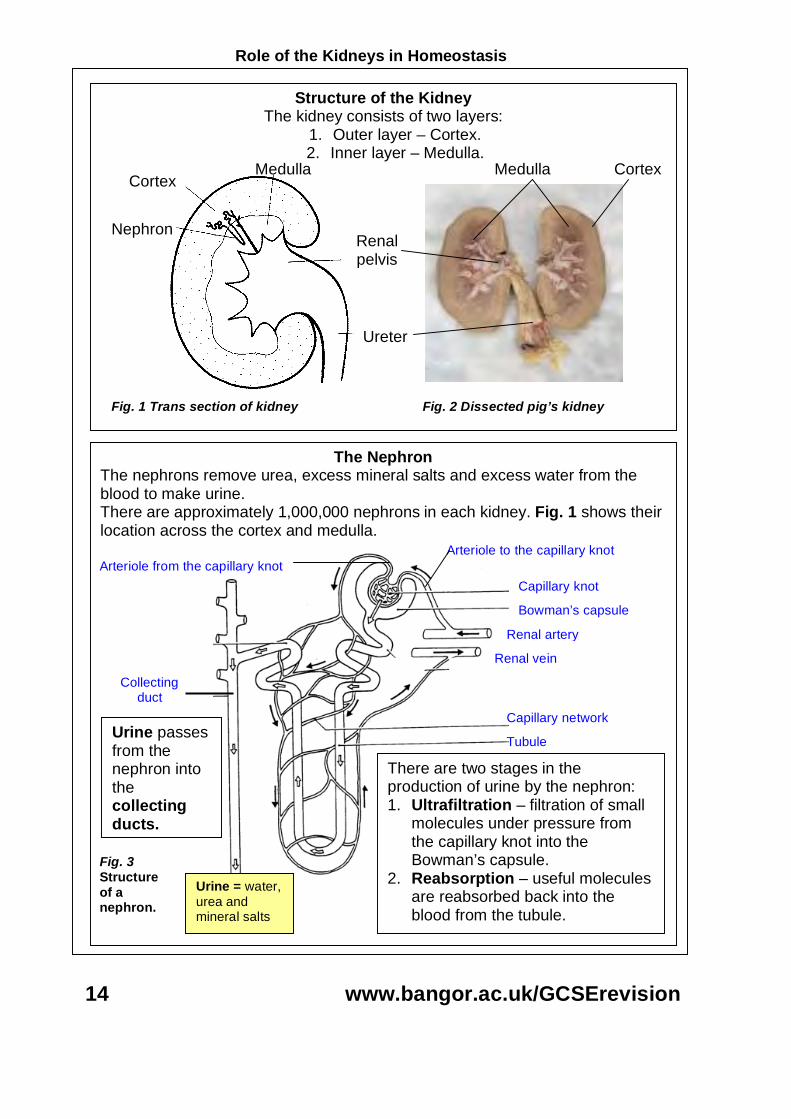
Renal pelvis
Ureter
Nephron
Cortex Medulla Cortex Medulla
Fig. 1 Trans section of kidney Fig. 2 Dissected pig’s kidney
The Nephron The nephrons remove urea, excess mineral salts and excess water from the blood to make urine. There are approximately 1,000,000 nephrons in each kidney. Fig. 1 shows their location across the cortex and medulla.
Urine = water, urea and mineral salts
Collecting duct
Capillary knot
Bowman’s capsule
Arteriole to the capillary knot Arteriole from the capillary knot
Renal artery
Renal vein
Capillary network
Tubule
Fig. 3 Structure of a nephron.
There are two stages in the production of urine by the nephron: 1. Ultrafiltration – filtration of small
molecules under pressure from the capillary knot into the Bowman’s capsule.
2. Reabsorption – useful molecules are reabsorbed back into the blood from the tubule.
Urine passes from the nephron into the collecting ducts.
Structure of the Kidney The kidney consists of two layers:
1. Outer layer – Cortex. 2. Inner layer – Medulla.

Role of the Kidneys in Homeostasis
www.bangor.ac.uk/GCSErevision 15
The table shows some differences in the composition of blood plasma and urine: Substance Blood plasma (%) Urine (%) Protein 9.00 0 Glucose 0.10 0 Urea 0.02 2.00 Mineral Salts 0.75 1.25 Analysis of table:
• There is no protein in the urine because their molecules are too large to be ultrafiltrated from the capillary knot into the Bowman’s Capsule.
• There is no glucose in the urine because it has all been reabsorbed from the tubule back into the blood of the capillary network.
• The percentage of urine and mineral salts has increased because some of the water in the tubule has been reabsorbed, therefore making the filtrate flowing into the collecting duct more concentrated.
The presence of blood or cells in the urine would indicate kidney disease.
Reabsorption • Useful substances such as glucose
and amino acids are reabsorbed from the filtrate in the tubule into the blood in the capillary network.
• Excess mineral salts are also reabsorbed.
• Water is also reabsorbed. (See osmoregulation – page 16)
Capillary knot
Tubule
Urine Capillary network
Bowman’n capsule
Arteriole to the glomerulus
How do the kidneys remove urea and excess mineral salts?
Arteriole to the glomerulus
Ultrafiltration • The arteriole to the capillary knot has a
larger diameter than the arteriole from the capillary knot, this increases blood pressure in the capillary knot.
• Small molecules such as urea, glucose, mineral salts, water and amino acids are filtered under pressure from the blood in the capillary knot into the Bowman’s capsule.
• Large molecules, such as proteins, or red blood cells are too large to be filtered out of the blood.
Fig. 1 Schematic drawing of the nephron.
Role of the Kidneys in Homeostasis
16 www.bangor.ac.uk/GCSErevision
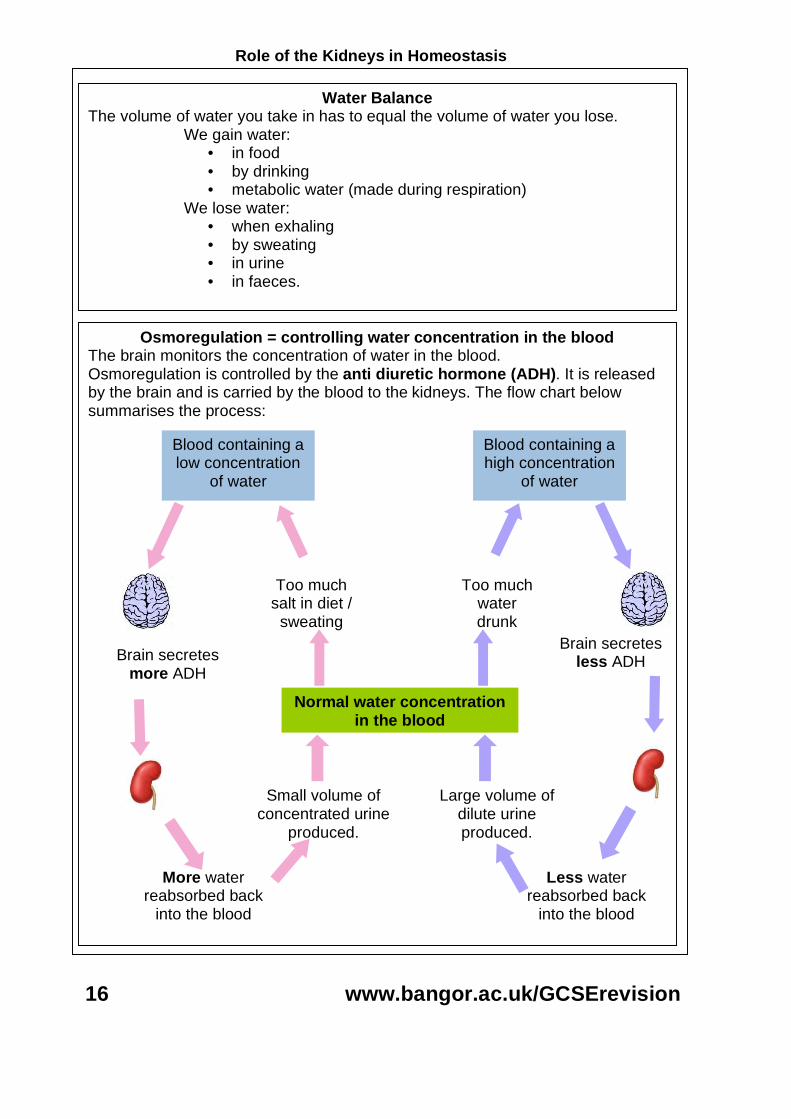
Normal water concentration in the blood
Blood containing a low concentration
of water
Too much water drunk
Too much salt in diet /
sweating
Brain secretes more ADH
Small volume of concentrated urine
produced.
More water reabsorbed back
into the blood
Blood containing a high concentration
of water
Brain secretes less ADH
Less water reabsorbed back
into the blood
Large volume of
dilute urine produced.
Water Balance The volume of water you take in has to equal the volume of water you lose.
We gain water: • in food • by drinking • metabolic water (made during respiration)
We lose water: • when exhaling • by sweating • in urine • in faeces.
Osmoregulation = controlling water concentration in the blood The brain monitors the concentration of water in the blood. Osmoregulation is controlled by the anti diuretic hormone (ADH). It is released by the brain and is carried by the blood to the kidneys. The flow chart below summarises the process:
The Role of the Kidneys in Homeostasis
www.bangor.ac.uk/GCSErevision 17
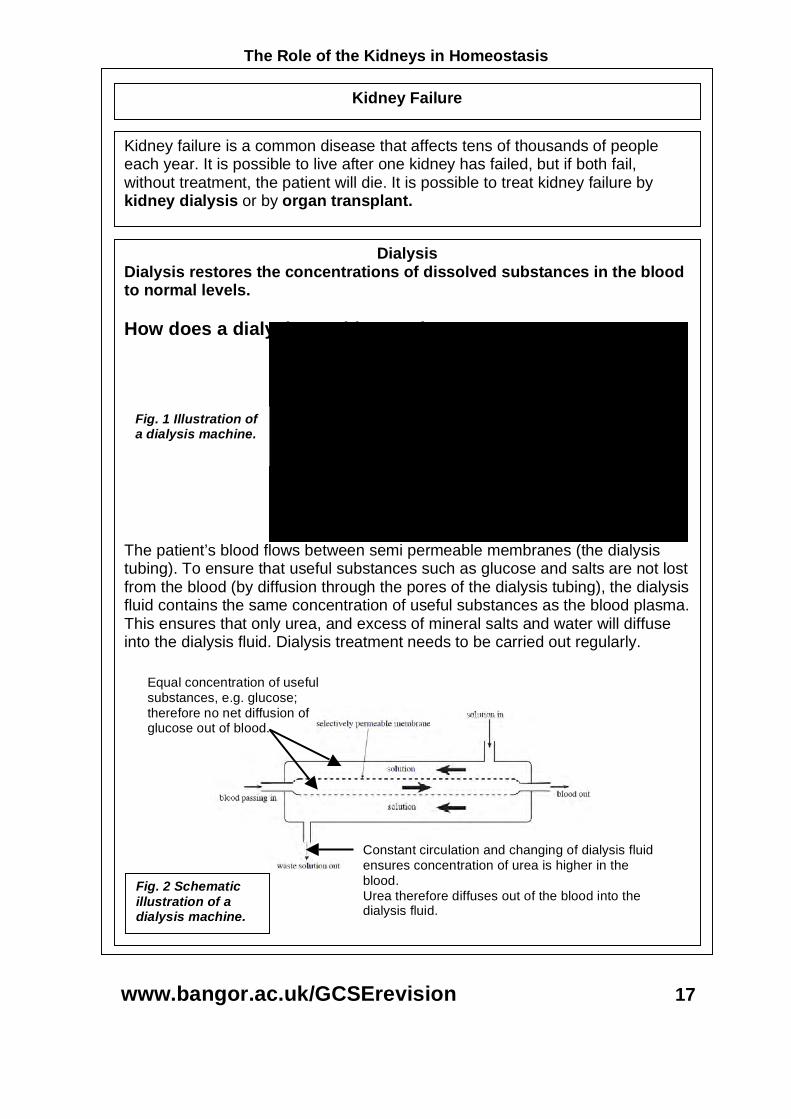
Kidney Failure
Kidney failure is a common disease that affects tens of thousands of people each year. It is possible to live after one kidney has failed, but if both fail, without treatment, the patient will die. It is possible to treat kidney failure by kidney dialysis or by organ transplant.
Fig. 1 Illustration of a dialysis machine.
Equal concentration of useful substances, e.g. glucose; therefore no net diffusion of glucose out of blood.
Constant circulation and changing of dialysis fluid ensures concentration of urea is higher in the blood. Urea therefore diffuses out of the blood into the dialysis fluid.
Fig. 2 Schematic illustration of a dialysis machine.
Dialysis Dialysis restores the concentrations of dissolved substances in the blood to normal levels. How does a dialysis machine work?
The patient’s blood flows between semi permeable membranes (the dialysis tubing). To ensure that useful substances such as glucose and salts are not lost from the blood (by diffusion through the pores of the dialysis tubing), the dialysis fluid contains the same concentration of useful substances as the blood plasma. This ensures that only urea, and excess of mineral salts and water will diffuse into the dialysis fluid. Dialysis treatment needs to be carried out regularly.

Role of the Kidney in Homeostasis
18 www.bangor.ac.uk/GCSErevision
Transplantation
The donor kidney is implanted at the bottom of the abdomen close to the thigh and is connected to the blood supply of the recipient. The failed kidneys are not normally removed. To reduce the chance of rejection before a transplant:
• Doctors make sure that the ‘tissue type’ of the donor and the recipient need to be similar. (Close family members are more likely to have a similar tissue type to the recipient.)
To reduce the chance of rejection after a transplant:
• The donor must take drugs that suppress the immune system. Comparing the advantages and disadvantages of dialysis and a kidney transplant: Dialysis Kidney transplant Temporary treatment Potential to ‘cure’ problem for many
years. Diet restrictions Generally no restriction to diet after
treatment Patient must visit hospital several times a week for treatment.
Patient does not have to visit hospital every week
Non-invasive treatment Treatment involves major surgery No drugs needed Patient must take drugs to suppress
immune system No problems with rejection of treatment
New kidney may be rejected by the body.
Kidney Transplants – ethical Issues There are a number of ethical issues involved with transplants. Some to consider are:
• Xenotransplants • Kidney donor schemes, e.g. presumed consent in Wales • Living donors • Buying and selling of organs • Availability of dialysis machines.
Plants, Water and Nutrients
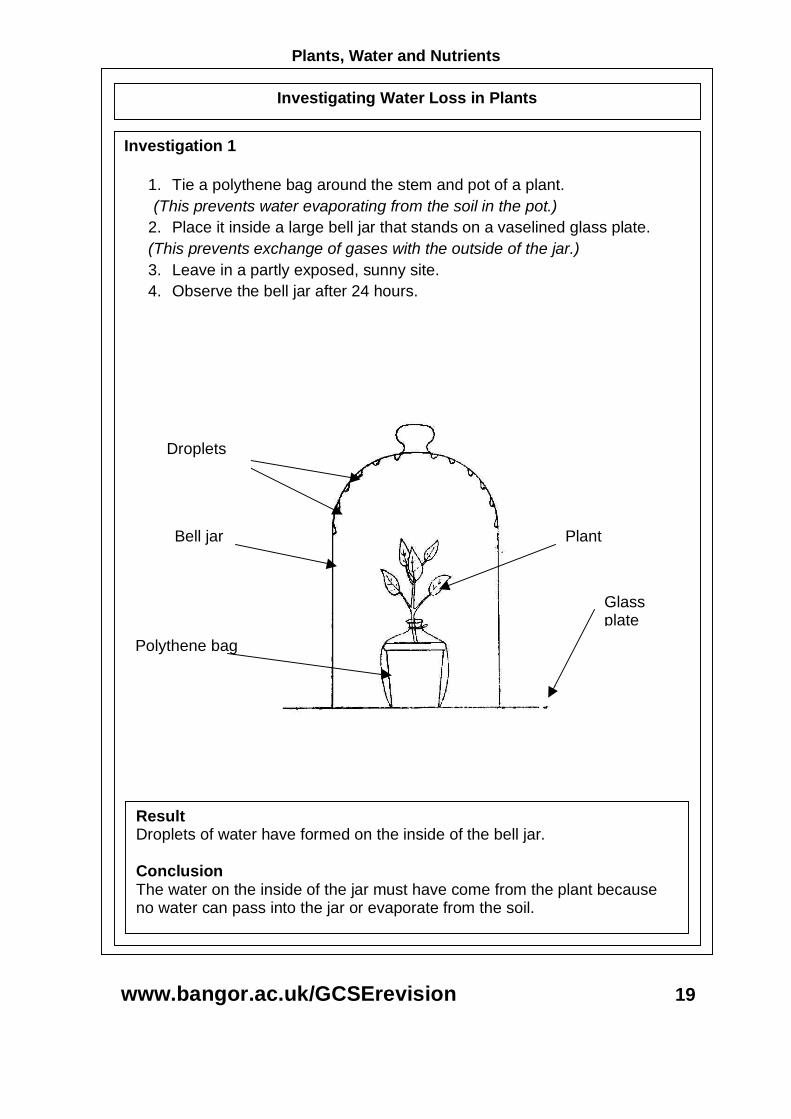
www.bangor.ac.uk/GCSErevision 19
Investigation 1
1. Tie a polythene bag around the stem and pot of a plant. (This prevents water evaporating from the soil in the pot.)
2. Place it inside a large bell jar that stands on a vaselined glass plate. (This prevents exchange of gases with the outside of the jar.) 3. Leave in a partly exposed, sunny site. 4. Observe the bell jar after 24 hours.
Investigating Water Loss in Plants
Bell jar Plant
Glass plate
Polythene bag
Droplets
Result Droplets of water have formed on the inside of the bell jar. Conclusion The water on the inside of the jar must have come from the plant because no water can pass into the jar or evaporate from the soil.
Plants, Water and Nutrients
20 www.bangor.ac.uk/GCSErevision
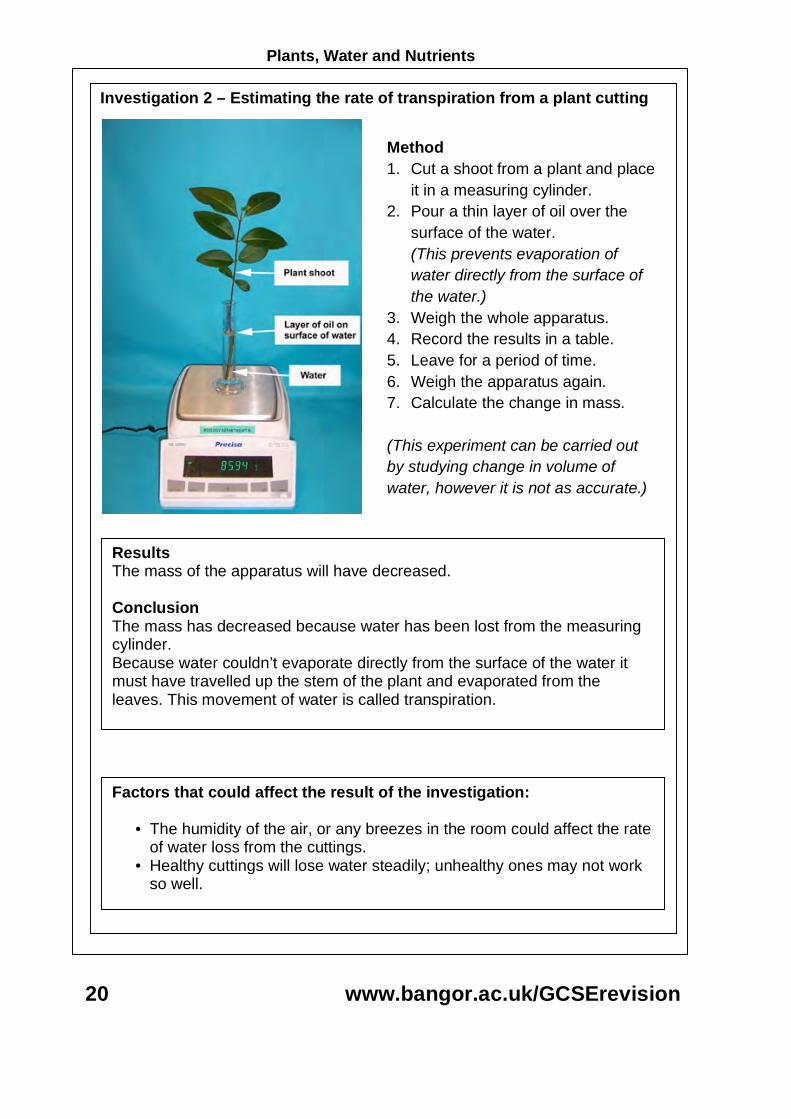
Investigation 2 – Estimating the rate of transpiration from a plant cutting
Method 1. Cut a shoot from a plant and place
it in a measuring cylinder. 2. Pour a thin layer of oil over the
surface of the water. (This prevents evaporation of water directly from the surface of the water.)
3. Weigh the whole apparatus. 4. Record the results in a table. 5. Leave for a period of time. 6. Weigh the apparatus again. 7. Calculate the change in mass. (This experiment can be carried out by studying change in volume of water, however it is not as accurate.)
Results The mass of the apparatus will have decreased. Conclusion The mass has decreased because water has been lost from the measuring cylinder. Because water couldn’t evaporate directly from the surface of the water it must have travelled up the stem of the plant and evaporated from the leaves. This movement of water is called transpiration.
Factors that could affect the result of the investigation:
• The humidity of the air, or any breezes in the room could affect the rate of water loss from the cuttings.
• Healthy cuttings will lose water steadily; unhealthy ones may not work so well.

Plants, Water and Nutrients
www.bangor.ac.uk/GCSErevision 21
Investigation 3 – Investigating Stomata
Method for an epidermal impression of leaf 1. The upper surface of a leaf is painted with a thin layer of clear nail varnish. 2. Leave for 10 – 15 minutes to allow the varnish to dry. 3. Remove the layer of varnish by attaching clear sticky tape to it, peeling it
from the leaf surface and sticking it to a microscope slide. 4. Observe the slide with a microscope and count the number of stomata in the
field of view. 5. Repeat steps 1 to 4 for the lower surface of a leaf. 6. Compare the results.
Fig. 1 Upper surface of a privet leaf showing no stomata present.
Fig. 2 Lower surface of a privet leaf showing stomata present.
The stomata are pores in surface of a leaf that allow water vapour to pass out. They also allow gaseous exchange to occur. A pair of guard cells controls the size of a stoma. These can change their shape causing the stoma to open or close. This allows a plant to control how much water passes out of a leaf.
Fig. 3 Illustration of stomata. The differences in the thickness of the cell walls of the guard cells cause them to change shape when their water content changes leading to opening and closing of the stomatal pore.
Guard cell
Stoma
Nucleus
Thin cell wall
Chloroplast
Thick cell wall
Result The lower surface contains the highest number of stomata. Conclusion The function of stomata is to allow gas exchange between the cells of the leaf and the air, however water is also lost by diffusion through open stomata. Having most of the stomata on the lower surface of the leaf shades them from the heat of the sun, and is an adaptation to reduce water loss.
Plants, Water and Nutrients
22 www.bangor.ac.uk/GCSErevision
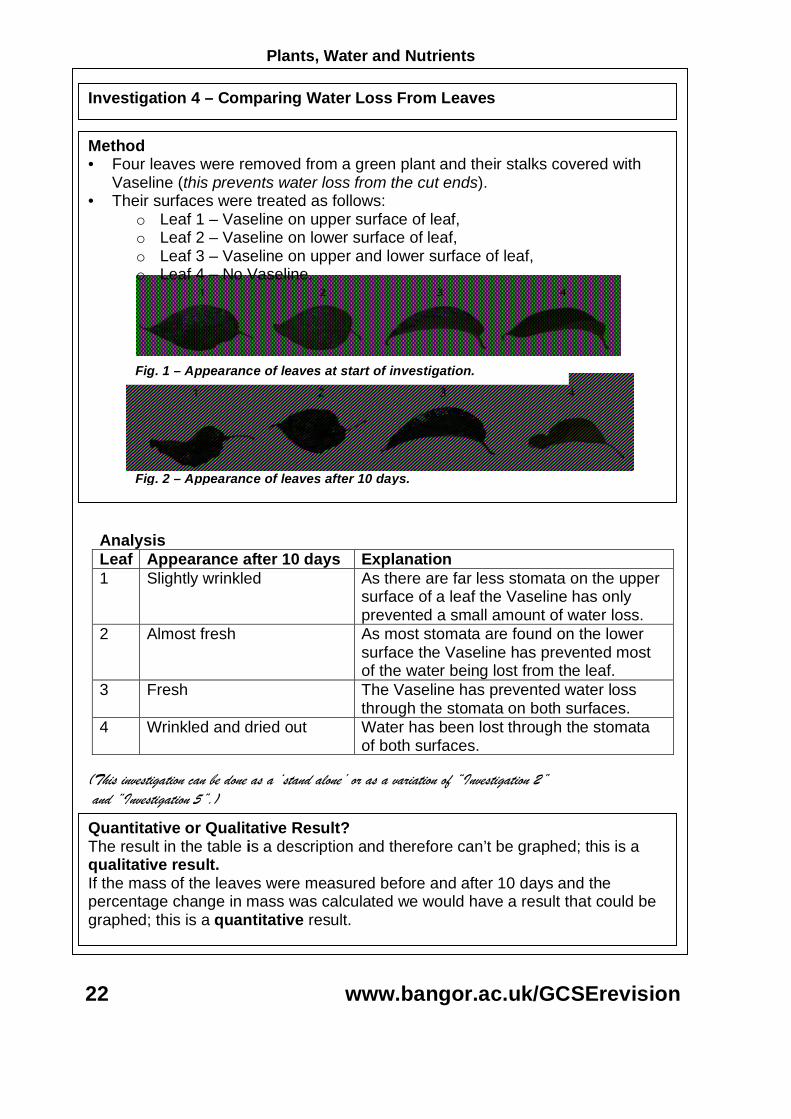
Investigation 4 – Comparing Water Loss From Leaves
Analysis Leaf Appearance after 10 days Explanation 1 Slightly wrinkled As there are far less stomata on the upper
surface of a leaf the Vaseline has only prevented a small amount of water loss.
2 Almost fresh As most stomata are found on the lower surface the Vaseline has prevented most of the water being lost from the leaf.
3 Fresh The Vaseline has prevented water loss through the stomata on both surfaces.
4 Wrinkled and dried out Water has been lost through the stomata of both surfaces.
(This investigation can be done as a ‘stand alone’ or as a variation of “Investigation 2” and “Investigation 5”.)
Quantitative or Qualitative Result? The result in the table is a description and therefore can’t be graphed; this is a qualitative result. If the mass of the leaves were measured before and after 10 days and the percentage change in mass was calculated we would have a result that could be graphed; this is a quantitative result.
Fig. 2 – Appearance of leaves after 10 days.
Fig. 1 – Appearance of leaves at start of investigation.
Method • Four leaves were removed from a green plant and their stalks covered with
Vaseline (this prevents water loss from the cut ends). • Their surfaces were treated as follows:
o Leaf 1 – Vaseline on upper surface of leaf, o Leaf 2 – Vaseline on lower surface of leaf, o Leaf 3 – Vaseline on upper and lower surface of leaf, o Leaf 4 – No Vaseline.
Plants, Water and Nutrients
www.bangor.ac.uk/GCSErevision 23
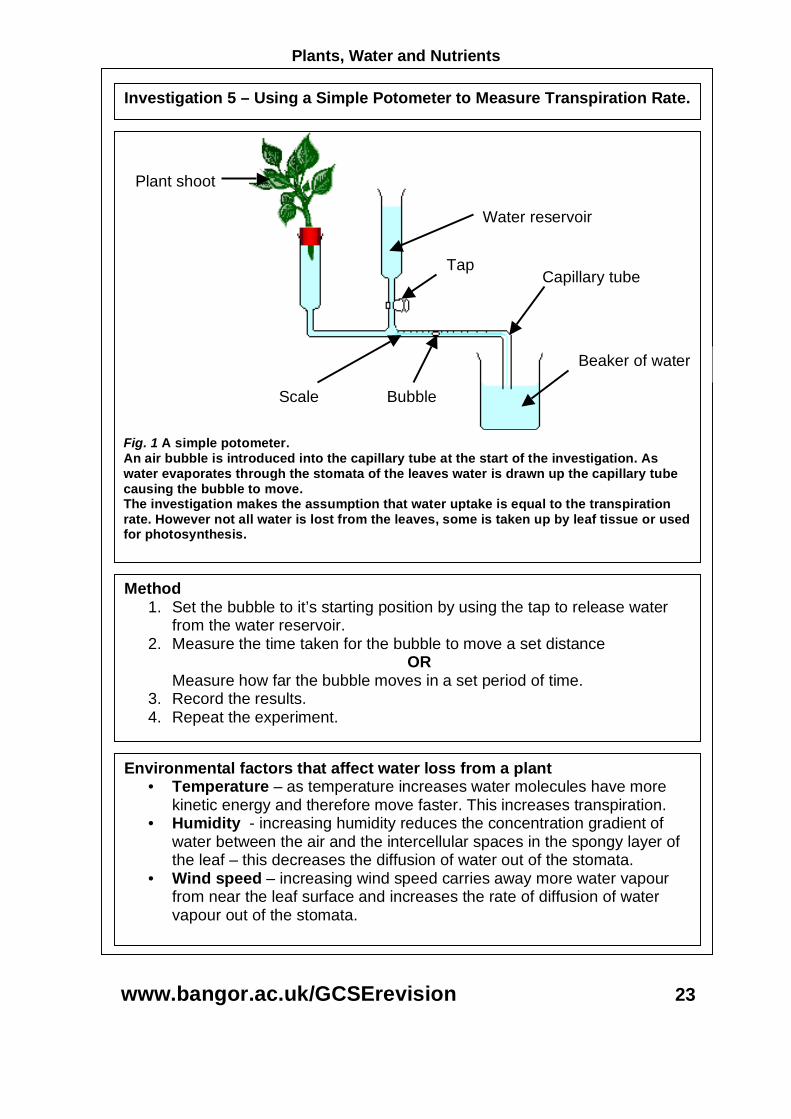
Investigation 5 – Using a Simple Potometer to Measure Transpiration Rate.
Fig. 1 A simple potometer. An air bubble is introduced into the capillary tube at the start of the investigation. As water evaporates through the stomata of the leaves water is drawn up the capillary tube causing the bubble to move. The investigation makes the assumption that water uptake is equal to the transpiration rate. However not all water is lost from the leaves, some is taken up by leaf tissue or used for photosynthesis.
Plant shoot
Bubble Scale
Tap
Water reservoir
Beaker of water
Capillary tube
Method 1. Set the bubble to it’s starting position by using the tap to release water
from the water reservoir. 2. Measure the time taken for the bubble to move a set distance
OR Measure how far the bubble moves in a set period of time. 3. Record the results. 4. Repeat the experiment.
Environmental factors that affect water loss from a plant • Temperature – as temperature increases water molecules have more
kinetic energy and therefore move faster. This increases transpiration. • Humidity - increasing humidity reduces the concentration gradient of
water between the air and the intercellular spaces in the spongy layer of the leaf – this decreases the diffusion of water out of the stomata.
• Wind speed – increasing wind speed carries away more water vapour from near the leaf surface and increases the rate of diffusion of water vapour out of the stomata.

Plants, Water and Nutrients
24 www.bangor.ac.uk/GCSErevision
Structure of a Leaf
1. Epidermis
3. Spongy layer C
ontains large air spaces to allow
gaseous exchange.
4. Epidermis
5. Guard cells
6. Stoma
7. Xylem
Transports water
8. Phloem
Transports sugar
9. Air space
Allows gas
exchange w
ith leaf cells.
10. Cuticle
Waxy, w
aterproof layer to reduce w
ater loss
2. Palisade layer C
ontains cells packed w
ith chloroplasts for photosynthesis.
Tran section (T.S.) of a leaf

Plants, Water and Nutrients
www.bangor.ac.uk/GCSErevision 25
The Transpiration Stream
There is a constant flow of water through a plant; this is called the transpiration stream.
Fig. 2 Annotated illustration of the transpiration stream
Observation of root hair cells
Fig. 3 Root with root hairs (left) and magnified view of root hair (above).
Water enters the plant from an area of high concentration of water in the soil to an area of lower water concentration inside the root hair cell, through it’s partially permeable membrane, by osmosis. The increased surface area of the root hair cell allows the plant to take in more water faster by osmosis.
1. Water enters the plant through root hair cells by osmosis.
2. Water moves from cell to cell in the root by osmosis.
3. Water moves into the xylem by osmosis
4. Water molecules stick together and this causes water to be pulled up the xylem as a column.
7. Water diffuses from the air spaces in the spongy layer out of the stomata into the air.
6. Water evaporates from some of the leaf cells, causing more water to be pulled up the xylem.
5. Water moves from cell to cell in the leaf by osmosis.
Water
2. Water is carried through the plant by the xylem.
Water enters the root hairs by osmosis.
Fig. 1 The transpiration stream
3. Water evaporates from the leaf through the stomata

Plants, Water and Nutrients
26 www.bangor.ac.uk/GCSErevision
Active Uptake of Mineral Ions by Plant Roots
When the concentration of a material is lower outside the cell it must be actively transported into the cell (sometimes referred to as active uptake).
Example – Uptake of nitrate ions by root hair cells
Fig. 1
Diagram of a plant root with enlarged view of a root hair cells.
High concentration of nitrate ions inside plant
cells.
Low concentration of
nitrate ions in soil water.
• Nitrate ions cannot move in by diffusion. • Nitrate ions must be actively transported from the soil water (an area of low
nitrate concentration) to the inside of the plant cells (an area of high nitrate concentration).
During active transport, salts or ions are pumped from an area of low concentration to an area of higher concentration.
This process requires energy released by the cell during respiration.
Factors that affect active transport:
• Active transport needs energy. • Energy is released during respiration.
Any factor that affects the rate of respiration will affect the rate of active transport, e.g.:
• Glucose concentration – respiration needs glucose. • Oxygen – aerobic respiration needs oxygen. • Temperature – affects the enzymes controlling respiration. • Toxic substances – e.g. cyanide stops respiration.
Factors that affect active transport will have an effect on the rate of uptake of ions from the soil into root hair cells.

Plants, Water and Nutrition
www.bangor.ac.uk/GCSErevision 27
Plant Transport Systems
Plants have two separate transport systems. • Phloem vessels (tubes) – transport sugar and other substances that
are produced by cells to all the other parts of the plant. • Xylem vessels (tubes) – transport water and mineral ions from the
roots to the rest of the plant.
Phloem Vessels Phloem carries sugar from the photosynthetic areas to other parts of the plant. Sugar is moved to other parts of the plant for use in respiration and converted into starch for storage. The transport of sugar is not fully understood so plant scientists are still investigating it.
Phloem and xylem vessels usually run together side by side. Groupings of phloem and xylem vessels are called vascular bundles.
Fig. 1 – T.S. of a sunflower stem showing positions of vascular bundles.
Vascular bundle
Xylem vessels Phloem vessels
Fig. 2 – T.S. of a sunflower stem showing a single vascular bundle.

Plants, Water and Nutrients
28 www.bangor.ac.uk/GCSErevision
Xylem Vessels The function of xylem vessels are:
1. Transport of water – from the roots to the rest of the plant. 2. Transport minerals – minerals such as nitrates phosphates and
potassium are transported by xylem around the plant dissolved in water. 3. Support the plant – the xylem vessels in the shoots and roots of mature
plants are inflexible and strong and give support to the plant
The Importance of Water Water is important to the plant for:
1. Use in photosynthesis; 2. Transport of minerals; 3. Support.
How does water support the structure of plant? Water provides support due to the pressure of the vacuoles pushing against the cell walls and this keeps the cells turgid and prevents cells becoming flaccid and plants wilting.
Fig. 3 Turgid cell Fig. 4 Flaccid cell
Investigation into the movement of a dye through a flowering plant 1. Take a white flower with a long stalk, e.g. a chrysanthemum and cut the
stalk carefully lengthwise. 2. Put each half of the stalk into a measuring cylinder (or boiling tube)
containing either plain water or water to which food dye has been added. 3. Tape the measuring cylinders to a plastic tray so that they don’t fall over. 4. Leave the flower for a few hours. 5. Observe where the dye ends up in the flower head.
Fig. 1 Flower at beginning.
Fig. 2 Flower after a few hours.
Explanation Water and dye are pulled up through xylem vessels. When they reach the flower petals the water evaporates from pores in the petal surface but the dye remains in the cells of the petals. The petals become coloured as dye accumulates in them. This procedure could be useful for producing quantities of unusually coloured flowers.
Plants, Water and Nutrients
www.bangor.ac.uk/GCSErevision 29
Healthy Plant Growth
Plants can only grow well if they are in a soil rich in mineral nutrients. Plant roots absorb the minerals from the soil and use them to produce materials that they need to grow. Three main minerals are needed:
• Nitrates • Potassium • Phosphates
NPK fertilisers that contain nitrates, phosphates and potassium can be added to soil to increase the mineral content.
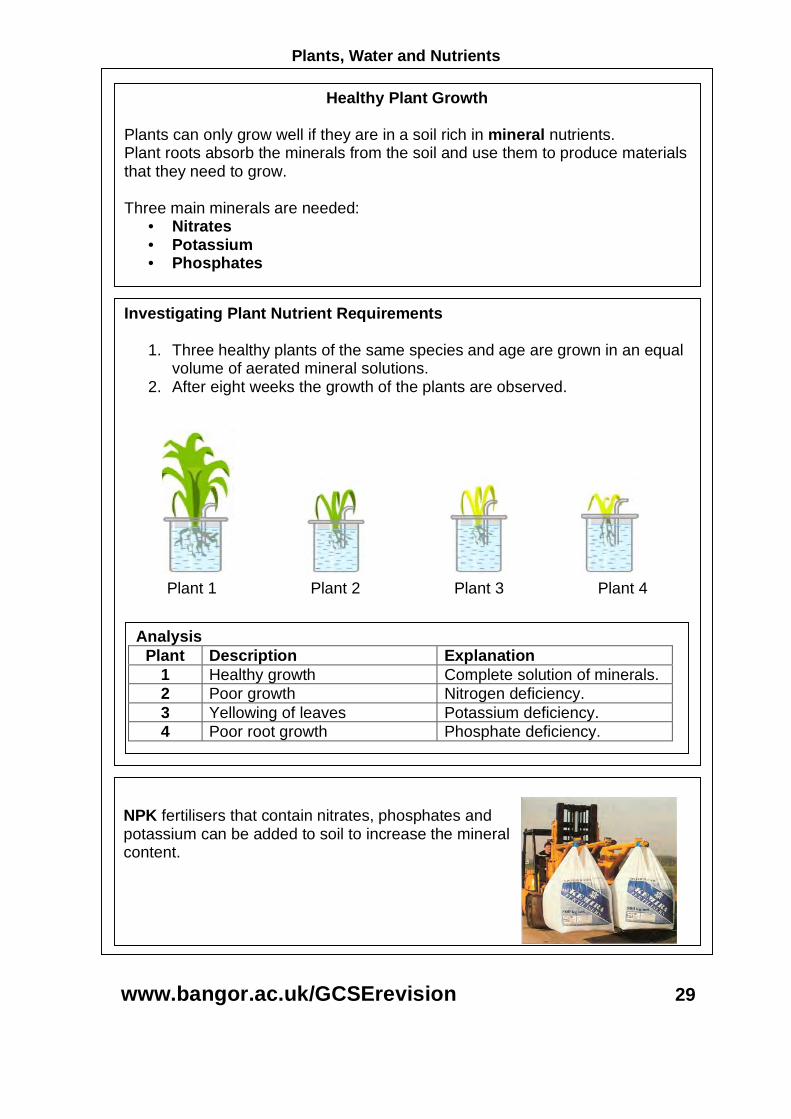
Investigating Plant Nutrient Requirements
1. Three healthy plants of the same species and age are grown in an equal volume of aerated mineral solutions.
2. After eight weeks the growth of the plants are observed.
Analysis Plant Description Explanation
1 Healthy growth Complete solution of minerals. 2 Poor growth Nitrogen deficiency. 3 Yellowing of leaves Potassium deficiency. 4 Poor root growth Phosphate deficiency.
Plant 1 Plant 2 Plant 3 Plant 4

Microorganisms and Disease
30 www.bangor.ac.uk/GCSErevision
Microorganisms and Disease
Most microorganisms (microbes) are harmless and many perform vital functions, e.g. recycling nutrients in the Nitrogen Cycle (Biology 1), food production (see page 40), production of antibiotics (see page 39). Some microbes are pathogens. A pathogen is a disease-causing microorganism
Microbe Phagocyte
Phagocyte detects ‘foreign’ microbe. Phagocyte engulfs microbe. Phagocyte digests microbe.
Defending Against Infection Your body has three lines of defence against infection by pathogens: 1. The skin stops microbes getting into the body.
• A layer of dead cells form a barrier around the body. • There is also a community of microbes on the skin (the skin flora), that
makes it difficult for pathogens to become established on the skin surface.
2. Platelets stop microbes getting into the body through a cut. • Platelets clot the blood in a cut and form a scab, keeping out microbes • (See page 5).
3. White blood cells defend against microbes that are inside the body. White blood cells defend against microbes in three ways: a. Phagocytes Ingest bacteria.
b. Lymphocytes produce antibodies to inactivate bacteria or viruses.
c. Lymphocytes produce antitoxins that counteract toxins released by bacteria.
Antibodies
Antigen A molecule on the cell surface that can be recognised by the immune system.
Antibodies Binds to antigen and destroy the foreign cell.
Lymphocyte produces antibodies.

Microorganisms and Disease
www.bangor.ac.uk/GCSErevision 31
The Immune Response
All cells have unique proteins on their surface called antigens. The immune system will recognise any cells as ‘foreign’ if their antigens are different to the ones on body cells. ‘Foreign’ antigens stimulate an immune response by the body.
Antigen 1. Lymphocyte recognises ‘foreign’ antigen.
Primary Response
Secondary Response
Lymphocytes multiply to
form clones.
2. Clones differentiate. Most develop to form short lived plasma cells.
3. Plasma cells
produce antibodies
that will destroy cells carrying the
specific ‘foreign’ antigen.
4. Some clones develop into long lasting memory cells.
5. Memory cells are long lasting and if they come across the same specific antigen again they stimulate an immune response.
6. Large numbers of plasma cells develop producing a large concentration of antibodies very quickly.
7. More memory cells produced. This ‘boosts’ immunity.

Microorganisms and Disease
32 www.bangor.ac.uk/GCSErevision
Immunity
Memory cells remain in the body and antibodies are produced very quickly if the same antigen is encountered a second time. This memory provides immunity following a natural infection and after vaccination. The response is highly specific to the antigen involved.
Primary response
Secondary response
Body encounters ‘specific antigen’ for the first time stimulating an immune response.
Memory cells encounter the same ‘specific antigen’ stimulating an immune response.
The graph below shows the body’s immune response when it comes across an antigen for the first and second time:
Describing the differences between the primary and secondary response: 1. The primary response is relatively slow, with a delay before antibody
production, compared to the secondary response that is much faster. 2. The concentration of antibodies produced in the secondary response is
much higher compared to the primary response. 3. The concentration of antibodies stays higher for much longer in the
secondary response compared to the primary response. Explanation of differences The presence of memory cells able to detect a ‘specific antigen’ causes antibodies to be produced very quickly and in large numbers if the same antigen is encountered a second time – this is known as immunity.
Why do most people suffer from measles only once, but could suffer from flu many times during their lives? The ‘flu’ virus mutates rapidly giving rise to new strains with different antigens. Because of this, different antibodies are needed and the memory cells produced during the previous bout of ‘flu’ cannot recognise the new antigens. The body therefore is not immune to the new strain of ‘flu’.
Microorganisms and Disease
www.bangor.ac.uk/GCSErevision 33
Vaccination
A Historical Perspective Edward Jenner first used vaccination against smallpox. He had heard that milkmaids who suffered the mild disease of cowpox never seemed to catch smallpox, a disease that caused many deaths at the time, particularly among children. He suggested that the pus in the blisters that milkmaids received from cowpox protected them from smallpox. In 1796, he inoculated a healthy boy with pus taken from a cowpox spot and the boy caught cowpox. A few weeks later Jenner inoculated the boy again, this time with smallpox. Fortunately for Jenner his theory proved correct and the boy survived. Jenner’s methodology would be considered unethical these days.
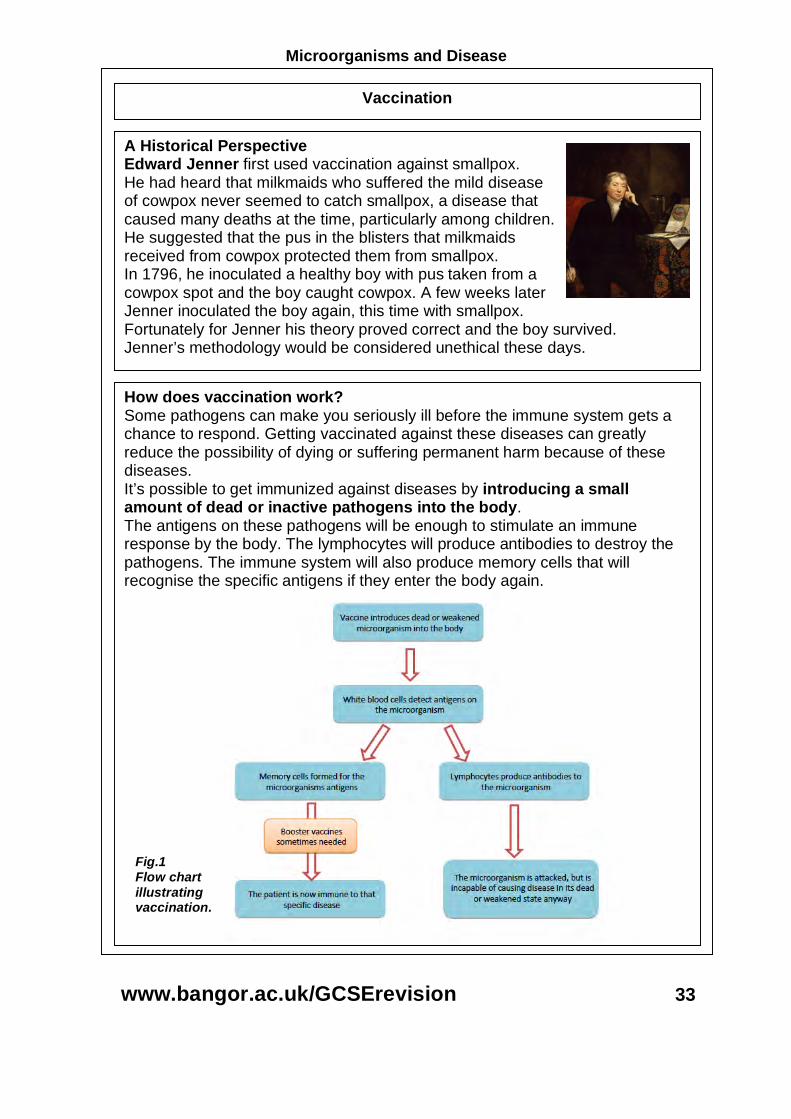
Fig.1 Flow chart illustrating vaccination.
How does vaccination work? Some pathogens can make you seriously ill before the immune system gets a chance to respond. Getting vaccinated against these diseases can greatly reduce the possibility of dying or suffering permanent harm because of these diseases. It’s possible to get immunized against diseases by introducing a small amount of dead or inactive pathogens into the body. The antigens on these pathogens will be enough to stimulate an immune response by the body. The lymphocytes will produce antibodies to destroy the pathogens. The immune system will also produce memory cells that will recognise the specific antigens if they enter the body again.
Microorganisms and Disease
34 www.bangor.ac.uk/GCSErevision
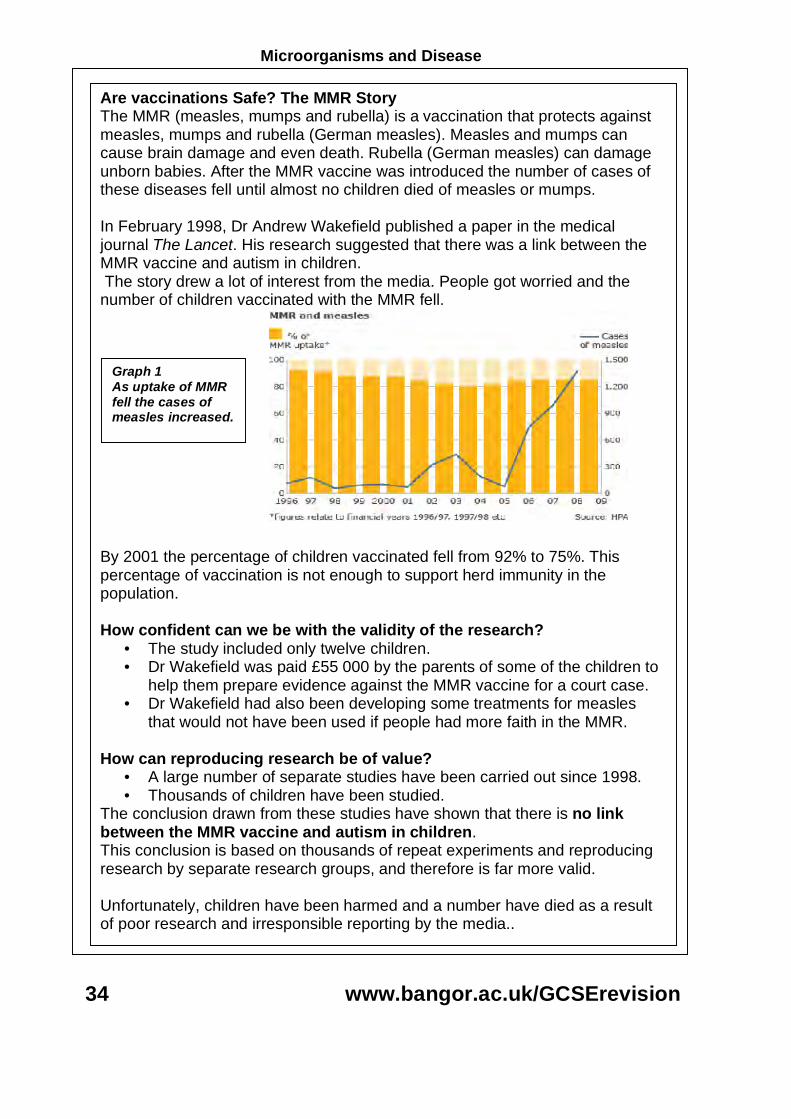
Are vaccinations Safe? The MMR Story The MMR (measles, mumps and rubella) is a vaccination that protects against measles, mumps and rubella (German measles). Measles and mumps can cause brain damage and even death. Rubella (German measles) can damage unborn babies. After the MMR vaccine was introduced the number of cases of these diseases fell until almost no children died of measles or mumps. In February 1998, Dr Andrew Wakefield published a paper in the medical journal The Lancet. His research suggested that there was a link between the MMR vaccine and autism in children. The story drew a lot of interest from the media. People got worried and the number of children vaccinated with the MMR fell. By 2001 the percentage of children vaccinated fell from 92% to 75%. This percentage of vaccination is not enough to support herd immunity in the population. How confident can we be with the validity of the research?
• The study included only twelve children. • Dr Wakefield was paid £55 000 by the parents of some of the children to
help them prepare evidence against the MMR vaccine for a court case. • Dr Wakefield had also been developing some treatments for measles
that would not have been used if people had more faith in the MMR. How can reproducing research be of value?
• A large number of separate studies have been carried out since 1998. • Thousands of children have been studied.
The conclusion drawn from these studies have shown that there is no link between the MMR vaccine and autism in children. This conclusion is based on thousands of repeat experiments and reproducing research by separate research groups, and therefore is far more valid. Unfortunately, children have been harmed and a number have died as a result of poor research and irresponsible reporting by the media..
Graph 1 As uptake of MMR fell the cases of measles increased.

Microorganisms and Disease
www.bangor.ac.uk/GCSErevision 35
Antibiotics
An antibiotic is a substance produced by a microorganism to kill other microorganisms. (e.g. Penicillin from the fungus Penicillium) Antibiotics, including penicillin, were originally medicines produced by living organisms, such as fungi. Antibiotics help to cure bacterial disease by killing the infecting bacteria or preventing their growth. Antibiotics do not kill viruses, because viruses live inside the host’s cells and so an antibiotic cannot reach them.
Antibiotic Resistance Resistance to a chemical poison is the ability of an organism to survive exposure to a dose of that poison which would normally be lethal to it. Antibiotic resistant bacteria can evolve by the overuse of antibiotics such as:
• Use of antibiotics in animal feed, • Over-prescription by doctors.
Doctors are worried about resistance to antibiotics because some bacteria, e.g. E. coli are common in humans and can cause serious illness or even death.
MRSA (methycillin resistant Staphylococcus aureus) has developed resistance to several antibiotics. Antibiotics are widely used in hospitals, especially to prevent infections occurring from surgery. The bacteria originated in Australia and within ten years had spread world-wide. Methods used in hospitals to control MRSA are:
• Hand washing, • Thorough cleaning of hospital wards, • Use of alcohol gels or antibacterial gels, • MRSA screening before surgery.
Fig. 1 How antibiotic resistance develops.

Microorganisms and Disease
36 www.bangor.ac.uk/GCSErevision
Investigating the effect of antibiotics on bacteria growing on agar plates.
Method 1. Grow a culture of bacteria, e.g. Micrococcus luteus, on a nutrient agar
plate. 2. Place a penicillin disc on the surface of the agar. 3. Label the Petri dish on the underside using a marker pen. 4. Seal the lid of the dish at either end with sticky tape. 5. Incubate the dish for 48 hours at 25OC. 6. Examine the dish and measure the diameter of the clear zone around the
disc. 7. Record the results. 8. Repeat the experiment. 9. Repeat steps 1 – 7 using a different antibiotic. 10. Compare the results.
P 1.5
Penicillin disc. Area with no bacteria growing.
Bacteria only growing around the edges.
Diameter of clear zone is measured.
Fig. 1 Effect of antibiotic (peniciliin) on bacterial growth.
Result from one Petri dish
Explanation Penicillin is an antibiotic and has killed the bacteria in the clear zone and is preventing any new growth. There are bacteria growing around the edges because the effect of the penicillin decreases with distance form the penicillin disc.

Microorganisms and Their Applications
www.bangor.ac.uk/GCSErevision 37
Growing Bacteria
Bacteria and fungi can be grown in Petri dishes containing nutrient agar. Working safely with microbes requires the use of aseptic techniques - this prevents microbes from the air contaminating the culture or microbes from the culture contaminating the air.
1. Sterilise Petri dishes and nutrient agar before use, e.g. in an autoclave/pressure cooker at 121OC for 15 minutes - to kill any bacteria in the agar.
2. Use an incubating loop to transfer a sample of milk to the Petri dish. The loop should be sterilised before and after the transfer by heating the loop until it glows red in a Bunsen flame.
3. Wipe the surface of the agar with the inoculating loop.
4. Secure the lid of the Petri dish with strips of adhesive tape.
5. Incubate the agar plates at 25OC to allow the bacteria to grow - pathogens will not grow at this temperature.
6. After 48 hours examine the dishes and count the number of colonies present.
7. Record your results. 8. Repeat the experiment. 9. Repeat steps 1 – 8 using different milk
samples. 10. Compare the results. 11. The Plates and equipment should be
sterilised after use
Investigating the presence of bacteria in milk using agar plates Method
Result A single bacterium is too small to be counted when it is placed on the agar plate Each bacterium grows into a colony. The colonies can be counted to find out the original numbers of bacteria
Bacterial colonies
Fig. 1 Culturing of bacteria using aseptic techniques.
Fig. 2 Magnified view of one bacterial colony. This investigation assumes that each colony has grown from an individual bacterium in the original culture.
Microorganisms and their Applications
38 www.bangor.ac.uk/GCSErevision
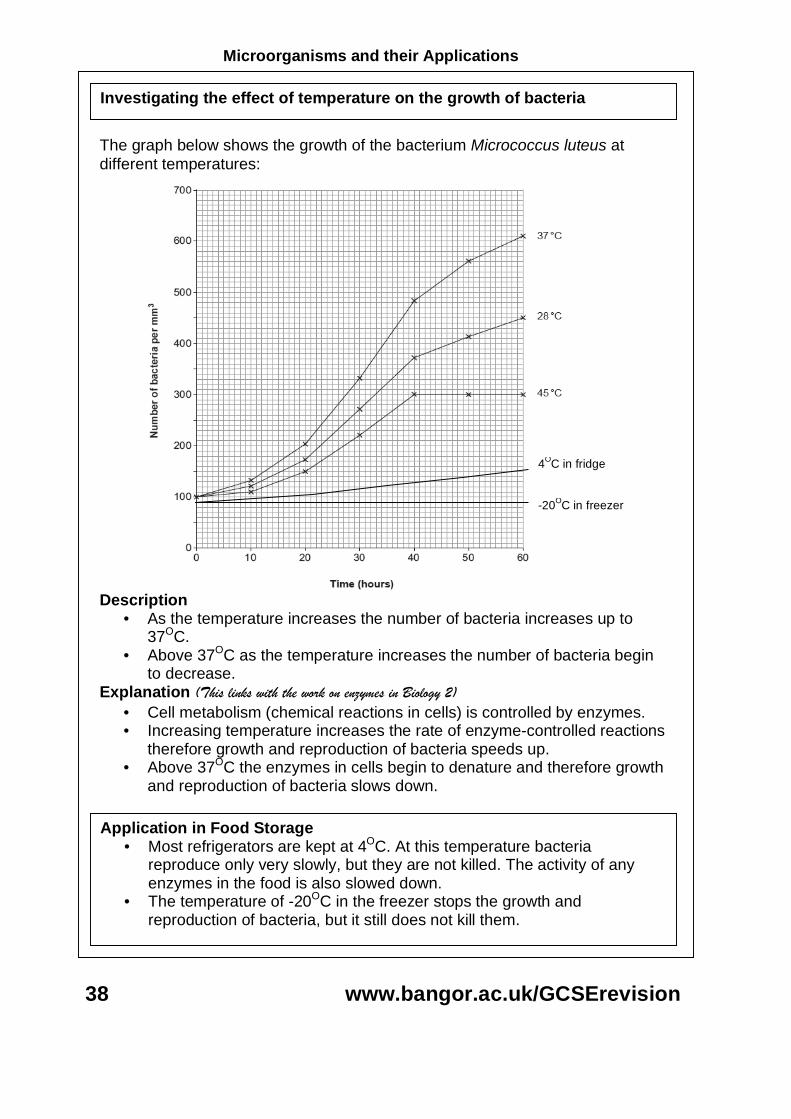
The graph below shows the growth of the bacterium Micrococcus luteus at different temperatures:
Investigating the effect of temperature on the growth of bacteria
4OC in fridge
-20OC in freezer
Description • As the temperature increases the number of bacteria increases up to
37OC. • Above 37OC as the temperature increases the number of bacteria begin
to decrease. Explanation (This links with the work on enzymes in Biology 2)
• Cell metabolism (chemical reactions in cells) is controlled by enzymes. • Increasing temperature increases the rate of enzyme-controlled reactions
therefore growth and reproduction of bacteria speeds up. • Above 37OC the enzymes in cells begin to denature and therefore growth
and reproduction of bacteria slows down. Application in Food Storage • Most refrigerators are kept at 4OC. At this temperature bacteria
reproduce only very slowly, but they are not killed. The activity of any enzymes in the food is also slowed down.
• The temperature of -20OC in the freezer stops the growth and reproduction of bacteria, but it still does not kill them.
Microorganisms and their Applications
www.bangor.ac.uk/GCSErevision 39
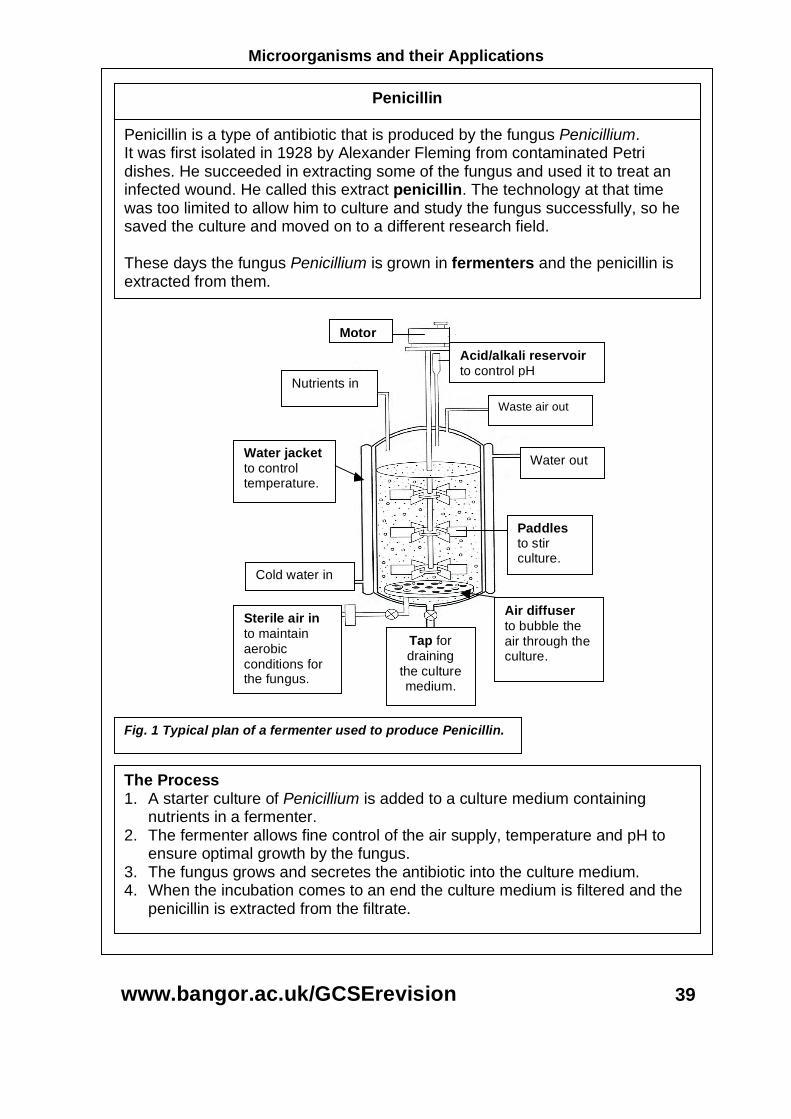
The Process 1. A starter culture of Penicillium is added to a culture medium containing
nutrients in a fermenter. 2. The fermenter allows fine control of the air supply, temperature and pH to
ensure optimal growth by the fungus. 3. The fungus grows and secretes the antibiotic into the culture medium. 4. When the incubation comes to an end the culture medium is filtered and the
penicillin is extracted from the filtrate.
______________
Waste air out
Cold water in
Water out
Tap for draining
the culture medium.
Sterile air in to maintain aerobic conditions for the fungus.
Acid/alkali reservoir to control pH
Motor
Water jacket to control temperature.
Air diffuser to bubble the air through the culture.
Paddles to stir culture.
Nutrients in
Penicillin Penicillin is a type of antibiotic that is produced by the fungus Penicillium. It was first isolated in 1928 by Alexander Fleming from contaminated Petri dishes. He succeeded in extracting some of the fungus and used it to treat an infected wound. He called this extract penicillin. The technology at that time was too limited to allow him to culture and study the fungus successfully, so he saved the culture and moved on to a different research field. These days the fungus Penicillium is grown in fermenters and the penicillin is extracted from them.
Fig. 1 Typical plan of a fermenter used to produce Penicillin.

Microorganisms and their Applications
40 www.bangor.ac.uk/GCSErevision
Using Microbes for Food Production
Three examples of foods produced by using microbes are: • Bread • Cheese • Yoghurt
Case Study – Mycoprotein Mycoprotein is the ingredient common to all Quorn™ products. Mycoprotein, means ‘protein from fungus’. It is produced using the fungus Fusarium that grows and reproduces rapidly on relatively cheap sugar syrup (made from waste carbohydrate) in large specialised fermenters. It needs aerobic conditions to grow successfully and can double its mass every five hours. The fungal biomass is harvested and purified. Then it is dried and processed to make mycoprotein. This is a pale yellow solid with a faint taste of mushrooms. On its own it has very little flavour. However, mycoprotein can be given a range of tastes and flavours to make it similar to many familiar foods. It is a high-protein, low-fat meat substitute. So vegetarians and people who want to reduce the fat in their diet plus people who just like the taste use it. Advantages of using microbes for food production:
• Rapid and contained growth so minimum space is used. • A predictable product is made under controlled conditions. • Waste materials from other processes may be used as a food source for
the microorganisms, e.g. whey from the production of cheese, may be used as a food source for the microorganisms.
Environmental Uses of Microbes
Microorganisms have an important role in decay and organic breakdown, e.g. digesting all the foliage dropped by trees in woods. Other examples of the environmental advantages of microbes are:
• Some micro-organisms are able to break down some plastics; • Cleaning up pollution, e.g. oil eating micro-organisms that use oil as food; • Production of biofuels by microorganisms, e.g. ethanol made from sugar
cane, sugar beet or corn. The sugar from these crops can be fermented to ethanol by microorganisms.