Page 1 April 2011 PWS 3.3 Portable Working Standard and Power Quality Analyzer.
62
Page 1 April 2011 PWS 3.3 Portable Working Standard and Power Quality Analyzer
-
Upload
jane-blair -
Category
Documents
-
view
215 -
download
0
Transcript of Page 1 April 2011 PWS 3.3 Portable Working Standard and Power Quality Analyzer.

Page 1April 2011
PWS 3.3Portable Working Standardand Power Quality Analyzer

Page 2April 2011
Working Standard Functions 20 mV ... 600 V (phase-neutral) 1 mA ... 12 A direct connection 10 mA ... 100 A via clamp-on CTs Measurement of electrical
parameters (UI, PQS, f, PF)incl. vector and waveform
display, harmonic analysis Up to 2 pulse inputs Instrument transformer testing
(CT/PT burden, CT/PT ratio) Accuracy 0.1 % / 0.05 %Options: CALSOFT Software Clip-on CTs: 1000 A LEMflex© up to 3000 A LiteWire Sensors
Advantages / Benefits

Page 3April 2011
Power Quality Analysis Functions 3 voltages/4 current channels Harmonics Interharmonics
Signal voltages Dips Swells Interruptions Voltage unbalance Flicker Transient capture
200s (10 kHz) IEC 61000-4-30 Class A 15 min battery buffered EN50160 reports
Advantages / Benefits

Page 4April 2011
Communication USB (integrated, standard) Ethernet (integrated, standard) Analog modem (integrated, optional) GSM modem (external, optional)Memory & GPS Time Synchronisation Memory: flash memory card GPS Time Synchronisation (integrated, optional)
Advantages / Benefits

Page 5April 2011
ConnectionsTop view
[1] Current inputs I1, I2, I3 [3] Phase connection U1, U2, U3[2] Current outputs I1*, I2*, I3* [4] Neutral connection UN
[5] Connection for Clamp-on CT1 [7] Connection Clamp-on CT IN/IE[6] Connection for Clamp-on CT2 [8] Impulse input / output

Page 6April 2011
ConnectionsTop view
[9] Impulse input [11] Modem connector[10] Ethernet connector [12] USB connector
[13] GSM modem [14] Compact flash card[15] Mains switch [16] Auxiliary supply connector

Page 7April 2011
ConnectionsBottom view
[17] Battery compartment(10 x R6/Mignon/AA 1.2V / 1.2 Ah NiMH accumulators)

Page 8April 2011
ConnectionsFront view
[18] Color LCD display[19] Alphanumeric keypad[20] Menu card keys[21] Cursor keys[22] Enter key[23] Exit key[24] Connector for
external keyboard

Page 9April 2011
Optional current clampsto the PWS 3.3
Error compensated clamp-on CT’s for measurements in the range 5 mA … 10A and10 mA … 100 A
Clamp-on CTs for meas-urements in the range100 mA … 1000 A

Page 10April 2011
Optional current clampsto the PWS 3.3
Flexible current trans-formers FLEX 3000 for measurements up to30 / 300 / 3000 A
Hot sticks for measurements on high voltage potential- AmpLiteWire up to 2000 A- VoltLiteWire up to 40 kV

Page 11April 2011
Operation Concept
Symbols Display Control Elements

Page 12April 2011
SoftwareMeter – Main Menu
Meter Testing
Measurement
Harmonics, Oscilloscope
Energy Measurement
Transformer Test
Special Functions
Installation (Setup)

Page 13April 2011
SoftwareMeter – Error Measurement

Page 14April 2011
SoftwareMeter – Measurement of UI, PQS and UIPQS

Page 15April 2011
SoftwareMeter – Wave form, Harmonics and Vector Diagram

Page 16April 2011
SoftwareMeter – Energy Measurement

Page 17April 2011
SoftwareMeter – Register Test

Page 18April 2011
SoftwareMeter – Voltage Burden Measurement (25% SN ≤ Sb ≤ 100% SN)

Page 19April 2011
SoftwareMeter – Current Burden Measurement (25% SN ≤ Sb ≤ 100% SN)

Page 20April 2011
SoftwareMeter – Voltage Ratio Measurement

Page 21April 2011
SoftwareMeter – Current Ratio Measurement

Page 22April 2011
SoftwareMeter – Special Functions

Page 23April 2011
Online Measurement
Power Quality Recording
Power Quality Analysis
First Row
SoftwarePower Quality – Main Menu

Page 24April 2011
SoftwarePower Quality – Recording menu
Second Row
Recording profile
Recording configuration
Recording setup
Start / Stop PQ Recording

Page 25April 2011
SoftwarePower Quality – Recording profile / setup / configuration

Page 26April 2011
SoftwarePower Quality – Online Measurement
Page 27April 2011
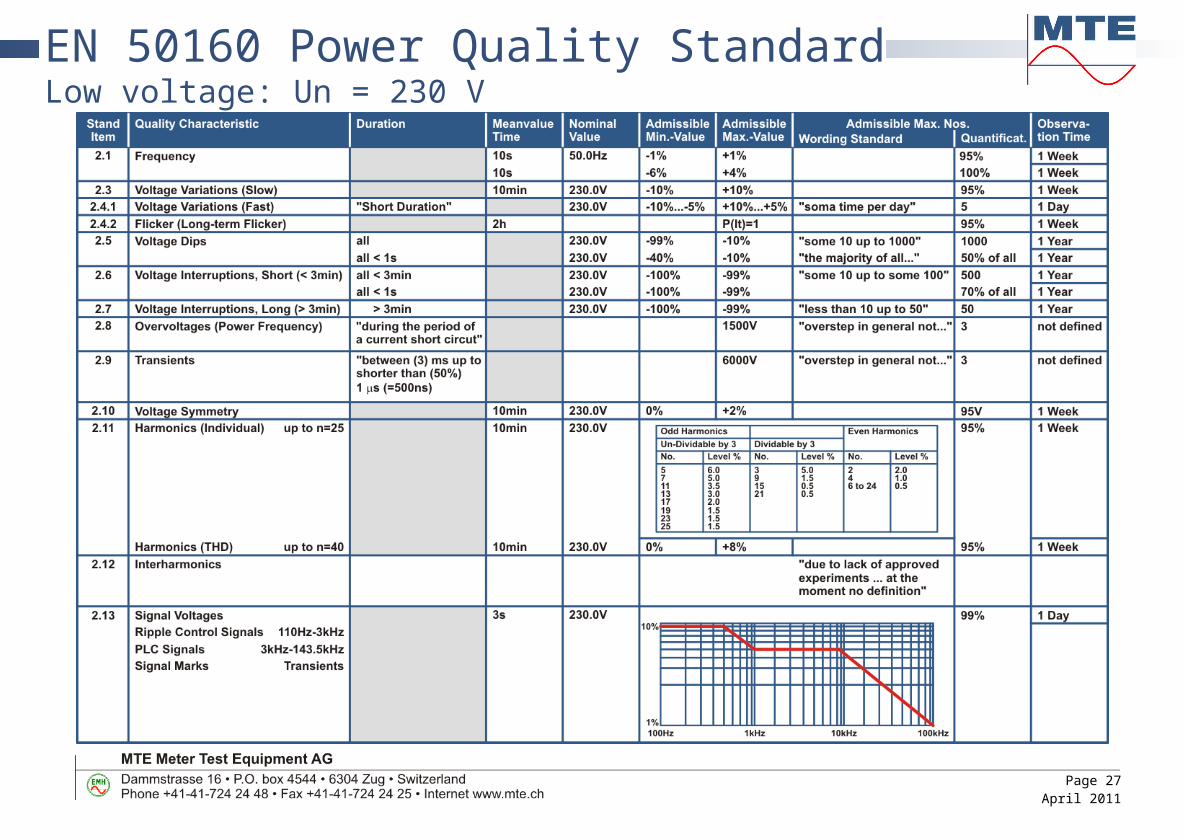
EN 50160 Power Quality StandardLow voltage: Un = 230 V

Page 28April 2011
How to read the table, two examples:EN 50160, 2.1 Frequency
EN 50160 Power Quality StandardLow voltage: Un = 230 V
EN 50160, 2.6 / Supply voltage interruptions, short

Page 29April 2011
IEC 61000-4-30 StandardPower Quality Measurement Methods
Class A performance Used, where precise measurement is necessary
Contractual applications Verification compliance with standard Resolving disputes
Class B performance Low uncertainty
Statistical surveys Trouble shooting

Page 30April 2011
Class A requirement Aggregation algorithm Time clock uncertainty (at least 1s/24h) Flagging concept to avoid counting events several timesPower quality parameters Power frequency Voltage and current magnitude Flicker Voltage Dips, interruptions, swells Current inrushes Voltage unbalances Harmonics/Interharmonics Voltage signals Transients
IEC 61000-4-30 StandardPower Quality Measurement Methods

Page 31April 2011
SoftwarePower Quality – Online Measurement
Advantages Quick configuration / start of recording of all PQ quantities Ideal for short-term analysis of PQ problems Recording/Analyzing of PQ situation during meter test On-line analyzing during recordingLimitations Recording time limited to max. 10 hours Recording must be defined individually for each PQ quantity Storing not possible; only screen shot

Page 32April 2011
SoftwarePower Quality – Online MeasurementUIPQSf Recording
Function / Firmware Aggregation acc. IEC 61000-4-30 Cl. A

Page 33April 2011
SoftwarePower Quality – Online MeasurementDip / Swell / Interruption Analysis
Function / Firmware(Dip Analysis)
Theory (acc. IEC 61000-4-30 Cl. A) Dip / Interruption Analysis

Page 34April 2011
SoftwarePower Quality – Online MeasurementDip / Swell / Interruption Analysis
Function / Firmware(Dip Analysis)
Theory (acc. IEC 61000-4-30 Cl. A)
3-phase InterruptionAnalysis
3-phase Dip Analysis

Page 35April 2011
SoftwarePower Quality – Online MeasurementDip / Swell / Interruption Analysis
Function / Firmware(Swell Analysis)
Theory (acc. IEC 61000-4-30 Cl. A)
Exceeding threshold of a certainpercentage of Udin (declared input voltage)

Page 36April 2011
SoftwarePower Quality – Online MeasurementHarmonics / Interharmonics Analysis
Function / Firmware Aggregation acc. IEC 61000-4-30 Cl. A)

Page 37April 2011
SoftwarePower Quality – Online MeasurementHarmonics / Interharmonics Analysis
Function / Firmware Theory (acc. IEC 61000-4-30 Cl. A)

Page 38April 2011
SoftwarePower Quality – Online MeasurementHarmonics / Interharmonics Analysis

Page 39April 2011
SoftwarePower Quality – Online MeasurementTransient Capture
Recorder / Table Display
Autoscaling On / Off
Display Min./Max. Values
Start/Stop Recording
Saving / File Management
Exit to previous Menue

Page 40April 2011
SoftwarePower Quality – Online MeasurementSignal Voltage Analysis
Setting of Signal Frequency
Auto Detection of Signal Frequency
Setting of Nominal Voltage
Setting of Signal Voltage Level

Page 41April 2011
SoftwarePower Quality – Online MeasurementFlicker Measurement

Page 42April 2011
SoftwarePower Quality – Online MeasurementUnbalance Measurement
Zero sequence voltage unbalance factor [%]
Negative sequence voltage unbalance factor [%]

Page 43April 2011
SoftwarePower Quality – Analysis
RecorderAnalysis
Bar GraphAnalysis
ResultSummary

Page 44April 2011
SoftwareData Base – Main Menu
Administrative data
Meter data
Transformer data
Load point data
View test result
Basic settings

Page 45April 2011
SoftwareData Base – Administrative Data

Page 46April 2011
SoftwareData Base – Meter Data

Page 47April 2011
SoftwareData Base – Transformer Data

Page 48April 2011
SoftwareData Base – View Test Results

Page 49April 2011
Windows©-SoftwareCALSOFT – Main Functions

Page 50April 2011
Windows©-SoftwareCALSOFT – Power Quality
PQ OnlineMeasurement

Page 51April 2011
Windows©-SoftwareCALSOFT – Power Quality
PQ Recording

Page 52April 2011
PQ Analysis
Windows©-SoftwareCALSOFT – Power Quality

Page 53April 2011
Windows©-SoftwareCALSOFT – PQ Online Measurement
Advantages Same functions as
in PWS 3.3 device Analysis functions
organized by folders

Page 54April 2011
Windows©-SoftwareCALSOFT – PQ Online Measurement

Page 55April 2011
Recording/EvaluationProfile
Recording Options
Setup U and I inputs
Start/Stop of Recording
Windows©-SoftwareCALSOFT – PQ Recording/Evaluation Profile
Functions

Page 56April 2011
Windows©-SoftwareCALSOFT – PQ Recording/Evaluation Profile
Functions Preparation/Saving
of analysis profiles Transfer of analysis
profiles to the device

Page 57April 2011
Windows©-SoftwareCALSOFT – PQ Recording/Evaluation Profile

Page 58April 2011
Functions Configuration of
recording start Configuration of
recording in blocks Definitions of time
block interval
Windows©-SoftwareCALSOFT – PQ Recording Options - Start time/length

Page 59April 2011
Windows©-SoftwareCALSOFT – PQ Analysis
General Info
Recorder Analysis
Bar Graph Analysis
Summary ResultOverview
Functions

Page 60April 2011
Windows©-SoftwareCALSOFT – PQ Analysis

Page 61April 2011
PWS 3.3 as DHCP Server IP - address PWS 3.3
can be fixed PWS 3.3 can allocate
IP-address e.g. tolocally connected PC
ETHERNET communication

Page 62April 2011
ETHERNET communication
PWS 3.3 as DHCP Client PWS 3.3 will be given
IP-address from server(e.g. if installed in a in-house or remote network)


![POWER SLEEVE [BB386EVO] — TL-PWS 86 — TL …...POWER SLEEVE [BB386EVO] — TL-PWS 86 — TL-PWS Is Jk9—ÄlJ— TC-PWS 86Y—JL-ey (IRA) 00 —[*13 -30 < D 0) TL-PWS < — PWS](https://static.fdocuments.in/doc/165x107/5f4dbd9d5303f80626076142/power-sleeve-bb386evo-a-tl-pws-86-a-tl-power-sleeve-bb386evo-a-tl-pws.jpg)