PACS - ndl.ethernet.edu.et
572
Transcript of PACS - ndl.ethernet.edu.et


PACSA GUIDE TOTHE DIGITALREVOLUTION
Second Edition
DREPR 11/16/2005 9:24 AM Page i
PACSA GUIDE TO THE DIGITAL REVOLUTION
SECOND EDITION
KEITH J. DREYER, DO, PHDDAVID S. HIRSCHORN, MD
JAMES H. THRALL, MDAMIT MEHTA, MD
EDITORS
With 97 Illustrations
DREPR 11/16/2005 9:24 AM Page iii

Library of Congress Control Number: 2005925976
ISBN 10: 0-387-26010-2ISBN 13: 978-0387-26010-5
Printed on acid-free paper.
© 2006 Springer Science+Business Media, Inc.All rights reserved. This work may not be translated or copied in whole or in part without the writtenpermission of the publisher (Springer Science+Business Media, Inc., 233 Spring Street, New York,NY 10013, USA), except for brief excerpts in connection with reviews or scholarly analysis. Use in connection with any form of information storage and retrieval, electronic adaptation, computer software, or by similar or dissimilar methodology now known or hereafter developed is forbidden.The use in this publication of trade names, trademarks, service marks, and similar terms, even if theyare not identified as such, is not to be taken as an expression of opinion as to whether or not they are subject to proprietary rights.While the advice and information in this book are believed to be true and accurate at the date ofgoing to press, neither the authors nor the editors nor the publisher can accept any legal responsi-bility for any errors or omissions that may be made. The publisher makes no warranty, express or implied, with respect to the material contained herein.
Printed in the United States of America. (BS/EB)
9 8 7 6 5 4 3 2 1
springeronline.com
Keith J. Dreyer, DO, PhD David S. Hirschorn, MDAssistant Professor of Radiology Research Fellow in Radiology InformaticsHarvard Medical School Harvard Medical SchoolVice Chairman of Radiology Informatics Massachusetts General HospitalMassachusetts General Hospital Boston, MA 02114Boston, MA 02114 andUSA Director of Radiology Informatics
Staten Island University HospitalJames H. Thrall, MD Staten Island, NY 10305Professor of Radiology USAHarvard Medical SchoolChairman of Radiology Amit Mehta, MDMassachusetts General Hospital Director of Interventional Radiology Boston, MA 02114 St. Josephs Health CenterUSA Toronto, Ontario
Canada M6R 1B5
DREPR 11/16/2005 9:24 AM Page iv

To my parentsand to my family and loved ones
whose genuine enthusiasminspires my passion for new ideas
KJD
To my wife Elisheva,for your love and warmth
DSH
To my wife Jean, who manages information technology in our householdand my children, Trevor and Keely, who have joined me in working
in the digital worldJHT
To my parents, MHM and NM for their guidance and support,and my family, SAM, CKM, SKM, HKM, and RM (on her way)
for their constant humor,and my teachers and colleagues for their help along the way
AM
DREPR 11/16/2005 9:24 AM Page v

PREFACE
The digital transformation of radiology marches on. Slow and inefficientfilm- and paper-based methods are giving way to quicker and simpler
computer-based ones. Report turnaround times are being measured inminutes or hours instead of days. There are more than a hundred informa-tion technology vendors in the radiology market; they all claim that theyhave best system to suit your needs. How can you tell which ones really arebest for you? How can you distinguish between truly important features andones that are just marketing ploys? How can you know the right questionsto ask to make sure you are getting all that you need and avoiding hiddencosts? This book covers the full spectrum of radiology information technol-ogy in the digital department. It brings together the expertise of many of therespected leaders in PACS, RIS, and speech recognition systems from aca-demic centers such as Harvard and the University of Maryland, communityhospitals, and even international teleradiology practices. Recent changes inimage display technologies are explored, as well as the maturation of digitalmammography, three-dimensional imaging, the electronic medical record,and teleradiology.
The process of assessing the needs of the institution and developing arequest for proposal that matches those unique requirements is covered in
DREPR 11/16/2005 9:24 AM Page vii
depth. This includes information on writing the primary evaluation criteria,evaluating proposals from different vendors, and choosing appropriatevendors. To justify the considerable investment of a PACS, financial con-cepts and tools are included that are useful in the financial evaluation. Legalissues that arise with teleradiology and formal policies that address theseissues are also discussed.
This book is intended for radiologists, technologists, administrators,and IT professionals who want to better understand these technologies andtheir impact. It is also useful for industry vendors, consultants, and health-care leaders who have an interest and modest knowledge of IT managementissues.
What's new in the second edition? It presents some of the latestresearch on reading room design and radiologist workflow. Recent develop-ments in CR and digital mammography are also included. Major changes indisplay and storage technologies which can have a huge impact on the costof PACS are discussed. Experience gained from maturing teleradiology prac-tices is shared. The role of decision support tools for order entry and digitalteaching files are also explored. These updates and additions will provide youwith the most current information about the digital transformation of radiology.
We would like to acknowledge our developmental editor, Merry Post,for keeping track of the myriad of details needed to make this second editiona reality. She also deserves credit for dealing with all of our crazy schedules.Her persistence is what kept this book on track. Kudos to the chapter authorsfor sharing their expertise with all of us, and thanks to my fellow sectioneditors for organizing and keeping track of progress of the chapters in theirsections. I also can not thank my wife, Elisheva, enough for supporting mein editing this book. The warm and loving home that she provides allowsme to focus on the task at hand; write, edit, and review chapters; and sendout countless e-mails.
David S. Hirschorn, MD
Prefaceviii
DREPR 11/16/2005 9:24 AM Page viii

CONTENTS
PREFACE viiCONTRIBUTORS xiii
SECTION I INTRODUCTION 1Keith J. Dreyer
1 INTRODUCTION 3David S. Hirschorn
SECTION II ADMINISTRATIVE ISSUES 7Gordon Smith
2 INTRODUCTION TO RIS AND PACS 9Gordon Smith
3 PACS STRATEGIC PLAN AND NEEDS ASSESSMENT 27Leonard A. Levine
DREPR 11/16/2005 9:24 AM Page ix

4 CREATING THE PACS REQUEST FOR PROPOSALAND SELECTING A VENDOR 45Alan L. Schweitzer and Gordon Smith
5 REENGINEERING WORKFLOW: A FOCUS ONPERSONNEL AND PROCESS 73Bruce I. Reiner and Eliot L. Siegel
6 REENGINEERING WORKFLOW: THE RADIOLOGIST’S PERSPECTIVE 97Eliot L. Siegel, Bruce I. Reiner, and Nancy Knight
7 FINANCIAL MODELING 125Syrene R. Reilly and David Avrin
8 LEGAL ISSUES AND FORMAL POLICIES 145Gordon Smith and David S. Hirschorn
SECTION III TECHNICAL ISSUES 171Thomas J. Schultz
9 COMPUTER FUNDAMENTALS 173Keith J. Dreyer
10 DIGITAL IMAGING FUNDAMENTALS 183Keith J. Dreyer and Mannudeep K. Kalra
11 IMAGE ACQUISITION 189Katherine P. Andriole
12 IMAGE COMPRESSION 229Bradley J. Erickson
13 PACS ARCHITECTURE 249Kenneth Heckman and Thomas J. Schultz
14 NETWORKING FUNDAMENTALS 269Scott M. Rogala
15 SERVERS AND OPERATING SYSTEMS 303Kenneth M. Nesbitt, Thomas J. Schultz, andRoberto Dasilva
Contentsx
DREPR 11/16/2005 9:24 AM Page x

16 STORAGE AND ENTERPRISE ARCHIVING 319Paul G. Nagy and Thomas J. Schultz
17 IMAGE DISPLAYS 347David S. Hirschorn
18 DIGITAL MAMMOGRAPHY 363Martin J. Yaffe
19 WEB DISTRIBUTION 373Keith J. Dreyer
SECTION IV CLINICAL ISSUES 383David S. Hirschorn
20 PACS WORKSTATION SOFTWARE 385Steven C. Horii
21 BREAST IMAGING, COMPUTER-AIDED DETECTION, AND COMPUTER-ASSISTED CLASSIFICATION 433Shalom S. Buchbinder
22 THREE-DIMENSIONAL IMAGING IN RADIOLOGY 447Gordon J. Harris
23 VOICE RECOGNITION 467Michael J. Mardini and Amit Mehta
24 ORDER ENTRY IN RADIOLOGY 483Daniel I. Rosenthal
25 DIGITAL TEACHING FILES AND EDUCATION 495Khan M. Siddiqui and Barton F. Branstetter IV
26 TELERADIOLOGY 523Giles Boland, Jonathan T. Schlakman, and James H. Thrall
INDEX 561
Contents xi
DREPR 11/16/2005 9:24 AM Page xi

CONTRIBUTORS
Katherine P. Andriole, PhD.Associate Professor of Radiology, Harvard Medical School, AssistantMedical Director, Imaging IT, Director of Imaging Informatics, Center forEvidence-Based Imaging, Brigham and Women’s Hospital, Boston, MA02120, USA
David Avrin, MD, PhDProfessor of Radiology, Adjunct Professor of Medical Informatics, Univer-sity of Utah, University of Utah Hospital and Clinics, Salt Lake City, UT84132, USA
Giles Boland, MDAssociate Professor of Radiology, Harvard Medical School, Vice Chairman,Business Development, Massachusetts General Hospital, Boston, MA 02114,USA
Barton F. Branstetter IV, MDAssistant Professor of Radiology and Otolaryngology, Director of Head andNeck Imaging, Associate Director of Informatics, University of PittsburghMedical Center, Pittsburgh, PA 15213, USA
DREPR 11/16/2005 9:24 AM Page xiii

Shalom S. Buchbinder, MDClinical Associate Professor, Albert Einstein College of Medicine, Chairmanof Radiology, Clinical Associate Professor of Radiology, Obstetrics, Gyne-cology and Womens’ Health, Staten Island University Hospital, StatenIsland, NY 10305, USA
Roberto Dasilva, MCSEData Center Manager, Department of Radiology, Massachusetts GeneralHospital, Boston, MA 02114, USA
Keith J. Dreyer, DO, PhDAssistant Professor of Radiology, Harvard Medical School, Vice Chairmanof Radiology Informatics, Massachusetts General Hospital, Boston, MA02114, USA
Bradley J. Erickson, MD, PhDAssociate Professor of Radiology and Medical Informatics, Director, Radi-ology Informatics Laboratory, Department of Radiology (E-2), Mayo Clinic,Rochester, MN 55905, USA
Gordon J. Harris, PhDDirector, 3D Imaging Service, Massachusetts General Hospital, Boston, MA02114, USA
Kenneth Heckman, BSNInformation Systems Analyst, Partners HealthCare System, Inc., Boston,MA 02115, USA
David S. Hirschorn, MDResearch Fellow in Radiology Informatics, Harvard Medical School, Mass-achusetts General Hospital, Boston, MA 02114; Director of RadiologyInformatics, Staten Island University Hospital, Staten Island, NY 10305,USA
Steven C. Horii, MDProfessor of Radiology, University of Pennsylvania, University of Pennsyl-vania Medical Center, Philadelphia, PA 19104, USA
Mannudeep K. KalraDirector of CT Research, Assistant Professor of Radiology, Emory Univer-sity Hospital, Atlanta, GA 30322, USA
Nancy Knight, PhDCoordinator, Research Publications and Grants, Veterans Affairs MarylandHealthcare System, Baltimore, MD 21201, USA
Contr ibutorsxiv
DREPR 11/16/2005 9:24 AM Page xiv

Leonard A. Levine, BS, MSIEManager, Radiology Data Services, Department of Radiology, MassachusettsGeneral Hospital, Boston, MA 02114, USA
Michael J. Mardini, MBAChief Executive Officer, Commissure, Inc., New York, NY 10011, USA;Founder and Former CEO, Talk Technology, Inc.
Amit Mehta, MDDirector of Interventional Radiology, St. Josephs Health Center, Toronto,Ontario, Canada M6R 1B5
Paul G. Nagy, PhDAssistant Professor of Radiology, University of Maryland, University ofMaryland Medical Center, Baltimore, MD 21201, USA
Kenneth M. NesbittSystems Engineer, Partners IS—Enterprise Medical Imaging, Boston, MA02114, USA
Syrene R. Reilly, MBADirector of Quality Management Services, Partners HealthCare System,Inc., Boston, MA 02199, USA
Bruce I. Reiner, MDDirector of Radiology Research, Veterans Affairs Maryland HealthcareSystem, Baltimore, MD 21201, USA
Scott M. RogalaCorporate Manager Network Engineering, Partners Healthcare,Charlestown, MA 02129, USA
Daniel I. Rosenthal, MDProfessor of Radiology, Harvard Medical School, Vice Chairman for Admin-istration, Department of Radiology, Massachusetts General Hospital,Boston, MA 02114, USA
Jonathan T. Schlakman, MDRadiologist, Remote Radiology International, Efrat, Israel 90435
Thomas J. Schultz, BSEChief Engineer, Partners HealthCare System, Inc., Boston, MA 02114, USA
Alan L. Schweitzer, MEEChief Technology Officer, Radiology Consulting Group, Boston, MA 02114,USA
Contr ibutors xv
DREPR 11/16/2005 9:24 AM Page xv
Khan M. Siddiqui, MDChief, Imaging Informatics and Body MR Imaging, Veterans Affairs Mary-land Healthcare System, Baltimore, MD 21201, USA
Eliot L. Siegel, MDProfessor of Diagnostic Radiology, University of Maryland School of Med-icine, Director of Imaging, Veterans Affairs Maryland Healthcare System,Baltimore, MD 21201, USA
Gordon Smith, MBADirector of Radiology Informatics, Department of Radiology, MassachusettsGeneral Hospital, Boston, MA 02114, USA
James H. Thrall, MDProfessor of Radiology, Harvard Medical School, Chairman of Radiology,Massachusetts General Hospital, Boston, MA 02114, USA
Martin J. Yaffe, PhDProfessor, Department of Medical Imaging and Medical Biophysics, Uni-versity of Toronto, Senior Scientist, Imaging/Bioengineering Research, Sunnybrook and Women’s College Health Sciences Centre, Toronto,Ontario, Canada M4N 3M5
Contr ibutorsxvi
DREPR 11/16/2005 9:24 AM Page xvi

INTRODUCTIONKEITH J. DREYER
I
DRE01 11/16/2005 9:26 AM Page 1

INTRODUCTION
DAVID S. HIRSCHORN
The first edition of this book made the point that picture archiving andcommunication systems (PACS) were no longer just a possibility but a
reality. The second edition takes this statement one step further: PACS isnot just a reality but a necessity. Most larger radiology departments havegone digital, and smaller departments and imaging centers are not farbehind. Printing CT and MRI exams for interpretation is like printing youre-mail in order to read it. Ten years ago this analogy would be lost on mostradiologists because they didn’t know what e-mail was, but now virtually allradiologists know what it is and use it on a regular basis. Digital cameras areubiquitous, and millions of consumers, radiologists among them, are fillingup hard drives instead of shoeboxes with their family photos. By now mostradiologists have viewed images on the Internet and have begun to recog-nize the benefits of managing images on a computer.
The benefits of PAC systems are clear. Within seconds after an imageis acquired, it can be viewed by the radiologist and any number of referr-ing and treating physicians simultaneously. There is no film to be lost orstolen. CT exams with a thousand images are becoming common and simplycannot be managed effectively on film. PACS viewing software can be used
1CHAPTER
DRE01 11/16/2005 9:26 AM Page 3
to dissect, analyze, magnify, or reformat image data in an infinite number of ways. Virtual private networks can transmit whole exams across the globe within seconds for remote consultation, perhaps in the middle of the night to a radiologist who is just starting her day. Today’s archives can keep decades of studies online in a cost-effective manner and in a much more organized and accessible manner than ever possible in a tradi-tional fileroom.
The PAC system is the most visible component of a digital radiologydepartment but is by no means the only one. A successful PACS requires astrong radiology information system (RIS) to feed it patient and exam infor-mation and to keep track of the life cycle of all exams from order placementto final result. The RIS ties together all the computer systems within thedepartment and is typically the sole point of communication to the worldoutside the department, such as the hospital information system and thebilling system. As such, it is perhaps the most complex system in the department.
The third key component of a digital radiology department is thespeech recognition system for report transcription. Speech recognitionsystems have been available for several years and are slowly becoming anecessity. As hospitals begin to realize that it is not unreasonable to expecta final report within hours instead of days, the pace of adoption will begin to pick up. Speech interfaces to computers are still uncommon in thegeneral computing environment, but this will inevitably change. Manycommercial telephone answering services routinely use speech recognition,and the trend is increasing. As will be explained later in detail, speech recognition systems do far more than convert speech to text. They yieldnumerous other benefits derived from using a computer-based dictationsystem that just weren’t worth pursuing until speech recognition technologycame along.
These 3 systems—the RIS, the PACS, and the speech recognitionsystem—form the backbone of a digital radiology department and are dis-cussed in detail in this book. The RIS directs information flow of exams from the ordering process, scheduling, and image acquisition through inter-pretation, communication of results, and billing. The PACS serves to receiveand store the images from the modalities and to distribute them to radiolo-gists for primary interpretation and throughout the healthcare enterprise for clinical review. The speech recognition system is a sophisticated and powerful tool to help the radiologist generate a clear and accurate report in a timely fashion. When implemented correctly with maximum systemintegration, the result is better, faster, and more cost-effective patient care.
PACS: A Guide to the Digi tal Revolut ion4
DRE01 11/16/2005 9:26 AM Page 4

ORGANIZATION
This second edition is organized differently from the first. The first editionmirrored the topics required for the process of developing a request for pro-posal (RFP) for PACS. In this edition, we chose to organize the topics aroundthe 3 main perspectives from which most people approach digital radiology:administrative, technical, and clinical. In this way the reader can morequickly focus on topics of personal interest. Some may choose to focus ononly a few chapters of one section; others who play multiple roles will needto draw on 2 or all 3 of the sections.
The administrative section begins with an introduction to RIS andPACS and proceeds to explore the issues involved in obtaining these systems.The effects that these systems have on the technical staff and the radiolo-gists are then discussed. Different financing options are presented next. Thesection concludes with a discussion of the legal issues surrounding the transition to a digital department.
The technical section starts with some basic computing and image-processing information and then focuses on digital imaging. Image acquisi-tion and compression raise issues that were not experienced with film; theseare covered in separate chapters. Various PACS architectures are presented,along with their practical differences. Basic topics on hardware and softwarechoices, such as networking and servers and operating systems, come next.Clinical storage techniques merit a chapter of their own, as storage can bea large part of the operational cost of running a PACS. Next explored areimage displays, as they are the main component of the PACS viewing stationthat differentiates it from a regular desktop PC. Digital mammography, themost challenging modality to bring into the digital world, also merits achapter of its own, which discusses the technical requirements for this specialmodality. The section ends with the topic of web distribution, which may ormay not be built into a PAC system.
The clinical section deals with some of the same topics mentionedabove, such as PACS viewing stations and digital mammography, but froma clinical perspective. Also discussed in greater depth are three-dimensionalimaging, speech recognition, and physician order entry systems. Teachingfiles and education are covered as well. Teleradiology, what it means todayand what it might mean tomorrow, concludes the last section.
It is our hope that you will find this book rich with ideas and informa-tion that you can use as you enter the digital transformation of radiology.
INTRODUCTION 5
DRE01 11/16/2005 9:26 AM Page 5

ADMINISTRATIVE ISSUESGORDON SMITH
II
DRE02 11/16/2005 9:27 AM Page 7

INTRODUCTION TORIS AND PACS
GORDON SMITH
In the current marketplace, forces acting upon the radiology practice aremandating the conversion from the analog paper- and film-based systems
to a purely digital department. These forces range from market competitionto demands from the referring base and, most prominent, to the need tobecome more efficient to balance the losses from the steady decline in reim-bursement rates.
The efficiency driver has the greatest direct impact on the practice dueto the reduced reimbursement rates for procedures, which is driving prac-tices to increase productivity just to break even. However, if a practice isalready at maximum capacity and costs are not being covered, the practiceis in for a tough decision regarding increasing efficiency. Does the practicemake the investment in technology to help increase efficiency, or does thepractice add another radiologist with the hope that the increased overheadwill be offset by the increased volume? These are decisions that practicemanagement often faces. However, in today’s market the problem is com-pounded further by the lack of available human resources (radiologists) tocorrect the problem, thus driving practices to the technological solution.The administrative end (billing) has been forced into being digital by
2CHAPTER
DRE02 11/16/2005 9:27 AM Page 9
the Health Insurance Portability and Accountability Act (HIPAA), whichrequires by law that all submissions be in digital format; those that are notreceive an automatic penalty. The efficiency driver, along with the needs forincreased quality, clinical effectiveness, and meeting the pressures of marketcompetition, should not be perceived as forcing a new way of practicing radiology. The new digital world should be seen as an opportunity to take a practice into the 21st century and to provide the patient with clinical services that could never be provided in the analog world, such as three-dimensional (3-D) reconstruction.
This decision will be one of the most important ones that will be madeby the practice. It will have an overwhelming impact upon the way you dowork, where you do work, and the culture of the department in which youwork. The decision to go digital is the decision to take your current prac-tice apart and define what is good and what is bad. This is an opportunityto leverage what you do well and correct what you do poorly.
What exactly is meant by being digital, and what is needed to accom-plish becoming digital? Becoming digital simply means that where there is currently a physical element that is used to perform the management of information to run the practice, that element is changed into an elec-tronic format. Schedules, tracking forms, film jackets, and reports are all produced digitally. How does technology address the pressures defined previously?
Imaging technology improves efficiency through the use of:
◗ Information management◗ Radiology information system (RIS) deployment◗ Digital modality deployment◗ PACS deployment
◗ Computer-aided diagnosis
◗ Remote access
Quality issues are addressed by:
◗ Instantaneous access to priors◗ Deep online clinical archive
◗ Online diagnostic information
◗ Subspecialty collaboration
PACS: A Guide to the Digi tal Revolut ion10
DRE02 11/16/2005 9:27 AM Page 10

Clinical effectiveness is enhanced by:
◗ Better data◗ Direct and computed radiography
◗ More data◗ Multidetector computed tomography
◗ New data◗ MRI
◗ Same data but more information◗ Image fusion (PET/CT)◗ 3-D rendering
In addition to the demands of managing the practice and providingmodern clinical care, you must meet the demands of the users of the infor-mation, your referring base. Most practicing physicians are aware of theadvances in imaging technology and the advantages it can provide. Clini-cians need imaging as a screening tool, and they are demanding almostinstantaneous access to imaging information. Five service areas should beaddressed to meet the demands of the practice’s customers: accessibility,urgency, security, simplification, and service.
Accessibility is addressed through the use of Web access, which pro-vides access to the images independent of location. The image data can beincorporated into the enterprise medical record (EMR), which provides theclinician with a single point of access to information for relevant clinical datafrom multiple departments. There is an emerging technology that involvesthe use of online collaboration.
Urgency has always been an issue; with the advent of the digital world,this need has increased substantially. The increased perception of the urgentneed for data, right or wrong, is a demand that still needs to be met. Theurgency for imaging information to meet the increased demand for “quickreads” and to provide instantaneous access to imaging data and interpreta-tion can be addressed through the use of the image distribution process toflag and distribute the images digitally to the appropriate radiologist forinterpretation. This process can be provided outside of the common hoursof operation, as well, through the use of teleradiology or “nighthawk” services. These are interpretation services that are provided digitally by anoff-site radiologist with a report provided to the clinician in a matter of afew hours instead of the next day.
INTRODUCTION TO RIS AND PACS 11
DRE02 11/16/2005 9:27 AM Page 11

The need for security in a digital environment is paramount. Theability to secure information in the digital environment is substantially betterthan it is in the analog world. This is accomplished through the use of com-puter-level and application-level security along with the implementation oftiered access to data.
In the digital environment, access to data is provided on a need-to-know basis. In contrast, the processes of the analog world expose patientinformation to many individuals who should not have access to it. Tieredaccess to patient data is not just the best practice for a department; it alsomeets the information security regulations established by HIPAA.
Simplification is providing more information in a manner that does notoverwhelm the clinician with too much data. Important clinical informationcan be communicated to the clinician by supplying just annotated key imagesinstead of a complete study without annotations. Developing technologiesthat are making their presence known are the use of 3-D rendering of imagesand the use of multimedia reports.
The final key point that needs to be addressed is providing the refer-ring clinician with services that improve the ability and ease of schedulingexams, increase access to the radiologists during the exam process to facili-tate changes in scheduling based on the urgency of the exam, and expeditethe distribution of results. Digitally based scheduling provides the clinicianwith quicker access to available appointment times, and electronically sub-mitted requests are less prone to being lost. The service that has the great-est impact is the ability to present a Web-based self-scheduling interface.This type of interface benefits both the clinician by offering more controlover the ordering process and the radiology department by allowing struc-tured input that can increase the capture of the correct CPT and ICD-9codes for each exam.
We have discussed the areas within and outside the department drivingthe move toward or the expansion of a digital department. Next are the components of the digital department. At the heart of the digital radiologydepartment exist two main computer systems: the radiology informationsystem (RIS) and the picture archiving and communication system (PACS).The RIS encompasses many text-based computing functions including tran-scription, reporting, ordering, scheduling, tracking, and billing. PACS dealswith image-based computing functions such as acquisition, interpretation,storage, and local image distribution.
PACS: A Guide to the Digi tal Revolut ion12
DRE02 11/16/2005 9:27 AM Page 12

THE RADIOLOGY INFORMATION SYSTEM
The RIS is the nervous system of the digital department (Figure 2.1). Everyaspect of the digital department relies in some manner on the RIS. The RISdrives the workflow of the information of the department. It is responsiblefor scheduling orders, capturing relevant clinical information about an examand providing this clinical information only to areas of the department thatrequire it, preparing prior exams if needed, and providing the PACS withthe information it needs to perform its role. Once an image is captured, theRIS and PACS work together to provide the radiologist with the necessaryinformation to interpret the exam and to deliver the report to the clinicians.In addition to the clinical functions of the RIS, the system manages billingfor the exams and provides the necessary data to support managementreporting for the department.
Scheduling is where the process begins. The scheduling step kicks offa number of events within the RIS to prepare for an exam to be performed.The process of scheduling an exam captures the appropriate clinical infor-mation to determine the exam to be performed. It is also the point in theprocess at which the patient demographics are captured. Accurate patientinformation is required for proper acquisition of relevant prior exam infor-mation and to ensure that billing can be performed correctly.
INTRODUCTION TO RIS AND PACS 13
Scheduling ImageTracking
ExamTracking
CliniciansOrders Radiology Information
System(RIS)
Broker
ResultsSpeech
Recognition
ImageArchive
Picture Archiving andCommunication System
(PACS)Billing
FIGURE 2.1
Traditional radiology digital infrastructure.
DRE02 11/16/2005 9:27 AM Page 13

The scheduling process is where a majority of the data errors occurwithin the system. Input data errors at this point will for the most part eliminate any operational efficiency gained by moving to the digital depart-ment. The three traditional interfaces of scheduling provide various levelsof control over the integrity of the data being put into the system. In thehospital information system (HIS) scheduling method, traditionally thelowest level of accuracy exists due to the lack of control over managing the sources of data for the HIS. The second most inaccurate is the manualscheduling method. This is the scheduling of exams within the department.In this area you do have control through programs that increase accuracysuch as competency-based training which is discussed in Chapter 25. TheWeb-based scheduling method is the most accurate because there is morecontrol over the incoming data, assuming there is a structured method ofgathering the required information.
Once the exam is scheduled, what happens with that data? The mostbeneficial processes are the acquisition of relevant prior exam informationand the validation of patient information. This information is used in thepre-fetching of prior films, either by moving studies in the PACS from long-term storage to near-line cache or by the creation of pick lists for the filmlibrary. This pre-fetching process reduces the time needed to gather theappropriate prior studies, which will allow for the finding of lost films beforethe time of interpretation, thereby increasing the quality of care. Addition-ally, it improves the process of protocolling exams by allowing for the processto occur well before the exam. This further increases efficiency by reducingthe number of interruptions in the workflow to protocol the exam at the timeof the exam.
The RIS provides the technologist and the radiologist with relevantinformation for performing the exam. The technologist interacts with theRIS either by receiving a paper request or, in the digital environment, bychecking an electronic worklist that provides the details of the exam, includ-ing the protocol assigned by the radiologist. During this process the RIStracks the exam status and the patient. This information is used to managethe rest of the exam transaction.
When the exam is complete and the images are ready for interpreta-tion, the RIS and PACS interact to validate that the images acquired matchthe order information. Once the images are determined to be valid, the examdata are routed to populate worklists for the appropriate radiology specialtyfor interpretation. This routing can be driven by either the RIS or the PACS,and there are different schools of thought regarding which is preferable.Either way, the relevant exam information is provided to the radiologist tointerpret the study.
PACS: A Guide to the Digi tal Revolut ion14
DRE02 11/16/2005 9:27 AM Page 14

The report in the digital department is captured by speech recognition,and, after it is signed by the radiologist, it is delivered to the appropriate des-tinations. These are primarily the requesting clinician and the billing office;delivery methods may include fax, secure e-mail, and, of course, regular mail.The RIS also serves as an archive for all the exam data, including the report.Thus, the RIS is the backbone for almost all the clinical operations of thedepartment.
Beyond controlling the exam management process for the department,the RIS can also provide a wealth of information for improving the opera-tions management for the department. The exam mixes, volume, turnaroundtimes, and billing data can facilitate the measurement of key departmentmetrics. Some examples of these measurements are throughput for thedepartment overall and by area or device. Report turnaround times and thechanges in efficiency due to changes made in department processes are alsokey operations measurements.
The next section introduces key digital imaging technologies and the fundamentals of PACS operations, followed by a discussion of how theRIS and PACS are tied together to form a single powerful core for “beingdigital.”
THE PICTURE ARCHIVING AND COMMUNICATION SYSTEM
The PACS by far is the portion of the digital department that gets the mostattention, and rightly so, for this is the where the bulk of the work is per-formed. This is also the area of the department where the greatest changeoccurs. It is important to understand the fundamentals of the functions andbasic technology of PACS. Many other chapters in this book explore thedetails of each area discussed in this introduction. Figure 2.2 illustrates ageneral overview of the basic functions and relationships of the PACS coreelements.
ELEMENTS OF A PACS
Following are the basic elements of a PACS:
◗ Image acquisition◗ PACS core◗ Interpretation workstations
INTRODUCTION TO RIS AND PACS 15
DRE02 11/16/2005 9:27 AM Page 15

IMAGE ACQUISITION
Image acquisition is the first point of image data entry into a PACS, and, asa result, errors generated here can propagate throughout the system,adversely affecting clinical operations. General predictors for successfulincorporation of image acquisition devices into a digital imaging departmentinclude ease of device integration into the established daily workflow routineof the clinical environment, high reliability and fault tolerance of the device,simplicity and intuitiveness of the user interface, and device speed.
Digital image acquisition from the inherently digital modalities such ascomputed tomography (CT) and magnetic resonance imaging (MRI) makessense. There are two methods for accomplishing this: direct capture andframe grabbing. Direct digital interfaces allow capture and transmission ofimage data from the modality at the full spatial resolution and bit depth orgray scale inherent in the modality, while analog (video) frame grabbers digitize the video signal voltage output going to an image display, such as ascanner console monitor. In the frame-grabbing method, as in printing animage to film, the image quality is limited by the process to only 8 bits (or256 gray values). This may not allow viewing in all the appropriate clinicalwindows and levels or contrast and brightness settings.
PACS: A Guide to the Digi tal Revolut ion16
RIS Image acquisition
ModalitiesMR CT CR NUC PET US
PACS Core
Database ManagerImage Archive
Workflow / ControlImage Distribution
EnterpriseDistribution
InterpretationWorkstations
Image Archive
Study ValidationPre-fetching
ModalityWorklists
FIGURE 2.2
Database management.
DRE02 11/16/2005 9:27 AM Page 16
For example, when viewing a CT of the chest, one may wish to viewin lung window and level settings and in mediastinal and bone windows andlevels. Direct capture of the digital data will allow the viewer to dynamicallywindow and level through each of these settings on the fly (in real time) atthe softcopy display station. To view all appropriate window and level settings on film, several copies of the study would have to be printed, one ateach window and level setting. If one performs the analog acquisition orframe grabbing of the digital data, the viewer can only window and levelthrough the 8 bits captured, which will not be sufficient. Thus, direct captureof digital data from the inherently digital modalities is the preferred methodof acquisition. Methods for digital image acquisition of the conventional projection x-ray include devices such as computed radiography (CR) orimaging with photostimulable or storage phosphors and digitization of exist-ing analog film, as well as direct digital detectors falling under the generalheading of digital radiography (DR). Digital acquisition of images alreadyon film can be accomplished using a variety of image digitization devices orfilm scanners. These include the infrequently used analog video cameras withanalog-to-digital converters (ADCs), digital cameras, charge-coupled devices(CCDs), and laser scanners.
FILM DIGITIZERS Film digitizers will still be necessary even in the all-digital or filmless imaging department, so that film images from outsidereferrals without digital capabilities can be input into the system and vieweddigitally. Film digitizers convert the continuous optical density values on filminto a digital image by sampling at discrete, evenly spaced locations andquantizing the transmitted light from a scan of the film into digital numbers.Several types of film digitizers exist today, with some used more frequentlythan others in PACS and teleradiology applications.
A commonly used film scanner for PACS is the CCD or flat-bedscanner, which uses a row of photocells and uniformly bright light illumi-nation to capture the image. A lens focuses the transmitted light from thecollimated, diffuse light source onto a linear CCD detector, and the signalis collected and converted to a digital electronic signal by an ADC.
The laser scanner or laser film digitizer uses either a helium-neon(HeNe) gas laser or a solid-state diode laser source. The laser beam is focusedby lenses and directed by mirror deflection components, and the light trans-mitted through the film is collected by a light guide, and its intensity detectedby a photomultiplier tube, converted to a proportional electronic signal, anddigitized in an ADC. They are semi- or fully automatic in operation and arecurrently the scanner of choice for PACS applications.
INTRODUCTION TO RIS AND PACS 17
DRE02 11/16/2005 9:27 AM Page 17
COMPUTED RADIOGRAPHY Computed radiography refers to projec-tion x-ray imaging using photostimulable or storage phosphors. In thismodality, x-rays incident on a photostimulable phosphor-based image sensoror imaging plate produce a latent image that is stored in the imaging plateuntil stimulated by laser light. This released light energy can be capturedand converted to a digital electronic signal for transmission of images todisplay and archival devices. Unlike conventional screen-film radiography in which the film functions as the imaging sensor, or recording medium, aswell as the display and storage media, CR eliminates film from the image-recording step, resulting in a separation of image capture from image displayand image storage. This separation of functions allows optimization of eachof these steps individually. In addition, CR can capitalize on featurescommon to all digital images, namely, electronic transmission, manipulation,display, and storage of radiographs.
Computed radiography can be used for the digital image acquisition ofprojection radiography examinations into a PACS. As a result of its wideexposure latitude and relative forgiveness of exposure technique, CR canimprove the quality of images acquired in difficult imaging situations, as in portable or bedside examinations of critically ill or hospitalized patients.As such, CR systems have been successfully used in the intensive care unit (ICU), in the emergency room (ER) or trauma center, as well as in the operating room (OR). CR can also be cost-effective for a high-volumeclinic setting or for a low-volume setting for input to a teleradiology service, and it has successfully reduced retake rates for portable and otherexaminations.
Technologic advances in CR hardware and software have contributedto the increased acceptance of CR as the current counterpart to conventionalscreen-film projection radiography, making its use for clinical purposes morewidespread. CR is compatible with existing x-ray equipment, yet separatesthe functions of image acquisition or capture, image display, and imagearchiving, as opposed to traditional screen-film radiography, in which filmserves for image capture, display, and archival medium. This separation offunctions by CR enables optimization of each of these steps individually.Potential benefits are improved diagnostic capability via the wide dynamicrange of CR and the ability to manipulate the exam through image process-ing as well as enhanced radiology department productivity via networkingcapabilities for transmission of images to remote digital softcopy displays andfor storage and retrieval of the digital data.
DIGITAL RADIOGRAPHY In addition to the current clinical devices fordigital image acquisition of projection x-rays, such as CR or imaging with
PACS: A Guide to the Digi tal Revolut ion18
DRE02 11/16/2005 9:27 AM Page 18

photostimulable or storage phosphors, are the direct digital detectors, whichfall under the general heading of DR.
Digital radiography refers to devices in which the digitization of the x-ray signal occurs within the detector itself, providing an immediate fullfidelity image on a softcopy display monitor. Compare this with CR, whichuses a photostimulable phosphor imaging plate detector in a cassette designthat must be processed in a CR reader following x-ray exposure for conver-sion to a digital image. Digital radiography devices may be classified as director indirect based on their detector design and conversion of absorbed x-raysinto an image. Note that the acronym DR may be used by some to refer todirect radiography, also called direct digital radiography (DDR), a subset ofdigital radiography in which x-ray absorption within the detector is con-verted into a proportional electric charge without an intermediate light conversion step.
Recent technologic advances in CR and DR have made digital projec-tion radiography more prevalent in the clinical arena; CR currently has agreater clinical installation base. Hardware and software improvements indetector devices, in image reading-scanning devices, in image-processingalgorithms, and in the cost and utility of image-display devices have con-tributed to the increased acceptance of these digital counterparts to con-ventional screen-film radiography.
COMPARISON OF COMPUTED RADIOGRAPHY AND DIGITAL RADIOGRA-PHY Digital radiography devices have more efficient detectors, offeringdirect energy conversion of x-ray for immediate readout. These detectorshave all the benefits of digital or filmless imaging. But cost is still highbecause detector production is difficult and expensive, and DR is a one-room-at-a-time detector. DR may be cost-effective in high-volume sites andfor imaging examinations requiring higher spatial resolution, such as uprightchest exams and bone work.
The ease of use, straightforward integration, and proven reliability ofCR systems over DR systems adds to the attractiveness of CR as a replace-ment for screen-film systems in general radiography in a PACS digital-imaging network. Digital radiography, however, has potential for excellentimage quality available immediately at the time of exposure. It is likely thatCR and DR devices will coexist for some time.
While CR and DR have been used for general radiography for many years, it is only recently that they have been successfully applied tomammography. Furthermore, meeting the cost competitiveness of screen-film systems is difficult unless film printing is eliminated from the cost equa-tion. Future improvements in image-processing algorithms, with a better
INTRODUCTION TO RIS AND PACS 19
DRE02 11/16/2005 9:27 AM Page 19
understanding of optimum display settings for softcopy viewing, have thepotential to greatly facilitate and standardize softcopy reading of digital projection radiographs and further the acceptance of CR and DR in the clinical arena. There is more detailed explanations of these technologies inlater chapters.
PACS CORE
Once the images have been acquired, they need to be managed appropriatelyto ensure that storage, retrieval, and delivery all occur without error. ThePACS should also guarantee that the images are stored using long-term methods that meet the minimum legal obligations for the retention ofimages for the given state. Additionally, they need to be delivered for interpre-tation in a timely manner. These requirements are satisfied by the PACS core.
The PACS core consists of the following:
◗ Database manager (e.g., Oracle, MS-SQL, Sybase)◗ Image archive (e.g., RAID, Jukebox)◗ Workflow/control software (image manager)◗ RIS interface
The database manager is the heart of the PACS. The relationshipbetween the image and the storage location is stored and managed withinthe database along with all the relevant data required to retrieve the image(see Figure 2.3). The database manager must also to be able to retrieveimages for a given patient’s current or prior exams when queried by the RISor other outside systems. The types of queries that the database responds toare defined by the Digital Imaging and Communications in Medicine(DICOM) standards. DICOM and these associated properties will be dis-cussed later in this section. The database architecture is typically relational,utilizing Oracle or Microsoft SQL Server.
The image archive works in conjunction with the database manager bystoring the images in a highly available system to provide online images fornearly instant retrieval and long-term storage to meet retention regulationsand disaster recovery. The images available for nearly instantaneous accessconsist of the recently acquired exams and those that were pre-fetched(requested by the RIS) from the previously scheduled exams and pulled fromlong-term storage. This storage is often referred to as online or near-line. It
PACS: A Guide to the Digi tal Revolut ion20
DRE02 11/16/2005 9:27 AM Page 20

consists of redundant array of inexpensive disks (RAID), where the imagesare stored on hard disk and are readily available when the database managermakes a request for the images to be distributed. The second tier of storageis referred to as long-term storage; this is intended to be the location forstudies that need to be kept on hand but are not needed for immediate access.The platform for this type of storage ranges from tape and optical jukeboxesto storage-area networks. As the cost of RAID continues to plunge, it isunclear how much longer there will be a need to utilize this secondarystorage for clinical image retrieval at all; it may evolve into a disaster recov-ery system only.
Image management (workflow control) is the role of the core that is the most visible and drives the functionality of the PACS. The image management process is where the data from the RIS and the data from thecore meet and are managed in a number of different ways. Image manage-ment/workflow of the PACS determines where and how images are routedthroughout the system to ensure they are stored appropriately once receivedfrom the imaging devices. Image management is also responsible for therouting of exams to the appropriate location, responding either to the PACSdatabase or to the RIS. In addition to managing the storage and distributionof images, the image manager is also the area within the PACS where thesystem administrator has tools to correct for system and data errors to ensuredata integrity.
INTRODUCTION TO RIS AND PACS 21
RadiologistWorklist
BrokerRIS
ModalityWorklists Modality
Display
Query
Update
PACSCore
Exam Status Update
FIGURE 2.3
RIS-driven PACS workflow.
DRE02 11/16/2005 9:27 AM Page 21
The RIS interface is where the two principal computing systems withinthe digital department come together. This interface is responsible forpassing the appropriate scheduling and exam information to the core to facilitate the pre-fetching of prior exams, the validation of the demo-graphic/exam information stored within the image prior to storage in thecore and subsequent distribution. Depending on the configuration and archi-tecture of the PACS-RIS relationship, this interface is managed with orwithout a broker.
The role of the broker is to negotiate between the PACS and the RISthe data required and perform any data format conversions that may berequired. The use of a broker is not preferred since it is another point formanagement and for failure, in addition to the limited functionality it mayimpose on the system.
PACS-RIS architectures are moving away from the use of brokers andare either combining the RIS into the PACS or vice versa. Essentially whereis the functionality of the broker embedded? The combination of the RIS-PACS is based on which system actually controls the workflow. In anRIS-driven environment, the modality and the radiologists’ worklists arecontrolled directly by the RIS, with the PACS acting in the passive role ofserving the images at the request of the RIS (Figure 2.3).
In this method, the RIS is driving workflow by drawing on its databaseto populate the modality worklists, therefore driving the work performed ateach modality. The schedule, status of each exam, and changes in status (can-celed or completed) are communicated directly with the RIS, enabling theRIS to make direct updates to its database. Once the completed status eventis received from the modality and the study is validated (RIS and PACScompare information to ensure accuracy), the exam is sent from the RIS tothe radiologist workstation worklist. The radiologist is then presented theexam for interpretation simply by using the data provided by the RIS toquery the PACS and having the image displayed on the workstation. TheRIS is driving the work, and the PACS is simply an image repository that isqueried on an as-needed basis. This is the model that PACS architecturesare moving toward since the RIS is the primary repository for all depart-mental data and it does not make sense to duplicate data sources.
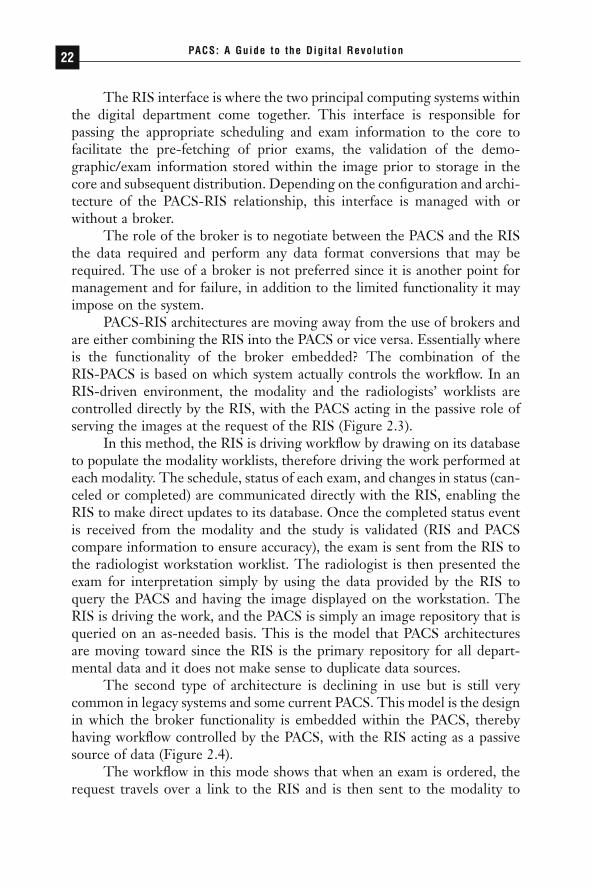
The second type of architecture is declining in use but is still verycommon in legacy systems and some current PACS. This model is the designin which the broker functionality is embedded within the PACS, therebyhaving workflow controlled by the PACS, with the RIS acting as a passivesource of data (Figure 2.4).
The workflow in this mode shows that when an exam is ordered, therequest travels over a link to the RIS and is then sent to the modality to
PACS: A Guide to the Digi tal Revolut ion22
DRE02 11/16/2005 9:27 AM Page 22
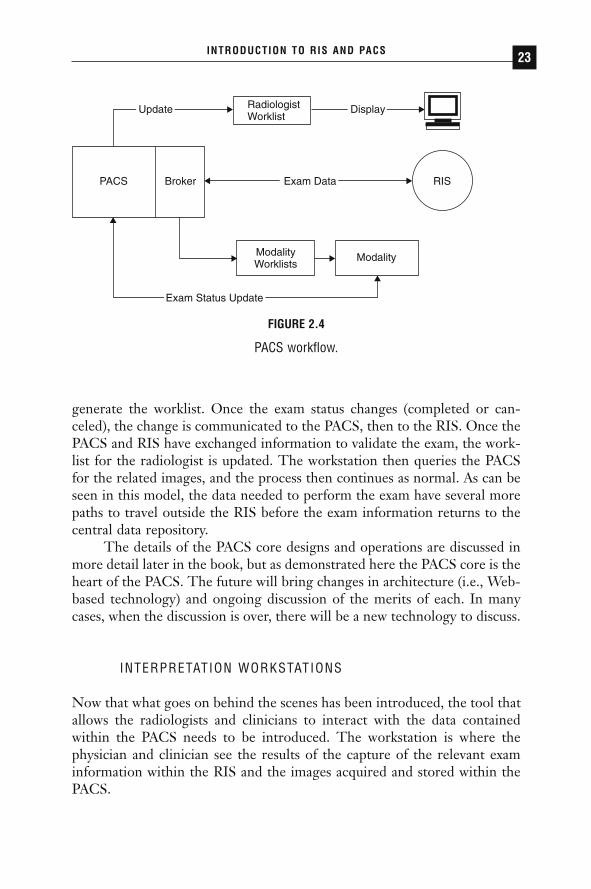
generate the worklist. Once the exam status changes (completed or can-celed), the change is communicated to the PACS, then to the RIS. Once thePACS and RIS have exchanged information to validate the exam, the work-list for the radiologist is updated. The workstation then queries the PACSfor the related images, and the process then continues as normal. As can beseen in this model, the data needed to perform the exam have several morepaths to travel outside the RIS before the exam information returns to thecentral data repository.
The details of the PACS core designs and operations are discussed inmore detail later in the book, but as demonstrated here the PACS core is theheart of the PACS. The future will bring changes in architecture (i.e., Web-based technology) and ongoing discussion of the merits of each. In manycases, when the discussion is over, there will be a new technology to discuss.
INTERPRETATION WORKSTATIONS
Now that what goes on behind the scenes has been introduced, the tool thatallows the radiologists and clinicians to interact with the data containedwithin the PACS needs to be introduced. The workstation is where thephysician and clinician see the results of the capture of the relevant examinformation within the RIS and the images acquired and stored within thePACS.
INTRODUCTION TO RIS AND PACS 23
RadiologistWorklist
PACS Broker RIS
Modality
Update Display
Exam Data
ModalityWorklists
Exam Status Update
FIGURE 2.4
PACS workflow.
DRE02 11/16/2005 9:27 AM Page 23

There are two general classifications of workstations: diagnostic andreview. The distinguishing characteristics between them are resolution andfunctionality. The diagnostic workstation is the type that is used by the radi-ologist to perform primary interpretation of the exam. These workstationsare the highest in resolution and brightness and contain the highest level offunctionality. Historically, they have been dedicated to the task with theapplication loaded locally, in some cases, on hardware and operating systemsother than the Windows/Intel (Wintel) platforms. These systems are quiteexpensive and require support skills that are not found in the typical hospi-tal or clinic setting. Also, due to the expense, the number of workstationsthat could be deployed was limited by available capital, which, in many cases,after the purchase of the core of the PACS was quite limited. As technologyhas moved forward, many of these workstations have moved to the Wintelplatform, which has somewhat reduced the capital cost of the workstationsand enabled a greater number of workstations to be deployed. Workstationavailability is an issue that needs to be taken into consideration when makingthe PACS purchase decision. It may be that due to limited capital resources,the potential efficiencies gained by the deployment of PACS are outweighedby the limited number of available workstations. However, there is a newtrend in the industry that is quickly becoming the standard, Web-basedPACS. In this case the primary interpretation workstation is any computerthat meets the performance and video resolution requirements to supportthe interface and has network connectivity. This new technology facilitatesincreased usage and acceptance of the workstation in the department,thereby increasing availability of workstations and the desired efficienciesthey bring. This new trend will drive many more practices into the PACSworld. Also, this availability of Web-based workstations is facilitating theincreased level of teleradiology solutions due to the Web-based clients thatallow access from almost anywhere.
The next type of workstation is the clinical review workstation. Thisworkstation is not as powerful as the diagnostic workstation. The differencecan be in hardware (resolution), available software functionality, or both. Inthe past, the sheer cost of deploying diagnostic workstations made it difficult for referring clinicians to benefit from the advantages of PACS. This drove the need for a step down in the type of services provided by theworkstation. In the past, many PACS vendors either created a scaled-downversion of their workstation or leveraged the rising technology of the Web.The clinical review workstation allows referring clinicians to have directaccess to the images. The quality of images is sufficient for the interpreta-tion of clinicians, allowing them to review the images along with the radi-ology report and possibly to share those results. This area of workstations is
PACS: A Guide to the Digi tal Revolut ion24
DRE02 11/16/2005 9:27 AM Page 24

benefiting the most from the advent of Web-based workstations. Web-basedclients allow access to the images to be distributed more widely within andoutside the practice.
It is important to note that the technology behind the workstation isincreasing at an incredible rate and that the hardware needed to support itis becoming ever-more accessible. As this trend continues, the penetrationof PACS technology within the institution will increase, allowing the prac-tice to realize more and more of the efficiencies that may have driven thePACS decision.
CONCLUSION
As the practice of radiology is faced with the challenges of reduced reim-bursements and the lack of both financial and human capital, some criticaldecisions need to be made to try to stave off the potential failure of the prac-tice. Practices must attempt to drive their operations in the most efficientmanner possible to better defend against these forces. Not only are therefinancial pressures; there is significant pressure from the referring base foradvanced imaging services. These services can be provided in an analog prac-tice; however, as technology continues to advance, the data will continue toincrease, and this will eventually overrun the analog practice. The forcesacting on the modern radiology practice dictate that a practice will have tobecome digital sometime to survive. The following chapters provide youwith the detailed knowledge you need to start on the path of both under-standing and becoming digital.
INTRODUCTION TO RIS AND PACS 25
DRE02 11/16/2005 9:27 AM Page 25

PACS STRATEGICPLAN AND NEEDS
ASSESSMENT
LEONARD A. LEVINE
WHY DO YOU NEED A PACS STRATEGIC PLAN?
For more than 100 years, the efficiency of radiology practices has beenlimited by film and film-handling activities. Picture archiving and commu-nication systems (PACS) completely reengineer radiology practices byenabling images to be electronically viewed virtually anywhere on a clinicalworkstation or an ordinary PC. Film is printed on demand instead of aftereach and every exam by the technologists. Prior examination films do notneed to be retrieved, matched to current films, distributed to radiologists,and retrieved again for refiling and storage. Radiologists’ reports are notdelayed due to missing films or because of inadequate hanging space for filmon an alternator or view box.
PACS enables ubiquitous availability of images, resulting in improvedclinical care and productivity throughout the healthcare enterprise. Patient
3CHAPTER
DRE03 11/16/2005 9:29 AM Page 27

care is improved due to image availability and faster report turnaround andbecause the image dataset can be manipulated to yield more clinical infor-mation (e.g., three-dimensional [3-D] reconstruction and computer-aideddiagnosis [CAD]).
Because a PACS is expensive technology that impacts the entire health-care enterprise, a strategic business plan is essential to define the costs, ben-efits, technical changes, and operational changes that will need to occur tomake the PACS a success. In many cases, a principal goal of the PACS strate-gic business plan is to help secure funding for the PACS and to provide aroadmap for its implementation. Building a strategic plan often provides thefirst opportunity in the process to educate end users about how the PACSwill impact their operations. The issues and functional requirements identi-fied in the strategic planning process will become input to the request forproposal (RFP). PACS vendors will be required to respond in detail to theRFP about how they will meet the unique needs of your institution.
WHAT IS IN THE PACS STRATEGIC PLAN?
A PACS strategic business plan is typically comprised of operational, tech-nical, and financial sections. The following documentation is required todevelop the plan:
◗ A list of all sites where images are acquired, clinically reviewed, orinterpreted, which will help to define the scope of the project.
◗ A modality list for each site, which will identify any upgrades andassociated costs that will be required to successfully integrate theimaging equipment with the PACS.
◗ An organizational chart, which will reveal the contacts responsiblefor each area that may be affected by the PACS. These stakeholderswill need to be educated about how a PACS can affect their opera-tions. In turn, they may become some of the key decision makers that will help define how the PACS should be implemented in theirareas.
◗ Mission and vision statements to illustrate how a PACS is alignedwith the organization’s other strategic goals.
◗ Technical staffing data, throughput statistics, and hours of operationby modality, which will project productivity and capacity improve-ments that may result from a PACS implementation.
PACS: A Guide to the Digi tal Revolut ion28
DRE03 11/16/2005 9:29 AM Page 28
◗ Professional staffing data, including reading room locations and thedegree of subspecialty interpretation, which will help estimate thenumber and type of primary interpretation workstations that will be needed.
◗ Exam volume and commensurate film expenses, which will helpproject film savings and estimate digital image archive needs.
◗ Network diagrams, including wide area networks to offsite imagingsites, to determine the adequacy of imaging dataset transmission.
◗ Number and type of different radiology information systems (RIS)and hospital information systems (HIS) deployed across the enter-prise and whether patients have a unique medical record numberacross the various sites in the enterprise. Vendors should be able to explain how their PACS solution will seamlessly and effectivelyfacilitate the flow of images across disparate HIS and RIS systems.
PACS STRATEGIC PLANNING: OPERATIONS
There are six recommended components to the operational section of theplan: (1) alignment with other strategic initiatives, (2) a PACS readinessassessment, (3) a basic phased implementation plan, (4) a PACS operationalimpact analysis, (5) a market assessment, and (6) a concluding section thatillustrates how PACS can leverage existing human and capital resources tomeet future demand for radiological services. Each component is discussedbelow.
ALIGNMENT TO STRATEGIC GOALS AND OBJECTIVES
The first phase of the strategic planning process is to outline the strategicgoals and objectives for the project. Strategic goals may be logistical innature, for example, moving into a new “digitally ready” department. Theremay also be strategic business objectives for the PACS, for example, align-ing the PACS plans for a private radiologist’s practice with the PACS plansfor the hospital served. Other objectives may include protection or expan-sion of market share and professional recruitment. Information systems (IS)initiatives will need to be integrated with the PACS; for example, deploy-ment of an electronic medical record or a new RIS will need to be alignedwith the PACS strategy.
PACS STRATEGIC PLAN AND NEEDS ASSESSMENT 29
DRE03 11/16/2005 9:29 AM Page 29

PACS READINESS ASSESSMENT
A PACS readiness assessment consists of an assessment of the organizationalbehavior, technical infrastructure, and existing operations. Assessment oforganizational readiness includes a candid evaluation of whether the currentleadership, departmental culture, and available support personnel are readyto implement and manage the change processes associated with a PACSimplementation. A leader with prior PACS experience and project manage-ment skills is recommended in order to develop the institutional “vision” fora PACS. Operational and technical aspects of the organization’s readiness toimplement PACS may be gleaned from interviews with key stakeholders anddecision makers.
Since a strategic business plan is often the vehicle that is used to securefunding for a PACS, interviews conducted during the strategic planningprocess represent an opportunity to both educate and build support for aPACS throughout all levels of the institution. Consultants with direct PACSexperience can provide the education that is necessary for building supportfor the strategic business plan. The results of the interviews will drive thedevelopment of the PACS implementation plan. The specific objectives ofeach interview are discussed below.
Radiology administration, including the administrative director and thechief of radiology, can identify the drivers for PACS from a radiology per-spective, including service and productivity issues. Radiology administratorscan assist with computed radiography (CR) or digital radiography (DR)deployment strategies. With PACS, on demand printing often replaces print-ing each study after acquisition. Ironically, this may result in the need formore printing capacity at certain locations (e.g., the film library). Radiologyadministrators can assist with the deployment strategy for Digital Imagingand Communications in Medicine (DICOM) compliant printers.
Hospital executives, including the chief executive officer, chief operating officer, chief information officer, chief financial officer, and vicepresidents, can identify PACS drivers from an institutional perspective. Thechief financial officer should discuss competing capital-intensive initiativesand describe the requirements for the capital decision-making process.These executives can also assist in setting the financial goals for reducingfilm printing. PACS does not completely eliminate the need to print film,and it is important to plan for the ability both to print on demand and toprint film as a backup strategy in the event the PACS is down.
Referring physicians can define their service level expectations fromradiology and provide insight into how a PACS can be optimized through-out the enterprise to improve patient throughput and care. Referring
PACS: A Guide to the Digi tal Revolut ion30
DRE03 11/16/2005 9:29 AM Page 30
physician support is critical to the success of a PACS project. High-volumeclinical areas, such as the intensive care unit (ICU) and emergency room,may have special requirements for electronic viewing of images. These areasare accustomed to having direct access to film and may require workstationscomparable to those deployed in radiology, including dual monitors for side-by-side comparison of current and prior exams, with high-brightness, high-resolution, and grayscale monitors. The plan should include estimates of theassociated costs of these workstations.
Radiologists should describe how the current analog environment negatively affects their ability to provide optimal service and how the PACSwill mitigate or remedy the situation. A privately owned radiology practicemay have PACS goals that are inconsistent with the hospital’s. Outside con-sultants may be able to offer solutions that are more closely aligned withboth the hospital’s and the radiologists’ goals. Professional staffing and inter-pretation practices will help to determine the location and type of diagnos-tic workstations and monitors that should be deployed.
The role of film librarians will be significantly different in a PACS envi-ronment. Film librarians will be managing electronic images, printing ondemand, and managing the unread case list. They will need to be PC profi-cient and able to understand complex decision rules, particularly during thetransition period from analog to digital images, to ensure that all relevantprior images, regardless of medium, are available at the time of interpreta-tion. Therefore, the skill sets of this group need to be assessed. The filmlibrarians can also provide estimates of the impact of lost film on patient careand throughput.
Technical managers and technologists should describe workflow, par-ticularly as it relates to film-handling activities. The interviews of technicalmanagers and technologists along with observations should be used to quan-tify the expected positive impact of a PACS on technologists’ productivityand equipment utilization.
The interviews conducted during the PACS readiness assessmentshould be synthesized to highlight common themes about the PACS strate-gic goals and objectives.
IMPLEMENTATION PLAN
The third component of the operational strategic plan is a high-level imple-mentation plan based on a phased approach to the PACS deployment. Thephases of the implementation plan are typically based on strategic financialand operational PACS drivers that were identified in the interview process.
PACS STRATEGIC PLAN AND NEEDS ASSESSMENT 31
DRE03 11/16/2005 9:29 AM Page 31

The plan should include potential schedules for CR or DR deployment,digital archive building, transitioning radiology operations to PACS, andenterprise-wide PACS deployment of electronic images as well as plans toreduce film expenses.
The implementation plan should include a description of each majorphase of the project, including its primary objectives and benefits, estimatedtime frame, dependencies, and costs (Table 3.1). The implementation plansets the parameters on when PACS-related expenses will be incurred andwhen film and film-related savings will be realized. Therefore, the imple-mentation plan is a prerequisite to developing the PACS return on invest-ment (ROI).
PACS IMPACT ANALYSIS
The fourth component of the operations section is the PACS impact analy-sis. The impact analysis includes estimates of the expected PACS benefitsthat may be realized through improved workflow and clinical care at eachphase of the PACS deployment. Much of the emphasis will be on the work-flow and productivity improvements that occur within radiology. Enterprise-wide PACS benefits should be discussed, although they are generally moredifficult to quantify.
PACS IMPACT ON FILM AND FILM-RELATED EXPENSE
Film savings are usually the most quantifiable cost savings used to justifyinvestments in PACS. Film savings include not only the cost of the actualfilm used but also all film-related costs, such as chemistry, film handling,storage, transportation, reprints and retakes, and film processor maintenance.
Film cost avoidance projections should include estimates of additionalfilm that would otherwise be used to meet expected exam volume growth.Estimates should also include projected film increases that would otherwiseoccur with the use of newly deployed multislice computed tomography (CT)scanners and other image-intensive modalities.
Cost savings can also include an anticipated reduction in the film libraryworkforce, but many plans attempt to estimate this more aggressively thanis reasonable. It is important to remember that the need to manage andretrieve prior films may persist for several years after the deployment ofPACS, and the need to print some films on demand may persist indefinitely.
PACS: A Guide to the Digi tal Revolut ion32
DRE03 11/16/2005 9:29 AM Page 32

PACS STRATEGIC PLAN AND NEEDS ASSESSMENT 33
TABL
E 3.
1PA
CS Im
plem
enta
tion
Plan
Prim
ary
Estim
ated
Phas
eKe
y Ob
ject
ives
Bene
fits
Tim
e Fr
ame
Depe
nden
cies
Cost
1De
velo
p an
d co
mm
unic
ate
PACS
Se
t sta
ge fo
r3–
6 m
onth
sVe
ndor
$1,6
00,0
00st
rate
gic
plan
rem
aini
ngse
lect
ed(P
ACS)
Inst
all t
elec
omm
unic
atio
ns li
nks
phas
esCo
ntra
ct$2
20,0
00Up
grad
e CT
, MRI
, US,
and
NM
mod
aliti
essi
gned
(SR)
to D
ICOM
, wor
klis
t-ena
bled
Fund
ing
Prep
are
site
s fo
r vi
ewin
g lo
catio
nsap
prov
edIn
stal
l net
wor
king
(w
iring
and
sw
itche
s)RI
S st
able
Prep
are
com
pute
r ro
omIn
stal
l PAC
S co
re s
yste
m, i
nclu
ding
Web
ser
ver
Impl
emen
t RIS
inte
rfac
eIn
stal
l spe
ech
reco
gniti
on s
erve
r an
dRI
S in
terf
ace
Trai
n ra
diol
ogis
ts2
Brin
g CT
, MRI
, US,
and
NM
mod
aliti
esIm
prov
e6–
12 m
onth
sPh
ase
1$6
00,0
00on
line
radi
olog
ist
com
plet
ed(P
ACS)
Inte
grat
e m
odal
ities
with
PAC
Spr
oduc
tivity
Trai
n te
chno
logi
sts
Redu
ce lo
stAc
quire
imag
esfil
mQA
imag
e qu
ality
(Con
tinue
d)
DRE03 11/16/2005 9:29 AM Page 33

PACS: A Guide to the Digi tal Revolut ion34
TABL
E 3.
1PA
CS Im
plem
enta
tion
Plan
(Con
tinue
d)
Prim
ary
Estim
ated
Phas
eKe
y Ob
ject
ives
Bene
fits
Tim
e Fr
ame
Depe
nden
cies
Cost
Impl
emen
t sof
tcop
y in
terp
reta
tion
ofIm
prov
e re
port
CT a
nd M
RI m
odal
ities
turn
arou
ndIn
stal
l dia
gnos
tic w
orks
tatio
nsIm
prov
e ac
cess
Trai
n ra
diol
ogis
tsto
dig
ital
Impl
emen
t lim
ited
film
ing/
prin
t on
mod
ality
dem
and
imag
es in
Inte
grat
e la
ser
prin
ters
with
PAC
Sra
diol
ogy
Deve
lop
and
impl
emen
t lim
ited
film
ing
prog
ram
3In
stal
l CR
Redu
ce lo
st3–
9 m
onth
sPh
ase
1$2
30,0
00In
stal
l CR
equi
pmen
tfil
mco
mpl
eted
(PAC
S)In
tegr
ate
CR w
ith P
ACS
Impr
ove
acce
ssCR
fund
ing
$1,0
00,0
00Tr
ain
tech
nolo
gist
sto
pla
in fi
lmap
prov
ed(C
R)Ac
quire
imag
esim
ages
inPA
CS s
uppo
rtPe
rfor
m Q
A on
imag
e qu
ality
radi
olog
ypl
an
DRE03 11/16/2005 9:29 AM Page 34

PACS STRATEGIC PLAN AND NEEDS ASSESSMENT 35
Impl
emen
t sof
tcop
y in
terp
reta
tion
of C
RIm
prov
eIn
stal
l clin
ical
rev
iew
wor
ksta
tions
(IC
Usra
diol
ogis
tan
d ED
s)pr
oduc
tivity
Trai
n cl
inic
ians
Impr
ove
repo
rtLi
mite
d fil
min
g/pr
int o
n de
man
dtu
rnar
ound
Deve
lop
and
impl
emen
t lim
ited
film
ing
Impr
ove
acce
sspr
ogra
mto
pla
in fi
lmim
ages
in IC
Uan
d ED
4In
tegr
ate
imag
ing
Web
use
r in
terf
ace
Prov
ide
acce
ss6–
12 m
onth
sPh
ases
1, 2
,$2
50,0
00w
ith e
lect
roni
c m
edic
al r
ecor
dto
imag
es to
and
3Im
age
dist
ribut
ion
to c
linic
ians
refe
rrin
gco
mpl
eted
Mar
ket c
apab
ility
clin
icia
nsIn
form
clin
icia
ns o
f ava
ilabi
lity
and
Impr
ove
serv
ice
hard
war
e re
quire
men
tsRe
duce
film
Assi
st w
ith in
stal
latio
nco
stTr
ain
user
sIm
plem
ent l
imite
d fil
min
g/pr
int o
nde
man
dEx
pand
lim
ited
film
ing
prog
ram
CR in
dica
tes
com
pute
d ra
diog
raph
y; C
T, c
ompu
ted
tom
ogra
phy;
DIC
OM, D
igita
l Im
agin
g an
d Co
mm
unic
atio
ns in
Med
icin
e; E
D,em
erge
ncy
depa
rtmen
t; IC
U, in
tens
ive
care
uni
t; M
RI, m
agne
tic r
eson
ance
imag
ing;
NM
, nuc
lear
med
icin
e; P
ACS,
pic
ture
arc
hivi
ngan
d co
mm
unic
atio
n sy
stem
s; Q
A, q
ualit
y as
sura
nce;
SR,
spe
ech
reco
gniti
on; U
S, u
ltras
ound
.
DRE03 11/16/2005 9:29 AM Page 35

PACS: A Guide to the Digi tal Revolut ion36
In addition, films from modalities that cannot easily be converted to digital format (e.g., mammography) must continue to be managed by thefilm librarians.
Film-related cost savings must be related to the implementation plan.For example, if deployment of enterprise-wide electronic distribution ofimages is delayed until the latter phases of the project, you will not be ableto stop printing film until after this phase of the project is complete. If youare phasing in PACS one modality at a time, film savings will be realizedonly for the modalities implemented and only if electronic distribution isavailable for those modalities.
Some areas are particularly challenging for electronic distribution andmay need to continue to print film until the operational issues unique tothese areas are addressed. For example, orthopedists may need to be able toperform measurements on the images for comparison with prostheticdevices. If the PACS does not provide this capability, the orthopedists willneed to continue to receive film. Deploying workstations in operating rooms(ORs) may be a challenge due to space constraints, the bright lighting con-ditions, and requirement for a sterile operating field, resulting in continuedfilm printing for this area. Digital mammography places some extraordinarydemands on PACS due to the large image sizes and requirement for high-resolution workstations. As a result, digital mammography is not widelydeployed at the current time.
PACS OPERATIONAL IMPACT ANALYSIS
The PACS impact analysis should include an analysis of technologist workflow in order to quantify the productivity and capacity opportunitiesthat may result from a PACS implementation within radiology. Productiv-ity and capacity improvements are commensurate with the amount of film-handling activities that are eliminated through a PACS implementation. Thetotal time required for these activities can be estimated based on a percent-age of total work time spent on performing them or on a per-exam basis.The time required for film-handling activities can then be annualized tohours based on the number of studies performed. The film-handling timeestimates may be obtained through any combination of interviews, heuris-tics, or observations. Examples of film-handling activities include but are notlimited to sneaker-nets, film printing, matching priors, refilming, searchingfor lost films, and slow teleradiology systems. Increases in equipment capac-ity due to faster throughput through elimination of film-handling activitiesshould also be estimated.
DRE03 11/16/2005 9:29 AM Page 36

The recouped equipment capacity may not be commensurate with thetechnologist productivity gains, since adjustments for multi-technologiststaffing and other factors may be required. For example, if two technologistsare staffing a CT scanner, patient throughput may be reduced if one technologist is processing film while the second technologist is focusing onpatient throughput.
Capacity opportunities and productivity improvements during the offshifts should be excluded if the demand is exceptionally low during thoseperiods. Always include benefits and shift differentials when translating thehours saved to salary avoidance.
PACS IMPACT ON MARKET SHARE ANALYSIS
The competitor analysis includes a definition of the immediate radiologymarket, a description of competitors, and the status of their PACS imple-mentations. The strategic plan should note any PACS advertising done bylocal competitors in order to highlight any potential threat to market share.Complete the threat assessment with a description of the market share atrisk if PACS is not implemented at your institution. Typically, estimates forthe at-risk market share are provided by senior hospital executives and thehospital’s marketing department. The goal of projecting the market-share-at-risk assessment is to estimate the amount of additional revenue that maybe shifted to or from a competitor that has respectively superior or inferiorradiology services.
The market share analysis is important because enhanced revenue fromPACS has a far greater impact on ROI analysis than do film and film-handling savings alone. However, revenue assessments are difficult to makeand are based on soft assumptions about current and future market share.Therefore, it is imperative to include the most senior levels of institutionaland radiology administration in generating the assumptions that lead toexpected PACS-related revenue changes. It is ultimately up to this same teamto decide whether projected revenue enhancements should be includeddirectly in the ROI. Projected revenue enhancements can often turn a neg-ative PACS ROI positive. Even if potential revenues are not included in theROI, they should be discussed in the strategic plan to illustrate the point thatwithout a PACS, current revenue sources may be at risk to PACS-enabledcompetitors who may be capable of delivering electronic images to the cli-nicians’ desktop computers.
The example in Table 3.2 illustrates the point. Community Hospitalknows its current annual volume and estimates that it currently captures 60%
PACS STRATEGIC PLAN AND NEEDS ASSESSMENT 37
DRE03 11/16/2005 9:29 AM Page 37

of the outpatient radiology business in its target market area. Based on itsknown volume and its estimate of current market share, Community Hos-pital estimates the total market volume and outstanding market share. Senioradministrators then discuss the referring physician community, competition,and advantages of being the first hospital in the area to deliver images to thereferring physicians’ desktop computers. They agree that it is reasonable toassume a potential 5% shift in the outstanding market share to CommunityHospital if digital image service is available and effectively marketed to thereferring physician base. Even with a current outpatient volume of only75,326, a 5% shift of the outstanding market share to Community Hospitalwould result in an additional 2,511 exams annually.
To estimate potential revenue, Community Hospital multiplies thepotential outpatient exam volume by its charge per exam and then by itsaverage collection rate. The result is the potential revenue opportunity thatmight be available by effectively marketing a PACS in a competitive market.Table 3.3 illustrates the calculation for potential revenue. Table 3.3 indicatesthat a 5% shift in market share could potentially lead to over a half a milliondollars in additional revenue. The model assumes that the mix of exams willremain the same.
PACS: A Guide to the Digi tal Revolut ion38
TABLE 3.2Potential Shift in Market Share Exam Volume
Community 5% PotentialHospital Market ShiftVolume (est. Estimated Total Outstanding in Volume to60% market Outpatient Market Share Community
Modality share) Market Volume (40%) Hospital
CT 13,470 22,450 8,980 449Diagnostic 51,174 85,290 34,116 1,706MRI 4,718 7,863 3,145 157US 5,964 9,940 3,976 199Total 75,326 125,543 50,217 2,511
CT indicated computed tomography; MRI, magnetic resonance imaging; US, ultrasound.
DRE03 11/16/2005 9:29 AM Page 38
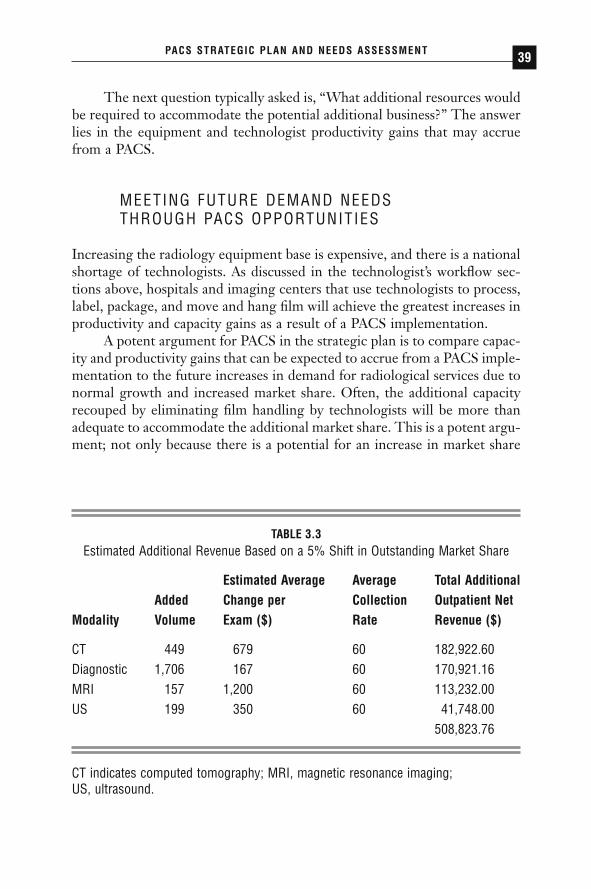
The next question typically asked is, “What additional resources wouldbe required to accommodate the potential additional business?” The answerlies in the equipment and technologist productivity gains that may accruefrom a PACS.
MEETING FUTURE DEMAND NEEDS THROUGH PACS OPPORTUNITIES
Increasing the radiology equipment base is expensive, and there is a nationalshortage of technologists. As discussed in the technologist’s workflow sec-tions above, hospitals and imaging centers that use technologists to process,label, package, and move and hang film will achieve the greatest increases inproductivity and capacity gains as a result of a PACS implementation.
A potent argument for PACS in the strategic plan is to compare capac-ity and productivity gains that can be expected to accrue from a PACS imple-mentation to the future increases in demand for radiological services due tonormal growth and increased market share. Often, the additional capacityrecouped by eliminating film handling by technologists will be more thanadequate to accommodate the additional market share. This is a potent argu-ment; not only because there is a potential for an increase in market share
PACS STRATEGIC PLAN AND NEEDS ASSESSMENT 39
TABLE 3.3Estimated Additional Revenue Based on a 5% Shift in Outstanding Market Share
Estimated Average Average Total AdditionalAdded Change per Collection Outpatient Net
Modality Volume Exam ($) Rate Revenue ($)
CT 449 679 60 182,922.60Diagnostic 1,706 167 60 170,921.16MRI 157 1,200 60 113,232.00US 199 350 60 41,748.00
508,823.76
CT indicates computed tomography; MRI, magnetic resonance imaging; US, ultrasound.
DRE03 11/16/2005 9:29 AM Page 39

and additional revenue generation, but because most, and sometimes all, ofthe revenue can be realized with little or no additional costs.
In the example in Table 3.4, the marginal or additional demand for newexams by year 5 is shown in line A. This is a combination of the demandfrom new market share due to improved service from the PACS and a 5%estimated annual growth rate. Line B is the total capacity that is expected tobecome available when film-handling activities are eliminated and when data
PACS: A Guide to the Digi tal Revolut ion40
TABLE 3.4Ability to Meet Growth and Market Demand Through Reduced Film Handling and
Worklist Management
Demand Projections
NuclearPlain Film Ultrasound CT MRI Medicine
Estimated annual growth 1,189 354 603 147 82Additional market share 156 49 56 132 23
potential (outpatients)Total additional exams (A) 1,345 403 659 279 105
Recoverable Capacity
NuclearPlain Film Ultrasound CT MRI Medicine
Recovered exam capacity 0 1,349 1,678 261 261from film handling
Recovered exam capacity 12,509 590 804 109 136from worklist management
Total annual potential 12,509 1,939 2,483 370 397recovered exams (B)
Ability to Meet Demand
B/A 930% 481% 377% 132% 380%
CT indicates computed tomography; MRI, magnetic resonance imaging.
DRE03 11/16/2005 9:29 AM Page 40
entry is reduced through worklist management. The last line, B/A, showsthe percentage of the new demand by year 5 that can be met using existinghuman and physical resources. The result can be translated to cost avoid-ance and may be included in the PACS ROI.
Many other benefits to the enterprise that can be attributed to PACSmay be difficult to quantify. Clinicians will experience improved productiv-ity since they will no longer need to spend time looking for film or visitingthe film library. Images and reports will be available in a more timely fashion,providing improved support for clinical decisions. Improved turnaround forradiological reports can reduce inpatient length of stay. Deployment of CRor DR and electronic viewing in the OR can reduce the amount of timerequired for film processing and therefore the amount of time required forthe operation, reducing the risk to the patient and potential costly downtimeof the OR.
Some PACS-related costs may also be difficult to quantify. Training andsupport are extraordinarily important to the success of PACS, and theresources required for effective delivery are consistently underestimated bypotential PACS buyers. A marketing campaign informing referring physi-cians about the availability and benefits of electronic image distribution iscrucial to the realization of film cost savings and maximizing the competi-tive advantage this can provide.
PACS STRATEGIC PLANNING: TECHNICAL
The technical strategic plan includes an assessment of IS readiness to imple-ment a PACs and an assessment of the network infrastructure and PC basewith respect to supporting a PACS and electronic image distribution. Thesection should conclude with a discussion of PACS management issues.
TECHNICAL READINESS
The chief information officer and the network engineering department candescribe their existing networks, their PC support, and their general readi-ness to support a PACS as well as other information technology (IT) initia-tives. In some cases, interviews with IT professionals can be a potentopportunity to allay any apprehensions about the impact of a PACS on theirexisting operations.
The interviews with the IT staff should include an evaluation of thecurrent local area and wide area network infrastructure and its ability to
PACS STRATEGIC PLAN AND NEEDS ASSESSMENT 41
DRE03 11/16/2005 9:29 AM Page 41
support the networking traffic that PACS is expected to introduce, with rec-ommendations for any upgrades that may be required. In addition, it shouldbe determined whether the existing modalities are currently networked viaa private network or connected to the networking infrastructure that will beused for PACS (i.e., the hospital network), as this migration may need to beperformed prior to implementation.
The installed PC base should be evaluated as to its suitability for enter-prise electronic distribution. A minimum of Pentium II processor, 500MHzwith 128MB RAM, with a 17-in monitor is generally recommended. Newermachines may be required by some PACS vendors.
Finally, suitable space for the PACS core components (e.g., a datacenter) must be available in order to deploy PACS. Estimates of spacerequirements should be included, and any needs that are not easily accom-modated should be identified. Anticipated deficiencies in the reading areasshould be described, and anticipated construction costs and workstation furniture should be included.
The goals of the interviews with the RIS manager are to understandthe RIS-related workflow and any expected equipment upgrade paths. Work-flow with regard to entry of patient demographics, scheduling, order entry,and the systems utilized for each of these steps should be reviewed to deter-mine whether any changes will be required to support PACS workflow andfunctionality.
The ability of both the PACS vendor and the RIS vendor to providethe necessary integration or interfaces between systems should be evaluatedand any costs associated with this task should be determined. If there aremultiple (different) HIS-RIS deployed across the enterprise, then this shouldbe documented for the vendor in the request for proposal (RFP). It is impor-tant to specify the exact version of the RIS(s) when making this determina-tion. It is helpful to identify another site with a similar combination ofRIS-PACS and contact that site as a reference.
PACS MANAGEMENT
The strategic plan should include a discussion of the human resourcesrequired to successfully deploy and support the PACS. Consider the skill setsrequired and the duties that will be expected of each individual involved inthe project and in support for the project. Services that are expected to beoutsourced from the PACS or other vendor should be described and even-tually included in the RFP. Services that will be needed on an ongoing basis
PACS: A Guide to the Digi tal Revolut ion42
DRE03 11/16/2005 9:29 AM Page 42
(e.g., an on-site service representative) will need to be included in the systemmaintenance agreement negotiated with the PACS vendor.
A downtime contingency plan is crucial to a successful implementation.Although a detailed operational plan does not need to be developed until thesystem implementation is in progress, it is important to include an estimateof any capital investments that will be required to support the contingencyplan (e.g., backup CRs and laser printers).
FINANCIAL ANALYSIS
The financial analysis should include an ROI analysis. All quantifiable costsavings, cost avoidance, revenue opportunities, and revenue protection estimates should be included in the analysis. The cash flows should be basedon the implementation plan. For example, if CR is not expected to replaceconventional radiography until year 2, then any film savings from conven-tional radiography should not be included until year 2.
As discussed in the operational plan, cost savings may include filmsavings, film library, technologist productivity, and off-site storage, includ-ing transportation. Revenue opportunities are based on estimates of in-creased exam volume due to competitive marketing of improved servicerelated to PACS.
Capital expenses include the estimated costs of the PACS equipment,computed radiography, required networking upgrades, and services (e.g.,project management, implementation support, and training) required tosupport the implementation. Capital expense estimates should also includecost estimates for system upgrades, such as additional storage purchased asrequired.
Operating expenses include the annual cost of the system maintenanceagreement with the PACS vendor and the additional human resources (full-time equivalents) required to support the PACS.
The financial analysis should be projected for at least 5 or 6 years andcan be extended further as necessary to show an eventual payback.
A Web server, typically included in most PACS implementations forthe electronic distribution of images to clinicians, can also provide imagesto radiologists, providing remote night-call via home teleradiology. If this isa requirement, an assessment of the availability of cable modem or digitalsubscriber line service at the radiologists’ homes should be conducted todetermine the feasibility of this approach. In addition, a preliminary assess-ment of the infrastructure necessary to support secure access from outside
PACS STRATEGIC PLAN AND NEEDS ASSESSMENT 43
DRE03 11/16/2005 9:29 AM Page 43

the firewall to an imaging Web server via, for example, a virtual privatenetwork server, should be included.
CONCLUSION
In conclusion, an effective PACS strategic plan serves as a marketing tool tocommunicate the benefits of PACS to senior administration and all stake-holders and educates key decision makers regarding the scope of the issuesnecessary to make informed decisions. The plan must make a serious attemptto quantify expected benefits in a way that is convincing to the key decisionmakers in order to provide a basis for allocating the necessary funding. Theplan should also identify all costs associated with converting to a PACS,including training and PACS administration. Last, a formal strategic planestablishes the basis to move forward with a comprehensive RFP document,typically the next step in the PACS acquisition process.
PACS: A Guide to the Digi tal Revolut ion44
DRE03 11/16/2005 9:29 AM Page 44

CREATING THEPACS REQUEST FOR
PROPOSAL ANDSELECTING A
VENDOR
ALAN L. SCHWEITZER • GORDON SMITH
The selection of a PACS vendor that can meet the needs of the healthcareenterprise can be a complex and painstaking process. A well-
written request for proposal (RFP) is a key step in this process. Although itmay be tempting to short cut this process and simply request proposalsand/or quotations from the vendors in which you are interested, it is impor-tant to understand that a well-written RFP should satisfy the followingobjectives:
4CHAPTER
DRE04 11/16/2005 9:31 AM Page 45
1. The RFP should provide information about the site to enable thevendor to provide a solution that best matches the unique require-ments of the site. This should minimize the time required to com-municate requirements verbally to each vendor individually.
2. The RFP should establish a framework for contractual requirementsrelated to system function, implementation, training, and serviceand support.
3. The RFP should create a format for responses that facilitate vendorcomparisons. This provides a mechanism for “leveling the playingfield” among vendors.
All of these objectives should all be kept in mind as guidelines when draft-ing the RFP. In addition to these objectives, it is useful to consider a fewfurther guidelines.
1. The RFP should be written as a functional specification. Specifica-tions are written as a list of requirements (e.g., “The monitor shallbe blue.”) It is helpful to structure the RFP so that each require-ment is defined by a single statement in a uniquely numbered para-graph. Additional clarifying language may be used to help in theinterpretation of the requirement.
2. The RFP should not overprescribe or engineer the solution. It isimportant to distinguish between requirements and design. The keyis to clearly describe your operational requirements and allow thevendor to describe how his solution meets the requirement. If youhave no specific requirement regarding some aspect of the specifi-cation but rather have either a preference or a desire to simply knowthe specification (e.g., in order to compare it with other vendors’offerings), it is appropriate to request the vendor to define the spec-ification for the system being proposed.
3. Before writing the RFP, it is important to consider what yourprimary evaluation criteria and process for vendor selection will be (see “Vendor Evaluation and Selection Process” later in thischapter). The evaluation and selection process will be facilitated if you can structure your RFP around these criteria and includecontent in the RFP that will solicit responses that easily differenti-ate the vendors from each other.
4. It is helpful to include forms that encourage vendors to summarizeand condense their responses so that you can compare vendorresponses side by side. This format, however, may constrain the
PACS: A Guide to the Digi tal Revolut ion46
DRE04 11/16/2005 9:31 AM Page 46

responses to the extent that you may not get as much detail or expla-nation as you would like. It is best to provide formats for bothsummary and detailed responses.
RFP CONTENT
INTRODUCTION
The introduction should include general information about the healthcareenterprise (e.g., descriptions of each site, number of beds, medical special-ties, and any plans for expansion). General information can also include astatement of the enterprise business strategy and a description of the health-care market in the local area (e.g., population, competition, etc.). Thissection should also include information about the Radiology department(e.g., the imaging services offered at each site, total number of procedures),a list or table of imaging modalities at each site, and general informationabout the professional practice (e.g., number of radiologists in the practice,number of radiologists reading during peak hours, etc.).
This section is provided as information to the vendor and generallydoes not require a response.
STRATEGIC GOALS
You will want to include a section outlining the strategic goals you hope toachieve with PACS and how the realization of these goals will contribute tostrategic objectives of the enterprise as a whole. This section should com-municate the expectations the stake holders have of PACS and a sense of theprioritization of these goals. This section is provided as information to thevendor and generally does not require a response.
CLINICAL OPERATIONS OVERVIEW AND REQUIREMENTS
The vendor needs to understand the unique aspects of your clinical opera-tions and workflow and any general requirements or expectations that youhave of a PACS to support your workflow. This section focuses on thoseaspects of your clinical operations that you believe will either impact or be
CREATING THE PACS REQUEST FOR PROPOSAL AND SELECTING A VENDOR 47
DRE04 11/16/2005 9:31 AM Page 47
impacted by PACS. You will want to describe both your current workflowand how you envision the workflow in a PACS environment. You shouldinclude scenarios to describe both the pre- and post-PACS workflow andrequest that the vendor describe how his system will either optimize thisworkflow or be impacted by it.
This section is intended to both provide information to the vendor andto solicit general responses from the vendor that describe features that mightnot easily be described in a technical specification. In general this will breakthe rules of defining functional specifications in simple normative state-ments, but this section can give the vendor an opportunity to describe fea-tures of his product offering that you may not anticipate in the technicalspecification and that may, in fact, provide value in your environment.
SITE-SPECIFIC OPERATIONS
For multisite operations, characteristics of the workflow that are unique toeach site should be described. If each site has a unique HIS and/or RIS orindependent master patient index, this should be highlighted. Patient regis-tration, scheduling, and exam order entry should be described for each site.
IMAGING-MODALITY BASED OPERATIONS
For each imaging modality, the workflow description should include examscheduling, patient registration, exam order entry, patient identification,image acquisition, quality assurance, introduction of images to PACS, andany unique requirements (by modality) for diagnostic review and reporting.Workflow and processes that are unique to handling STAT exams should bedescribed. Any paper processes that are in place should be described with aneye towards replacing these processes with an electronic analog. Somemeasure of peak throughput and staffing should be provided as a part of thedescription. The workflow should be evaluated and described for each siteand area (e.g., outpatient vs. inpatient vs. ED).
Imaging modalities described should include the following:
◗ Diagnostic X-ray◗ Portable X-ray◗ Computed tomography (CT)
PACS: A Guide to the Digi tal Revolut ion48
DRE04 11/16/2005 9:31 AM Page 48

◗ Magnetic resonance imaging (MRI)◗ Ultrasound (US)◗ Nuclear medicine◗ Special procedures◗ Mammography (if included for PACS)
DIAGNOSTIC REVIEW
This section can include information that would detail your vision for work-station deployment. This would include how many radiologists could bereading simultaneously, from which locations, and the division of workwithin the department. Additional workstations to support physical proxim-ity of radiologists to imaging services they support should also be included.The section should also describe how exams would be reported, key imagepresentation functions to be used, and how the report transcription andapproval functions work.
CLINICAL REVIEW
Most of the requirement for clinical review is typically addressed by generalpurpose PC’s using a web browser to access images in the PACS. Cliniciansin areas such as ED and ICU that rely heavily on imaging services and rou-tinely make treatment decisions without the radiologists’ final interpretationmay want dual monitor workstations with high-brightness monitors to moreclosely approximate the diagnostic workstations used by the radiologists.This section should describe your expectations of the needs of the clinicians,specific medical specialties, locations, and expected deployment for clinicalreview workstations.
You may also wish to describe the physical locations of physicians’offices for your major referrers and how you expect to provide access to anyphysicians that require access to images remotely from the main facility.
EXTERNAL SYSTEMS
Describe any other systems that will need to have access to images from thePACS, such as radiotherapy, surgical planning, or another PACS.
CREATING THE PACS REQUEST FOR PROPOSAL AND SELECTING A VENDOR 49
DRE04 11/16/2005 9:31 AM Page 49
TELERADIOLOGY OPERATIONS
Describe how exams would be acquired and transmitted from remote sitesto the PACS or viewed remotely by a radiologist at home or a remote tele-radiology service. Describe how reports would be handled. Focus on needsand requirements, not on technology.
TECHNICAL REQUIREMENTS
SYSTEM ARCHITECTURE
The RFP should request the vendor to provide an overview of the systemarchitecture and provide specific information regarding the architecture thatwould help to differentiate vendors’ solutions.
Examples are:
◗ Platform (e.g., Unix, Linux, MS Windows)◗ Web-based vs. Hybrid (Client/Server diagnostic workstations + Web
distribution◗ All images online vs. online and nearline hierarchical storage◗ Redundancy features◗ Architecture for multiple sites
CORE SYSTEM
The core system of the PACS includes all hardware and software necessaryto support the acquisition of images, image storage/archive, database man-agement, image management and image retrieval. The RFP should describethese components in a general way, specify the requirements for each, andask the vendor to describe specifics regarding each of these.
IMAGE ACQUISITION The RFP should list all current and plannedimaging modalities, including vendor, model number, age, software revision level, and supported DICOM services classes for each. The RFP should require the vendor to assume responsibility for the success-
PACS: A Guide to the Digi tal Revolut ion50
DRE04 11/16/2005 9:31 AM Page 50
ful integration of all modalities. For modalities that cannot be made“DICOM ready,” with a software upgrade, the RFP should request thevendor to propose a solution to interface to the modality. The RFP shouldrequest that the vendor describe the architecture used for image acquisitionand to describe the upgrade path for adding additional modalities, forexample, if additional acquisition hardware is required. The vendor shouldbe asked to describe the mechanism by which validation of image data againstRIS data occurs for modalities that do not have DICOM modality worklistfunctionality. The vendor should also describe if the technologist is providedwith feedback when validation fails and the means to correct any exams thatfail validation.
ONLINE STORAGE Online storage, typically RAID storage, is theprimary storage component of the PACS and is used to store images that areavailable for fast retrieval of newly acquired studies. Current storage costshave made it economically feasible for many vendors to configure PACS sothat all images are available online, expanding storage as needed to accom-modate newly acquired images. The RFP should estimate projected storagerequirements over the life of the PACS or provide enough information forthe vendor to make this estimate. Online storage capacity is heavily depend-ent upon the ability of the vendor to store priors in lossy compressed format(while preserving the original uncompressed or lossless compressed imagein long-term storage) and the willingness of the site to utilize this techniqueto reduce storage costs. If this is a desirable strategy, the RFP should statethis as a requirement.
Many sites are beginning to consider an enterprise storage strategy for all their storage needs, purchasing storage directly from a storage vendor. This decision is frequently driven by PACS. If this is the directionto be taken, the RFP should specify that the PACS be compatible with the preferred storage vendor. If storage is to be purchased from the PACS vendor, the RFP should specify how much online storage is requiredinitially.
LONG-TERM ARCHIVE AND DISASTER RECOVERY Long-Term Archival(LTA) storage is required for legal archive, backup, and disaster recovery.The RFP should require that the vendor specify the total capacity of the storage device used. If the site has a preference for the technology to be used (e.g., DVD, tape, content-addressed storage), the RFP should
CREATING THE PACS REQUEST FOR PROPOSAL AND SELECTING A VENDOR 51
DRE04 11/16/2005 9:31 AM Page 51

specify this. You will want to include a requirement for the vendor to describe their disaster recovery plan including an estimated length of timeto restore the system to operation and the length of time required to restoreaccess to prior exams. In addition, the vendor should describe how offline(shelf ) storage is managed.
If the online storage will not be expanded to accommodate all priorexams and the LTA is to be used as a nearline storage device, the RFP shouldrequire that the system automatically retrieve images from the LTA ifunavailable in online storage in response to an ad-hoc query or selectionfrom a worklist. In addition, pre-fetch of relevant priors should be supportedand require the vendor to include a description of the algorithm used to pre-fetch prior exams.
The RFP should request that the vendor describe available image compression used in conjunction with the LTA and if compression is arequirement, the RFP should state this.
DATABASE MANAGER The database manager in PACS systems is uti-lized to store the patient and exam data, maintain pointers to the image datato permit efficient retrieval, track exam statuses (e.g., acquired, validated, anddictated), store user account information, and maintain system information(e.g., DICOM parameters for each modality). It effectively serves as the“memory” of the system with the Image Manager serving as the “intelli-gence” of the system.
PACS vendors typically imbed a commercial off-the-shelf databasemanagement product to implement the PACS database (e.g., Oracle,MS/SQL, Sybase) and if it is important to you to know which one, and/oryou have a preference, the RFP should state this.
The database manager is a single point of failure in a PACS and if youwant optimal reliability, you will want the vendor to specify redundant data-base servers with automatic failover. The RFP should request the vendor todescribe included or optional redundancy features.
A unique feature of a PACS database is that it grows indefinitely asexams are acquired. System performance may be adequate at the time ofinstallation, but as the database grows, if the database manager hardware andsoftware is not specified and configured to support the potential growth inthe database size, system performance can degrade over time. The RFPshould require that the database manager maintain system performance forat least five years of operation.
The vendor should provide the hardware and software necessary toautomatically backup the database to removable media with no human inter-
PACS: A Guide to the Digi tal Revolut ion52
DRE04 11/16/2005 9:31 AM Page 52
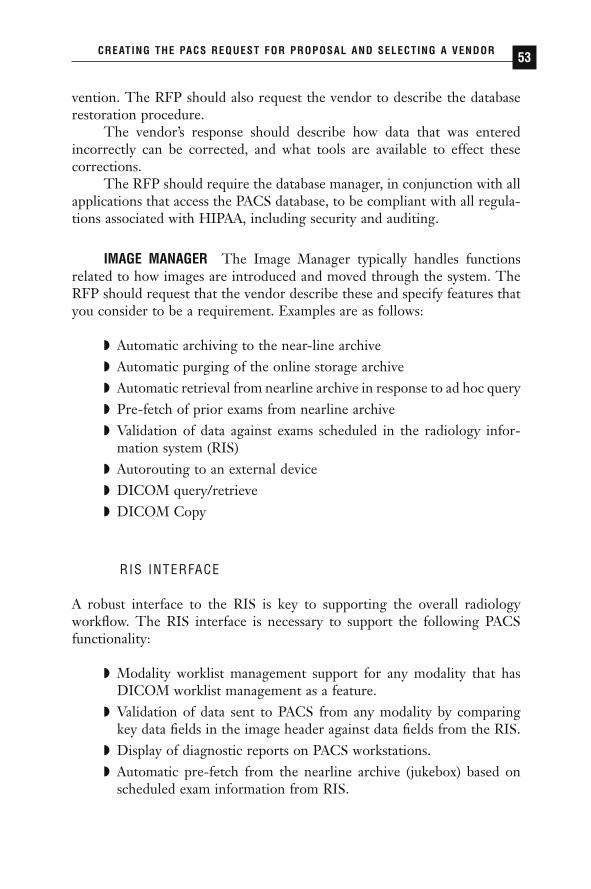
vention. The RFP should also request the vendor to describe the databaserestoration procedure.
The vendor’s response should describe how data that was enteredincorrectly can be corrected, and what tools are available to effect these corrections.
The RFP should require the database manager, in conjunction with allapplications that access the PACS database, to be compliant with all regula-tions associated with HIPAA, including security and auditing.
IMAGE MANAGER The Image Manager typically handles functionsrelated to how images are introduced and moved through the system. TheRFP should request that the vendor describe these and specify features thatyou consider to be a requirement. Examples are as follows:
◗ Automatic archiving to the near-line archive◗ Automatic purging of the online storage archive◗ Automatic retrieval from nearline archive in response to ad hoc query◗ Pre-fetch of prior exams from nearline archive◗ Validation of data against exams scheduled in the radiology infor-
mation system (RIS)◗ Autorouting to an external device◗ DICOM query/retrieve◗ DICOM Copy
RIS INTERFACE
A robust interface to the RIS is key to supporting the overall radiology workflow. The RIS interface is necessary to support the following PACSfunctionality:
◗ Modality worklist management support for any modality that hasDICOM worklist management as a feature.
◗ Validation of data sent to PACS from any modality by comparing key data fields in the image header against data fields from the RIS.
◗ Display of diagnostic reports on PACS workstations.◗ Automatic pre-fetch from the nearline archive (jukebox) based on
scheduled exam information from RIS.
CREATING THE PACS REQUEST FOR PROPOSAL AND SELECTING A VENDOR 53
DRE04 11/16/2005 9:31 AM Page 53

The RFP should specify the site’s RIS, including the software revision level.If scheduling is done in a different system, and support for pre-fetch isrequired, the scheduling system should also be specified. The RFP shouldrequire that an interface to the site’s RIS be included in the proposal andrequest a complete description. In addition, the RFP should specify that thefunctions listed above be supported.
You will want to specify if you want film-based exams and their asso-ciated reports to be available in the PACS. Exams completed prior to thePACS implementation may require a historical data upload. You shouldspecify both requirements in the RFP.
DIAGNOSTIC REVIEW WORKSTATION
The diagnostic review workstation is by the radiologist for primary inter-pretation and is one of the most important components of the PACS system.Its functionality will significantly impact the radiologists’ productivity and itis therefore important to carefully specify the requirements for this com-ponent. A suggested organization for specifying these requirements is asfollows:
◗ General System Requirements◗ Monitors◗ User Interface and Profiles◗ Worklists and Queries◗ Diagnostic Report Display◗ Examination Display and Arrangement◗ Image Display and Paging◗ Grayscale Operations◗ Image Orientation, Zoom, Pan, and Magnifying Glass◗ Region of Interest, Distance and Angle Measurement◗ Image Annotation◗ Image Identification◗ 3D Processing◗ Hard Copy Printing◗ Speech Recognition◗ Scanned Documents
PACS: A Guide to the Digi tal Revolut ion54
DRE04 11/16/2005 9:31 AM Page 54
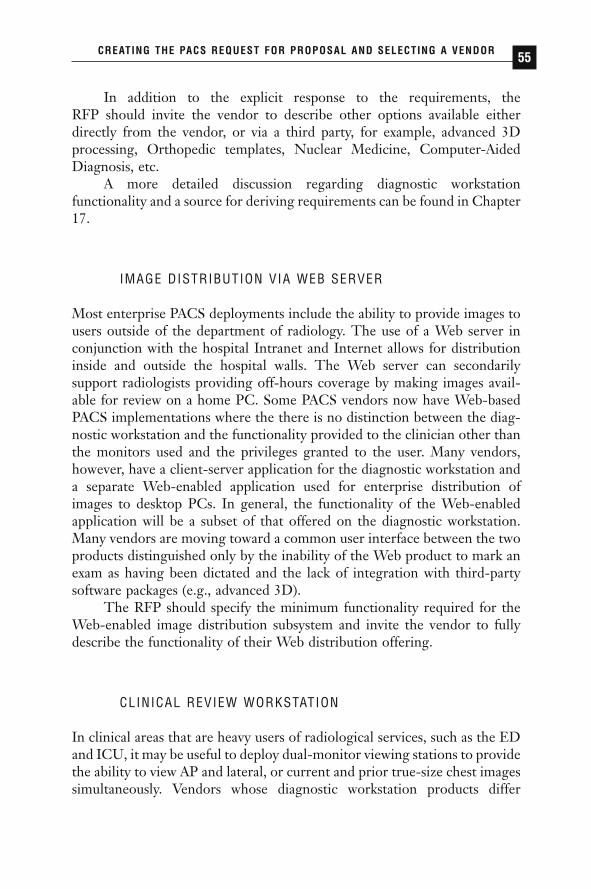
In addition to the explicit response to the requirements, the RFP should invite the vendor to describe other options available eitherdirectly from the vendor, or via a third party, for example, advanced 3D processing, Orthopedic templates, Nuclear Medicine, Computer-AidedDiagnosis, etc.
A more detailed discussion regarding diagnostic workstation functionality and a source for deriving requirements can be found in Chapter17.
IMAGE DISTRIBUTION VIA WEB SERVER
Most enterprise PACS deployments include the ability to provide images tousers outside of the department of radiology. The use of a Web server inconjunction with the hospital Intranet and Internet allows for distributioninside and outside the hospital walls. The Web server can secondarilysupport radiologists providing off-hours coverage by making images avail-able for review on a home PC. Some PACS vendors now have Web-basedPACS implementations where the there is no distinction between the diag-nostic workstation and the functionality provided to the clinician other thanthe monitors used and the privileges granted to the user. Many vendors,however, have a client-server application for the diagnostic workstation anda separate Web-enabled application used for enterprise distribution ofimages to desktop PCs. In general, the functionality of the Web-enabledapplication will be a subset of that offered on the diagnostic workstation.Many vendors are moving toward a common user interface between the twoproducts distinguished only by the inability of the Web product to mark anexam as having been dictated and the lack of integration with third-partysoftware packages (e.g., advanced 3D).
The RFP should specify the minimum functionality required for theWeb-enabled image distribution subsystem and invite the vendor to fullydescribe the functionality of their Web distribution offering.
CLINICAL REVIEW WORKSTATION
In clinical areas that are heavy users of radiological services, such as the EDand ICU, it may be useful to deploy dual-monitor viewing stations to providethe ability to view AP and lateral, or current and prior true-size chest imagessimultaneously. Vendors whose diagnostic workstation products differ
CREATING THE PACS REQUEST FOR PROPOSAL AND SELECTING A VENDOR 55
DRE04 11/16/2005 9:31 AM Page 55

significantly from their Web-distribution products will sometimes offer an“intermediate” clinical review workstation product that more closely resem-bles their diagnostic workstation for clinicians whom feel they need func-tionality equivalent to that of the radiologist. The decision regarding whichsoftware product to deploy in these areas should be made after selecting thevendor based upon the suitability of the Web-distribution product to eacharea’s needs. If any of the vendors you are soliciting have products that areintended for this application, you will want to include a specification of thefunctionality required for these clinical areas. The RFP can invite the vendorto simply respond with how their clinical workstation offering differs fromthe diagnostic workstation.
TECHNOLOGIST Q/A WORKSTATION
Depending on your intended workflow, it may be helpful for technologiststo confirm the successful transmission of studies to the PACS, to have theability to “fix” study information that does not correlate with correspondingRIS data, view historical exams on PACS, and to print images from PACS in response to requests from referring physicians. Ad hoc printing isa capability you may also wish to provide to the film library. Some vendorsprovide these capabilities via a web client which can be accessed from any PC, however many vendors require at a minimum a software license foreach workstation or PC that has this software installed. You will want to specify the minimum functionality required by the technologists and film library.
NETWORK
The RFP should include a description of each site’s networking infras-tructure, including both the local area network (LAN) and the wide areanetwork interconnecting the sites that will have PACS deployed or will beutilized for enterprise distribution. The description should include thevendor(s) and models used for the core routers and switches, bandwidth, andservices that provide the wide area network connections. The PACS vendorshould be asked to respond regarding the suitability of the existing net-working infrastructure and to propose any upgrades they believe necessaryto achieve acceptable performance. In addition, the RFP should request thesolicited vendors to propose any additional storage cache hardware thatwould be needed to minimize traffic on the wide area network connections.
PACS: A Guide to the Digi tal Revolut ion56
DRE04 11/16/2005 9:31 AM Page 56

SYSTEM THROUGHPUT AND PERFORMANCE
System performance in PACS is of importance primarily to the radiologistusing the display workstation. This section should define performancerequirements for the PACS that the vendor will commit to. Performancerequirements should be defined based on a reference set of images which would define a typical study for CR, CT, and MRI. Ultrasound and Nuclear Medicine studies are typically less demanding so these do not need to be included. Performance benchmarks defined can be as follows:
◗ Image load time from selection from the worklist to appearance ofthe first image
◗ Time to display the complete study◗ Time to display the results of a database query (note that this is for
display of a list of studies; not the images in a study)◗ Time to display images retrieved from nearline archive (if this is
applicable)◗ Time to send a complete study from the modality and display on a
workstation
Most vendors will hedge their response based on their inability to controlnetwork traffic, so it is appropriate to include language that requires that thedefined benchmarks be met presuming that non-imaging networking trafficis negligible.
IMPLEMENTATION PLAN
It is important that the vendor understands your environment and has an overview of your vision for the rollout of the system. Some departmentswill want the “big-bang” approach where the entire system is installed in the department and the transition covers every area of the department at once.The disadvantage to this method is the disruption to the department and thedemands that are placed upon the deployment staff to ensure the process issuccessful. In addition, this approach may place demands on the financialresources of an institution that cannot be met. An alternative to the “big bang” is a phased implementation with each phase focusing on a spe-cific objective. This type of conversion has less of an impact on operations andallows the staff to be trained sequentially as each phase is rolled out.
CREATING THE PACS REQUEST FOR PROPOSAL AND SELECTING A VENDOR 57
DRE04 11/16/2005 9:31 AM Page 57

Typically the first phase focuses on project planning, communication,and implementation of the infrastructure, including networking, PACS corecomponents, HIS/RIS interface, modality upgrades and DICOM integra-tion, and EMR interface.
The following phases focus on implementation within the radiologydepartment. This can proceed either by modality or by site, with digitalmodalities (CT, MRI, US, NucMed) being implemented first, followed bygeneral radiography (plain film x-ray) and mammography. For most sites,implementation of general radiography requires conversion to computedradiography or digital radiography, and implementation of mammographyrequires conversion to digital mammography, both of which represent a majorinvestment. Postponing implementation of these modalities until later phasescan ease both the cash flow and the demand on human resources.
It is typically recommended that electronic distribution of imagesthroughout the enterprise be planned as the final phase of the PACS imple-mentation. This gives radiology the opportunity to fully absorb the tech-nology, refine processes and procedures, and adjust workflow to optimize theuse of the new technology before having to address the change managementrequired to convert the whole enterprise to utilization of soft-copy distribu-tion of images.
The RFP should present a high-level implementation plan to thevendor to provide an understanding of the resources you will expect fromthe vendor for a successful deployment. The vendor should be required topresent a proposed implementation plan that meets your expectations andincludes the following elements:
◗ Vendor support to be provided, including specific personnel.◗ Qualifications of staff assigned to the implementation◗ Equipment to be installed during each phase.◗ Amount of time the vendor expects to spend on-site.◗ Staff support required by the department◗ Proposed implementation timeline◗ Costs associated with each implementation phase.
TRAINING
A robust training program is an absolute necessity for a successful PACSimplementation. This section of the RFP should define your trainingrequirements and give the vendor enough information to realistically esti-
PACS: A Guide to the Digi tal Revolut ion58
DRE04 11/16/2005 9:31 AM Page 58

mate the resources that will be required. Training should include the PACSAdministrator, radiologists, technologists, clerical staff (including film libra-rians), and clinicians. The RFP should estimate the number of personnel ineach discipline that will need to be trained.
The RFP should solicit the vendor to describe their training me-thodology for each user category and outline the number of hours of train-ing to be provided. The vendor should be asked to specify if training is tobe provided in a classroom or one-on-one setting and which trainingmodules include hands-on training. The vendor should be required tospecify if they intend to provide end-user training or follow a train-the-trainer strategy.
Required reference materials, such as manuals, online help, computer-based training, reference cards, etc. should be specified by the vendor in thissection. The vendor should be asked to specify if their training includes acompetency-based evaluation to validate that trainees have effectivelyabsorbed the material covered.
SUPPORT AND MAINTENANCE
Vendor support and maintenance throughout the implementation and life ofthe PACS is a key component of the services that a PACS vendor mustprovide in order to maximize the benefits that PACS can provide. The RFPshould specify your expectations for the following services:
◗ Project planning and installation◗ System reliability, uptime and response time◗ Warranty◗ Maintenance and support
PROJECT PLANNING AND INSTALLATION
This section should solicit the vendor(s) to describe their implementationmethodology and explicitly state the site’s expectations regarding thevendor(s) responsibilities.
The following are some specific areas to cover in the RFP:
◗ Project management services◗ Installation of all vendor-supplied system components
CREATING THE PACS REQUEST FOR PROPOSAL AND SELECTING A VENDOR 59
DRE04 11/16/2005 9:31 AM Page 59

◗ Interfacing of imaging modalities◗ Interfacing to the existing laser printers◗ RIS interface validation◗ User training
SYSTEM RELIABILITY, UP TIME, AND RESPONSE TIME
This section of the RFP is most likely be the area of greatest contention inthe entire process. This is where the customer will be reducing the prof-itability of the sale by increasing the service levels that the vendor is beingheld against. This is where the customer needs to insist and only bend if thevendor offers another area of savings that is just as advantageous. Be carefulhere; what may seem as a good deal financially may be at the sacrifice ofprudent clinical services. To ensure these requirements force compliance,financial penalties should be assessed for each violation. It is imperative that the practice keep independent records of downtime in order to ensurecompliance.
This section of the RFP specifies your expectations regarding systemup-time and the vendor’s response time to resolve critical problems. For thenew initiate, it is important to note that only a few tenths of a percentage ofguaranteed uptime can work out to a significant amount of time. Forexample, if the customer agrees to 99.5% uptime, this means that the systemcan be off-line for only 4 hours a month whereas when the uptime guaran-tee is 99.95%, downtime is restricted to 20 minutes per month. In most prac-tices, a 4-hour outage per month would be unacceptable, particularly if itwas a single 4 hour outage that occurred during peak hours.
The industry standard is to distinguish between downtime that rendersthe entire system unusable and downtime affecting a single component suchas a workstation or single modality interface. You will want to require thatthe core system be held to 99.9% uptime at a minimum. The other aspectsof the PACS system relating to clinical viewing, web-distribution, and near-line storage can be held to a different service level agreement such as 99%uptime.
The vendor(s) responses will also typically distinguish between planned(e.g. software upgrades) and unplanned downtime, with planned downtimebeing exempt from the requirements. Distinctions may also be madebetween downtime experienced during “normal business hours” and “off-hours” where the impact to the operation may be somewhat less severe.
PACS: A Guide to the Digi tal Revolut ion60
DRE04 11/16/2005 9:31 AM Page 60

This section should also solicit the vendor(s) to commit to a maximumresponse time to reported problems. The RFP should distinguish betweenremote support and onsite support. The majority of problems with PACScan typically be handled remotely, but hardware problems require onsitesupport, and most vendors will not commit to less than 4 hours to dispatcha service technician for onsite support. It is important to keep in mind thegeographic location of the vendor’s support team closest to your institutionand the RFP should request that the vendor(s) indicate where their onsitesupport personnel will be dispatched from.
To ensure these requirements force compliance, the RFP should definethe financial penalties to be assessed for each violation, typically in the formof an extension of the warranty or service contract or a replacement optionfor hardware components that repeatedly cause downtime. It is imperativethat the site keep independent records of downtime in order to ensure compliance.
WARRANTY
Standard warranty coverage for PACS is typically one year, with somevendors offering only 90 day coverage on hardware: The RFP should definethe site’s expectations regarding the warranty. Examples of areas to cover are:
◗ When the warranty starts◗ Length of the warranty◗ Coverage (e.g., parts and labor)◗ Service response time during the warranty period◗ Software upgrades to be included during the warranty period◗ Penalty clauses for failure to meet the requirements of the RFP
MAINTENANCE AND SUPPORT
Maintenance and support should always be negotiated at the time of theinitial PACS purchase since this is when the customer has the most lever-age. The RFP, as a precursor to the contract should therefore define the site’sexpectations and attempt to get the vendor to commit to a service pricingfor coverage for the expected life of the system. The vendors quotationsshould include options to purchase on an annual basis or commit to a more
CREATING THE PACS REQUEST FOR PROPOSAL AND SELECTING A VENDOR 61
DRE04 11/16/2005 9:31 AM Page 61
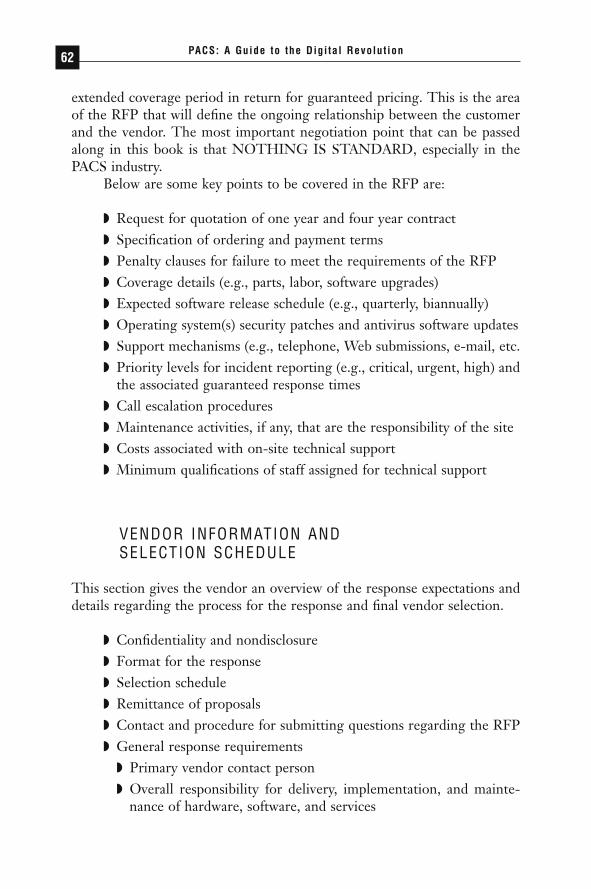
extended coverage period in return for guaranteed pricing. This is the areaof the RFP that will define the ongoing relationship between the customerand the vendor. The most important negotiation point that can be passedalong in this book is that NOTHING IS STANDARD, especially in thePACS industry.
Below are some key points to be covered in the RFP are:
◗ Request for quotation of one year and four year contract◗ Specification of ordering and payment terms◗ Penalty clauses for failure to meet the requirements of the RFP◗ Coverage details (e.g., parts, labor, software upgrades)◗ Expected software release schedule (e.g., quarterly, biannually)◗ Operating system(s) security patches and antivirus software updates◗ Support mechanisms (e.g., telephone, Web submissions, e-mail, etc.◗ Priority levels for incident reporting (e.g., critical, urgent, high) and
the associated guaranteed response times◗ Call escalation procedures◗ Maintenance activities, if any, that are the responsibility of the site◗ Costs associated with on-site technical support◗ Minimum qualifications of staff assigned for technical support
VENDOR INFORMATION AND SELECTION SCHEDULE
This section gives the vendor an overview of the response expectations anddetails regarding the process for the response and final vendor selection.
◗ Confidentiality and nondisclosure◗ Format for the response◗ Selection schedule◗ Remittance of proposals◗ Contact and procedure for submitting questions regarding the RFP◗ General response requirements
◗ Primary vendor contact person◗ Overall responsibility for delivery, implementation, and mainte-
nance of hardware, software, and services
PACS: A Guide to the Digi tal Revolut ion62
DRE04 11/16/2005 9:31 AM Page 62

◗ Conformance to federal, HIPAA, state, local, JCAHO, and American College of Radiology requirements.
◗ Delivery of works-in-progress◗ Evaluation criteria◗ Evaluation process◗ Disclaimers
APPENDICES
The appendices provide information to the vendor that may not be conve-niently presented in the body of the RFP or that is cross-referenced by mul-tiple sections of the RFP. Recommended examples are:
◗ List of modalities and their supported DICOM service classes◗ List of laser printers◗ Exam volume broken down by site and modality◗ Growth projections broken down by site and modality◗ Estimated storage requirements broken down by site and modality
RESPONSE FORMS
In order to facilitate the comparison of multiple vendors, it is helpful toprovide a response form that vendors are required to complete. The responseforms should force the vendor to respond in a tabular format with summa-rized responses that facilitate comparison of critical requirements, features,and vendor capabilities. In preparation for designing these forms, it is helpfulto map out the criteria you will use for evaluating the vendors. Once this hasbeen determined, the forms can be designed to assist with the differentia-tion of vendors around these criteria. Some suggested response forms are asfollows.
GENERAL DESCRIPTION OF THE VENDOR
Include year established, company ownership (e.g., private, public), parentcompany, number of personnel in R&D, Sales & Marketing, Service &Support, gross revenues and net income from PACS, R&D investment.
CREATING THE PACS REQUEST FOR PROPOSAL AND SELECTING A VENDOR 63
DRE04 11/16/2005 9:31 AM Page 63

CLIENT BASE
Include number of sites live, implementing, and contract signed for currentyear and two prior years. Also include number of sites which are more than70% filmless.
CLIENT REFERENCE
Include site profile (e.g., institution name, number of beds, exam volume,HIS/RIS) and contact information.
TECHNICAL REQUIREMENTS, TRAINING, AND SERVICE AND MAINTENANCE
These forms can be structured to mirror the corresponding sections of theRFP. The response forms should not necessarily replace a comprehensiveresponse to these sections of the RFP, which is used to insure compliance toa specification, but should rather be designed to highlight major differencesamong vendors.
ITEMIZED PRICING
This form is perhaps the most important of all, as it not only facilitates com-parison among vendors, but requires the responses to provide line-itempricing for each major system component. Forcing the vendor to expose thedetailed cost structure of the purchase gives the site added leverage in thenegotiation.
It is recommended that pricing for software and hardware be brokenout separately, and that line-item pricing for each major componentdescribed in the RFP (e.g., PACS core, Web server, modality interfaces,HIS/RIS interface, diagnostic workstations, clinical review workstations) berequired. The form should also include pricing for systems integration,implementation, training services, and extended maintenance services. Thisgives you the ability to compare pricing for a software-only purchase, for thegrand total including services, and for the total cost of ownership over thelife of the PACS. Line-item pricing also gives you the ability to estimate costsif you wish to adjust the purchase to either add or eliminate individual lineitems or, for example, to increase the number of workstations.
PACS: A Guide to the Digi tal Revolut ion64
DRE04 11/16/2005 9:31 AM Page 64

DISTRIBUTING THE RFP
The first temptation after all the hard work that went into the creation ofthe RFP is to send it out to every PACS vendor the site can think of. Remem-ber that for every RFP you send out you will receive a response ranging from100 to more than 500 pages. Reviewing these can be challenging.
Based upon the work that has gone into the RFP, the site should havea very good idea of its requirements. With some homework, you should be able to narrow down the number of possible vendors to a manageablenumber. You can further refine that list by requesting vendor presentationsat your site or by visiting any of the tradeshows featuring radiology vendors.Once a manageable list of vendors (4 to 6) is determined, the RFPs should be sent out with a firm due date giving the vendors 4 to 6 weeks torespond.
Vendors should be given a contact for clarification of any questions they may have regarding the RFP. If inconsistencies or ambiguities areuncovered during this process, it is best to provide clarification to all vendorsto insure a level playing field among all vendors, and that individual vendorsare not making erroneous assumptions based on their interpretation of theRFP.
VENDOR EVALUATION AND SELECTION PROCESS
REVIEW PROPOSALS
Once the proposals are received the process of reviewing each in detailbegins. The review should ensure that all the requirements outlined in theRFP have been responded to properly and that the answers to the questionsare relevant to the requests made of the vendor. This can be a tedious task,but it is one that is quite important to ensure that improper assumptions arenot carried forward into the evaluation process.
Selection of a PACS is typically done by a committee in order to ensurethat the views of all critical stakeholders are incorporated in the decisionprocess. Few members of the committee will have the time to review in detailthe entire response from all vendors, so it is helpful to summarize theresponses in a tabular format, laying out all vendors’ responses side-by-sidein a comparison table. This can be done by utilizing the responses to theforms included in the RFP. The summaries should then be distributed to themembers of the selection committee for their review.
CREATING THE PACS REQUEST FOR PROPOSAL AND SELECTING A VENDOR 65
DRE04 11/16/2005 9:31 AM Page 65
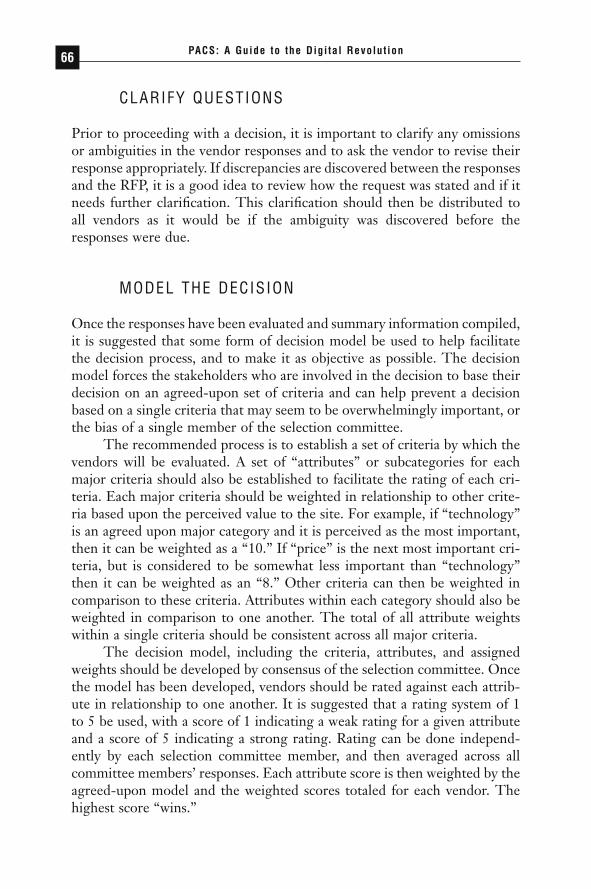
CLARIFY QUESTIONS
Prior to proceeding with a decision, it is important to clarify any omissionsor ambiguities in the vendor responses and to ask the vendor to revise theirresponse appropriately. If discrepancies are discovered between the responsesand the RFP, it is a good idea to review how the request was stated and if itneeds further clarification. This clarification should then be distributed toall vendors as it would be if the ambiguity was discovered before theresponses were due.
MODEL THE DECISION
Once the responses have been evaluated and summary information compiled,it is suggested that some form of decision model be used to help facilitatethe decision process, and to make it as objective as possible. The decisionmodel forces the stakeholders who are involved in the decision to base theirdecision on an agreed-upon set of criteria and can help prevent a decisionbased on a single criteria that may seem to be overwhelmingly important, orthe bias of a single member of the selection committee.
The recommended process is to establish a set of criteria by which thevendors will be evaluated. A set of “attributes” or subcategories for eachmajor criteria should also be established to facilitate the rating of each cri-teria. Each major criteria should be weighted in relationship to other crite-ria based upon the perceived value to the site. For example, if “technology”is an agreed upon major category and it is perceived as the most important,then it can be weighted as a “10.” If “price” is the next most important cri-teria, but is considered to be somewhat less important than “technology”then it can be weighted as an “8.” Other criteria can then be weighted incomparison to these criteria. Attributes within each category should also beweighted in comparison to one another. The total of all attribute weightswithin a single criteria should be consistent across all major criteria.
The decision model, including the criteria, attributes, and assignedweights should be developed by consensus of the selection committee. Oncethe model has been developed, vendors should be rated against each attrib-ute in relationship to one another. It is suggested that a rating system of 1to 5 be used, with a score of 1 indicating a weak rating for a given attributeand a score of 5 indicating a strong rating. Rating can be done independ-ently by each selection committee member, and then averaged across allcommittee members’ responses. Each attribute score is then weighted by theagreed-upon model and the weighted scores totaled for each vendor. Thehighest score “wins.”
PACS: A Guide to the Digi tal Revolut ion66
DRE04 11/16/2005 9:31 AM Page 66

Scoring is typically based on the responses to the RFP, but committeemembers should also rely on their knowledge of vendors’ products and rep-utations gleaned from demonstrations at trade shows, onsite presentations,reference checks, experience of colleagues, prior experience with individualvendors, and so on.
An example of the decision model described is shown Table 4.1 below.It is helpful for the model to be created in a spreadsheet format, so thatweights and ratings can easily be changed.
During this process it can be very helpful to employ an independentfacilitator who is not invested in the outcome to guide the development ofthe decision model and facilitate a discussion of the scoring. If the facilita-tor is involved in the RFP review process as well, and is knowledgeable aboutthe vendors being considered, the process can potentially be streamlined byusing the facilitator to provide a “straw horse” scoring model that can thenbe adjusted by the consensus of the committee.
If, after the model is developed, the ratings established, and the totalscores tallied, the results are not consistent with the apparent leanings of thecommittee, it may be appropriate to re-evaluate the model, adding criteriaand adjusting the weights and ratings to be consistent with the apparent con-sensus of the committee. It is important to keep in mind that the purpose ofthe model is to facilitate objective discussion and reach consensus and notto single-mindedly drive the process. the reasons should be objectively eval-uated and the ratings or weights possibly changed.
NARROW TO TWO VENDORS
The objective of the decision model is to choose two semifinalists, either ofwhich is acceptable to the selection committee. Limiting the number ofsemifinalists will help make the planning of site visits and contract negotia-tion more manageable, but it is important to proceed to negotiation withmore than one vendor to insure that the vendors stay competitive, even ifthere is a clear preference.
CONDUCT SITE VISITS
This is probably one of the most important steps in the decision process.This is the opportunity for the physicians and staff to see the system in actionand ask detailed questions about the advertised functionality versus reality.The most important thing to remember in this step is not to allow the vendorto escort you during the entire visit. Many of the vendors arrange the visits;
CREATING THE PACS REQUEST FOR PROPOSAL AND SELECTING A VENDOR 67
DRE04 11/16/2005 9:31 AM Page 67

TABL
E 4.
1De
cisi
on M
odel
Vend
or 1
Vend
or 2
Vend
or 3
Vend
or 4
Vend
orRa
wW
eigh
ted
Raw
Wei
ghte
dRa
wW
eigh
ted
Raw
Wei
ghte
dCa
tego
ryW
eigh
tSc
ore
Scor
eSc
ore
Scor
eSc
ore
Scor
eSc
ore
Scor
e
TECH
NOLO
GY10
.00
2238
.00
2340
.00
2747
.00
1931
.00
Com
plia
nce
to S
peci
ficat
ion
0.10
20.
204
0.40
40.
404
0.40
Perc
eive
d W
orka
bilit
y0.
204
0.80
30.
605
1.00
40.
80Us
e of
Cur
rent
Tec
hnol
ogy
0.30
41.
205
1.50
51.
503
0.90
Flex
ibili
ty0.
204
0.80
40.
805
1.00
20.
40Ad
here
nce
to S
tand
ards
0.10
40.
405
0.50
40.
404
0.40
RIS/
PACS
Inte
grat
ion
0.10
40.
402
0.20
40.
402
0.20
PRIC
E10
.00
1539
.00
1331
.00
1948
.00
821
.00
Softw
are
0.20
40.
803
0.60
40.
803
0.60
Hard
war
e0.
105
0.50
40.
405
0.50
20.
20Se
rvic
es0.
102
0.20
30.
305
0.50
10.
10PA
CS G
rand
Tot
al0.
604
2.40
31.
805
3.00
21.
20VE
NDOR
VIA
BILI
TY10
.00
1836
.00
1224
.00
2244
.00
2142
.00
Vend
or O
vera
ll Ex
perie
nce
0.20
30.
602
0.40
40.
805
1.00
Vend
or/P
rodu
ct S
tabi
lity
0.20
40.
801
0.20
51.
004
0.80
Site
Sop
hist
icat
ion
0.20
40.
804
0.80
51.
004
0.80
PACS: A Guide to the Digi tal Revolut ion68
DRE04 11/16/2005 9:31 AM Page 68

CREATING THE PACS REQUEST FOR PROPOSAL AND SELECTING A VENDOR 69
PACS
Impl
emen
tatio
n Ex
perie
nce
0.20
20.
402
0.40
40.
805
1.00
Perc
eive
d Re
spon
sive
ness
0.20
51.
003
0.60
40.
803
0.60
TRAI
NING
2.00
64.
0013
8.67
138.
6713
8.67
Over
all P
hilo
soph
y0.
333
1.00
31.
005
1.67
31.
00M
anua
ls0.
332
0.67
51.
675
1.67
51.
67Tr
aini
ng C
lass
es0.
331
0.33
51.
673
1.00
51.
67SU
PPOR
T4.
0010
13.3
311
14.6
711
14.6
714
18.6
7Su
ppor
t Stra
tegy
0.33
31.
003
1.00
31.
004
1.33
Serv
ice
Resp
onsi
vene
ss0.
334
1.33
51.
674
1.33
51.
67Up
time
Guar
ante
e0.
333
1.00
31.
004
1.33
51.
67CL
IENT
REL
ATIO
NSHI
P2.
008
5.33
85.
3310
6.67
74.
67Ex
istin
g re
latio
nshi
p0.
333
1.00
10.
332
0.67
20.
67Co
ntac
t dur
ing
RFP
proc
ess
0.33
31.
002
0.67
41.
332
0.67
RFP
Qual
ity0.
332
0.67
51.
674
1.33
31.
00Su
mm
ary
136
124
169
126
DRE04 11/16/2005 9:31 AM Page 69

however it is very important that they not interfere with the candid responsesfrom the site you are looking for. The site visits should not be limited to justthe physicians; support and I.T. staff should also be part of the visit to eval-uate the operational and technical issues.
Try to schedule the site visits as close to each other as possible. It is sa good idea to perform a review session with the visit team after each visitand to compare your experiences against the responses and results of the RFP measurements. You are making a decision that represents a majorinvestment and will be very difficult to change once the system is deployed.This does not mean that the process should get bogged down into analysisparalysis. Once two vendors have been selected, it is time to move to thenext step.
NEGOTIATE THE CONTRACT
The RFP process can be long, difficult, and sometimes very frustrating. Thefinal decision for two vendors has been made, and it is time to “put the twovendors in a room and let them fight it out.” This is where two vendors areplayed off against each in order to get the best value. Remember that valueincludes not only price but system options, hardware, software licensing,service contracts, committed functionality, all of which should be includedin the negotiation.
The basics of negotiation skills are to understand that any negotiationbreaks down into three principal focus areas (known as the dimensions ofnegotiation); tactics, deal design and setup. Tactics are based upon peopleand processes. Deal design is based upon value and substance, and setup isthe scope and sequence of the deal.
Barriers to successful tactics are interpersonal issues, poor communi-cation and “hard ball” attitudes. A barrier to deal design is the lack of feasi-ble or desirable arguments. The barrier to setup is that the parties do notsupport a viable process or valuable agreement.
The approach that can help resolve tactical issues is to act “at the table”to improve interpersonal processes and tactics. Deal design issues are bestresolved by redesigning a deal that unlocks value. For a successful setup, achange in focus needs to be made away from the table to create a more favor-able scope and sequence for the approach.
How does this information relate to negotiating a PACS deal? Beingable to identify an area of weakness in the focus areas described above willhelp provide a very general way of measuring how you should initiate andchange course as you head through the negotiation process.
PACS: A Guide to the Digi tal Revolut ion70
DRE04 11/16/2005 9:31 AM Page 70
In addition to the theory presented, the best practical advice availableis to come to the table prepared. Make sure when you begin the negotiationsession you have a clear set of objectives for that session. Realize that youmay not make it past the first objective in that meeting and that you do nothave to solve everything before leaving the table. It is important to under-stand that the person speaking is usually on the defensive and is trying toconvince the other party.
A “hard ball” attitude is very likely to fail because a negotiation is aprocess of coming to a mutually beneficial arrangement. It is not realistic toexpect a PACS vendor to enter into a business relationship where they willnot make a profit. Keep this in mind when the deal looks like it may be goingsouth. If the deal design is breaking down a re-thinking of the deal may beneeded. This can be especially true as you continue to play the competingvendors against each other.
In the long run, the goal is to get the deal you can feel comfortablewith. If you are not comfortable, then there is doubt about the value of the deal. It needs to reevaluated or even renegotiated until the doubt is eliminated.
CONCLUSION
The process of creating an RFP and selecting a vendor requires attention todetail, patience, and the willingness to look deep within your own institu-tion to realistically determine your requirements and expected benefits. Yourunderstanding your institution’s objectives, expected benefits, and your oper-ation is used to develop a vision of the future. This must be translated intoa set of requirements that describes the operations of the department anddefines the technical, implementation, training, and support needs in orderto best achieve a solid Request for Proposal that best reflects the needs oforganization and obligates the vendor to meet those needs.
To put it simply, when creating an RFP the end result is proportionalto the effort put into it. The RFP and the decision process that follows setthe stage for a favorable contract negotiation and a successful implementa-tion and should be undertaken with care.
REFERENCE
1. Lax DA, Sebenus JK. 3-D negotiation. Harvard Bus Rev. 2003;81(11):65–74
CREATING THE PACS REQUEST FOR PROPOSAL AND SELECTING A VENDOR 71
DRE04 11/16/2005 9:31 AM Page 71
REENGINEERINGWORKFLOW:A FOCUS ON
PERSONNEL ANDPROCESS
BRUCE I. REINER • ELIOT L. SIEGEL
Diagnostic radiology departments and practices share a dual mission. Oneis to provide the highest quality of care possible for patients, a goal
that involves a well-informed selection of imaging techniques, skilled interpretation, timely and clear communication of findings to clinicians andreferring physicians, and the most efficient and effective use of available per-sonnel. The second is to maximize income (or at least to minimize loss).
5CHAPTER
DRE05 11/16/2005 9:33 AM Page 73

Although some healthcare providers may balk at the comparison, these goalsare not dissimilar from those that govern industrial assembly lines, whereefficiency and productivity are demanded along with high levels of qualityand consistency and where innovation and economies of scale drive cost decisions.
In the last decade, the increased penetration of managed care, growingcompetition among diagnostic imaging providers, and an assortment of economic factors have caused unpredictable fluctuations and, in many cases,decreases in reimbursement rates for imaging services. For most imagingpractices and departments, this resulted in the need to decrease operatingexpenses across the board at the same time that the volume of studies to beread increased. The assumption was that these reductions could be madewithout compromising the quality of services rendered.
The initial reaction to these financial constraints at many sites was tosuggest that radiologists and other imaging personnel could work “harder,faster, and longer” while trimming excess fat from expenses—a strategy thatultimately proved self-defeating as these enforced economies quickly reachedtheir limits and took an inexorable toll on staff morale. Moreover, theseeconomies have been put in place during a time of rapid and revolutionarychange, with the implementation of filmless imaging, integration of picturearchiving and communication systems (PACS) with other radiology and hos-pital information systems (RIS and HIS, respectively), and the advent of newand increasingly complex and sophisticated image sets. This changing envi-ronment has also been affected by a shortage of trained radiologic technol-ogists (RTs) and by increased demands for accountability and monitoring ofmedical error. It is clear to some observers that the most promising way torealize further reductions in costs and maximize efficiency without compro-mising patient care is to adapt methodologies from industrial engineering tostudy, modify, and, if necessary, completely redesign the workflow process inthe imaging department.
Workflow engineering is a highly regarded and well-developed fieldwithin the industrial and manufacturing communities. Simply put, it involvesthe analysis and breakdown of individual steps that occur in the performanceof a multistep task, such as the assembly of an automobile or the acquisitionand interpretation of a radiograph. Although the engineering literature con-tains thousands of references to workflow analysis, which has been adoptedwidely in other disciplines, radiology has not embraced the concept. Lessonslearned from industry may govern the supply chain in a clinic, the pharmacyordering and distribution system in a hospital, or the timing and flow of cafeteria service in a medical center, but they are rarely applied in theimaging suite.
PACS: A Guide to the Digi tal Revolut ion74
DRE05 11/16/2005 9:33 AM Page 74

Unlike most industrial assembly lines, radiology departments are notoriously inefficient. An inordinate number of personnel steps are typi-cally required from the time a patient is registered until an imaging reportis made available to the referring clinicians. These functions are performedby a variety of clerical, technical, and professional personnel in a process thatoften evolves over a period of years into a confusing and disorganized routinedictated more by tradition than by logic. Even after the introduction of film-less radiology and PACS, many of these inherited routines remain fixed butvestigial parts of departmental workflow. The challenge is to step back andlook at the big picture of workflow as it relates to well-established prioritiesfor any imaging center, including quality of service, timeliness of service,quality of product, and economic efficiency.
In a truly industrialized approach, the optimal workflow strategy toattain high levels for these priorities might be to create the equivalent of aradiology assembly line, in which each staff member concentrated on oneand only one task. The technologist, for example, would perform only tasksdirectly related to image acquisition. Additional tasks, such as patient escort,room preparation, exam scheduling, accessing data, and retrieval of histori-cal exams, might be allocated to radiology aides—with individual aides specializing in specific tasks.
This brave new world of radiology is not yet within the bounds of feasibility. This is perhaps fortunate, because the essential element left outof a truly industrialized view of radiology workflow is, in fact, the mostimportant: the patient. In the industrial analogy, the patient becomes theproduct. In too many imaging settings, the implicit goal has already becometo reduce the patient to a conglomerate of pixels as quickly as possible. Theprocess of optimizing workflow must keep a focus on the patient and his orher needs as well as the essential part that satisfaction and well-being playin maintaining efficient and predictable workflow.
In a digital imaging environment, the greatest changes in workflowoptimization involve three simple tasks: automation, integration, and sim-plification. Automation, experienced by every imaging department in manyand ongoing forms, is the replacement of manual tasks by computer-generated tasks. An example would be that of modality worklist software,which automates the process of linking patient demographic informationbetween the HIS and RIS and effectively eliminates manual data entry bythe technologists. Integration is the linking of disparate computer systems,eliminating the time-consuming steps of accessing and transferring datafrom one computer system to another. Finally, simplification is the ability toconvert complex, time-consuming tasks into more straightforward ones. Anexample of simplification would be the development of radiologist-specific
A FOCUS ON PERSONNEL AND PROCESS 75
DRE05 11/16/2005 9:33 AM Page 75

hanging protocols that are customized to the needs of the radiologist andeliminate the time-intensive and frustrating tasks of manually retrievingcomparison studies in the interpretation process.
In this chapter, we look at the changes in workflow that have accom-panied the switch from film to PACS at many institutions and at ways of ana-lyzing imaging workflow to improve operational efficiency and productivity.We address the personnel and processes involved in the steps that precedethe interpretation process, including exam scheduling, patient arrival, imageacquisition, processing, and transfer/storage. Chapter 6 focuses on radiolo-gist workflow as it pertains to the processes of image display, interpretation,and reporting.
ANALYZING WORKFLOW FROM THE PERSONNEL PERSPECTIVE
In the 1980s, several investigators attempted to estimate the average timerequired to perform various radiological examinations. The reported procedure times and their constituent components varied widely (by 300%or more for the same exam) because of institutional idiosyncrasies, differ-ences in equipment, and even differing definitions of when an examinationactually began and ended. The introduction of PACS provided opportuni-ties to reassess workflow within a number of institutions worldwide that sub-sequently reported on the effects of the film-to-filmless transition on time,cost, and quality of product.
The most widely used approach to analyze, model, and reengineerworkflow in the medical setting has been task analysis, where the perform-ance of duties of each employee is described, timed, and integrated into aworkflow diagram. Such studies can involve time-motion investigations, such as one conducted at the Baltimore Veterans Affairs Medical Center(BVAMC), before the introduction of PACS. Management consulting firmBooz Allen Hamilton enumerated more than 50 steps in the process frominitiation of a clinician order for a radiology study until the transcribed radi-ology report was available in the patient’s chart for review. As more depart-ments have gone filmless, the number of consultants who provide similartask-specific analyses has increased. Many radiologists and administratorswere amazed to see how inefficient their departmental and intra-institutionalpractices had become over time. However, after a careful redesign of theworkflow process and the installation of a well-integrated PACS and RIS,the lessons learned from the reengineering have, in many cases, been lost. It
PACS: A Guide to the Digi tal Revolut ion76
DRE05 11/16/2005 9:33 AM Page 76
is useful to look once again at the effects on personnel and task-specific work-flow in the transition from film to PACS to pinpoint those areas in whichadditional economies of time and labor might be realized and incorporatedinto additional reengineering for high-quality, patient-centered care.
CLERICAL PERSONNEL
BEFORE PACS
The time-motion study developed for the BVAMC’s imaging departmentbefore the introduction of PACS demonstrated that a large percentage of the steps in the workflow process were clerical in nature. Among these werea number of steps in the completion, submission, and handling of an orderor requisition for the examination, as well as in the processing of that requestin the radiology department and in communication between clerical staff andRTs. Clerical functions also included the many steps involving film handlingand movement throughout the medical center. One particularly labor-intensive task was the daily requirement to retrieve more than 500 filmjackets for patients who were to be seen in the various outpatient depart-ments and then to attempt to retrieve each of these studies so that they couldbe returned and refiled in the film library. Film library staff was also respon-sible for finding old patient film jackets and matching these to new studies,so that old and new examinations could be transported together to readingrooms for interpretation by radiologists. After studies had been interpreted,the clerical staff was again involved in transporting films back to the libraryor to other areas of the medical center. They were also responsible for deliv-ery of report dictation audiotapes from the reading room to the report transcription area.
AFTER PACS
The transition to the use of an HIS-RIS and PACS at the BVAMC had aprofound effect on workflow in the clerical areas of the department. The useof the computer systems resulted in a dramatic reduction in the number ofsteps required and the amount of time required to perform the remainingsteps. The use of an integrated HIS-RIS reduces the process of submissionof a radiology request to a much faster and simplified process in which theclinician identifies the patient to be studied and the exam to be performedand enters the reason for the examination on a computer workstation using
A FOCUS ON PERSONNEL AND PROCESS 77
DRE05 11/16/2005 9:33 AM Page 77
a graphical user interface. Other patient information, such as age, sex, loca-tion within the hospital, requesting clinician, and primary care provider, areautomatically sent by the HIS to the radiology department and the PACS.This information is also available to RTs, who interact with the system toschedule the patient examination and (when appropriate) edit the request.
When ordering information is sent to the PACS, it creates an electronicimage “folder” entry in its database and initiates a request to the long-termimage storage device to retrieve previous examinations for comparison incases in which they are not already available in short-term storage. This pre-fetching of old studies from the long-term archive is thus initiated before the new study is performed, well in advance of interpretation by the radiologist or review by the clinicians. Depending on institutionalrequirements or preferences, this pre-fetching of comparison studies can beinitiated by other events, such as patient admission, patient transfer, or ascheduled appointment for an outpatient visit. Any patient images can berouted from long- to short-term storage or can be sent to a specific work-station or group of workstations according to predefined rules. This may berequired for applications such as at-home teleradiology, where bandwidth islimited.
The elimination of film and integration of the PACS with the HIS-RIShave obviated the need for a paper request for the ordering clinician. At thesame time, the labor- and time-intensive task of physically moving filmsaround the hospital has been eliminated. At our institution, only mammog-raphy uses film (but will doubtless go filmless here and in most institutionsin the near future). Although films still come from other institutions, thedramatic reduction in the number of films has reduced the need for film fileroom personnel.
If one of the goals of workflow analysis is to determine the most effi-cient use of personnel in the face of changing technologies, then one of theinevitable results is that some personnel roles will change and others will beeliminated. At the BVAMC, all but one of the film room librarians were elim-inated and the number of other clerical assistants reduced. It is worthwhileto note that new assignments were found for each of these employees withinthe hospital. Every department looking seriously at reengineering workflowshould plan for the possibility of such reassignments. If innovation becomesassociated with employee termination and new technology with career obso-lescence, then change will be met with increasing resistance by staff through-out the medical enterprise.
At the BVAMC, as at other institutions, the switch to PACS broughtunexpected benefits to transcriptionists using a digital dictation system incombination with the HIS. Transcriptionists now work at home and connect
PACS: A Guide to the Digi tal Revolut ion78
DRE05 11/16/2005 9:33 AM Page 78
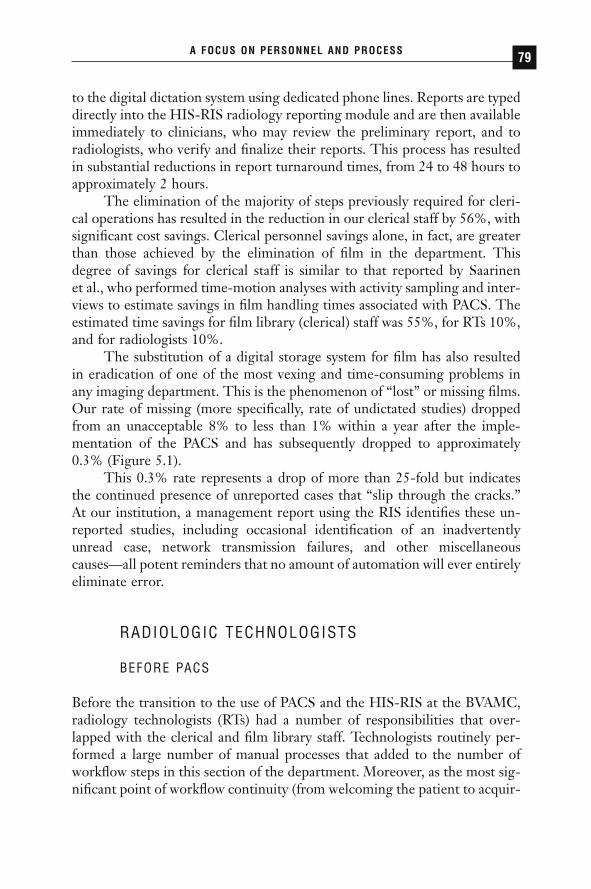
to the digital dictation system using dedicated phone lines. Reports are typeddirectly into the HIS-RIS radiology reporting module and are then availableimmediately to clinicians, who may review the preliminary report, and toradiologists, who verify and finalize their reports. This process has resultedin substantial reductions in report turnaround times, from 24 to 48 hours toapproximately 2 hours.
The elimination of the majority of steps previously required for cleri-cal operations has resulted in the reduction in our clerical staff by 56%, withsignificant cost savings. Clerical personnel savings alone, in fact, are greaterthan those achieved by the elimination of film in the department. Thisdegree of savings for clerical staff is similar to that reported by Saarinen et al., who performed time-motion analyses with activity sampling and inter-views to estimate savings in film handling times associated with PACS. Theestimated time savings for film library (clerical) staff was 55%, for RTs 10%,and for radiologists 10%.
The substitution of a digital storage system for film has also resultedin eradication of one of the most vexing and time-consuming problems inany imaging department. This is the phenomenon of “lost” or missing films.Our rate of missing (more specifically, rate of undictated studies) droppedfrom an unacceptable 8% to less than 1% within a year after the imple-mentation of the PACS and has subsequently dropped to approximately0.3% (Figure 5.1).
This 0.3% rate represents a drop of more than 25-fold but indicatesthe continued presence of unreported cases that “slip through the cracks.”At our institution, a management report using the RIS identifies these un-reported studies, including occasional identification of an inadvertentlyunread case, network transmission failures, and other miscellaneous causes—all potent reminders that no amount of automation will ever entirelyeliminate error.
RADIOLOGIC TECHNOLOGISTS
BEFORE PACS
Before the transition to the use of PACS and the HIS-RIS at the BVAMC,radiology technologists (RTs) had a number of responsibilities that over-lapped with the clerical and film library staff. Technologists routinely per-formed a large number of manual processes that added to the number ofworkflow steps in this section of the department. Moreover, as the most sig-nificant point of workflow continuity (from welcoming the patient to acquir-
A FOCUS ON PERSONNEL AND PROCESS 79
DRE05 11/16/2005 9:33 AM Page 79
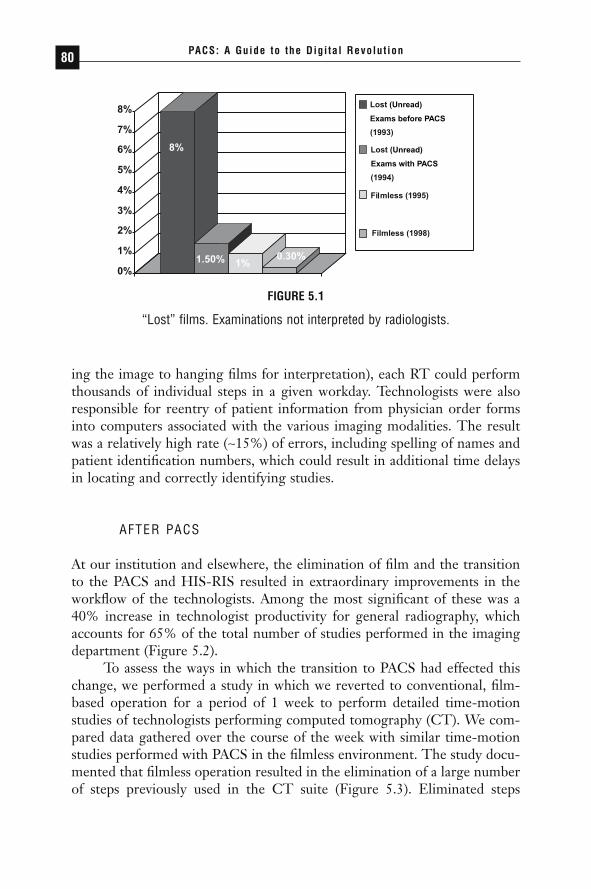
ing the image to hanging films for interpretation), each RT could performthousands of individual steps in a given workday. Technologists were alsoresponsible for reentry of patient information from physician order formsinto computers associated with the various imaging modalities. The resultwas a relatively high rate (~15%) of errors, including spelling of names andpatient identification numbers, which could result in additional time delaysin locating and correctly identifying studies.
AFTER PACS
At our institution and elsewhere, the elimination of film and the transitionto the PACS and HIS-RIS resulted in extraordinary improvements in theworkflow of the technologists. Among the most significant of these was a40% increase in technologist productivity for general radiography, whichaccounts for 65% of the total number of studies performed in the imagingdepartment (Figure 5.2).
To assess the ways in which the transition to PACS had effected thischange, we performed a study in which we reverted to conventional, film-based operation for a period of 1 week to perform detailed time-motionstudies of technologists performing computed tomography (CT). We com-pared data gathered over the course of the week with similar time-motionstudies performed with PACS in the filmless environment. The study docu-mented that filmless operation resulted in the elimination of a large numberof steps previously used in the CT suite (Figure 5.3). Eliminated steps
PACS: A Guide to the Digi tal Revolut ion80
(Unread)
(Unread)
Exams before PACS
Exams with PACS
FIGURE 5.1
“Lost” films. Examinations not interpreted by radiologists.
DRE05 11/16/2005 9:33 AM Page 80
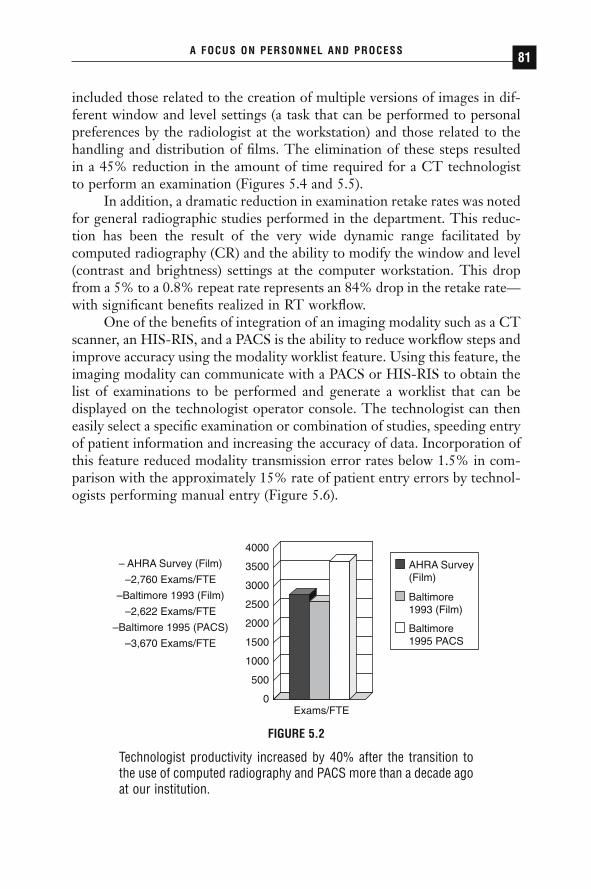
included those related to the creation of multiple versions of images in dif-ferent window and level settings (a task that can be performed to personalpreferences by the radiologist at the workstation) and those related to thehandling and distribution of films. The elimination of these steps resultedin a 45% reduction in the amount of time required for a CT technologistto perform an examination (Figures 5.4 and 5.5).
In addition, a dramatic reduction in examination retake rates was notedfor general radiographic studies performed in the department. This reduc-tion has been the result of the very wide dynamic range facilitated by computed radiography (CR) and the ability to modify the window and level(contrast and brightness) settings at the computer workstation. This dropfrom a 5% to a 0.8% repeat rate represents an 84% drop in the retake rate—with significant benefits realized in RT workflow.
One of the benefits of integration of an imaging modality such as a CTscanner, an HIS-RIS, and a PACS is the ability to reduce workflow steps andimprove accuracy using the modality worklist feature. Using this feature, theimaging modality can communicate with a PACS or HIS-RIS to obtain thelist of examinations to be performed and generate a worklist that can be displayed on the technologist operator console. The technologist can theneasily select a specific examination or combination of studies, speeding entryof patient information and increasing the accuracy of data. Incorporation ofthis feature reduced modality transmission error rates below 1.5% in com-parison with the approximately 15% rate of patient entry errors by technol-ogists performing manual entry (Figure 5.6).
A FOCUS ON PERSONNEL AND PROCESS 81
0
500
1000
1500
2000
2500
3000
3500
4000
AHRA Survey(Film)
Baltimore1993 (Film)
Baltimore1995 PACS
– AHRA Survey (Film)
–2,760 Exams/FTE
–Baltimore 1993 (Film)
–2,622 Exams/FTE
–Baltimore 1995 (PACS)
–3,670 Exams/FTE
Exams/FTE
FIGURE 5.2
Technologist productivity increased by 40% after the transition tothe use of computed radiography and PACS more than a decade agoat our institution.
DRE05 11/16/2005 9:33 AM Page 81
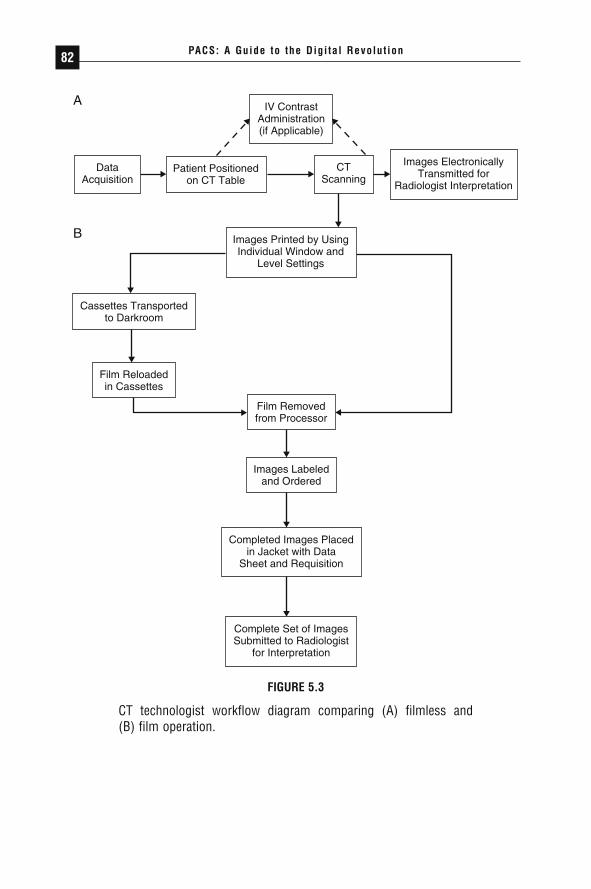
PACS: A Guide to the Digi tal Revolut ion82
IV ContrastAdministration(if Applicable)
Images Printed by UsingIndividual Window and
Level Settings
Cassettes Transportedto Darkroom
Film Reloadedin Cassettes
Film Removedfrom Processor
Images Labeledand Ordered
Completed Images Placedin Jacket with Data
Sheet and Requisition
Complete Set of ImagesSubmitted to Radiologist
for Interpretation
Patient Positionedon CT Table
DataAcquisition
CTScanning
Images ElectronicallyTransmitted for
Radiologist Interpretation
A
B
FIGURE 5.3
CT technologist workflow diagram comparing (A) filmless and (B) film operation.
DRE05 11/16/2005 9:33 AM Page 82
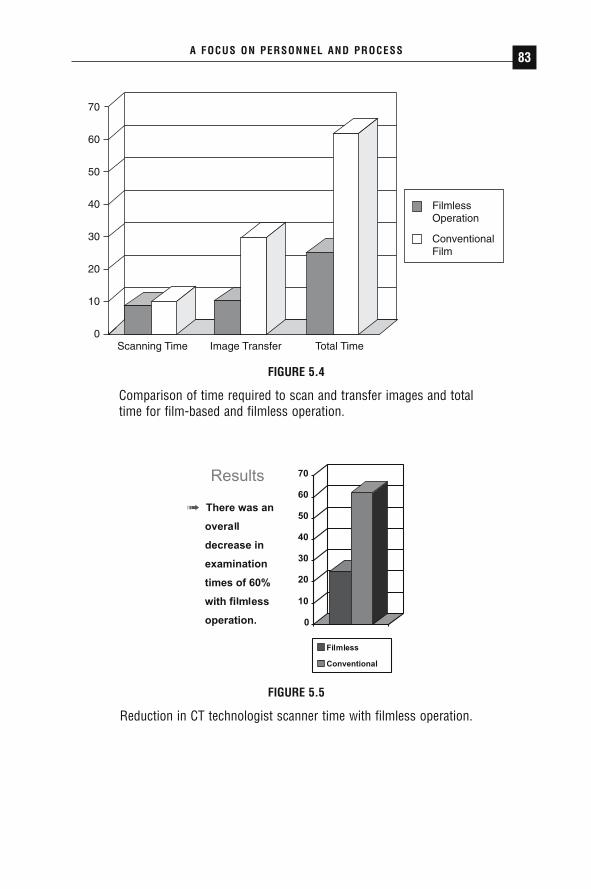
A FOCUS ON PERSONNEL AND PROCESS 83
0
10
20
30
40
50
60
70
Scanning Time
FilmlessOperation
ConventionalFilm
Image Transfer Total Time
FIGURE 5.4
Comparison of time required to scan and transfer images and totaltime for film-based and filmless operation.
FIGURE 5.5
Reduction in CT technologist scanner time with filmless operation.
DRE05 11/16/2005 9:33 AM Page 83

WHEN TECHNOLOGY LIMITS PERSONNEL
The potential personnel hours saved by PACS and the incremental benefitsin fewer errors and improved patient care have been obvious from the begin-ning. However, in many cases, actual workflow benefits have been limitedby difficulties in integration and communication between the HIS-RIS, thePACS, and the imaging modality, with a large body of literature offeringfirsthand experiences and advice. The two most common standards used inthis communication are Digital Imaging and Communications in Medicine(DICOM) and Health Level Seven (HL7). Unfortunately, the majority ofHIS-RIS’s do not adequately support DICOM, and specific implementationsand interpretations of both DICOM and HL7 vary widely. The Radiologi-cal Society of North America and the Health Information ManagementSystems Society sponsored a “phased series of public demonstrations ofincreasing connectivity and systems integration,” which has broughttogether imaging vendors with HIS-RIS vendors. This very important effort,known as the Integrating the Healthcare Enterprise (IHE) initiative, hasbegun to facilitate more efficient and predictable communication amongimaging modalities, the HIS-RIS, and PACS, and potentially among medicalfacilities as well. Additionally, several vendors now offer consolidated RIS-PACS or RIS-HIS-PACS solutions, or both. The lesson to be learned fromthese lingering communication bottlenecks is that even when personnelworkflow is reengineered to keep up with evolving technologies, there maybe times when some aspects of those technologies lag behind.
PACS: A Guide to the Digi tal Revolut ion84
0%
2%
4%
6%
8%
Before ModalityWorklist
Overall Transmission Failure Rate
After ModalityWorklist
FIGURE 5.6
CT transmission failure rate before and after modality worklist.
DRE05 11/16/2005 9:33 AM Page 84

INTRODUCING NEW PERSONNEL
One effect of the introduction of PACS into the radiology workplace hasbeen the identification of new roles for personnel. The most prominent hasbeen that of PACS administrator, which has risen from a hypothetical iden-tity to an emerging profession in less than 5 years. One of the main func-tions of this technical/administrative position is to identify bottlenecks inworkflow, both human and automated, and evaluate methods to streamlinecost and maintain the quality of care in an atmosphere of continuously evolv-ing technology.
Others have posited the need for a new kind of technologist, one ded-icated to the PACS in the same way that RTs are (ideally) dedicated to imageacquisition. Still others have noted that with the ever-decreasing clerical staffin radiology departments, a number of tasks (such as patient escort and dataentry) could be performed effectively by full-time radiology aides. Manyradiology departments are experimenting with different combinations ofemployees in different configurations. It seems clear that as technologychanges, so will the duties and identities of radiology personnel. The challenge is to build this flexibility and innovation into workflow analyses toaccommodate such change.
ANALYZING WORKFLOW FROM THE QUEUING PERSPECTIVE
Queuing theory is a branch of mathematical reasoning and analysis that seeksto theoretically describe production processes along with the statistical/probabilistic techniques to account for varying dynamic patterns within thestages of those processes. Mathematicians have long been fascinated by theseemingly random but ultimately predictable flow dynamics of lines of carsin traffic or humans waiting to see a movie. The field received a boost whenhigh-speed computing created “queues” of incoming and outgoing data thatrequired analytic predictive metrics. Today, the results of queuing analysisare incorporated into a wide range of applications, from waiting-line con-figurations outside roller coasters to sorting and prioritizing of high-speedgenomic computing tasks.
A number of authors have incorporated queuing analysis—basedmethods into their investigations of patient scheduling, hospital or institu-tional systems analysis, and medical workplace efficiency. Queuing theory,which breaks up any process into constituent time-span components, is
A FOCUS ON PERSONNEL AND PROCESS 85
DRE05 11/16/2005 9:33 AM Page 85

particularly suitable for looking at radiology workflow, where the patient(and, later, data acquired from the patient) can be tracked through a seriesof time-specific fields from arrival to delivery of images to the clinician.Although individual work assignments are taken into perspective in queuinganalysis, the focus is actually on the overall span of time and the true flowof activity.
Queuing analysis poses specific questions about the process of work-flow. In the radiology setting, these questions are broken into individual sub-components of arrival, service, and queue characteristics.
ARRIVAL
The key questions to be asked are: How do customers (patients) arrive forservice (individually or in batch mode)? How are arrivals distributed overtime (episodic or continuous)? And how do arrivals differ according to hourof the day, day of the week, or even season? In a radiology department, somearrivals are predictable and others are not. When analyzing the queue forgeneral radiography, certain variations in arrival can be predicted reliably.For example, in large hospitals, orthopedic clinics tend to be high-volumeusers. It is possible to predict from experience with reasonable certainty thatduring the hours of orthopedic clinic operation a batch influx of patients willarrive for radiographic exams. Some of these patients will have been previ-ously scheduled and can be anticipated, whereas others are unscheduled. Yetall of these arrivals can be predicted as part of planned departmental work-flow, because the day of the week and time of the day for orthopedic clinicoperation are known in advance.
Emergency department (ED) utilization of radiology services, on theother hand, is not as predictable. Referrals can be individual or in groupsand can be episodic or continuous. However, a review of weekly or monthlystatistics on these referrals may reveal patterns. Certain ED physicians reg-ularly on duty may order radiology studies with more frequency than others.Certain times in the ED (trauma-heavy Friday and Saturday evening shifts,for example) may routinely produce more referrals. All these data can becompiled to provide a degree of predictability.
The simplest arrival process is one of predictable and regular arrivals,which translates into a constant time interval between successive arrivals.Only in rare instances in medicine (outpatient psychiatric therapy, forexample) is the arrival distribution this tidy. Queuing analysis provides math-ematical models, such as the Poisson distribution for arrivals, that can take
PACS: A Guide to the Digi tal Revolut ion86
DRE05 11/16/2005 9:33 AM Page 86

seemingly random data—the rate of real-life arrivals in a radiology depart-ment—and transform these into a single average arrival rate for specific daysand times.
SERVICE
The key questions to be asked are: How long does the service take for com-pletion of the desired task (service time distribution)? What are the requiredresources needed to perform the service? Is the service performed in paral-lel (one queue for all servers) or in series (each server with his or her ownindividual queue)? And is preemption allowed (can a server reprioritize thequeue)?
To analyze radiology workflow, we must assess how long a given examwill take, realizing that this time will differ depending on a dauntingly largenumber of factors, such as patient characteristics (inpatient on stretcher vs.ambulatory outpatient, for example), type of exam (5-view vs. 2-view lumbarspine radiographic exam, for example), individual technologist skills andhabits, and technology (wall-mounted bucky unit vs. table unit, for example).Required resources can vary according to these and other variables. Forexample, an immobile stretcher patient will require multiple staff membersto assist with transfer to and from the table, whereas the ambulatory out-patient can be accommodated quickly and efficiently by a single technolo-gist. Preemption commonly occurs based on the clinical urgency of theindividual patient. ED patients, for example, often take precedence over elec-tively scheduled outpatients. Such preemption has significant effects on thequeue status when ED utilization rates are high.
Although similar in some ways to time-motion studies, the queuingperspective on service takes into account multiple variables and again facil-itates useful predictions about resources that will be needed at specific times.
QUEUE CHARACTERISTICS
The key questions to be asked are: How does one choose the order of service(random, by order of arrival, priority according to clinical need, or the“squeaky wheel” phenomenon)? Do some customers (patients or referringclinicians) leave the queue if the wait becomes too long? Do customers (bothpatients and referring clinicians) represent a captive audience that is forcedto remain in the queue regardless of service limitations?
A FOCUS ON PERSONNEL AND PROCESS 87
DRE05 11/16/2005 9:33 AM Page 87

Queue characteristics vary in institutional and imaging settings. Forexample, an outpatient imaging center’s business model is largely predicatedon rapid service. To remain competitive, queues must remain small withrapid service delivery. If they fail, they risk alienating patients, their families,and referring physicians. A VA hospital, on the other hand, deals with a cap-itated patient population that is in effect a captive audience. Longer queuesare tolerated in such an environment because the resources are limited andthe demand will remain high, even with longer queues.
QUEUING ANALYSIS
To use queuing analysis to provide insight into management decision makingin the allocation of personnel and technology, five key questions can beasked:
1. What is the average patient waiting time?2. What is the average time to exam completion?3. What is the probability of a patient having to wait longer than a
specified time interval before service is initiated?4. What is the average length of the queue? How does it vary over
time?5. What is the expected utilization rate of the individual server?
One example of the results of asking these questions can be found in arecent study comparing CR and direct radiography (DR) workflow costs.Despite the fact that DR was found to be significantly faster than CR inaverage examination time, the cost differential favored CR in most imagingsettings. The differentiating factor was not employee time or other costs butthe rate of flow of patients. The more expensive technology could be costjustified only when utilization rates per radiographic room exceeded 80%.Such rates occur only in busy outpatient centers with continuous, high-volume, scheduled patient arrival rates. For most hospital practices, theepisodic and intermittent nature of patient arrival rates produces lower utilization rates and shorter queues in which the less expensive technologywould be more cost-efficient. Only by analysis of waiting time and of theflow of the patient from waiting time to completion of study can such information be integrated with other workflow analyses to yield a completepicture of departmental productivity and efficiency.
PACS: A Guide to the Digi tal Revolut ion88
DRE05 11/16/2005 9:33 AM Page 88
THE ROLE OF QUALITY ASSURANCE INWORKFLOW AND PRODUCTIVITY
During the course of our professional training, all of us are taught the impor-tance of quality. No other profession should be more quality oriented thanmedicine, where a lapse can affect every participant and every subsequentstep in the medical imaging chain, from the scheduling of an examination to clinical management decisions made by the referring clinician based onimaging findings. Missteps can result in adverse outcomes as minor as longerwaiting times for imaging and as major as misdiagnoses. Rigorous qualityassurance (QA) measures, originally borrowed from industrial models, arenow widely acknowledged as important but are not uniformly implementedthroughout the medical enterprise. Quality assurance is often cited as thebest way to ensure optimal patient care and decrease possible medicolegalconsequences. An often overlooked benefit of QA, however, is its potentiallypositive effect on productivity and workflow.
When evaluating productivity and workflow within the medicalimaging department, objective measures are typically quantity orientedrather than quality oriented. Productivity and workflow can be measured ina number of different ways, depending on both perspective and the intendeduses for the information. For RTs, productivity is most often measured in exams per full-time equivalent, whereas for radiologists it is measured inrelative value units. For the administrator, who takes a more global per-spective on productivity and workflow, the foci of objective measures includetime and effort spent in scheduling backlog and exam/report turnaroundtime. An emphasis on such quantitative measures (and the need for speedand efficiency) often has the unintended effect of worsening rather thanenhancing quality. In fact, many supervisors and decision makers within theimaging department and healthcare enterprise view QA programs as costinefficient.
The only imaging modality in which QA is consistently performed ismammography, because it is federally mandated through the MammographyQuality Standards Act. For most other modalities, QA is highly variable.Short of additional federal or state legislation, additional QA programsrequire some sort of economic justification for widespread adoption. Exam-ples of such justification include reduced medicolegal risk (by lowering insur-ance premiums and decreasing the likelihood of large payouts), increasedrevenue (through improved customer satisfaction and increased referrals), ordecreased expenses (by improved operational efficiency and productivity).Although the last justification is not commonly thought of as a direct result
A FOCUS ON PERSONNEL AND PROCESS 89
DRE05 11/16/2005 9:33 AM Page 89
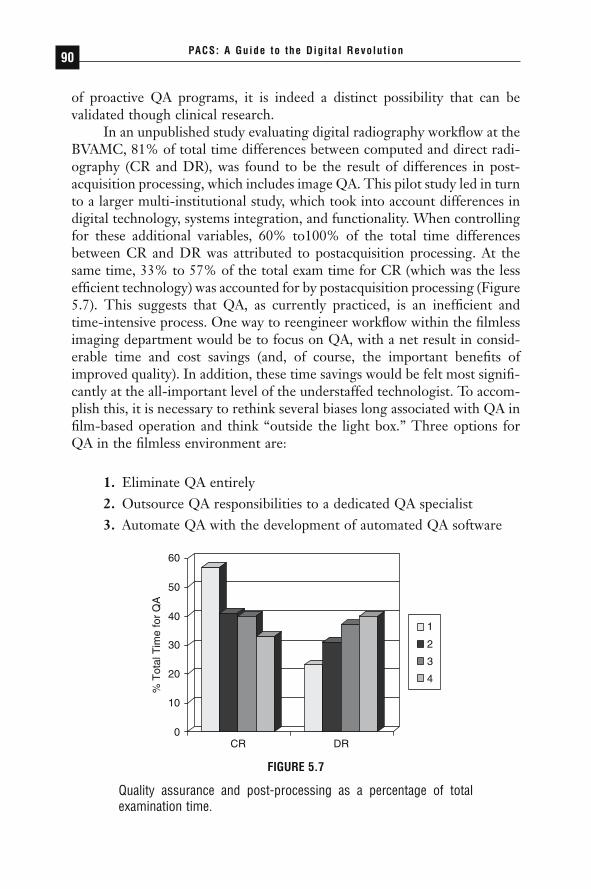
of proactive QA programs, it is indeed a distinct possibility that can be validated though clinical research.
In an unpublished study evaluating digital radiography workflow at theBVAMC, 81% of total time differences between computed and direct radi-ography (CR and DR), was found to be the result of differences in post-acquisition processing, which includes image QA. This pilot study led in turnto a larger multi-institutional study, which took into account differences indigital technology, systems integration, and functionality. When controllingfor these additional variables, 60% to100% of the total time differencesbetween CR and DR was attributed to postacquisition processing. At thesame time, 33% to 57% of the total exam time for CR (which was the lessefficient technology) was accounted for by postacquisition processing (Figure5.7). This suggests that QA, as currently practiced, is an inefficient and time-intensive process. One way to reengineer workflow within the filmlessimaging department would be to focus on QA, with a net result in consid-erable time and cost savings (and, of course, the important benefits ofimproved quality). In addition, these time savings would be felt most signifi-cantly at the all-important level of the understaffed technologist. To accom-plish this, it is necessary to rethink several biases long associated with QA infilm-based operation and think “outside the light box.” Three options forQA in the filmless environment are:
1. Eliminate QA entirely2. Outsource QA responsibilities to a dedicated QA specialist3. Automate QA with the development of automated QA software
PACS: A Guide to the Digi tal Revolut ion90
CR
% T
otal
Tim
e fo
r Q
A
0
10
20
30
40
50
60
DR
1
2
3
4
FIGURE 5.7
Quality assurance and post-processing as a percentage of totalexamination time.
DRE05 11/16/2005 9:33 AM Page 90

While the first option may seem heretical, in reality it is highly prac-tical. As previously noted, the retake rate at BVAMC went down to only0.8% when transitioning from film to filmless operation. In such a scenario,only 1 out of every 125 patients would effectively require a callback becauseof technical deficiency. Elimination of QA would free up 33% to 57% oftechnologist time, thereby improving technologist productivity, departmen-tal workflow, and operational efficiency.
The second option requires the training of a dedicated QA specialist,which has the mixed effect of enhancing technologist productivity at theexpense of creating a new full-time employee. The productivity gains of mul-tiple technologists would more than cost justify this position. At the sametime, changing QA workflow from single to batch mode would significantlyimprove departmental workflow while improving the overall consistency ofthe QA process (and potentially improving overall image quality).
The third option combines the best of all worlds and offers the futureopportunity to further automate an existing manual process. Automation ofQA has the potential to simultaneously improve image quality, education,and training (via a referenceable QA database), reduce payroll expenses, andimprove productivity and workflow.
In the end, optimizing QA and workflow can be a synergistic process.To accomplish this, however, one needs to purge the biases of film-basedoperation and understand the capabilities of digital imaging. By removingQA as a back-end technologist function, significant productivity gains canbe realized while improving image consistency and overall quality.
CONCLUSION
Many, if not most, imaging departments have not significantly altered fun-damental patterns of workflow since their film-based days. Despite signifi-cant changes in technology and personnel, these patterns have remainedfixed. Technology, however, is more than the focus around which workflowchanges must be made. It provides the means with which to improve work-flow and optimize the contributions of the humans who, in the end, are stillresponsible for the work and the end product. If workflow (along with result-ing patient care, personnel satisfaction, and overall profitability) is to be trulyoptimized, expectations must be changed. Individual tasks should be auto-mated whenever possible and specialized when not. To accomplish this, each“assembly line worker” must have clearly defined tasks that he or she istrained to perform with a greater degree of efficiency than could otherwisebe realized in the current environment of interchangeable parts and multitasking.
A FOCUS ON PERSONNEL AND PROCESS 91
DRE05 11/16/2005 9:33 AM Page 91
We must never forget, of course, that what distinguishes us from a trulyindustrial endeavor is that our end product is not a gadget or inanimateobject but a dynamic entity, derived from a living, breathing person. Effi-cient workflow must take the human source into consideration and remem-ber that the perception of service delivery is also predicated on the qualityand timeliness of service delivery.
Nor should we forget that the lessons of QA borrowed from industrytake on a special urgency and importance in medical imaging. No matterhow efficient a process, it has failed if the end product is of inferior quality.We must continuously analyze and reanalyze the overall process, looking torefine any glitches that may have an adverse effect on quality. Current stan-dards of practice provide valuable guidelines, but standards such as DICOMand HL7 can take us only so far. True integration requires a consensus suchas that provided by the IHE effort about how we will use these standards tosolve practical challenges, such as smooth workflow, communication of infor-mation, uniformity of image presentation, unidentified emergency roompatients, and security.
◗ REFERENCES
Andriole KP, Luth DM, Gould RG. Workflow assessment of digital versus computedradiography and screen-film in the outpatient environment. J Digit Imaging.2002;15(suppl 1):124–126.
Bartholmai BJ, Erickson BJ, Hartman TE, et al. The electronic imaging technologyspecialist: the role of a new radiology subspecialty for the 21st century. SeminRoentgenol. 2003;38:256–269.
Beasley JE. Queueing theory. Operations research notes from Imperial College.Available at: http://people.brunel.ac.uk/~mastjjb/jeb/or/queue.html. Accessedon: August 3, 2005.
Boochever SS. HIS/RIS/PACS integration: getting to the gold standard. RadiolManage. 2004;26:16–24.
Cabrera A. Defining the role of a PACS technologist. J Digit Imaging. 2002;15(suppl1):120–123.
Gocke P, Debatin JF, Durselen LF. Process management and controlling in diagnostic radiology in the hospital [in German]. Radiologe. 2002;42:332–343.
Gross-Fengels W, Miedeck C, Siemens P, et al. PACS: from project to reality. Reportof experiences on full digitalization of the radiology department of a major hospital [in German]. Radiologe. 2002;42:119–124.
PACS: A Guide to the Digi tal Revolut ion92
DRE05 11/16/2005 9:33 AM Page 92
Guthrie BL, Price C, Zaleski J, Backensto E. The Digital Imaging and Com-munications in Medicine (DICOM) archive is a dynamic component of a clini-cian image-related workflow solution. J Digit Imaging. 2001;14(2 suppl 1):190–193.
Hayt DB, Alexander S, Drakakis J, Berdebes N. Filmless in 60 days: the impact ofpicture archiving and communications systems within a large urban hospital. J Digit Imaging. 2001;14:62–71.
Health Level Seven, Inc. HL7. Available at: http://www.hl7.org. Accessed August 15,2004.
Honeyman-Buck J. PACS adoption. J Digit Imaging. 2002;15(suppl 1):184–188.Janower ML. 1988. Productivity standards for technologists: how to use them.
Radiology. 1988;166:276–277.Kolb G. Going filmless: lessons from a Swedish breast center. Decis Imaging Econ.
[serial online]. August 2004. Available at: http://www.imagingeconomics.com/library/200408-08.asp. Accessed August 15, 2004.
Kuzmak PM, Dayhoff RE. The use of digital imaging and communications in medicine (DICOM) in the integration of imaging into the electronic patientrecord at the Department of Veterans Affairs. J Digit Imaging. 2000;13(2 suppl1):133–137.
Kuzmak PM, Dayhoff RE. Experience with DICOM for the clinical specialties inthe healthcare enterprise. Proc SPIE Med Imaging. 2003;5033:18–29.
Langen HL, Bielmeier J, Wittenberg G, Selbach R, Feustel H. Workflow improve-ment and efficiency gain with near total digitalization of a radiology department[in German]. Rofo Fortschr Geb Rontgenstr Neuen Bildgeb Verfahr. 2003;175:1309–1316.
Locko RC, Blume H, Goble JC. Enterprise-wide worklist management. J DigitImaging. 2002;15(suppl 1):175–179.
MacEwan DW. Radiology workload system for diagnostic radiology: productivityenhancement studies. Radiology Manage. 1982;5:24–38.
May GA, Deer DD, Dackiewicz D. Impact of digital radiography on clinical work-flow. J Digit Imaging. 2000;13(2 suppl 1):76–78.
Mazurowski J. Informatics management and the PACS administrator. Radiol Manage.2004;26:41–42.
Mulvaney J. The case for RIS/PACS integration. Radiol Manage. 2002;24:24–29.
National Electrical Manufacturers Association. DICOM: Digital Imaging and Communications in Medicine. Available at: http://medical.nema.org. AccessedAugust 15, 2004.
Nissen-Meyer S, Holzknecht N, Wieser B, et al. Improving productivity by imple-menting RIS and PACS throughout the clinic: a case study [in German]. Radiologe. 2002;42:351–360.
A FOCUS ON PERSONNEL AND PROCESS 93
DRE05 11/16/2005 9:33 AM Page 93
Ouvry A. PACS implementation dramatically impacts people and radiology workprocesses. Proc SPIE Med Imaging. 1997;3035:602–603.
Radiological Society of North America. Integrating the Healthcare Initiative. Available at: http://www.rsna.org/IHE. Accessed August 15, 2004.
Redfern RO, Horii SC, Feingold E, Kundel HL. Radiology workflow and patientvolume: effect of picture archiving and communication systems on technologistsand radiologists. J Digit Imaging. 2000;13(2 suppl 1):97–100.
Redfern RO, Langlotz CP, Abbuhl SB, Polansky M, Horii SC, Kundel HL. Theeffect of PACS on the time required for technologists to produce radiographicimages in the emergency department radiology suite. J Digit Imaging. 2002;15:153–160.
Reiner B, Siegel E, Carrino JA. Workflow optimization: current trends and futuredirections. J Digit Imaging. 2002;15:141–152.
Reiner B, Siegel E, Carrino JA, McElveny C. SCAR Radiologic Technologist Survey:analysis of technologist workforce and staffing. J Digit Imaging. 2002;15:121–131.
Reiner B, Siegel E, Scanlon M. Changes in technologist productivity with imple-mentation of an enterprisewide PACS. J Digit Imaging. 2002;15:22–26.
Reiner BI, Salkever D, Siegel EL, et al. Multi-institutional analysis of computed anddirect radiography. Part II. Economic analysis. Radiology. 2005;236:420–426.
Reiner BI, Siegel EL, Carrino JA, Goldburgh MM. SCAR Radiologic TechnologistSurvey: analysis of the impact of digital technologies on productivity. J DigitImaging. 2002;15:132–140.
Reiner BI, Siegel EL, Hooper FJ, Glasser D. Effect of film-based versus filmlessoperation on the productivity of CT technologists. Radiology. 1998;207:481–485.
Roos JE, Desbiolles LM, Willmann JK, Weishaupt D, Marincek B, Hilfiker PR.Multidetector-row helical CT: analysis of time management and workflow. EurRadiol. 2002;12:680–685.
Saarinen AO, Wilson MC, Iverson SC, et al. Potential time savings to radiologydepartment personnel in a PACS-based environment. Proc SPIE. 1990;1234:261–269.
Sacco P, Mazzei M, Pozzebon E, Stefani P. PACS implementation in a universityhospital in Tuscany. J Digit Imaging. 2002;15(suppl 1):250–251.
Schmidt J, Meetz K, Wendler T. Workflow management systems—a powerful meansto integrate radiologic processes and application systems. J Digit Imaging.1999;12(2 suppl 1):214–215.
Schoppe WD, Hessel SJ, Adams DF. Time requirements in performing body CTstudies. J Comp Assist Tomogr. 1981;5:513–515.
Sferrella SM, Story CP. The impact of tech aides in radiology. Radiol Manage.2004;26:22–30.
PACS: A Guide to the Digi tal Revolut ion94
DRE05 11/16/2005 9:33 AM Page 94
Siegel EL, Diaconis JN, Pomerantz S, et al. Making filmless radiology work. J DigitImaging. 1995;8:151–155.
Siegel EL, Reiner BI. Challenges associated with the incorporation of digital radi-ography into a picture archival and communication system. J Digit Imaging1999;12(2 suppl 1):6–8.
Siegel EL, Reiner BI, Severance S, et al. Comparison of technologist productivityfor chest radiography when using CR and DR: importance of workflow opti-mization. Paper presented at: Annual Meeting of the Society for ComputerApplications in Radiology; May 3, 2002; Cleveland, OH.
Trisolini MG, Baswell SB, Johnson SK, et al. Radiology work-load measurementsreflecting variables specific to hospital, patient, and examination: results of a col-laborative study. Radiology. 1988;166:247–253.
Wendt G, Peppler W, Edwards W, Parisot C, Lindop C. Clinical implementationof the IHE presentation of grouped procedures integration profile in a multi-vendor environment—workflow modification and barriers to implementation. J Digit Imaging. 2002;15(suppl 1):64–66.
Wong STC, Tjandra D, Wang H, Shen W. Workflow-enabled distributed compo-nent-based information architecture for digital medical imaging enterprises.IEEE Trans Inf Technol Biomed. 2003;7:171–183.
A FOCUS ON PERSONNEL AND PROCESS 95
DRE05 11/16/2005 9:33 AM Page 95

REENGINEERINGWORKFLOW: THERADIOLOGIST’SPERSPECTIVE
ELIOT L. SIEGEL • BRUCE I. REINER • NANCY KNIGHT
Busy day in the department. Morning: read several kidney studies and consultedon a fx. Home for lunch: stopped at drug store. Cut grass. Afternoon: read 3 studies. Organized cases. Home at 4:00. Took Lucille to see ForbiddenPlanet.
May 1956 entry in the diary of Col. William LeRoy Thompson, MDFirst Chair and Registrar of the Department of Radiologic Pathology
at the Armed Forces Institute of Pathology, Walter Reed Army Medical Center
Ask almost any observer what has changed most about the practice of radi-ology in the last half century and the immediate answer will be the tech-
nology. New modalities, interventional techniques, and the digitalization ofalmost every aspect of image acquisition, retrieval, processing, reporting, and
6CHAPTER
DRE06 11/16/2005 9:36 AM Page 97

archiving have profoundly altered the look of the imaging department. Aska radiologist the same question, however, and he or she will respond that themost fundamental and challenging change in actual practice has been in thepace of work demanded of the individual who interprets the images. Goneare the days of a few studies in the morning, home for lunch, and a few morein the afternoon, as Colonel Thompson outlined in his diary at Walter Reedin 1956. Almost gone are the days of single- or two-view studies, interpretedon film and returned with dictated and manually transcribed reports to thereferring physician.
Instead, an extraordinarily rapid and exponential growth in the numberof images that constitute a single study, as well as the performance of numer-ous studies per patient, has multiplied the daily total of images presented tomany radiologists by factors of not tens or hundreds but thousands. Tenac-ity and creativity have joined sensitivity and specificity as necessary metricsof radiologic success, as once-daunting 8-channel computed tomography(CT) datasets are replaced by those generated from 64-channel studies, andmodalities from magnetic resonance (MR) to ultrasound (US) to fusion tech-niques in nuclear imaging yield increasingly large and complex groups ofimages. As Horii and others have pointed out, the size of these datasets hasactually accomplished what logic and documented successes sometimes failedto do. These images form the “first group of examinations that cannot prac-tically be printed to film for interpretation.” A 1000-image CT examina-tion—now commonplace in many institutions—would require a minimumof 67 film sheets to print (using a 4 ¥ 4 matrix on film) and would take up17 panels of a 4-light-box mechanical film changer for each window/levelcombination. The image explosion has made the transition to filmlessimaging mandatory for many who once considered it an interesting futureoption.
The result over the past 5 years has been an increasing focus on work-flow issues relating to the essence of radiologic practice: the process thatoccurs at the interface between the interpreter and the image. The litera-ture documenting radiologist workflow issues is growing. Of course, thetasks of the radiologist at the workstations are part of a larger workflow and depend on a number of factors, including effective picture archiving and communication systems (PACS) integration with the radiology and hospital information systems (RIS and HIS, respectively), worklist manage-ment, workstation design, and innovations in the interpretation process,reporting, and interactions with clinicians and the larger medical enterprise.Less studied but equally important are the effects of room design andergonomics on radiologist workflow and productivity as well as the need forreliable metrics and tools by which such productivity can be assessed andcompared.
PACS: A Guide to the Digi tal Revolut ion98
DRE06 11/16/2005 9:36 AM Page 98

Because PACS serve increasingly as the nexus and conduit for the workof the radiologist, a number of other chapters in this book cover in greaterdetail the technical elements that make up routine workflow. Our goal in thischapter is to provide background, overview, and resources on current chal-lenges and benefits associated with various elements of radiologist workflow.
BACKGROUND
For a number of reasons, including the fact that radiologists are the mostexpensive members of the imaging department’s staff, interpretation work-flow has been studied for many years to determine which factors influenceproductivity and accuracy. These studies took on additional importancewhen quantifiable results were needed to bolster the transition from film-based to filmless imaging in many institutions. Studies performed at the Baltimore Veterans Affairs Medical Center (BVAMC) documented anincrease in radiologist productivity by more than 50% over the course ofsuch a transition. This marked improvement occurred despite the fact thatradiologist reading times decreased only slightly, by approximately 8% to15%. The improvement was believed to be the result of a combination ofcomplex factors, including more effective sharing of the workload by theradiologists, fewer interruptions, immediate availability of old examinationsand reports for comparison, and the elimination of the film library and theinefficiencies and time delays associated with it (see Chapter 5 for informa-tion on departmental workflow effects that contributed to overall increasesin productivity). Since the time of our original report, many other groups ofradiologists have reported similar increases in productivity during the tran-sition to filmless operation with an enterprise-wide PACS. Although thistransition has been made in a variety of settings, from academic to privatepractice and in countries with varying reimbursement, personnel, and patientcharacteristics, some elements of success—as well as continuing challenges—remain constant.
PREPARING FOR INTERPRETATION:WORKLISTS, ARCHIVE ACCESS, AND INITIAL DISPLAY
Among the most important determinants of radiologist and clinician per-formance is the time required for a PACS workstation to retrieve one ormore imaging studies, to display them for interpretation, and to present a
THE RADIOLOGIST’S PERSPECTIVE 99
DRE06 11/16/2005 9:36 AM Page 99
suitable choice of workstation tools that allow the radiologist to glean asmuch clinically significant information as possible about the images. Studiesthat we have performed at the BVAMC and the University of Maryland havesuggested that the first image from an 8-megabyte computed radiographystudy should take less than 3 seconds to display. Cross-sectional images, suchas 512 ¥ 512-pixel CT images, should display at a rate of at least 5 per secondor faster. Our data suggest that image display performance that is signifi-cantly slower may result in a significant decrease in radiologist reading speedand produce increased levels of fatigue.
Manufacturers of PACS originally took one of two general approachesto the delivery of images to a radiologist’s workstation. In the first, imageswere stored on a single, large, short-term storage unit, typically a redundantarray of inexpensive disks (RAID). With this approach, workstations com-municated directly with this centrally located storage device over a very fastnetwork for image retrieval. The major advantage of this approach was theflexibility to rapidly retrieve any images at any location for both radiologistsand clinicians. The major disadvantage was that it required a fast network inwhich single points of failure posed threats to continuous operation. Suchsystems were vulnerable to a major loss of function in the event of failure ofthe short-term storage device.
The alternative PACS architecture for delivery of images utilized amodel that more closely emulated (and had many of the disadvantages of ) afilm-based environment in which films were sent to or placed on a film alter-nator. With a PACS, this was accomplished electronically by routing appro-priate images to one or more workstations that were most likely to be usedto review those image studies. Images to be read and comparison studieswere stored locally on the hard drives (local storage) of the workstationsthemselves. Images could be intelligently routed to any number of worksta-tions most likely to retrieve these studies. For example, all CT examinationscould be routed to one or more workstations dedicated to interpretation of CT examinations or to the workstations or radiologists likely to read those studies on any particular day. Relevant comparison CT, general radio-graphs, or other studies deemed to be likely to be needed for comparisoncould also be routed to those workstations automatically, using predefinedrules determined by the radiologists. The major advantage of such a systemwas independence from failure of any one component of the PACS or eventhe network itself. The disadvantage was the difficulty in selecting rules that would anticipate often unpredictable and spontaneous requirements of radiologists for comparison studies and older imaging studies that couldbe requested by clinicians for review. The other disadvantage of this archi-tecture was the tendency for workstations to require a greater amount of
PACS: A Guide to the Digi tal Revolut ion100
DRE06 11/16/2005 9:36 AM Page 100
local storage as well as the inefficiencies of storing images in multiple locations.
Fortunately, most PACS now combine the two approaches to minimizedisadvantages and optimize benefits. (The currently available choices ofPACS architectures are discussed in detail in Chapter 13.) For example,PACS that use a central hard drive (or RAID) may also employ mirrored orbackup systems to further decrease the likelihood of a general system failure.Those systems that use local workstation storage now create more central“nodes” or short-term image servers that store images for a cluster of work-stations. This can result in more efficient storage and retrieval and decreasethe need for very specific algorithms for routing images to a particular work-station. It is likely that this trend will continue in the future and will signif-icantly blur the differences between the two approaches to short-term imagestorage and distribution.
The combination of the use of modality worklists, display default pro-tocols, and a fast image retrieval and display system now provides the abilityto customize the radiology workflow process. Given these workflow and per-formance features, radiologists should be substantially more productive withless fatigue than in the conventional, film-based environment.
WORKLISTS AND WORKFLOW
Other chapters in this book address questions of workstation accessibility,security, and sign-on. Identifying the appropriate images to be read and connecting these images with the appropriate patient data and relevantpriors, however, have always constituted the first major step in the radiolo-gist workflow process. This step has changed profoundly within the lastdecade.
To maximize the efficiency of the workflow of diagnostic radiologists,early PACS adopters discovered that it was important to achieve paperlessas well as filmless operation. Even today, the efficiency of many PACS imple-mentations is hampered by the failure to eliminate paper from the radio-logists’ (and others’) workflow process. In paper-based departments,radiologists began their work when presented with a stack of forms that con-tained information about the patient, examination, and reason for the study,with limited additional information, such as the name of the ordering physi-cian or service, patient location, and so on. The radiologist then would usethe information on these forms to enter patient or study identification man-ually or use a barcode reader or other mechanical tool to identify the patientand study to the workstation.
THE RADIOLOGIST’S PERSPECTIVE 101
DRE06 11/16/2005 9:36 AM Page 101

In the filmless department, these steps (and the attendant high rate ofintroduced error) have been eliminated by the implementation of workliststhat define the type of unread studies to be presented for interpretation andtheir order of presentation. Worklists are shared, enterprise-wide rosters ofunread studies, which, through the PACS, are integrated with a wealth ofadditional information. The worklist acts as a database filter that allows aradiologist to view images defined by anatomic regions (e.g., chest, neuro-radiology, or musculoskeletal) or modality (e.g., ultrasonography, nuclearmedicine, angiography, or special procedures) or any combination of these.The advantages of worklists for radiologists include the ability to sign in atany location and have full access to all unread examinations in their area orareas of expertise at any time, the ability for multiple radiologists to shareresponsibility for reading similar types of studies, and the performanceimprovements associated with the elimination of manually keyed or bar-coded patient or study information.
The physical time savings for all radiology personnel and especially forthe radiologist are evident. However, smooth implementation of sharedworklists across the enterprise were hindered for a number of years by prob-lems with interfaces between and among the RIS, HIS, PACS, and otherhospital or practice information systems. The development and acceptanceof the Digital Imaging and Communications in Medicine (DICOM) work-list standards, which offer guidelines for electronic communication betweenthe imaging department and other parts of the hospital enterprise, providedthe missing link that many institutions needed to begin to successfully imple-ment worklists at the radiology workstation. The Integrating HealthcareEnterprise (IHE) initiative of the Radiological Society of North America andthe Healthcare Information and Management Systems Society has addressedmany of the remaining challenges associated with the lack of plug-and-playcompatibility that resulted from the substantial flexibility (or looseness) ofthe Health Level Seven (HL7) and DICOM standards and those of otherinformation technology systems.
Implementation of DICOM modality worklist management softwarehas been reported to reduce input errors from 6.4% to 0.1%. In anotherstudy, a pre-PACS CT transmission failure rate of 7.6% (largely the resultof human error in data entry) was reduced to 3.5% after the addition ofDICOM worklists, with a much smaller portion of that percentageaccounted for by human error (Figure 6.1).
Worklists can also be generated using an algorithm designed to preventstudies from being read and reported more than once (overreading), thusincreasing overall radiologist productivity and reducing the possibility ofconflicting recommendations. They can also be customized so that imagescan be used in resident or teaching review.
PACS: A Guide to the Digi tal Revolut ion102
DRE06 11/16/2005 9:36 AM Page 102

PRE-FETCH
One of the workflow rate-limiting steps in the process of image retrieval anddisplay is related to the fact that retrieval of images from long-term storagefrom an optical, magneto-optical, or tape archive is quite slow. In fact,retrieval times can be 10 to 100 times slower from long-term than fromshort-term storage, depending on the PACS architecture and equipment.Archiving and retrieval are addressed in other chapters of this volume.
Despite the more widespread use of RAID for both short- and long-term storage associated with substantial cost reductions in “spinning disk”archives, strategies to minimize the likelihood of a delay in image retrievalremain important elements in well-planned workflow. Such strategies use aset of algorithms (rules) that attempt to maximize the likelihood that therequired images are available in short-term storage. The goal is to have theoptimal number of relevant priors available without initiating unnecessarytransfers from long-term storage. This process is an excellent example of theadvantage of a PACS-HIS-RIS that forms an “intelligent” system, andnumerous algorithms have been suggested and investigated.
One of the most straightforward examples of image pre-fetch is storageof new and historic examinations locally at a workstation. With this PACSarchitecture, images and predefined prior studies (for example, the last twostudies that match both modality and anatomic location) are routed to a par-ticular workstation or workstations. This pre-fetch strategy can also be usedin a system in which workstations share a single RAID server. In this typeof system, predefined relevant priors are retrieved from long-term storageautomatically when a new imaging study is performed.
THE RADIOLOGIST’S PERSPECTIVE 103
FIGURE 6.1
The CT transmission error rate was cut dramatically after the intro-duction of modality worklists.
DRE06 11/16/2005 9:36 AM Page 103

Other pre-fetch strategies can substantially increase the possibility thatimages that are likely to be needed by the radiologist or clinician are avail-able on a local workstation or server. For example, image pre-fetches can betriggered based on a scheduled or new admission to the hospital, a sched-uled outpatient appointment, or a transfer of a patient from one location toanother within the hospital. Our analysis of the RIS database at the BVAMCindicated that a relatively small number of studies can be pulled to achievea high likelihood that the required studies will be available on local storage.We found that if a PACS retrieved the most recent 30% of a patient’s pre-vious examinations into a short-term storage area before an outpatientappointment, there was a 91% probability that the required images wouldbe available on the server rather than in the long-term archive. Such a pre-fetch strategy is the digital and much less labor-intensive equivalent ofpulling film jackets in advance of outpatient visits and can be very effectivein optimizing radiologist and clinician workflow in the review of imagingstudies.
HANGING PROTOCOLS/DISPLAY
One of the more complex processes in reading conventional film was thearrangement of images from current and previous studies on a view box orfilm alternator. In a film-based department, radiologists typically functionedin one of two ways. In the first, the radiologist was responsible for taking anew study and finding comparison studies from a film jacket. Often, the filmlibrarian placed these outside the film jacket. The radiologist then took theseexaminations and arranged them on a series of view boxes. The radiologistthen found any relevant old reports, interpreted the study, took the filmsback down, and (with luck) placed them back into the correct film jacket. Inthe second mode, the study to be read was placed on a film alternator withany relevant films and reports. The competent film librarian learned howeach radiologist preferred to have his or her films arranged for specificstudies. Having the fileroom personnel arrange the films resulted inimproved workflow for the radiologists but required additional time and file-room staff. The hanging and removal of the studies also created delays inradiologist workflow, because the radiologist often had to wait for studies tobe hung, then taken down, and new studies to be put up. The general in-house criteria that determined how film would be placed on film alternatorsor view boxes were referred to as “hanging protocols” or “display protocols.”
A PACS softcopy workstation automates many of these manual work-flow steps, eliminating delays in the display of imaging studies. Hanging pro-
PACS: A Guide to the Digi tal Revolut ion104
DRE06 11/16/2005 9:36 AM Page 104

tocols can be executed much more rapidly and reliably and can be customizedto the specific demands of individual radiologists at a single workstation orany workstation across the enterprise. PACS hanging protocols can be rela-tively simple (new studies on the right, older ones on the left) or quitecomplex. The system can define, for all users or for specific radiologists orclinicians, specific rules that determine which previous studies, if any, areretrieved for comparison and precisely how current and prior studies are dis-played for interpretation. Images can be displayed, for example, in framemode, which closely emulates film (nine images on one monitor), or in stackmode (a series of images displayed sequentially, much like viewing anima-tion by flipping through a stack of cards). The need for these hanging pro-tocols is even greater with more complex examinations, such as a largethin-section CT dataset in which multiplanar, three-dimensional (3-D), ormaximum-intensity projection (MIP) views with variable slice thickness maybe selected for current and comparison study.
The PACS at the BVAMC uses a series of algorithms for display on amultimonitor workstation. These are known as default display protocols(DDPs). The use of the DDP, which can be toggled off or on, was found toresult in an increase in radiologist productivity of between 10% and 20%,depending on the imaging modality (Figure 6.2). In addition, radiologistsreported less fatigue subjectively with the use of the DDP in comparisonwith electronic but manual selection of prior studies to be retrieved andmanual (electronic) or nonintelligent placement of the images on the work-station. Reading times were also decreased somewhat by the reduced amountof time required to review previous reports. Using the PACS, previous
THE RADIOLOGIST’S PERSPECTIVE 105
FIGURE 6.2
Radiologist reading times for general radiography decreased by 10%using the default display protocol.
DRE06 11/16/2005 9:36 AM Page 105

reports are organized in chronological or another organized format to makereview of priors rapid and their relationships easily understood.
THE INTERPRETATION PROCESS
Radiologist image interpretation speed has been only one of a number offactors that have resulted in increased productivity, but the workflowimprovement that has been associated with PACS in this area has been sig-nificant. At the BVAMC, we found that radiologist reading times decreasedby 19% in the interpretation of portable chest radiographs from the inten-sive care unit (unpublished data). Another study performed at our facilitydemonstrated that radiologists were 8% faster in the interpretation of musculoskeletal radiographs using computer workstations and computedradiography in comparison with interpretation using conventional film. Sim-ilarly, radiologists were found to require 15% less time to interpret CTexaminations using a computer workstation than using film. This was, forthe most part, associated with the decreased amount of time required todisplay images, particularly in multiple window/level combinations. Theadvantage of softcopy interpretation over film for CT studies was evengreater for examinations in which there were previously performed CTexaminations for comparison. This increased speed of CT interpretation wasnot associated with any decrease in the accuracy of interpretation; in fact,accuracy increased to a statistically significant degree. Others have docu-mented similar decreases in total interpretation time.
WORKSTATION TOOLS
The retrieval of images to the workstation is only the first of several work-flow steps in the interpretation of an imaging study. To extract as much clin-ically useful information as possible from the images, a number of steps maybe helpful:
1. Images must be optimized with regard to window/level (bright-ness/contrast) settings. There is no optimal window/level for most images.Consequently, continuous dynamic adjustment of window/level settings isoften necessary for a conventional radiograph (such as a foot examination).Alternatively, certain presets may be used (as would be typical for a thoracicCT).
PACS: A Guide to the Digi tal Revolut ion106
DRE06 11/16/2005 9:36 AM Page 106

2. The method of image display and navigation must be chosen. Thesimplest of these is static softcopy interpretation, with images displayed onworkstations much as they would have been on view boxes. Frame mode isan example of this type of static mode in which images are displayed in amatrix similar to that typically printed to film. Stack mode displays imagessequentially in a single window in a movie- or cine-like format. Linked stackmode, a further enhancement that synchronizes multiple stacked imageswithin a single examination or across a current and one or more prior exam-inations, is increasingly available and utilized, although its value has not beenadequately documented in the literature. Most recently, volumetric naviga-tion of isotropic CT datasets permits review of images in any desired two-dimensional (2-D) or 3-D perspective, resulting in a separation of themanner in which images were acquired (the axial plane for CT, for example)from the way in which they are reviewed.
3. Images and portions of images can be zoomed or magnified.4. Images can be viewed using MIP, which has been documented to be
useful in the evaluation of blood vessels and lung nodules.5. Thin-section images can be combined arithmetically to create a
user-selected slice thickness that is a multiple of that reconstructed by theacquisition device.
6. Images can be arranged in a logical format to make it as easy as pos-sible to compare various sequences (e.g., enhanced vs. unenhanced, or T1vs. T2 vs. contrast-enhanced MR images) and to compare a current studywith comparable images from a previous study.
7. Images can also be enhanced with tools, such as edge enhancement,smoothing or interpolation algorithms that “smooth” the image to give it aless boxy or “pixely” appearance, or those that enhance the ability to displaya wide range of contrast on an 8-bit monitor or film.
8. Images can also be processed using more sophisticated techniquesto achieve spatial frequency and image contrast optimization.
9. Additional tools can be implemented to aid in decision support,including computer-aided detection tools that have been successfully appliedin mammography and in the detection of lung nodules on CT or conven-tional chest radiography.
Each of these steps depends to some degree on the preferences of the radi-ologist and on the demands of the specific study and modality. For manyradiologists, both experienced and in training, one of the greatest currentchallenges is in identifying these preferences as the range of choices expands
THE RADIOLOGIST’S PERSPECTIVE 107
DRE06 11/16/2005 9:36 AM Page 107

and technology evolves. The “intelligent” workstation and the PACS thatsupports it not only must be ready to customize different combinations ofworkstation tools to suit each user but must be configured to seamlessly inte-grate new software that enhances the interpretation process.
Current PACS workstations vary tremendously in the success of theirgraphical user interface and in the number of steps required to utilize theseand other tools. Most workstations do a relatively poor job of optimizingradiologist workflow. The best of these workstations have a relatively simple(elegant) graphical user interface and require a minimum number of key-strokes and steps to retrieve, optimize, compare, and remove a study, andthen proceed to the next imaging study. As the PACS industry continues todevelop and mature, vendors are spending an increasing amount of timeobtaining feedback and performing studies of radiologist workflow in theinterpretation of imaging studies, which has resulted and will continue toresult in improvements in the radiologist-machine interface.
We have found that the use of workstation tools by radiologists changeswith increasing experience with the system. Radiologists have a tendency touse tools such as image zoom and magnification less frequently as they gainadditional experience with the workstation. However, we have found thateven experienced radiologists utilize the window/level adjustments in themajority of cases.
WORKFLOW TOOLS TO COPE WITH IMAGE OVERLOAD
The use of volumetric navigation has been accelerated by the rapid transi-tion to the use of multidetector CT scanners. Radiologists around the worldare finding other interpretation routines inadequate for the large numbersof images generated from these systems. A routine CT of the thorax usinga multidetector system can generate 30 sheets of film each for lung, media-stinum, and liver settings. Even stack mode is inadequate for review of the300 to 500 images acquired for a routine CT of the chest or the abdomenand pelvis and is even more so for the 1500 to 2000 images acquired for aCT angiography “runoff” study.
Several strategies are being investigated for dealing with this imageoverload. The most common is to acquire images using a multidetectorscanner using thin-collimation and then reconstruct the images that are sentto the PACS using much thicker (e.g., 5- or 8-mm) sections, resulting in a3- to 10-fold reduction in the number of images sent to the PACS. Addi-tional reconstructions or renderings can then be performed by the technol-ogists using a dedicated CT workstation. Unfortunately, this approach is
PACS: A Guide to the Digi tal Revolut ion108
DRE06 11/16/2005 9:36 AM Page 108

unsatisfactory. It requires a large amount of additional technologist time,especially for angiographic rendering, analogous to the extra time requiredfor technologists to produce films in multiple window/level settings. Becauseof the complexity and time required, technologists only perform this ren-dering in a small percentage of cases. In addition, the reconstructed imagesunnecessarily take up a good deal of archival, network, and workstationmemory space.
Radiologists should have flexibility from case to case to determinewhether the images should be reviewed in the sagittal, coronal, or obliqueplanes or using a 3-D perspective. Volumetric navigation frees the radiolo-gist from the limitations of fixed-slice axial images. An image of the spine,for example, can be rapidly and interactively rendered and reviewed as asagittal or coronal dataset at any desired slice thickness. The viewing per-spective can be determined by the area being examined and the clinicalhistory. The pulmonary arteries, for example, can be reviewed using rela-tively thick-slice coronal or oblique perspectives, with or without the use ofMIP rendering. The colon, in our experience, is best depicted in the coronalplane, whereas the liver and spleen may be examples of organs best reviewedin the axial plane but may be improved with the use of MIPs. The vascula-ture of the thorax, abdomen, pelvis, and other areas may be optimally dis-played according to their orientation within the body and are also probablybest rendered as MIP images.
Although volumetric navigation has tremendous potential, it posessome unique and daunting challenges as well, especially the concern that we might be trading image volume overload for clinical image content over-load. Our abdominal and thoracic subspecialists have asked whether they are now responsible for detailed reports of the musculoskeletal system andspine and of the individual vessels now visualized on a routine body CTstudy. Should they specifically and routinely comment, for example, on therenal arteries, aortic and iliac arteries, or superior and inferior mesentericarteries? What are the implications of this on the time required to dictate astudy?
Perhaps the biggest barrier to the transition to the use of volumetricnavigation has been the lack of integration of this capability in the currentgeneration of PACS workstations. It is not practical for a radiologist inter-preting a study using a PACS workstation to walk over to a dedicated 3-D/multiplanar workstation for each case. Another challenge is the fact thatimage navigation is typically not a linear, sequential process like review of aset of axial images but may be performed in a more haphazard fashion, witha radiologist reviewing a portion of a dataset in one plane and other portionsusing other views, which could result in portions of a dataset not beingreviewed at all.
THE RADIOLOGIST’S PERSPECTIVE 109
DRE06 11/16/2005 9:36 AM Page 109
The transformation of the radiology interpretation process will con-tinue at a rapid pace. Although image navigation and enhancement will con-tinue to improve (including better support for multimodality fusion such aspositron emission tomography [PET]/CT), the next major phases will focuson decision support tools such as computer-assisted diagnosis (CAD) andcuing and intelligent applications of informatics. Computer-assisted cuingmay take many forms, including an overlay in which microcalcifications arecircled on a mammogram and lung nodules appear in a color that indicatestheir probability of malignancy. CAD programs will come into routine usein the next few years, especially in the detection of lung nodules and breastcancers. Clinical information from the electronic medical record, results ofprevious examinations, and clinical and imaging expert systems will be uti-lized to optimize image navigation, computer cuing, and CAD programs andto suggest diagnostic possibilities. Comparison with large computerized ref-erence image datasets may also be utilized routinely by radiologists to facil-itate more rapid and accurate diagnoses. These future additions to thearmamentarium of the radiologist will also create additional challenges thatwill undoubtedly require the creativity and expertise of the medical imagingcommunity.
CHANGING THE REPORTING PARADIGM
SPEECH RECOGNITION
The interactive workstation has facilitated one of the most obvious changesin radiologist workflow over the last decade: the way in which radiologyreports are generated, reviewed, and relayed to the referring physician andto the medical record. Machine dictation of radiology reports and subse-quent manual transcription were among the first “automated” elements inthe radiology workflow. At the same time, manual transcription accountedfor the main time lag between image acquisition and delivery of interpreta-tion results to referring clinicians. As early as the 1980s, radiologists wereconsidering the possibility that speech recognition techniques might beincorporated into the reporting process.
In the intervening 2 decades, speech recognition (sometimes misiden-tified as voice recognition) has become an integral part of the radiologyworkflow, with many institutions eliminating medical transcription positionsentirely. Speech recognition has been investigated more closely than almostany area of digitalization for two reasons: it affects every imaging specialist,
PACS: A Guide to the Digi tal Revolut ion110
DRE06 11/16/2005 9:36 AM Page 110

across modalities and subspecializations, and it has often been a “hard sell”to the radiologists who (in theory) would benefit most from its implemen-tation. The literature on speech recognition is voluminous, with manyreports of benefits in decreased needs for auxiliary staff, money savings, andtime savings in turning around reports for delivery to physicians who orderedstudies.
The process of acceptance of speech recognition technologies by radi-ologists has not been smooth. In part, this was because it was unfamiliar.More important, many radiologists perceived speech recognition reportingto be more difficult, more time consuming, and part of a slippery slope thatseemed to be taking clerical tasks out of the hands of paid assistants andturning them into routine parts of the professional interpretation and report-ing process. (They were, of course, correct in the last of these assumptions.)Efforts by vendors to simplify enrollment (the process by which an individ-ual imprints his or her speech patterns on the system), increased use of reporttemplates, well-executed training, and the introduction of innovative time-saving features have served to win over many who originally opposed theintroduction of speech recognition. Advantages in report turnaround times,the ability to correct and redact reports at the time of dictation or subse-quent time of choice, access to the report through the PACS from anywherein the medical enterprise, and a tendency toward the production of shorter,more organized reports have bolstered support for speech recognitionamong radiologists. For those who use speech recognition in combinationwith structured reporting technologies, real-time savings and workflowadvantages are being realized.
STRUCTURED REPORTING
Structured reporting is not new. Since the first “roentgenology” reports inthe late 19th century, imaging specialists have sought to simplify their workby eliminating unnecessary duplication from report to report. In the earli-est days, there were fill-in-the-blank reporting forms. Later, radiologists readfrom templates as part of dictated reports, filling in the specific informationfor each patient. Today, templates and macros integrated into the electronicradiology reporting process allow each radiologist to customize routinereporting and enter large sections of reports using only a few keystrokes.Moreover, templates can be used in “batch mode” for high-volume studyreporting.
THE RADIOLOGIST’S PERSPECTIVE 111
DRE06 11/16/2005 9:36 AM Page 111

Structured reporting is now being combined with other workstationinterpretation tools to yield what some have called the radiology report ofthe future: a multimedia package that includes not only the traditional reportbut embedded annotated images, lists of and links to additional informationaland visual resources, and cues and guidance provided by computer-aideddecision support strategies. The possibilities for entirely transforming boththe radiology reporting process as well as elevating the level of content inreports are truly exciting. The challenge will lie in exploring these possibil-ities in ways that enhance rather than add to the work of the radiologist.
THE EFFECT OF CHANGED RADIOLOGISTWORKFLOW ON ENTERPRISE INTERACTIONS
REFERRING PHYSICIANS AND CLINICIANS
The transition to filmless operation at the BVAMC was associated with an82% reduction in in-person consultation rates in general radiography and a44% reduction for the cross-sectional imaging section, despite an increasein the volume of studies (Figure 6.3). This decrease in the general radio-graphy consultation rate from 13% (pre-PACS) to 2.4% was greater than wehad anticipated. The ability of clinicians to remain in patient care areas andnot make time-consuming trips to the radiology department has significantlychanged their workflow as well. The direct consultation process has been
PACS: A Guide to the Digi tal Revolut ion112
FIGURE 6.3
The advent of PACS and image distribution throughout the enter-prise brought an 82% reduction in clinical consultations on generalradiology cases.
DRE06 11/16/2005 9:36 AM Page 112

transformed into an electronic process that relies to a greater extent ondigital annotation of images viewed at workstations, access to digital dicta-tions over the telephone, and increased use of e-mail and physician alertsavailable in the EMR.
The increased frequency of image review by physicians at our institu-tion was associated with an unexpected increase in radiology utilization ratesand, perhaps ironically, in a consequent increase in overall radiology work-load. The number of studies ordered per patient admission at our institu-tion increased by 43% after the implementation of digital distribution ofimages and reports, compared with a 0% increase for the rest of the VA hos-pitals throughout the country during the same period. Outpatient utilizationat our institution increased by 21% during the same period, while nationalVA outpatient utilization decreased.
Clinicians adjusted with great alacrity to decreased report turnaroundtimes after radiologists began reading studies within a few minutes of acqui-sition and came to expect these accelerated turnarounds as a part of radiol-ogy department services. Ninety-eight percent of clinicians surveyed at theBVAMC indicated that the use of the PACS contributed to more effectiveuse of their time. This was largely due to the improved access to current andprevious imaging studies and convenient availability of access to these imagesin patient care areas. Clinicians indicated that they accessed the PACS 3 to5 times per day, with 22% accessing the system more often. The averageestimate of the amount of time saved because of the PACS, according to cli-nician surveys, was approximately 50 minutes, suggesting that the systemsubstantially enhanced their workflow. In some institutions, clinicians cannow access the digital dictation system by phone for radiology reports as wellas read near real-time reports distributed after speech recognition sign-offon the PACS.
A not inconsiderable amount of concern has been expressed (for themost part in editorials and not in data-driven studies of the problem) aboutthe result of the changed radiologist workflow and output on the quality ofinteraction with clinicians. It is true that the number of face-to-face inter-actions over specific cases has been greatly diminished in the all-digital radi-ology department. However, other technological innovations may be servingto compensate for what some perceive as the radiologist’s diminished pres-ence in the diagnostic and treatment equation. For example, radiologists aremuch more likely to use the telephone to discuss urgent findings, such as apneumothorax in the intensive care unit (ICU), than before the transition tofilmless operation. This is because the decreased time between study acqui-sition and review makes it much more likely that the radiologist will be thefirst to review the images. Thus, many clinicians are receiving real-time
THE RADIOLOGIST’S PERSPECTIVE 113
DRE06 11/16/2005 9:36 AM Page 113

reports from their colleagues in radiology about their most urgent and/orproblematic cases.
Moreover, in a reversal of the old consultation pattern that had the cli-nician coming to the radiologist, the radiology department is now, in effect,distributing itself throughout the enterprise for immediate access to a widerange of practitioners. PACS workstations with integrated access to the RISin surgical suites, ICUs, emergency departments, and satellite clinics haveeliminated an entire segment of routing workflow and put the results of theradiologist’s work at the immediate service of the clinician where he or sheneeds it most. DeSimone et al. evaluated the impact of PACS on clinicalpractice in the ICU setting and showed statistically significant reductions intime to perform clinical actions after the diagnostic examination. UsingPACS, significant alterations were demonstrated in the processes of obtain-ing radiologic information, viewing exams, and consulting between ICUphysicians and radiologists. The results of the study suggest that a PACS hasa major effect on both patient management and radiology department work-flow in the ICU setting.
One example of this improved workflow has been in the communica-tion of abnormal findings by emergency room (ER) or emergency depart-ment physicians. One study reported that even in a non-PACS environment,the introduction of a single workstation in the ER reduced time to deliveryof the radiology report from an average of 40 to 16 minutes by eliminatingprinting and transport. One of the challenges in a paperless and filmless envi-ronment has been the communication of preliminary impressions of ERphysicians to radiologists. This has been addressed at our institution bygiving the ER clinicians the ability to view a field on their workstation thatallows them to determine whether a study has been interpreted by a radiol-ogist. For those studies that have not yet been dictated by a radiologist (aminority during the working day) by the time the ER physician reviews theimaging study, the ER physician can type a preliminary impression directlyinto the PACS electronic display in the section that lists the reason for thestudy. The radiologist is then able to alert the ER physicians when there isa discrepancy between their preliminary impressions and the radiologist’sinterpretation of the images.
These advantages, when combined with the incremental positive effectsof collegial e-mails, voice mails, augmented teaching sessions and confer-ences, and the generally increased utilization of a growing number of dif-ferent imaging services, suggest that the benefits of digital imaging willenhance rather than detract from the radiologist’s standing in the largermedical enterprise.
PACS: A Guide to the Digi tal Revolut ion114
DRE06 11/16/2005 9:36 AM Page 114
WORKFLOW AND MULTI- INSTITUTIONAL PACS
The market forces that have created the strong impetus to increase efficiencyand productivity have also fostered the formation of imaging networks inwhich large radiology groups provide imaging services for multiple facilities.This can result in substantial savings by taking advantage of centralizedadministration, scheduling, and staffing and economies of scale in supplies,furniture, and even imaging apparatus. However, imaging networks posechallenges that include issues related to distance, different equipment andinformation systems, communications, and personnel with different “cul-tures” and a variety of approaches to the departmental operation. Optimiz-ing RIS and PACS workflow management can be difficult across such adisparate landscape but carries with it a number of long- and short-term ben-efits. Radiology coverage and subspecialty expertise can be shared acrossmultiple hospitals. This has been particularly helpful in situations in whichone or more radiologists provide overnight coverage for multiple facilities.The ability of a single radiologist to provide network coverage across mul-tiple facilities has been a major impetus for many radiology groups to installteleradiology systems or PACS. Such efforts have their own difficulties intracking multiple patient identification systems, interfacing adequately with several vendors, and dealing with communications problems betweenhospitals with different systems. Despite these challenges, the potentialworkflow advantages of a multifacility shared or complete virtual radiologydepartment are tremendous, both to the radiology department and to theclinician. The potential to share the radiology caseload in a more effectivemanner made possible by PACS in a single institution is even greater in a wide area networked virtual department, particularly with regard to sub-specialty expertise. The ability to access images obtained at other institutionswithin the network can eliminate many of the delays associated with filmtransportation as well as decrease the number of unnecessarily repeatedexaminations.
In the VA Maryland HealthCare System, the transition to a wide areanetwork virtual radiology department has resulted in savings of approxi-mately $800,000 to $1,000,000 per year, largely in personnel costs. Thenetwork is set up in a hub-and-spoke configuration in which images are sent to Baltimore for storage on the VA Baltimore commercial PACS andare then made available throughout the healthcare network. This hub-and-spoke configuration is also used for the HIS and RIS, resulting in theneed for a central computer system in Baltimore and reliable high-speed networks connecting the facilities. This “central” architecture for the PACS
THE RADIOLOGIST’S PERSPECTIVE 115
DRE06 11/16/2005 9:36 AM Page 115

has been successful in our environment, with four facilities connected to theBVAMC.
Perhaps the biggest challenge with regard to integration of multiplehealthcare facilities is the need to have a common, agreed-on method forexchange of patient images and other patient information. Recent federalgovernment mandates in the United States have hastened efforts to codifystandards that would make processes such as patient identification, modalityworklists, and management of image interpretation automated in a multi-vendor, multi-HIS-RIS hospital system or between two or more healthcaresystems. At the same time, such improved communication is under newrestrictions designed to protect patient privacy. The IHE initiative is at theforefront of efforts to bring modality imaging vendors to the table with bothRIS and HIS vendors to formulate solutions to these challenges. True inte-gration across one or multiple healthcare enterprises is a much more prac-tical and easily achievable goal than it seemed only a few years ago.
THE READING ROOM ENVIRONMENT AND WORKFLOW
One of the more hotly debated issues with regard to optimization of radiol-ogist reading performance and workflow has been the question of theoptimal number of monitors that are required when using a PACS worksta-tion for various modalities such as computed radiography, CT, MR, sonog-raphy, and so on. This is particularly important given the substantial expenseof these monitors and the high percentage of the total workstation cost associated with the number of monitors. At the BVAMC, we performed aprospective study of the impact on radiologist performance and levels offatigue as a function of the number of monitors. We found an approximately25% increase in radiologist reading speed for a 4-monitor in comparisonwith a 1-monitor workstation in the interpretation of portable chest radi-ographs performed using computed radiography when we took into accountthe number of prior studies reviewed. Interestingly, there was a decrease inthe number of historical studies reviewed as the number of monitorsdecreased. There was very little difference in the amount of time requiredto read the studies when comparing a 2- with a 4-monitor workstation, andthe largest increase in performance was seen between a 1- and a 2-monitorworkstation. Although we have not yet performed this study, our expecta-tion would be that the use of stack mode for CT and MR studies would sub-stantially decrease the added value of 4- or even 2-monitor workstations forthe interpretation of these studies. Anecdotally, this seems to be particularly
PACS: A Guide to the Digi tal Revolut ion116
DRE06 11/16/2005 9:36 AM Page 116
true when the workstation permits images from multiple examinations to belinked according to anatomic section, which facilitates easy comparison ofcurrent and previous cross-sectional images.
The number of monitors is only one factor in designing an ideal radi-ology reading room, a goal that has only recently been appreciated as apotential contributor to improvements in radiology workflow. Despite tran-sitioning to filmless or almost-filmless imaging, most institutions maintainedwithout question the traditional configuration of the film reading room. And,given the extensive attention that has been paid to PACS monitors and work-stations, surprisingly little attention has been paid to the radiologist (and cli-nician) reading room environment. Our research at the BVAMC hasindicated that a number of factors, including monitor and ambient roomlighting levels, among others, play a critical role in radiologist productivityand fatigue. We found that radiologist performance decreases significantlyand that fatigue increases as monitor brightness drops or as ambient roomlighting increases.
Several research laboratories have now documented the importance ofadditional factors, such as workstation chair design, the availability of indi-vidual lighting and temperature controls, and room acoustics, on radiologistperformance and fatigue. Architects, who have responsibility for designingworkplace environments, have also recognized the vital role of workstationergonomics.
AUDITING THE RADIOLOGIST WORKFLOW PROCESS
Every imaging department, regardless of the quality of staff, integrity of find-ings, or excellence of technical facilities, shares a usually unspoken secret:their way of doing radiologic work evolved over time and without a com-prehensive workflow design strategy. Even the most carefully planned of all-digital departments still contain elements of workflow that are purelyvestigial. With the rapid turnover of technology and personnel, potentialworkflow improvements are available to every department and could notonly realize time and money benefits but enhance patient outcomes andquality-of-work issues for both radiologists and technologists. The problem,of course, is in identifying areas of potential improvement before the nextround of change brings in new variables.
The digitalization of the entire acquisition, processing, reading, report-ing, and archiving process in radiology presents extraordinary opportunitiesfor quantifiable study. Some variables are easily extracted from the informa-
THE RADIOLOGIST’S PERSPECTIVE 117
DRE06 11/16/2005 9:36 AM Page 117

tion technology record (speech recognition dictation and correction times,for example), whereas others require more definition (such as reports on howmany times a radiologist looks at a specific type of image and/or refers toothers).
Radiologist workflow cannot be studied without adequate tools tomeasure performance (including the use of workstation tools of all types),accuracy, comfort, fatigue, and satisfaction. We have recently worked withindustry to extend error logging tools built into workstation software intomore comprehensive workstation “audits” that generate very large amountsof data (approximately 50 pages per minute) and have used these to producedetailed analyses of radiologist interpretation workflow. These audit data-bases constitute as yet untapped gold mines of fascinating data and shouldlead to new insights into the ways in which radiologists utilize conventionaland multiplanar 3-D workstations in rendering routine diagnoses. Thesetypes of investigations should provide the data that will drive future work-station enhancement and influence the next generation of intelligent (or lessdumb) workstations that analyze each radiologist’s interpretation habits andthen adapt responses to help the radiologist achieve enhanced efficiency andaccuracy.
CONCLUSION
The most frightening and most promising word that currently defines radi-ologist workflow is “more”: more images generated from more modalities tobe read at a faster pace, more tools that support image processing and report-ing, more ways to shape interactions with others in the medical enterprise,and more possibilities to enhance diagnostic capabilities and the well-beingof patients. The problem, of course, is that there are no more hours in theday.
The importance of an understanding of workflow for RIS and PACSvendors has resulted in substantial improvements in the development ofintelligent software and use of integration with other information systems.This trend will undoubtedly continue. Universal adoption of integrationprotocols such as the IHE and standards such as DICOM and HL7 will con-tinue the trend toward the elimination of paper and will result in furtherreductions in the number of steps in the flow of information to and from theimaging department. Computer-assisted detection will provide both a pre-screen and a double-read for radiologists in the interpretation of a muchwider array of imaging studies. Workstation innovations will continue toimprove on the ways in which radiologists can access and compare current
PACS: A Guide to the Digi tal Revolut ion118
DRE06 11/16/2005 9:36 AM Page 118

and previous examinations and will permit a greater degree of interactivitywith the images themselves. New strategies will doubtless be offered fordealing with increasing datasets.
The challenge, of course, is to be able to incorporate such new strate-gies into existing PACS configurations and to evaluate their utility in bothworkflow benefits and diagnostic outcomes. PACS are well beyond the “earlyadopters” phase and have become an integral part of all aspects of radiologyworkflow. In the process, the pace and nature of the radiologist’s work haschanged profoundly, and we are only now beginning to investigate the effectsof these changes and the ways in which future change may continue to altertraining, practice, and workflow.
◗ REFERENCES
Andriole KP, Avrin DE, Yin L, Gould RG, Luth DM, Arenson RL. Relevant priorsprefetching algorithm performance for a picture archiving and communicationsystem. J Digit Imaging. 2000;13(2 suppl 1):73–75.
Andriole KP, Morin RL, Arenson RL, et al. Transforming the radiological interpre-tation process: the SCAR TRIP initiative. Proc SPIE Med Imaging. 2004;5371:1–7.
Bennett WF, Vaswani KK, Mendiola JA, Spigos DG. PACS monitors: an evolutionof radiologists’ viewing techniques. J Digit Imaging. 2002;15(suppl 1):171–174.
Boochever SS. HIS/RIS/PACS integration: getting to the gold standard. RadiolManage. 2004;26:16–24.
Cavanaugh BJ, Garland HT, Hayes BL. Updating legacy systems for the Integrat-ing the Healthcare Enterprise (IHE) initiative. J Digit Imaging. 2000;13(2 suppl1):180–182.
Dackiewicz D, Bergsneider C, Piraino D. Impact of digital radiography on clinicalworkflow and patient satisfaction. J Digit Imaging. 2000;13(2 suppl 1):200–201.
DeSimone DN, Kundel HL, Arenson RL, et al. Effect of a digital imaging networkon physician behavior in an intensive care unit. Radiology. 1988;149:4–44.
Donnelly JT, Anderson Q. Automating clinically relevant prefetch processes inpicture archiving and communication systems solutions. J Digit Imaging.2001;14(2 suppl 1):135–139.
Gale B, Safriel Y, Lukban A, Kalowitz J, Fleischer J, Gordon D. Radiology reportproduction times: voice recognition vs. transcription. Radiol Manage. 2001;23:18–22.
Gale ME, Gale DR. Modality worklist. An essential component in a PACS envi-ronment. J Digit Imaging. 2000;13:102–108.
THE RADIOLOGIST’S PERSPECTIVE 119
DRE06 11/16/2005 9:36 AM Page 119

Gay SB, Sobel AH, Young LQ, Dwyer SJ III. Processes involved in reading imagingstudies: workflow analysis and implications for workstation development. J Digit Imaging. 2002;15:171–177.
Ghosh S, Andriole KP, Avrin DE. Viewport: an object-oriented approach to inte-grate workstation software for tile and stack mode display. J Digit Imaging.1997;10(3 suppl 1):177–179.
Graf B, Mendenhall R, Suero M, Wiggins R. Study status consistency and duplicate-read protection in a distributed architecture. J Digit Imaging. 2001;14(2 suppl 1):60–62.
Gross-Fengels W, Miedeck C, Siemens P, et al. PACS from project to reality. Reportof experiences on full digitalization of the radiology department of a major hos-pital. Radiologe. 2002;42:119–124.
Hayt DB, Alexander S. The pros and cons of implementing PACS and speech recog-nition systems. J Digit Imaging. 2001;14:149–157.
Hirschorn D, Eber C, Samuels P, Gujrathi S, Baker SR. Filmless in New Jersey: theNew Jersey Medical School PACS Project. J Digit Imaging. 2002;15(suppl 1):7–12.
Hirschorn DS, Hinrichs CR, Gordon, M, Shah K, Visvikis G. Impact of a diagnos-tic workstation on workflow in the emergency department at a level I traumacenter. J Digit Imaging. 2001;14(2 suppl 1):199–201.
Horii S, in Reiner BI, Siegel EL. The cutting edge: strategies to enhance radiolo-gist workflow in a filmless/paperless imaging department. J Digit Imaging.2002;15:178–190.
Jager D, Kotter E, Langer M. RIS modality interfaces. From proprietary solu-tions to DICOM worklist management [in German]. Radiologe. 1999;39:286–291.
Junck KL, Berland LL, Bernreuter WK, et al. PACS and CR implementation in alevel I trauma center emergency department. J Digit Imaging. 1998;11(3 suppl1):159–162.
Kim Y, Fahy JB, DeSoto LA, et al. Development of a PC-based radiological imagingworkstation. J Digit Imaging. 2003;16(1):104–113.
Krupinski EA, Radvany M, Levy A, et al. Enhanced visualization processing: effecton workflow. Acad Radiol. 2001;8:1127–1133.
Kuzmak PM, Dayhoff RE. Experience with DICOM for the clinical specialties inthe healthcare enterprise. Proc SPIE Med Image. 2003;5033:18–29.
Langer HL, Bielmeier J, Wittenberg G, Selbach R, Feustel H. Workflow improve-ment and efficiency gain with near total digitization of a radiology department[in German]. Rofo Fortschr Geb Rontgenstr Neuen Bildgeb Verfahr. 2003;175:1309–1316.
Langer S. Impact of tightly coupled PACS/speech recognition on report turnaroundtime in the radiology department. J Digit Imaging. 2002;15(suppl):234–236.
PACS: A Guide to the Digi tal Revolut ion120
DRE06 11/16/2005 9:36 AM Page 120

Langer S. OpenRIMS: an open architecture radiology informatics managementsystem. J Digit Imaging. 2002;15:91–97.
Langer S. Radiology speech recognition: workflow, integration, and productivityissues. Curr Probl Diagn Radiol. 2002;31:95–104.
Locko RC, Blume H, Goble JC. Enterprise-wide worklist management. J DigitImaging. 2002;15(suppl 1):175–179.
Mack S, Holstein J, Kleber K, Gronemeyer DH. New aspects of image distributionand workflow in radiology. J Digit Imaging. 2000;13(2 suppl 1):17–21.
May GA, Deer DD, Dackiewicz D. Impact of digital radiography on clinical work-flow. J Digit Imaging. 2000;13(2 suppl 1):76–78.
Moise A, Atkins S. Interaction techniques for radiology workstations: impact onusers’ productivity. Proc SPIE Med Imaging. 2004;5371:16–22.
Moore SM. Using the IHE scheduled workflow integration profile to drive modal-ity efficiency. RadioGraphics. 2003;23:523–529.
Morioka CA, Valentino DJ, Duckwiler G, et al. Disease-specific intelligent pre-fetchand hanging protocol for diagnostic neuroradiology workstations. Proc AMIASymp. 2001;468–472.
Mulvaney J. The case for RIS/PACS integration. Radiol Manage. 2002;24:24–29.Nagy P, Siegel E, Hanson T, Kreiner L, Johnson K, Reiner B. PACS reading room
design. Semin Roentgenol. 2003;38:244–255.Offenmueller W. Managed workflow between HIS, RIS, modalities, and PACS: now
with DICOM or beyond? Proc SPIE Med Imaging. 1996;2711:144–155.Okura Y, Matsumura Y, Harauchi H, et al. An inductive method for automatic
generation of referring physician prefetch rules for PACS. J Digit Imaging.2002;15:226–231.
Oosterwijk H. DICOM vs. HL7 for modality interfacing. J Digit Imaging. 1998;11(3 suppl 1):39–41.
Page D. Voice recognition saves time, money, but rads resist it. Diagn Imaging.2000;22:6–7.
Redfern RO, Horii SC, Feingold E, Kundl HL. Radiology workflow and patientvolume: effect of picture archiving and communication systems on technologistsand radiologists. J Digit Imaging. 2000;13(2 suppl 1):97–100.
Reiner BI, Siegel EL. Effect of filmless imaging on the utilization of radiologist ser-vices. Radiology. 2000;215:163–167.
Reiner BI, Siegel EL. The cutting edge: strategies to enhance radiologist workflowin a filmless/paperless imaging department. J Digit Imaging. 2002;15:178–190.
Reiner BI, Siegel EL. Evolution of the digital revolution: a radiologist perspective.J Digit Imaging. 2003;16:324–330.
Reiner BI, Siegel EL, Carrino JA. Workflow optimization: current trends and futuredirections. J Digit Imaging. 2002;15:141–152.
THE RADIOLOGIST’S PERSPECTIVE 121
DRE06 11/16/2005 9:36 AM Page 121

Reiner BI, Siegel EL, Hooper FJ. Accuracy of interpretation of CT scans: compar-ing PACS monitor displays and hard-copy images. AJR Am J Roentgenol.2002;179:1407–1410.
Reiner BI, Siegel EL, Protopapas Z. The impact of filmless radiology on the fre-quency of clinician consultation with radiologists. Am J Radiol. 1999;173:169–172.
Reiner BI, Siegel EL, Shastri K. The future of radiology reporting. In: Reiner BI,Siegel EL, Weiss DL, eds. Electronic Reporting in the Digital Medical Enterprise.Great Falls, VA: Society for Computer Applications in Radiology; 2003:83–104.
Reiner BI, Siegel EL, Weiss DL, eds. Introduction: the evolution of the radiologyreport and the development of speech recognition. In: Electronic Reporting in theDigital Medical Enterprise. Great Falls, VA: Society for Computer Applicationsin Radiology; 2003:1–7.
Reiner B, Siegel E, Kuzmak P, Severance S. Transmission failure rate for computedtomography examinations in a filmless imaging department. J Digit Imaging.2000;13(2 suppl 1):79–82.
Robbins AH, Horowitz DM, Srinivasan MK, et al. Speech-controlled generation ofradiology reports. Radiology. 1987;162:569–573.
Roos JE, Desbiolles LM, Willmann JK, et al. Multidetector-row helical CT: analy-sis of time management and workflow. Eur Radiol. 2002;12:680–685.
Rosenthal DR, Chew FS, Dupuy DE, et al. Computer-based speech recognition asa replacement for medical transcription. AJR Am J Roentgenol. 1998;170:23–25.
Rostenberg B. The Architecture of Imaging. Chicago, IL: American Hospital Publish-ing Inc; 2002:173–181.
Rostenberg B. Reading rooms should be designed to accommodate future changes.Diagn Imaging. 2002;24:11–15.
Siegel EL, Reiner BI. Recommendations for image prefetch for film digitizationstrategy based on an analysis of an historic radiology image database. J DigitImaging. 1998;11:94–99.
Siegel E, Reiner B. Filmless radiology at the Baltimore VA Medical Center: a 9 yearretrospective. Comput Med Imaging Graph. 2003;27:101–109.
Siegel EL, Reiner BI. Digital Eye for the Analog Guy [film]. Waukesha, WI: GEMedical; 2004.
Siegel EL, Diaconis JN, Pomerantz S, et al. Making filmless radiology work. J DigitImaging. 1995;8:151–155.
Sistrom CL, Honeyman-Buck JC. Template and macro management for a radiologyspeech recognition system. In: Reiner BI, Siegel EL, Weiss DL, eds. ElectronicReporting in the Digital Medical Enterprise. Great Falls, VA: Society for ComputerApplications in Radiology; 2003:73–82.
Thomas MA, Rowberg AH, Langer SG, et al. Interactive image enhancement of CRand DR images. J Digit Imaging. 2004;17(3):189–195.
PACS: A Guide to the Digi tal Revolut ion122
DRE06 11/16/2005 9:36 AM Page 122

Walter LeRoy Thompson Collection. Archives of the American College of Radiol-ogy. Reston, VA. Accessed April 1996.
Weiss DL. A users guide to speech recognition technology. Decis Imaging Econ.2001;14:32–34.
Weiss DL. Speech recognition technology improves workflow efficiency. DiagnImaging. 2002;24:48–51.
Weiss DL. Speech recognition: evaluation, planning, installation, and use: purchas-ing a speech recognition system. In: Reiner BI, Siegel EL, Weiss DL, eds. Elec-tronic Reporting in the Digital Medical Enterprise. Great Falls, VA: Society forComputer Applications in Radiology; 2003:27–42.
Yoshimura H, Inoue Y, Tanaka H, et al. Operating data and unsolved problems ofthe DICOM modality worklist: an indispensible tool in an electronic archivingenvironment. Radiat Med. 2003;21:68–73.
THE RADIOLOGIST’S PERSPECTIVE 123
DRE06 11/16/2005 9:36 AM Page 123
FINANCIALMODELING
SYRENE R. REILLY • DAVID AVRIN
This chapter provides an overview of the financial concepts and tools thatare useful in the financial evaluation of picture archiving and communi-
cation systems (PACS). The first section discusses various analysis methodsand makes a case for using net present value (NPV) methodology. Thesecond section looks at the major cost elements that should be consideredand quantified. The third section explores the cost-saving opportunities andnonfinancial benefits of implementing PACS. These three sections shouldhelp you on your path to justifying PACS financially.
ANALYSIS METHODS
There are numerous ways to evaluate a capital investment such as PACS. Itis worthwhile to understand all of them and to determine which methodsare most widely used and respected at your organization, especially by those with decision rights. It is often helpful to use several methods, as eachprovides a different lens through which you can analyze your investmentopportunity. Different methods appeal to different constituencies. The
7CHAPTER
DRE07 11/16/2005 9:37 AM Page 125
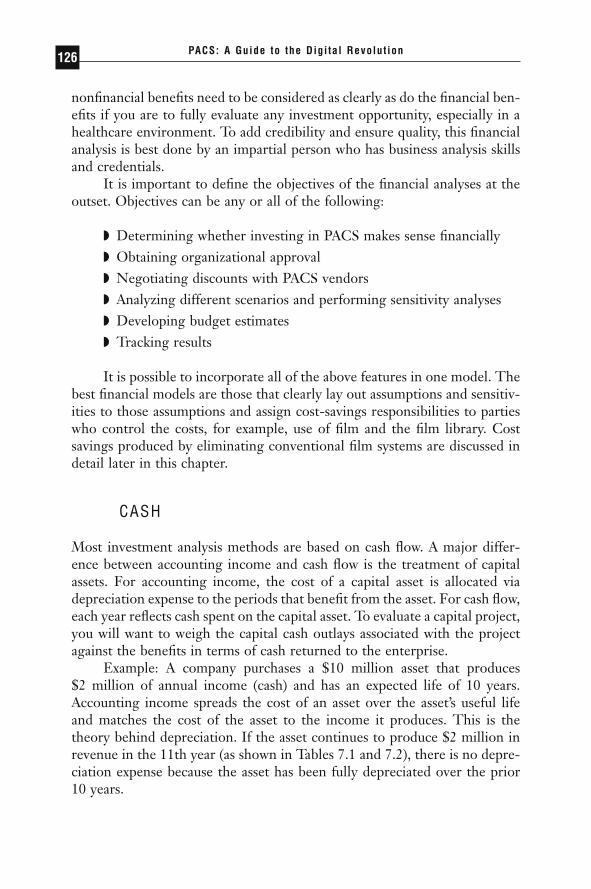
nonfinancial benefits need to be considered as clearly as do the financial ben-efits if you are to fully evaluate any investment opportunity, especially in ahealthcare environment. To add credibility and ensure quality, this financialanalysis is best done by an impartial person who has business analysis skillsand credentials.
It is important to define the objectives of the financial analyses at theoutset. Objectives can be any or all of the following:
◗ Determining whether investing in PACS makes sense financially◗ Obtaining organizational approval◗ Negotiating discounts with PACS vendors◗ Analyzing different scenarios and performing sensitivity analyses◗ Developing budget estimates◗ Tracking results
It is possible to incorporate all of the above features in one model. Thebest financial models are those that clearly lay out assumptions and sensitiv-ities to those assumptions and assign cost-savings responsibilities to partieswho control the costs, for example, use of film and the film library. Costsavings produced by eliminating conventional film systems are discussed indetail later in this chapter.
CASH
Most investment analysis methods are based on cash flow. A major differ-ence between accounting income and cash flow is the treatment of capitalassets. For accounting income, the cost of a capital asset is allocated viadepreciation expense to the periods that benefit from the asset. For cash flow,each year reflects cash spent on the capital asset. To evaluate a capital project,you will want to weigh the capital cash outlays associated with the projectagainst the benefits in terms of cash returned to the enterprise.
Example: A company purchases a $10 million asset that produces $2 million of annual income (cash) and has an expected life of 10 years.Accounting income spreads the cost of an asset over the asset’s useful life and matches the cost of the asset to the income it produces. This is the theory behind depreciation. If the asset continues to produce $2 million inrevenue in the 11th year (as shown in Tables 7.1 and 7.2), there is no depre-ciation expense because the asset has been fully depreciated over the prior10 years.
PACS: A Guide to the Digi tal Revolut ion126
DRE07 11/16/2005 9:37 AM Page 126
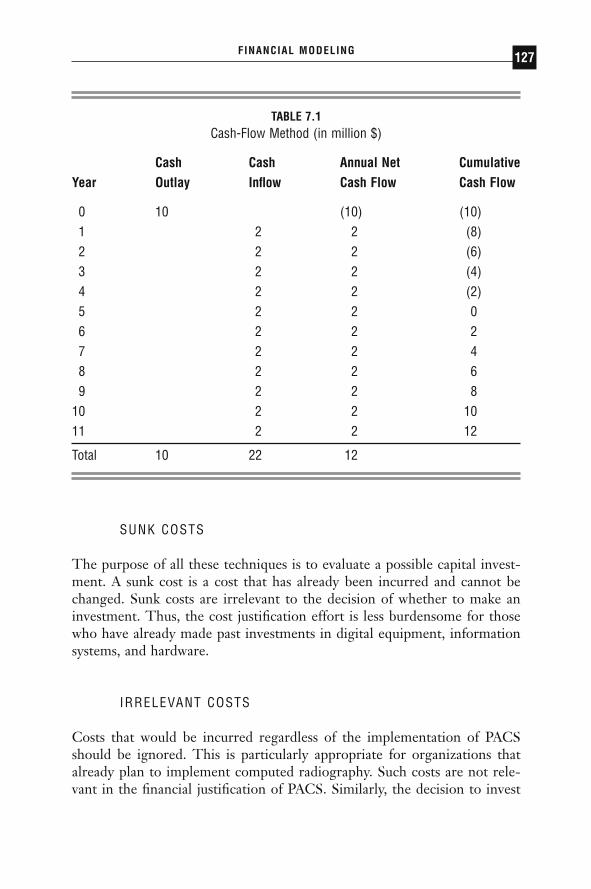
SUNK COSTS
The purpose of all these techniques is to evaluate a possible capital invest-ment. A sunk cost is a cost that has already been incurred and cannot bechanged. Sunk costs are irrelevant to the decision of whether to make aninvestment. Thus, the cost justification effort is less burdensome for thosewho have already made past investments in digital equipment, informationsystems, and hardware.
IRRELEVANT COSTS
Costs that would be incurred regardless of the implementation of PACSshould be ignored. This is particularly appropriate for organizations thatalready plan to implement computed radiography. Such costs are not rele-vant in the financial justification of PACS. Similarly, the decision to invest
FINANCIAL MODELING 127
TABLE 7.1Cash-Flow Method (in million $)
Cash Cash Annual Net CumulativeYear Outlay Inflow Cash Flow Cash Flow
0 10 (10) (10)1 2 2 (8)2 2 2 (6)3 2 2 (4)4 2 2 (2)5 2 2 06 2 2 27 2 2 48 2 2 69 2 2 8
10 2 2 1011 2 2 12
Total 10 22 12
DRE07 11/16/2005 9:37 AM Page 127

in voice recognition technology is separate from the PACS decision andshould be analyzed separately.
PAYBACK PERIOD
Payback period represents the number of years it takes for an organizationto recover its initial investment via the cash flows generated from the invest-ment, without adding the cost of capital (interest). This is also the point atwhich the project breaks even on a cumulative cash-flow basis. Some organ-izations establish required payback periods in addition to other financialhurdles (described later). This method offers ease of use and simplicity ofapplication, but it does not help determine the true value of the investmentover its lifetime or its value relative to other investment opportunities (seeTable 7.3). The example in Table 7.1 illustrates a payback period of 5 years,the point at which the cumulative cash flow is $0.
PACS: A Guide to the Digi tal Revolut ion128
TABLE 7.2Accounting Income Method (in million $)
Depreciation Annual CumulativeYear Expense Revenue Income Income
01 1 2 1 12 1 2 1 23 1 2 1 34 1 2 1 45 1 2 1 56 1 2 1 67 1 2 1 78 1 2 1 89 1 2 1 9
10 1 2 1 1011 — 2 2 12
Total 10 22 12
DRE07 11/16/2005 9:37 AM Page 128
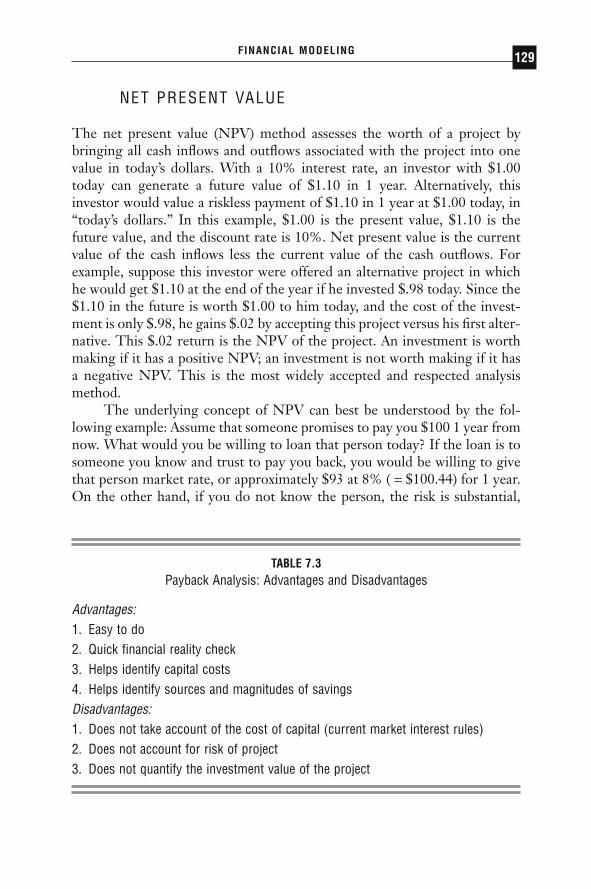
NET PRESENT VALUE
The net present value (NPV) method assesses the worth of a project bybringing all cash inflows and outflows associated with the project into onevalue in today’s dollars. With a 10% interest rate, an investor with $1.00today can generate a future value of $1.10 in 1 year. Alternatively, thisinvestor would value a riskless payment of $1.10 in 1 year at $1.00 today, in“today’s dollars.” In this example, $1.00 is the present value, $1.10 is thefuture value, and the discount rate is 10%. Net present value is the currentvalue of the cash inflows less the current value of the cash outflows. Forexample, suppose this investor were offered an alternative project in whichhe would get $1.10 at the end of the year if he invested $.98 today. Since the$1.10 in the future is worth $1.00 to him today, and the cost of the invest-ment is only $.98, he gains $.02 by accepting this project versus his first alter-native. This $.02 return is the NPV of the project. An investment is worthmaking if it has a positive NPV; an investment is not worth making if it hasa negative NPV. This is the most widely accepted and respected analysismethod.
The underlying concept of NPV can best be understood by the fol-lowing example: Assume that someone promises to pay you $100 1 year fromnow. What would you be willing to loan that person today? If the loan is tosomeone you know and trust to pay you back, you would be willing to givethat person market rate, or approximately $93 at 8% ( = $100.44) for 1 year.On the other hand, if you do not know the person, the risk is substantial,
FINANCIAL MODELING 129
TABLE 7.3Payback Analysis: Advantages and Disadvantages
Advantages:1. Easy to do2. Quick financial reality check3. Helps identify capital costs4. Helps identify sources and magnitudes of savingsDisadvantages:1. Does not take account of the cost of capital (current market interest rules)2. Does not account for risk of project3. Does not quantify the investment value of the project
DRE07 11/16/2005 9:37 AM Page 129

and you may be willing to give that person only $80, or even $50, based onthe higher risk of not being paid back.
Furthermore, if the term of the promise were longer, say 5 years insteadof 1, like a savings account in reverse, the interest would have to be com-pounded over the term of the investment, usually on an annual or monthlybasis. The formula for this process, NPV, is similar to the familiar interestcompounding formula, but with the compounding portion in the denomi-nator, as shown:
where:
P = future value (being discounted)d = discount rate per periodn = the number of periods
NPVP
+ d n=( )1
PACS: A Guide to the Digi tal Revolut ion130
TABLE 7.4Risks of PACS Implementation
Technology:Integration/interoperability
1. Modalities—DICOM compliance2. RIS-HIS
Software: stability/(robustness)ScalingNetwork infrastructure
1. Institution2. Community
Disaster ProtectionOrganization:Acceptance
User interfaceRadiologistsClinicians
Realization of film and personnel savingsLack of in-house expertise
DRE07 11/16/2005 9:37 AM Page 130
The discount rate has two components: (1) the underlying (riskless)market rate or cost of capital for the term (including inflation), and (2) anestimate of the risk premium, or interest rate related to the risk of the project.Risk of PACS project implementation is a complex topic that we do notdiscuss in detail, other than to consider that the risk factor should encom-pass all the assumptions of the project: costs of implementation, timelinessof implementation, and realized cost savings. Some of the risks that shouldbe considered are listed in Table 7.4.
There are many ways for a PACS project to get off track. Major obsta-cles or risks with major or even disastrous consequences are often referredto as “showstoppers” by information technology (IT) professionals. Notethat because the discount rate includes an inflation factor, the cash flows itis applied to should also include an inflation factor so the analysis compares“apples to apples.”
RISKS OF PACS IMPLEMENTATION
When an organization has more projects than capital, the discount rateshould be set at the risk-adjusted return that the funds could generate on acompeting project, as a hurdle rate (e.g., build an operating room suite vs.implement PACS). A certificate of deposit bearing 7% offered by a bankinsured by the FDIC has a risk-adjusted return of 7% because there is norisk. A PACS implementation expected to generate 20% returns if the imple-mentation is flawless may have a risk-adjusted return of 12% to 15% toreflect the risk that savings might not materialize or additional revenue mightnot be generated. In this case, enterprises generally set the discount rate orhurdle rate at the corporate level. That rate is usually 15% to 20%, depend-ing on the risk profile of the enterprise. In health care, IT projects are oftenassigned higher risk rates because they have a reputation of not being ableto produce the desired return; PACS falls into this category. For certain ITprojects in health care, there are often other enterprise-wide strategicreasons to proceed, even if the expected returns do not overcome the hurdlerate.
If the investment and/or savings occur at different times (years) and/orin differing amounts, the NPV calculation is the sum of each value for thespecific length of time from the time of investment into the future:
NPV discount rate per period
to n, where n number of periods
= +( )= =
ÂP
ii
i/ 1
1
FINANCIAL MODELING 131
DRE07 11/16/2005 9:37 AM Page 131

The simplest way to calculate the NPV is to discount the annual netcash flow, or the sum of capital outlays (termed “investment”), and costsavings (termed “incremental cash flow”), as demonstrated in Tables 7.5 and 7.6. At a discount rate of 15%, cash flows beyond 10 years have a mar-ginal impact, as evidenced in the table examples, in which the $2 million incash flow in year 10 has a present value of $490,000, or 25% of its futurevalue.
It is useful to project out as many years as it takes to reach steady-statecash flows or to the point at which no further benefits are expected from theinvestment. The capital outlay occurs in the first year(s). Operating costs willramp up as the system reaches completion and should be adjusted each yearfor inflation. Savings ramp up as the enterprise discontinues its use of film.So, if the organization plans to implement PACS over 2 years and to take 5 years from implementation before achieving its film elimination targets,the analysis should be carried over for 7 years (2 years to implement plus 5years to achieve full cost savings). The PACS life expectancy would serve asa time-cap on this exercise.
PACS: A Guide to the Digi tal Revolut ion132
TABLE 7.5Net Present Value Example with Initial Investment of $10 (in millions)
Incremental Net DiscountedYear Investment Cash Flow Cash Flow Cash Flow
0 $10.00 ($10.00) ($10.00)1 $2.00 $2.00 $1.742 $2.00 $2.00 $1.513 $2.00 $2.00 $1.324 $2.00 $2.00 $1.145 $2.00 $2.00 $0.996 $2.00 $2.00 $0.867 $2.00 $2.00 $0.758 $2.00 $2.00 $0.659 $2.00 $2.00 $0.57
10 $2.00 $2.00 $0.49NPV $0.02
DRE07 11/16/2005 9:37 AM Page 132
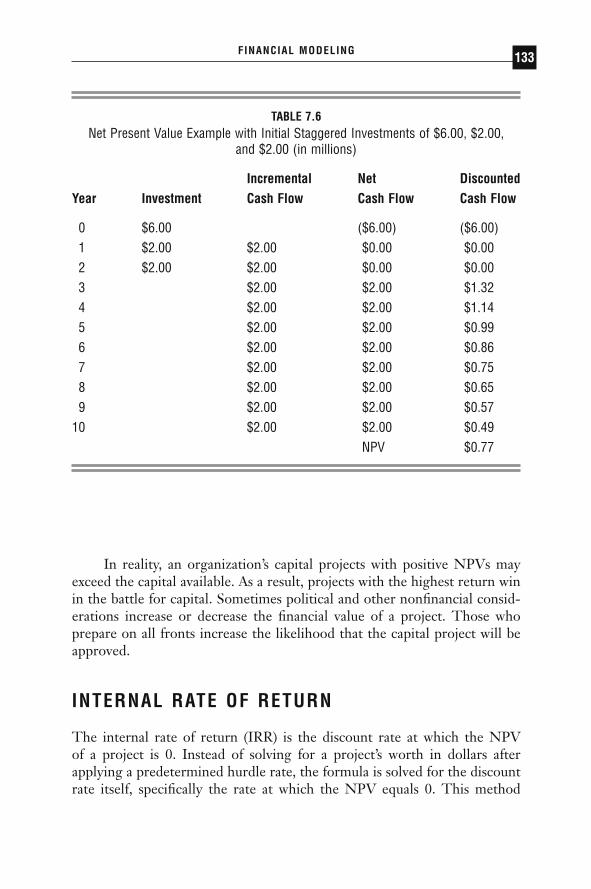
In reality, an organization’s capital projects with positive NPVs mayexceed the capital available. As a result, projects with the highest return winin the battle for capital. Sometimes political and other nonfinancial consid-erations increase or decrease the financial value of a project. Those whoprepare on all fronts increase the likelihood that the capital project will beapproved.
INTERNAL RATE OF RETURN
The internal rate of return (IRR) is the discount rate at which the NPV of a project is 0. Instead of solving for a project’s worth in dollars after applying a predetermined hurdle rate, the formula is solved for the discountrate itself, specifically the rate at which the NPV equals 0. This method
FINANCIAL MODELING 133
TABLE 7.6Net Present Value Example with Initial Staggered Investments of $6.00, $2.00,
and $2.00 (in millions)
Incremental Net DiscountedYear Investment Cash Flow Cash Flow Cash Flow
0 $6.00 ($6.00) ($6.00)1 $2.00 $2.00 $0.00 $0.002 $2.00 $2.00 $0.00 $0.003 $2.00 $2.00 $1.324 $2.00 $2.00 $1.145 $2.00 $2.00 $0.996 $2.00 $2.00 $0.867 $2.00 $2.00 $0.758 $2.00 $2.00 $0.659 $2.00 $2.00 $0.57
10 $2.00 $2.00 $0.49NPV $0.77
DRE07 11/16/2005 9:37 AM Page 133
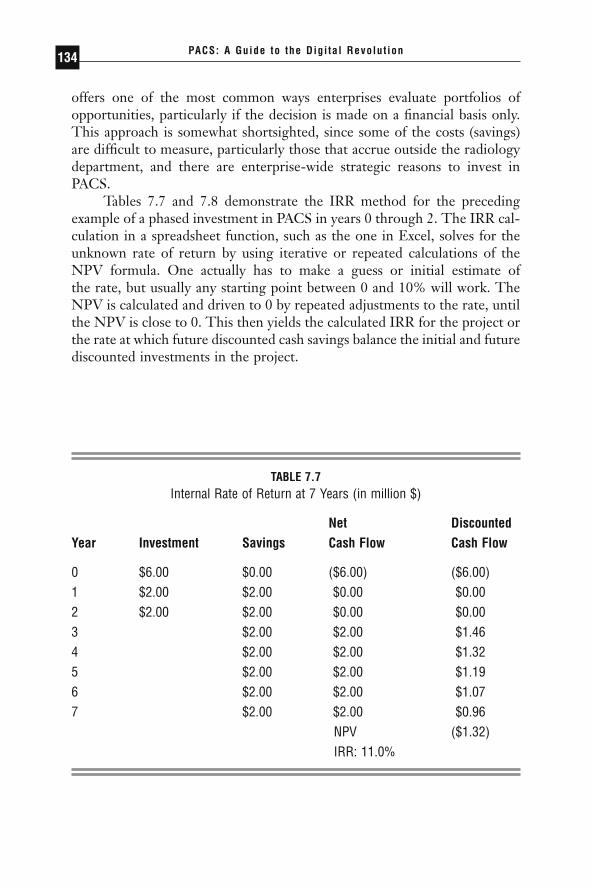
offers one of the most common ways enterprises evaluate portfolios ofopportunities, particularly if the decision is made on a financial basis only.This approach is somewhat shortsighted, since some of the costs (savings)are difficult to measure, particularly those that accrue outside the radiologydepartment, and there are enterprise-wide strategic reasons to invest inPACS.
Tables 7.7 and 7.8 demonstrate the IRR method for the precedingexample of a phased investment in PACS in years 0 through 2. The IRR cal-culation in a spreadsheet function, such as the one in Excel, solves for theunknown rate of return by using iterative or repeated calculations of theNPV formula. One actually has to make a guess or initial estimate of the rate, but usually any starting point between 0 and 10% will work. TheNPV is calculated and driven to 0 by repeated adjustments to the rate, untilthe NPV is close to 0. This then yields the calculated IRR for the project orthe rate at which future discounted cash savings balance the initial and futurediscounted investments in the project.
PACS: A Guide to the Digi tal Revolut ion134
TABLE 7.7Internal Rate of Return at 7 Years (in million $)
Net DiscountedYear Investment Savings Cash Flow Cash Flow
0 $6.00 $0.00 ($6.00) ($6.00)1 $2.00 $2.00 $0.00 $0.002 $2.00 $2.00 $0.00 $0.003 $2.00 $2.00 $1.464 $2.00 $2.00 $1.325 $2.00 $2.00 $1.196 $2.00 $2.00 $1.077 $2.00 $2.00 $0.96
NPV ($1.32)IRR: 11.0%
DRE07 11/16/2005 9:37 AM Page 134
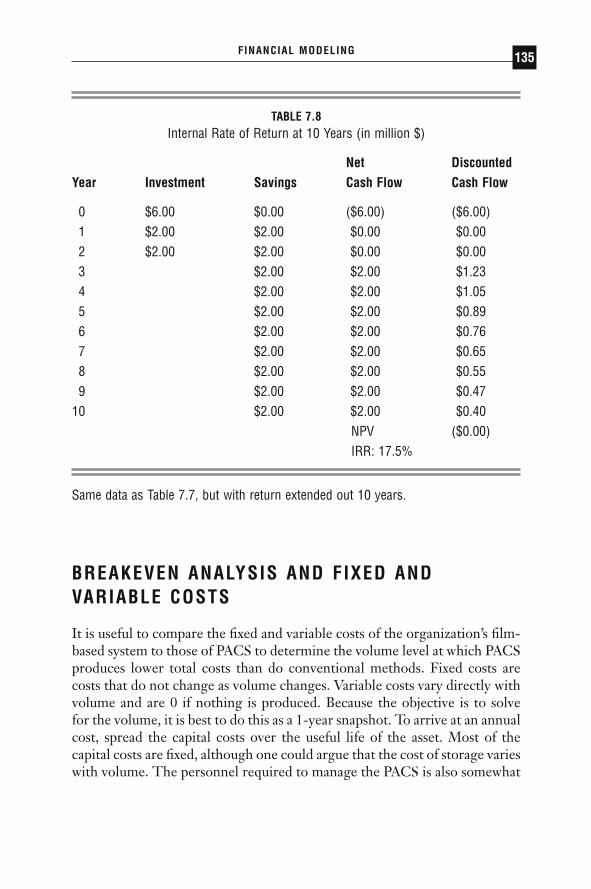
BREAKEVEN ANALYSIS AND FIXED ANDVARIABLE COSTS
It is useful to compare the fixed and variable costs of the organization’s film-based system to those of PACS to determine the volume level at which PACSproduces lower total costs than do conventional methods. Fixed costs arecosts that do not change as volume changes. Variable costs vary directly withvolume and are 0 if nothing is produced. Because the objective is to solvefor the volume, it is best to do this as a 1-year snapshot. To arrive at an annualcost, spread the capital costs over the useful life of the asset. Most of thecapital costs are fixed, although one could argue that the cost of storage varieswith volume. The personnel required to manage the PACS is also somewhat
FINANCIAL MODELING 135
TABLE 7.8Internal Rate of Return at 10 Years (in million $)
Net DiscountedYear Investment Savings Cash Flow Cash Flow
0 $6.00 $0.00 ($6.00) ($6.00)1 $2.00 $2.00 $0.00 $0.002 $2.00 $2.00 $0.00 $0.003 $2.00 $2.00 $1.234 $2.00 $2.00 $1.055 $2.00 $2.00 $0.896 $2.00 $2.00 $0.767 $2.00 $2.00 $0.658 $2.00 $2.00 $0.559 $2.00 $2.00 $0.47
10 $2.00 $2.00 $0.40NPV ($0.00)IRR: 17.5%
Same data as Table 7.7, but with return extended out 10 years.
DRE07 11/16/2005 9:37 AM Page 135

fixed. Variable costs are minimal. A conventional system’s fixed costs arelower, since there is less capital equipment. The conventional system’s vari-able costs consist mainly of film (and other disposables) and film librarysupport activities (personnel). Although these are the major ingredients, youcould try to capture numerous other costs that are more difficult to quan-tify. (We discuss those more fully later in this chapter.) These economic rela-tionships are depicted in Figure 7.1.
In Figure 7.1, the dashed line (traditional fee-for-service income) nolonger exists as such but is replaced by an underlying linear demand line forimaging services, to which a value can be assigned or ascribed. For example,in a managed care or capitated healthcare enterprise, a demand for imagingservices is some function of the number of insured lives (linear), demo-graphics (nonlinear), utilization profile of the referring physicians (complex),and possibly other factors. Some generalizations can be made, however. Ifthe horizontal axis is labeled “Insured Lives,” then the slope of the demandline is proportional to the diagnostic imaging utilization profile and deter-mines the volume of examinations. An institution still has to provide thisvolume of services. However, the important differential is not between thedemand line and the cost line (digital or conventional), but between the con-ventional and the digital, where the crossover occurs at some volume level.
PACS: A Guide to the Digi tal Revolut ion136
Traditional Fee-for-Service
FIGURE 7.1
Breakeven analysis.
DRE07 11/16/2005 9:37 AM Page 136
That is because the incremental or variable costs of a digital study are lower,particularly for the digital modalities.
COSTS
FACTORS DETERMINING COSTS
There is no boilerplate solution for how to determine the costs of imple-menting PACS. The costs depend on the sophistication of the enterprise’sexisting information system network and its imaging equipment inventoryand needs. These capital costs, together with ongoing costs for operating thesystem, determine what levels of savings are required to justify PACS. Invest-ing in PACS represents a trade-off: decreased operating costs (film and filmpersonnel) versus increased capital costs together with PACS maintenanceand personnel costs. To produce a credible financial analysis, it is best to erron the side of overstating costs and understating savings to the extent thatthe results allow.
Determining the cost to acquire, move, and store images is critical. Anequipment inventory assessment must be done by a technician who under-stands how each radiology practice operates, what equipment exists, andwhat PACS equipment is needed. As the cost of software and maintenanceis often in question and the discounts are flexible, the price to pay for thesystem could be calculated by using the number that generates a positiveNPV. The required discount could be calculated by comparing this numberto the list price offering. Equipment vendors can easily supply list prices andcustomary discounts. This discount, which can be substantial, is influencedby negotiation, size of purchase, and reputation value of the enterprise tothe vendor. In addition, list prices are in a deflationary mode as technolog-ical advances and competition drive down prices.
CAPITAL EXPENDITURES
The initial capital outlay consists of the categories of expenditure listed in Table 7.9, the technical nature of which are discussed more fully in thefollowing chapters. Archive capital costs will continue to decrease, and in spite of early skepticism, creative methods for management of hier-archical storage promise to decrease storage costs even further in the nearfuture.
FINANCIAL MODELING 137
DRE07 11/16/2005 9:37 AM Page 137
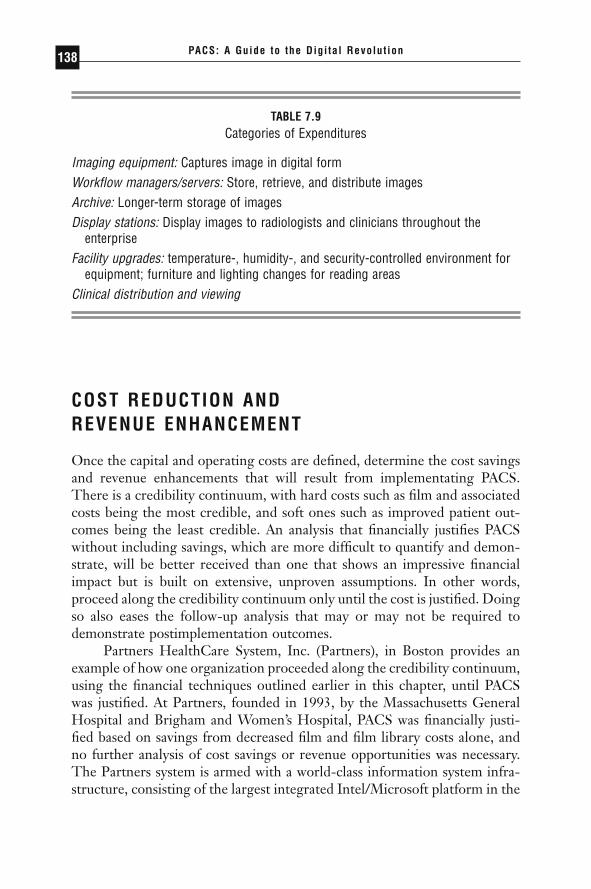
COST REDUCTION AND REVENUE ENHANCEMENT
Once the capital and operating costs are defined, determine the cost savingsand revenue enhancements that will result from implementating PACS.There is a credibility continuum, with hard costs such as film and associatedcosts being the most credible, and soft ones such as improved patient out-comes being the least credible. An analysis that financially justifies PACSwithout including savings, which are more difficult to quantify and demon-strate, will be better received than one that shows an impressive financialimpact but is built on extensive, unproven assumptions. In other words,proceed along the credibility continuum only until the cost is justified. Doingso also eases the follow-up analysis that may or may not be required todemonstrate postimplementation outcomes.
Partners HealthCare System, Inc. (Partners), in Boston provides anexample of how one organization proceeded along the credibility continuum,using the financial techniques outlined earlier in this chapter, until PACSwas justified. At Partners, founded in 1993, by the Massachusetts GeneralHospital and Brigham and Women’s Hospital, PACS was financially justi-fied based on savings from decreased film and film library costs alone, andno further analysis of cost savings or revenue opportunities was necessary.The Partners system is armed with a world-class information system infra-structure, consisting of the largest integrated Intel/Microsoft platform in the
PACS: A Guide to the Digi tal Revolut ion138
TABLE 7.9Categories of Expenditures
Imaging equipment: Captures image in digital formWorkflow managers/servers: Store, retrieve, and distribute imagesArchive: Longer-term storage of imagesDisplay stations: Display images to radiologists and clinicians throughout the
enterpriseFacility upgrades: temperature-, humidity-, and security-controlled environment for
equipment; furniture and lighting changes for reading areasClinical distribution and viewing
DRE07 11/16/2005 9:37 AM Page 138
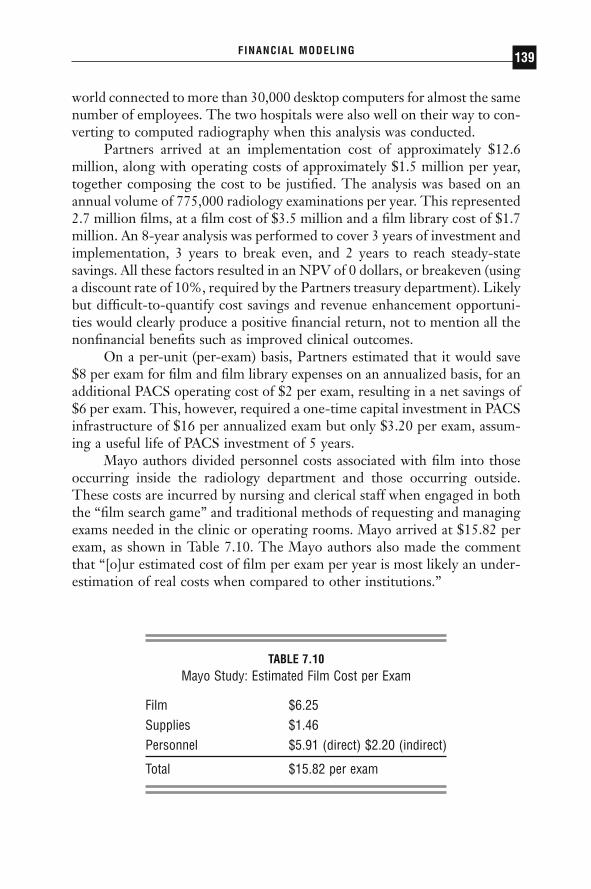
world connected to more than 30,000 desktop computers for almost the samenumber of employees. The two hospitals were also well on their way to con-verting to computed radiography when this analysis was conducted.
Partners arrived at an implementation cost of approximately $12.6million, along with operating costs of approximately $1.5 million per year,together composing the cost to be justified. The analysis was based on anannual volume of 775,000 radiology examinations per year. This represented2.7 million films, at a film cost of $3.5 million and a film library cost of $1.7million. An 8-year analysis was performed to cover 3 years of investment andimplementation, 3 years to break even, and 2 years to reach steady-statesavings. All these factors resulted in an NPV of 0 dollars, or breakeven (usinga discount rate of 10%, required by the Partners treasury department). Likelybut difficult-to-quantify cost savings and revenue enhancement opportuni-ties would clearly produce a positive financial return, not to mention all thenonfinancial benefits such as improved clinical outcomes.
On a per-unit (per-exam) basis, Partners estimated that it would save$8 per exam for film and film library expenses on an annualized basis, for anadditional PACS operating cost of $2 per exam, resulting in a net savings of$6 per exam. This, however, required a one-time capital investment in PACSinfrastructure of $16 per annualized exam but only $3.20 per exam, assum-ing a useful life of PACS investment of 5 years.
Mayo authors divided personnel costs associated with film into thoseoccurring inside the radiology department and those occurring outside.These costs are incurred by nursing and clerical staff when engaged in boththe “film search game” and traditional methods of requesting and managingexams needed in the clinic or operating rooms. Mayo arrived at $15.82 perexam, as shown in Table 7.10. The Mayo authors also made the commentthat “[o]ur estimated cost of film per exam per year is most likely an under-estimation of real costs when compared to other institutions.”
FINANCIAL MODELING 139
TABLE 7.10Mayo Study: Estimated Film Cost per Exam
Film $6.25Supplies $1.46Personnel $5.91 (direct) $2.20 (indirect)
Total $15.82 per exam
DRE07 11/16/2005 9:37 AM Page 139

FILM COST
To capture film costs it is necessary to develop assumptions about the numberof annual exams, films per exam, and cost per film over the life of the capitalinvestment in PACS. Annual savings is the product of annual exams multi-plied by number of films per exam multiplied by the expected film cost persheet. For example, an enterprise that generally conducts 10,000 annual MRIexams using 8 films per MRI at a cost of $1.50 per film would save $120,000if it eliminated 100% of its film use. It is easiest to combine all associatedfilm costs, including chemicals, processing, folder jackets, and so forth, withthe film commodity cost for simplicity.
For most enterprises, it is necessary to ramp up film elimination from0% to 90% or so over some number of years. It is difficult to eliminate filmentirely (thus the 90%) because of the need to produce films for cliniciansoutside of the enterprise, for legal proceedings, and so on. Nevertheless, itis necessary to reach a fairly aggressive target quickly in order to justify PACScurrently. The rapidity with which film use is eliminated is the key factor incost savings. A long implementation perpetuates dual systems and processes,delays savings, and destroys value. A commitment must be made by the clin-ical enterprise that film use will be eliminated as soon as PACS is imple-mented. To make these assumptions real, keep in mind that a replacementfor image distribution must be in place as well as a PACS prior to success-ful film elimination.
FILM LIBRARY COST
The film library cost consists mainly of personnel managing the contents ofthe film library. As with film costs, the savings here would ramp up andshadow film reduction. The analysis could also include costs saved by reduc-ing the space required for film storage. For many institutions, the space saveddepends on legal requirements for film storage, which may take several yearsto develop, as the law generally follows practice, and these, from a legal per-spective, are uncharted waters. For the analysis to capture space savings, theorganization must have an alternate need for the space, and by gaining thefilm storage space, be able to avoid leasing additional space. It may be easierto treat such space savings as a wash when anticipating the increased spacerequired for the PACS equipment and its staff, but this needs to be deter-mined on a case-by-case basis.
PACS: A Guide to the Digi tal Revolut ion140
DRE07 11/16/2005 9:37 AM Page 140

The analysis can also phase in a reduction in warehouse costs for filmstorage that shadows the implementation phases. This reduction would alsohave to respect the film storage time required by law.
LOST EXAMS
The financial impact study could also include the elimination of incremen-tal costs and lost revenue associated with misplaced films. Savings may mate-rialize from a decrease in staffing required of practitioners and administrativepersonnel to serve existing volumes, or as increased throughput (revenue lessincremental costs). This impact is difficult to quantify, and the inclusion ofthese costs depends on whether the institution tracks this information.
It is also difficult to quantify the cost to the enterprise of not produc-ing a film for a legal proceeding, or the cost of the department’s and insti-tution’s reputations in not being able to produce a film for a patient orphysician who needs it. The nonquantifiable cost to the patient might bestaggering if a previous study is needed for comparison with a present studybefore a clinician can make an informed diagnosis. These situations can beenumerated in the analysis as nonquantifiable benefits.
REDOS
PACS virtually eliminates the need for redos for two reasons. First, com-puted radiography imaging modality has a very wide range of latitude forexposure error, compared to film. Second, the rate of lost exams in a well-engineered PACS is very low compared to the estimated 10% to 15% tem-porary or permanent loss rate in a conventional film library. To calculate thissavings, estimate the cost of redos to the organization in terms of time andmaterials. The savings in time depends on whether the clinician would beserving other patients instead of repeating the process; the savings in costdepends on whether a reduction in staffing would result. Such savings applynot only to radiologists but also to clinicians who are detained by redos.Savings on materials are calculated by the number of redone exams multi-plied by films per exam multiplied by the cost per film.
Again, it is difficult to quantify the cost to patients associated with thedelay caused by a redo. At the risk of being overly dramatic, we can say thata savings in time can make the difference between life and death for patientswhose critical condition may depend on a rapid diagnosis.
FINANCIAL MODELING 141
DRE07 11/16/2005 9:37 AM Page 141
SAVED TIME FOR PRACTITIONERS ANDADMINISTRATIVE STAFF
PACS makes image distribution faster, easier, and more reliable. This featuretranslates into a cost reduction if staff are eliminated or into an additionalfinancial contribution (incremental revenue less incremental costs) if anunmet demand for services (additional volume) exists. This impact will notbe felt until the PACS is fully implemented and all radiologists and cliniciansare proficient in its use. This time saved is difficult to measure without com-paring the task time today versus the task time in a carefully projected envi-ronment, but few data are available for such comparison.
Faster turnaround time will likely translate into shorter stays which, inturn, can reduce costs of care or produce additional income if additionalpatients can be served. The potential impact on length-of-stay and increasedadmissions would be difficult to substantiate. It is difficult to know ormeasure how PACS contributes to shortening length of stay because thereare so many complex factors that contribute to length of stay; it is difficultto segregate PACS as a single component.
SITE OPPORTUNITIES
Just as the electronic revolution makes it possible for millions of people tospend more time working from home, electronic imaging makes the locusof work far less important for radiology services. PACS enables diagnosticimages to be available anytime, anywhere they are needed, with little or nohuman intervention. This eliminates the necessity and cost of having radi-ologist coverage in multiple sites within an entity and in many entities withina system. The mobility of images created by PACS facilitates peer or expertreview of images inter- and intra-network. This mobility reduces the poten-tial number of radiologists required to serve a given population and also thetime in which those services can be provided. Enterprises that take advan-tage of these site opportunities will be able to serve existing patients withfewer resources (reduce costs) or serve additional patients with existingresources (increase revenue).
MULTISITE IMAGE READING
The peaks and valleys of demand can be better managed by diverting imagereading to alternate sites. Diversion allows for more effective use of
PACS: A Guide to the Digi tal Revolut ion142
DRE07 11/16/2005 9:37 AM Page 142

resources, faster turnaround times, and improved patient outcomes. It alsolets any appropriate radiologist read images for a clinician anywhere withinthe defined network, thereby allowing patients to receive care in their ownlocales and in some instances, allowing clinicians to receive radiology ser-vices with only a technician, rather than a radiologist, on-site.
IMPROVED PATIENT OUTCOMES
Perhaps the most difficult benefit to quantify is improved patient outcomes,yet such benefits represent perhaps the most compelling argument for PACSimplementation. Improved outcomes are the product of many factors: imageclarity, fewer lost exams and redos, multi-availability of digital images, and,most important, turnaround time. The latter is especially true where dis-tance is involved. No simple quantitative value can be placed on improveddetection of disease or image availability, nor is there a simple way to assessthe value of a secure and fast repository of images. These factors will havea huge impact on the way medicine is practiced and the quality of carepatients receive.
COMPETITIVE IMPACT
A financial analysis could attempt to capture whether implementing PACSwould have an impact on the organization’s overall revenue and admissions.Many enterprises, especially integrated delivery networks, will see the deci-sion to implement PACS simply as a necessary step in maintaining theirmarket position. If PACS is financially justified and greatly improves patientoutcomes, the entity or system that adopts it first will have a competitiveadvantage.
◗ REFERENCES
Avrin DE. PACS economic issues and justifications. American Association of Physi-cists in Medicine 1999 Summer School: Practical Digital Imaging and PACS.Sonoma State University; Rohnert Park, CA. Madison, WI: Medical PhysicsPublishing.
Avrin DE, Andriole KP, Yin L, et al. A hierarchical storage management (HSM)scheme for cost-effective on-line archival using lossy compression. J DigitImaging. 2001;14(1):18–23.
FINANCIAL MODELING 143
DRE07 11/16/2005 9:37 AM Page 143

King BF, Ward S, Bruesewitz RT, et al. Cost of film: purchasing, processing, pack-aging, storing and disposal over the lifetime of a film examination in a large radi-ology department. SCAR Proceedings. 1996:152–156.
Pratt HM, Langlotz CP, Feingold ER, et al. Incremental cost of department-wideimplementation of a PACS and CR. Radiology. 1998;206:245–252.
Spiro HT. Finance for the Nonfinancial Manager. 2nd ed. New York: John Wiley andSons; 1982.
PACS: A Guide to the Digi tal Revolut ion144
DRE07 11/16/2005 9:37 AM Page 144

LEGAL ISSUES ANDFORMAL POLICIES
GORDON SMITH • DAVID S. HIRSCHORN
The past decade has brought explosive growth in PACS technology, makinglarge-scale teleradiology an integral part of many radiology practices.
This reality has left legislatures, the courts, and a wide variety of organiza-tions that formulate healthcare policy scrambling to keep pace with an ever-changing practice environment. The result is a patchwork of laws, courtdecisions, and formal policies formulated by the American College of Radi-ology (ACR) and others that address a wide variety of issues relating to teleradiology. Some issues, such as the medical licensure and institutionalcredentials necessary to practice teleradiology in a given jurisdiction, arefairly well defined. However, the majority of legal and policy issues that con-front this increasingly important aspect of radiology practice are unsettledor not even addressed, leaving a broad range of unanswered questions. Inaddition to the challenges of addressing litigation and standards for the clin-ical aspects of radiology, the Health Insurance Portability and Accountabil-ity Act (HIPAA) has brought upon radiology a level of compliancecomplexity never seen before. The regulations penetrate every area of thedepartment, and the policies further define and expand the obligations within
8CHAPTER
DRE08 11/16/2005 9:39 AM Page 145

HealthCare Financing Administration (HCFA) regulations that were basedon the Privacy Act of 1974.
THE CURRENT SITUATION
We are currently in the midst of an era of rapid technical innovation andchange that is unequaled in recorded history. Computing power thatrequired whole rooms a few short decades ago can now be convenientlycarried. The cost of this computing power has fallen dramatically, makingpossible the widespread use of powerful computing platforms. The accom-panying dramatic innovation in communications technology has allowed theinexpensive transfer of large volumes of data over long distances.
These innovations have combined to make teleradiology and picturearchiving and communication systems (PACS) technology available in manymedical settings. Digital images are acquired, transmitted, displayed, andstored in a wide variety of settings. These range from purely local exercises,such as the interpretation of computed tomography (CT) images at ascanner’s dedicated workstation, to transmission of images over hundreds orthousands of miles for official interpretation and storage. The activities cur-rently possible through available technology are in many ways limited onlyby the creativity of those who use it.
Like most activities with the potential to impact the health of the pop-ulation, teleradiology and PACS technology are subject to controls estab-lished by the law and policies developed by various organizations. Lawsenacted by Congress and by the various state legislatures are implementedby the executive branch through administrative agencies. These agenciesdraft regulations that define the day-to-day operation of the legislation, pro-viding detail that is often absent from the law itself. The Food and DrugAdministration (FDA) and the HCFA are well-known examples of federalagencies; a variety of state administrative agencies perform similar functionsfor state laws.
The content, meaning, or appropriateness of laws and regulations isoften subject to dispute. Parties may contend that administrative agenciesmisinterpreted the law when drafting regulations, or perhaps oversteppedthe discretion that the law allowed them. In extreme cases, there may bequestions as to whether Congress or the legislature possessed the authorityto pass the law itself. In any such dispute, it is the courts at the federal, state,and local level that serve as the final arbiter of the law. In this role, they shapethe final enforcement of any legislation.
PACS: A Guide to the Digi tal Revolut ion146
DRE08 11/16/2005 9:39 AM Page 146

Another source of control is policies, guidelines, and standards devel-oped by private organizations with interests in a field. In teleradiology and PACS, the ACR has played a key role in developing standards for boththe equipment employed and the role of radiologists and other personnel in applying the technology. While these standards lack the force of law, they serve an important function in defining teleradiology and PACS forthose both in and outside the field of radiology. In this context, similar standards have been used by courts in examining disputes involving medicalpractice.
The various sources of law and policy do not ordinarily prospectivelyaddress issues. Typically, legislatures, administrative agencies, and profes-sional organizations develop law and policy after problems have developedthat demand resolution. This means that a conflict or problem must firstoccur and be identified before any action is taken.
Even when the need for a new law or policy is recognized, developingthat law or policy is not a quick or easy process. Congress and the state leg-islatures may take years to draft and enact legislation, and administrativeagencies years to define the new law with regulations. Courts may be evenslower to resolve new legal problems, as a number of decisions on similardisputes are typically needed to form a body of law. Even professional organ-izations with vested interests in areas such as teleradiology and PACS, suchas the ACR, generally have in place a complex mechanism to develop stan-dards or guidelines, a process that may take years after the need for actionis identified.
The result—in rapidly changing, technologically driven fields such asteleradiology and PACS—is a definite disparity between the capabilities ofthe technology and the institution of laws and policies to govern its use.Today, only a fraction of pertinent teleradiology and PACS issues have beenaddressed. Although almost every state has explicit or implied licensurerequirements for radiologists interpreting teleradiology images from insideits borders, there is a dearth of court decisions addressing the various legalissues that are sure to affect its everyday practice. Furthermore, new laws arepassed and new policies established on an ongoing basis, with the pace ofthese new controls bound to increase as the technology matures and its usebecomes even more widespread.
This chapter outlines current law and policy as they pertain to tele-radiology and PACS. It also outlines issues with the potential to affect thefields in the near future. It is not a substitute for qualified legal advice, andradiologists engaging in these activities are urged to consult qualified legalcounsel before employing these technologies.
LEGAL ISSUES AND FORMAL POLICIES 147
DRE08 11/16/2005 9:39 AM Page 147

STANDARDS AND POLICIES OF PROFESSIONAL ORGANIZATIONS
The provision of medical services has been a long-standing focus of profes-sional societies, and the activities made possible by the development of teleradiology and PACS technology are no exception. Given the technol-ogy’s pronounced impact on the practice of radiology, the ACR has taken aleading role in defining what constitutes professionally acceptable teleradi-ology and PACS services, developing a variety of standards and other poli-cies. The American Medical Association (AMA) has also examined thepractice of teleradiology and telemedicine. The standards and policies devel-oped by such organizations do not have the force of law, but they do repre-sent a detailed consensus of expert opinion in the field. As such, they mayserve as important indicators regarding what constitutes the professionalstandard of medical practice in teleradiology and PACS.
AMERICAN COLLEGE OF RADIOLOGY
The ACR is a leading professional society in radiology, with a membershipcomposed of radiologists, radiation oncologists, and medical physicists. Aspart of an effort to advance the science of radiology and improve the qualityof radiology services, the college has developed a formal mechanism forestablishing and revising standards for the various subspecialty areas thatmake up the profession. Each standard represents a consensus policy state-ment by the college. Effective January 1, 1999, the ACR established newstandards for teleradiology and digital image data management.
ACR STANDARD FOR TELERADIOLOGY
The ACR standard covers a wide variety of issues related to teleradiology. Itstresses that teleradiology must be of sufficient quality to perform the indi-cated task. When a system is used to perform an official interpretation, thereshould not be a “clinically significant loss of spatial or contrast resolutionfrom image acquisition through transmission to final image display.” Fromthis overriding principle, the document describes in detail the personnel andequipment considered necessary to conduct teleradiology.
Initially, the standard outlines the qualifications of personnel obtainingimages at the transmitting site. These individuals must be qualified to
PACS: A Guide to the Digi tal Revolut ion148
DRE08 11/16/2005 9:39 AM Page 148

perform the specific examination being performed. In all cases, a licensedand/or registered radiologic technologist, nuclear medicine technologist, orsonography technologist is needed. In addition to appropriate technologists,a qualified medical physicist and an “image management specialist” are desir-able to have on-site or as consultants. The document defines an image man-agement specialist as an individual who is “qualified by virtue of educationand experience” to provide service to the teleradiology system.
The physician performing the official interpretation of transmittedimages must have a basic understanding of the strengths and weaknesses ofteleradiology, as well as be qualified to interpret the particular diagnosticmodality at issue. With regard to what constitutes adequate qualification, thestandard refers to other ACR standards for rendering interpretations on thevarious imaging modalities. Notably, the teleradiology standard states thatthis physician should maintain licensure appropriate to the delivery of teleradiology services at both the transmitting and receiving sites. This effec-tively requires a physician interpreting teleradiology to maintain appropri-ate licensure in multiple states, if teleradiology is conducted across state linesand the state(s) involved require such licensure. The standard maintains asimilar position on staff privileges: If images are transmitted from a hospi-tal, the interpreting physician should be credentialed and obtain appropri-ate privileges at that institution.
Similar to legal requirements faced by physicians interpreting locallyproduced images, the ACR teleradiology standard holds the physician pro-viding the official interpretation of teleradiology images responsible for thequality of the images being reviewed. Simply put, this position makes it dif-ficult for physicians providing official teleradiology interpretation to escapepotential liability for poor-quality images. Physicians providing official inter-pretations are also cautioned to consult with their professional liabilitycarrier to ensure coverage in both sending and receiving sites. A large portionof the teleradiology standard addresses technical and legal issues associatedwith the equipment used and the images displayed and stored by that equip-ment. All new equipment acquisition should comply with the DigitalImaging and Communications in Medicine (DICOM) standard, developedby the ACR and the National Electrical Manufacturers Association (NEMA).Two matrix categories are established for rendering official image interpre-tation. A small matrix (512 ¥ 512 resolution with a minimum of 8-bit depth)is deemed sufficient for computed tomography (CT), magnetic resonanceimaging (MRI), ultrasound (US), nuclear medicine (NM), digital fluo-roscopy, and digital angiography. Computed radiography and digitizedradiographs are considered large-matrix studies (a minimum of 2.5 line pairsper millimeter [lp/mm] spatial resolution at a minimum of 10-bit depth).
LEGAL ISSUES AND FORMAL POLICIES 149
DRE08 11/16/2005 9:39 AM Page 149

Image data for teleradiology systems may be obtained by both directimage capture for purely digital images or by secondary image capture forfilm images that are digitized. Direct image capture is the “most desirable”method of acquisition for primary diagnosis. Regardless of acquisitionmethod, images must have annotation capabilities that allow data such aspatient name, identification number, name of transmitting facility, type ofexamination, anatomic orientation, and method of compression displayed onthe image. The standard allows the use of both reversible and irreversiblecompression, assuming that a qualified supervising physician determines thatthere is no reduction in “clinically diagnostic image quality.” These com-pression methods should be reviewed periodically by the supervising physi-cian to “ensure appropriate image quality.” Data transmission is required tohave adequate error-checking capability, and there must be no loss of clini-cally significant data during this transmission.
Display characteristics for the monitors used in officially interpretingteleradiology images are described. These should have a luminance of at least50ft-lamberts and be located in areas with suitable room lighting. Imagemanipulation features should include window and level adjustments, pan andzoom, the capability to rotate or flip images, and the ability to calculate anddisplay accurate linear measurements and pixel values (as appropriate for themodality being interpreted). The images should be accurately associated withthe correct patient study and demographic information, and any compres-sion or similar processing should be noted. Requirements for displays notbeing used for official interpretation are noted to be less stringent, thoughthe exact characteristics are not delineated.
Archiving and retrieving image data receive significant attention in thestandard. Prior examinations should be retrievable from the archive in a timeframe appropriate to the clinical needs of the facility and medical staff. Anysystem should provide storage capable of complying with all facility, state,and federal regulations regarding medical record retention. Images stored ateither the transmitting or receiving site should meet the specific jurisdic-tional requirements of the transmitting site. Images interpreted off-site neednot be stored at the receiving facility. However, if such data are maintainedat the receiving facility, the data retention period must meet the jurisdic-tional requirements of the receiving jurisdiction as well. All policies relatingto the storage of image data should be written and equivalent to policies andprocedures that exist for hardcopy medical images.
A teleradiology system should have protections to ensure the securityof archived data. Specifically, the confidentiality of patient data must beaddressed, as well as measures to safeguard the data from intentional or un-intentional corruption. These protections should apply to both the networkand the software it employs.
PACS: A Guide to the Digi tal Revolut ion150
DRE08 11/16/2005 9:39 AM Page 150

Finally, the standard addresses practical, day-to-day issues of teleradi-ology. Written policies and procedures to ensure a continuity of care con-sistent with that for hardcopy images are suggested. Mentioned are internalredundant systems, backup telecommunications links, and a disaster plan. Atleast monthly image quality control using a test image is described. Spatialresolution at such testing should be consistent with the specific matrix beingemployed, that is, small or large.
Currently, there is little indication as to how this revised teleradiologystandard may be applied in practice. Given the ACR’s reputation and theneed for minimum standards in clinical teleradiology practice, many of thedetails of the standard will probably be adopted by radiologists practicingteleradiology. However, given the rapid advancement of technology, it is vir-tually certain that some of the standard’s technical details will shortly beobsolete. The portions of the document calling for appropriate licensure inboth the sending and receiving jurisdictions are likely to be considerablymore enduring, as are the provisions applying to the archiving and retrievalof teleradiology data.
ACR STANDARD FOR DIGITAL IMAGE DATA MANAGEMENT
The ACR maintains a separate standard for digital image data management.Its provisions are applicable to any system of image data management, fromsingle-modality or single-use system to a complete PACS system, as wouldbe used for teleradiology. As a result, there is considerable overlap with theACR Standard for Teleradiology, which focuses on PACS. Like the tele-radiology standard, the digital image data management standard states thatthe examination that serves as the data source is subject to the specific ACRstandard for that modality.
The goals of digital image data management as outlined in the stan-dard include, but are not limited to: (1) initial acquisition or generation ofaccurately labeled and identified image data; (2) transmission of data to anappropriate storage medium from which they can be retrieved; (3) retrievalof data from available prior imaging studies for comparison; (4) transmissionof data to remote sites for consultation, review, or formal interpretation; (5)appropriate compression of image data to facilitate transmission or storage,without loss of clinically significant information; (6) archiving of data tomaintain accurate patient medical records in a form that is retrievable in atimely fashion, meets applicable facility, state, and federal regulations, andmaintains patient confidentiality; and (7) administration with appropriatedatabase management procedures.
LEGAL ISSUES AND FORMAL POLICIES 151
DRE08 11/16/2005 9:39 AM Page 151

Most of the document itself is devoted to describing in detail how these goals are to be accomplished. Qualifications and responsibilities for personnel, including physicians, electronic/computer assistant, medicalimage physicist, and image management specialists are outlined, largely paralleling descriptions in the teleradiology standard. Similarly, compliancewith the DICOM standard is “strongly recommended,” and image categoriesfor official interpretation are split into those for small and large matrices.The definitions for these matrices and the type of imaging modalities in each type of matrix are identical to the teleradiology standard, as are the descriptions of image acquisition and annotation capabilities. Trans-mission standards likewise mirror those detailed in the teleradiology standard.
Archiving and retrieval sections of the digital image data managementstandard also reiterate those found in the teleradiology standard. Storagecapacity must be capable of complying with all facility, state, and federal reg-ulations regarding medical record retention, with images stored at either thetransmitting or retrieval site complying with the requirements of the trans-mitting jurisdiction. Storage is not necessary at the receiving site, but if suchstorage is undertaken, the retention period of that jurisdiction must be metas well. Security to protect the confidentiality of patient identification andimaging data should be present. All policies relating to the achieving andstorage of digital image data should be equivalent to those in existence forhardcopy records and should be in writing. For clinical use, any system mustallow timely retrieval of archived images, as well as mechanisms to ensurecontinuity of care.
AMERICAN MEDICAL ASSOCIATION POLICIES ONTELEMEDICINE AND TELERADIOLOGY
The AMA is the largest medical professional society in the United States,encompassing the spectrum of medical specialties and issues. The growingimportance of telemedicine, which includes teleradiology and PACS, hascaptured the association’s attention at its highest levels. This has led to theissuance of several reports and implementation of certain policies.
In 1996, the AMA published “The Promotion of Quality Telemedi-cine,” which was jointly issued by the Council on Medical Education andthe Council on Medical Service. In this document, the AMA supports theACR position that physicians providing “authenticated interpretation ofimages transmitted by teleradiology” should maintain licensure “appropri-ate to the delivery of radiologic service” at both the transmitting and receiv-
PACS: A Guide to the Digi tal Revolut ion152
DRE08 11/16/2005 9:39 AM Page 152

ing sites. As noted previously, this position generally requires that a radiol-ogist interpreting telemedicine studies maintain full licensure in both thetransmitting and the receiving jurisdictions. However, if the service providedis “curbside consultation,” a phrase used to describe an informal secondopinion where there is no expectation of compensation, the AMA policy recognizes that a full and unrestricted license is not needed.
AMA policy, however, does not recognize the ACR Teleradiology Stan-dard and related standards as such. Under AMA policy for “practice param-eters,” as recognized in the AMA Policy for the Promotion of Telemedicine,such parameters serve as “educational tools” and “strategies for patient man-agement that are designed to assist physicians in clinical decision making.”This is distinct from the legal concept of a “standard of care,” the level ofmedical care established necessary to defeat allegations of negligence in amalpractice action. Generally, this standard is established by physicians, tes-tifying as experts as to the level of care required. Furthermore, a relatedpolicy states that “practice parameters developed by a particular medical spe-cialty or specialties should not preclude the performance of the proceduresor treatments addressed in that practice parameter by physicians who are notformally credentialed in that specialty or specialties.” Thus, under existingAMA policy, ACR standards on teleradiology and digital image data man-agement serve only an educational purpose and are not acknowledged toestablish an actual standard of care.
The AMA has also tracked developments in telemedicine and teleradi-ology. In 1996, the House of Delegates, the AMA’s governing body, adopteda resolution directing the association to monitor activities of hospitals, specialty societies, and regulatory agencies that affect telemedicine andsubmit a report. The result of this resolution was the Status Report ofTelemedicine, issued at the 1997 interim meeting, a substantial portion ofwhich outlined ACR actions in the area. ACR initiatives such as the DICOMstandard, developed in conjunction with the NEMA, were acknowledged.The document also noted that the FDA Center for Devices and Radiologi-cal Health had encouraged such collaboration between the clinical commu-nity, as represented by the ACR, and manufacturers of diagnostic imagingequipment.
Given the growing importance of telemedicine in general and tele-radiology in particular, there is little doubt that the AMA will continue totrack developments and generate policy in the area. For the present, it isunlikely that the association will change its stance requiring full and unre-stricted licensure in both transmitting and receiving jurisdictions in thesetting of teleradiology, or acknowledge that ACR standards represent theprofessional standard of care.
LEGAL ISSUES AND FORMAL POLICIES 153
DRE08 11/16/2005 9:39 AM Page 153

GOVERNMENT REGULATIONS
Both the federal and state governments are involved in the regulation of teleradiology and PACS. This regulatory authority stems from legislationthat controls medical devices, healthcare benefits, and the practice of medi-cine, with the regulations themselves drafted by a variety of administrativeagencies. Generally, regulation at the federal level is directed at medicaldevices and the provision of healthcare benefits. At the state level, the dom-inant activity is regulation of medical practice.
FEDERAL GOVERNMENT
FOOD AND DRUG ADMINISTRATION
The FDA has its regulatory authority for medical devices grounded in theFood, Drug and Cosmetics Act, as amended by Medical Device Amendmentsof 1976 and other amendments, which requires that products be safe andeffective for their marketed indication(s). The definition of a “medicaldevice” under the act is extremely broad—broad enough to include devicesemployed for teleradiology and PACS. Devices regulated by the agency arebroken down into several distinct groups. Initially, all devices are arbitrarilyseparated into those legally marketed prior to implementation of the MedicalDevice Amendments on May 28, 1976, and those marketed after that date.These are known as “pre-amendment” and “post-amendment” devices,respectively.
Pre-amendment devices are further divided into 3 classes, based onpotential patient risk. Devices with the least risk are placed in class I, whichis subject only to “general controls.” Class I products are not individuallyregulated. Rather, their safety and effectiveness are assured by general con-trols, which include manufacturing and labeling controls. General controlsare considered important for all medical devices. Accordingly, they also applyto class II and III products.
Class II is the intermediate regulatory category for devices with higherrisk to patients than class I but not requiring the highest degree of regula-tion. Products in this class are subject to “special controls,” specific regula-tions designed to assure their safety and effectiveness. As with class I, thesedevices are not individually regulated, with each generic product type subjectto applicable special controls.
Class III is the most stringent regulatory category. It is reserved forproducts with either a potentially unreasonable risk of patient injury or with
PACS: A Guide to the Digi tal Revolut ion154
DRE08 11/16/2005 9:39 AM Page 154
insufficient data to establish actual patient risk. Devices in this class are tech-nically subject to a premarket approval process, requiring demonstration ofsafety and effectiveness prior to marketing. However, pre-1976 class IIIproducts are “grandfathered” and may be legally marketed until such timeas the FDA requests such data and the manufacturer either fails to providethem or the data fail to show safety and effectiveness.
Post-amendment devices are generally subject to a premarket notifica-tion process, which generally applies to higher-risk class II and all class IIIproducts. This requires that a manufacturer provide the FDA notice of itsintention to market a product. If the agency determines that the product is“substantially equivalent” to a pre-amendment device (or a post-amendmentdevice that has been reclassified to class I or II), that device may be legallymarketed subject to the regulations currently applicable to its “predicate”device. Should there be no pre-1976 equivalent, the device is automaticallyplaced in class III, subject to the premarket approval process. Lower-riskproducts may be reclassified to class I or II, although this generally requiresevidence that the device’s risk is appropriate to the new classification.
Teleradiology and PACS were not in existence in the pre-1976 worldof medical devices. Though these post-amendment devices could have beenautomatically placed in class III, the FDA treated teleradiology and PACSequipment as accessories to the imaging devices that they serviced, avoidingthe premarket approval process. However, this made marketing approval for the devices somewhat complicated, as the products were not themselvesclassified.
The FDA moved to end this system in 1996, issuing the policy state-ment “Telemedicine Related Activities.” While reinforcing the agency’sauthority to regulate teleradiology and PACS devices, the statement pro-posed formally classifying the products. Image storage devices and medicalimage devices were to be placed in class I and exempted from the premarketnotification requirement unless irreversible compression was used. Medicalimage digitizers, medical image hardcopy devices, and PACS systems wereto be class II products. General purpose products used in a medical settingwere not to be regulated, unless labeled for a medical use. The latter cate-gory could include such items as word-processing software employed in aPACS system.
The agency issued its final rule effecting these changes on April 29,1998. As proposed in Teleradiology and Related Activities, these regulationsplaced medical image storage devices in class I, exempt from the premarketnotification requirement unless irreversible compression is used. Medicalimage digitizers, medical image hardcopy devices, and PACS were made classII devices. A number of “voluntary standards” are to serve as special controls
LEGAL ISSUES AND FORMAL POLICIES 155
DRE08 11/16/2005 9:39 AM Page 155

for these devices: (1) DICOM; (2) Joint Photographic Experts Group( JPEG), which specifies methods for reversible and irreversible compressionof digital medical images; and (3) the Society of Motion Picture and Televi-sion Engineers test pattern, used to test monitors and printers for accept-ance and quality control purposes.
HEALTHCARE FINANCING ADMINISTRATION
The HCFA oversees the federal Medicare program, disbursing vast sums ofmoney to healthcare providers and institutions nationwide. Given the scopeof Medicare, HCFA regulations applicable to Medicare fund recipients havea broad impact on the provision of U.S. health care. HCFA itself is governedby the Privacy Act of 1974, a federal statute that protects the confidential-ity of individually identifiable data. In practice, the act requires that HCFAkeep the records of its Medicare patients confidential. HCFA is also subjectto certain provisions of HIPAA, in which Congress mandated certain secu-rity and electronic signature requirements.
Recently, HCFA has become concerned that certain electronic datatransmissions have the potential to violate patient confidentiality and hencethe Privacy Act of 1974. Its response was the HCFA Internet Security Policy,issued in November 1998. This document applies to what HCFA describesas “HCFA Privacy Act-protected and/or sensitive HCFA information,”which includes: (1) all individually identifiable data held in systems ofrecords; (2) payment information that is used to authorize or make cash pay-ments to individuals or organizations; (3) proprietary information that hasvalue in and of itself and that must be protected from unauthorized disclo-sure; and (4) computerized correspondence and documents that are consid-ered highly sensitive and/or critical to an organization and that must beprotected from unauthorized alteration and/or premature disclosure.
The HCFA Internet Security Policy allows covered data to be trans-mitted via the Internet, as long as “an acceptable method of encryption” isutilized to provide confidentiality and integrity of the data. Furthermore,authentication or identification procedures must be employed to assure thatboth the sender and the recipient of the data are known to each other andare authorized to receive and decrypt such information. The policy coversall systems or processes that use the Internet or interface with the Internetto transmit sensitive data. However, it does not apply to local data-at-rest orlocal host or network protections, although it is explicit that such local datamust still be protected by “all necessary measures.”
The HCFA Internet Security Policy describes in considerable detail thetechnical specifications of acceptable practices. Minimally acceptable encryp-
PACS: A Guide to the Digi tal Revolut ion156
DRE08 11/16/2005 9:39 AM Page 156

tion methods as of November 1998 include algorithms such as Triple 56-bitDES (defined as 112-bit equivalent) for symmetric encryption, 1024-bitalgorithms for asymmetric systems, and 160 bits for elliptical curve systems.The agency explicitly reserves the right to increase these minimum levelswhen “deemed necessary” by advances in techniques and capabilities associ-ated with the processes used by attackers to break encryption.
Acceptable authentication approaches, accomplished over the Internetvia an “in-band” process, include: (1) formal certificate authority-based useof digital certificates; (2) locally managed digital certificates, provided thatall parties to the communication are covered by the certificates; (3) self-authentication, as in internal control of symmetric “private keys”; and (4)tokens or “smart cards.” Acceptable identification approaches, undertakenoutside the Internet via an “out-of-band” process, include: (1) telephonicidentification of users and/or password exchange; (2) exchange of passwordsand identities by U.S. certified mail; (3) exchange of passwords and identi-ties by bonded messenger; (4) direct personal contact exchange of passwordsand identities; and (5) tokens or smart cards.
Entities subject to the HCFA Internet Security Policy must modifytheir security plan to detail the methodologies and protective measures usedif they employ the Internet for transmission of covered data and to ade-quately test these implemented measures. HCFA reserves the right to auditthese organizations and their security policies. Finally, any organizationwishing to transmit covered data via the Internet must inform HCFA of itsintent to do so.
HCFA is in the midst of promulgating formal regulations addressingsecurity of electronic individual healthcare information, as well as health planuse of electronic signatures.
DEPARTMENT OF HEALTH AND HUMAN SERVICES
HEALTH INSURANCE PORTABILITY AND ACCOUNTABILITY ACT Thepassage of HIPAA has driven many to demand improvements in the man-agement of the information systems within the healthcare system. When thePrivacy Act of 1974 was passed, many saw the legislation as ineffectivebecause it allowed the disclosure of the information without the subject’sapproval when the use of the information was routine. The rules that gov-erned the definition of routine use were expanded, and the loopholes in thelaw continued to increase. Second, the burden of enforcement was placedentirely on the individual via the filing of a civil suit. However, the frame-work established by the Privacy Act of 1974 and HCFA have led to the devel-opment of a framework for HIPAA.
LEGAL ISSUES AND FORMAL POLICIES 157
DRE08 11/16/2005 9:39 AM Page 157

The Health Insurance Portability and Accountability Act is brokendown into 3 principal rules:
◗ Transaction Rule: The facilitation of the exchange of informationbetween providers and payers
◗ Privacy Rule: The empowerment of patients for access and controlof their medical information
◗ Security Rule: The safeguards for the information exchanged in thetransaction and privacy rules
Since computerized information systems drive almost every departmentwithin the hospital, the Security Rule will rely heavily on information tech-nology to provide the required support to meet the other rules enforcement.Experts estimate that probably 10% or fewer of private healthcare organi-zations have adequate security; in other words, 90% or more have inade-quate security. The implementation of security within a practice’sinformation system is a complex process ranging from the establishment ofdependable secure workflows of most departmental operations to the imple-mentation of many new technical or operational changes to the existinginformation technology. The details regarding the implementation of poli-cies and procedures to ensure HIPAA compliance are well beyond the scopeof this book.
STATE GOVERNMENT
LICENSURE
At its most basic level, teleradiology is the practice of medicine. The rightof the individual states to license such practice has been settled law in the United States since the turn of the century, when the U.S. SupremeCourt upheld a West Virginia statute requiring that physicians practicing inthat state obtain a license based on criteria established by the state (Dent v.West Virginia). Today, states enforce their licensure prerogative throughmedical practice statutes, which typically define what constitutes the “prac-tice of medicine” and therefore who is subject to medical licensure. The def-inition of the practice of medicine is usually broad, as with North Carolina’sstatute:
any person shall be regarded as practicing medicine or surgery . . . who shall diag-nose or attempt to diagnose, treat or attempt to treat, operate or attempt to operate
PACS: A Guide to the Digi tal Revolut ion158
DRE08 11/16/2005 9:39 AM Page 158

on, or prescribe for or administer to, or profess to treat any human ailment, physi-cal or mental, or any physical injury to or deformity of another person
Although teleradiology is not specifically mentioned in this and otherstatutes, there is little doubt that the broad definition of medical practiceencompasses the in-state teleradiology practitioner. The impact on out-of-state physicians who consult about patients located within the jurisdiction isless clear. To eliminate this confusion, many states have amended theirmedical practice statutes to clarify their applicability to out-of-state tele-radiology practitioners (Goldberg and Gordon 1998). In states wherestatutes have not been altered, the impact on out-of-state practitionersremains uncertain.
Many states have various exceptions to their licensure requirement. Forexample, out-of-state physicians rendering emergency treatment are oftenexempt. “Occasional” consultants may be exempt, but the definition of whatlevel of activity qualifies differs between states. Several states have “borderstates exceptions,” which exempt licensed physicians in immediately neigh-boring states from the state’s licensure requirement. Given the nature of teleradiology practice, with its typically nonemergent, recurrent nature andbroad reach, it is likely that the applicability of all of these exemptions willbe limited.
With current medical practice statutes and their exemptions, licensurerequirements for out-of-state teleradiology practitioners fall into 1 of 3general categories: (1) full licensure is either expressly required by statute orpresumed because teleradiology and/or telemedicine is not specifically men-tioned in the applicable medical practice act and no exemption applies; (2) a“special purpose” license for out-of-state teleradiology practitioners is available; and (3) full licensure is not required, though something short offull licensure may be necessary. The last 2 categories are infrequentlyencountered.
Given the potential consequences of violating medical practice statutes,it is advisable to exercise caution in all questionable practice situations. Lossof licensure in a practitioner’s home state, exclusion from federal Medicareand Medicaid programs, and/or loss of malpractice insurance may all be indi-rect consequences of practicing without an appropriate license (CaliforniaBusiness and Professions Code 1998a; 42 USCA. 1998; NORCAL MutualInsurance Co. 1997). Interestingly, violation of the medical practice statuteitself is typically only a misdemeanor (California Business and ProfessionsCode 1998b).
Licensure requirements, current as of April 1999, for the 50 statesappear in Table 8.1. Also included are pertinent, specific state requirements.
LEGAL ISSUES AND FORMAL POLICIES 159
DRE08 11/16/2005 9:39 AM Page 159

PACS: A Guide to the Digi tal Revolut ion160
TABLE 8.1Licensure Requirements (1999)
State Code Specific Requirements
Alabama 3 Grants a 3-year special-purpose license to nonresident telemedicine practitioners. Excludes informal or uncompensated consultations. Subjects licensee to Alabama medical board jurisdiction and requires licensee’s home state to issue reciprocal telemedicine licenses to Alabama physicians.
Alaska 1Arizona 2 “Single or infrequent” consultations are exempted.Arkansas 2 Episodic consultations with Arkansas physicians, provision
of services unavailable in Arkansas, or physical travel to the state to provide care are exempted.
California 3 No license required so long as the telemedicine consultant does not have ultimate authority over the patient; requires specific informed consent from the patient to use telemedicine consultation; exempts telephone conversations and e-mail messages between patient and practitioner.
Colorado 2 “Occasional” consultations exempted.Connecticut 2 “Occasional” consultations exempted.Delaware 1District of 1
ColumbiaFlorida 2 Full licensure for physicians providing official authenticated
interpretations through an ongoing regular arrangement.Georgia 2Hawaii 3 Telepractitioners exempted from licensure if local physician
maintains primary control over the patient’s care.Idaho 2Illinois 2 Out-of-state physicians practicing telemedicine subject
themselves to the jurisdiction of Illinois courts.Indiana 2 Full licensure for telemedicine on a regular routine or
nonepisodic basis.Iowa 1Kansas 2 Exemption for occasional consultation; border states
exemption.
DRE08 11/16/2005 9:39 AM Page 160
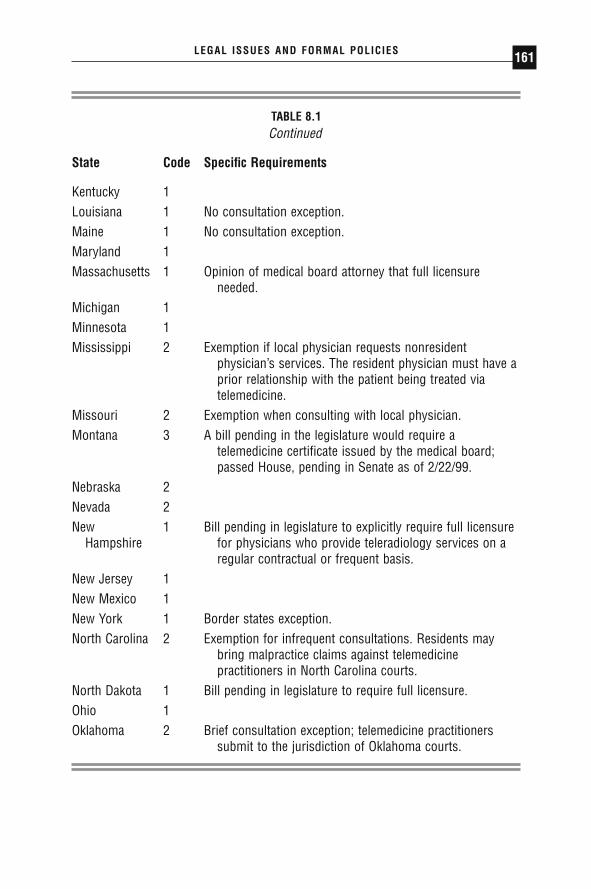
LEGAL ISSUES AND FORMAL POLICIES 161
TABLE 8.1Continued
State Code Specific Requirements
Kentucky 1Louisiana 1 No consultation exception.Maine 1 No consultation exception.Maryland 1Massachusetts 1 Opinion of medical board attorney that full licensure
needed.Michigan 1Minnesota 1Mississippi 2 Exemption if local physician requests nonresident
physician’s services. The resident physician must have a prior relationship with the patient being treated via telemedicine.
Missouri 2 Exemption when consulting with local physician.Montana 3 A bill pending in the legislature would require a
telemedicine certificate issued by the medical board; passed House, pending in Senate as of 2/22/99.
Nebraska 2Nevada 2New 1 Bill pending in legislature to explicitly require full licensure
Hampshire for physicians who provide teleradiology services on a regular contractual or frequent basis.
New Jersey 1New Mexico 1New York 1 Border states exception.North Carolina 2 Exemption for infrequent consultations. Residents may
bring malpractice claims against telemedicine practitioners in North Carolina courts.
North Dakota 1 Bill pending in legislature to require full licensure.Ohio 1Oklahoma 2 Brief consultation exception; telemedicine practitioners
submit to the jurisdiction of Oklahoma courts.
DRE08 11/16/2005 9:39 AM Page 161

PACS: A Guide to the Digi tal Revolut ion162
TABLE 8.1Licensure Requirements (1999) (Continued)
State Code Specific Requirements
Oregon 1 Bill pending in legislature to require a special telemedicine license that is not a limited license but still does not allow the out-of-state physician to practice in the state, except across state lines.
Pennsylvania 1Rhode Island 1South Carolina 1South Dakota 2 Consultation exception limited to maximum 24-hour period
in any 1 year.Tennessee 2 On 5/15/96 the medical board was authorized by the
legislature to issue special telemedicine licenses; as of 2/25/99 there is a bill pending in the legislature that would make transmission of patient medical information via telemedicine technology to a person in another state who is not licensed in Tennessee grounds for license suspension or revocation.
Texas 3 The state board of medical examiners is authorized to issuespecial-purpose licenses for telemedicine; otherwise, full licensure required.
Utah 2 Consultation exception repealed.Vermont 1 Bill pending to authorize special-purpose license.Virginia 1Washington 1 Bill pending that would require telemedicine practitioner to
be sponsored by a local physician.West Virginia 2 Consultation exception provides that consultant cannot
consult for more than 3 months in his lifetime.Wisconsin 1Wyoming 1
Key: 1: States that have not specifically addressed the telemedicine licensure issue,so that full licensure is presumed.2: States that specifically include telemedicine in their definition of medical practiceand expressly require full licensure.3: States requiring something other than full licensure, such as a special-purposelicense or no license in the state.
DRE08 11/16/2005 9:39 AM Page 162

Given the myriad of state licensure requirements, some have advocated amore uniform system of licensure for telemedicine/teleradiology. In 1996,the Federation of State Medical Boards suggested that the states adoptlimited telemedicine licenses. However, leading national medical organiza-tions, such as the ACR and the AMA, have adopted policies advocating fulllicensure in each state where a physician practices teleradiology. The statesthemselves heavily favor full licensure for physicians treating patients withintheir borders and appear extremely reluctant to surrender any authority toregulate such medical care. In this current climate, it is unlikely that any typeof national licensure for teleradiology practice will emerge in the foresee-able future.
OTHER STATE ISSUES
In addition to licensure, many states have enacted legislation that affects teleradiology. Generally, these laws and regulations address teleradiology/telemedicine initiatives within the state, or attempt to coordinate such activ-ities to achieve a public health goal. For example, some states are activelypromoting telemedicine to provide care to their rural populations. A com-plete description of these nonlicensure activities is beyond the scope of thisdiscussion.
RELATED LEGAL CONSIDERATIONS
The practice of teleradiology and PACS storage of image data raise a numberof legal concerns, mostly related to state law doctrines. These includemedical malpractice and record-keeping issues. To date, there are no casesknown to the authors or other commentators directly addressing teleradiol-ogy and PACS (Caryl 1998). Accordingly, most analysis in this area is byanalogy to conceptually similar fact situations.
MEDICAL MALPRACTICE IN TELERADIOLOGY
ESTABLISHING A CLAIM
Teleradiology is medical practice and, as such, exposes a physician to liabil-ity under state tort law, commonly known as medical malpractice. Success-ful malpractice actions require 4 elements: (1) a duty to the patient; (2) a
LEGAL ISSUES AND FORMAL POLICIES 163
DRE08 11/16/2005 9:39 AM Page 163
negligent breach or violation of that duty; (3) patient injury as a result ofthat negligence; and (4) actual damages from the injury. Assuming that apatient has suffered injury that has resulted in damages, as is the case in mostmalpractice actions, the question becomes whether the teleradiology practi-tioner owes a duty to the patient whose images he or she interprets and whatconstitutes negligence in that interpretation.
There is no definitive case law addressing the existence of duty owedto a patient by a teleradiology practitioner. However, most commentatorsbelieve that a doctor-patient relationship exists between a radiologist inter-preting teleradiology images and the patient whose images he or she reviews,a relationship that establishes a duty to that patient (Caryl 1998; Cuzmanesand Orlando 1997). A court decision supporting this proposition is Hand v.Tavera (1993), in which a physician under a managed care contract whorefused to hospitalize a patient was held to have formed a doctor-patient rela-tionship, despite the fact that he had never met or spoken with that patient.The court reasoned that the relationship was established as the patient hadpaid for the physician’s services. Another decision is McKinney v. Schlatter(1997), which found that a telephone consultation is sufficient to establish adoctor-patient relationship, when a physician relied on a cardiologist’s advicethat a clinical problem was not cardiac in nature. Given that a teleradiologypractitioner is paid for his or her interpretation, and that interpretation isordinarily relied on to guide clinical decision making, these cases indicatethat typical teleradiology consultations will be sufficient to establish a dutyto the patient.
It is less clear that a doctor-patient relationship is established when theconsultation is informal, no compensation is received, and no official inter-pretation is rendered. Specifically, if the teleradiology practitioner is engagedin a “curbside consult,” there is the possibility that no relationship will befound (Berger and Cepelewicz 1996). However, if the radiologist receives orexpects any compensation from the consult, it is doubtful that any “curbsideconsult” exception would apply.
A second key requirement of a successful malpractice action is negli-gent breach of a physician’s duty to the patient. Negligence exists when aphysician has violated the medical standard of care, a legal concept whoseexact definition varies among jurisdictions. Generally, this standard is estab-lished by physicians, testifying as experts, as to what constitutes acceptablemedical practice in the fact situation before the court. Although these stan-dards were originally based on practice patterns in the local communitywhere injury occurred, there has been a growing trend in medical malprac-tice to a national standard of care, applicable across jurisdictions. Teleradi-ology, with its wide geographic sweep and cross-jurisdictional nature, will
PACS: A Guide to the Digi tal Revolut ion164
DRE08 11/16/2005 9:39 AM Page 164

almost certainly involve a national standard of care. The exact form this stan-dard takes will depend on case law developed as malpractice cases involvingteleradiology inevitably come before the courts.
CHOICE OF LAW
Medical malpractice is a legal action based in state law—law that may differgreatly among jurisdictions. These differences become problematic when theteleradiology practitioner interprets images of a patient who resides in andwas imaged in another state. Here, the question becomes which law, that ofthe transmitting state or that of the receiving state, to apply.
Although teleradiology and PACS are new technologies, the choice ofwhich state law to apply when a plaintiff and defendant are residents of dif-ferent jurisdictions is not new for the courts. Under well-established law, astate may exercise jurisdiction on an out-of-state individual or corporationprovided that there are “minimum contacts” between the state and the indi-vidual or corporation (International Shoe v. Washington 1945). Three criteriamust be met: (1) the defendant must have purposefully availed him- or herselfof acting in the state; (2) the cause of action must have arisen in the state;and (3) the defendant’s acts must have a substantial enough connection tomake exercise of jurisdiction reasonable (Compuserve, Inc. v. Patterson 1996).In the setting of commercial activity, it is widely acknowledged that com-mitting an act of negligence in a state or doing business in that jurisdictionsatisfies these requirements. Commentators examining teleradiology believethat this doctrine will be used to subject practitioners to the laws of the trans-mitting jurisdiction, although in the absence of applicable court decisions,the question remains unresolved (Caryl 1998). Some states have acted toremove this uncertainty by enacting legislation that specifically subjects out-of-state telemedicine practitioners to the state’s jurisdiction.
The practical implications of a teleradiology practitioner being subjectto the laws of the transmitting jurisdiction may be profound. A radiologistcould find him- or herself facing a local judge or jury potentially hostile toan out-of-state defendant. Perhaps even more important, applicability ofanother state’s jurisdiction may destroy protections a physician enjoys in hisor her home state, such as award limits on the amount of allowable damages.
INSURANCE ISSUES
Interstate teleradiology practice raises professional liability insurance cover-age issues related to the interpretation of images generated outside the prac-
LEGAL ISSUES AND FORMAL POLICIES 165
DRE08 11/16/2005 9:39 AM Page 165
PACS: A Guide to the Digi tal Revolut ion166
titioner’s home state. Coverage of out-of-state teleradiology activities shouldnot be presumed. Not all insurance carriers are licensed in every state, andunderwriting criteria among jurisdictions may vary. Accordingly, many poli-cies specifically exclude coverage for out-of-state incidents, unless a rider hasbeen added to specifically provide such coverage. This means that theunwary teleradiology practitioner subject to an out-of-state malpracticeaction may find his professional liability carrier reserving coverage rights orcompletely denying coverage.
RECORD KEEPING
Data generated from teleradiology and PACS activities are medical records.As such, there are a myriad of considerations regarding data storage, includ-ing where the data must be maintained, their form, and the period of reten-tion. Confidentiality of data is another consideration. Laws, regulations, and institutions’ policies for film and paper records may serve as a guide,though the vary nature of electronic data will necessarily demand specialconsiderations.
Initially, when electronic data are acquired at one site and stored atanother, it is unclear whether these data must be maintained at the trans-mitting site, the receiving site, or both sites. As discussed previously, the ACRStandard for Teleradiology requires only that data be maintained at thetransmitting site. Certainly, any applicable law, regulation, or institutionalpolicy with regard to where data must be maintained should be observed.
The form of stored image data is another consideration. Given thepresent cost of electronic storage and the amount of that storage necessaryto archive medical images, many centers compress data to save resources. Ifcompression is reversible, there is no intrinsic problem. However, when irre-versible, “lossy” compression is employed, there is a question of a medicalrecord being altered and clinically relevant data being lost. In the somewhatanalogous setting of hardcopy medical records, any alteration may beextremely problematic legally, as it calls into question the validity of theentire record (Andrews 1992). It remains to be seen whether storage withlossy compression practice will become an issue for the courts.
The retention period of medical records is subject to federal, state, andinstitutional laws and policies. Laws and policies for the jurisdiction whereelectronic data are being stored should be followed. In addition, the ACRStandard for Teleradiology suggests that teleradiology data being stored atthe receiving facility meet the storage standards at the transmitting facility.
DRE08 11/16/2005 9:39 AM Page 166
LEGAL ISSUES AND FORMAL POLICIES 167
This policy is prudent, given the probable applicability of the transmittingstate’s laws to the teleradiology practitioner.
A final consideration with any stored medical record is confidentiality.Various authorities, the physician/patient privilege, ethical considerations,the constitutional right to privacy, and some state statutory law demand thatthis confidentiality be maintained (Andrews 1992). Although electronicstorage may be a more convenient and accessible format for storing andaccessing medical records, this form of record keeping may be more vul-nerable to security breaches.
As described in the ACR Teleradiology Standard and the ACR Stan-dard for Digital Image Data Management, security is needed for electroni-cally stored medical records. The ACR standards notwithstanding, there isvirtual certainty that the courts would apply the same privacy standards toelectronic records that have been applied to traditional medical records(Alberts v. Devine 1985). This imposes a duty on the physicians and institu-tions using teleradiology and PACS to develop policies that assure reason-able patient confidentiality, or face potential liability for breaches ofconfidentiality.
CONCLUSION
Teleradiology and PACS technology and application have expanded greatlyin the last decade, in many ways leaving behind the laws and policies intendedto regulate and control the field. Even where policies have been developed,such as the ACR Standard for Teleradiology and the ACR Standard forDigital Image Data Management, it is unclear what impact these policies willhave on the practice of teleradiology and the use of PACS. Many of the legaland policies questions being asked by radiologists and others today will notbe answered for years, as legislatures, courts, and professional societiesdevelop approaches to the novel problems posed by the technology. Untilthat time, physicians using teleradiology and PACS technology should usecaution and common sense when confronted with unsettled legal or regula-tory questions.
◗ REFERENCES
42 USCA Section 1320a-7 (1998).Alberts v. Devine, 479 NE2d 113 (Mass 1985), cert. denied, 474 US 1013 (1985).
DRE08 11/16/2005 9:39 AM Page 167
American College of Radiology: ACR Standard for Digital Image Data Manage-ment. Effective January 1, 1999. Reston, VA (1999a).
American College of Radiology: ACR Standard for Teleradiology. Revised 1998;effective January 1, 1999. Reston, VA (1999b).
American Medical Association: House of Delegates Resolution 117 (I-96). InterimMeeting. 1996.
American Medical Association: status report on telemedicine. Council on MedicalService Report 8-I-97. Chicago 1997.
American Medical Association: the promotion of quality telemedicine. Joint reportof the Council on Medical Education and Council on Medical Service, 1996.In: American Medical Association: Continuing Medical Education Resource Guide.Chicago; 1996.
American Medical Association: the promotion of telemedicine. Quoting AMA Poli-cies 410.973 and 410.987. American Medical Association. Chicago; 1999a.
American Medical Association: Policy 410:987[3]. American Medical Association.Chicago; 1999b.
Andrews, BW. Medical records liability. Health Lawyer. Summer 1992;6:11.Berger S, Cepelewicz BB. Medical legal issues in teleradiology. AJR 1996;166:
505–510.California Business and Professions Code § 2305 (1998a).California Business and Professions Code § 2314, § 2315 (1998b).Caryl CJ. Malpractice and other legal issues preventing the development of tele-
medicine. J Law Health. 1998;12:173.Classification for five medical image management devices: final rule. 63 Federal Reg-
ister 43242 (April 29, 1998).Compuserve, Inc. v. Patterson, 89 F3d 1257 (6th Cir 1996).Cuzmanes PT, Orlando CP. Automation of medical records: the electronic super-
highway and its ramifications for healthcare providers. J Pharm Law 1997;6:19.Dent v. West Virginia. 129 US 114 (1889).Federal Food, Drug and Cosmetic Act, § 201 (1999) (codified at 21 USCA 321).Federation of State Medical Boards of the United States, Inc.: a model act to regu-
late the practice of telemedicine or medicine by other means across state lines,executive summary. Euless, TX; October 31, 1995.
Goldberg AS, Gordon JF. Telemedicine: Emerging Legal Issues. Washington, DC:American Health Lawyers Association; 1998.
Hagland M. Six opinions on IT security. Health Manage Technol. 1998;19(6):24–29.Hand v. Tavera, 864 SW2d 678 (Ct. App Tex 1993).HealthCare Financing Administration. internet security policy. Washington, DC;
November 24, 1998a.HealthCare Financing Administration. Proposed rule: security and electronic signa-
ture standards. 63 Federal Register 43242 (August 12, 1998b).
PACS: A Guide to the Digi tal Revolut ion168
DRE08 11/16/2005 9:39 AM Page 168

International Shoe v. Washington, 326 US 310 (1945).McKinney v. Schlatter, 1997 WL 67702 (Ohio App 12 Dist 1997).NORCAL Mutual Insurance Co. Professional Liability Insurance Policy. Part III
Exclusions, A-7. San Francisco; 1997.North Carolina General Statutes § 90-18 (1998).Telemedicine related activities. Center for Devices and Radiological Health, US
Food and Drug Administration. Rockville, MD; July 11, 1996.
LEGAL ISSUES AND FORMAL POLICIES 169
DRE08 11/16/2005 9:39 AM Page 169

TECHNICAL ISSUESTHOMAS J. SCHULTZ
III
DRE09 11/16/2005 9:40 AM Page 171

COMPUTERFUNDAMENTALS
KEITH J. DREYER
The personal computer revolution has dramatically changed our livesforever. Over the past 20 years, with the decrease in hardware costs,
increase in computational performance, and a seemingly endless variety ofsoftware products, computers have entered nearly every facet of our personaland professional lives. One of the best things about computer hardware andsoftware is that you do not have to know how they work to make them workfor you. However, if you can understand just the basics (which is not toohard to do), you can better appreciate how computers can be applied to thefield of radiology. With this in mind, the following pages review the basicsof modern computers. Mainframes or minicomputers are not discussed.Instead, the goal is to define the fundamental components of a microcom-puter—known today as a PC or personal computer—which can easily func-tion as a workstation for primary interpretation of medical images. Importantsoftware concepts such as operating systems and programming languages arealso discussed.
You can think of computers like humans in that they share 4 of thesame basic functions—input, output, memory, and processing (or thought).And since all these functions occur at different locations, there needs to be
9CHAPTER
DRE09 11/16/2005 9:40 AM Page 173
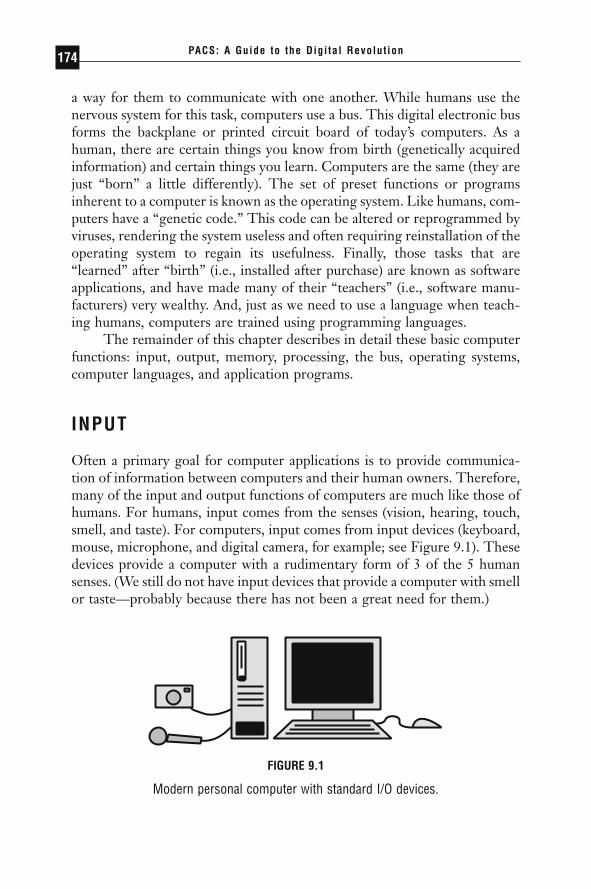
a way for them to communicate with one another. While humans use thenervous system for this task, computers use a bus. This digital electronic busforms the backplane or printed circuit board of today’s computers. As ahuman, there are certain things you know from birth (genetically acquiredinformation) and certain things you learn. Computers are the same (they arejust “born” a little differently). The set of preset functions or programsinherent to a computer is known as the operating system. Like humans, com-puters have a “genetic code.” This code can be altered or reprogrammed byviruses, rendering the system useless and often requiring reinstallation of theoperating system to regain its usefulness. Finally, those tasks that are“learned” after “birth” (i.e., installed after purchase) are known as softwareapplications, and have made many of their “teachers” (i.e., software manu-facturers) very wealthy. And, just as we need to use a language when teach-ing humans, computers are trained using programming languages.
The remainder of this chapter describes in detail these basic computerfunctions: input, output, memory, processing, the bus, operating systems,computer languages, and application programs.
INPUT
Often a primary goal for computer applications is to provide communica-tion of information between computers and their human owners. Therefore,many of the input and output functions of computers are much like those ofhumans. For humans, input comes from the senses (vision, hearing, touch,smell, and taste). For computers, input comes from input devices (keyboard,mouse, microphone, and digital camera, for example; see Figure 9.1). Thesedevices provide a computer with a rudimentary form of 3 of the 5 humansenses. (We still do not have input devices that provide a computer with smellor taste—probably because there has not been a great need for them.)
PACS: A Guide to the Digi tal Revolut ion174
FIGURE 9.1
Modern personal computer with standard I/O devices.
DRE09 11/16/2005 9:40 AM Page 174

OUTPUT
Output for humans comes simply through the movement of muscles. Thisallows us to grasp and move other objects (such as a pencil or a musicalinstrument), which we can further use to communicate our output data (suchas writing or playing music). We can also move certain muscles to generatesound (phonation) to further communicate our output (speech). So insummary, we humans write and draw, talk and sing, and move a variety ofobjects to generate output, or more humanly stated, express our thoughts.With computers, we have tried to emulate several of these human outputsso our computers can communicate with us. Drawing and writing come inthe form of computer monitors and printers (both the film and paper types)(see Figure 9.1). Talking and music generation come through sound cardsand speakers connected to the computer, providing computers with theability to communicate with humans over telephones. Finally, the movementof objects through the use of computers (known as robotics) is well devel-oped for specific applications (e.g., assembly-line automation) but is not gen-erally available to the public yet.
MEMORY
Human memory is poorly understood and quite variable. Its capacity istremendous though its accuracy is anything but perfect (you can test this bytrying to recite the last paragraph you have just read word for word). Com-puter memory, on the other hand, is well defined, highly accurate, and avail-able in very large (albeit expensive) quantities. Computer memory serves avariety of purposes and comes in a variety of forms. Memory is needed tostore input and output data, as well as data calculated during processing (seeFigure 9.2), and to store application programs (that list of instructions that
COMPUTER FUNDAMENTALS 175
FIGURE 9.2
Removable (floppy) drive and media.
DRE09 11/16/2005 9:40 AM Page 175

tells the computer what to do). To serve this variety of purposes best, a widevariety of memory types are available. In general, they come in 3 forms:solid-state—RAM (random access memory), spinning media—HDD (harddisk drive), RAID (redundant array of inexpensive disks), and linear media—optical and magnetic tape storage. These vary in size, speed of access, volatil-ity, and cost.
PROCESSING
At the core of the computer is the central processing unit, or CPU (“proces-sor” for short) (see Figure 9.3). It is the human brain analog. The CPU inter-prets a set of instructions (known as machine code) and performs whatevertasks it is told to do. A list of these tasks, or instructions, is known as a com-puter program. Programs tell the CPU exactly what to do and when to doit (more on programs later).
All modern CPUs are digital, meaning information within them isprocessed using digital or finite states of electronic voltage (v). Typically, 0volts (0v) represents the number “zero” while 5 volts (5v) represents thenumber “one.” All remaining numbers can be represented by a series of 0sand 1s just as we use the series of numerals 0, 1, 2, 3, 4, 5, 6, 7, 8, and 9 torepresent all remaining numbers larger than nine. Humans developed usingthe decimal system (base 10) probably because we have 10 fingers. Com-puters use the binary system (base 2) because a single digital gate (a digitaltransistor) has 2 states (on and off, 5v and 0v, or 1 and 0) to process andstore its information. Conversion from their binary system to our decimalsystem is typically performed by the computer before displaying thesenumbers for human consumption. As an example, binary 10110101 (or 1 ¥
PACS: A Guide to the Digi tal Revolut ion176
FIGURE 9.3
Various CPU boards.
DRE09 11/16/2005 9:40 AM Page 176

20 + 0 ¥ 21 + 1 ¥ 22 + 0 ¥ 23 + 1 ¥ 24 + 1 ¥ 25 + 0 ¥ 26 + 1 ¥ 27, or 1 + 0 + 4+ 0 + 16 + 0 + 64) equals decimal 85 (or 5 ¥ 100 + 8 ¥ 101, or 5 + 80).
While humans typical place commas between 3 groups of our decimaldigits (e.g., 1,500,325), computers group their binary digits (bits) into groupsof 8 (bytes). CPUs today process numbers contained in chunks of 1 to 16bytes (8 to 128 bits) at a time. Modern CPUs use millions of transistors toprocess these huge binary numbers and billions of transistors to store theirresults, all in chips about the size of your thumbnail. They can executeinstructions at well over 1GHz (more than a billion instructions per second).In 1985, computer processors were considered screamers if they ran at 1MHz. Thus, modern CPUs are running a thousand times faster than theydid just 20 years ago—and they keep getting faster.
A wide variety of CPUs are available today from a number of vendorssuch as Intel, AMD, Texas Instruments, Motorola, IBM, and Sony. As longas manufacturers continue to place more and more transistors on a singleintegrated circuit, CPUs will continue to decrease in price while increasingin performance, thereby making all our applications run faster.
THE BUS
Inside your computer is a “motherboard” (see Figure 9.4). Basically, thisboard is the computer, to which is attached a power supply, a surroundingmetal case, and all input/output devices (such as the keyboard, mouse, andmonitor). On the motherboard sit the CPU, the RAM, and connections tothe hard disk. These devices are electronically connected to one another onthe motherboard via the computer bus. The bus has at its disposal a varietyof possible connectors or slots for attaching external devices to your com-
COMPUTER FUNDAMENTALS 177
FIGURE 9.4
PC motherboard and power supply.
DRE09 11/16/2005 9:40 AM Page 177

puter as well. The number and type of connectors, which vary between com-puters, have a large impact on the computer’s expandability. One connector,the AGP (accelerated graphics port), is typically used for connection to avideo display card, which contains more memory and a special CPU, calleda GPU, or graphical processing unit, which manages communication to thecomputer monitor for image display. Basically, data is transmitted from com-puter memory to the video display card, where bytes are converted intopixels, generating the digital image.
All this traffic must go back and forth quickly if an image is to make itto the screen in the blink of an eye. Each time the information moves, ittakes a finite period of time. The wider the bus, the faster the digital trafficcan flow across it. There are many kinds of bus architectures, but for themost part the combination of CPU and operating system functions on a pre-determined or specified bus. In other words, once you buy the computer,you cannot change the bus. Because the bus can be a bottleneck to per-formance, a new bus is designed from time to time to provide greater per-formance. Recently, USB-2 (Universal Serial Bus 2) has become a popularbus for connecting all sorts of external devices to expand the performanceand functionality of today’s computers.
OPERATING SYSTEMS
The operating system (OS) is the software at the heart of the computer. Itis simply a program that performs a variety of basic functions for all otherprograms. (For example, the mouse pointer arrow is actually generated bythe OS. Any program that needs a mouse pointer [such as a radiology work-station] simply uses the OS to generate it.) Examples of some operatingsystems that you might have heard of are CP/M, DOS, LINUX, OS-X,MUMPS, OS/2, SOLARIS, UNIX, VMS, and Windows XP. Without anOS, your computer is merely a lump of silicon and metal. The operatingsystem is what determines what software you can and cannot run on the com-puter. If you have UNIX, forget about running Microsoft Word forWindows. If you have Windows XP, you cannot run Macintosh OS-basedsoftware.
Historical note: MUMPS was the first OS designed primarily for medicalapplication programs. It was designed and developed in 1966 by G. OctoBarnett and Neil Pappalardo to facilitate the management of text-basedmedical information through the use of a hierarchal storage array. It is stillused in a number of modern radiology departments even today.
PACS: A Guide to the Digi tal Revolut ion178
DRE09 11/16/2005 9:40 AM Page 178

An operating system is usually designed to run on a specific CPU orseries of CPUs. That is, you can run DOS on an Intel 286, 386, 486, orPentium, but it will not run on a Motorola-based Mac. As computers havebecome more powerful and compact, operating systems have been designedto take advantage of this power, and they have become graphical so that ordi-nary people can interact with the computer more intuitively. What facilitatestheir interactions are GUIs (pronounced goo-eez) or graphical user inter-faces. Because these GUI-based OSs expose many high-level functions to theend user (e.g., scrolling, drop and drag, wastebaskets), application programsrunning on them have a common look and feel, regardless of who makesthem. In 1984 Apple introduced the Macintosh. Its OS was probably the firstwidely accepted GUI. Shortly thereafter came the Microsoft GUI (akaWindows). Once the first GUI took hold, more GUIs followed, and pro-grams started to take advantage of their advanced, yet repetitive, functionsand features. In fact, you can even find major medical equipment, includingmagnetic resonance (MR) and computed tomography (CT) scanners and vir-tually every kind of picture archiving and communication systems (PACS)component, running applications on GUI OSs on PCs.
COMPUTER LANGUAGES
As mentioned earlier, at the lowest level computers know of only 1s and 0s. If you really want to communicate with a computer in its “native tongue,”you would have to speak binary. Furthermore, the CPU of a computer knowsa very few, rudimentary instructions—what is known as machine languageor machine code. Very few programmers can “talk” in this native tongue,and it is a very inefficient form of human-computer communication (kind oflike getting your point across to someone by tapping on a table). Enter thehigh-level computer language.
Even though the computer can understand only this machine code, ifit had an interpreter it could understand other languages as well. Therefore,if computer scientists could think of a logical way to communicate commandsto a computer, they would just have to write a program (known as an inter-preter, a compiler, or an assembler) to convert that language to machine lan-guage and submit it to the computer. C is an example of just that. It is ahigh-level language that is much more intuitive for programmers to under-stand than machine code and therefore makes them much more efficient. Asingle line of C might convert to thousands of lines of machine language,which the CPU can process in the blink of an eye. Visual C# is a specific
COMPUTER FUNDAMENTALS 179
DRE09 11/16/2005 9:40 AM Page 179

version of the language from Microsoft that uses a GUI programming envi-ronment for RAD (rapid application development). With Visual C#, majorworks can be developed in days.
Other examples of popular high-level languages include C++, VisualBasic, Pascal, and Java. Java, developed by SUN Microsystems, is the newestof these languages, and its popularity is growing rapidly because it can runon a variety of CPUs and OSs without altering any lines of code.
APPLICATION PROGRAMS
Application programs are those software packages that you purchase andinstall after you buy your computer. (Some are actually installed before youbuy, but after the computer is manufactured, and are called “bundled” soft-ware.) Application programs are probably the reason you bought your com-
PACS: A Guide to the Digi tal Revolut ion180
FIGURE 9.5
Sample Web site display using a Web browser.
DRE09 11/16/2005 9:40 AM Page 180
puter in the first place. Examples include word processors, spreadsheets, andradiology primary interpretation applications.
Sometimes application programs become so widely used that they worktheir way into the OS. A good example of this is the browser applicationused to “surf the Web” (see Figure 9.5). Considerable debate has been underway recently as to whether the browser should reside in the OS or shouldbe sold separately. This seemingly simple decision drastically changes thelandscape for nearly every software vendor—thus the debate.
CONCLUSION
We could not sustain medical imaging growth (or civilization, for thatmatter), as we currently know it, without computers. They continue toimprove in performance and usability and decrease in cost and size. For themto become even more widely accepted, however, they will have to commu-nicate better with their human users. This is happening already (see Chapter25, “Voice Recognition”). It is shortsighted to exclude anything from therange of possibilities of what computers may be able to do in the future.Compared to the millions of years required for nature-guided human evo-lution, in the past few decades computers have progressed at unprecedentedrates. One can only hope that before we make them too intelligent, they willhave learned to appreciate their creators. For more information on computerfundamentals, please visit http://www.MyRadiology.com.
COMPUTER FUNDAMENTALS 181
DRE09 11/16/2005 9:40 AM Page 181
DIGITAL IMAGINGFUNDAMENTALS
KEITH J. DREYER • MANNUDEEP K. KALRA
From its inception over a century ago, radiology has provided a view intohuman anatomy and pathology via signal detection and image generation.
For decades, the only imaging modality available to the science was projec-tion radiography, in which all nonabsorbed signals were converted to animage by a sheet of radiographic film. There was no opportunity for digitalimage processing because there were no digital images.
Things have changed drastically for radiology in the last half century.New digital methods of capturing anatomy, pathology, and physiology havebeen invented (e.g., computed tomography [CT], magnetic resonance [MR],ultrasound, and positron emission tomography), and even projection radi-ography has become digitized (e.g., computed radiography and direct radi-ography). It is this infiltration of digital imaging into radiology that hasallowed digital image processing to become a fundamental part of all modernradiology departments.
10CHAPTER
DRE10 11/16/2005 9:41 AM Page 183

WHY IMAGING?
One may ask, why generate images at all? Many of the native signals detectedby radiological modalities today bear little resemblance to an image. Typi-cally, extensive signal processing is necessary to generate even a rudimentarytwo-dimensional image, let alone the complex images that we are familiarwith today. Keeping in mind that humans contain biological signal proces-sors capable of interpreting all sorts of analog data, why not simply presentthe signal itself in its native form for interpretation? With more than half ofthe human brain dedicated to image processing, one can quickly see that avisual image is one of the best signals to use when representing data forsophisticated human interpretation.
Radiological modalities that convert their native signal informationinto visual images are far easier for humans to interpret. The more the result-ing images resemble directly observed human anatomy, the easier it is forthe observer to create a frame of reference for their subsequent interpreta-tion. The ability to differentiate between normal and abnormal (pathologicstates are detected by the identification of abnormal anatomy and/or physi-ology) is fundamental to the radiological diagnosis of disease. While muchof the ability to differentiate these states depends on the observer’s experi-ence (knowledge of human pathophysiology and its imaging presentationstates), creating an ideal image is paramount to making the correct diagno-sis. It is, in large part, the science of digital image processing that will allowus to create an ideal image to enhance the interpretation process.
DIGITAL IMAGES
Before we begin exploring digital image processing, we must first understandhow a digital image is constructed. A digital image is a representation of atwo-dimensional image as a finite set of digital values called picture elementsor pixels (Figure 10.1). (Note: The term “digital image” also applies to dataassociated with points scattered over a three-dimensional [3-D] region, suchas those produced by CT and magnetic resonance imaging (MRI). In thatcase, each signal sample is called a voxel, or volume element, instead of apixel. These 3-D image types are described in detail in Chapter 22.) Pixelsare organized into rows and columns. In fact, the spatial resolution of animage is determined by the number of rows and columns. Typical resolu-tions for medical images are 512 ¥ 512, 1024 ¥ 1024 and 2048 ¥ 2048. Pixelsof medical images are typically so small and so numerous that, when dis-
PACS: A Guide to the Digi tal Revolut ion184
DRE10 11/16/2005 9:41 AM Page 184
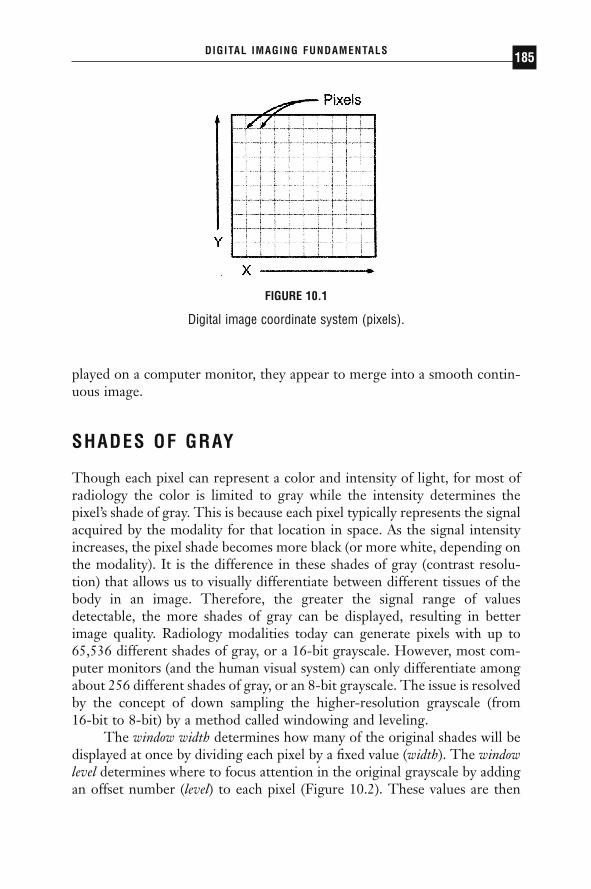
played on a computer monitor, they appear to merge into a smooth contin-uous image.
SHADES OF GRAY
Though each pixel can represent a color and intensity of light, for most ofradiology the color is limited to gray while the intensity determines thepixel’s shade of gray. This is because each pixel typically represents the signalacquired by the modality for that location in space. As the signal intensityincreases, the pixel shade becomes more black (or more white, depending onthe modality). It is the difference in these shades of gray (contrast resolu-tion) that allows us to visually differentiate between different tissues of thebody in an image. Therefore, the greater the signal range of valuesdetectable, the more shades of gray can be displayed, resulting in betterimage quality. Radiology modalities today can generate pixels with up to65,536 different shades of gray, or a 16-bit grayscale. However, most com-puter monitors (and the human visual system) can only differentiate amongabout 256 different shades of gray, or an 8-bit grayscale. The issue is resolvedby the concept of down sampling the higher-resolution grayscale (from 16-bit to 8-bit) by a method called windowing and leveling.
The window width determines how many of the original shades will bedisplayed at once by dividing each pixel by a fixed value (width). The windowlevel determines where to focus attention in the original grayscale by addingan offset number (level) to each pixel (Figure 10.2). These values are then
DIGITAL IMAGING FUNDAMENTALS 185
FIGURE 10.1
Digital image coordinate system (pixels).
DRE10 11/16/2005 9:41 AM Page 185

normalized down to a resultant 8-bit pixel for subsequent computer monitordisplay.
IMAGE PROCESSING
Image processing can be thought of as the digital manipulation of an imagethat results in a new (and, one hopes, improved) image (Table 10.1). A goodexample of this is the windowing and leveling algorithm described above. Itprovides the observer with the ability to enhance different aspects of theoriginal image, producing new images that when collectively displayedprovide more information to the observer than the original image did. Otheralgorithms used for image processing include histogram equalization, geo-
PACS: A Guide to the Digi tal Revolut ion186
Pixel Value Input
Lum
inan
ce O
utpu
t
Win
dow
Lev
el
Window Width
FIGURE 10.2
Visual representation of window level techniques.
TABLE 10.1Digital Imaging Techniques
Technique In Out
Image Processing Image ImageImage Analysis Image MeasurementsImage Understanding Image High-Level Description
DRE10 11/16/2005 9:41 AM Page 186

metric transformations (zoom, rotate, pan), image fusion, noise reduction,edge enhancement, segmentation, frequency transformations, and imagecompression. Many of these rudimentary image-processing functions areavailable with picture archiving and communication systems (PACS) andtheir respective primary interpretation workstations.
IMAGE ANALYSIS
Where image processing ends, image analysis typically begins. Image analy-sis is defined as the processing performed on an image that results in meas-urements or other low-level descriptors. Examples of image analysis are thealgorithms used to measure bone density on CT, cardiac index on CTangiography, or tumor volumes on MR. The results are measurements thatcan be compared to an index and/or previous values to monitor disease pro-gression. Most medical image analysis algorithms today require some manualintervention (semiautomated analysis) using the human to begin the process(seed planting) with the computer providing tireless consistency to theremaining, otherwise subjective, measurement tasks.
IMAGE UNDERSTANDING
Beyond image analysis is the complex field of image understanding. Inmedical imaging, image understanding is often referred to as CAD, or com-puter-aided diagnosis. Most CAD systems of today attempt to find (throughfeature extraction) an aspect of the medical image data that suggests the presence of disease. Oftentimes these areas of concern are indicated to theradiologist by an overlay (i.e., arrow, circle) produced by the image-understanding algorithm. It remains the responsibility of the radiologist todetermine the validity of these automatically identified areas of concern.
CONCLUSION
The use of digital imaging in medicine has provided a wealth of value toradiology in the healthcare enterprise. It has allowed for the elimination of film and for the digital storage, retrieval, transfer, and display of imagesanywhere throughout the enterprise, or throughout the world. Thoughimage-processing algorithms are performed daily in hospitals every-where, image-analysis and image-understanding methods remain elusive. It
DIGITAL IMAGING FUNDAMENTALS 187
DRE10 11/16/2005 9:41 AM Page 187

is these authors’ belief that the next great digital revolution in medicalimaging will occur when the secrets to these final challenges start to berevealed. For more information on digital-imaging fundamentals, please visithttp://www.MyRadiology.com.
PACS: A Guide to the Digi tal Revolut ion188
DRE10 11/16/2005 9:41 AM Page 188

IMAGEACQUISITION
KATHERINE P. ANDRIOLE
Digital acquisition of data from the various imaging modalities for inputto a picture archiving and communication system (PACS) is covered in
detail in this chapter. Essential features for successful clinical implementa-tion including conformance with the Digital Imaging and Communicationsin Medicine (DICOM) standard, radiology information system–hospitalinformation system (RIS-HIS) interfacing, and workflow integration are dis-cussed. Image acquisition from the inherently digital cross-sectional modal-ities such as computed tomography (CT) and magnetic resonance imaging(MRI) are reviewed, as well as digital acquisition of the conventional pro-jection x-ray utilizing computed radiography (CR), digital radiography (DR),and film digitizers for digital acquisition of images originally recorded onfilm.
Quality assurance (QA) and quality control (QC) for a PACS aredescribed with emphasis on QA-QC procedures and troubleshooting prob-lems occurring specifically at image acquisition. Future trends in imageacquisition for digital radiology and PACS will be introduced includinganticipated changes in image datasets (such as increased matrix size,increased spatial resolution, increased slice number and study size, and
11CHAPTER
DRE11 11/16/2005 9:43 AM Page 189

improved image quality); changes in the imaging devices themselves (suchas smaller footprints and more portability); and image-processing capabili-ties for softcopy display.
INTRODUCTION TO IMAGE ACQUISITION
INTEGRATION WITH PICTURE ARCHIVING ANDCOMMUNICATION SYSTEMS
Image acquisition is the first point of data entry into a PACS, and as such,errors generated here can propagate throughout the system, adversely affect-ing clinical operations. General predictors for successful incorporation ofimage acquisition devices into a digital imaging department include ease ofdevice integration into the established daily workflow routine of the clinicalenvironment, high reliability and fault tolerance of the device, simplicity andintuitiveness of the user interface, and device speed.
DIGITAL IMAGING AND COMMUNICATIONS IN MEDICINE
Imaging modality conformance with the Digital Imaging and Communica-tions in Medicine (DICOM) standard is critical; only a basic summary isincluded here. DICOM consists of a standard image format as well as anetwork communications protocol. Compliance with this standard enablesan open architecture for imaging systems, bridging hardware and softwareentities and allowing interoperability for the transfer of medical images andassociated information between disparate systems.
The push by the radiological community for a standard format acrossimaging devices of different models and makes began in 1982. Collabora-tion between the American College of Radiology (ACR) and the NationalElectrical Manufacturers Association (NEMA) produced a standard format(ACR-NEMA 2.0) with which to store an image digitally. It consisted of afile header followed by the image data. The file header contained informa-tion relevant to the image, such as matrix size or number of rows andcolumns, pixel size, and grayscale bit depth, as well as information about theimaging device and technique, (e.g., Brand X CT scanner, acquired with con-trast). Patient demographic data such as name, date of birth, and so on, werealso included in the image header. The ACR-NEMA 2.0 standard specifiedexactly where in the header each bit of information was to be stored, suchthat the standard required image information could be read by any device,
PACS: A Guide to the Digi tal Revolut ion190
DRE11 11/16/2005 9:43 AM Page 190
simply by going to the designated location in the header. This standardunified the format of imaging data but functioned only as a point-to-pointprocedure.
In 1994, at the Radiological Society of North America (RSNA)Meeting, a variety of imaging vendors participated in an impressive demon-stration of the new and evolving imaging standard (ACR-NEMA 3.0) orwhat is currently known as the DICOM standard. Participants attached theirdevices to a common network and transmitted their images to one another.In addition to the standard image format of ACR-NEMA 2.0, the DICOMstandard included a network communications protocol, or a common lan-guage for sending and receiving images and relevant data over a network.
The DICOM standard language structure is built on informationobjects (IO), application entities (AE), and service class users (SCU) andproviders (SCP). Information objects include, for example, the image types,such as CT, MRI, CR, and the like. The application entities include thedevices, such as a scanner, workstation, or printer. The service classes (SCU,SCP) define an operation on the information object via service object pairs(SOP) of IO, SCU, and SCP. The types of operations performed by an SCU-SCP on an IO include storage; query-retrieve; verification; print; studycontent notification; and patient, study, and results management.
The DICOM standard is used, for example, to negotiate a transactionbetween a compliant imaging modality and a compliant PACS workstation.The scanner notifies the workstation, in a language both understand, that ithas an image study to send to it. The workstation replies to the modalitywhen it is ready to receive the data. The data is sent in a format known toall, the workstation acknowledges receipt of the image, and then the devicesend their negotiation. Figure 11.1 shows the results of an example PACS toolfor reading the DICOM header. Shown are elements in Groups 8 and 10pertaining to image identification parameters (such as study, series, imagenumber) and patient demographics (such as patient name, medical recordnumber, date of birth), respectively.
Prior to DICOM, the acquisition of digital image data and relevantinformation was extremely difficult, often requiring separate hardwaredevices and software programs for different vendors’ products, and even fordifferent models of devices made by the same manufacturer. Most of themajor manufacturers of imaging devices currently comply with the DICOMstandard, thus greatly facilitating an open systems architecture consisting ofmultivendor devices. For many legacy devices purchased prior to the estab-lishment of DICOM, an upgrade path to compliance can be performed. Forthose few devices that do not yet meet the standard, interface boxes con-sisting of hardware equipment and software programs that convert the image
IMAGE ACQUISITION 191
DRE11 11/16/2005 9:43 AM Page 191

data from the manufacturer’s proprietary format to the standard form areavailable.
RADIOLOGY INFORMATION SYSTEM–HOSPITALINFORMATION SYSTEM INTERFACING FOR DATA VERIFICATION
Equally essential, particularly at acquisition, is integrating the RIS and/orHIS with the PACS. This greatly facilitates input of patient demographics(name, date, time, medical record number [MRN] to uniquely identify apatient, accession number [AccNum] to uniquely identify an imaging exam-ination, exam type, imaging parameters, etc.), and enables automatic PACSdata verification, correlation, and error correction with the data recorded inthe RIS-HIS. Most imaging modalities are now tightly coupled with the RIS,providing automatic downloading of demographic information from the RISvia barcode readers or directly to the scanner console (via modality worklist
PACS: A Guide to the Digi tal Revolut ion192
FIGURE 11.1
The output of an example of a PACS tool for reading the DICOMheader. Shown are elements in Groups 8 and 10, pertaining to imageidentification parameters (such as study, series, image number) andpatient demographics (such as patient name, medical recordnumber, date of birth), respectively.
DRE11 11/16/2005 9:43 AM Page 192

capability) and hence to the DICOM header. This eliminates the highlyerror-prone manual entry of data at acquisition.
Health Level Seven (HL7) is the RIS-HIS standard, and compliancewith it is desirable. RIS-HIS databases are typically patient-centric, enablingquery and retrieval of information by the patient, study, series, or image datahierarchy. Integration of RIS-HIS data with the PACS adds intelligence tothe system, helping to move data around the system based on “how and whatdata should be delivered where and when,” automating the functions per-formed traditionally by the film librarian.
MODALITY WORKLIST
Many vendors now provide the capability to download RIS-HIS schedulesand worklists directly to the imaging modality, such as most CT, MRI, digitalfluoroscopy (DF), and ultrasound (US) scanners. In these circumstances, theimaging technologist need only choose the appropriate patient’s name froma list on the scanner console monitor (by pointing to it on a touch-screenpad), and the information contained within the RIS-HIS database will bedownloaded into the PACS header and associated with the image data forthat patient examination.
In the general DICOM model for acquisition of image and relevantdata from the imaging modality, the modality device acts as an SCU, and thedata is stored to an SCP device such as a PACS acquisition gateway or animage display workstation. In the modality worklist function, however, theimage device receives the pertinent patient demographics and image studyinformation from a worklist server, such as a PACS, RIS, or RIS-HIS inter-faced device.
There are two modes for accomplishing the RIS-HIS data transfer tothe imaging modality. In the first, data is transferred automatically to themodality based on the occurrence of an event trigger, such as a scheduledexamination or a patient arrival. The second method involves a query fromthe modality to the RIS-HIS. This may be initiated by entry of some iden-tifier at the modality, such as bar coding of the study AccNum or the patientMRN from the scheduling card. This initiates a request for the associatedRIS-HIS information (patient name, date of birth) to be sent from the work-list server on demand.
The benefits of the DICOM modality worklist cannot be overstated.Incorrectly (manually) entered patient demographic data, such as all the per-mutations of patient name (e.g., James Jones, J Jones, Jones J) can result inmislabeled image files and incomplete study information; correct demo-
IMAGE ACQUISITION 193
DRE11 11/16/2005 9:43 AM Page 193
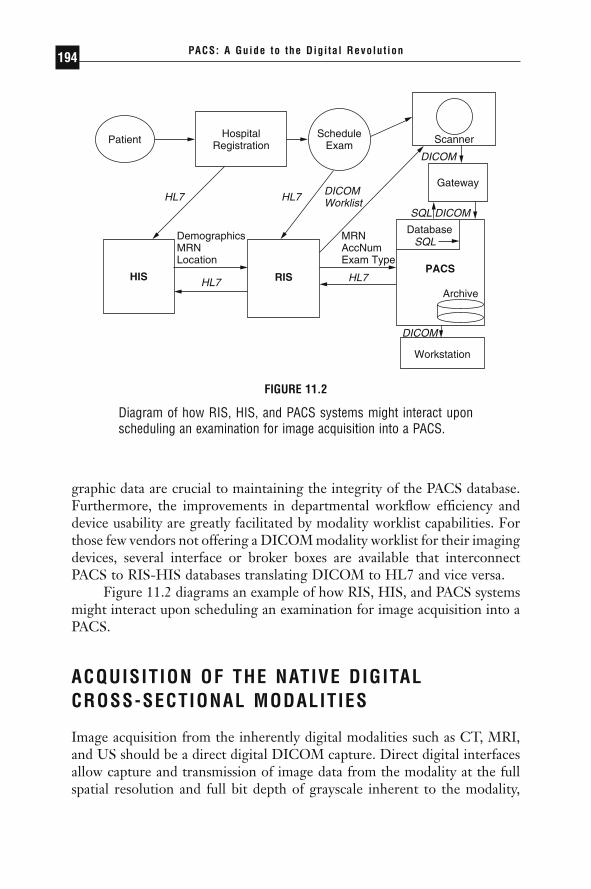
graphic data are crucial to maintaining the integrity of the PACS database.Furthermore, the improvements in departmental workflow efficiency anddevice usability are greatly facilitated by modality worklist capabilities. Forthose few vendors not offering a DICOM modality worklist for their imagingdevices, several interface or broker boxes are available that interconnectPACS to RIS-HIS databases translating DICOM to HL7 and vice versa.
Figure 11.2 diagrams an example of how RIS, HIS, and PACS systemsmight interact upon scheduling an examination for image acquisition into aPACS.
ACQUISITION OF THE NATIVE DIGITAL CROSS-SECTIONAL MODALITIES
Image acquisition from the inherently digital modalities such as CT, MRI,and US should be a direct digital DICOM capture. Direct digital interfacesallow capture and transmission of image data from the modality at the fullspatial resolution and full bit depth of grayscale inherent to the modality,
PACS: A Guide to the Digi tal Revolut ion194
Patient
HIS RISPACS
HospitalRegistration
DemographicsMRNLocation
MRNAccNumExam Type
HL7 HL7
HL7 HL7
DICOMWorklist
SQL DICOM
SQL
DICOM
DICOM
ScheduleExam
Scanner
Gateway
Database
Archive
Workstation
FIGURE 11.2
Diagram of how RIS, HIS, and PACS systems might interact uponscheduling an examination for image acquisition into a PACS.
DRE11 11/16/2005 9:43 AM Page 194
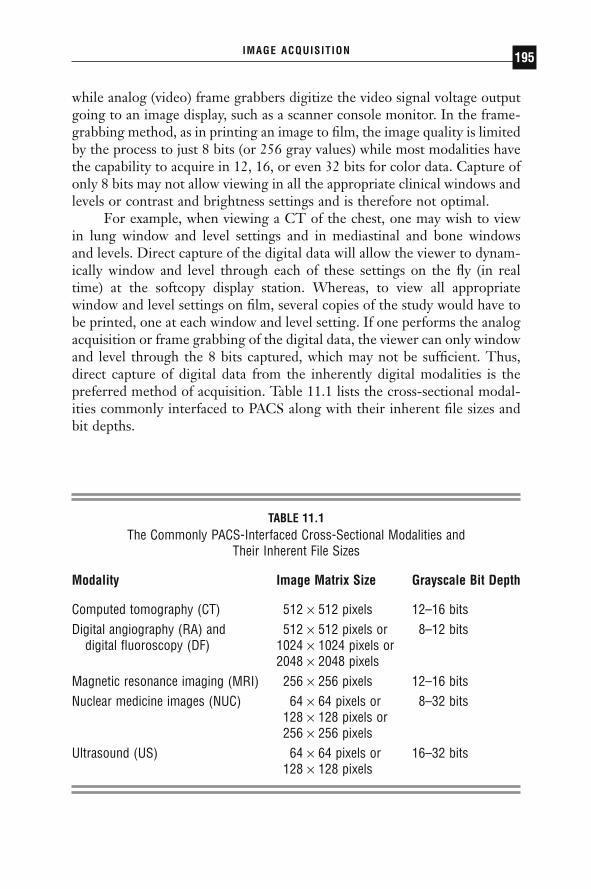
while analog (video) frame grabbers digitize the video signal voltage outputgoing to an image display, such as a scanner console monitor. In the frame-grabbing method, as in printing an image to film, the image quality is limitedby the process to just 8 bits (or 256 gray values) while most modalities havethe capability to acquire in 12, 16, or even 32 bits for color data. Capture ofonly 8 bits may not allow viewing in all the appropriate clinical windows andlevels or contrast and brightness settings and is therefore not optimal.
For example, when viewing a CT of the chest, one may wish to viewin lung window and level settings and in mediastinal and bone windows and levels. Direct capture of the digital data will allow the viewer to dynam-ically window and level through each of these settings on the fly (in real time) at the softcopy display station. Whereas, to view all appropriatewindow and level settings on film, several copies of the study would have tobe printed, one at each window and level setting. If one performs the analogacquisition or frame grabbing of the digital data, the viewer can only windowand level through the 8 bits captured, which may not be sufficient. Thus,direct capture of digital data from the inherently digital modalities is the preferred method of acquisition. Table 11.1 lists the cross-sectional modal-ities commonly interfaced to PACS along with their inherent file sizes andbit depths.
IMAGE ACQUISITION 195
TABLE 11.1The Commonly PACS-Interfaced Cross-Sectional Modalities and
Their Inherent File Sizes
Modality Image Matrix Size Grayscale Bit Depth
Computed tomography (CT) 512 ¥ 512 pixels 12–16 bitsDigital angiography (RA) and 512 ¥ 512 pixels or 8–12 bits
digital fluoroscopy (DF) 1024 ¥ 1024 pixels or2048 ¥ 2048 pixels
Magnetic resonance imaging (MRI) 256 ¥ 256 pixels 12–16 bitsNuclear medicine images (NUC) 64 ¥ 64 pixels or 8–32 bits
128 ¥ 128 pixels or256 ¥ 256 pixels
Ultrasound (US) 64 ¥ 64 pixels or 16–32 bits128 ¥ 128 pixels
DRE11 11/16/2005 9:43 AM Page 195
ACQUISITION OF PROJECTION RADIOGRAPHY
Methods for digital image acquisition of the conventional projection x-rayinclude via CR scanners (imaging with photostimulable or storage phos-phors), digitization of existing analog film, and DR devices. Digital acquisi-tion of images already on film can be accomplished using a variety of imagedigitization devices or film scanners. These include the infrequently usedanalog video cameras with analog-to-digital converters (ADC), digitalcameras, charge coupled devices (CCD), and laser scanners.
FILM DIGITIZERS
Film digitizers will still be necessary even in the all-digital or filmless imagingdepartment, so that film images from outside referrals lacking digital capa-bilities can be acquired into the system and viewed digitally. Film digitizersconvert the continuous optical density values on film into a digital image bysampling at discrete evenly spaced locations and quantizing the transmittedlight from a scan of the film into digital numbers. Several types of film dig-itizers exist today, with some used more frequently than others in PACS andteleradiology applications.
The analog video camera with ADC, or camera on a stick, has beenused in low-cost, entry-level teleradiology applications but is infrequentlyused in PACS applications today because of its manual operation. The analogvideo camera requires an illumination source and careful attention to lenssettings, focus, f-stop, and so forth. In addition, it has a maximum resolu-tion of 1024 ¥ 1024 ¥ 8 bits (256 grays), thus limiting the range of windowand level, or contrast and brightness values the resulting digital image canbe displayed in. Digital cameras produce a digital signal output directly fromthe camera at a maximum resolution of 2048 ¥ 2048 ¥ 12 bits (4096 grays)but are still infrequently used in PACS due to their high cost.
More commonly used are film scanners such as the CCD and laserscanners, sometimes called flatbed scanners. CCD scanners utilize a row ofphotocells and uniform bright light illumination to capture the image. A lensfocuses the transmitted light from the collimated, diffuse light source ontoa linear CCD detector, and the signal is collected and converted to a digitalelectronic signal via an ADC converter. CCD scanners have a maximum res-olution of 4096 ¥ 4096 ¥ 8 to 12 bits, but have a narrow film optical densityrange to which they can respond. CCD scanners have been used in high-end teleradiology or entry-level in-house film distribution systems, such asimage transmission to the intensive care units (ICUs).
PACS: A Guide to the Digi tal Revolut ion196
DRE11 11/16/2005 9:43 AM Page 196

The laser scanner or laser film digitizer uses either a helium-neon(HeNe) gas laser or a solid-state diode laser source. The laser beam is focusedby lenses and directed by mirror deflection components, and the light trans-mitted through the film is collected by a light guide, its intensity detectedby a photomultiplier tube, converted to a proportional electronic signal, anddigitized in an ADC. Laser scanners use a fine laser beam of generally vari-able or adjustable spot sizes down to 50 microns (producing an image sharp-ness of approximately 10 line pairs per millimeter [lp/mm]). They have amaximum spatial resolution of 4096 ¥ 5120 and a grayscale resolution of 12bits and can accommodate the full optical density range of film. They aresemi- or fully automatic in operation and are currently the scanner of choicefor PACS applications even though they are often more expensive than CCDscanners.
COMPUTED RADIOGRAPHY
Computed radiography refers to projection x-ray imaging using photostim-ulable or storage phosphors as the detector. In this modality, x-rays incidentupon a photostimulable phosphor (PSP)-based image sensor or imagingplate (IP) produce a latent image that is stored in the IP until stimulated toluminesce by laser light. This released light energy can be captured and con-verted to a digital electronic signal for transmission of images to display andarchival devices. Unlike conventional screen-film radiography in which the film functions as the imaging sensor or recording medium, as well as the display device and storage media, CR eliminates film from the image-recording step, resulting in a separation of image capture from image displayand image storage. This separation of functions potentiates optimization ofeach of these steps individually. In addition, CR can capitalize on featurescommon to all digital images, namely, electronic transmission, manipulation,display, and storage of radiographs.
Technological advances in CR over time have made this modalitywidely accepted in digital departments. Hardware and software improve-ments have been made in the PSP plate, in image reading-scanning devices,and in image-processing algorithms. Overall reduced cost of CR devices aswell as a reduction in cost and increased utility of image display devices hascontributed to the increased acceptance of CR as a viable digital counterpartto conventional screen-film projection radiography. This section provides anoverview of the state-of-the-art in CR systems, including a basic descriptionof the data acquisition process, a review of system specifications, imagequality and performance, and advantages and disadvantages inherent in CR.
IMAGE ACQUISITION 197
DRE11 11/16/2005 9:43 AM Page 197

An explanation of the image-processing algorithms that convert the raw CR image data into useful clinical images will be provided. The image-processing algorithms to be discussed include image segmentation or expo-sure data recognition and background removal, contrast enhancement,spatial frequency processing including edge enhancement and noise smooth-ing, dynamic range control (DRC), and multiscale image contrast amplifi-cation (MUSICA). Note that the same types of image-processing algorithmsutilized for CR may be applied to DR images as well. Examples of severaltypes of artifacts potentially encountered with CR are given along with theircauses and methods for correction or minimization of these effects.
PROCESS DESCRIPTION
A CR system consists of a screen or plate of a stimulable phosphor materialthat is usually contained in a cassette and is exposed in a manner similar tothe traditional screen-film cassette. The PSP in the IP absorbs x-rays thathave passed through the patient, “recording” the x-ray image. Like the con-ventional intensifying screen, CR plates produce light in response to x-raysat the time of exposure. However, storage phosphor plates have the addi-tional property of being capable of storing some of the absorbed x-ray energyas a latent image. Plates are typically made of a europium-doped barium-fluoro-halide-halide crystallized matrix. Electrons from the dopant ionbecome trapped just below the conduction band when exposed to x-rays.Irradiating the IP at some time after the x-ray exposure with red or near-infrared laser light liberates the electrons into the conduction band, stimu-lating the phosphor to release some of its stored energy in the form of green,blue, or ultraviolet light, the phenomenon of photostimulable luminescence.The intensity of light emitted is proportional to the amount of x-ray energyabsorbed by the storage phosphor.
The readout process uses a precision laser spot scanning mechanism inwhich the laser beam traverses the IP surface in a raster pattern. The stim-ulated light emitted from the IP is collected and converted into an electri-cal signal, with optics coupled to a photomultiplier tube (PMT). The PMTconverts the collected light from the IP into an electrical signal, which isthen amplified, sampled to produce discrete pixels of the digital image, andsent through an ADC to quantize the value of each pixel (i.e., a value between0 and 1023 for a 10-bit ADC or between 0 and 4095 for a 12-bit ADC).
Not all of the stored energy in the IP is released during the readoutprocess. Thus, to prepare the IP for a new exposure, the IP is briefly floodedwith high-intensity (typically fluorescent) light. This erasure step ensuresremoval of any residual latent image.
PACS: A Guide to the Digi tal Revolut ion198
DRE11 11/16/2005 9:43 AM Page 198
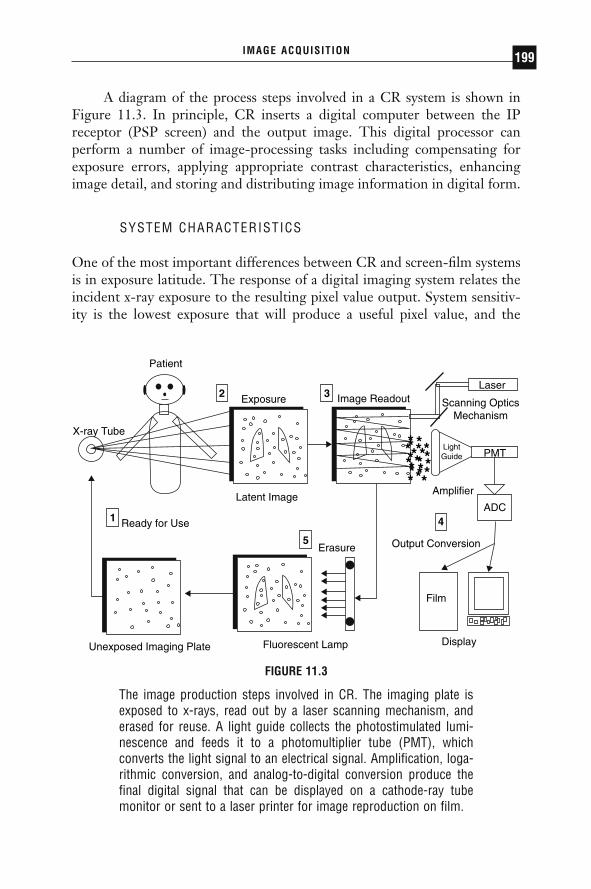
A diagram of the process steps involved in a CR system is shown inFigure 11.3. In principle, CR inserts a digital computer between the IPreceptor (PSP screen) and the output image. This digital processor canperform a number of image-processing tasks including compensating forexposure errors, applying appropriate contrast characteristics, enhancingimage detail, and storing and distributing image information in digital form.
SYSTEM CHARACTERISTICS
One of the most important differences between CR and screen-film systemsis in exposure latitude. The response of a digital imaging system relates theincident x-ray exposure to the resulting pixel value output. System sensitiv-ity is the lowest exposure that will produce a useful pixel value, and the
IMAGE ACQUISITION 199
Patient
Exposure Image Readout
Erasure
Latent Image
Ready for Use
X-ray Tube
Unexposed Imaging Plate Fluorescent Lamp Display
Output Conversion
Amplifier
Laser
Scanning OpticsMechanism
LightGuide PMT
Film
2 3
4
5
1
*** **************
*****
ADC
FIGURE 11.3
The image production steps involved in CR. The imaging plate isexposed to x-rays, read out by a laser scanning mechanism, anderased for reuse. A light guide collects the photostimulated lumi-nescence and feeds it to a photomultiplier tube (PMT), which converts the light signal to an electrical signal. Amplification, loga-rithmic conversion, and analog-to-digital conversion produce thefinal digital signal that can be displayed on a cathode-ray tubemonitor or sent to a laser printer for image reproduction on film.
DRE11 11/16/2005 9:43 AM Page 199

dynamic range is the ratio of the exposures of the highest and lowest usefulpixel values. Storage phosphor systems have extremely wide exposure lati-tude. The wide latitude of storage phosphor systems and the effectively lineardetector characteristic curve allow a wider range of exposure information tobe captured in a single image than is possible with any screen-film system.In addition, the wide dynamic range of CR allows it to be used under a broadrange of exposure conditions without the need for changing the basic detec-tor. This also makes CR an ideal choice for applications in which exposuresare highly variable or difficult to control as in portable or bedside radiogra-phy. Through image processing, CR systems can usually create a diagnosticimage out of under- or overexposures via appropriate lookup table correc-tion. In the screen-film environment, such under- or overexposures mighthave necessitated retakes and additional exposure to the patient.
Dose requirements of a medical imaging system depend on the system’sability to detect and convert the incoming signal into a usable output signal.It is important to stress that CR systems are not inherently lower-dosesystems than screen-film. In fact, several studies have demonstrated a higherrequired exposure for CR to achieve equivalent optical density on screen-film. However, the wider latitude of storage phosphor systems makes themmuch more forgiving of under- or overexposure. As in any DR system, whendose is decreased, the noise due to quantum mottle increases. Reader toler-ance of this noise tends to be the limiting factor on the lowest acceptabledose.
In some clinical situations, the radiologist may feel comfortable in low-ering the exposure technique factor to reduce dose to the patient—such asin pediatric extremity x-ray exams. In other situations, such as imaging thechest of the newborn, one may wish to increase exposure to reduce the morevisible mottle (at lower doses) to avoid mistaking the noise over the lungs asindication of pulmonary interstitial emphysema, for example. Computedradiography systems are signal-to-noise-limited (SNR-limited) whereasscreen-film systems are contrast-limited.
IMAGE QUALITY
DETECTIVE QUANTUM EFFICIENCY Objective descriptors of digitalimage quality include detective quantum efficiency (DQE), which is ameasure of the fidelity with which a resultant digital image represents thetransmitted x-ray fluence pattern (i.e., how efficiently a system converts thex-ray input signal into a useful output image) and includes a measure of the noise added. Also taken into account are the input-output characteris-
PACS: A Guide to the Digi tal Revolut ion200
DRE11 11/16/2005 9:43 AM Page 200
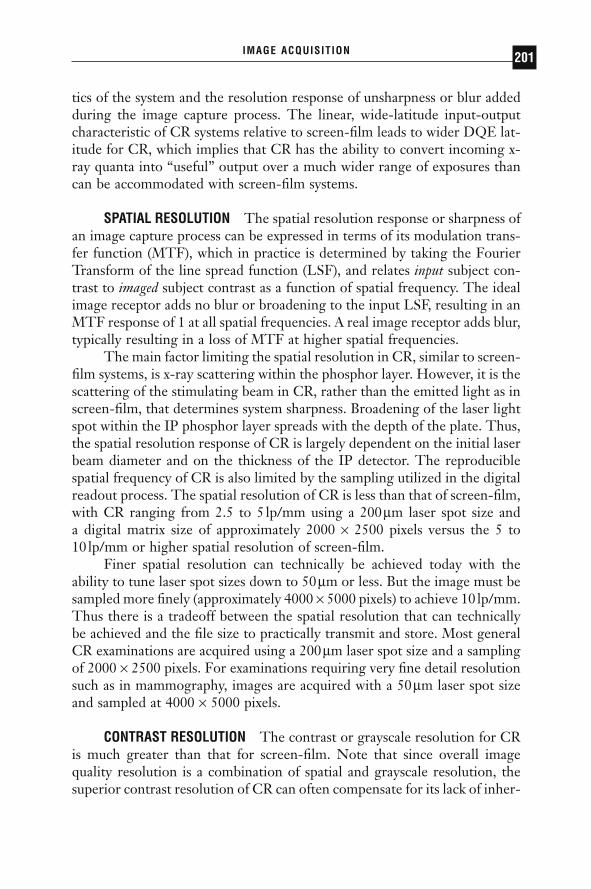
tics of the system and the resolution response of unsharpness or blur addedduring the image capture process. The linear, wide-latitude input-outputcharacteristic of CR systems relative to screen-film leads to wider DQE lat-itude for CR, which implies that CR has the ability to convert incoming x-ray quanta into “useful” output over a much wider range of exposures thancan be accommodated with screen-film systems.
SPATIAL RESOLUTION The spatial resolution response or sharpness ofan image capture process can be expressed in terms of its modulation trans-fer function (MTF), which in practice is determined by taking the FourierTransform of the line spread function (LSF), and relates input subject con-trast to imaged subject contrast as a function of spatial frequency. The idealimage receptor adds no blur or broadening to the input LSF, resulting in anMTF response of 1 at all spatial frequencies. A real image receptor adds blur,typically resulting in a loss of MTF at higher spatial frequencies.
The main factor limiting the spatial resolution in CR, similar to screen-film systems, is x-ray scattering within the phosphor layer. However, it is thescattering of the stimulating beam in CR, rather than the emitted light as inscreen-film, that determines system sharpness. Broadening of the laser lightspot within the IP phosphor layer spreads with the depth of the plate. Thus,the spatial resolution response of CR is largely dependent on the initial laserbeam diameter and on the thickness of the IP detector. The reproduciblespatial frequency of CR is also limited by the sampling utilized in the digitalreadout process. The spatial resolution of CR is less than that of screen-film,with CR ranging from 2.5 to 5 lp/mm using a 200mm laser spot size and a digital matrix size of approximately 2000 ¥ 2500 pixels versus the 5 to 10 lp/mm or higher spatial resolution of screen-film.
Finer spatial resolution can technically be achieved today with theability to tune laser spot sizes down to 50mm or less. But the image must besampled more finely (approximately 4000 ¥ 5000 pixels) to achieve 10 lp/mm.Thus there is a tradeoff between the spatial resolution that can technicallybe achieved and the file size to practically transmit and store. Most generalCR examinations are acquired using a 200mm laser spot size and a samplingof 2000 ¥ 2500 pixels. For examinations requiring very fine detail resolutionsuch as in mammography, images are acquired with a 50mm laser spot sizeand sampled at 4000 ¥ 5000 pixels.
CONTRAST RESOLUTION The contrast or grayscale resolution for CRis much greater than that for screen-film. Note that since overall imagequality resolution is a combination of spatial and grayscale resolution, thesuperior contrast resolution of CR can often compensate for its lack of inher-
IMAGE ACQUISITION 201
DRE11 11/16/2005 9:43 AM Page 201
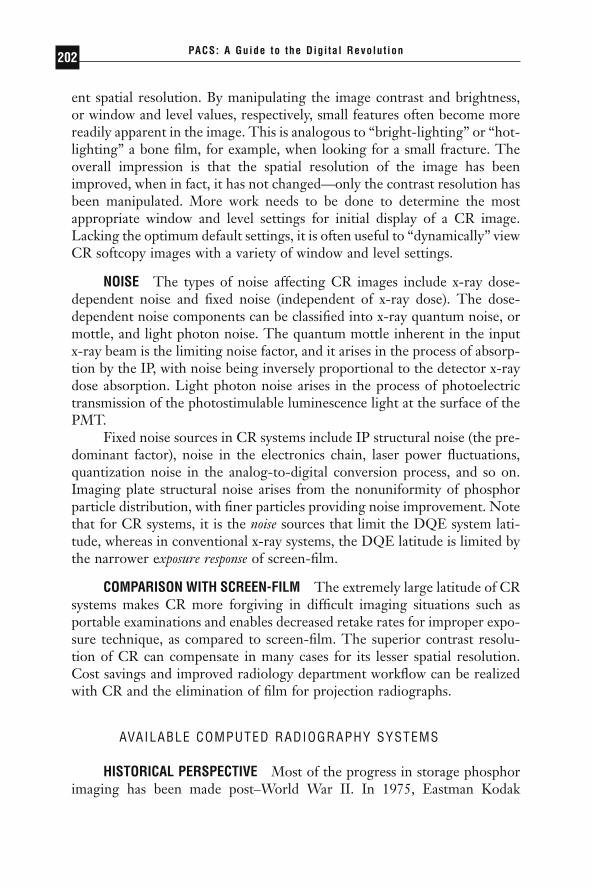
ent spatial resolution. By manipulating the image contrast and brightness,or window and level values, respectively, small features often become morereadily apparent in the image. This is analogous to “bright-lighting” or “hot-lighting” a bone film, for example, when looking for a small fracture. Theoverall impression is that the spatial resolution of the image has beenimproved, when in fact, it has not changed—only the contrast resolution hasbeen manipulated. More work needs to be done to determine the mostappropriate window and level settings for initial display of a CR image.Lacking the optimum default settings, it is often useful to “dynamically” viewCR softcopy images with a variety of window and level settings.
NOISE The types of noise affecting CR images include x-ray dose-dependent noise and fixed noise (independent of x-ray dose). The dose-dependent noise components can be classified into x-ray quantum noise, ormottle, and light photon noise. The quantum mottle inherent in the inputx-ray beam is the limiting noise factor, and it arises in the process of absorp-tion by the IP, with noise being inversely proportional to the detector x-raydose absorption. Light photon noise arises in the process of photoelectrictransmission of the photostimulable luminescence light at the surface of thePMT.
Fixed noise sources in CR systems include IP structural noise (the pre-dominant factor), noise in the electronics chain, laser power fluctuations,quantization noise in the analog-to-digital conversion process, and so on.Imaging plate structural noise arises from the nonuniformity of phosphorparticle distribution, with finer particles providing noise improvement. Notethat for CR systems, it is the noise sources that limit the DQE system lati-tude, whereas in conventional x-ray systems, the DQE latitude is limited bythe narrower exposure response of screen-film.
COMPARISON WITH SCREEN-FILM The extremely large latitude of CRsystems makes CR more forgiving in difficult imaging situations such asportable examinations and enables decreased retake rates for improper expo-sure technique, as compared to screen-film. The superior contrast resolu-tion of CR can compensate in many cases for its lesser spatial resolution.Cost savings and improved radiology department workflow can be realizedwith CR and the elimination of film for projection radiographs.
AVAILABLE COMPUTED RADIOGRAPHY SYSTEMS
HISTORICAL PERSPECTIVE Most of the progress in storage phosphorimaging has been made post–World War II. In 1975, Eastman Kodak
PACS: A Guide to the Digi tal Revolut ion202
DRE11 11/16/2005 9:43 AM Page 202

Company (Rochester, NY) patented an apparatus using infrared-stimulablephosphors or thermoluminescent materials to store an image. In 1980, FujiPhoto Film (Tokyo, Japan) patented a process in which PSPs were used torecord and reproduce an image by absorbing radiation and then releasingthe stored energy as light when stimulated by a helium-neon laser. Theemitted phosphor luminescence was detected by a PMT, and the electronicsignal produced reconstructed the image.
Fuji was the first to commercialize a storage phosphor-based CR systemin 1983 (as the FCR 101) and published the first technical paper (in Radiol-ogy) describing CR for acquiring clinical digital x-ray images. The central-processing-type second-generation scanners (FCR 201) were marketed in1985. Third-generation Fuji systems marketed in 1989 included distributedprocessing (FCR 7000) and stand-alone (AC-1) types. Fuji systems in theFCR 9000 series are improved, higher-speed, higher-performance, third-generation scanners. Current Fuji systems include upright chest units, CRdetectors in wall and table buckeyes, multiplate autoloaders, and morecompact stand-alone units.
In 1992, Kodak installed its first commercial storage phosphor reader(Model 3110). Later models include autoloader devices. In 1994, Agfa-Gevaert NV (Belgium) debuted its own CR system design (the ADC 70). In1997, Agfa showed its ADC Compact with greatly reduced footprint. Agfaalso introduced a low-cost, entry-level single plate reader (the ADC Solo) in1998, appropriate for distributed CR environments such as clinics, traumacenters, ICUs, and the like. In 1998, Lumisys presented its low-cost, desktopCR unit (the ACR 2000) with manual-feed, single-plate reading. Numerousdesktop units have been introduced including the Orex CR. Konica Corpdebuted its own device (XPress) in 2002 and later (the Regius) upright unit,both of which have relatively fast scan times (at 40 and 16s cycle times,respectively). Many companies have been involved in CR research and devel-opment, including NA Philips Corp, EI DuPont de Nemours & Co, 3M Co,Hitachi, Ltd, Siemens AG, Toshiba Corp, General Electric Corp, KaseiOptonix, Ltd, Mitsubishi Chemical Industries, Ltd, Nichia Corp, GTEProducts Co, and DigiRad Corp.
TECHNOLOGICAL ADVANCES
Major improvements in the overall CR system design and performance char-acteristics include a reduction in the physical size of the reading/scanningunits, increased plate-reading capacity per unit time, and better imagequality. These advances have been achieved through a combination of
IMAGE ACQUISITION 203
DRE11 11/16/2005 9:43 AM Page 203

changes in the IPs themselves, in the image reader or scanning devices, andin the application of image-processing algorithms to affect image output.
The newer IPs developed for the latest CR devices have higher imagequality (increased sharpness) and improved fading and residual image characteristics. Higher image quality has resulted from several modificationsin the IP phosphor and layer thickness. Smaller phosphor grain size in the IP (down to approximately 4mm) diminishes fixed noise of the IP, while increased packing density of phosphor particles counteracts a con-comitant decrease in photostimulable luminescence. A thinner protectivelayer is utilized in the plates, tending to reduce x-ray quantum noise. In and of itself, this would improve the spatial resolution response characteris-tics of the plates as a result of diminished beam scattering. However, in the newest IPs, the quantity of phosphor coated onto the plate is increasedfor durability purposes, resulting in the same response characteristic of pre-vious IPs.
A historical review of CR scanning units chronicles improved com-pactness and increased processing speed. The first Fuji unit (FCR 101) from1983 required roughly 6m2 of floor space to house the reader and could onlyprocess about 45 plates per hour, while today’s Fuji models as well as othervendors’ devices occupy less than 1m2 and can process more than 110 platesper hour. This is a decrease in apparatus size by a factor of approximatelyone sixth and an increase in processing capacity of roughly 2.5 times.Desktop models reduce the physical device footprint even further.
Computed radiography IP sizes, pixel resolutions, and their associateddigital file sizes are roughly the same across manufacturers for the variouscassette sizes offered. For example, the 14 in ¥ 17in (35cm ¥ 43cm) platesare read with a sampling rate of 5 to 5.81 pixels per mm, at a digital imagematrix size of roughly 2000 ¥ 2000 pixels (1760 ¥ 2140 pixels for Fuji and2048 ¥ 2508 pixels for Agfa and Kodak). Images are typically quantized to12 bits (for 4096 gray levels). Thus, total image file sizes range from roughly8MB to 11.5MB. The smaller plates are scanned at the same laser spot size(100mm), and the digitization rate does not change; therefore, the pixel sizeis smaller. The 10 in ¥ 12in (24cm ¥ 30cm) plates are typically read at a sam-pling rate of 6.7 to 9 pixels per mm, and the 8 in ¥ 10in (18cm ¥ 24cm)plates are read at 10 pixels per mm.
Cassetteless CR devices have been introduced in which the detector isincorporated into a chest unit, wall, or table buckey to speed throughput andfacilitate workflow much as DR devices do. Dual-sided signal collectioncapability is available from Fuji, increasing overall signal-to-noise. Agfa hasshown a product in development (ScanHead CR) that stimulates and readsout the IP line by line as opposed to the point-by-point scanning that occurs
PACS: A Guide to the Digi tal Revolut ion204
DRE11 11/16/2005 9:43 AM Page 204

in most CR devices today. Increased speed (5s scan time) and higher DQEhave been demonstrated. In addition, needle-phosphors have been exploredas a possible replacement to powder-phosphors, having shown improvedspatial resolution and DQE.
IMAGE-PROCESSING ALGORITHMS
Image processing is performed to optimize the radiograph for output display.Each manufacturer has a set of proprietary algorithms that can be applied tothe image for printing on laser film or for display, initially only on the man-ufacturer’s own proprietary workstations. Prior to the DICOM standard,only the raw data could be directly acquired digitally. Therefore, to attainthe same image appearance on other display stations, the appropriate image-processing algorithms (if known) had to be implemented somewhere alongthe chain from acquisition to display. Now image-processing parameters canbe passed in the DICOM header, and algorithms can be applied to CRimages displayed on generic workstations, though advanced real-timemanipulation of images can typically only be done on each manufacturer’sspecific processing station. In general, the digital image processing appliedto CR consists of a recognition or analysis phase, followed by contrastenhancement and/or frequency processing. Note that the same general typesof image processing applied to CR can also be applied to DR images.
IMAGE SEGMENTATION In the image recognition stage, the region ofexposure is detected (i.e., the collimation edges are detected), a histogramanalysis of the pixel gray values in the image is performed to assess the actualexposure to the plate, and the appropriate lookup table specific to the regionof anatomy imaged and chosen by the x-ray technologist at the time ofpatient demographic information input is selected. Proper recognition of theexposed region of interest is extremely important as it affects future pro-cessing applied to the image data. For example, if the bright white area ofthe image caused by collimation at the time of exposure is not detected prop-erly, its very high gray values will be taken into account during histogramanalysis, increasing the “window” of values to be accommodated by a givendisplay device (softcopy or hardcopy). The effect would be to decrease theoverall contrast in the image.
Some segmentation algorithms, in addition to detection of collimationedges in the image, enable users to blacken the region outside these edges,in the final image if so desired. This tends to improve image contrast appear-ance by removing this bright white background in images of small body parts
IMAGE ACQUISITION 205
DRE11 11/16/2005 9:43 AM Page 205

or pediatric patients. Figure 11.4B demonstrates this feature of “blackenedsurround,” as applied to the image in Figure 11.4A.
CONTRAST ENHANCEMENT Conventional contrast enhancement, alsocalled gradation processing, tone scaling, and latitude reduction, is per-formed next. This processing amounts to choosing the best characteristiccurve (usually a nonlinear transformation of x-ray exposure to image density)to apply to the image data. These algorithms are quite flexible and can betuned to satisfy a particular user’s preferences for a given “look” of the image.Lookup tables are specific to the region of anatomy imaged. Figure 11.5shows an example of the default adult chest lookup table (A) applied to animage and the (B) same image with high-contrast processing. A reverse con-trast scale or “black bone” technique, in what was originally black in theimage becomes white, and what was originally white in the image becomesblack, is sometimes felt to be beneficial for identifying and locating tubes and lines. An example is shown in Figure 11.6 where the contrast
PACS: A Guide to the Digi tal Revolut ion206
FIGURE 11.4
Example of image segmentation algorithm detection of (white) col-limation edges of exposure region in (A), with “blackened surround”applied in (B). Note the improved overall contrast in (B).
A B
DRE11 11/16/2005 9:43 AM Page 206

reversal algorithm has been applied to the image in Figure 11.6A, resultingin the image in Figure 11.6B.
SPATIAL FREQUENCY PROCESSING The next type of image processingusually performed is spatial frequency processing, sometimes called edgeenhancement. These algorithms adjust the frequency response characteris-tics of the CR systems, essentially implementing a high or band pass filteroperation to enhance the high spatial frequency content contained in edge
IMAGE ACQUISITION 207
FIGURE 11.5
Chest image processed with (A) default mode and (B) high-contrastalgorithm applied.
FIGURE 11.6
Chest image processed with (A) default mode and (B) blackbone orcontrast reversal algorithm applied.
A B
BA
DRE11 11/16/2005 9:43 AM Page 207
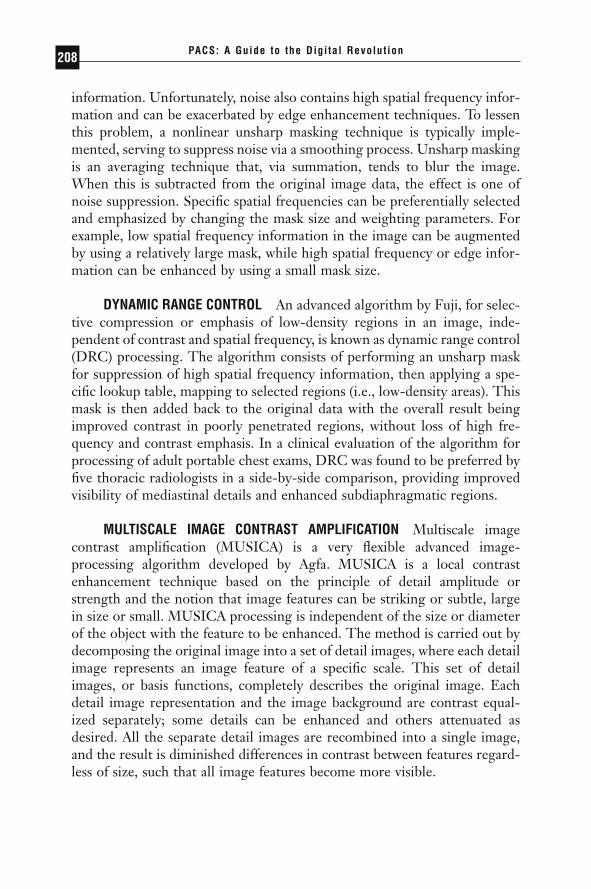
information. Unfortunately, noise also contains high spatial frequency infor-mation and can be exacerbated by edge enhancement techniques. To lessenthis problem, a nonlinear unsharp masking technique is typically imple-mented, serving to suppress noise via a smoothing process. Unsharp maskingis an averaging technique that, via summation, tends to blur the image.When this is subtracted from the original image data, the effect is one ofnoise suppression. Specific spatial frequencies can be preferentially selectedand emphasized by changing the mask size and weighting parameters. Forexample, low spatial frequency information in the image can be augmentedby using a relatively large mask, while high spatial frequency or edge infor-mation can be enhanced by using a small mask size.
DYNAMIC RANGE CONTROL An advanced algorithm by Fuji, for selec-tive compression or emphasis of low-density regions in an image, inde-pendent of contrast and spatial frequency, is known as dynamic range control(DRC) processing. The algorithm consists of performing an unsharp maskfor suppression of high spatial frequency information, then applying a spe-cific lookup table, mapping to selected regions (i.e., low-density areas). Thismask is then added back to the original data with the overall result beingimproved contrast in poorly penetrated regions, without loss of high fre-quency and contrast emphasis. In a clinical evaluation of the algorithm forprocessing of adult portable chest exams, DRC was found to be preferred byfive thoracic radiologists in a side-by-side comparison, providing improvedvisibility of mediastinal details and enhanced subdiaphragmatic regions.
MULTISCALE IMAGE CONTRAST AMPLIFICATION Multiscale imagecontrast amplification (MUSICA) is a very flexible advanced image-processing algorithm developed by Agfa. MUSICA is a local contrastenhancement technique based on the principle of detail amplitude orstrength and the notion that image features can be striking or subtle, largein size or small. MUSICA processing is independent of the size or diameterof the object with the feature to be enhanced. The method is carried out bydecomposing the original image into a set of detail images, where each detailimage represents an image feature of a specific scale. This set of detailimages, or basis functions, completely describes the original image. Eachdetail image representation and the image background are contrast equal-ized separately; some details can be enhanced and others attenuated asdesired. All the separate detail images are recombined into a single image,and the result is diminished differences in contrast between features regard-less of size, such that all image features become more visible.
PACS: A Guide to the Digi tal Revolut ion208
DRE11 11/16/2005 9:43 AM Page 208

IMAGE ARTIFACTS
The appearance and causes of image artifacts that can occur with CR systemsshould be recognized and corrected. Artifacts can arise from a variety ofsources including those related to the IPs themselves, to image readers, andto image processing. Several types of artifacts potentially encountered withCR have been minimized with the latest technology improvements but maystill be seen in older systems.
Lead backing added to the aluminum-framed, carbon-fiber cassetteshas eliminated the so-called lightbulb effect, darkened outer portions of afilm due to backscattered radiation. High sensitivity of the CR plates rendersthem extremely susceptible to scattered radiation or inadvertent exposure,thus routine erasure of all CR plates on the day of use is recommended, asis the storing of IPs on end, rather than stacking of cassettes one on top ofanother. The occurrence of persistent latent images after high exposures orafter prolonged intervals between plate erasure and reuse has been lessenedby the improved efficiency of the two-stage erasure procedure utilized in thelatest CR systems. Improved recognition of the collimation patternemployed for a given image allows varied (including off-angle) collimationfields and, in turn, improves histogram analysis and subsequent processingof the imaged region, although these algorithms can fail in some instances.Plate cracking from wear-and-tear can create troublesome artifacts.
Inadvertent double exposures can occur with the present CR systems,potentially masking low-density findings such as regions of parenchymalconsolidation, or leading to errors in interpreting line positions. Such arti-facts are more difficult to detect than with screen-film systems because ofCR’s linear frequency processing response, optimizing image intensity overa wide range of exposures (i.e., due to its wide dynamic range). Figure 11.7shows an example of the double exposure artifact. Laser scanning artifactscan still occur with current CR readers and are seen as a linear artifact acrossthe image, caused by dust on the light source. Proper and frequent cleaningof the laser and light guide apparatus as well as the IPs themselves canprevent such artifacts.
The ability of CR to produce clinically diagnostic images over a widerange of exposures depends on the effectiveness of the image analysis algo-rithms applied to each dataset. The specific processing parameters used arebased on standards tuned to the anatomic region under examination. Incor-rect selection of diagnostic specifier or inappropriate anatomic region canresult in an image of unacceptable quality. Understanding the causes of someof the CR imaging artifacts described here as well as maintaining formal,
IMAGE ACQUISITION 209
DRE11 11/16/2005 9:43 AM Page 209

routine QA procedures can help to recognize, correct, and avoid future difficulties.
SUMMARY OF COMPUTED RADIOGRAPHY
Computed radiography can be utilized for the digital image acquisition ofprojection radiography examinations into a PACS. As a result of its wideexposure latitude and relative forgiveness of exposure technique, CR canimprove the quality of images in difficult imaging situations, such as inportable or bedside examinations of critically ill or hospitalized patients. Assuch, CR systems have been successfully utilized in the ICU setting, in theemergency room (ER) or trauma center, as well as in the operating room(OR). Computed radiography can also be cost effective for a high-volumeclinic setting or in a low-volume site as input to a teleradiology service andhas successfully reduced retake rates for portable and other examinations.
PACS: A Guide to the Digi tal Revolut ion210
FIGURE 11.7
Example of inadvertent double exposure.
DRE11 11/16/2005 9:43 AM Page 210
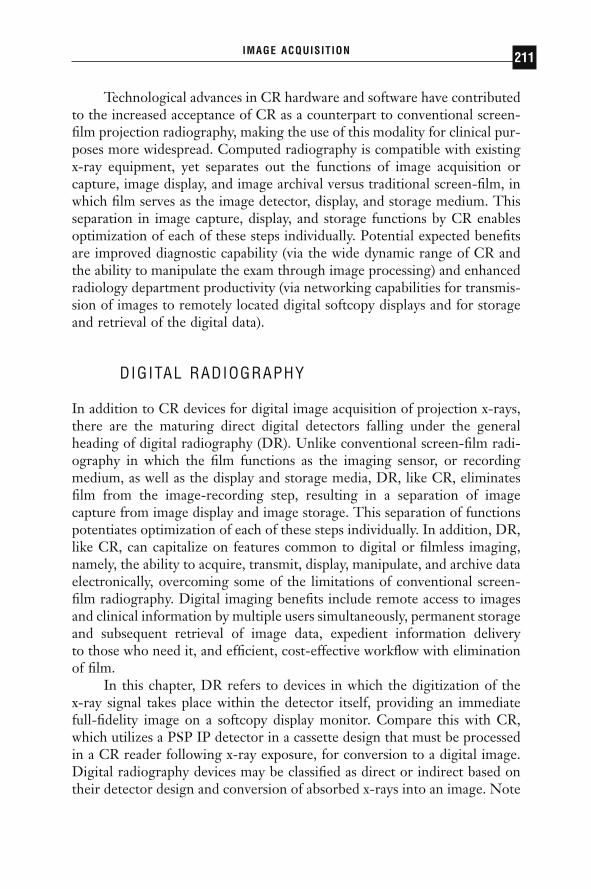
Technological advances in CR hardware and software have contributedto the increased acceptance of CR as a counterpart to conventional screen-film projection radiography, making the use of this modality for clinical pur-poses more widespread. Computed radiography is compatible with existingx-ray equipment, yet separates out the functions of image acquisition orcapture, image display, and image archival versus traditional screen-film, inwhich film serves as the image detector, display, and storage medium. Thisseparation in image capture, display, and storage functions by CR enablesoptimization of each of these steps individually. Potential expected benefitsare improved diagnostic capability (via the wide dynamic range of CR andthe ability to manipulate the exam through image processing) and enhancedradiology department productivity (via networking capabilities for transmis-sion of images to remotely located digital softcopy displays and for storageand retrieval of the digital data).
DIGITAL RADIOGRAPHY
In addition to CR devices for digital image acquisition of projection x-rays,there are the maturing direct digital detectors falling under the generalheading of digital radiography (DR). Unlike conventional screen-film radi-ography in which the film functions as the imaging sensor, or recordingmedium, as well as the display and storage media, DR, like CR, eliminatesfilm from the image-recording step, resulting in a separation of imagecapture from image display and image storage. This separation of functionspotentiates optimization of each of these steps individually. In addition, DR,like CR, can capitalize on features common to digital or filmless imaging,namely, the ability to acquire, transmit, display, manipulate, and archive dataelectronically, overcoming some of the limitations of conventional screen-film radiography. Digital imaging benefits include remote access to imagesand clinical information by multiple users simultaneously, permanent storageand subsequent retrieval of image data, expedient information delivery to those who need it, and efficient, cost-effective workflow with eliminationof film.
In this chapter, DR refers to devices in which the digitization of the x-ray signal takes place within the detector itself, providing an immediatefull-fidelity image on a softcopy display monitor. Compare this with CR,which utilizes a PSP IP detector in a cassette design that must be processedin a CR reader following x-ray exposure, for conversion to a digital image.Digital radiography devices may be classified as direct or indirect based ontheir detector design and conversion of absorbed x-rays into an image. Note
IMAGE ACQUISITION 211
DRE11 11/16/2005 9:43 AM Page 211

that the acronym “DR” may be used by some to refer to direct radiography,also called direct digital radiography (DDR), as the subset of digital radiog-raphy in which x-ray absorption within the detector is converted into a pro-portional electric charge without an intermediate light conversion step.
This section provides an overview of the state-of-the-art in digital radiography systems. A basic description of the data acquisition process willbe given, followed by a review of system specifications, image quality, andperformance, including signal-to-noise, contrast, and spatial resolution char-acteristics. Advantages and disadvantages inherent in CR and DR, and acomparison with screen-film radiography will be given with respect tosystem performance, image quality, workflow, and cost.
PROCESS DESCRIPTION
INDIRECT VERSUS DIRECT CONVERSION DR refers to devices fordirect digital acquisition of projection radiographs in which the digitizationof the x-ray signal takes place within the detector. Digital radiographydevices, also called flat-panel detectors, include two types, indirect conver-sion devices in which light is first generated using a scintillator or phosphorand then detected by a CCD or a thin-film-transistor (TFT) array in con-junction with photodiodes; and DDR devices, which consist of a top elec-trode, dielectric layer, selenium x-ray photoconductor, and thin-film pixelarray. Figure 11.8 shows a comparison of the direct and indirect energy con-version steps in the production of a digital x-ray image. DDR devices offerdirect energy conversion of x-ray for immediate readout without the inter-mediate light conversion step.
The basis of DR devices is the large area TFT active matrix array, orflat panel, in which each pixel consists of a signal collection area or chargecollection electrode, a storage capacitor, and an amorphous silicon field-effect transistor (FET) switch that allows the active readout of the chargestored in the capacitor. Arrays of individual detector areas are addressed byorthogonally arranged gate switches and data lines to read the signal gener-ated by the absorption of x-rays in the detector. The TFT arrays are usedin conjunction with a direct x-ray photoconductor layer or an indirect x-ray-sensitive phosphor-coated light-sensitive detector or photodiode array.
An example DDR device, diagrammed in cross section in Figure 11.9,uses a multilayer detector in a cassette design, in which the x-ray energy isconverted directly to electron-hole pairs in an amorphous selenium (Se) photoconductive conversion layer. Charge pairs are separated in a bias fieldsuch that the holes are collected in the storage capacitors and the electrons
PACS: A Guide to the Digi tal Revolut ion212
DRE11 11/16/2005 9:43 AM Page 212

drift toward the Se-dielectric interface. At the end of exposure, the imageresides in the pixel matrix in the form of charges, with the charge propor-tional to the absorbed radiation. At the end of readout, the charges are erasedto prepare for another detection cycle.
An example indirect DR device uses an x-ray-sensitive phosphorcoating on top of a light-sensitive flat panel amorphous silicon (Am-Si)detector TFT array. The x-rays are first converted to light and then to a pro-portional charge in the photodiode (typically a cesium iodide [CsI] scintilla-tor), which is then stored in the TFT array where the image signal isrecorded.
SYSTEM CHARACTERISTICS DR detectors have high efficiency, lownoise, and good spatial resolution; wide latitude; and all the benefits of digitalor filmless imaging. Similarly, DR has a very wide dynamic range of quan-
IMAGE ACQUISITION 213
Direct Conversion
X-rays
Conversion Losses;increased NoisePhotoconductor
Converts X-rays toElectrical Signal
Digital X-ray Image
Conversion Losses;increased Noise
Light
Phosphor ConvertsX-rays to Light
X-rays
Indirect Conversion
Light Converted toElectrical Signal
Digital X-ray image
FIGURE 11.8
The image production steps involved in direct and indirect digitalradiography detectors.
DRE11 11/16/2005 9:43 AM Page 213
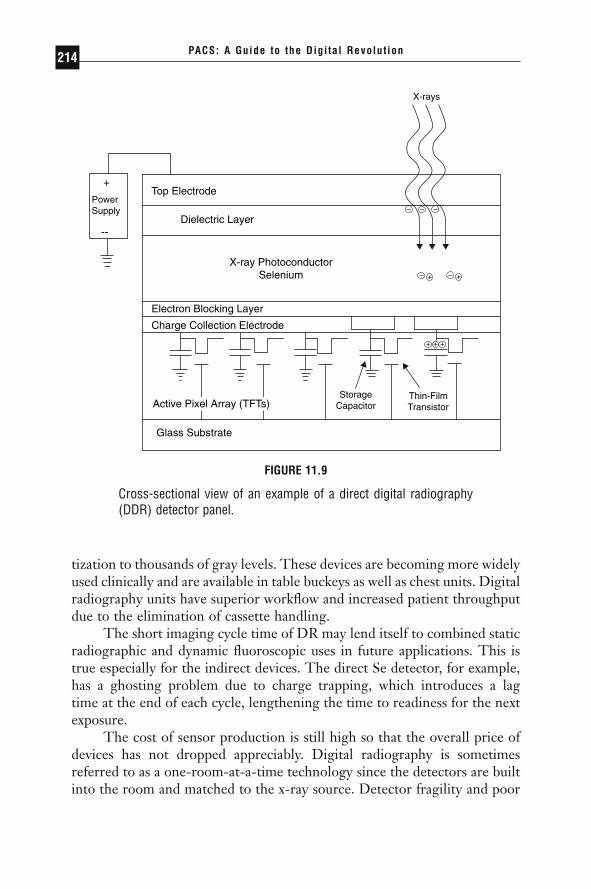
tization to thousands of gray levels. These devices are becoming more widelyused clinically and are available in table buckeys as well as chest units. Digitalradiography units have superior workflow and increased patient throughputdue to the elimination of cassette handling.
The short imaging cycle time of DR may lend itself to combined staticradiographic and dynamic fluoroscopic uses in future applications. This istrue especially for the indirect devices. The direct Se detector, for example,has a ghosting problem due to charge trapping, which introduces a lag time at the end of each cycle, lengthening the time to readiness for the nextexposure.
The cost of sensor production is still high so that the overall price ofdevices has not dropped appreciably. Digital radiography is sometimesreferred to as a one-room-at-a-time technology since the detectors are builtinto the room and matched to the x-ray source. Detector fragility and poor
PACS: A Guide to the Digi tal Revolut ion214
+
PowerSupply
--
Top Electrode
Dielectric Layer
X-ray PhotoconductorSelenium
Electron Blocking Layer
Charge Collection Electrode
Glass Substrate
StorageCapacitor
Thin-FilmTransistor
X-rays
+
– +–
– –
+
–
+ +
Active Pixel Array (TFTs)
FIGURE 11.9
Cross-sectional view of an example of a direct digital radiography(DDR) detector panel.
DRE11 11/16/2005 9:43 AM Page 214

portability make DR difficult to use in the bedside x-ray environment, butsome portable devices are now being introduced.
IMAGE QUALITY DR image quality is comparable to that of CR.However, DR devices have higher DQEs than CR, capturing roughly 80%absorption of the x-ray energy at optimum exposures. Thus, DR is a veryhigh-efficiency, low-noise detector, converting much of the incoming x-raysignal into useful output. Several recent studies have demonstrated highimage quality at lower radiation dose to the patient. The ability to lowerexposure would be a significant advantage for DR. A factor limiting DR effi-ciency involves the packing fraction or the ratio of active detector area todead space taken up by the data readout devices (transistors, data lines, capac-itors, etc.). Because the physical size of the data readout components is cur-rently fixed, the smaller the pixel size, the smaller the packing fraction, witha larger proportion of dead area overwhelming the active area, in some casesreducing the active area to 30% or less. The overall effect is a reduction ingeometric and quantum efficiency.
The spatial resolution of DR is comparable to that of CR, which is stillless than that for analog x-ray. Typical matrix sizes are on the order of 2000to 2500 pixels ¥ 2000 to 2500 pixels. The pixel size of the TFT array detec-tor is the limiting factor for spatial resolution, with the direct Se detectoryielding a better inherent spatial resolution than do indirect detectors. Thiscan lead to better signal modulation and superior contrast.
DR design presents a delicate trade-off between detector efficiency,inversely proportional to pixel size, and spatial resolution, affected directlyby pixel size. Typically, DR devices are specified for higher detection effi-ciency at a cost of much less spatial resolution than screen-film, with com-pensation by a wide dynamic range or high contrast resolution. Designcomplexities requiring further development include wiring configurations tominimize dead space and maximize the detector packing fraction, fast androbust signal readout methods, and better error correction matrices for moreaccurate signal readout.
COMPARISON OF COMPUTED RADIOGRAPHY ANDDIGITAL RADIOGRAPHY
Table 11.2 lists the advantages of CR and DR, including all the benefits ofdigital images, which can be electronically processed, manipulated, distrib-uted, displayed, and archived. The superior contrast resolution of the digitalmodalities can compensate in many cases for the lesser spatial resolution as
IMAGE ACQUISITION 215
DRE11 11/16/2005 9:43 AM Page 215

compared with screen-film. Both CR and DR can be utilized for the digitalimage acquisition of projection radiography examinations into a PACS.
As for any digital image acquisition device, CR and/or DR would bethe first point of entry into a PACS. Errors may propagate from here, with the quality of the PACS output being directly dependent on the qualityof the signal in. In addition to image quality, essential features for success-ful clinical implementation of CR or DR systems for a PACS include the fol-lowing: DICOM conformance of the modality is essential and includescompliance with the image data and header format, as well as the DICOMcommunication protocol. Equally critical is interfacing to the RIS-HIS.Integration of the CR/DR system with the RIS-HIS can reduce humanerrors on patient demographic information input and improve efficiency.Ease of integration of the device into the daily workflow routine, and sim-plicity and robustness of the user interface are very important. Reliability,fault tolerance, and capabilities for error tracking are also major issues toconsider, as are device speed and performance.
As a result of CR’s convenient workflow and portability, as well as itswide exposure latitude and relative forgiveness of exposure technique, CRcan improve the quality of images in difficult imaging situations, such as inportable or bedside examinations of critically ill or hospitalized patients, andenable decreased retake rates for improper exposure technique. As such, CRsystems have been successfully utilized in the ICU setting, in the ER ortrauma center, as well as in the OR. Computed radiography can also be costeffective for a high-volume clinic setting, or in a low-volume site as input toa teleradiology service. Cost savings and improved radiology departmentalworkflow can be realized with CR and the elimination of film.
PACS: A Guide to the Digi tal Revolut ion216
TABLE 11.2Summary of Advantages of CR and DR Systems
Produce digital images capable of being electronically processed, manipulated,distributed, displayed, and archived
Large latitude systems allowing excellent visualization of both soft tissue and bonein the same exposure image
Superior contrast resolution potentially compensating for lack of spatial resolutionDecreased retake ratesPotential cost savings if film is eliminatedImproved radiology department workflow with elimination of film handling routines
DRE11 11/16/2005 9:43 AM Page 216
Technological advances in CR hardware and software have contributedto the increased acceptance of CR as the current counterpart to conventionalscreen-film projection radiography, making the use of this modality for clin-ical purposes more widespread. Computed radiography is compatible withexisting x-ray equipment, yet separates out the functions of image acquisi-tion or capture, image display, and image archival versus traditional screen-film, in which film serves as the image detector, display, and storage medium.This separation in image capture, display, and storage functions by CRenables optimization of each of these steps individually. Potential expectedbenefits are improved diagnostic capability (via the wide dynamic range ofCR and the ability to manipulate the data through image processing), andenhanced radiology department productivity (via networking capabilities fortransmission of images to remotely located digital softcopy displays and forstorage and retrieval of the digital data).
DR devices have more efficient detectors, offering direct energy con-version of x-ray for immediate readout. The higher DQE may enable DRto produce high-quality images at a lower radiation dose to the patient.These detectors have low noise and good spatial resolution, wide latitude,and all the benefits of digital or filmless imaging. But cost is still high sincedetector production is difficult and expensive, and DR is a one-room-at-a-time detector. Digital radiography may be cost effective in high volume set-tings with constant high patient throughput. However, meeting the costcompetitiveness of screen-film systems is difficult unless film printing iseliminated from the cost equation. Digital radiography may be preferablefor imaging examinations requiring very high quality, such as in mammog-raphy, upright chest exams, and bone work.
Future improvements in image-processing algorithms, with a betterunderstanding of optimum display settings for softcopy viewing, have thepotential to greatly facilitate and standardize softcopy reading of digital pro-jection radiographs and further the acceptance of CR and DR in the clini-cal arena. It is likely that CR and DR devices will coexist for some time.
QUALITY ASSURANCE AND QUALITY CONTROLFOR ACQUISITION
The current trend for radiology departments and medical imaging withinhealthcare enterprises is an increasing move toward the all-digital or film-less medical image management system or PACS. Operational concerns withPACS implementations can arise at all stages of the process, from the design
IMAGE ACQUISITION 217
DRE11 11/16/2005 9:43 AM Page 217

specifications to installation, training, and acceptance. Quality control pro-cedures necessarily become modified in the filmless radiology department,and new processes must be put in place to better prepare for the total digitalclinical department.
Forming and maintaining a continuing quality improvement (CQI)committee may facilitate PACS installation and training periods, workflowmodifications, quality assurance, and clinical acceptance. This committeeshould include radiologists at all levels (resident, fellow, attending), radiol-ogy technologists, film library personnel, ED and ICU clinician end users,and PACS team members. The CQI committee may assist in the creation ofnew management procedures, provide a means for user feedback and edu-cation, and contribute to the overall acceptance of and user satisfaction withthe system.
PROBLEMS OCCURRING AT ACQUISITION
The imaging modality is the first entry point into the PACS, and any errorsin data input here can propagate throughout the system. Thus, interfacingof a PACS to the RIS-HIS and, better yet, DICOM modality worklist capa-bility at the imaging device, are essential. When a PACS is properly inter-faced to the RIS-HIS, input data can be verified by comparison of pertinentdemographic data (name, date, time, MRN, AccNum, and exam type) at thePACS acquisition gateway with the data recorded in the RIS. Thus, anyimaging exam entering the PACS will be RIS-verified prior to archival anddistribution, maintaining the data integrity of the system.
Most imaging modalities are now tightly coupled with the RIS andprovide automatic downloading of demographic information from the RIS,via barcode readers, to the modality, and hence the DICOM header. Thiseliminates the highly error-prone manual entry of data at acquisition. Unfor-tunately for manual data-entry devices, any errors in data may result in theimage data being held in a queue pending manual (human) inspection andresolution. Continuous feedback should be given to technologists makingrepeated errors in data entry.
The well-designed PACS holds newly acquired studies in a restrictedarea (fix-queue or “penalty box”) until the demographic data in the headeris matched to a pending exam request from the RIS-HIS. If any failureoccurs, such as an incorrect MRN or DOB (date of birth), the new exam willnot pass automatically into the system to be archived (although it may bedisplayable) until the discrepancy has been resolved by human intervention.However, the inverse test has not been implemented. Pending exam orders
PACS: A Guide to the Digi tal Revolut ion218
DRE11 11/16/2005 9:43 AM Page 218

held in the RIS-HIS that do not relate to any incoming PACS image datawithin a certain time frame should be flagged. Full PACS acquisition QArequires this bidirectional process monitor to ensure that data in the PACSis valid and verified with data in the RIS-HIS, and all data in the RIS-HISis acquired into the PACS. This may also assist QA procedures in deter-mining which of the studies that have been ordered and completed have noassociated report and therefore may not have been read.
Some DICOM transfer of imaging exams (i.e., from CT and MR scan-ners) to the PACS requires autosend-networking pathways to be enabled atthe scanner. Unfortunately, these features can easily be turned off (frequentlyby the service manufacturer), resulting in missed real-time transfer of imagesto the PACS. Stressing the importance of having the autosend enabled at thetime the examination is performed to the imaging technologists as well asthe manufacturer’s service personnel can reduce this problem.
Although many digital angiographic/fluorographic systems areDICOM compliant, few have been integrated into a PACS. The largevolume of data typically generated by angiographic procedures is one reasonfor this. One way to reduce the data volume, and perhaps facilitate connec-tion to a PACS, might be to store only key images of an angiographic run,much the way they are filmed. Some manufacturers allow operators to createsummary series of the examinations, which could then be transmitted to thePACS for viewing on display workstations. A second problem for incorpo-ration of angiographic images into a PACS arises from the inability of mostPACS to do subtraction, pixel shifting, and rapid mask selection—featuresutilized in most angiographic examinations.
QUALITY CONTROL PROCEDURES/TROUBLESHOOTING
During the PACS planning, specifications, and lab testing phases it can bebeneficial to involve anticipated users of the system. User awareness of thegoals of a PACS implementation and its system features prior to clinicalinstallment can affect the overall success of the system. Installation of systemcomponents will be most successful when scheduled during low-volumeperiods and when all affected users are notified well in advance of the installdate. Backup contingency plans must be in place prior to going live in theclinical environment.
Among the many roles of the medical physicist and/or PACS engineerin incorporating an imaging modality into the diagnostic imaging depart-ment are acceptance testing of the device and QA-QC. The medical physi-
IMAGE ACQUISITION 219
DRE11 11/16/2005 9:43 AM Page 219

cist should be involved in the siting and planning of the imaging system, aswell as the installation, testing and tuning, and training. Formal QA-QCprocedures are still evolving, particularly for the newer modalities such asCR. In fact, substantial efforts have been under way to standardize CR QA-QC, such as the American Association of Physicists in Medicine (AAPM)Task Group #10 draft document “Computed Radiography AcceptanceTesting and Quality Control.”
In spite of the fact that CR is more forgiving of a broad range of expo-sures, the use of this modality is not an excuse to employ poor radiographictechnique. Computed radiography exposures as well as image quality shouldbe routinely monitored on a per-examination-type basis. Understanding thecauses of possible CR imaging artifacts as well as maintaining formal, routinequality assurance procedures can help to recognize, correct for, and avoidfuture difficulties with this relatively new modality, just as with the provenmodalities. Formal QA-QC procedures should be put in place and diligentlyadhered to.
Maintenance, QA-QC, and workflow procedural modifications con-tinue to be developed as incidents occur and system troubleshooting iscarried out, as more radiology departments implement PACS technologies.Documentation of events and CQI committee review and analysis of systemfunctioning in conjunction with review of user comments and suggestions isextremely important to the successful clinical operation of the PACS.
FUTURE TRENDS IN IMAGE ACQUISITION
Although the types of imaging modalities will probably not change all thatmuch in the next several years, the anticipated future trends in image acqui-sition for digital radiology and PACS include changes in the image datasetsizes, changes in the imaging devices themselves, and improvement in imageprocessing for softcopy display of digital images.
IMAGE DATASETS
No new types of imaging modalities are foreseen for the near future.However, it is anticipated that the image data sets acquired from the exist-ing modalities will increase in overall study file size, in some cases dramati-cally; to a certain extent this has already begun. For example, many radiologydepartments have begun installing multiple detector array or multislice CTscanners, which tend to generate a greater number of individual images than
PACS: A Guide to the Digi tal Revolut ion220
DRE11 11/16/2005 9:43 AM Page 220
do the single detector array scanners. This is due to the slice thickness inhelical acquisition (~5mm) versus the single detector arrays (~7 to 10mm)and the clinical imaging protocols used, as well as the increasing clinicalutility of three-dimensional image display representations.
Image matrix sizes for the digital projection radiography devices (CRand DR) have gone up from roughly from 1000 ¥ 2000 square matrices to4000 ¥ 5000 pixels squared for mammography applications. The increasedsampling was done to improve the spatial resolution. Most laser film digi-tizers can now vary their spot sizes from 200mm down to 50mm, greatlyimproving the inherent spatial resolution of the resulting images of thescanned analog film, with a concomitant increase in file size.
The bit depth representation of grayscale pixel values has also increasedfrom 8 bits to 10, 12, and 16 bits, and color images are stored as 32-bit- or4-byte-per-pixel data files. Furthermore, the addition of post-processingresults or slice reconstructions, and cinegraphic sequences to the imagedataset, while improving the overall quality of the image, may greatlyincrease the amount of data to be acquired into a PACS.
DEVICES
While image datasets and file sizes are getting larger, the imaging devicesthemselves will continue to get smaller in physical footprint. This has beenseen most dramatically with the CR devices, going from requiring roughly36m2 of floor space and special electrical power and cooling to desktopdevices that can be placed in most any location. CT and MRI devices tooare becoming smaller in size, more portable, and more robust. Hopefullythese devices will continue to become less expensive.
IMAGE PROCESSING
An important area of increased attention continues to be image-processingcapabilities for softcopy image display. Future processing techniques willmost likely go above and beyond the simple window and level (or contrastand brightness) manipulation techniques. These post-processing algorithmsare currently available and tunable at the imaging modality or accompany-ing modality acquisition workstation but may in time be manipulable in real-time at the display station.
Image compression is currently being debated but may eventually beavailable at the modality to reduce image transmission time and archival
IMAGE ACQUISITION 221
DRE11 11/16/2005 9:43 AM Page 221

space. Some techniques, such as the wavelet transform, may become morewidely utilized not only as compression techniques, but also for imageenhancement at the imaging devices.
In time, it is anticipated that the percentage of all imaging devices uti-lized by healthcare enterprises that are digital in nature will increase greatly.Further, the percentage of digital image acquisition from the devices that arecapable should increase, decreasing the amount of film used as an acquisi-tion, display, and archival medium.
CONCLUSION
Image acquisition is the first point of data entry into a PACS. Errors gener-ated here can propagate throughout the system, adversely affecting clinicaloperations. General predictors for successful incorporation of image acqui-sition devices into a digital-imaging department include:
◗ Ease of device integration into the established daily workflow routineof the clinical environment
◗ High reliability and fault tolerance of the device◗ Simplicity and intuitiveness of the user interface◗ Device speed
Imaging modality conformance with the DICOM standard is critical.DICOM consists of a standard image format as well as a network commu-nications protocol. Compliance with this standard enables an open archi-tecture for imaging systems, bridging hardware and software entities andallowing interoperability for the transfer of medical images and associatedinformation between disparate systems.
◗ Compliance with the DICOM standard has greatly facilitated imageacquisition for PACS and digital radiology departments.
◗ DICOM compliance should be required from the modality andPACS vendors.
◗ Most modalities today do comply with the DICOM standard.◗ Interface boxes are available to convert legacy devices that do not
comply with the DICOM standard.
Equally essential, particularly at acquisition, is interfacing the RIS-HISwith the PACS. This greatly facilitates input of patient demographics (name,
PACS: A Guide to the Digi tal Revolut ion222
DRE11 11/16/2005 9:43 AM Page 222
date, time, MRN, AccNum, exam type) and imaging parameters and enablesautomatic PACS data verification, correlation, and error correction with thedata recorded in the RIS-HIS. Most imaging modalities are now tightlycoupled with the RIS, providing automatic downloading of demographicinformation from the RIS, via barcode readers, to the modality, and henceto the DICOM header. Additionally, many vendors comply with theDICOM modality worklist function, providing the capability to downloadRIS-HIS schedules and worklists directly to the imaging modality. Both of these features eliminate the highly error-prone manual entry of data atacquisition.
◗ RIS-HIS-PACS database integration is essential for a clinically func-tioning digital department and is intelligence added.
◗ HL7 compliance is desirable.◗ RIS-HIS databases are typically patient-centric, enabling query and
retrieval of information by the patient, study, series, or image datahierarchy.
◗ Modality worklist capability at the imaging device can greatlyimprove departmental workflow and efficiency.
Image acquisition from the inherently digital modalities such as CTand MRI should be performed as a direct digital DICOM capture, asopposed to frame grabbing of the data. Direct digital interfaces allow captureand transmission of image data from the modality at the full spatial resolu-tion and full bit depth or grayscale inherent in the modality, while analog(video) frame grabbers digitize the video signal voltage output going to an image display, such as a scanner console monitor, and image quality islimited by the process to only 8 bits (or 256 gray values). Direct capture ofdigital data from the inherently digital modalities is the preferred method ofacquisition.
Digital acquisition of images originally recorded on film can be accom-plished using a variety of image digitization devices. These include the infre-quently used analog video cameras with ADCs, digital cameras, CCDs, andlaser scanners. Laser scanners use a fine laser beam of generally variable or adjustable spot sizes down to 50mm. They have maximum resolution of4096 ¥ 5120 ¥ 12 bits, can accommodate the full optical density range offilm, and are semiautomatic or fully automatic in operation. Laser scannersare the film digitizer of choice for most PACS needs and have an adjustablespot size to meet the application.
Computed radiography and DR are modalities that digitally acquireprojection radiographs without the use of film. Computed radiography uti-
IMAGE ACQUISITION 223
DRE11 11/16/2005 9:43 AM Page 223

lizes a PSP IP in a cassette design similar to that of screen-film cassettes.The PSP IPs have the property that, when exposed to x-ray, a latent imageis formed in the plate until it is subsequently stimulated to luminesce by alaser. The emitted light is then captured and converted to a digital image.Digital radiography uses conversion of x-ray energy to electrical charge(often via an intermediate light conversion step). The electrical charge is col-lected by a TFT pixel array, offering electronic readout initiated immedi-ately at the time of exposure. Both CR and DR have:
◗ All the benefits of digital (filmless) images including the ability toacquire, transmit, display, manipulate, and store data digitally
◗ Wide latitude response detectors, potentially reducing retakes result-ing from poor exposure as in the screen-film based environment
◗ Equivalent spatial resolution capabilities
Computed radiography has superior procedural flexibility for someexaminations with difficult positioning, can accommodate portable bedsideexaminations, and is a proven clinical modality. Digital radiography has ahigher efficiency detector with potential for dose reduction and immediateimage readout with higher patient throughput, particularly in settings witha steady flow of high volume.
Some current DR problem areas include portability issues, the require-ment for a single device per radiographic room (“one-room-at-a-time tech-nology”), and its high production cost. It is likely that CR and DR will coexistas digital radiographic devices for some time. Quality assurance and qualitycontrol procedures become necessarily modified in the filmless radiologydepartment, and new processes must be put in place. Forming and main-taining a CQI committee may facilitate:
◗ PACS installation and training◗ Workflow management◗ Quality assurance◗ Clinical acceptance
The major problem occurring at acquisition is inaccurate data input atthe modality. This source of (human) input error can be greatly reduced byintegrating the RIS-HIS with the PACS. This allows RIS verification ofPACS data prior to archival, and an image audit monitoring of what is in thePACS as compared with what is in the RIS, and vice versa. Quality controlfor the imaging modalities is just as essential in the digital world as it is in
PACS: A Guide to the Digi tal Revolut ion224
DRE11 11/16/2005 9:43 AM Page 224

the film-based arena. Proper planning and communication with end usersearly and often as to system status can reduce dissatisfaction with the system.
Future trends anticipated in image acquisition for digital radiology andPACS are summarized in Table 11.3 and include changes in image datasetssuch as increased matrix sizes, increased inherent spatial resolution,increased slice numbers and study sizes, and improved image quality.Imaging devices themselves will continue to become smaller in physical footprint, more portable and robust, and possibly less costly. The image-processing capabilities for softcopy display will be an important area receiving increased attention in the future. Many of these capabilities will bedeveloped by the image acquisition modality vendors and by research teamsfor application to the optimal softcopy display of digital images for diagno-sis and review. In time, the percentage of images acquired digitally willincrease, and less film will be printed for medical imaging.
◗ REFERENCES
Agfa. The highest productivity in computed radiography. Agfa-Gevaert NV Report.Belgium; 1994.
Andriole KP. Anatomy of picture archiving and communication systems: nuts andbolts—image acquisition: getting digital images for imaging modalities. J DigitImaging. May 1999a;12(2 suppl 1):216–217.
IMAGE ACQUISITION 225
TABLE 11.3Summary of Future Trends in Image Acquisition
Image matrix size ≠Image quality ≠≠Spatial resolution ≠Number of image slices ≠≠≠Size of imaging examinations ≠≠≠Size of devices ØØPortability of devices ≠Cost of devices ØPercentage of image devices that are digital ≠≠≠Percentage of image acquisition that is digital (elimination of film) ≠≠
DRE11 11/16/2005 9:43 AM Page 225
Andriole KP. Computed radiography overview. In Seibert JA, Filipow LJ, AndrioleKP, eds. Practical Digital Imaging and PACS. Medical Physics Publishing;1999b:135–155.
Andriole KP. Productivity and cost assessment of CR, DR and screen-film for out-patient chest examinations. J Digit Imaging. January 2003;15(3):161–169.
Andriole KP, Avrin DE, Yin L, Gould RG, Arenson RL. PACS databases and enrich-ment of the folder manager concept. J Digit Imaging. February 2000;13(1):3–12.
Andriole KP, Gooding CA, Gould RG, Huang HK. Analysis of a high-resolutioncomputed radiography imaging plate versus conventional screen-film radiogra-phy for neonatal intensive care unit applications. SPIE Phys Med Imaging.1994;2163:80–97.
Andriole KP, Gould RG, Avrin DE, Bazzill TM, Yin L, Arenson RL. Continuingquality improvement procedures for a clinical PACS. J Digit Imaging. August1998;11(3 suppl 1):111–114.
Barnes GT. Digital x-ray image capture with image intensifier and storage phosphorplates: imaging principles, performance and limitations. Proceedings of the AAPM1993 Summer School: Digital Imaging. Monograph 22. Charlottesville, VA: Uni-versity of Virginia; 23–48.
Berg GE, Kaiser HF. The x-ray storage properties of the infra-red storage phosphorand application to radiography. J Appl Phys. 1947;18:343–347.
Bogucki TM, Trauernicht DP, Kocher TE. Characteristics of a storage phosphorsystem for medical imaging. Kodak Health Sciences Technical and Scientific Mono-graph 6. New York: Eastman Kodak Co; July 1995.
Gringold EL, Tucker DM, Barnes GT. Computed radiography: user-programmablefeatures and capabilities. J Digit Imaging. 1994;7(3):113–122.
Honeyman JC, Staab EV. Operational concerns with PACS implementations. ApplRadiol. August 1997a;13–16.
Honeyman JC, Jones D, Frost MM, et al. PACS quality control and automaticproblem notifier. SPIE Medical Imaging 1997: PACS Design and Evaluation1997b;3035:396–404.
Ishida M. Fuji Computed Radiography Technical Review, No. 1. Tokyo: Fuji Photo FilmCo, Ltd; 1993.
Kodak. Digital radiography using storage phosphors. Kodak Health Sciences Technicaland Scientific Monograph. New York: Eastman Kodak Co; April 1992.
Kodak. Optimizing CR images with image processing: segmentation, tone scaling,edge enhancement. Kodak Health Sciences Technical and Scientific Manuscript. NewYork: Eastman Kodak; March 1994.
Kotera N, Eguchi S, Miyahara J, Matsumoto S, Kato H. Method and apparatus forrecording and reproducing a radiation image. US Patent 4,236,078 (1980).
Lee DL, Cheung LK, Jeromin LS. A new digital detector for projection radiogra-phy. Proc SPIE Phys Med Imaging. February 26–27, 1995;2432:237–249.
PACS: A Guide to the Digi tal Revolut ion226
DRE11 11/16/2005 9:43 AM Page 226

Luckey G. Apparatus and methods for producing images corresponding to patternsof high energy radiation. US Patent 3,859,527 (June 7, 1975). Revised No.31847 (March 12, 1985).
Matsuda T, Arakawa S, Kohda K, Torii S, Nakajima N. Fuji Computed RadiographyTechnical Review, No. 2. Tokyo: Fuji Photo Film Co, Ltd; 1993.
Oestman JW, Prokop M, Schaefer CM, Galanski M. Hardware and software arti-facts in storage phosphor radiography. Radiographics. 1991;11:795–805.
Ogawa E, Arakawa S, Ishida M, Kato H. Quantitative analysis of imaging perform-ance for computed radiography systems. SPIE Phys Med Imaging. 1995;2432:421–431.
Seibert, JA. Photostimulable phosphor system acceptance testing. In: Seibert JA,Barnes GT, Gould RG, eds. Specification, Acceptance Testing and Quality Controlof Diagnostic X-ray Imaging Equipment. Medical Physics Monograph No. 20.Woodbury, NY: AAPM; 1994:771–800.
Solomon SL, Jost RG, Glazer HS, Sagel SS, Anderson DJ, Molina PL. Artifacts incomputed radiography. AJR Am J Roentgenol. 1991;157:181–185.
Sonoda M, Takano M, Miyahara J, Kato H. Computed radiography utilizing scan-ning laser stimulated luminescence. Radiology. 1983;148:833–838.
Storto ML. Andriole KP, Kee ST, Webb WR, Gamsu G. Portable chest imaging:clinical evaluation of a new processing algorithm in digital radiography. 81st Sci-entific Assembly and Annual Meeting of the Radiological Society of NorthAmerica; November 26–December 1, 1995; Chicago.
Volpe JP, Storto ML, Andriole KP, Gamsu G. Artifacts in chest radiography with athird-generation computed radiography system. AJR Am J Roentgenol. 1996;166:653–657.
Vuylsteke P, Dewaele P, Schoeters E. Optimizing radiography imaging performance.Proceedings of the 1997 AAPM Summer School, 107–151.
Willis CE, Leckie RG, Carter J, Williamson MP, Scotti SD, Norton G. Objectivemeasures of quality assurance in a computed radiography-based radiologydepartment. Proc SPIE. 1995;2432:588–599.
Wilson AJ, West OC. Single-exposure conventional and computed radiography: thehybrid cassette revisited. Invest Radiol. 1993;28(5):409–412.
IMAGE ACQUISITION 227
DRE11 11/16/2005 9:43 AM Page 227

IMAGECOMPRESSION
BRADLEY J. ERICKSON
Implementation of any picture archiving and communication system (PACS)requires a discussion of how to deal with the large quantities of data that
must be transmitted and stored. Even before PACS, clever engineers devisedencoding schemes that reduced the apparent size of images to reduce thedemands placed on transmission and storage devices. Encoding images inorder to reduce storage and transmission demands is called “image com-pression.” Compression of medical images is controversial—some argue thatit should not be used, because soon storage and networks will be cheapenough that compression is not necessary. This argument has been madefrom the early days of PACS and continues to be made. I suspect this issuewill continue to be controversial until humans no longer view images.
Those faced with the need to implement systems in the present pointto the benefits that can be achieved. Sometimes the argument for using compression is purely financial: using compression tips the scale from alosing proposition to a winning one. It can allow one to use less expensivenetworking technologies and requires less (potentially much less) storage.These can be major components of the capital acquisition as well as operat-ing costs.
12CHAPTER
DRE12 11/16/2005 9:44 AM Page 229

In other cases, compression can make the difference between a projectthat is feasible and one that cannot work. When a specific turnaround timeis required to achieve satisfactory service and the network capacity is limited,compression can be the only solution. This is most often the case whenremote facilities are an integral part of the PACS equation.
Whether cost savings or turnaround time is the issue, the counter-argument is frequently made that if one delays the project, the advance oftechnology can obviate the need for compression. This is an appealing argu-ment, for Moore’s law seems to apply not only to processor speed but alsoto network and storage devices. Unfortunately, this oversimplifies the situa-tion. The primary reason this argument fails is that the demands on theimaging system are not static. The standards for PACS performance con-tinue to rise in step with Moore’s law. That is because the same advances inprocessing power that make a PACS cheaper are also making imaging devicesthat produce higher image data volumes. A few years back, we reported thatover a long period of time, the daily image data volume for computed tomog-raphy (CT) and magnetic resonance (MR) scanners was paralleling the in-creases in network speed and storage density. Figure 12.1 shows that therelationship has held true for 30 years. The conclusion is that one shouldnot delay a project in expectation that technology advances will eliminatethe need for compression. If a PACS implementation is not viable without com-pression today, it likely will not be viable in the future. Similarly, if compression is
PACS: A Guide to the Digi tal Revolut ion230
Disk Log (MB/in)
LAN Log (KB/sec)
CT Log (MB/day)
MR Log (MB/day)
7
6
5
4
3
2
1
0
–1
1974
1978
1983
1988
1993
1998
2003
2008
*
FIGURE 12.1
Graph of network speed, storage density, and daily CT and MR datavolumes from 1974 to 2004. * = projected.
DRE12 11/16/2005 9:44 AM Page 230
necessary at the start of a project, one should plan that it will continue to be neces-sary for its lifetime.
IMAGE COMPRESSION TECHNOLOGIES
There are two main categories of image compression: reversible, or lossless,and irreversible, or lossy. Reversible compression will exactly reproduce theoriginal image after compression and decompression. There is little contro-versy surrounding the use of lossless compression—the major question iswhether the computational effort is worth the modest gain. For most medicalimages, the gain is on the order of 2 :1 to 3 :1. A 2 :1 ratio means that thestorage or network demands are 50% of what the original image wouldrequire; 3 :1 would require just 33%. Many systems implement this type ofimage compression because the computation cost is small compared to thecost savings in storage and networking. In some cases, this compressionoccurs only when the image is saved to the long-term archive, saving onlystorage costs. Some storage devices actually have hardware that performs thistype of compression.
There are 2 main ways that lossless compression algorithms work. Thefirst type is the group that utilizes repetition within an image to compressthe image. For instance, if there were several consecutive pixels with thesame value, it is faster to say “5 pixels of value 312” than to say “312 312312 312 312.” Other than some outer regions of images (e.g., the pixels thatfill the circle of a CT to make a square) or three-dimensional (3-D) render-ings, exact repetition of pixel values is rather rare for medical images.However, an adaptation is to use the prior value as a starting point and justsend the difference. Other than where there are strong edges, small numbers(which take less space) added to the prior value will correctly represent thepixel value.
An alternative to this strategy is to look for patterns within the image.If one were to look through this text, there would be a fairly high frequencyof “the” and “to,” and one would find that “q” was always followed by “u.”If a single-letter code were substituted for these patterns, the storage spacerequired for the text could be significantly reduced. This is a dictionary-stylecompression method and is commonly used for highly structured informa-tion, such as text. It is used in most of the “zip” programs that are availableto compress files.
The lines that follow this paragraph show examples of lossless com-pression methods. The original pixel values are shown in [a]. A run-lengthencoding of the pixels could be that shown in [b]. Note that there are more
IMAGE COMPRESSION 231
DRE12 11/16/2005 9:44 AM Page 231

values sent in line [b] than line [a], though the value encoding how many ofa kind may not take as much space as the value. Line [c] shows a differen-tial encoding of the pixels. The number of values is the same, but if thechange values are small, they will take less space to transmit. The next line,[d], has two parts: a dictionary and the data. The data values are used to lookup the actual pixel values for the output. The first entry in the dictionary isthe most common pattern and uses the fewest bits possible, with less fre-quently used patterns consuming more bits. Note that in all of these exam-ples, the compressed data is larger than the original. This is because in sucha small dataset there is little redundancy to take advantage of and becausedifferent data sizes (bits) are not represented.
[a] 1 4 4 4 5 6 7 8 8 4 5 4 5 1 4
[b] 1 1)(3 4)(1 5)(1 6)(1 7)(2 8)(1 4)(1 5) (1 4)(1 5)(1 1) (1 4)
[c] 1 3 0 0 1 1 1 1 0 -4 1 -1 1 -4 3
[d] dictionary: (4 5) (4 4) (1) (6) (7) (8 8) (4)data: 3 2 1 4 5 6 1 1 3 7
While there is some structure to medical images, the gain achieved bycompression of images is not as great as that achieved by compression oftext. Compared with the repetition strategy described above, pattern-basedcompression typically will achieve higher compression ratios but requiresmore central processing unit (CPU) power and memory to compress anddecompress. However, one can devise methods in which most of the CPUpower is used for the compression task (which is done just once) and less fordecompression (which is done every time the image is viewed). Unlike loss-less compression, where the compression ratio is the same for a given image,the implementation of lossy compression requires decisions about how muchcompression to apply. Depending on the algorithm, one may specify a“quality factor,” which roughly correlates with perceived image quality aftercompression, or the algorithm may require a specific compression ratio. Itwould seem that the quality factor approach is more desirable, as each imagewould then be optimally compressed. In practice, however, the correlationwith perceived image quality is variable. This will be discussed in greaterdepth later in this chapter.
Lossy compression begins with a very different step from lossless com-pression that is not very intuitive. That first step is a transformation, and the
PACS: A Guide to the Digi tal Revolut ion232
DRE12 11/16/2005 9:44 AM Page 232

type of transformation is often used to characterize the type of compression.An early popular transformation was the discrete cosine transform (DCT).In some cases, the entire image had this transform applied. However, this iscomputationally intensive, particularly for the computers of the 1980s, whenthe technique gained popularity. Therefore, an industry group known as theJoint Photographic Experts Group ( JPEG) created a processing algorithmfor images that would break the image into 8 ¥ 8 pixel blocks and apply theDCT to each block. These smaller blocks were more amenable to computersof the day and permitted dedicated hardware to be built for this task. Ineither case, the DCT would create an image (with the same matrix size asthe original image/block) in which the low-frequency components were con-centrated in the lower left corner, with the highest-frequency elements inthe upper right. The values in this transformed image matrix are sometimesreferred to as coefficients because they are coefficients for a mathematicalformula that can re-create the image. More recently, the various forms ofthe wavelet transformation have been applied for image compression. Suchwavelet transforms produce multiple images at different scales, where thenext-higher-resolution image has the higher-frequency changes from itslower-resolution predecessor. Figure 12.2 shows an example of a 4-levelwavelet transformed image.
After the transformation of choice has been performed, the image hasbeen altered, but there has been no loss of information—one could invertthe transformation and exactly reproduce the original image. The next step after transformation is quantization, which is the step of deciding which parts of the transformed image are important and which are not. Onecould select a low-frequency rectangle and compute the inverse transformof it to re-create an image that would be somewhat blurrier than the origi-nal. How blurry the resulting image is depends on how effectively the trans-formation concentrated information into the selected parts of thetransformed image.
There are 2 primary ways one can save storage/transmission space: byassuming that coefficients not sent are 0 (zero-filling) or by reducing theaccuracy of the coefficients that are sent (e.g., converting from 80-bit float-ing point values to 20-bit scaled integers). In some schemes, including JPEG,one can also preferentially save accuracy on those coefficients that representfrequencies that the human eye is sensitive to, while saving bits on thosecomponents to which the eye is not sensitive. The multiresolution nature of wavelets also permits more sophisticated selection of parts of the imagethan just a rectangle. Some algorithms, such as Set Partitioning in Hierar-chical Trees (SPIHT), efficiently represent areas of images that have muchactivity while saving bits in uninteresting areas. This is complementary to
IMAGE COMPRESSION 233
DRE12 11/16/2005 9:44 AM Page 233

preferring spatial frequencies to which the eye is sensitive, as describedabove.
In some cases, it is also desirable to sequence the coefficients so thatthose that are most important to recreating a faithful image are first in thestream of data, rather than ordered by an X, Y position. This can allow theuser to get a quick view while the image continues to improve as more infor-mation is sent. This is called progressive streaming (referring to the orderof data transmission) or successive refinement (referring to the actual dis-playing of improved images).
After the coefficients have been quantized, there is often still someredundancy, and so the third step in lossy compression is to use one of thelossless techniques described above (typically a dictionary-type method) tofurther compress the quantized coefficients.
Unlike lossless methods, in which the compression ratio is fully deter-mined by the algorithm selected, lossy methods allow the user to select eitherthe compression ratio or a quality factor. In either case, the user’s choice
PACS: A Guide to the Digi tal Revolut ion234
FIGURE 12.2
Example of a wavelet transformed image. The lowest-frequencycomponents are in the upper left corner. The original image can beexactly reconstructed from this image.
DRE12 11/16/2005 9:44 AM Page 234

affects how much the coefficients are quantized, meaning that a judgment ismade about acceptable compression level. Unfortunately, in most cases it is not feasible for the user to interactively select the appropriate compres-sion for each and every image, and so general rules for compression must beused.
APPLICATION TO MEDICAL IMAGING
The description of image compression provided above is not unique tomedical images—these image compression algorithms are used for imageson the Internet or from your digital camera. However, some unique aspectsof medical images deserve comment. The first is that most medical imagesare grayscale, with more gray levels than most commercial/consumer images.Radiographic images are 10 to 12 bits, while CT and MR images are 12 to16 bits. Since computers prefer to deal with pixels that are multiples of 8bits, most medical images are stored using 16 bits per pixel. One exceptionis ultrasound. In some cases (particularly Doppler), ultrasound images use24-bit color, which is like that used in commercial/consumer imaging.Grayscale ultrasound images are variable and may be either 8-bit or 16-bit.The significance is that JPEG was created without attention to medicalimaging, and the extensions to JPEG to allow it to support 12 or 16 bits arenot always compatible.
Another difference is that CT and MR images are often from spatiallyadjacent locations, meaning there is significant redundancy between 2 ormore images. This is not considered in any of the (two-dimensional [2-D])algorithms described above. However, an update of the JPEG standard(referred to as JPEG2000) does have components that support the notion ofa 3-D stack of slices. While the JPEG2000 standard is still advancing, thebasic 2-D methods have been ratified, and there are implementations thathave been tested on medical images. Some of those results will be discussedlater in this chapter. Because compression has been considered important tothe success of PACS by many of its leaders, there was a concerted effort toparticipate in the JPEG2000 standard in order to make it better supportmedical images—in particular, by addressing the 16-bit issue. The DigitalImaging and Communications in Medicine (DICOM) standard has includedJPEG-based compression in its transfer syntaxes for some time. The ap-proved part of JPEG2000, which focuses on 2-D image compression usinga wavelet transformation, has already been adopted as a DICOM standard(Supplement 61, November 2001). It includes support for 16-bit images,progressive encoding, and region-of-interest functions (improved quality
IMAGE COMPRESSION 235
DRE12 11/16/2005 9:44 AM Page 235
in specific regions of the image). It is expected that as other parts ofJPEG2000 are ratified, such as the volumetric image functions ( JP3D orJPEG2000 Part 10) and Motion JPEG for endoscopy, DICOM will addthem to its standard.
EVALUATION IN MEDICAL IMAGING
IS IT WORTH IT?
There is controversy over whether there is any acceptable level of lossy com-pression for medical images or if there should be no allowance for alterationof pixel data. I believe that lossy compression can be acceptable and justi-fied. Many major medical centers have come to the same conclusion. Thereare several bases for this conclusion.
First, as with nearly all parts of medical practice, one must exercisejudgment about the trade-off of benefits and risks. Higher-quality radi-ographs can be obtained if higher-exposure images are obtained. Whetherthis would improve diagnosis or simply reduce quantum noise is the judg-ment we make when an exposure/dosage decision is made. In the case of MR and CT, one could reconstruct many more images than is typicallyrequired using interpolation. In the case of MR, one could use many moresignal averages to reduce noise. But in order to conserve resources (reduceMR examination time or reduce total images per examination) we make judg-ments about how much is enough to be diagnostic. The same is true withimage compression. As long as there is a thorough understanding of thetrade-offs, and confidence that diagnostic accuracy is not significantlyimpacted, compression is no more “dangerous” than other decisions inmedical imaging.
Second, the pixel data altered by compression has nearly always beenaltered even before it is compressed. CT uses reconstruction filters that mayblur to reduce noise. Computed radiographs have lookup tables applied toemphasize certain regions of the histogram, while suppressing others, andmay also have spatial filtering. These are also carefully considered alterationsof pixel data in order to improve radiologist efficiency. Perhaps the greatestloss of data occurs in fluoroscopy, in which only a few spot images are takenfrom several minutes of an examination.
Third, it has been shown that at modest levels, lossy compression actu-ally improves diagnostic performance because it preferentially loses thenoise. This has been shown to improve detection of breast cancers as well
PACS: A Guide to the Digi tal Revolut ion236
DRE12 11/16/2005 9:44 AM Page 236
as lung pathologies. From this perspective, compression could be viewed asa valuable processing step. This also raises issues about implementation. Iflossy compression makes a lesion more conspicuous, compressing an imageonly after interpretation could cause one to miss a lesion that is more appar-ent with compression. If the lossy compressed version is the only versionarchived, it also could lead to greater difficulties if there should be anymedico-legal issues about lesion perception/diagnosis. For this reason, whenour department had the opportunity to implement lossy compression priorto diagnostic review, we did so. In that case, no one ever saw the originalimages—the same lossy compressed image is interpreted by the radiologist,distributed to the referring physician, and archived for any later review. Ofcourse, this was done only after a large-scale review of the compression algo-rithm that was implemented.
In these days when containment of medical costs is receiving muchattention, we should not be reluctant to make a carefully considered, thor-oughly studied decision to reduce costs by implementing lossy compression.
SETTING THE STANDARD
If one agrees that using lossy compression can be an acceptable decision, thenext question is how to determine what is good enough. As noted in thetechnical description of lossy algorithms, nearly all allow the user to selectat least the range of compression that is achieved. That is really the chal-lenge of compression: how to maximize the compression ratio withoutdegrading the image. At least 4 methodologies have been used to answer thisquestion.
The first method is to use human visual ratings. In this case, one simplyasks radiologists either: (1) Are the compressed images good enough? or (2)Is there any difference between compressed and uncompressed images? Thefirst question is a bit more difficult to justify, as it involves a judgment aboutwhat is required for diagnosis. In many cases, the abnormalities are soobvious that even marked image degradation could still permit a diagnosis.This is usually how x-ray exposure is selected. An alternative that seems moreacceptable is to see whether there is any perceptible difference between com-pressed and uncompressed images. If one cannot tell the difference, it isunlikely to make a diagnostic difference. This type of study is easy to execute,since one can select randomly from all images and then present pairs ofimages (the original and the compressed/decompressed) to a blinded rater.If the rater prefers the compressed images at the same rate (or higher ratedue to de-noising effect), then the compression ratio is acceptable.
IMAGE COMPRESSION 237
DRE12 11/16/2005 9:44 AM Page 237
The second method seeks to prove that compressed images are diag-nostically equivalent to uncompressed. To do this, one must have proof ofwhat the diagnosis is for each case. Furthermore, one should really have arange of diseases that would be expected to be diagnosed with that type ofimage. Ideally, the gold standard for knowing that disease is present shouldbe established by an independent method, since we know that compressioncan improve performance. If an independent standard were not used, all the correct diagnoses made possible by improved signal-to-noise ratio wouldbe counted as misses. And finally, you must have enough of each type ofdisease to prove a difference. Note that failing to find a difference is not thesame as proving equivalence. The latter is much more demanding statisti-cally, while failing to find a difference is a certainty if you have only a fewcases.
One example of this methodology is a study we did with chest radi-ographs, in which we selected 2 common pathologies: nodules and fibrosis.We selected only 2 diseases to keep the receiver operating characteristic(ROC) design simple. We also selected them because they had very differ-ent properties—uncalcified nodules are low-frequency findings, while fibro-sis is a high-frequency finding. Chest CT was used as the gold standard.Mammography can employ the same technique—masses versus microcalci-fications, with biopsy or clinical follow-up being the gold standard.
The third method is to use computer-aided diagnosis (CAD) output asa detector for diagnostic degradation. This has the advantage of allowingmany cases to be assessed with less effort. In addition, the variability of ahuman observer is removed. The major concern is that the features impor-tant to a CAD algorithm may not be the same for a human. Furthermore,CAD algorithms are generally focused on detecting a single disease (e.g.,cancer). In cases like mammography, where cancer is nearly the entire diseaserange, this is not a problem, but for nearly all other modalities, preservationof CAD performance ensures only that features important to that CAD algo-rithm are preserved, not necessarily all the features necessary for a radiologicinterpretation.
The fourth evaluation method is also computer-based but uses a modelof the human visual system to predict when lossy compression has producedalterations that would be visible to a human. Like method 3, this methodhas the advantage of allowing many cases to be evaluated with little humaneffort. It has the additional advantage over the CAD method in that it shouldbe valid for any type of image or disease. However, this method is complexto implement—one must have a valid model of the human visual system,which, in turn, requires knowledge of the output device. The computations
PACS: A Guide to the Digi tal Revolut ion238
DRE12 11/16/2005 9:44 AM Page 238

for this are also nontrivial. Nevertheless, there are now some reports thatare using this method.
COMPRESSION APPLICATIONS IN MEDICAL IMAGING
Clearly, the goal of medical image compression is to reduce the amount ofdata that must be stored or transmitted. Depending on the application, eitherlossy or lossless compression may be the best choice. Rather than reviewapplications using this division, it is probably more appropriate to evaluatecompression for each modality. This is because the compressibility of imagesis best correlated with modality.
MAMMOGRAPHY
Mammography is an area that has received much attention from the com-pression industry. That is because the data sets are large (40 megabytes [MB]per image ¥ 4 images per screening exam), there is a large exam volumebecause mammography is used for screening a large at-risk population, andexpertise is often not distributed to areas that acquire the images. This com-bination of factors means that moving the images from the acquisition location to a distant location where there is expertise in interpreting mam-mograms is often necessary.
One factor that has made analysis of mammogram compression easieris that there is really only one disease process of interest: breast cancer.However, breast cancer can have any of 3 types of appearance. The first isthat of a small area of tiny calcifications, also known as microcalcifications.The second appearance is of a mass, which will often have irregular borders.The third is distortion of the architecture of the tissue within the breast.Because these 3 appearances can be fairly easily characterized, the analysisof compression effects is simpler than for other image types.
Early mammography compression studies used digitized films andeither JPEG or a wavelet variant. Because early algorithms tended to losehigh-frequency information first, most attention was paid to the effect onmicrocalcifications. Studies from the 1990s showed that JPEG compressioncould be applied at levels up to 15 :1 without producing perceptible changesin the images, as assessed by image-processing experts. One should note thatthis study did not use radiologists to evaluate the images. This is often aproblem—to do a good study, one must have many cases with subtle disease
IMAGE COMPRESSION 239
DRE12 11/16/2005 9:44 AM Page 239

with an independent gold standard, and these many cases should be evalu-ated by radiologists. Just compiling a large set of subtle cases with proof ofdiagnosis is difficult. Getting several experts to review these cases is moredifficult. And since the cases selected are subtle, there will be significant vari-ability in the ratings—variability that will obscure any subtle differencecaused by compression.
For these reasons, some have begun using computer-aided diagnosis(CAD) as a measure of acceptable compression. This is an elegant way toavoid the variability inherent in human observers, and to evaluate the largenumber of cases required to detect small differences.
Early studies, of necessity, used digitized film mammograms. Digitaldetectors are beginning to appear on the market. It is possible that the imageproperties are different, and so it is necessary to perform separate studies onthese images to determine the correct compression ratio. But at the sametime, compression algorithms, such as JPEG2000, are advancing. JPEG2000is receiving much attention because it has been adopted into the DICOMstandard and because it holds promise for better compression performancethan standard JPEG. One recent study using an alternative forced-choicemethod found that digital mammograms compressed with JPEG2000 atratios up to 20 :1 were indistinguishable from the originals, which is similarto results for digitized films.
COMPUTED RADIOGRAPHY/DIGITAL RADIOGRAPHY
Compression of radiographic images also has a long history, beginning withstudy of digitized radiographs but now focusing on computed radiography(CR) and digital radiography (DR) images. It is encouraging that the resultsseem similar: digitized radiographs seem to be about as compressible as CRand DR. For chest radiographs, ratios in the range of 20 :1 seem to produceno visible or diagnostic degradation. Slone found that with very close inspec-tion/magnification, images compressed at 10 :1 using JPEG are still indis-tinguishable from originals, and at normal viewing conditions, 20 :1 isequivalent. Compression at ratios of up to 32 :1 (either JPEG or wavelet) didnot degrade detection of simulated nodules on chest phantom images. Wefound that for either nodule diagnosis or interstitial disease detection,wavelet compression of digitized chest X-rays (CXRs) at up to 40 :1 was notsignificantly different for nodules and for interstitial disease, and perform-ance at 10 :1 showed a trend to be superior to original images. There arefewer studies of musculoskeletal radiographs, but those that exist also showthat compression in the range of 20 :1 does not alter visual appearance.
PACS: A Guide to the Digi tal Revolut ion240
DRE12 11/16/2005 9:44 AM Page 240

COMPUTED TOMOGRAPHY AND MAGNETIC RESONANCE IMAGES
Images with a smaller matrix, such as CT and MRI, might be expected tobe less compressible because there is less potential for redundancy; this seemsto be the case. Whereas radiography seems to tolerate ratios in the 20 :1range, acceptable compression ratios for CT and MR seem to be closer to10 :1. There is also very little difference between compression methods,likely because there is less redundancy for full-frame methods such asJPEG2000 and wavelet to leverage. In a study of wavelet compression, ratiosof 8 :1 did not affect accuracy of diagnosis of acute appendicitis, but 16 :1and 24 :1 did show decreased sensitivity. Another study showed no changein nodule detection on low-dose chest CT at 10 :1 utilizing wavelet com-pression; 10 :1 was also found equivalent for both JPEG and wavelet fordetection rate for lung cancers on low-dose chest CT. Brain MRIs com-pressed using a wavelet algorithm at up to 20 :1 showed no difference in ROC value for variety of lesions for a 512 ¥ 256 matrix and 10 :1 for a256 ¥ 256 matrix. This reflects rather nicely that the higher matrix had littleadditional information. JPEG compression of head CTs at up to 20 :1 didnot degrade ROC performance for detecting infarction, though infarction isa low-frequency finding that may be more compression tolerant.
While it would be nice to have a single ratio for a modality, this is notthe case. Conventional chest CTs compressed at 6 :1 ( JPEG) were consid-ered acceptable, but only 4 :1 was acceptable for thin section (2mm) CT.This is an interesting finding that despite the fact that compression seemsto discard noise preferentially, noisy images are less compressible. It demon-strates the importance of redundancy and texture versus information in visualappearance. This is an important problem because of the rapid expansion ofmultidetector CT. It is fairly simple to create very thin images as well asthicker images for a given body part. Studies comprising thousands of imagescould become routine. The fact that the greater noise in these thin sectionsdominates the redundancy is significant—not only are there more slices tostore and transmit, but they are also less compressible. Since potentially mul-tiple datasets are derived from the same projection data, some have proposedthat it may be more efficient to compress the projection images than to com-press the reconstructed sections.
FLUOROSCOPY
The largest systematic study of fluoroscopic compression, and probably ofany medical imaging modality, is for cardiac angiograms. This large, multi-
IMAGE COMPRESSION 241
DRE12 11/16/2005 9:44 AM Page 241
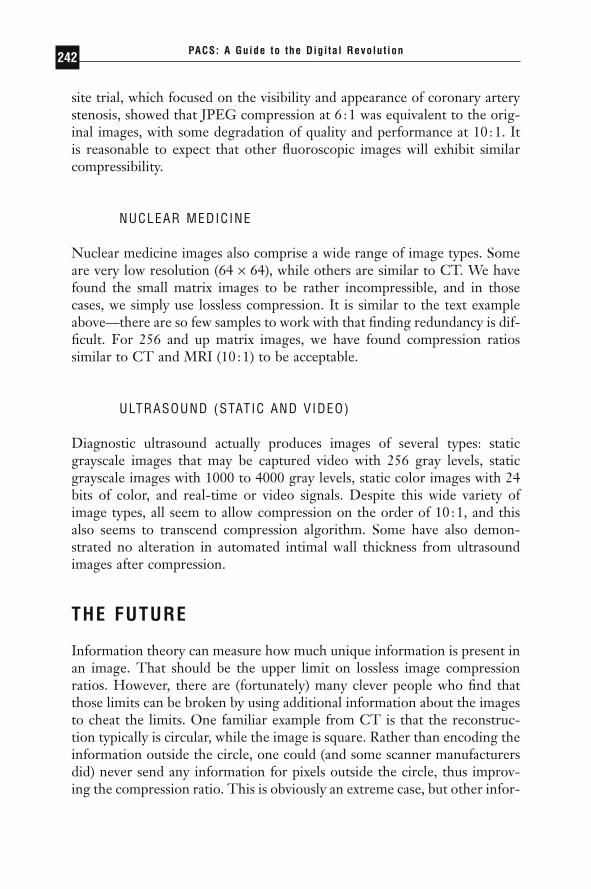
site trial, which focused on the visibility and appearance of coronary arterystenosis, showed that JPEG compression at 6 :1 was equivalent to the orig-inal images, with some degradation of quality and performance at 10 :1. Itis reasonable to expect that other fluoroscopic images will exhibit similarcompressibility.
NUCLEAR MEDICINE
Nuclear medicine images also comprise a wide range of image types. Someare very low resolution (64 ¥ 64), while others are similar to CT. We havefound the small matrix images to be rather incompressible, and in thosecases, we simply use lossless compression. It is similar to the text exampleabove—there are so few samples to work with that finding redundancy is dif-ficult. For 256 and up matrix images, we have found compression ratiossimilar to CT and MRI (10 :1) to be acceptable.
ULTRASOUND (STATIC AND VIDEO)
Diagnostic ultrasound actually produces images of several types: staticgrayscale images that may be captured video with 256 gray levels, staticgrayscale images with 1000 to 4000 gray levels, static color images with 24bits of color, and real-time or video signals. Despite this wide variety ofimage types, all seem to allow compression on the order of 10 :1, and thisalso seems to transcend compression algorithm. Some have also demon-strated no alteration in automated intimal wall thickness from ultrasoundimages after compression.
THE FUTURE
Information theory can measure how much unique information is present inan image. That should be the upper limit on lossless image compressionratios. However, there are (fortunately) many clever people who find thatthose limits can be broken by using additional information about the imagesto cheat the limits. One familiar example from CT is that the reconstruc-tion typically is circular, while the image is square. Rather than encoding theinformation outside the circle, one could (and some scanner manufacturersdid) never send any information for pixels outside the circle, thus improv-ing the compression ratio. This is obviously an extreme case, but other infor-
PACS: A Guide to the Digi tal Revolut ion242
DRE12 11/16/2005 9:44 AM Page 242

mation can be used to effectively reduce the data size without altering pixelsof interest. For instance, CT data is viewed at narrow window widths overonly a limited range of window levels. By altering the histogram, one canimprove compression ratios without producing any perceptible image degra-dation as normally viewed.
THREE-DIMENSIONAL (3-D) IMAGING
Three-dimensional imaging modalities, such as helical CT, MR, and ultra-sound (US), are those that are experiencing the greatest growth in datavolumes. Since they can also produce 3-D data, improved compression ratesmay be achievable by utilizing methods that take advantage of the coherencethat is through-plane, as well as in-plane. While early results with 3-D com-pression were disappointing, more recent attempts with thinner section datashow more promise. Figure 12.3 shows a comparison of 2-D versus a videolike 3-D compressor versus a true 3-D spatial compressor. It is likelythat this improved performance for 3-D in the later study is because thethinner sections possible with multidetector computed tomography(MDCT) allow more coherence of data between slices. However, the resultscontinue to fall below expectations, likely because these thinner slices alsohave more noise, which decreases compressibility.
IMAGE COMPRESSION 243
FIGURE 12.3
Comparison of JPEG2000 compression methods. The original imageis the left-most panel. The next image is after 2-D JPEG2000 com-pression has been applied. The third uses a videolike compressor,and the fourth is 3-D JPEG2000 compression. All compressedimages have a final compression ratio of 100 :1. Note the markeddegradation of the 2-D compressed image and the near-perfect 3-D compressed image. (Images courtesy of Michael Marcellin, University of Arizona.)
DRE12 11/16/2005 9:44 AM Page 243
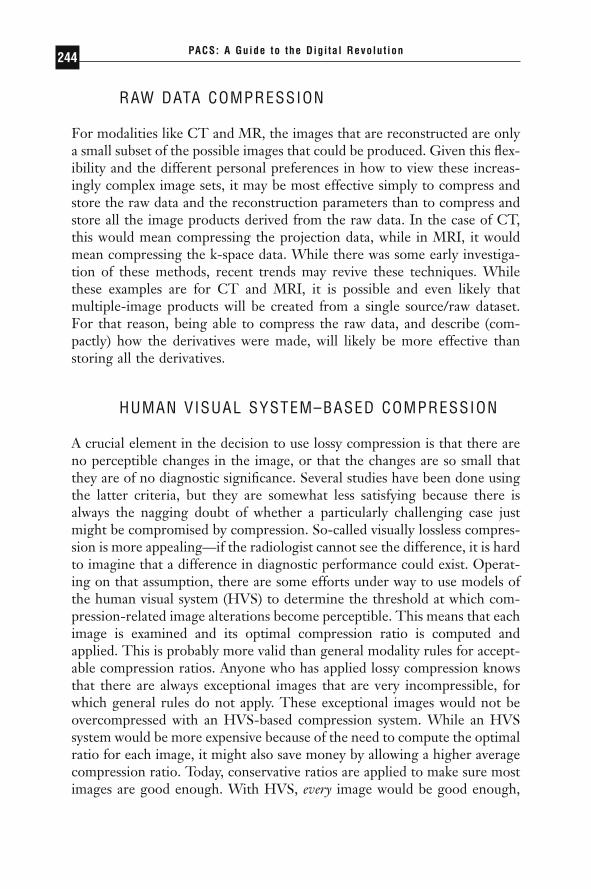
RAW DATA COMPRESSION
For modalities like CT and MR, the images that are reconstructed are onlya small subset of the possible images that could be produced. Given this flex-ibility and the different personal preferences in how to view these increas-ingly complex image sets, it may be most effective simply to compress andstore the raw data and the reconstruction parameters than to compress andstore all the image products derived from the raw data. In the case of CT,this would mean compressing the projection data, while in MRI, it wouldmean compressing the k-space data. While there was some early investiga-tion of these methods, recent trends may revive these techniques. Whilethese examples are for CT and MRI, it is possible and even likely that multiple-image products will be created from a single source/raw dataset.For that reason, being able to compress the raw data, and describe (com-pactly) how the derivatives were made, will likely be more effective thanstoring all the derivatives.
HUMAN VISUAL SYSTEM–BASED COMPRESSION
A crucial element in the decision to use lossy compression is that there areno perceptible changes in the image, or that the changes are so small thatthey are of no diagnostic significance. Several studies have been done usingthe latter criteria, but they are somewhat less satisfying because there isalways the nagging doubt of whether a particularly challenging case justmight be compromised by compression. So-called visually lossless compres-sion is more appealing—if the radiologist cannot see the difference, it is hardto imagine that a difference in diagnostic performance could exist. Operat-ing on that assumption, there are some efforts under way to use models ofthe human visual system (HVS) to determine the threshold at which com-pression-related image alterations become perceptible. This means that eachimage is examined and its optimal compression ratio is computed andapplied. This is probably more valid than general modality rules for accept-able compression ratios. Anyone who has applied lossy compression knowsthat there are always exceptional images that are very incompressible, forwhich general rules do not apply. These exceptional images would not beovercompressed with an HVS-based compression system. While an HVSsystem would be more expensive because of the need to compute the optimalratio for each image, it might also save money by allowing a higher averagecompression ratio. Today, conservative ratios are applied to make sure mostimages are good enough. With HVS, every image would be good enough,
PACS: A Guide to the Digi tal Revolut ion244
DRE12 11/16/2005 9:44 AM Page 244

and those that are very compressible would not be undercompressed. Workon HVS-based compression is still preliminary, but such a system is a rea-sonable possibility and might address concerns that exist within the imagingcommunity.
This chapter introduced compression by pointing out that it was con-troversial. But once computer algorithms are used to interpret images, therewill be a quantitative measure of required image characteristics that willpermit precise optimization of compression. This is directly analogous tomodeling the HVS to determine acceptable compression. The difference isthat HVS models are based on estimates of humans and specific viewing con-ditions—these may not match actual viewers and viewing conditions. WithCAD, such variability is not present, enabling more confident statementsthat compression is not affecting image interpretation. Some may still arguethat at some point, computers and networks will be inexpensive enough torender compression needless. The fact that this argument has been made fordecades, and since Moore’s law specifies an 18-month doubling time, I doubtthis will be true in the foreseeable future. Indeed, the forces driving com-puter technology also drive medical imaging devices. Compression is a tech-nology that we will have to grapple with for the foreseeable future. Muchlike x-rays themselves, compression can be applied to advantage as long asthose employing it understand its strengths and weaknesses.
◗ REFERENCES
Bae KT, Whiting BR. CT data storage reduction by means of compressing pro-jection data instead of images: feasibility study. Radiology. 2001;219(3):850–855.
Brennecke R, et al. American College of Cardiology/European Society of Cardiol-ogy international study of angiographic data compression phase III. Measure-ment of image quality differences at varying levels of data compression. EurHeart J. 2000;21(8):687–696.
Chan H, et al. Image compression in digital mammography: effects on computer-ized detection of subtle microcalcifications. Med Phys. 1996;23(8):1325–1336.
Good W, Maitz G, Gur D. Joint photographic experts group (JPEG) compatibledata compression of mammograms. J Digit Imaging. 1994;7(3):123–132.
Erickson BJ, et al. Requirements for an enterprise digital image archive. J DigitImaging. 2001;14(2):72–82.
Hangiandreou NJ, et al. The effects of irreversible JPEG compression on an auto-mated algorithm for measuring carotid artery intima-media thickness fromultrasound images. J Digit Imaging. 2002;15(suppl 1):258–260.
IMAGE COMPRESSION 245
DRE12 11/16/2005 9:44 AM Page 245
Huang H. Progress in image processing technology related to radiological sciences:a five-year review. Comput Methods Programs Biomed. 1987;25(2):143–156.
Kerensky RA, et al. American College of Cardiology/European Society of Cardiol-ogy international study of angiographic data compression phase I. The effectsof lossy data compression on recognition of diagnostic features in digital coro-nary angiography. Eur Heart J. 2000;21(8):668–678.
Ko JP, et al. Wavelet compression of low-dose chest CT data: effect on lung noduledetection. Radiology. 2003;228(1):70–75.
Kotter E, et al. Evaluation of lossy data compression of chest X-rays: a receiver oper-ating characteristic study. Invest Radiol. 2003;38(5):243–249.
Li F, et al. Effects of JPEG and wavelet compression of spiral low-dose CT imageson detection of small lung cancers. Acta Radiol. 2001;42(2):156–160.
Manduca A, et al. Histogram transformation for improved compression of CTimages. In Medical Imaging 1997. Newport Beach, CA: SPIE; 1997.
Manduca A, et al. 3-D compression of medical images with Set Partitioning in Hier-archical Trees. In RSNA. Chicago: RSNA; 1997.
Megibow AJ, et al. Computed tomography diagnosis utilizing compressed imagedata: an ROC analysis using acute appendicitis as a model. J Digit Imaging.2002;15(2):84–90.
Ohgiya Y, et al. Acute cerebral infarction: effect of JPEG compression on detectionat CT. Radiology. 2003;227(1):124–127.
Persons KR, et al. Evaluation of irreversible JPEG compression for a clinical ultra-sound practice. J Digit Imaging. 2002;15(1):15–21.
Ritenour ER. Lossy compression should not be used in certain imaging applicationssuch as chest radiography. For the proposition. Med Phys. 1999;26(9):1773–1774.
Said A, Pearlman W. A new fast and efficient codec based on set partitioning in hier-archical trees. IEEE Trans Trans Circuits and Systems for Video Technology. 1996;6:243–250.
Savcenko V, et al. Detection of subtle abnormalities on chest radiographs after irreversible compression. Radiology. 1998;206(3):609–616.
Siddiqui K, et al. Improved image compression at various slice thicknesses for multi-slice CT using 3-D JPEG2000 (part 2) in comparison with conventional 2-D com-pression. In Soc Computer Applications in Radiology. Vancouver, BC: SCAR; 2004.
Slone RM, Muka E, Pilgram TK. Irreversible JPEG compression of digital chestradiographs for primary interpretation: assessment of visually lossless threshold.Radiology. 2003;228(2):425–429.
Sung MM, et al. Clinical evaluation of compression ratios using JPEG2000 on com-puted radiography chest images. J Digit Imaging. 2002;15(2):78–83.
Suryanarayanan S, et al. A perceptual evaluation of JPEG 2000 image compressionfor digital mammography: contrast-detail characteristics. J Digit Imaging. 2004;17(1):64–70.
PACS: A Guide to the Digi tal Revolut ion246
DRE12 11/16/2005 9:44 AM Page 246

Tuinenburg JC, et al. American College of Cardiology/European Society of Cardi-ology international study of angiographic data compression phase II. The effectsof varying JPEG data compression levels on the quantitative assessment of thedegree of stenosis in digital coronary angiography. Eur Heart J. 2000;21(8):679–686.
Yamamoto S, et al. Evaluation of compressed lung CT image quality using quanti-tative analysis. Radiat Med. 2001;19(6):321–329.
Zhang Y, Pham B, Eckstein M. Automated optimization of JPEG 2000 encoderoptions based on model observer performance for detecting variable signals inX-ray coronary angiograms. IEEE Trans Med Imaging. 2004;23(4):459–474.
Zheng B, et al. Applying computer-assisted detection schemes to digitized mammo-grams after JPEG data compression: an assessment. Acad Radiol. 2000;7(8):595–602.
IMAGE COMPRESSION 247
DRE12 11/16/2005 9:44 AM Page 247
PACSARCHITECTURE
KENNETH HECKMAN • THOMAS J. SCHULTZ
Over the past several years, picture archiving and communication system(PACS) architecture has evolved to incorporate the advances that have
occurred in computer, imaging, and networking technologies. These tech-nological advances have resulted in increased server processing speeds, fasternetworks, decreased costs of storage and hardware, increased reliability ofhardware, and an increase in image size as well as in the number of imagesin a study. Because of all these factors, it is increasingly important for PACSprofessionals to have an understanding of the evolving technologies and theimpact they have on the PACS environment.
In this chapter we will discuss PACS architecture, storage models, historic and current trends, disaster recovery, and medical-legal archiving.The medical-legal archive topic alone could consume an entire book. Legal issues surrounding the archive will not be addressed; instead thissection will discuss some of the most frequently employed technologies andstrategies.
13CHAPTER
DRE13 11/16/2005 9:45 AM Page 249
WHAT IS PACS ARCHITECTURE?
Architecture is a general term that can be applied to a wide variety of situ-ations. In general, it is used to define the construction of an entity. In com-puter systems it is a logical and functional description of the hardwareconfiguration of the system. It is very important to carefully plan the PACScore architecture; both the current and foreseeable future goals of the intu-ition must be accounted for. This is often difficult because both the organ-ization and the technology are never in a static state.
KEY TERM DEFINITIONS
To discuss the architecture, it is crucial to use common definitions of thePACS components. The following section describes and defines the mostrelevant PACS components (Figure 13.1).
CORE SERVERS
Core servers (A through G in Figure 13.1 plus the database) are the com-puters that are integral to the functioning of the PACS. Depending on thearchitecture and software, the core could consist of one or more servers. Theserver’s roles include, but are not limited to, database, Digital Imaging andCommunications in Medicine (DICOM; gateway) exam import/export, radi-ology information system (RIS) interfacing, storage systems, Web servers,and other interface/image distribution servers.
DATABASE
The database is the component of the PACS system that is used to store allthe information required for the PACS to operate. It contains all the spe-cific study information, that is, patient demographics, prior reports, annota-tions and notes, archive (exam storage) locations, exam routing rules, andsimilar types of information.
HEALTH LEVEL SEVEN SERVER
The Health Level Seven (HL7) server (A in Figure 13.1) is responsible forreceiving the data from the (RIS) and populating this data into the PACS
PACS: A Guide to the Digi tal Revolut ion250
DRE13 11/16/2005 9:45 AM Page 250

database. HL7 is the interface standard for data transfer between hospitalinformation systems.
MODALITY WORKLIST
The modality worklist (MWL) function (shown as A and B in Figure 13.1and defined in the DICOM standard) allows the technologist at modalitiesto query the PACS or workflow server. The returned data automatically pop-ulates the appropriate fields at the modality. Because the data is electroni-
PACS ARCHITECTURE 251
HL7 Feed from RIS
Modality
HL7 Server(Validate Exams
Modality Worldist)
DICOM Server(Exam Entry Point)
See Chapter 11,“Image Acquisition”
BA
D
E
F
G
H I
C
Database
PACS Archive
Clinical(Lossy Compressed)
Full Fidelity(Lossless Compressed)
Legal/Disaster Recovery(Lossless Compressed)
See Chapter 16,“Storage and Enterprise
Archiving”
See Chapter 12,“Image Compression”
See Chapter 19,“Web Distribution”
Image Distribution(Workstation Access Point)
Note:
All textual data is stored inthe databse. This includes RIS information (examplesinclude patient. demographics and order data), exam storage location, and exam status.
See Chapter 20,“PACS Workstation
Software”
See Chapter 17,“Image Displays”
Radiologyworkstations
ClinicalWorkstations
Electronic MedicalRecord and
Other Internal System Integrations
FIGURE 13.1
Basic PACS components.
DRE13 11/16/2005 9:45 AM Page 251

cally entered, the integrity of the demographic data transferred with theimages is significantly higher than that of data entered manually.
DIGITAL IMAGING AND COMMUNICATIONS IN MEDICINE SERVER
The role of the DICOM server (C in Figure 13.1) is to accept DICOM-compliant images sent from the modalities. The process usually begins byvalidating site-specific key demographics contained in the DICOM headerwith the HL7 populated data in the PACS database (recall that the RIS iscontinually transmitting information to PACS via HL7). Once the study hasbeen validated (demographic data contained in the image data match thoseof the RIS), the textual data (modality-specific data) are imported into thedatabase and the images are compressed (in lossy and/or lossless fashion,depending on policies) and stored in the archive(s). If routing (automatic for-warding to another DICOM system) is implemented, the exam is then for-warded to the foreign host.
PACS ARCHIVE
Archiving is discussed in depth in Chapter 16, but a general understandingof the terminology is essential for a thorough discussion of PACS architec-ture. The archive (D through F in Figure 13.1) is defined as the long-termstorage system for PACS. The archive is generally split into “full fidelity”and “clinical” or “lossy compressed,” also known as the clinical and disasterrecovery (DR) archives. The DR archive usually employs lossless compres-sion, which has very low compression ratios (typically 2 :1), but preserves allthe image quality (no image quality lost due to compression). The clinicalarchive usually offers significantly higher compression ratios (10 :1 or more)and is generally used for clinical review. Lossy compression is typicallyachieved by processing the images through a spatial to frequency domainconversion (JPG2000). During the conversion process, an algorithm deter-mines which data are most insignificant and throws those data away—thehigher the compression ratio, the greater the loss of image quality. A highlycompressed clinical archive allows fast retrieval of prior exams (smaller fileslessen the bandwidth demands on the network). Even more beneficial, theamount of storage (redundant array of inexpensive disks [RAID]) requiredto keep all priors online is magnitudes less than the amount that would
PACS: A Guide to the Digi tal Revolut ion252
DRE13 11/16/2005 9:45 AM Page 252

otherwise be required. It is also important to note that there are importantlegal implications for storing medical exams that vary from state to state.
IMAGE DISTRIBUTION SERVERS
The image distribution servers (G in Figure 13.1) are the servers that inter-face the workstations and other display devices with the PACS. This isaccomplished either by routing (automatically pushing exams to the work-stations via polices) or by the workstation pulling the images on demand.The on-demand method is usually implemented via Web servers and is thepreferred option for most new PACS offerings.
WORKSTATIONS
Workstations (H and I in Figure 13.1) are the computers with which endusers (radiologists, technologists, and referring providers) view and interpretradiographic images. These workstations generally provide different func-tionality depending on the need of the user.
In general, workstation software falls into two categories: thin clientand thick client. The thin client is usually a Web (standards-based) applica-tion that has minimal hardware and software requirements and offers cen-tralized display station installation/upgrade management. The result isworkstation software that any user can install without the assistance of thePACS vendor or the institution’s PACS team. The thick client generallyrequires a larger amount of workstation power, storage, and configurationmanagement. The thick client display station software is usually built on pro-prietary software, and industry standards are not leveraged. This results incomplex installation/maintenance procedures often requiring that the PACSvendor install and maintain every workstation. (In some instances the insti-tution’s PACS team can be trained by the PACS vendor to install/maintainthe workstations, but this is usually not the case.)
STORAGE
Three models are generally used for online spinning storage (RAID) (D through F in Figure 13.1). They are direct attached storage (DAS),storage area network (SAN), and network attached storage (NAS). The details of the storage types are thoroughly discussed in Chapter 16.
PACS ARCHITECTURE 253
DRE13 11/16/2005 9:45 AM Page 253

The intention of the following is to give a basic understanding of the 3storage strategies and how they relate to PACS architecture.
DIRECT ATTACHED STORAGE Direct attached storage is a storagedevice that is directly attached to a server. The server that is attached to thestorage device is the only server that can directly utilize that storage.
STORAGE AREA NETWORK Storage area network is a high-speed, ded-icated (usually fiber-optic) network of shared storage devices. The SANarchitecture works in a way that makes all storage available to all servers viaa dedicated network—not the same network used for e-mail and Web brows-ing. Scaling storage in a SAN is accomplished by simply adding more storagedevices to the storage network. Standards are emerging, but most solutionsare usually proprietary.
NETWORK ATTACHED STORAGE Network attached storage is a dedi-cated computer that provides file (disk) sharing and is often referred to as aNAS head. A key differentiator between NAS and SAN is that the NAS headis shared and accessed across the same network as the institution’s e-mail andbusiness applications; a dedicated storage network is usually not required.The underlying storage infrastructure behind the NAS head (computer con-nected to the storage offering file sharing) may be DAS or SAN (the NASheads may participate in a storage network). Scalability is achieved either byadding more NAS heads or by connecting more storage to existing NASheads. In this environment, commodity and proprietary solutions cancoexist.
HIERARCHICAL STORAGE MANAGEMENT OR LIFE CYCLE MANAGEMENT
Hierarchical storage management (HSM), also referred to as life cycle man-agement, is an application that automatically moves data among differentstorage systems (E and F in Figure 13.3). The concept is to move infrequently used data to slower (cheaper) tiers of storage. Some examplesinclude undictated exams on fast disk (RAID), relevant prior exams on slower disk (RAID), and exams not reviewed in 18 months on tape(CD/DVD). Some solutions move data among geographical locations butkeep all data on spinning disk (life cycle strategies are discussed later in thischapter under “Medical-Legal Archive”). There are only two practical tiersof storage specific to PACS: disk (RAID) and removable media. Contrary to
PACS: A Guide to the Digi tal Revolut ion254
DRE13 11/16/2005 9:45 AM Page 254

traditional belief that storage tiers should also exist for disk (fast, expensivedisk for unread studies and slow, inexpensive disk for prior exams), our expe-rience has shown that having tiers of RAID (fast and slow) yields immeas-urable performance differences. Regardless of the selected approach, the roleof the HSM is to prevent catastrophic data loss due to hardware, software,or human error.
CLUSTERING
Clustering is the binding of two or more computers together in such a waythat the application behaves as if it were installed on a single computer. Theprimary reasons for clustering are load balancing and fault tolerance. Loadbalancing spreads the requests for application services across all participat-ing servers. For example, if a researcher submits a request for 1000 exams,1 server could satisfy the request while another server is refreshing a work-flow screen for a radiologist. Fault tolerance refers to the ability of a systemto handle hardware or software failure while continuing to behave as if therehas been no failure from the perspective of the end user. There are multi-ple degrees of fault tolerance, which can be as simple as planning for powerinterruptions or as involved as being able to sustain a multiserver failure. Acommon fault-tolerant implementation of clustering is referred to as fail-over. A fail-over cluster refers to the practice of mirroring a system so thatevery function that a server performs can be performed on a duplicate(backup) system. Therefore, when the primary system fails, the backupsystem automatically takes control and satisfies all incoming requests.
ELEMENTS OF THE ARCHITECTURE
Several key topics need to be evaluated to determine an appropriate archi-tecture for an institution. It is important that a multidisciplinary team beinvolved in designing the technical and operational components of thePACS. Depending on the organizational structure, the team should includethe following: general information system (IS)/information technology (IT)staff, networking specialists, radiologists, and radiology clinical operationsstaff. Once the team is assembled, at least the following should be consid-ered: operational fit (workflow), versatility, scalability, robustness, and faulttolerance.
PACS ARCHITECTURE 255
DRE13 11/16/2005 9:45 AM Page 255
OPERATIONAL FIT
Operational fit refers to how the workflow that is built into the PACSproduct will work with the current workflow requirements of the institution.A PACS implementation will, by its very nature, require many workflowchanges by the radiology department. However, each vendor has a differentway to deal with these changes, and the impact on radiologist, technologists,and administrative/support staff needs to be very carefully evaluated. Anexcellent PACS product may be worthless if implemented in an institutionwhose workflow cannot not be modified to fit how the selected PACSproduct operates.
VERSATILITY
Versatility, in this context, defines a system’s ability to incorporate new tech-nologies and adapt to internal institutional changes. Technology changescould be anything from the addition of a new storage medium to the imple-mentation of (perhaps fewer) more powerful servers. Operationally, changescould range from new modalities or new modality imaging protocols to arollout of clinical review stations to referring physicians.
SCALABILITY
Scalability, in the PACS world, refers to the ability of the PACS software togrow with the institution’s goals. This statement refers to software, not hard-ware. The limitation of a system’s ability to grow in terms of volume, depthof storage, or number of supported users and modalities is completelydependent on the PACS provider’s design/implementation. Hardware is sub-servient to the software. For example, if a PACS provider’s platform supports1 server (all PACS operations operate on 1 computer), then the system canonly scale by purchasing a faster, more powerful server. If the PACS providersupports the spreading of the PACS processes over multiple servers, then thesystem can be scaled by adding more servers.
ROBUSTNESS/FAULT TOLERANCE
Robustness applies to several important elements in the system that allowadministrators to provide high-quality services (acceptable uptime from theend user’s perspective). This includes items such as self-monitoring capabil-
PACS: A Guide to the Digi tal Revolut ion256
DRE13 11/16/2005 9:45 AM Page 256
ities (to e-mailing or paging the PACS administrator when a monitored eventoccurs), ability to interact with third-party software (antivirus and systembackup applications), and resilience to hardware failure (clustering) and virusattacks. A robust system will also allow users to be able to work with thesystem without understanding the architecture or even knowing when asystem fault has occurred.
COMPARISON OF PACS ARCHITECTURES
PACS architectures typically fall into 2 major categories: distributed and cen-tralized. Older PACS are usually implemented on the distributed model, andnewer PACS usually on the centralized model. Each approach has specificstrengths and weaknesses, depending on how the PACS vendor implementsa design. It is critical that the design philosophy of a selected PACS vendoris fully understood and accepted. Once a PACS is installed and it is discov-ered that the PACS vendor’s and the institution’s visions are not aligned, itis usually too late to make a change. Below is a discussion of the earlier designphilosophies and how the architecture has evolved.
HISTORIC DISTRIBUTED MODEL
One of the first successful designs utilized in PACS was the distributed model(Figure 13.2). This model was based on the client-server computing approachin the late 1980s. There were several other factors that influenced this model.At the time network speeds were about 1/100 of what the standard networkspeed is today, and disk storage was slower and far more expensive. The highestdensity of an individual disk was about 36 gigabytes (GB); today it is 400 GBand climbing. It is also worth noting that lossy compression was generally notaccepted for any purpose. The lack of compression exacerbated the cost ofstorage and stressed the network. These and other issues resulted in a PACSdesign that utilized transient storage at the workstations to avoid network bot-tlenecks and relied excessively on the medical-legal archive because of insuf-ficient disk space within the PACS core. Exams were only temporally cachedon disk, resulting in constant retrieves from near-line storage (usually mag-netic optical disk [MOD] or digital linear tape [DLT], tape technology).
Generally, the PACS data flow was as follows: the RIS interfaced withthe PACS via HL7. The process that arbitrated the communications wasoften called a broker (A in Figure 13.2). Modalities would interact with thebroker system to facilitate modality worklists. Upon receiving images fromthe modality, the DICOM server would interact with the broker to validate
PACS ARCHITECTURE 257
DRE13 11/16/2005 9:45 AM Page 257
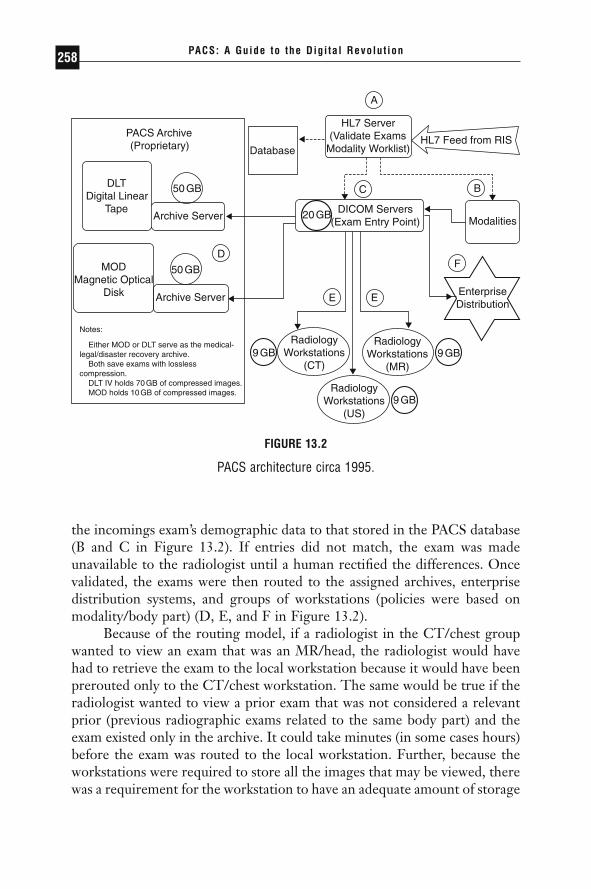
the incomings exam’s demographic data to that stored in the PACS database(B and C in Figure 13.2). If entries did not match, the exam was madeunavailable to the radiologist until a human rectified the differences. Oncevalidated, the exams were then routed to the assigned archives, enterprisedistribution systems, and groups of workstations (policies were based onmodality/body part) (D, E, and F in Figure 13.2).
Because of the routing model, if a radiologist in the CT/chest groupwanted to view an exam that was an MR/head, the radiologist would havehad to retrieve the exam to the local workstation because it would have beenprerouted only to the CT/chest workstation. The same would be true if theradiologist wanted to view a prior exam that was not considered a relevantprior (previous radiographic exams related to the same body part) and theexam existed only in the archive. It could take minutes (in some cases hours)before the exam was routed to the local workstation. Further, because theworkstations were required to store all the images that may be viewed, therewas a requirement for the workstation to have an adequate amount of storage
PACS: A Guide to the Digi tal Revolut ion258
PACS Archive (Proprietary)
DLT Digital Linear
Tape
MODMagnetic Optical
Disk
50GB
Archive Server
50GB
20GB
9 GB9 GB
Archive Server
Database
HL7 Server (Validate Exams
Modality Worklist) HL7 Feed from RIS
ModalitiesDICOM Servers
(Exam Entry Point)
EnterpriseDistribution
RadiologyWorkstations
(MR)
9 GBRadiology
Workstations (US)
RadiologyWorkstations
(CT)
Notes:
Either MOD or DLT serve as the medical- legal/disaster recovery archive. Both save exams with losslesscompression. DLT IV holds 70GB of compressed images. MOD holds 10GB of compressed images.
A
C B
D
E E
F
FIGURE 13.2
PACS architecture circa 1995.
DRE13 11/16/2005 9:45 AM Page 258

(simple rules flushed exams when the disk began to fill). This often frustratedradiologists who would retrieve a study, view the exam, then, wanting torereview the exam, had to reretrieve the exam from the archive because theexam no longer resided on the local workstation’s disk.
Operationally, the workflow of a department needed to be designed insuch a way that organized the radiologist workload by subspecialty. There-fore, because of the requirement of the distributed model to route exams,routing/relevant prior policies were constantly being tweaked. Perfectpolices were rarely attained.
CURRENT CENTRALIZED MODEL
This section will show how the current trend of leveraging standards leadsto a simpler, more supportable PACS (Figure 13.3). Many of the constraints(routing, immediate access to all exams, client administration, proprietarystandards, and others) have been alleviated and in many cases completelyeliminated.
As PACS systems have matured, the goal has become to make all imagesreadily available to all users regardless of what workstation configuration is available (uncontrolled hardware). This has caused a shift in the industryto a more centralized architecture utilizing Internet standards–based technologies.
In a centralized system (Internet standards–based), there are two dis-tinct layers, the core and the workstation. Figure 13.3 shows a generic cen-tralized PACS. In this figure, A through F are all considered part of the core,while G and H are workstations. Usually, the client workstations are basedon thin clients leveraging standards and technology available through theoperating system (file sharing) and Web browsers (HTML). One of thecrucial elements for a centralized PACS is adequate network speed and band-width to accommodate the movement of images quickly from one location(archive) to another (workstations). Due to advancements in network tech-nologies during the past 10 years—there have been substantial performancegains and significant reductions in costs—it is very affordable to install 100megabyte (MB) or even 1000 MB switched network infrastructure (seeChapter 15 for more network information). The same can be said of storage,especially given the growing acceptance of lossy compressed priors. The costper terabyte (TB) of storage has fallen from as much as $100,000 per TB toas little as $4,000 per TB. Consider the actual cost when 10 :1 compressionis factored in. When RAID costs less and less RAID is required, the insti-tution can realize significant savings.
PACS ARCHITECTURE 259
DRE13 11/16/2005 9:45 AM Page 259

In this approach, the data flow is as follows: Demographic data is trans-ferred to the PACS from the RIS via HL7 (A in Figure 13.3). The HL7process (in most cases) is now considered an integral part of the PACS; it isnot referred to (conceptually or physically) as a separate “broker” process.
PACS: A Guide to the Digi tal Revolut ion260
HL7 Feed from RIS Database/HL7 ServerModality Worklist
Modalities
DICOM Servers(Exam Entry Point)
Disaster Recovery/Medical-Legal Archive(Lossless Compression ~2:1)
Clinical Archive(Lossy Compressed ~10:1)
A
B
C
D E
F
H
G
NAS SAN DAS
Disk(RAID)
Disk(RAID)
Disk(RAID)
ArchiveServer
ArchiveServer
DVD
DigitalVideo Disk
LTO x
LinearTape Open
CAS
ContentAddressable
Storage
WEB Servers(Exam Entry Point)
EnterpriseDistribution
(EMR)
ClinicalWorkstations
RadiologyWorkstations
FIGURE 13.3
PACS architecture circa 2005.
DRE13 11/16/2005 9:45 AM Page 260

The imported RIS data is then used for modality worklists and exam vali-dation. After the images are acquired at the modality, the images are trans-ferred via DICOM to the PACS DICOM/image server (C in Figure 13.3).Once the data are received and validated by the DICOM/image server, theimages are sent to the archive, where multiple copies, both lossless and lossy,are stored (D and E in Figure 13.3). At that point the images are availablevia the image distribution servers (F in Figure 13.3) to the various types ofPACS workstations and enterprise distribution systems (G and H in Figure13.3).
Integration of PACS into other hospital applications becomes muchsimpler when a standards-based PACS is installed. It can be as simple asembedding a Web link in the hospital’s electronic medical records system(EMR). The link could work in a process like the following: The user nav-igates the hospital medical record system to the radiology section and selectsan exam to review. Within the report text, the familiar underlined blue textrepresenting a Web link appears. When a user clicks on the link, a browserwindow opens up, launches the PACS client, and displays the images of theexam being reviewed in the hospital’s EMR application.
In this model, no autorouting or pre-fetching of images is required.This completely eliminates the administrative time required to build andmaintain routing rules, and the frustration felt by radiologists unable toaccess any exam at any workstation at any time is also eliminated. Anothersignificant benefit is that the scalability of the system is such that growth (inexam volume and new modalities) can be attained and new technologiesadded (see Chapters 15 and 16 on storage and server technologies) with noor little impact to the radiologist or clinician. This truly opens the possibil-ity of viewing the PACS provider as a software company sticking with itscore competency and staying out of the hardware and storage business.
Still at the center of newer PACS designs is the database. The role ofthe database has not substantially changed. It is still responsible for storinga wide variety of information about the exams and exam locations.
COMBINED DISTRIBUTED AND CENTRALIZEDMODEL: TRANSITIONAL TECHNOLOGY
Currently several PACS products in the market incorporate elements of bothmodels into their architecture. These products will typically allow for pre-fetching and routing, as well as fast retrieval of images from any location.They also tend to have multiple versions of the workstation that range froma thin client version for use by clinicians outside of radiology and a thick
PACS ARCHITECTURE 261
DRE13 11/16/2005 9:45 AM Page 261

client version for primary interpretation. While these products address theissues of both distributed and centralized models, they also require thesupport that is required by both models. They tend to utilize newer tech-nologies that are available and may have a more complex architecture thana pure centralized or decentralized model. These complexities may or maynot be more difficult to support and need to be closely evaluated.
MEDICAL-LEGAL ARCHIVE
The discussions in this chapter, to this point, have focused on the PACSarchitecture design considerations and definitions and explanations of PACScore components. It is also important for institutions to understand that theinstallation of PACS is no guarantee that images cannot be lost. In fact,digital archiving solutions are burdened with far greater expectations for dataretention and retrieval compared to the film analog world. This section willcompare and contrast the operational and technical options available forlegal archiving of medical images.
DISASTER RECOVERY
PACS disasters can and do appear in a variety of forms. To a system admin-istrator, PACS disasters may be thought of as a result of technical failuresthat impact overall performance. To the radiologist or clinician, a disastermay be perceived as a single exam that cannot be immediately viewed, thetechnical reasons being irrelevant; in fact, it may simply be due to a poorPACS architecture or implementation strategy. The PACS could merely befraught with insufficient clinical storage, poor archival policies, or limitedRIS integration. The focus of this section will be the prevention of PACSdisasters caused by the actual loss of data.
There are two basic strategies for storing exams in “safe” locations:disk-to-disk and removable media. The term “safe” refers to a remote/second location that is unlikely to be affected by the same event(s) that ledto the data loss at the primary site.
DISK TO DISK
“Disk-to-disk” simply refers to the replication of exam data to other diskstorage devices ideally located at remote location. Because of the significant
PACS: A Guide to the Digi tal Revolut ion262
DRE13 11/16/2005 9:45 AM Page 262

price decreases in disk-based storage devices over the past few years, manydisk-only disaster recovery solutions have been penetrating the PACSmarket. Currently there are 3 general approaches to applying disk-to-diskdisaster recovery (Figure 13.4).
STORAGE AREA NETWORK In the storage area network (SAN)approach, a storage device is installed at all remote sites where copies of theexams are desired. This also necessitates reliable (usually dedicated) networkfiber connectivity between the storage sites (not the same network as theintuition would use for Web/e-mail and other day-to-day business activities).Iron Mountain and other physical document storage vendors are now pro-viding SAN storage devices as part of their offerings. The replication/storagemanagement is provided by the storage devices; external computers are notrequired to manage the data replication process. Some storage companiesoffering this type of solution include EMC, IBM, Winchester Systems, andHP. See Chapter 16 for more information on SAN.
NETWORK ATTACHED STORAGE The network attached storage (NAS)approach is similar to the SAN approach. The primary difference is that the
PACS ARCHITECTURE 263
Clinical Archive(Lossless Compressed ~2:1)
Primary PACS
Primary PACS
NAS/SAN/CAS
NAS/SAN/CAS
NAS/SAN/CAS
Remote Site Iron Mountain
Disk (RAID) Disk (RAID) Disk (RAID)
HSM
MODDVDTape
Copy 1
Copy 2 Copy 3
Automatic Electronic Delivery
Courier Delivery of Media
A
B
FIGURE 13.4
PACS medical-legal archive examples.
DRE13 11/16/2005 9:45 AM Page 263

replication process is managed by software running on computers connectedto the storage, and the network connecting the devices is not required to be dedicated. The one layer of abstraction of replicating the data at the operating-system level makes a multivendor solution more attainable. Forexample, if the primary PACS utilizes Windows 2003 on a Dell server con-nected to 2 TB of disk storage and the remote location has an IBM serverrunning Linux connected to 2 TB of storage, the exam data could be repli-cated between the two locations via standard file-sharing protocols availableto both operating systems. The replication software will leverage these stan-dard protocols to synchronize the two locations. Nearly all storage compa-nies provide NAS solutions. Two companies that specialize in NAS areNetwork Appliance and Quantum’s Snappy Appliances. See Chapter 16 formore information on NAS.
CONTENT ADDRESSABLE STORAGE Content addressable storage(CAS) is a scalable storage/computing grid. The idea is to provide scalabil-ity and performance by adding self-contained units that act together as ahive. The units can be defined as a small server containing at least 4 disks(~1 TB raw). All the units run the same software, which allows them to actas one. The aggregate storage is the sum of all the units. Some manufactur-ers use elaborate algorithms to provide a unique key that allows the verifi-cation of file integrity and retrieval. This key is often called a token, and thekey/integrity generation algorithm commonly employed is message digest 5(MD5). Some manufacturers hide the token complexities behind a filesystem, effectively making the grid device look like a NAS. Companies offer-ing grid storage include EMC (Centera) (Hopkinton, MA) and ExaGrid(Westborough, MA). See Chapter 16 for more information on CAS.
REMOVABLE MEDIA
In this approach, the primary PACS site hosts a computer running softwarethat manages the process of moving exams from disk to removable mediaand removable media back to disk. The solution usually contains a roboticlibrary that allows for near-line access to large numbers of media. The genreof software that provides this service is called HSM (see “HierarchicalStorage Management or Life Cycle Management” earlier in this chapter).The term is being replaced with “life cycle management”. The storagepolices available allow for the creation of two or more copies of the media.One copy can stay local to the intuition, another could be sent to a remotesite, and a third copy could be sent to a document storage company such as
PACS: A Guide to the Digi tal Revolut ion264
DRE13 11/16/2005 9:45 AM Page 264

Iron Mountain. Removable media solutions are the least expensive andeasiest to implement. Companies providing this type of solution includeStorageTek (ASM) (Louisville, CO), EMC (Legatto), and IBM (Tivoli)(Armonk, NY). See Chapter 16 for more information on removable media.
Table 13.1 is a quick summary of key considerations and how they relateto common archival strategies.
TECHNIQUE CONSIDERATIONS
We have defined and described basic strategies for archiving, but how doesone select the best approach? This is a difficult question to answer. Institu-tional experience, IT resources, politics, and vendor relationships all play afactor in selecting an archival solution. Below are some general guidelinesto consider that are independent of the internal considerations.
PACS ARCHITECTURE 265
TABLE 13.1Comparison of Approaches for Medical-Legal Archiving
Storage Network ContentArea Attached Addressable
Category Network Storage Storage Removable
Suitable for PACS ***** ***** ***** *****Resistant to virus attack *** ** *** *Resistant to human activity *** *** **** *****Proprietary ***** ** ***** ***Scalability ***** ***** ***** *****Fast to recover exams ***** **** *** *Requires human intervention ** *** ** *****Multivendor friendly * ***** * *****Technically simple ** **** **** *****Reasonable initial cost *** **** **** *****Reasonable maintenance costs *** *** **** *****
Number of asterisks indicates degree to which solution agrees with categoryattribute.
DRE13 11/16/2005 9:45 AM Page 265

SOLUTION REQUIREMENTS
◗ Technically simple◗ Provide copies of exams in multiple locations◗ Low cost◗ Accept some manual processes◗ Accept slow retrieval from off-site locations (physical transportation
of media)◗ Provide enough storage on the clinical RAID; if insufficient storage
exists on the clinical archive, significant/continuous retrieves of priorexams from the DR archive can cause media failures and affect theradiologist workflow
In this scenario, a removable media solution would probably be the leadingcandidate. Once the equipment is installed and configured, a human wouldneed only to insert media as required and export filled media for transportto one (or more) safe locations. The cost for multisite storage is only theprice of media and transport.
SOLUTION REQUIREMENTS
◗ No manual interaction—complete automation◗ Large budget needed◗ Provide copies of exams in multiple locations◗ Allow fast retrieval from any location (electronic transportation)
This strategy requires deploying a RAID in each location where it is desiredto store a copy of each exam. All copies occur automatically with no humaninvolvement once the solution is configured. To sustain this approach, each year disk storage will need to be purchased in equal increments at alllocations. Any budget cuts could seriously jeopardize the integrity of thearchive; there may be enough funds to store exams at only 1 site instead ofthe planned 2 or 3. There is also an increased risk that an engineer per-forming maintenance on a storage device could cause accidental data lossthat could be replicated to all other sites. Even worse, it may be possible fora virus attack to affect all copies of the exams because all copies are alwaysonline.
PACS: A Guide to the Digi tal Revolut ion266
DRE13 11/16/2005 9:45 AM Page 266
USING DISASTER RECOVERY TO SWITCH VENDORS?
Although the current relationship with the PACS provider may be satisfac-tory, what would happen if that were to change? What if a new PACS wasreleased to the market that had desired capabilities that the current vendorwould not be able to match for years? This topic could consume an entirearticle—perhaps even an entire book. What is important to consider duringthe development of an archive strategy is how to prepare for the possibleswitch to another PACS provider. The answer may be to store all exam datain a nonproprietary format (DICOM standard part 10) on open standardstorage systems. Many PACS storage products store data in a format thatonly their software can retrieve; consider products that are open. This willensure that your new PACS vendor can read the stored exams.
RECOVERY AND EXAM PRIORITY
In the end, whatever strategy is selected must provide a means to quicklyrecover (business continuance) from a local disaster. For DR it is importantto consider the pattern of usage in radiology; data (exams) that are stored inPACS are less likely to be retrieved (reviewed) once dictated. This is animportant consideration when a disaster hits. For example, assume a waterpipe broke near the computer room and RAID devices were lost that con-tained 4 years’ worth of exams. Conventional approaches would be to re-populate the RAID devices from the archive file by file, usually in reversechronological order. The problem with this approach is that the usage of theexam data is random, not sequential. Therefore, if a radiologist is waiting todisplay an exam that is 2 years old, the wait could be days or longer. A betterapproach is to employ a system that can automatically repopulate the PACSby demand. In this system a request to display a missing exam would resultin triggering automatic processes that would reload the exam back intoPACS. This method would import the most relevant (requested) exams as apriority and populate the unrequested exams as resources permit.
PACS ARCHITECTURE 267
DRE13 11/16/2005 9:45 AM Page 267
NETWORKINGFUNDAMENTALS
SCOTT M. ROGALA
The world of networking and the world of picture archiving and commu-nications systems (PACS) are two different environments that converge
in such a way as to require a very special skill set. This chapter gives you thebasics of computer networking and shows you how they apply to a PACSenvironment.
It is important to appreciate the role the network plays in a PACSimplementation. Our goal is not to make you an expert network engineer,but rather to give you enough information so you can navigate the often con-fusing, cluttered world of computer networking. With the right kind ofinformation you will feel comfortable enough with the terminology tounderstand what your vendor(s) are providing, on both the PACS andnetwork sides. We also want to impress on you the importance of goodnetwork design and implementation; these are integral parts of the PACSsystem. Failure to create a strong, robust network infrastructure will resultin unhappy users, finger-pointing, and loss of confidence in PACS. If thenetwork is designed and implemented correctly, it can contribute immenselyto a successful PACS implementation.
14CHAPTER
DRE14 11/16/2005 9:47 AM Page 269
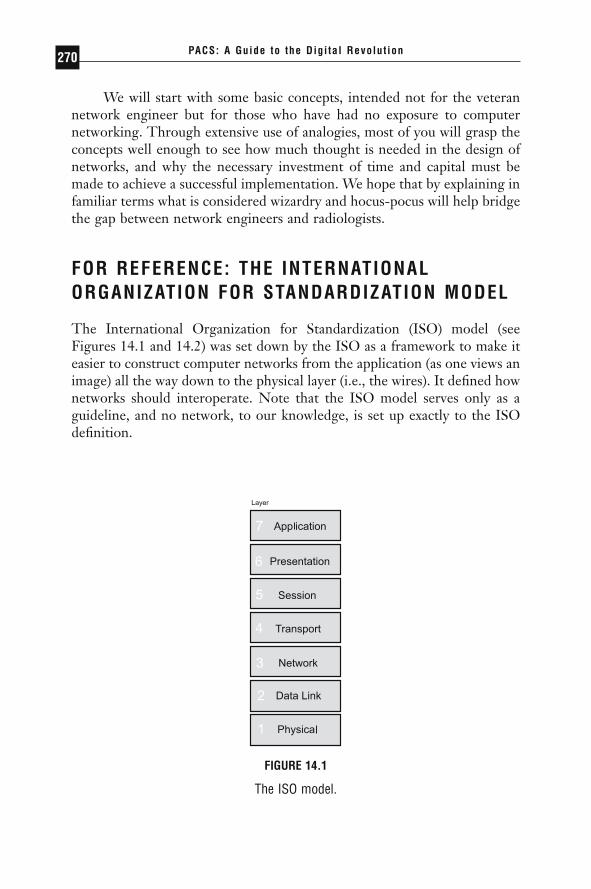
We will start with some basic concepts, intended not for the veterannetwork engineer but for those who have had no exposure to computer networking. Through extensive use of analogies, most of you will grasp theconcepts well enough to see how much thought is needed in the design ofnetworks, and why the necessary investment of time and capital must bemade to achieve a successful implementation. We hope that by explaining infamiliar terms what is considered wizardry and hocus-pocus will help bridgethe gap between network engineers and radiologists.
FOR REFERENCE: THE INTERNATIONALORGANIZATION FOR STANDARDIZATION MODEL
The International Organization for Standardization (ISO) model (seeFigures 14.1 and 14.2) was set down by the ISO as a framework to make iteasier to construct computer networks from the application (as one views animage) all the way down to the physical layer (i.e., the wires). It defined hownetworks should interoperate. Note that the ISO model serves only as aguideline, and no network, to our knowledge, is set up exactly to the ISOdefinition.
PACS: A Guide to the Digi tal Revolut ion270
FIGURE 14.1
The ISO model.
DRE14 11/16/2005 9:47 AM Page 270
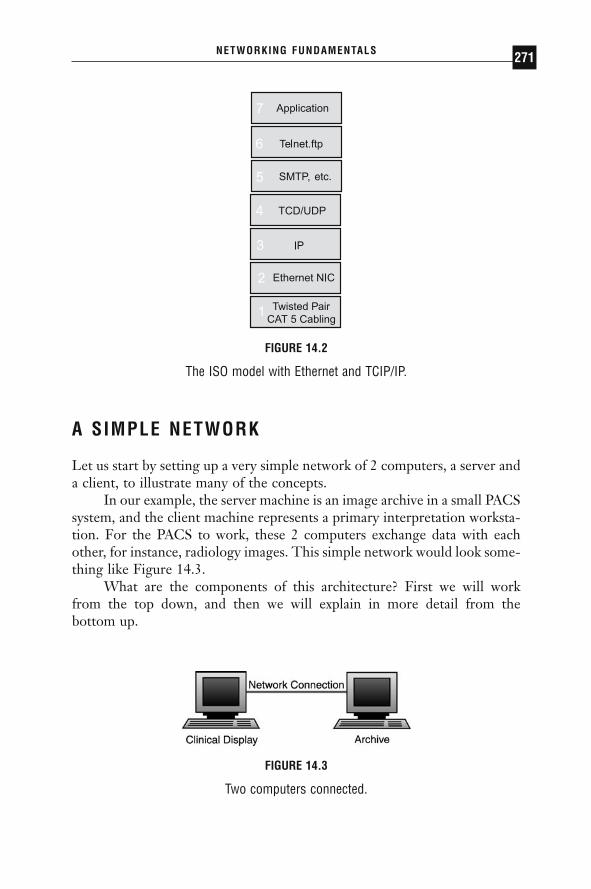
A SIMPLE NETWORK
Let us start by setting up a very simple network of 2 computers, a server anda client, to illustrate many of the concepts.
In our example, the server machine is an image archive in a small PACSsystem, and the client machine represents a primary interpretation worksta-tion. For the PACS to work, these 2 computers exchange data with eachother, for instance, radiology images. This simple network would look some-thing like Figure 14.3.
What are the components of this architecture? First we will work from the top down, and then we will explain in more detail from the bottom up.
NETWORKING FUNDAMENTALS 271
Twisted Pair CAT 5 Cabling
etc.
FIGURE 14.2
The ISO model with Ethernet and TCIP/IP.
FIGURE 14.3
Two computers connected.
DRE14 11/16/2005 9:47 AM Page 271

THE ARCHITECTURE AND COMPONENTS AND THE INTERNATIONAL ORGANIZATION FOR STANDARDIZATION MODEL
The archive machine hosts the images the clinical display needs. An appli-cation on the archive knows how to answer image requests from clinical dis-plays. In the ISO model this portion of communication happens at the higherlevels. The application needs to transfer this information from itself to theclinical display requesting the information. The overall picture would looksomething like Figure 14.4. Figure 14.4 is an extremely simplified way oflooking at the ISO model. It is displayed in this way to emphasize the fun-damental components that we will need to understand to effectively makePACS networking decisions.
Each layer is interested only in the exchange of information betweenthe layer directly above and that directly below. (For example, the hardwarelayer generally does not care how the protocol layers pass information to theapplication: it is concerned only with passing the information up to the pro-tocol layer.) In this way the application communicates with the protocolstack, which in turn hands the information over to the hardware layer (thenetwork interface card, or NIC). Next, the hardware layer puts the infor-mation out onto the network.
Each layer has a different and well-defined task. The application layerknows the data it wants to transmit, and it knows which machine it wants totransmit it to. The protocol stack knows how to find the computer in ques-tion (or how to find a device that knows how to locate it). The network layerknows how to transmit the data over the network, and the network knows
PACS: A Guide to the Digi tal Revolut ion272
Data Link(Hardware)
Network(Protocol)
FIGURE 14.4
A simplified ISO model.
DRE14 11/16/2005 9:47 AM Page 272

how to transmit the data to its destination. On the other end, the informa-tion works its way back up until it ultimately reaches the application and theimage is viewable.
In many ways, this is analogous to the way the U.S. postal system works.In our scenario it would look something like Figure 14.5.
In this example it is easy to see how each layer is independent of theothers. It is not important to the envelope what information is contained init, only that the information fits. The same goes for the post office box, whichdoes not care what size envelope or even small box is put in it, only that itis not a koala or something else that does not belong in post office boxes.Moreover, the post office box could not care less about the contents of theenvelope. As we will see later, the post office system uses the address on theenvelope to move the envelope throughout the postal system.
NETWORKING FUNDAMENTALS 273
FIGURE 14.5
Postal system analogy.
DRE14 11/16/2005 9:47 AM Page 273

Now we will work our way back up through the layers, starting withthe physical layer. The physical layer consists of the wires that make up thenetwork. It may also include the NIC in the computers attached to it. Ingeneral, the physical layer can be thought of as the “plumbing” or highwayof a network. The quality and width of the pipe can determine the speed atwhich the data can be transmitted, the reliability of the network, and the distance at which the data can be transmitted.
Most of you have probably seen the cable coming out of the wall plateand connecting to your computer’s NIC. These cables are commonly knownas unshielded twisted pair (UTP) copper cabling, also referred to as Cate-gory 5 (CAT5) or Category 3 (CAT3), depending on the exact quality. Net-works can also be made up of telephone wires, coax cable (otherwise knownas thinnet or 10Base5), and other types of wires. One advance that haschanged networks dramatically in recent years has been the use of fiber-opticcabling, which can transmit more data over longer distances than con-ventional cabling by using light or lasers instead of electrical signals. Therelatively high cost of fiber cabling has relegated it generally to the core ofnetworks where bandwidth is needed most. Of late, fiber cabling has becomethe only type of cabling that can support faster transmission rates, and it is finding its way to the desktop as it becomes more popular and less ex-pensive. Later in this chapter, we will discuss which types of cabling are generally used where.
Let us return to our example in Figure 14.3. Our hypothetical networkwill use CAT5 cabling between the 2 workstations for now. The worksta-tions could be directly connected or, using a device discussed earlier, wecould use a hub, to which both devices can be connected, as shown in Figure14.6. Just like the hub of a wheel, a hub in networking terms is a device
PACS: A Guide to the Digi tal Revolut ion274
CAT 5Copper Cable
FIGURE 14.6
Two computers connected with a hub.
DRE14 11/16/2005 9:47 AM Page 274
connecting multiple computers. Hubs can have from as few as 4 to as manyas 24 or 48 connections for computers.
One layer higher, the hardware (data link) layer consists of the NIC,as well as the software drivers installed on the computer that allow the com-puter to communicate with the hardware. The most common types of cardsare Ethernet cards, which are designed to communicate on Ethernet net-works. There are also ATM cards (asynchronous transfer mode, discussedlater), token ring cards, and a variety of others. As with all the other layers,direct communication occurs between cards of the same type (i.e., Ethernetto Ethernet, or ATM to ATM). As we get into more complicated networktopologies, we will see that networks can become very diverse, consisting ofcomputers with Ethernet cards, ATM cards, and token ring cards, all com-municating via the use of various internetworking devices.
For now, to keep it simple, let us say that both computers have Ether-net cards in them. Both computers also have the appropriate software driversinstalled.
As we continue to move up our simplified ISO model, we need todiscuss protocols. Loosely defined, protocols are a set of predetermined rulesthat 2 or more parties follow in communication or other interactions. Incomputer networks, protocols are the set of rules, or languages, that enablecomputers to communicate over the underlying network infrastructure. Pro-tocols and how they are used are very much akin to languages in the realworld: just as humans speak languages such as English, French, and Swahili,networks use languages such as TCP/IP, IPX, and Appletalk. For 2 com-puters to communicate, they must be speaking the same language. In ourscenario we will say that our 2 computers are speaking TCP/IP with eachother, thus using a common language to communicate over an Ethernetnetwork on CAT5 cabling.
Last but not least is the application that uses this language to commu-nicate. In this example, that application is PACS.
COMMUNICATION AND CONVERSATIONS
It is time to delve more deeply into exactly how conversations occur. Oncewe establish that 2 computers want to exchange data, they must use theirshared set of rules (protocols) to do so. Further, these protocols need to com-municate over a network. So far we have talked about Ethernet, ATM, andtoken ring. These are sometimes called network topologies, and they alloccur at the data link layer. Certain rules must be followed on these topo-logies for them to work correctly. We have also identified a few of the more common protocols (or languages), such as TCP/IP and IPX. These
NETWORKING FUNDAMENTALS 275
DRE14 11/16/2005 9:47 AM Page 275
computer communication languages operate at the network layer. Any pro-tocol that is routable is using layer 3, the network layer, to make decisions.Protocols that are not routable are called bridged protocols and are awareof only the data link layer. We discuss this further when we discuss routingand bridging.
To better explain the relationship between a topology, such as Ether-net, and a protocol, such as TCP/IP, we again use the analogy of humancommunication. When we communicate, we can do so via a wide variety ofmedia: the air (speech), paper (the written word), or hands (sign language).What language we use is completely independent of the medium we use.Similarly, computers can communicate via TCP/IP or IPX and do so overEthernet or copper wire or token ring or fiber-optic cabling. (Later wediscuss devices that do the functional equivalent of taking written Englishand verbalizing it, or vice versa. You are much less likely to find a networkdevice that does the functional equivalent of translating from English toFrench, however; such devices are commonly referred to as gateways.)
Since protocols are much like languages, it is useful to use the conver-sation model to explain how computers communicate. The primary obsta-cle in using this analogy is that communication for us is second nature; wetalk and write without being aware that we are in fact following a set of rules.In the world of computers, where only logic exists and everything is takenliterally, conversations are actually very complicated to carry out.
As an example, in human behavior, there are protocols for starting aconversation, such as saying “Hello, how are you?” and responding “Good,and yourself ?” These sorts of things occur naturally (assuming everyone iscivil!). Similarly, ending a conversation has sets of rules concerning good-byes, and so on. Even during the conversation, it is important not to inter-rupt the person speaking, and to acknowledge what the person is saying witha nod. If you do not understand what the person is saying, you ask the personto repeat himself or herself. Very similar things happen on computer net-works, as we will explain.
AN EXAMPLE OF A CLASSIC COMPUTERNETWORK—SHARED ETHERNET
To get a better understanding of how computers handle this, let us look ata conversation between our archive computer (server) and our clinical display(client) and postulate how they might communicate. The client knows it wants certain information from the server. Its request makes its way down through the protocol stack using a language that it knows the archive
PACS: A Guide to the Digi tal Revolut ion276
DRE14 11/16/2005 9:47 AM Page 276

understands. This message makes its way out onto the wire, heading for thedestination machine. The destination, in this case the archive, is listening foranybody looking to talk to it, and sees the packet (piece of data) on thenetwork. The 2 machines begin with their “Hello, how are you?” routineand agree to communicate with certain rules.
They agree, for instance, on how much data the 2 will transmit at anygiven time, what to call their conversation, and a great number of otherthings. All the while, since there is a single shared network between the 2devices, only 1 of the 2 computers can be speaking at any given time. If theclient and archive attempt to send information at the same time, both of theirtransmissions are lost, and they need to start their sentences over. When sucha situation arises, it is termed a “collision,” because the electrical signalseffectively collide with one another on the network of shared cabling. Inthese instances, algorithms in the program determine when it is safe to starttrying to repeat the message while decreasing the likelihood of another collision.
When only 2 computers are in the equation, the likelihood of a colli-sion is smaller than you might imagine. However, as more and more com-puters compete for the same network, the likelihood of 2 or more computerstrying to transmit at once increases greatly. At some point, when you arebuilding networks with hundreds of computers on them or networks inwhich computers are constantly trying to communicate, collisions becomethe norm rather than the exception, and the network cannot bear the burdenof all those sentences in the conversation. The sentences, in network terms,are called packets.
What we are describing is called shared Ethernet, in which all the com-puters share the same network. Even today it is probably the most populartype of network in the world, although newer technologies are becomingmore prevalent. Only 1 computer can be transmitting its electrical impulsesonto the network at any given time. We like to use the example of a con-ference room to make the idea of a shared medium a little easier to under-stand (see Figure 14.7).
Let us say that our conference room holds 200 people. First, we set upa simple rule: anybody can talk to anybody else, but only 1 person in theentire room can be talking at a time. If somebody tries to talk while some-body else is in midsentence, they both have to stop and start their sentencesagain. One can see very quickly how, in a room full of people operating underthese rules, very little is going to get said, especially if a lot of conversationsare in progress. In this example, the conference room is analogous to anetwork segment, the air is the medium (Ethernet), the people are the com-puters, and the information they are trying to transmit could be PACS
NETWORKING FUNDAMENTALS 277
DRE14 11/16/2005 9:47 AM Page 277

knowledge, baseball news, or the latest juicy gossip. Some could be speak-ing English or French, but only those who understand French are able to communicate with others who understand French. Similarly, on ournetwork, computers could be talking TCP/IP to one another while othersare speaking IPX. They all share the same network segment, but they com-municate only with those speaking the same language.
ENTER BRIDGING
You can see in this scenario how inefficient such communications can be.The same was true for early networks. The first attempt to tackle theproblem of collision was with a concept called bridging. A bridge is a devicethat connects 2 or more networks together. (As we see later, a bridge under-stands only the 2 lower layers of our simplified ISO model. Next we talkabout a device that understands the lower 3 layers, a router.)
To explain exactly what a bridge does, let us take the conference roomand split it in two. We assign each person a unique number, known as his orher MAC address, or media access control address. The MAC address isunique not only in the conference room, but also throughout the world. Incomputing, the MAC address is derived from the network interface card. Itis how each computer (or in our example, each person) is identified.
In Figure 14.8 you see that the conference room is split in two, withpeople numbered 1, 2, and 3 on the left side and 4, 5, and 6 on the rightside. In the middle of the conference room is a dividing wall, which stops allnoise unless the bridge, B, allows it through. It is the bridge’s job to keep
PACS: A Guide to the Digi tal Revolut ion278
4 PACS, Baseball3 English or TCP/IP2 The People1 The Air the Sound Travels Over
FIGURE 14.7
The conference room.
DRE14 11/16/2005 9:47 AM Page 278
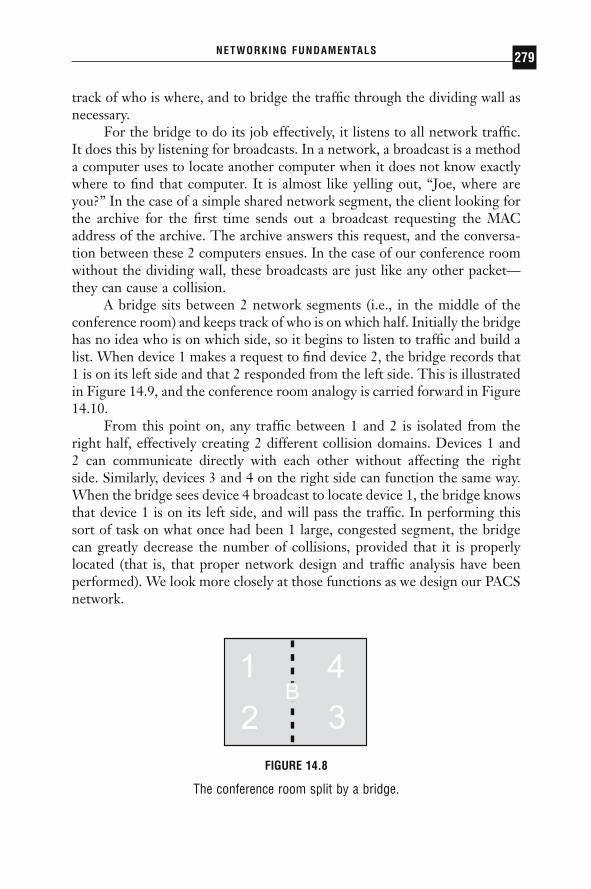
track of who is where, and to bridge the traffic through the dividing wall asnecessary.
For the bridge to do its job effectively, it listens to all network traffic.It does this by listening for broadcasts. In a network, a broadcast is a methoda computer uses to locate another computer when it does not know exactlywhere to find that computer. It is almost like yelling out, “Joe, where areyou?” In the case of a simple shared network segment, the client looking forthe archive for the first time sends out a broadcast requesting the MACaddress of the archive. The archive answers this request, and the conversa-tion between these 2 computers ensues. In the case of our conference roomwithout the dividing wall, these broadcasts are just like any other packet—they can cause a collision.
A bridge sits between 2 network segments (i.e., in the middle of theconference room) and keeps track of who is on which half. Initially the bridgehas no idea who is on which side, so it begins to listen to traffic and build alist. When device 1 makes a request to find device 2, the bridge records that1 is on its left side and that 2 responded from the left side. This is illustratedin Figure 14.9, and the conference room analogy is carried forward in Figure14.10.
From this point on, any traffic between 1 and 2 is isolated from theright half, effectively creating 2 different collision domains. Devices 1 and 2 can communicate directly with each other without affecting the right side. Similarly, devices 3 and 4 on the right side can function the same way.When the bridge sees device 4 broadcast to locate device 1, the bridge knowsthat device 1 is on its left side, and will pass the traffic. In performing thissort of task on what once had been 1 large, congested segment, the bridgecan greatly decrease the number of collisions, provided that it is properlylocated (that is, that proper network design and traffic analysis have beenperformed). We look more closely at those functions as we design our PACSnetwork.
NETWORKING FUNDAMENTALS 279
FIGURE 14.8
The conference room split by a bridge.
DRE14 11/16/2005 9:47 AM Page 279
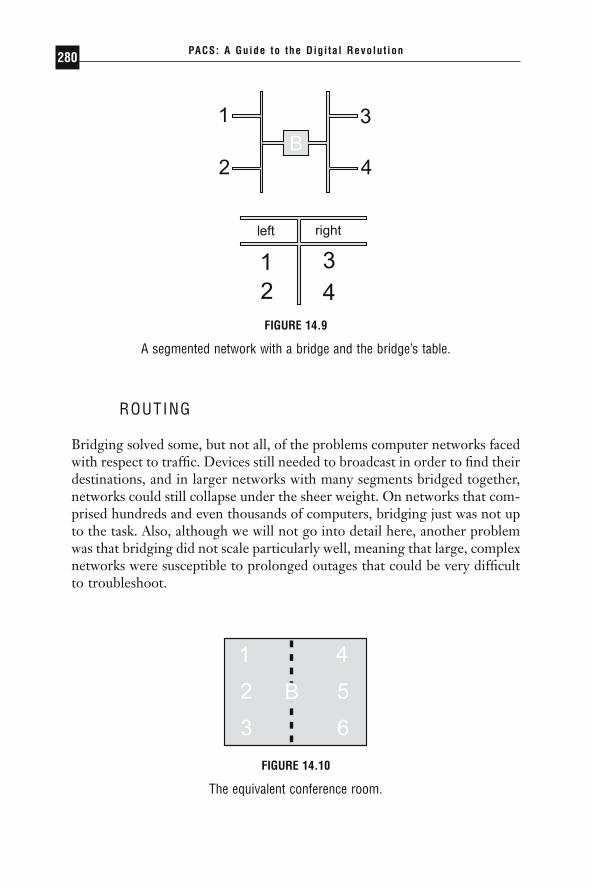
ROUTING
Bridging solved some, but not all, of the problems computer networks facedwith respect to traffic. Devices still needed to broadcast in order to find theirdestinations, and in larger networks with many segments bridged together,networks could still collapse under the sheer weight. On networks that com-prised hundreds and even thousands of computers, bridging just was not upto the task. Also, although we will not go into detail here, another problemwas that bridging did not scale particularly well, meaning that large, complexnetworks were susceptible to prolonged outages that could be very difficultto troubleshoot.
PACS: A Guide to the Digi tal Revolut ion280
FIGURE 14.9
A segmented network with a bridge and the bridge’s table.
FIGURE 14.10
The equivalent conference room.
DRE14 11/16/2005 9:47 AM Page 280

The challenge facing programmers was to create a more intelligent net-working device that could limit broadcasts and more efficiently use the band-width. Routing is a technology developed in the mid-1980s to address theseproblems. Routing made use of protocols that had more intelligence builtinto them so they could pass traffic more effectively throughout the network.Protocols that came along before routing existed had no concept of layer 3 of the ISO model; they simply made use of the MAC address and usedbroadcasts to find their destinations. Protocols like that are called bridgedprotocols, and examples are LAT and Netbeui. When routing was intro-duced, protocols came along such as TCP/IP and IPX, which sent out in-formation in packets that routers could use to more intelligently handle thetraffic. These are commonly referred to as routable protocols. Such proto-cols could limit broadcasts and make it much easier to find devices on a largenetwork.
Again we will use the conference room example, except this time wewill expand our world to include the hallway outside the conference room,and add other conference rooms off this hallway (see Figure 14.11).
In this example, each room has a letter assigned to it: A through D.There are folks in each room and now they can be addressed in two ways.MAC addresses still need to be unique, but the protocol address needs to beunique only within that conference room. Addressing at the routable proto-col level would look something like Table 14.1.
The benefit is realized when we have many conference rooms, as inTable 14.1. When device A.a wants to communicate with device D.c, itknows that (1) device D.c is not in the same conference room as itself (otherwise it would have the same room letter) and (2) the hallway knowshow to find room D. So device A.a sends its information out into the hall-way (the router, sometimes referred to as its “default gateway”), and therouter relays the conversation to room D, where device D.c receives theinformation.
NETWORKING FUNDAMENTALS 281
In the user 1. a protocol (network) layer address, the“1” is the data link layer unique address.
FIGURE 14.11
Four conference rooms (A through D) with devices in each.
DRE14 11/16/2005 9:47 AM Page 281

Earlier we mentioned that there are devices that can take the spokenword and convert it to written, and the reverse, as well. Both routers andbridges are capable of doing this, and commonly do. For instance, room Ccould be a room in which all the devices are communicating via the writtenword, while rooms A, B, and D are communicating via oral speech. Therouter would know how to verbalize everything coming out of room C andgoing into the other rooms, and know how to do the reverse for traffic goinginto room C.
Routing has been tremendously beneficial in large, complicated envi-ronments. Although it adds another layer of complexity and requires signif-icantly more engineering to set up, it goes a long way toward simplifying,troubleshooting, and preventing a network from collapsing during heavytraffic. Unfortunately, routing can slow traffic down, because it has toperform some intensive tasks in order to determine exactly where the packetneeds to travel. Keeping with our analogy, the time spent using the hallwayto get to another conference room slows the conversation. In most cases theslowdown is negligible, but as we discuss in designing PACS networks, it canbe detrimental to PACS performance.
A router is slow because it has to examine more of the packet to makerouting decisions. Bridges work much more quickly because they have fewerdecisions to make. The nature of networks is such that they are never set upas efficiently as possible—the server you need so you get your informationinevitably has 2 or 3 routers in the way. In addition, as bandwidth demandsincrease, segments need to become smaller, which means more routers,which means slower response time to the server. When routing became tooslow, another technology was introduced. Enter switching.
PACS: A Guide to the Digi tal Revolut ion282
TABLE 14.1Conference Rooms and Addresses of Their Devices
Room Devices’ Addresses
A A.a, A.b, A.c, A.dB B.a, B.b, B.c, B.dC C.a, C.b, C.c, C.dD D.a, D.b, D.c, D.d
DRE14 11/16/2005 9:47 AM Page 282

SWITCHING
Switching, as simple as it is, revolutionized the networking industry. Manynetworks were collapsing under the sheer weight of routers, and engineerswere unable to break up their segments any more than they already hadwithout creating hopelessly complex architectures. The idea of switching isto step back and look at only as much of the packet as a bridge looks at, thedata link layer. This means that a switch is essentially a bridge. To a lot ofpeople this is confusing, so let us look at it this way—a switch is basically abridge with many, many interfaces, and sometimes each interface has only 1device connected to it. Switches were developed because it became cost-effective to build bridges with numerous interfaces on them. Switches areessentially bridges that are applied in a different manner than originalbridges because they are more powerful. As we begin to look at networkdesign and talk about bandwidth, we will see how the idea of switching (andthe fact that it came about as higher-speed networks were being developed),when incorporated with routing, helps make network bottlenecks easier toremove.
Switches are used in a variety of ways. Some switches are used in thecore of the network (more on this later), whereas other switches are used toreplace hubs. When they replace hubs, they have the same effect as chang-ing the rules in the conference room. Recall our first rule of the conferenceroom: anybody can talk to anybody else, but only 1 person in the room canbe talking at a time. If more than 1 person speaks we have a collision. Tohelp alleviate the problem, we first installed a bridge in the conference room;then we added conference rooms with a hallway as the router. But thatscheme can be applied only so far. At some point we cannot take everybodyout of the conference room, and 50 chatty people are going to have someserious collision problems. It does not seem productive to install 25 bridgesin the conference room. But when switching came along, it greatly simpli-fied the situation by doing just that. In effect, switching looked at the ruleswe established concerning talking and changed 1 rule in the conferenceroom—that which was the most inefficient. Switching allows us to say that anybody can talk to anybody else, as long as each person is talking toonly 1 other person. Sometimes when a switch is used to separate everybodyfrom everybody else in the conference room, it is referred to as a switchinghub.
But what happens when the users in the conference room do not wantto talk to each other, but instead want to talk to somebody in another room,that is, through the router? Then we need to talk about bandwidth.
NETWORKING FUNDAMENTALS 283
DRE14 11/16/2005 9:47 AM Page 283

BANDWIDTH
Bandwidth, simply stated, is the rate at which information can be transmit-ted in a specific time interval, usually seconds. In computer networks, therate at which data can be transmitted is measured in bits per second. A bit,or binary digit, is either a 0 or a 1. A bit can be considered the atom of thecomputer world. Eight bits are called a byte. The reason 8 bits are signifi-cant is that eight 1s in binary form (11111111) are equivalent to 255 indecimal form, which is enough to represent all variations in the Englishalphabet of upper- and lower-case letters, numbers, and other characters.
One million bytes are commonly referred to as 1 megabyte, or 1MB.This is how most computer users understand file sizes, hard drive sizes, andthe like. In the data networking world, however, transmission rates are meas-ured in megabits, not megabytes. One megabit is denoted as 1Mb to distinguish it from a megabyte. In this way, data transmission rates can bedeceiving because a network that can transmit data at 10Mb per second isreally transmitting 1.25MB per second (one eighth the speed). Whymegabytes are used when referring to file sizes and megabits are used whenreferring to data transfer rates is a mystery. It could have been a marketingploy by network vendors to make their networks sound faster than they reallyare.
To most people, megabits mean very little. It is like telling people yourcar has 282 horsepower when they have not experienced 150, 250, or 300horsepower. To put megabits into perspective, let us use the example shownin Table 14.2.
Many different types of common networks are available. Along withthe shared Ethernet mentioned in our example network, others are listed inTable 14.3 in relative order of performance (though bear in mind that certain
PACS: A Guide to the Digi tal Revolut ion284
TABLE 14.2Putting Megabits into Perspective
The typical individual reads at approximately 600 bits/second.The image transmitted to your television screen represents about 3,000,000
bits/second.Most modems connect to the Internet at 56,000 bits/second.The most common type of network in existence today is shared Ethernet, which
operates at 10,000,000 bits/second.
DRE14 11/16/2005 9:47 AM Page 284
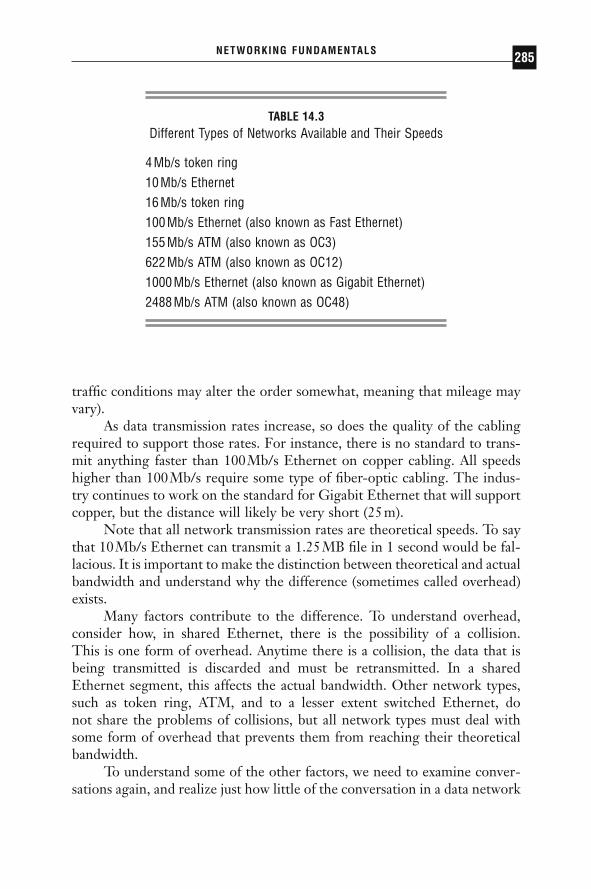
traffic conditions may alter the order somewhat, meaning that mileage mayvary).
As data transmission rates increase, so does the quality of the cablingrequired to support those rates. For instance, there is no standard to trans-mit anything faster than 100Mb/s Ethernet on copper cabling. All speedshigher than 100Mb/s require some type of fiber-optic cabling. The indus-try continues to work on the standard for Gigabit Ethernet that will supportcopper, but the distance will likely be very short (25m).
Note that all network transmission rates are theoretical speeds. To saythat 10Mb/s Ethernet can transmit a 1.25MB file in 1 second would be fal-lacious. It is important to make the distinction between theoretical and actualbandwidth and understand why the difference (sometimes called overhead)exists.
Many factors contribute to the difference. To understand overhead,consider how, in shared Ethernet, there is the possibility of a collision. This is one form of overhead. Anytime there is a collision, the data that isbeing transmitted is discarded and must be retransmitted. In a shared Ethernet segment, this affects the actual bandwidth. Other network types,such as token ring, ATM, and to a lesser extent switched Ethernet, do not share the problems of collisions, but all network types must deal withsome form of overhead that prevents them from reaching their theoreticalbandwidth.
To understand some of the other factors, we need to examine conver-sations again, and realize just how little of the conversation in a data network
NETWORKING FUNDAMENTALS 285
TABLE 14.3Different Types of Networks Available and Their Speeds
4Mb/s token ring10Mb/s Ethernet16Mb/s token ring100Mb/s Ethernet (also known as Fast Ethernet)155Mb/s ATM (also known as OC3)622Mb/s ATM (also known as OC12)1000Mb/s Ethernet (also known as Gigabit Ethernet)2488Mb/s ATM (also known as OC48)
DRE14 11/16/2005 9:47 AM Page 285

has to do with the actual data being transmitted. Each half of spoken dia-logue is made of sentences. In a network, each of these sentences is called apacket. Packets are the elements composed of bits that carry data betweenthe 2 computers on the network.
Let us look at the example of the letter and the envelope to see how apacket is formed.
In Figure 14.12, the letter represents the data that needs to be sent tothe recipient. Realize that this letter is only a small part of what is actuallygetting sent through the postal system. The letter requires the envelope, therecipient’s address, and the return address. All of this contributes to over-head. In some cases, the actual data could comprise as little as 33% of thepacket. On top of that, each packet must be checked to make sure it madeit to its destination without any errors (from electrical interference, forinstance, which may cause a 0 to be interpreted as a 1 or vice versa). Thereis overhead in doing the checking, as well. As you might imagine, all of thisextra information can quickly contribute to overhead on a network, gobblingup bandwidth you thought you had all to yourself. In some protocols, packetsalso have to be acknowledged by the receiver, or else the sender resends thepacket. Imagine the overhead involved in sending a message that simply says,“Yes, I got your letter.” There is very little data in that packet compared tothe actual bandwidth it consumes.
(Bear in mind that the packet in Figure 14.13 is an example of a packet,and not to be taken too literally. Each packet is actually made up of otherinformation, depending on the exact protocol and data link layer for whichit is designed. Our example packet has been simplified dramatically.)
All of this goes a long way toward dragging the actual bandwidth of anetwork down. Most engineers agree that between collisions and overhead,
PACS: A Guide to the Digi tal Revolut ion286
Letter = DataProofread = Checksum (CRC)
Envelope = Source Address (SA)Envelope = Destination Address (DA) Also Start and End
FIGURE 14.12
A letter and envelope with address are like a packet.
DRE14 11/16/2005 9:47 AM Page 286
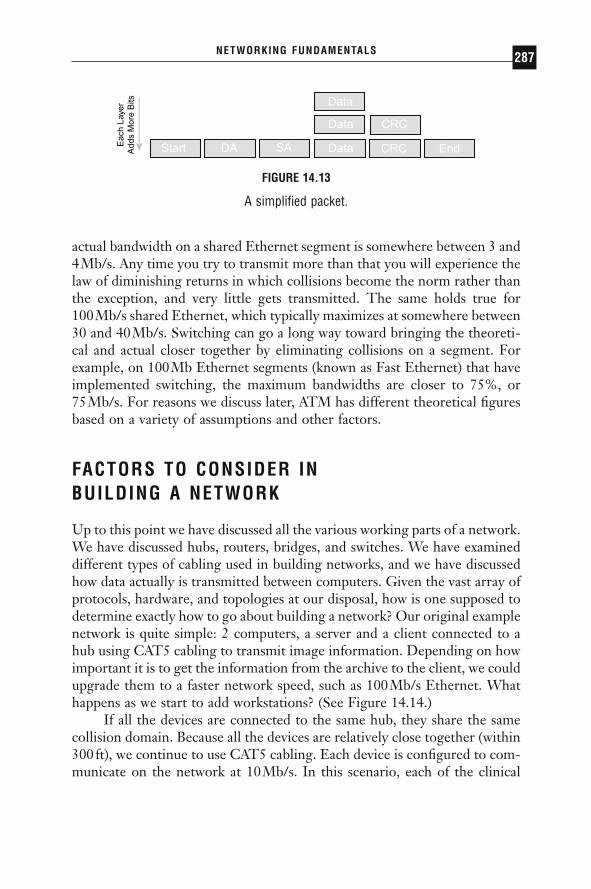
actual bandwidth on a shared Ethernet segment is somewhere between 3 and4Mb/s. Any time you try to transmit more than that you will experience thelaw of diminishing returns in which collisions become the norm rather thanthe exception, and very little gets transmitted. The same holds true for 100Mb/s shared Ethernet, which typically maximizes at somewhere between30 and 40Mb/s. Switching can go a long way toward bringing the theoreti-cal and actual closer together by eliminating collisions on a segment. Forexample, on 100Mb Ethernet segments (known as Fast Ethernet) that haveimplemented switching, the maximum bandwidths are closer to 75%, or 75Mb/s. For reasons we discuss later, ATM has different theoretical figuresbased on a variety of assumptions and other factors.
FACTORS TO CONSIDER IN BUILDING A NETWORK
Up to this point we have discussed all the various working parts of a network.We have discussed hubs, routers, bridges, and switches. We have examineddifferent types of cabling used in building networks, and we have discussedhow data actually is transmitted between computers. Given the vast array ofprotocols, hardware, and topologies at our disposal, how is one supposed todetermine exactly how to go about building a network? Our original examplenetwork is quite simple: 2 computers, a server and a client connected to ahub using CAT5 cabling to transmit image information. Depending on howimportant it is to get the information from the archive to the client, we couldupgrade them to a faster network speed, such as 100Mb/s Ethernet. Whathappens as we start to add workstations? (See Figure 14.14.)
If all the devices are connected to the same hub, they share the samecollision domain. Because all the devices are relatively close together (within300ft), we continue to use CAT5 cabling. Each device is configured to com-municate on the network at 10Mb/s. In this scenario, each of the clinical
NETWORKING FUNDAMENTALS 287
Eac
h La
yer
Add
s M
ore
Bits
FIGURE 14.13
A simplified packet.
DRE14 11/16/2005 9:47 AM Page 287
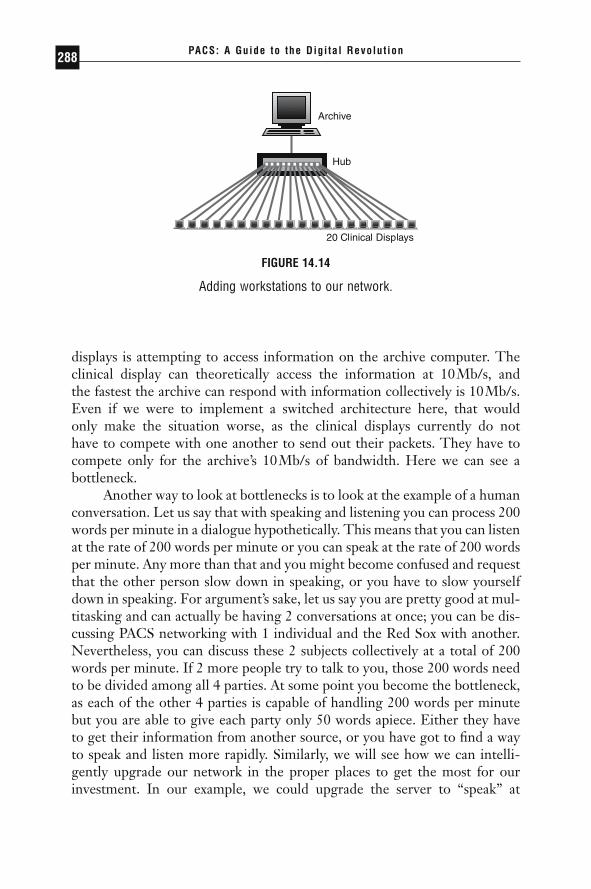
displays is attempting to access information on the archive computer. Theclinical display can theoretically access the information at 10Mb/s, and the fastest the archive can respond with information collectively is 10Mb/s.Even if we were to implement a switched architecture here, that would only make the situation worse, as the clinical displays currently do not have to compete with one another to send out their packets. They have tocompete only for the archive’s 10Mb/s of bandwidth. Here we can see a bottleneck.
Another way to look at bottlenecks is to look at the example of a humanconversation. Let us say that with speaking and listening you can process 200words per minute in a dialogue hypothetically. This means that you can listenat the rate of 200 words per minute or you can speak at the rate of 200 wordsper minute. Any more than that and you might become confused and requestthat the other person slow down in speaking, or you have to slow yourselfdown in speaking. For argument’s sake, let us say you are pretty good at mul-titasking and can actually be having 2 conversations at once; you can be dis-cussing PACS networking with 1 individual and the Red Sox with another.Nevertheless, you can discuss these 2 subjects collectively at a total of 200words per minute. If 2 more people try to talk to you, those 200 words needto be divided among all 4 parties. At some point you become the bottleneck,as each of the other 4 parties is capable of handling 200 words per minutebut you are able to give each party only 50 words apiece. Either they haveto get their information from another source, or you have got to find a wayto speak and listen more rapidly. Similarly, we will see how we can intelli-gently upgrade our network in the proper places to get the most for ourinvestment. In our example, we could upgrade the server to “speak” at
PACS: A Guide to the Digi tal Revolut ion288
FIGURE 14.14
Adding workstations to our network.
DRE14 11/16/2005 9:47 AM Page 288
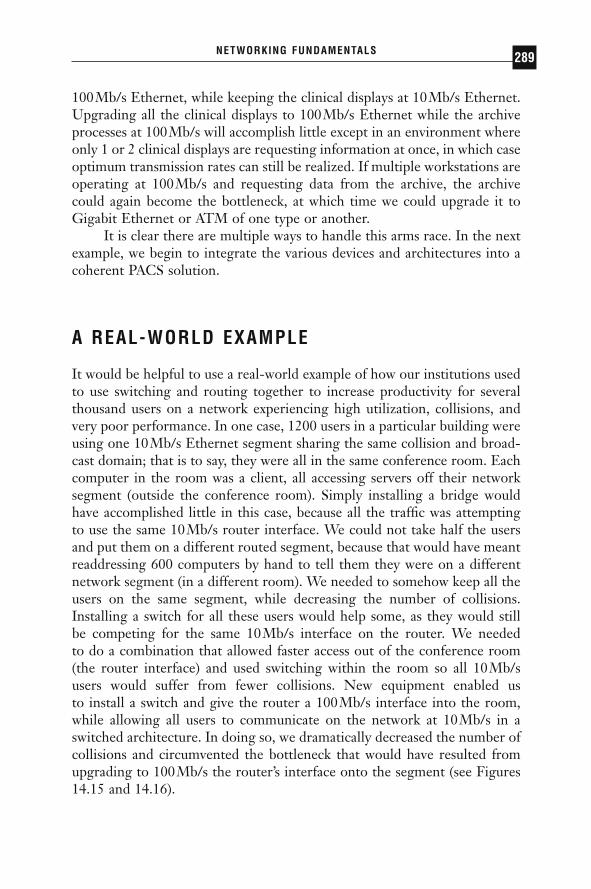
100Mb/s Ethernet, while keeping the clinical displays at 10Mb/s Ethernet.Upgrading all the clinical displays to 100Mb/s Ethernet while the archiveprocesses at 100Mb/s will accomplish little except in an environment whereonly 1 or 2 clinical displays are requesting information at once, in which caseoptimum transmission rates can still be realized. If multiple workstations areoperating at 100Mb/s and requesting data from the archive, the archivecould again become the bottleneck, at which time we could upgrade it toGigabit Ethernet or ATM of one type or another.
It is clear there are multiple ways to handle this arms race. In the nextexample, we begin to integrate the various devices and architectures into acoherent PACS solution.
A REAL-WORLD EXAMPLE
It would be helpful to use a real-world example of how our institutions usedto use switching and routing together to increase productivity for severalthousand users on a network experiencing high utilization, collisions, andvery poor performance. In one case, 1200 users in a particular building wereusing one 10Mb/s Ethernet segment sharing the same collision and broad-cast domain; that is to say, they were all in the same conference room. Eachcomputer in the room was a client, all accessing servers off their networksegment (outside the conference room). Simply installing a bridge wouldhave accomplished little in this case, because all the traffic was attemptingto use the same 10Mb/s router interface. We could not take half the usersand put them on a different routed segment, because that would have meantreaddressing 600 computers by hand to tell them they were on a differentnetwork segment (in a different room). We needed to somehow keep all theusers on the same segment, while decreasing the number of collisions.Installing a switch for all these users would help some, as they would still be competing for the same 10Mb/s interface on the router. We needed to do a combination that allowed faster access out of the conference room(the router interface) and used switching within the room so all 10Mb/s users would suffer from fewer collisions. New equipment enabled us to install a switch and give the router a 100Mb/s interface into the room,while allowing all users to communicate on the network at 10Mb/s in aswitched architecture. In doing so, we dramatically decreased the number ofcollisions and circumvented the bottleneck that would have resulted fromupgrading to 100Mb/s the router’s interface onto the segment (see Figures14.15 and 14.16).
NETWORKING FUNDAMENTALS 289
DRE14 11/16/2005 9:47 AM Page 289

PACS: A Guide to the Digi tal Revolut ion290
10 Mb/s Router
FIGURE 14.15
Network before upgrade.
100 Mb/s100 Mb/s
100 Mb/s
100 Mb/s
100 Mb/s
100 Mb/s
100 Mb/s
100
Mb/
s
FIGURE 14.16
Network after upgrade.
DRE14 11/16/2005 9:47 AM Page 290
PACS NETWORKS
As you probably see by now, networks can be incredibly diverse. There area number of factors to take into consideration when building a network, andwe have many tools available to us in the form of routers, switches, Ether-net, ATM, and copper and fiber cabling. How effectively we put this togetherdepends on the amount of knowledge we have of the tools available to us,as well as an intimate understanding of exactly how traffic on the networkflows. We also need to take cost into consideration. Among the many impor-tant factors, 4 stand out (Table 14.4).
The decision-making process is similar to that used for choosing a car.Potentially, one could purchase a high-performance car for a midrange price,but in the long run there may be reliability issues with it, and maintenancemay be expensive. On the other hand, a more reliable car might cost thesame amount but lack the performance we might require on the highway.Getting both reliability and performance costs more money.
PACS networks are different from most networks. Typical networks areintended to transmit e-mail, share small files, share printers, and handleother processes. If it takes 2 minutes or 3 minutes to transmit an e-mail, doesit really matter? If it takes 10 seconds to open that Word document ratherthan 8, who is going to notice? On the other hand, PACS networks are trans-mitting large amounts of data, and that data needs to get where it is goingquickly and reliably. PACS networks require both performance, because ofthe sheer amount of data being transmitted, and reliability, because of thedata’s clinical nature. The reason PACS is becoming so popular is that onlyrecently have fast, reliable technologies become available to make PACSimplementations practical and cost-effective. In the following examples, youwill see networks on 3 different scales and learn the rationale behind theirdesign.
NETWORKING FUNDAMENTALS 291
TABLE 14.4Four Important Factors in Building a Network
Performance—How quickly the network can transmit data.Reliability—How reliable the network is. How easy is it to maintain?Upgradability—How easy is it to upgrade?Price—How much does the network cost?
DRE14 11/16/2005 9:47 AM Page 291

ASYNCHRONOUS TRANSFER MODE
First let us look at few technologies that we will use in building this network.One such technology is ATM, or asynchronous transfer mode. We willexplain the differences between ATM and Ethernet by explaining how theywere derived.
Ethernet, in its purest form, is a “dumb” medium. It does not knowwhat traffic is passing over it, nor does it need to. It operates under simplerules and principles that govern how traffic will be transported. Your e-mailabout the Red Sox has no higher or lower priority than a PACS image or atelephone call. In this sense, Ethernet is said to have no concept of qualityof service, or QoS.
ATM, on the other hand, was designed with the intent of allowing thenetwork administrator to classify different types of traffic with different pri-orities. In this sense, an ATM network offers different levels of QoS depend-ing on the application or workstation.
ATM is able to do this so well in large part because it is a much morepredictive architecture. In an Ethernet network, packets can vary in size,reaching a maximum of 1500 bytes. However, some packets can be 300 bytes,some 50 bytes, and some 1500 bytes. Thus, it is very difficult for an Ether-net network to be able to predict traffic patterns. On the other hand, ATMpackets are called “cells” and are always 53 bytes in length. Because of theconstant size of the cells, ATM is predictive: a packet of streaming video willnot get “stuck” behind a 1500-byte e-mail packet in a router while it tries toreach its destination.
ATM is often compared to a telephone network because of the highpredictability it ensures. ATM networks can be built so that voice cells willhave a high priority and always get through. ATM does this in much thesame way the telephone system does. When you pick up the telephone and attempt to make a call, the ATM or telephone network checks to seewhether it can complete the call with the parameters you require. In the case of ATM and computer networks, you may request a certain amount of bandwidth. If the ATM network cannot guarantee that amount of bandwidth, the computer and the network can negotiate a lower bandwidthrate, or not start the conversation at all. This is very much like a telephonecall, especially a cell phone call, where you occasionally get a “fast busy”because the voice network cannot guarantee enough bandwidth to completethe call.
That said, ATM has had a long, troubled journey toward universalacceptance. It has taken years from its inception to make it to a finishedproduct. Along the way various vendors have released products based
PACS: A Guide to the Digi tal Revolut ion292
DRE14 11/16/2005 9:47 AM Page 292

only loosely on not-yet-agreed-upon standards that make vendor interoper-ability very unlikely. Because of this, when you choose an ATM vendor,understand the high probability of the product’s not working with otherATM hardware.
Another consideration in choosing to use ATM in networks is the worka router or switch needs to perform in converting packets into cells and back.This conversion contributes a certain overhead, which is often viewed asdetrimental. Strong consideration should be made when mixing ATM withother network types, such as Ethernet. However, those considerations gobeyond the scope of this book.
There are other downsides to ATM. The number of ATM installationsin most LAN environments is rather small when compared to those of Ethernet. Hence, it can be harder to find engineers who have expertise inthe area. What is more, the price per port of ATM is significantly higherthan that of Ethernet. Add to this the fact that Gigabit Ethernet is begin-ning to gain steam and provide high bandwidth at a lower price, so an invest-ment in ATM may not be a good one.
WIDE AREA NETWORKING
All the technologies that we have talked about so far (ATM, Ethernet, tokenring) have been designed for local campus settings; that is, for connectionson which we can run either fiber or copper cabling. When we leave thecampus setting, however, we no longer have the luxury of being able to runour own cable. Whether trying to go across the street, across town, or acrossthe world, we need an external provider to connect sites. Telephone com-panies (also known as Regional Bell Operating Companies, or RBOCs), suchas Bell Atlantic or AT&T, have massive networks designed for handling tele-phone calls all over the world. They can use these networks to provide datatransmission as well.
RBOCs lease “circuits” to companies over which to transmit data.These circuits are generally point-to-point connections between 2 sites.Generally speaking, the circuits they provide offer bandwidth from 56 kilo-bits (Kb)/s all the way up to 155Mb/s. Unfortunately, charges are recurring(usually monthly), and the price per megabit is much higher than on the localarea network (LAN) for a connection of the same speed. For instance, a stan-dard type of circuit, a T1, operates at 1.554Mb/s, and can cost severalhundred dollars per month. The farther the circuit extends, the more theRBOC charges. Several factors in the industry have kept these costs fairlystable for many years, but technologies to get around these charges are
NETWORKING FUNDAMENTALS 293
DRE14 11/16/2005 9:47 AM Page 293

becoming more popular, and competition is starting to drive down prices(see Figure 14.17). We discuss some of these technologies and the competi-tion factors later in this chapter.
A SIMPLE PACS NETWORK
Figure 14.18 shows a relatively simple PACS network. As you can see, thereare 2 modalities, 3 clinical and diagnostic displays, and an archive server. All
PACS: A Guide to the Digi tal Revolut ion294
Eth
erne
t Seg
men
t (H
ub o
r S
witc
h)
Eth
erne
t Seg
men
t (H
ub o
r S
witc
h)
FIGURE 14.17
Illustration of how leased circuits from RBOCs can be integrated intoLANs to allow connectivity between 2 LANs.
100 Mb/s Ethernet
100 Mb/s Ethernet
100 Mb/s Ethernet
100 Mb/s Ethernet
100 Mb/s Ethernet
100 Mb/s Ethernet
FIGURE 14.18
A simple PACS network.
DRE14 11/16/2005 9:47 AM Page 294

these devices are connected to a central Ethernet switch, probably usingCAT5 cabling. This network assumes that all devices connecting to thecentral switch are within cable specifications for connecting at speeds of 100Mb/s.
In this diagram the archive server is connected at 100Mb/s, as are thediagnostic and clinical displays. The modalities are connected at 100Mb/s.As most traffic is being sent to the archive server and retrieved from thearchive server, we see our first potential bottleneck, but in a network of thissize, it is very unlikely that the 100Mb/s connection will be swamped. Insome cases, a 1000Mb/s (Gigabit Ethernet) connection could be substitutedfor the 100Mb/s connection to the server, but the likelihood that it wouldenhance performance is minimal.
MAKING LIFE MORE COMPLICATED
Now we will complicate our PACS network somewhat. First, we will addsome modalities and displays. Let us say that these additions are located atthe other end of the building and thus the distance exceeds our maximumcable requirements. We will need to connect them to a second Ethernetswitch, and then connect the Ethernet switches together, probably withfiber-optic cabling because the 2 switches are 750 feet apart.
Adding this additional closet (switch) causes us to look at our networkin a whole new light. Now we have to consider how much bandwidth weneed between the 2 closets (1, in Figure 14.19). This second switch has 3modalities and 3 display stations and could conceivably saturate 330Mb/s ofbandwidth if all are transmitting at the same time. This is very unlikely, andFast Ethernet is likely to be enough bandwidth for quite some time.
Still, just as in the simple PACS network, all the traffic is going to thearchive. So it is even more conceivable that the connection between thearchive and the switch will be the most likely bottleneck. Given the tech-nologies available these days, both links (2 and 3 in Figure 14.19) could be155Mb/s ATM, although that is not much of an improvement over 100Mb/sEthernet. We also need to consider the cell conversion if the rest of thedevices are still Ethernet and if we want to add ATM to an all-Ethernet envi-ronment. Another option is 622Mb/s (OC-12) ATM, which offers signifi-cantly better performance than 155Mb/s ATM. Gigabit Ethernet is yetanother option, and would probably come in at the same price point or betterthan 622Mb/s ATM. These options offer a perfect example of how you mustwork with your PACS vendor and network vendor to determine which con-nection type best fits your situation.
NETWORKING FUNDAMENTALS 295
DRE14 11/16/2005 9:47 AM Page 295
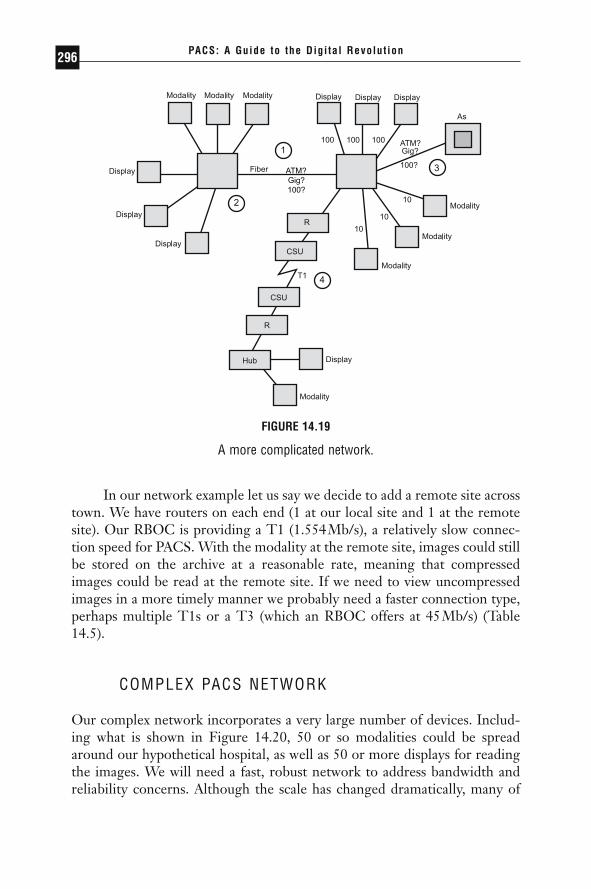
In our network example let us say we decide to add a remote site acrosstown. We have routers on each end (1 at our local site and 1 at the remotesite). Our RBOC is providing a T1 (1.554Mb/s), a relatively slow connec-tion speed for PACS. With the modality at the remote site, images could stillbe stored on the archive at a reasonable rate, meaning that compressedimages could be read at the remote site. If we need to view uncompressedimages in a more timely manner we probably need a faster connection type,perhaps multiple T1s or a T3 (which an RBOC offers at 45Mb/s) (Table14.5).
COMPLEX PACS NETWORK
Our complex network incorporates a very large number of devices. Includ-ing what is shown in Figure 14.20, 50 or so modalities could be spreadaround our hypothetical hospital, as well as 50 or more displays for readingthe images. We will need a fast, robust network to address bandwidth andreliability concerns. Although the scale has changed dramatically, many of
PACS: A Guide to the Digi tal Revolut ion296
ATM?Gig?100?
FIGURE 14.19
A more complicated network.
DRE14 11/16/2005 9:47 AM Page 296
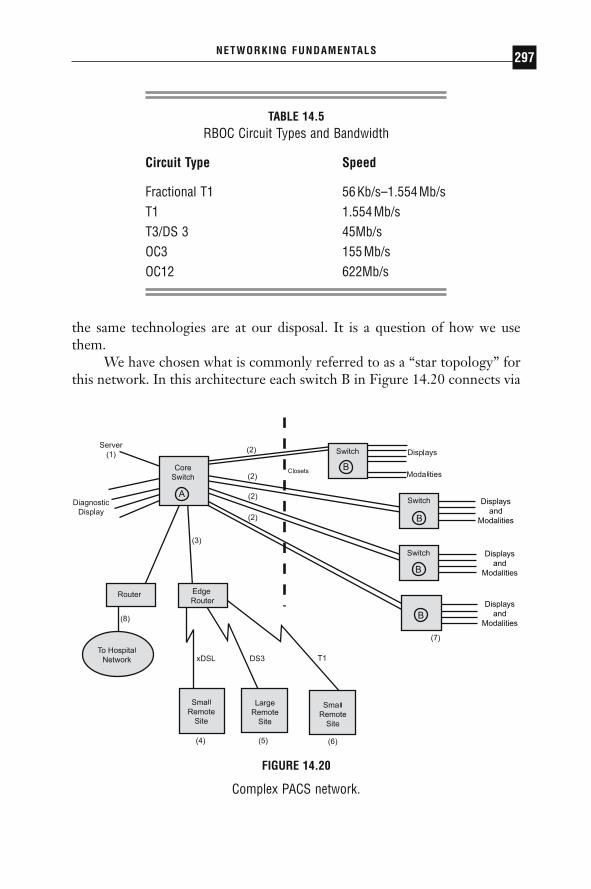
the same technologies are at our disposal. It is a question of how we usethem.
We have chosen what is commonly referred to as a “star topology” forthis network. In this architecture each switch B in Figure 14.20 connects via
NETWORKING FUNDAMENTALS 297
TABLE 14.5RBOC Circuit Types and Bandwidth
Circuit Type Speed
Fractional T1 56Kb/s–1.554Mb/sT1 1.554Mb/sT3/DS 3 45Mb/sOC3 155Mb/sOC12 622Mb/s
Displaysand
Modalities
Displaysand
Modalities
Displaysand
Modalities
FIGURE 14.20
Complex PACS network.
DRE14 11/16/2005 9:47 AM Page 297
fiber to the core switch A in Figure 14.20. Modalities and displays can beconnected to either the closet switch closest to them or to the core switch,if it is closer. We chose this design in our example because the archive serverwas centrally located to all of them, thus cutting down on wiring costs.
As for the actual connections between the core switch A and the closetswitches B, we have a number of technologies. Again, your PACS vendormay have preferences. In this case, we chose Gigabit Ethernet for the con-nections (uplinks) between the core and closet switches (2 in Figure 14.20).You may notice that we include 2 fiber-optic uplinks from the closets to thecore switch. This allows greater reliability in the event that 1 of the pairs offiber-optic connections experiences a failure, or if the fiber-optic connectionon either the core switch or the closet fails.
Although not illustrated here, an even more resilient design wouldinclude 2 core switches A, with the archive server having a connection toboth core switches, and each closet switch having a connection to both coreswitches. This type of connection would create a somewhat more compli-cated design to troubleshoot in the event of a failure, and it would certainlycost more, but it provides a high level of redundancy (meaning cable failuresand hardware failures have less of an impact on the network) and ensures ahigh degree of availability of the archive server.
You also should notice a connection, 3, in Figure 14.20 to an edgerouter. This router acts just the same as the router in our previous PACSdesign, except that multiple sites of varying speed connect to it. In thecurrent example, we are connecting to a remote site (4) using xDSL at 144Kb/s. This speed is too slow for sending or retrieving compressedimages, but fast enough for a remote site that needs only to view compressedimages. The site connected with the DS3 (5) acts just like the site in the pre-vious network example (Figure 14.19).
The site with the DS3 connection can communicate back to our mainnetwork at 45Mb/s. This allows ample bandwidth for the large remote siteto host a few modalities and display computers, although at a premium interms of price. If bandwidth becomes an issue over this link we could upgradeto an OC3 connection providing 155Mb/s, but the cost would be great.
Finally, 8 in Figure 14.20 shows a router that is providing connectiv-ity to the rest of the hospital network, including its clinical systems. Notethat this is the only router we are using on the LAN, and that in none ofour previous examples did we include a router, as it can slow down per-formance in moving large images. However, in interfacing with the rest ofa hospital network, a router should provide an efficient way of allowing usto move patient information between the 2 networks, as well as allowing cli-
PACS: A Guide to the Digi tal Revolut ion298
DRE14 11/16/2005 9:47 AM Page 298

nicians to view compressed images throughout the hospital on lower-pricedworkstations.
FUTURE TRENDS
The networking industry as a whole experiences changes at an extremelyrapid pace. The rate of change is dizzying. There are several changes in theindustry that will affect how PACS is implemented in the near future.
GIGABIT ETHERNET
Gigabit Ethernet has gained acceptance. Now Gigabit Ethernet is offeredby nearly all vendors at reasonable prices. For the first time on the LAN,the ability for the network to provide inexpensive bandwidth has outpacedthe computer’s ability to transmit data. This means that since it is difficultfor a Sparc workstation to transmit much more than 200Mb/s, a GigabitEthernet connection offers plenty of bandwidth. Before Gigabit Ethernet,only expensive OC-12 ATM could make such a promise, while most work-stations could saturate a 100Mb/s Ethernet pipe. Of course, as computersget faster, their ability to transmit data will also increase. At this point,however, Gigabit Ethernet provides a lot of room for growth. Even so, it ispossible for computers to collectively saturate Gigabit Ethernet backbonesand connections, so careful network design is still required. Further, thereare groups currently working on terabit Ethernet speed solutions.
RESOURCE RESERVATION PROTOCOL
Earlier, when explaining the advantages of ATM, we said that ATM had theability to distinguish between different traffic types, thus allowing it to effi-ciently pass video and voice traffic while still moving e-mail along at a rea-sonable rate. Ethernet vendors, not wanting to be left in the dust, recognizedthis distinguishing capability as an important feature and have been workingtoward implementing some of those features into the Ethernet architecture.Called RSVP (resource reservation protocol), this feature will give Ethernetsome ATM-like capabilities by allowing it to offer a lesser degree of QoS(almost a poor man’s QoS). When combined with the brute force of GigabitEthernet, it offers a challenge to the future of the more elegant ATM in theLAN environment.
NETWORKING FUNDAMENTALS 299
DRE14 11/16/2005 9:47 AM Page 299
LAYER 3 SWITCHING
As detailed at length earlier in this chapter, switching occurs at the ISOmodel layer 2 and routing occurs at layer 3. The lines are becoming blurred,however, as vendors seek to offer the speed and flexibility of switching andthe intelligence and efficiency of routing. Vendors are calling this layer 3switching, although different vendors have widely varying ideas of how toimplement it and what it means. In effect, layer 3 switching should combinethe best of both worlds to such an extent that the idea of using the corridorin the conference room model will no longer be seen as an impediment to fast, efficient communication between different segments. In a largenetwork, where PACS seeks to peacefully coexist with any number of appli-cations, layer 3 switching offers potentially dramatic benefits by getting largeimages and studies out to a vast clientele.
VIRTUAL PRIVATE NETWORKS
Virtual private networks, or VPNs, have constituted a major buzzword inthe industry. The goal of this technology is to make the Internet a safemedium for the secure transfer of private information, such as clinical dataor images. It does this by encrypting the information at the source anddecrypting it at the destination. In doing so a private virtual network is setup over the public, unsecure Internet. There is hope that companies can usethis technology to decrease costs by using the Internet to exchange infor-mation that they normally would be able to share only over private circuitsleased from RBOCs, thus saving money. This is also an ideal technology touse for remote access to the corporate network for home users or in virtualoffice environments. In the near future, as this technology matures andvendors are able to produce scalable solutions, VPNs will make a greatimpact on how the Internet is used.
LOWER COSTS
Competitiveness among vendors also means lower costs in the networkingindustry, just as in the computer industry. In the first year that Gigabit Ethernet became available, prices dropped nearly in half. The price of NICscontinues to drop, as well as the price of routers and switches. On the WANfront, RBOCs are seeing increasing competition from one another, fromcable providers, and from other third-party providers who are seeking to take
PACS: A Guide to the Digi tal Revolut ion300
DRE14 11/16/2005 9:47 AM Page 300

advantage of the tremendous hunger for bandwidth on the WAN. The costand speed of the connection to the home or remote office, often called the“last mile,” is quickly reaching attractive price points for many applications,especially PACS. RBOCs will be forced to lower prices of T1s and T3s asnew technologies such as cable modems, xDSL, and wireless become morecommon. Similarly, use of the Internet and technologies such as VPN willalso allow for significant price reductions for remote access.
NETWORKING FUNDAMENTALS 301
DRE14 11/16/2005 9:47 AM Page 301

SERVERS ANDOPERATINGSYSTEMS
KENNETH M. NESBITT • THOMAS J. SCHULTZ • ROBERTO DASILVA
Sometimes policies and procedures for all areas of system (picture archiv-ing and communication system [PACS]) operations are overlooked, or it
is assumed that the PACS vendor will provide them. Although every vendorprovides a standard build document, it usually lacks procedures for contin-gencies such as server deployment, maintenance, change management, virusprevention and recovery, and server recovery from hardware and softwarefailures. Therefore, it is important that the institution understand the avail-able technologies and, jointly with the selected PACS provider, develop aPACS server strategy that reflects the goals of the institution. This chapterhas 3 sections that discuss technologies and issues to consider during thedeployment process: “The PACS Core (Servers),” “Operating System Secu-rity and Policies,” and “Viruses, Trojans, and Worms.”
15CHAPTER
DRE15 11/16/2005 9:48 AM Page 303

THE PACS CORE (SERVERS)
There are numerous server deployment scenarios from which to choose.Most strategies are based on one or more of the following techniques: singleserver, multiserver, load balancing, and server clustering.
SINGLE SERVER
The single server model consists of one server handling all PACS functions.These functions include the importation of exams from DICOM modalities,the processing of the database requests, and the processing of image distri-bution requests from the radiologists’ interpretation workstations. Work-stations can access exams via standard Web protocols (the same Webprotocols used to book your vacation on the Internet) or through a propri-etary application program interface (API) built into the PACS vendor’s soft-ware. The single server scenario is often ideal for an imaging center or small community hospital where the size and volume of exams are relatively small. Thus, the need for additional servers to provide the distributed proces-sor power, memory, and hard disk space is not as great as it would be in alarger hospital, where higher volumes and exam sizes necessitate moreresources. Figure 15.1 illustrates a single server model for PACS using Webtechnology as a means of distribution, with a backup server waiting in thewings.
MULTISERVER
In a multiserver model, a separate server is responsible for each componentof the PACS. One server handles DICOM importing, another server main-tains the database, and one handles image distribution requests. This designaffords the luxury of having processor power, memory, and hard disk spacededicated to each PACS component on an individual basis rather than havingthe components competing for the resources of one server. For example, thisproves useful in institutions where large exam sizes and the number of studiesperformed can cause the database to grow to considerable size (200 giga-bytes [GB] or more). Figure 15.2 shows a multiserver model for PACS usingWeb technology as a means of image distribution. All requests for informa-tion or images are funneled through the Web server. The Web server actslike a traffic cop, directing information requests to the proper servers. Imagerequests are serviced from the archive(s), and textual requests are servicedthrough the database.
PACS: A Guide to the Digi tal Revolut ion304
DRE15 11/16/2005 9:48 AM Page 304
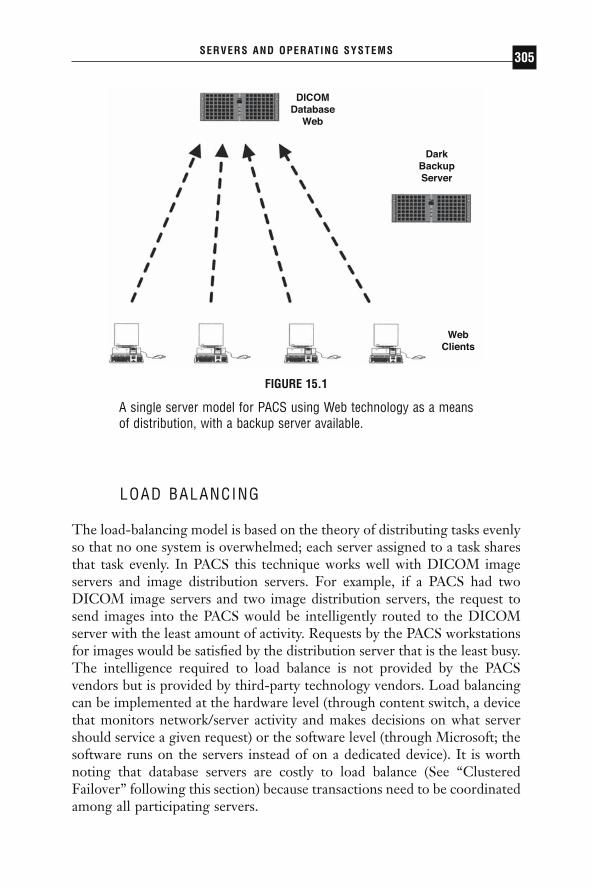
LOAD BALANCING
The load-balancing model is based on the theory of distributing tasks evenlyso that no one system is overwhelmed; each server assigned to a task sharesthat task evenly. In PACS this technique works well with DICOM imageservers and image distribution servers. For example, if a PACS had twoDICOM image servers and two image distribution servers, the request tosend images into the PACS would be intelligently routed to the DICOMserver with the least amount of activity. Requests by the PACS workstationsfor images would be satisfied by the distribution server that is the least busy.The intelligence required to load balance is not provided by the PACSvendors but is provided by third-party technology vendors. Load balancingcan be implemented at the hardware level (through content switch, a devicethat monitors network/server activity and makes decisions on what servershould service a given request) or the software level (through Microsoft; thesoftware runs on the servers instead of on a dedicated device). It is worthnoting that database servers are costly to load balance (See “ClusteredFailover” following this section) because transactions need to be coordinatedamong all participating servers.
SERVERS AND OPERATING SYSTEMS 305
FIGURE 15.1
A single server model for PACS using Web technology as a meansof distribution, with a backup server available.
WebClients
DICOMDatabase
Web
DarkBackupServer
DRE15 11/16/2005 9:48 AM Page 305

Figure 15.3 illustrates a typical load-balancing model for PACS, usingthe Web as a means of image distribution. Following the diagram, bothDICOM image servers forward their respective information to the databaseserver, while each Web server makes respective calls to the database serverto fulfill the client requests.
PACS: A Guide to the Digi tal Revolut ion306
DICOM Images
Database
Web
DarkBackupServer
WebClients
FIGURE 15.2
A multiserver model for PACS using Web technology for image dis-tribution. All requests for information or images are funneledthrough the Web server, which directs information requests to theproper servers.
DRE15 11/16/2005 9:48 AM Page 306

CLUSTERED FAILOVER
The clustered failover model provides a high level of hardware redundancyprotection for PACS servers (this approach is often referred to as active-passive clustering). Clustered failover means that one server controls the taskbeing performed while the second server passively waits for the first one tofail. In this model, the DICOM image servers are clustered together in pairs,as are the image distribution servers, providing simple failover redundancy.
SERVERS AND OPERATING SYSTEMS 307
Image and Web Servers each handle onehalf of the traffic.
Image Servers
DatabaseServer
DarkBackupServers
WebServer
Web Clients
FIGURE 15.3
A typical load-balancing model for PACS, using the Web as a meansof image distribution. Both DICOM image servers forward theirinformation to the database server, while each Web server makescalls to the database server to fulfill the client requests.
DRE15 11/16/2005 9:48 AM Page 307

The failover between servers is managed through software, either with anenterprise-class operating system such as UNIX/Solaris, Windows 2000Advanced Server, or Windows Server 03 Enterprise edition, or through commercially available cross-platform products such as Veritas. A caveat ofthis approach is that if the PACS software caused the failure of the first server,the second server will also fail because it is running the same software as thefirst.
It is also possible to combine techniques (often called active-active clustering). For example, if the database (IBM DB2, Oracle, or MicrosoftSQL Server) were clustered and load balanced, then during normal opera-tions all data requests would be evenly distributed between both physicalservers. If one failed, all operations would be funneled to the remainingserver. Figure 15.4 shows a clustered failover (load-balanced) model forPACS using Windows 2000 Advanced Server as the operating system. This
PACS: A Guide to the Digi tal Revolut ion308
Web Clients
WebServers
DatabaseServer
BackupDatabase
Server
DarkBackupServers
ImageServers
Failover Link
DatabaseCopy
Failover Link
FIGURE 15.4
A clustered failover (load-balanced) model for PACS; Windows 2000Advanced Server is the operating system.
DRE15 11/16/2005 9:48 AM Page 308
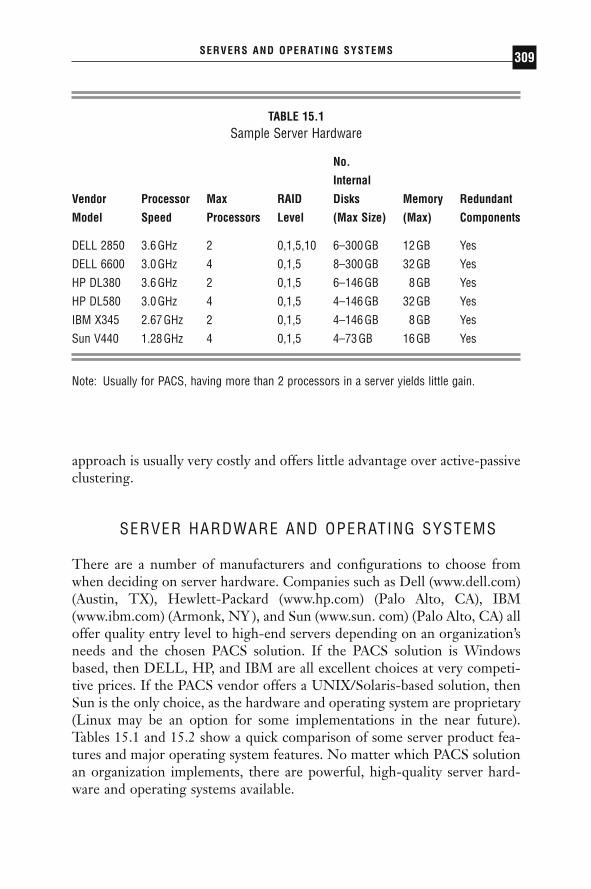
approach is usually very costly and offers little advantage over active-passiveclustering.
SERVER HARDWARE AND OPERATING SYSTEMS
There are a number of manufacturers and configurations to choose fromwhen deciding on server hardware. Companies such as Dell (www.dell.com)(Austin, TX), Hewlett-Packard (www.hp.com) (Palo Alto, CA), IBM(www.ibm.com) (Armonk, NY ), and Sun (www.sun. com) (Palo Alto, CA) alloffer quality entry level to high-end servers depending on an organization’sneeds and the chosen PACS solution. If the PACS solution is Windowsbased, then DELL, HP, and IBM are all excellent choices at very competi-tive prices. If the PACS vendor offers a UNIX/Solaris-based solution, thenSun is the only choice, as the hardware and operating system are proprietary(Linux may be an option for some implementations in the near future).Tables 15.1 and 15.2 show a quick comparison of some server product fea-tures and major operating system features. No matter which PACS solutionan organization implements, there are powerful, high-quality server hard-ware and operating systems available.
SERVERS AND OPERATING SYSTEMS 309
TABLE 15.1Sample Server Hardware
No.
Internal
Vendor Processor Max RAID Disks Memory Redundant
Model Speed Processors Level (Max Size) (Max) Components
DELL 2850 3.6GHz 2 0,1,5,10 6–300GB 12GB Yes
DELL 6600 3.0GHz 4 0,1,5 8–300GB 32GB Yes
HP DL380 3.6GHz 2 0,1,5 6–146GB 8GB Yes
HP DL580 3.0GHz 4 0,1,5 4–146GB 32GB Yes
IBM X345 2.67GHz 2 0,1,5 4–146GB 8GB Yes
Sun V440 1.28GHz 4 0,1,5 4–73GB 16GB Yes
Note: Usually for PACS, having more than 2 processors in a server yields little gain.
DRE15 11/16/2005 9:48 AM Page 309

DISASTER RECOVERY
Disaster recovery (DR) planning is equally important as choosing the rightPACS solution. Without thorough and concise planning, an institution mayfind itself severely impacted if a major failure occurs on one of the PACScore components. System downtime could be counted in weeks if properstrategies are not developed. This section discusses different aspects of DR,such as uninterruptible power supply (UPS) and emergency power, serveroperating system (OS) imaging, archiving, and database backups.
UNINTERRUPTIBLE POWER SUPPLY
Having a UPS and emergency power installed in the room where the PACSservers will be housed is critical to surviving anything from power blips tocomplete power outages. An enterprise-class UPS consists of several largebatteries, built-in power filtering, and system-monitoring capabilities. The ideal UPS will provide enough battery power to allow servers to shutdown gracefully in the event of primary power failure. Companies such asMGE (www.mge.com) (Saint Ismier, France) and APC (www.apc.com) (W. Kingston, RI) offer entry level to enterprise-class UPSs capable ofaccommodating any PACS scenario.
Most hospitals and trauma centers supply backup emergency power tokey areas such as the emergency ward and intensive care units. Upon theinstallation of PACS, it is advisable to have the PACS servers integrated intothe same emergency backup power system. Emergency power can keep PACS
PACS: A Guide to the Digi tal Revolut ion310
TABLE 15.2Sample Server Operating Systems
Supported Supported ClusterOS Processors Memory Capable
Windows 2000 Server 4 8GB NoWindows 2000 Enterprise 8 32GB YesWindows 2003 Server 4 8GB NoWindows 2003 Enterprise 8 32GB YesLinux 64 64GB YesSolaris 64 64GB Yes
DRE15 11/16/2005 9:48 AM Page 310

servers operational through power failures and enable an organization to con-tinue operating until normal power has been restored. The role of a UPS inthis scenario is to provide enough power to bridge the gap between the initialpower failure and the institution’s switch over to the backup power system.
OPERATING SYSTEM IMAGING
Server OS imaging involves using third-party software to take a snapshot(state in time) or image of the OS volume (or any volume) that encompassesall the applications and server patches installed. Images of other volumes, suchas the database or log volumes, may also be acquired. By implementing a strat-egy of making OS images of servers before making changes such as installingsecurity patches, tweaking performance, or upgrading applications, extensivedowntime can be avoided. If a system change causes issues, it can take less than20 minutes to reset the affected server back to the last known running state.(Consider the peace of mind provided by knowing that it will only take 20minutes to restore a server to a known working state after a virus attack.) Thisis significantly faster than having to go through the process of reinstalling the OS and other applications, then possibly having to re-create the databasefrom tape backups and database log files. Two vendors of server-imaging software are Acronis (www.acronis.com) (Herndon, VA) and Powerquest(www.powerquest.com) (Orem, UT). Both offer excellent products to helpprotect your server environment and reduce the time required to recover froma disaster. Both products offer the capability to restore system images fromremote network locations (NAS) or from CD or DVD.
REMOVABLE MEDIA
Archiving to removable media provides the institution with the option ofstoring the removed media in a secure offline location. (Storage devices arecovered in detail in Chapter 16.) There are many choices for removable media,such as CD, DVD, DLT (digital linear tape, proprietary technology devel-oped by Quantum), Super DLT 1, Super DLT 2, LTO (linear tape open) 1,LTO 2, and the recently released LTO 3. For smaller institutions, a DVDarchive would probably suffice. With DVD media capable of writing to bothsides, the ability to store 9.4GB on one disc is appealing, and the new 25GBDVD release is imminent. One company that offers this solution is DAXArchiving Solutions (www.daxarchiving.com) (The Netherlands). The DLTsolution has been around for a while and is still a viable option for most
SERVERS AND OPERATING SYSTEMS 311
DRE15 11/16/2005 9:48 AM Page 311

institutions. It provides up to 80GB of storage using data compression. SuperDLT 1 takes things up a notch with capacities of 160GB raw and 320GB com-pressed. Super DLT 2 goes even further, with capacities of 300GB raw and600GB compressed. Linear tape open is an open standards–based technologysupported by companies such as Hewlett Packard, IBM, and Seagate (ScottsValley, CA). Linear tape open 1 tapes can store 100GB raw and 200GB compressed. The second-generation LTO 2 drives can store 200GB raw and400GB compressed. Linear tape open 3 became available in the fourth quarterof 2004 and offers capacities of 400GB raw and 800GB compressed. Twocompanies that offer complete DLT and LTO solutions are Storage(www.storagetek.com) (Louisville, CO) and IBM (www.ibm.com).
DATABASE BACKUPS
Database backups are an essential of everyday life in the world of PACS.They are a vital piece of the DR puzzle that must be completed to ensure aminimal loss of data (PACS and server configurations) in the event of a sub-stantial failure or environmental disaster. In conjunction with server imaging,the database backup can be used to restore the database to a state that wouldbe less than 24 hours old. It is highly recommended that database backupsbe performed regularly (every 24 hours). Occasionally restoring a backup toa test system to ensure the integrity of the backup is good idea. Backing upto a high-density tape such as Super DLT or LTO enables retaining manydays’ worth of backups, which is useful in the event a single backup copy isbad. It is important to be cognizant of the fact that database corruption orhardware failure can occur at any time, so keep several backups to preventmajor headaches.
OPERATING SYSTEM SECURITY AND POLICIES
To maintain a secure network environment and ensure system functionality,it is crucial that server security policies be clearly developed and outlined.The following is a general outline of recommended server policies.
OPERATING SYSTEM PATCHES
Operating systems (defined as the first program that runs when a computeris turned on; this program manages all other programs, including applica-
PACS: A Guide to the Digi tal Revolut ion312
DRE15 11/16/2005 9:48 AM Page 312
tions such as e-mail or PACS) all have flaws or bugs. The OS provider con-tinually offers updates (patches) to fix problems that can cause crashes or toseal security flaws to protect the server from hackers. It is very important toroutinely and diligently monitor the OS provider’s Web site for availablepatches. Usually a security hole is discovered and fixed before hackers cantake advantage of the flaw. How? Hackers reverse engineer a security patchto learn of the OS flaw and then create malicious programs (viruses) toexploit the flaw. Their intention is to affect systems that are not patched(protected from the flaw).
VIRUS PROTECTION
Operating system patches are the first line of defense against malicious(virus) software (see “Viruses, Trojans, and Worms” in the next section). Thesecond line of defense is a genre of software (obviously named) antivirus.Antivirus software runs on each server and workstation and continually mon-itors files and running programs for signature behaviors. The antivirus soft-ware provider continually researches the Web and other sources for virussightings. Once a new virus is discovered, it is then studied and reverse engi-neered to determine what security flaws it takes advantage of, how it repli-cates itself, and whatever else it tries to do (e.g., steal data, clog the network).Once the virus is understood, this information is electronically sent to allcustomers subscribing to the antivirus provider’s service. The updated infor-mation is often called “virus signatures.” Once the antivirus software isupdated with the new signatures, it will then scan the server to determinewhether it has been compromised. If it has been, the antivirus software will remove the virus, cleansing the system. Sometimes the system is soseverely compromised that it cannot be repaired. In this scenario the systemwill need to be rebuilt from a known clean OS image or by reinstalling the OS and applications. Providers of antivirus software include McAfee(www.mcafee.com) and Norton (www.symantec.com).
PASSWORDS
Servers should have individual user accounts and fairly complicated pass-words to prevent a security breach by a hacker. Most hackers will write asimple algorithm looking for easy access through weak passwords or, betteryet, no password at all. Examples of weak passwords are “123” or “abc.”
SERVERS AND OPERATING SYSTEMS 313
DRE15 11/16/2005 9:48 AM Page 313

PASSWORD CONSTRUCTION GUIDELINES
◗ Include both upper- and lowercase characters (e.g., a–z, A–Z).◗ Have digits and punctuation characters as well as letters (e.g., 0–9,
!@#$%Ÿ&*()_+|~-=\`{}[]:≤;¢·Ò?,./).◗ Have at least 8 alphanumeric characters.
LIMIT THE NUMBER OF UNNECESSARY ACCOUNTS
Avoid creating duplicate user accounts, test accounts, shared accounts,general department accounts, and the like. Use group policies to assign per-missions as needed, and audit your accounts regularly.
NO UNENCRYPTED AUTHENTICATION
It is advisable that user authentication (logging in) be encrypted (an encod-ing that makes a password difficult to reverse engineer). For example: “baby”could be encoded to “%%$FFDFDR” during transmission over thenetwork, but when the server receives the login data it converts it back to“baby.” This is important to consider because hackers have tools that allowthem to monitor network traffic and snatch passwords that are transmittedin clear text (“baby”).
NO UNAUTHORIZED E-MAIL DELIVERIES
All operating systems have the ability to send mail messages to other servers.Malicious code (viruses) has the ability to leverage this process and causehavoc throughout the institution (spam and other mail-clogging problems).To help avoid this situation, it is advisable to turn off the SMTP (simple mailtransfer protocol) program unless it is absolutely needed.
PHYSICAL SECURITY
All servers and related equipment should be located in a secure room withlimited access to only those individuals supporting the system. This is an
PACS: A Guide to the Digi tal Revolut ion314
DRE15 11/16/2005 9:48 AM Page 314
obvious security measure to take, but many institutions have had issues withmissing/modified equipment due to poor access polices.
SECURE BACKUP MEDIA
All backups and emergency repair disks should be kept in a secure, fireprooflocation in a building other than the one where the server resides.
SECURITY GUIDELINES FOR WINDOWS (NT, 2000, 2003, AND XP)
Following are basic guidelines unique to Windows-based systems.
ADMINISTRATOR ACCOUNTS
The administrator account in Windows grants the highest level of access.Any system change can be performed with this account. Therefore, theadministrator account (in domains, the domain administrator) should berestricted to senior members of the information technology (IT) staff. Each IT staff member requiring administrative privileges should have his or her own account created and placed within the administrator’s group. This will allow for clear tracking of who is doing what and when. For situ-ations in which IT staff require fewer privileges, such as reading e-mail, asecond account should be created with a lower level of access. Following this practice will prevent accidental changes from being made to criticalsystems.
REPLACE THE “EVERYONE” GROUP WITH “AUTHENTICATED USERS” ON FILE SHARES
“Everyone” in the context of Windows security means that anyone who hasaccess to your server can access the data contained within those shares. The“Everyone” group is assigned by default when a share is created and thusshould be replaced with the “Authenticated Users” group.
PASSWORD PROTECT THE SCREENSAVER
A simple method of preventing access to a system in an unsecured locationis to password protect the screensaver. This is a basic feature built into allWindows operating systems. For details, visit www.microsoft.com.
SERVERS AND OPERATING SYSTEMS 315
DRE15 11/16/2005 9:48 AM Page 315

USE NEW TECHNOLOGY FILE SYSTEM ON ALL PARTITIONS
New technology file system (NTFS) is the only file system type that imple-ments strong security and encryption features. It also contains autocorrec-tion capabilities when corruption occurs. For these and other reasons, it isrecommended that this file system be implemented for most applications.Visit www.microsoft.com for more information.
RUN WINDOWS UPDATE
Microsoft provides a mechanism for automatic notification and installationof critical OS patches. It is strongly recommended that you take advantageof this service. On servers it is usually the best practice to set the service todownload all patches automatically, but to install them manually. Thisapproach allows for review of how the patch will affect the PACS applica-tions. It is possible that some patches may prevent PACS from running correctly.
DISABLE THE DEFAULT SHARES
Windows NT, Windows 2000, Windows Server 03, and Windows XP openhidden shares on each installation for use by the system account. You candisable the default administrative shares in two ways. One is to stop or disablethe server service, which removes the ability to share folders on the server.The other way is by editing the registry (see www.microsoft.com for details).Keep in mind that disabling these shares provides an extra measure of secu-rity but may cause problems with applications. Test your changes in a labbefore disabling these shares in a production environment.
VIRUSES, TROJANS, AND WORMS
More than 30 new viruses appear every day, and the roster of active virusesincreases by more than 10,000 per year.
DEFINITION OF A VIRUS
A virus is defined as a piece of code that replicates by attaching itself toanother object, usually without the user’s knowledge or permission. Viruses
PACS: A Guide to the Digi tal Revolut ion316
DRE15 11/16/2005 9:48 AM Page 316

can infect program files, documents, or low-level disk and file-system structures such as the boot sector and partition table. Viruses can run whenan infected program file runs and can also reside in memory and infect files as the user opens, saves, or creates the files. When a computer virusinfects a computer running Windows, it can change values in the registry,replace system files, and take over e-mail programs in its attempt to repli-cate itself.
DEFINITION OF A WORM
Worms are a type of virus that replicate by copying themselves from onecomputer to another, usually over a network. The general goal of a worm isto replicate itself to as many systems as possible. Often the worm acts as atransport mechanism for delivering yet another virus.
DEFINITION OF A TROJAN HORSE
A Trojan horse is a virus that masquerades as a useful program. Sometimesit actually performs a useful purpose, but behind the scenes it releases a virus.A Trojan horse program can come from an e-mail attachment or a down-load from a Web site, usually disguised as a joke program or a software utilityof some sort.
EDUCATION AND TRAINING
The operations and IT team should work together to develop a sound edu-cation and training program for the PACS users. The more users understandabout passwords, viruses, and safe computing, the less likely it is that theywill be the ones to allow a compromise of the PACS system.
GLOSSARY
CORE The central foundation of the PACS, consisting of one or moreservers.
SERVER Powerful, robust computers that possess multiple-gigahertz-speedprocessors, several gigabytes of memory, and several gigabytes of hard-drivespace (RAID).
SERVERS AND OPERATING SYSTEMS 317
DRE15 11/16/2005 9:48 AM Page 317
PROCESSOR The component of a server that does most of the data processing.
MEMORY The component of a server that assists the processor with dataprocessing and preserves data for retrieval.
HARD DRIVE The component of a server that holds and spins a magneticdisk and reads/writes information on it. It is also referred to as a hard disk.
GIGABYTE (GB) A unit of computer memory or hard drive capacity equalto 1,024 megabytes.
GIGAHERTZ (GHZ) A unit of frequency used to measure modern processorclock speed. One GHz is equal to 1 billion clock cycles per second.
SYSTEM ARCHITECTURE Deployment scenario/server model: the topologyof the CORE systems, workstations, and archive, meaning the number ofservers used and their respective roles.
PRIMARY SERVER The server that performs most or all of the PACS func-tions on a regular basis.
BACKUP SERVER A server that is attached to the network and configuredto deploy in the event of a failure or virus attack on the primary server.
DARK SERVER A server that is detached from the network to prevent infec-tion from virus attacks. This provides a preconfigured, virus-free server todeploy in the event that the primary server requires downtime for repairs.
PACS: A Guide to the Digi tal Revolut ion318
DRE15 11/16/2005 9:48 AM Page 318
STORAGE ANDENTERPRISEARCHIVING
PAUL G. NAGY • THOMAS J. SCHULTZ
Astudy conducted at the Berkeley School of Information Management andSystems concluded that the world generated more than 5 exabytes (5
billion gigabytes [GB]) of recorded information in 2002. This represents a30% growth per year for the past 5 years. More information has been gen-erated in the past 3 years alone than in the previous 40,000 years of civi-lization combined. The entire printed Library of Congress holds 17 millionbooks, or 136 terabytes (TB) of data.
Hospitals have seen a parallel data explosion, especially in the imagingmodalities. A single 2000-slice computed tomography (CT) procedure cap-tures 1GB of information. Advances in molecular imaging, multispectralimaging, and physiologic imaging suggest that the rate of growth in storagerequirements will only accelerate in the future. We have clearly entered theera of information overload, and our success now depends on how well wecan capture, retrieve, and synthesize this avalanche of information.
16CHAPTER
DRE16 11/16/2005 9:51 AM Page 319

The storage industry has been providing innovations at a breakneckpace to attempt to manage this data deluge. Expanding storage and the esca-lating pace of capacity and performance are among the true marvels of thecomputer age. Historians like to study the storage industry in particularbecause it is somewhat like studying the evolution of fruit flies, with com-panies innovating and the market reforming itself every few years to con-stantly embrace disruptive changes. Gordon Moore, the cofounder of Intel,predicted in 1965 that the number of transistors on a microprocessor wouldcontinue to double every 18 months for the same cost. Now known asMoore’s law, this observation applies not only to microprocessors but toalmost every facet of computing, especially storage. Over the last 50 years,the storage areal density (number of bits that can be squeezed into 1 squareinch) has increased by a factor of 17 million at the same time that the vocab-ulary of storage terminology has expanded to accommodate previouslyundreamed of capacities (Table 16.1). Widespread agreement on the accu-racy of Moore’s law has led to an entirely new philosophy of equipmentbuying: if everything will be better and cheaper next year, then buy only whatyou need and make sure your system is designed to incorporate new tech-nology that has not yet been invented.
Archiving technology is described as either online, near-line, or offline.Hard drives are online technology, because they are instantly accessible ona moment’s notice. Tape and optical media are considered near-line because
PACS: A Guide to the Digi tal Revolut ion320
TABLE 16.1Storage Terminology: Powers of 10
Kilo 103 1 kilobyte (KB) = 1000 bytesMega 106 1 megabyte (MB) = 1000KBGiga 109 1 gigabyte (GB) = 1000MBTera 1012 1 terabyte (TB) = 1000GBPeta 1015 1 petabyte (PB) = 1000TBExa 1018 1 exabyte (EB) = 1000PBZetta 1021 1 zettabyte (ZB) = 1000EBYotta 1024 1 yotta (YB) = 1000ZBGoogle 10100
DRE16 11/16/2005 9:51 AM Page 320

they may need to be automatically retrieved from a robotic jukebox andmounted before being accessible. This generally takes 10 to 30 seconds ifdrives are available in the jukebox.
Offline storage requires manual intervention to load the media off ashelf and into the reader. As storage technology is becoming dramaticallyless expensive, offline storage should be discouraged. The true cost of offlinestorage is higher than most users perceive, because it includes the delay intime to retrieve data, the operator’s time, and, most important, the muchhigher probability of losing data by mislabeling, misplacing, or damaging themedia through improper storage.
HARD DRIVES
The hard drive was invented at the research laboratories of IBM in 1952.The random access method of accounting control (RAMAC) stored its datain 50 stacked, 2-ft-wide aluminum platters. The platters rotated at 1200 rev-olutions per minute (rpm), and the system weighed more than 1 ton. At thetime, RAMAC was considered a marvel because it could hold 5 megabytes(MB) of data—the storage equivalent of 50,000 punch cards.
DRIVE MECHANICS
A hard drive consists of cylindrical platters, with thousands of single-bit-widetracks of data (Figure 16.1). The surface of the platter is layered with a fer-romagnetic material and polished so that the surface is extremely uniform.To read information off the surface of the hard drive, an electromagnet on a moving arm skims the surface of the platter at a height of less than 0.10mm. When the head is in read mode, it will induce a current on thehead from the magnetic surface of the hard drive and thus be able to readinformation. When the hard drive is writing to the disk, the head is ener-gized and changes the polarity of the magnetic surface of the platter. Whenthe ferromagnetic material is exposed to an external field, it is permanentlymagnetized.
The hard drive surface is broken into rings, also known as tracks. Eachtrack on the hard drive is broken into sectors. A platter can have upwards of 30,000 tracks and between 100 and 500 sectors per track. When a com-puter requests a file from the hard drive, the file is indexed by the track andsectors in which it is located. Sectors can be of various sizes, but, for large
STORAGE AND ENTERPRISE ARCHIVING 321
DRE16 11/16/2005 9:51 AM Page 321

file applications like a picture archiving and communications system (PACS),a typical sector size is 64 kilobytes (KB). The hard drive spins the platterunderneath the head and rotates at a rate of 5400rpm for relatively slowdrives and up to 15,000rpm for high-speed drives. The two key perform-ance metrics for hard drives are defined as the seek time and the data trans-fer rate.
The seek time is the time that it takes to access the beginning piece ofdata requested. On average, this is the time it takes for half of a rotation toposition the sector requested underneath the head (a lag known as rotationallatency). This is dependent on the speed at which the hard drive is spinning.For a 5400-rpm hard drive, the access time would be calculated as:
For a 15,000-rpm hard drive, the access time is significantly reduced:
A high-speed hard drive is ideal for applications such as databases and e-mailservers that can process more than 300 in-and-out requests per second from
115 000
0 5 2 0 minute
rotations rotation milliseconds
,. .¥ =
15400
0 5 5 6 minute rotations
rotation milliseconds¥ =. .
PACS: A Guide to the Digi tal Revolut ion322
Anatomy of a Hard Drive(Spinning Disk)
Platters
Side View
ActuratorArm
Top-downView
MagneticHead
Sectors
Tracks
FIGURE 16.1
Terminology and internal mechanisms of a hard drive.
DRE16 11/16/2005 9:51 AM Page 322
a storage system. For storing large image files, however, it is arguable that ahigh overall transfer and throughput rate is more important than saving afew milliseconds on access time.
Data transfer rate is not quite as simple to calculate because it isdependent on the geometry of the hard drive and the location of the data.Data transfer rates are twice as great around the outer radius of hard drivesbecause the circumference at the outer radius is twice that of the tracksaround the inner radius. On average, high-rpm drives transfer data at 40 to60MB per second, and slower-rpm drives transfer data at 25 to 40MB persecond.
The highest-capacity hard drive released to date is the 400-GB harddrive by Hitachi (Tokyo, Japan). The 400-GB hard drive has 5 platters and10 heads that read both sides of the platters. The Hitachi drive rotates at7200rpm, has an access time of 8.5 milliseconds, and is rated at an averagetransfer rate of 45MB per second.
DISK ARRAYS AND INTERFACES
Hard drive performance is often limited by the way in which the drive isconnected to the computer. The hard drive is defined by this connector,called the interface. Many types of interfaces are available, but the principalones for enterprise storage applications are serial ATA, small computersystem interface (SCSI), and Fibre Channel. Parallel ATA, or AT attached,was originally named for the IBM AT computer and is the most commontype of hard drive in the commercial PC market.
Serial ATA is an evolved version of parallel ATA that provides enter-prise performance and reliability at commercial pricing. ATA drives areincluded in the majority of the PC market, with a volume of 10 times thatof SCSI, which allows them a much lower cost per gigabyte of storage.
SCSI has historically been the hard drive style of choice for enterpriseapplications. Multiple hard drives can be daisy-chained off a single SCSI con-nection. Fibre Channel is an outgrowth of SCSI. In fact, it uses the sameSCSI command set but transports it over a serial connection, whereas SCSIuses a parallel bus. Fibre Channel is an unfortunate misnomer in that it is aprotocol and does not depend on fiber-optic connections at the physicallayer. Although Fibre Channel can be run over copper wire, it is usually runover fiber optics because of the extremely fast speed that optical switchingprovides. Fibre Channel hard drives have the fastest interface and are alsothe most expensive type of hard drive on the market. Table 16.2 summarizeshard drive interface performance.
STORAGE AND ENTERPRISE ARCHIVING 323
DRE16 11/16/2005 9:51 AM Page 323

RELIABILITY AND CALCULATING MEAN TIME TO FAILURE
Failure of computer components is a given and must be taken into accountwhen designing an archive. Computer components with moving parts, suchas the hard drive, have a higher probability of failure than solid-state com-ponents, such as the central processing unit and motherboard. Hard drivebearings can seize, heads can crash into platters, or the actuator arm can lockup. Most enterprise hard drives are rated with a mean life-to-failure of morethan 1 million hours of operation. This does not mean that the average harddrive will actually last for 1 million hours. This model assumes a 5-year lifes-pan that is covered in the warranty and that all drives are replaced every 5years. This is an important difference and means that a migration plan shouldbe in place to prevent going over the warranty. Over the 5 years (43,800
PACS: A Guide to the Digi tal Revolut ion324
TABLE 16.2Hard Drive Interface Performance
Interface Theoretical Performance (MB/s)
USB 1.0/1.1 1.5Ultra ATA/33 33IEEE 1394/Firewire 50USB 2.0 60Ultra ATA/66 66Ultra ATA/100 100Ultra ATA/133 133Serial ATA/150 150Ultra 160/SCSI 160Serial ATA II/300 300Ultra 320/SCSI 320Fibre Channel 400+
Source: Connolly C. Highpoint 1520 RocketRAID SerialATA/150 controller. Game PC. July 27, 2002. Availableat: www.gamepc.com/labs/view_content.asp?id=hpsataraid&page=2. Accessed September 15, 2004.
DRE16 11/16/2005 9:51 AM Page 324

hours) of warranty for the hard drive, there is a 4% failure rate. In otherwords, for every 22 hard drives running over the 5 years, expect at least 1hard drive to fail.
REDUNDANT ARRAY OF INEXPENSIVE DISKS
Redundant array of inexpensive disks (RAID) is one of the core concepts of implementing a high-performance, high-availability large storage solu-tion. RAID allows multiple hard drives to work in concert and appear to the computer as a single storage device. Several RAID configurations are available and provide different combinations of redundancy and per-formance characteristics. To orchestrate the hard drives, a RAID controlleris utilized between the hard drives and the computer. The RAID controlsthe hard drives directly and provides blocks of storage to the operatingsystem.
RAID 0, striping, splits data to 2 hard drives simultaneously. Thebenefit to striping is that the storage system can be twice as fast at readingand writing data because it utilizes 2 drives. The problem with striping,however, is that there is no data redundancy. If either drive fails, all data onboth drives are lost.
RAID 1, mirroring, copies the data to a shadow hard drive. RAID 1provides complete redundancy in the event that 1 of the hard drives fails butdoes not enjoy any performance benefits because the user is still reading froma single drive. The other challenge to RAID 1 is effectively the loss of thecapacity of the second drive.
RAID 10 is called a nested strategy and combines RAID 1 and RAID0 levels. Two hard drives are striped, and both of those hard drives have amirror copy in case of failure. This simple technique provides the perform-ance benefits of 2 drives while allowing for failure. The drawback of RAID10 is that half the storage is used making a backup of the data.
RAID 3 requires a minimum of 3 hard drives and is a combination ofstriping and a checksum. As data are split among multiple hard drives, achecksum, or parity bit, is calculated. If any of the drives fails, the informa-tion can be reconstructed onto a new hard drive from this checksum. RAID3 uses a fixed parity drive with synchronized disk rotation and calculateschecksums at the bit level. The challenge to parity drives is that the capac-ity of 1 drive is lost and that writing data to the disk array can be slowerbecause it is calculating the parity bit. The read speed from RAID 3 is quitefast because the data is striped over all the drives in the array.
RAID 4 is a variant of RAID 3. RAID 4 calculates the parity bit on adedicated drive at the block level instead of at the lower bit level. This
STORAGE AND ENTERPRISE ARCHIVING 325
DRE16 11/16/2005 9:51 AM Page 325

improves the random access performance of the disk array compared withRAID 3.
RAID 5 is a variant of RAID 4 that also calculates the parity at theblock level. However, RAID 5 does not use a dedicated drive to store the checksum but, instead, distributes the parity information among all the drives; this improves random access write performance. RAID 5 has rel-atively poor write performance but excellent read performance that matcheswell to the clinical requirements of PACS. Performance truly matters withPACS when a user selects a patient name on a list and wants instantly to readlarge image studies. PACS is considered a read-intensive application in thatevery study that is written to the system is read 5 to 10 times in its life-time for diagnosis, relevant priors, enterprise distribution, archiving, andmigration.
A new technique not yet in common use is RAID 6. RAID 6 is similarto RAID 5 but calculates 2 parity checks that allow the system to suffer any2 hard drive failures without compromise. The catch is the loss of capacityof 2 drives on the system.
In clinical practice, RAID 5 is the predominant technique for retain-ing medical images on storage arrays. RAID 5 is considered the ideal con-figuration for the PACS industry because it provides good performancethrough striping across multiple drives and at the same time provides redun-dancy and can survive losing the capacity of 1 drive in the array. With 1 driveout, however, the system must run in compromised condition in whichanother drive failure would result in the loss of the entire RAID array. Thatis why it is always good policy to have an extra hard drive sitting on a RAIDarray to act as a hot spare. During the event of a failed drive, the system willactivate the spare and start rebuilding the spare drive. The time it takes torebuild the spare hard drive and restore the RAID is called the mean timeto recovery (MTTR). This recovery rebuild rate is usually in the range of20 to 50GB/hour. For a 200 to 300GB drive, this exposed time could beseveral hours. A RAID 5 system is fully operational to external requestsduring the rebuild time, although its performance will be degraded becauseit is rebuilding a drive in the background. The probability of another failureduring the rebuild time is extremely remote. When a system seems to goagainst the odds by having more failures than are statistically probable, envi-ronmental issues, such as high internal temperature or excessive vibration inthe system rack, may be the cause. One common myth is that hard drivesand system components fail without any warning signs. A study performedin 1999 tracked the system log of 368 hard drives and showed 4 hard drivefailures over an 18-month period. The drives started warning the systembetween 5 and 186 hours before each failure, generating on average more
PACS: A Guide to the Digi tal Revolut ion326
DRE16 11/16/2005 9:51 AM Page 326

than 1000 messages. It is important to have a systems management tool inplace and adequately configured so that the administrator can be alerted tothe problem and be proactive in finding a solution.
The most common systems management tool is the simple networkmanagement protocol (SNMP). This protocol allows health informationabout a server to be communicated between systems to provide a holisticview of the status of the entire system. SNMP tools can track fans, harddrives, and power supplies for failure and can e-mail administrators in theevent of failure. These tools also can routinely monitor the temperature ofthese components, as well as the drawing power used. Limits can be set foridentifying impending problems. The Storage Management Initiative Spec-ification (SMI-S), an open standard developed by the Storage NetworkIndustry Association (SNIA), has been recently introduced. Whereas SNMPis developed around a passive mode for catching error messages, SMI-S isdesigned to be more active, allowing administrators to control and recon-figure enterprise storage devices.
ROLE OF THE FILE SYSTEM
Now that all your hard drives are sitting in a nice disk drive rack mountarray, how does the PACS application connect to and make use of them?Sitting between an application and the low-level block access storage systemlies the file system, as shown in Figure 16.2 The file or filing system is the
STORAGE AND ENTERPRISE ARCHIVING 327
FIGURE 16.2
File system.
DRE16 11/16/2005 9:51 AM Page 327

card catalog of a storage system and knows where files are stored and pres-ents a hierarchical view that helps users locate them. When searchingthrough the treelike structure of your file system in an application such asWindows Explorer, you are viewing the file system and not actually scan-ning through the entire hard drive. When you defragment a hard drive, thefile system reorganizes the hard drive to put files into contiguous sectors for faster reading. The common file systems for Windows are FAT16,FAT32, and NTFS. NTFS is the newest file system from Microsoft and has the best features for PACS applications. NTFS can address up to 256TB of data using a 64-KB cluster size and can support up to 16-TB files.FAT32 can address up to only 32GB, and the largest file it can support is 2GB.
DIRECT ATTACHED STORAGE, STORAGE AREA NETWORKS, AND NETWORK ATTACHED STORAGE
Direct attached storage (DAS) is using the hard drives that come with theserver (Figure 16.3). Storage area networks (SANs) and network attachedstorage (NAS) are the only 2 methods for scaling storage by inserting anetwork topology at either the file level (NAS) or the block level (SAN)between the storage system and the application.
DIRECT ATTACHED STORAGE
A 5U server might have the capacity for 10 to 12 drives to be added, typi-cally yielding a capacity of around 2 to 3TB. This is the least expensiveapproach for small storage requirements but also provides the least amountof redundancy. If any component fails on the server and stops the applica-tion, access to the data will also be lost. Another challenge of DAS is thelikelihood of running out of space. A direct attached solution does not scalewell.
STORAGE AREA NETWORK
Storage area network refers to a network dedicated to storage access at the block level (Figure 16.3). Networking typically involves Ethernet and
PACS: A Guide to the Digi tal Revolut ion328
DRE16 11/16/2005 9:51 AM Page 328

STORAGE AND ENTERPRISE ARCHIVING 329
Direct Attached Storage
Server 1 Server 2
Disk Device 1 Disk Device 1
Storage Area Network
Server 1 Server 2
Fiber Switch
Disk Device 1 Disk Device 1
Network Attached Storage
Server 1 Server 2
NAS Device 1 NAS Device 2
ExistingNetwork
FIGURE 16.3
Simple example of direct attached storage (DAS), storage areanetwork (SAN), and network attached storage (NAS).
DRE16 11/16/2005 9:51 AM Page 329

TCP/IP standards, but a SAN uses neither. A SAN uses the Fibre Channelcommunications protocol to directly access storage devices. The file systemremains on the computer, but low-level block-level access is routed throughan external network of storage devices. These external storage devices canbe daisy-chained together into an arbitrary loop or can be driven from a startopology using a SAN switch.
A SAN is perfectly suited for a busy information services departmentrunning dozens or even hundreds of servers. A SAN can be used to handlethe storage needs of servers running different operating systems, althougheach system sees only its own blocks of data. Instead of having to monitorand manage the storage needs on each of those computers, storage man-agement can be consolidated into a SAN and managed centrally. A SAN putsthe storage in one place to manage and can automatically grant computersmore storage on demand when it sees them approaching their storage limits.This provides significant economies in the operating costs for the servers. ASAN can provide logic at the block level to copy data to different storagedevices and provide a transparent level of fault tolerance to the computersas well. Another unique advantage of SAN is that it can move and back updata from 1 node of the SAN (such as a RAID array) to another node (suchas a tape archive) without drawing any resources from the host computers.This is called a clientless backup.
A SAN is the most frequently used storage method for PACS databaseredundancy. With fault-tolerant clustering, 2 servers share the same SANpartition, although 1 server sits passive. The 2 servers are linked via a heart-beat connection that monitors the active server and, in the event of failure,alerts the passive server to assume the network name of the server and takeover the shared storage partition and database processes.
SAN is the highest performance type of scalable storage architecturebecause it provides such low-level access—but it is also the most expensive.One reason is that optical connections are more costly than copper ones. Inaddition, the storage network industry is orders of magnitude smaller thanthe Ethernet network industry and so cannot provide buyers the benefits ofeconomies of scale. Because it is not used as widely, the Fibre Channel stan-dard is not as plug-and-play as networking standards. Some incompatibili-ties are often intentional. SAN providers often include proprietary code forthe following: performance/value-added features (such as multihost busadapter [HBA], the card that connects the server to the SAN), unique soft-ware for caching read/write requests in fast memory, replication (backup toanother location) technology, fault monitoring, and SAN management. ASAN can become an engineering exercise and require complex installation
PACS: A Guide to the Digi tal Revolut ion330
DRE16 11/16/2005 9:51 AM Page 330

and ongoing maintenance. Expertise in Fibre Channel is not as common ininformation technology organizations as networking expertise and is there-fore more costly. Figure 16.4 is a PACS example of a multivendor SANimplementation.
To alleviate these problems, an exciting and potentially disruptive technology has been developed: Internet SCSI or iSCSI. Internet SCSI is a communications protocol that sends and receives low-level SCSI
STORAGE AND ENTERPRISE ARCHIVING 331
SAN (Dedicated Network)
PACS Gateway
PACS Gateway
PACS Gateway
PACS Gateway
• Modality ConnectionPoint
• Exam Validation• Initial Exam Storage
PACSWorkstations
PACS Retrievalof Exams
Storing/Retrieving of Exams
Vendor 1
Vendor 2
Fibre Channel Switch (2 GB)Storage DeviceVendor 1 (Year 1)
Rack of Fiber Disks
Rack of Fiber Disks
Rack of Fiber Disks
Storage DeviceVendor 2 (Year 2)
Rack of Fiber Disks
Rack of Fiber Disks
Rack of Fiber Disks
“Clinical” Archive
“Clinical” Archive
Proprietary Management Software
Proprietary Management Software
Multvendor storage devices often requireseparate HBAs in each host: one set for eachvendor. (This is not usually a technicalrequirement but promoted to ensure vendor supportcompliance and less finger-pointing.)
Fibre Channel Switch: Device that intelligently routes data to the desired destination
*
FIGURE 16.4
Sample PACS (SAN) implementation.
DRE16 11/16/2005 9:51 AM Page 331

commands on a copper Category 5 Ethernet cable sitting on top of TCP/IProuting protocols. Internet SCSI can use the same inexpensive cabling asEthernet networking and even sit on an Ethernet network. Internet SCSI is giving rise to what is being referred to as IP SANs, and it is predicted that this strategy will drastically reduce the cost of SANs installation and support with the introduction of plug-and-play (multivendor) components.
NETWORK ATTACHED STORAGE
The third technique for adding storage is by working at the file level and using NAS (Figure 16.5). NAS servers, also known as filers, are dedi-cated to providing remote file-level access. PACS applications can accessstorage sitting on NAS servers using a high-level file-level access protocolcalled the common Internet file system (CIFS; Microsoft Windows–type filesharing). The benefit of using CIFS is that it is a widely used standard in theindustry and is platform independent. Linux and Unix servers workextremely well as CIFS file servers using the powerful and open-sourceSamba server. CIFS uses the universal naming convention (UNC) foraddressing files, such as: \\servername\share\path\filename. The firstportion of the UNC is the server name or network address at which the NASserver resides.
NAS is a relatively easy way to scale a storage system when the PACSapplication supports UNC. The database keeps a UNC pointer to the loca-tions at which the files reside. One potential drawback of the NAS archi-tecture is that data are sent on the same network twice, with one hop sendingdata from the NAS to the server and the second hop sending data from theserver to the end-client workstation. This contrasts with a SAN, which typ-ically uses a dedicated Fibre Channel network to afford fast, direct access tothe storage devices. Some PACS applications avoid this potential problemby passing the UNC address to the end workstation to directly access thefiles from the NAS server. This architecture scales well, because it avoidshaving all system file access go through a central point that becomes a poten-tial bottleneck. As an example, suppose there are 5 NAS devices, each con-taining 1TB of storage on a 1GB network, and the PACS software isarchitected to spread the storage load among the 5 NAS devices. The aggre-gate network bandwidth would be 5 ¥ 1GB or 5GB, and the aggregatestorage would be 5TB. Both the amount of storage and the pipeline to thestorage increase proportionally as (vendor-agnostic “inexpensive”) storagedevices are added.
PACS: A Guide to the Digi tal Revolut ion332
DRE16 11/16/2005 9:51 AM Page 332

STORAGE AND ENTERPRISE ARCHIVING 333
PACS Gateway
PACS Gateway
PACS Gateway
PACS Gateway• Modality Connection Point• Exam Validation• Initial Exam Storage
PACSWorkstations
Retrival of Exams
Storing of Exams“Clinical” Archive
Replication
Replication
Windows2003 DFS
Management
NAS Device 1A NAS Device 2A
4 TB DAS
4 TB DAS
Network Switch
NAS Device 1B NAS Device 2B
Dedicated StorageNetwork
4 TB Partition
4 TB Partition
8TB SAN
Distributed File System (DFS)
DFS redirects requests for files to assigned NAS devices. The primary advantage of redirecting clientrequests is to take advantage of replication. If two or more NAS devices are replicated and the primaryNAS device fails, DFS will automatically direct all future client requests to one of the still functioningbackup NAS devices.
Process Overview
In this example there are 4 NAS access points. Because the NAS devices present the underlining storageas a file system, the technology utilized by physical storage devices is irrelevant. To illustrate this point, this example utilizes 2 distinctly separate technologies (DAS and SAN). A simplistic way to look at this is thatthe operating system presents all disk storage as a file system. Storage vendors write plug-in software thatinterfaces the storage device to the operating system. This software is usually referred to as “device drivers.”Therefore, if the operating system can mount (use) the storage device, it can then, in turn, offer the filesystem to other users on the network (in Windows-speak, file share).
FIGURE 16.5
Sample PACS (NAS) implementation.
DRE16 11/16/2005 9:51 AM Page 333

Another exciting NAS-related technology is contained in new featuresoffered by the distributed file system (DFS) that is standard with theMicrosoft Windows 2003 operating system. A distributed file system canmake several disparate NAS servers appear logically grouped and presentthem to the PACS application as a single source. A distributed file systemprovides replication between NAS servers that can act as a fault-tolerantbackup to switch over to in the event 1 of the NAS servers fails. These fea-tures were once available only from high-end storage vendors.
Challenges involved in supporting a large NAS environment includethe installation/support of replication/backup software, monitoring tools,antivirus measures (including daily signature updates), and, of course, thosepesky service patches (because a NAS server is running an operating systemwith a file system, both will need to be maintained on all the NAS serversto avoid security vulnerabilities and file corruption).
GRID STORAGE
Grid storage creates fault-tolerant storage pools based on commodity “inex-pensive” servers, often referred to as grid servers (Figure 16.6). Each gridserver usually contains 4 internal serial ATA disk drives, 1 processor, and amodest amount of memory. Each of the servers participating in the grid runsvendor proprietary software that allows the devices to act as one. At least 1server acts as the interface between the grid and external application (PACS)servers. This grid’s interface server appears to the PACS servers as a NASdevice presenting a standard file system. The interface server also hosts hier-archical storage manager (HSM)-like software that manages the location offiles based on user configurable polices. These polices allow for defining 1 - n copies of a file, with each copy stored on a different grid server. Thisis how redundancy/fault tolerance is achieved. If 1 or more of the grid serversfails, the data can still be retrieved to the interface node (standard file system)from a copy located on a functioning grid server.
CONTENT ADDRESSABLE STORAGE
Content addressable storage (CAS) is functionally the same as grid storage.However, instead of presenting files to the application (PACS) servers viaNAS, a proprietary interface is utilized (Figure 16.6). Moreover, the integrityof the files is guaranteed by elaborate algorithms that provide a unique value(token) based on the data in the file. The algorithm commonly employed is
PACS: A Guide to the Digi tal Revolut ion334
DRE16 11/16/2005 9:51 AM Page 334

MD5 (message-digest algorithm). The generated value acts as a unique keyfor retrieving the file and must be stored by the (PACS) application. If thedata on the storage grid somehow changed, the file’s unique value would nolonger match the token stored in the (PACS) application database, resultingin an error being sent from the storage grid back to the requesting (PACS)application. This approach also supports the ability to logically group filestogether as related objects and store metadata (data about the data; forexample, to store date, last access date, or information relating to the sourcesof the data.)
STORAGE AND ENTERPRISE ARCHIVING 335
PACS Gateway
PACS Gateway
PACS Gateway
PACS Gateway• Modality Connection Point• Exam Validation• Initial Exam Storage
Retrieval of Exams
Storing of Exams
Grid Interface Server
Storage Grid
Internal (Dedicated) NetworkFacilitating Communications
Between Grid Servers
PACSWorkstations
Grid Server 960 GB
Grid Server 960 GBGrid Server 960 GB
Grid Server 960 GB
Grid Server 960 GBGrid Server 960 GB
Net
wor
k S
witc
h
“Clinical” Archive
Simple NAS Approach:PACS workstations connect directly to thestorage grid interface server’s file system.The storage grid appears as an NAS.
CAS (Content Addressable Storage):This type of storage grid typically interactswith the outside world (PACS) via tokensgenerated by an MDS algorithm. Filesare retrieved/stored through proprietaryinterfaces. The client application (PACS)must store a token instead of aconventional file path.
Sample Configuration1U, P4 3.2GHz, 4 Drives, Win2k
250 GBDrive
250 GBDrive
250 GBDrive
250 GBDrive
OS/Application Mirror(4 GB)
Swap File Mirror(4 GB)
Disk 1(JBOD)
(246 GB)
Disk 2(JBOD)
(246 GB)
Disk 3(JBOD)
(246 GB)
Disk 4(JBOD)
(246 GB)
JBOD (Just a Bunch of Disks; similar to unmanaged DAS)
Device ConfigurationStorage Grid 960 GB
FIGURE 16.6
Grid storage.
DRE16 11/16/2005 9:51 AM Page 335
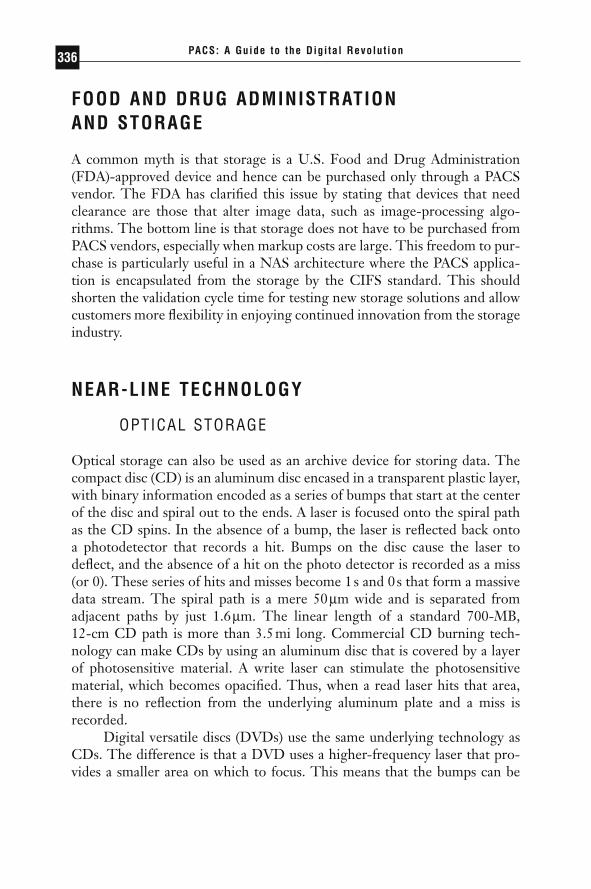
FOOD AND DRUG ADMINISTRATION AND STORAGE
A common myth is that storage is a U.S. Food and Drug Administration(FDA)-approved device and hence can be purchased only through a PACSvendor. The FDA has clarified this issue by stating that devices that needclearance are those that alter image data, such as image-processing algo-rithms. The bottom line is that storage does not have to be purchased fromPACS vendors, especially when markup costs are large. This freedom to pur-chase is particularly useful in a NAS architecture where the PACS applica-tion is encapsulated from the storage by the CIFS standard. This shouldshorten the validation cycle time for testing new storage solutions and allowcustomers more flexibility in enjoying continued innovation from the storageindustry.
NEAR-LINE TECHNOLOGY
OPTICAL STORAGE
Optical storage can also be used as an archive device for storing data. Thecompact disc (CD) is an aluminum disc encased in a transparent plastic layer,with binary information encoded as a series of bumps that start at the centerof the disc and spiral out to the ends. A laser is focused onto the spiral pathas the CD spins. In the absence of a bump, the laser is reflected back ontoa photodetector that records a hit. Bumps on the disc cause the laser todeflect, and the absence of a hit on the photo detector is recorded as a miss(or 0). These series of hits and misses become 1s and 0s that form a massivedata stream. The spiral path is a mere 50mm wide and is separated from adjacent paths by just 1.6mm. The linear length of a standard 700-MB, 12-cm CD path is more than 3.5mi long. Commercial CD burning tech-nology can make CDs by using an aluminum disc that is covered by a layerof photosensitive material. A write laser can stimulate the photosensitivematerial, which becomes opacified. Thus, when a read laser hits that area,there is no reflection from the underlying aluminum plate and a miss isrecorded.
Digital versatile discs (DVDs) use the same underlying technology asCDs. The difference is that a DVD uses a higher-frequency laser that pro-vides a smaller area on which to focus. This means that the bumps can be
PACS: A Guide to the Digi tal Revolut ion336
DRE16 11/16/2005 9:51 AM Page 336

smaller and packed more closely together. A DVD has a spiral path that isa mere 320nm wide, separated from adjacent tracks by 740nm. A DVD canstore 4.7GB of data, 7 times the capacity of CDs. DVDs can be written onboth sides, providing twice the capacity (9.4GB). A newer technology allowsa DVD to store 2 layers on the same side by having a semitransparent layermade from gold overlaid on top of the base aluminum layer. A laser can focuseither on the gold layer or through it on the aluminum layer. This techniquerequires slightly longer bump sizes to ensure accuracy, so the total capacityis slightly less than twice that of a regular DVD. A double-sided, double-layer DVD can hold 15.9GB of data.
An interesting hybrid between magnetic and optical technology ismagneto-optical (MO) drives. An MO drive writes to the media using a mag-netic field that thermally changes the properties of the material. When polar-ized light is shone on the material, the material shifts the frequency of thereflected light. This gives MO faster write speeds than typical optical drives,up to 4MB/s. MO disks are encased in a hard envelope and can be selectedas rewriteable or “write once read many” (WORM). The WORM optionprovides an exceptionally long lifetime for the media, projected at more than60 years. Magneto-optical media come in 5.2- and 9.1-GB capacities but costseveral times as much per gigabyte as DVD media.
If optical media are selected for archive technology, it is likely that ajukebox will be part of the solution. A jukebox system uses a robotic arm toload and unload optical media from readers and stores the media in slots.Optical media are sensitive to extremes in temperature, humidity, and directexposure to sunlight. A jukebox should be used, especially for exposed mediasuch as CDs and DVDs that do not have enclosed hard cases and so are sus-ceptible to scratches from manual handling. Today, large optical jukeboxsystems can hold up to 2000 slots and as much as 20TB of storage usingdouble-sided DVD or MO technology.
TAPE
Tape is based on the same magnetic technology used for hard drives. Thedifference is that tape encases the magnetic material in a flexible plastic strip that is 8 to 12mm wide and holds multiple tracks of data. Tape is a sequential access device, and hard drives and optical media are randomaccess devices. High-capacity cartridges hold more than 2000 linear feet of tape. A tape must wind to (seek) the location at which data are stored.This can take on the order of 30 to 60 seconds for larger-capacity tapes,
STORAGE AND ENTERPRISE ARCHIVING 337
DRE16 11/16/2005 9:51 AM Page 337

whereas hard drives and optical drives can do this in well under a second(Table 16.3). The engineering trick is to wind the tape quickly with a minimalamount of tension that might cause wear and eventual failure. In a jukebox,an additional 10 to 30 seconds is usually needed to pull a tape from a slot and mount it into a reader. Tape jukebox systems have a MTBF (meantime between failures) of 200,000 hours but, in many cases, remain opera-tional during component failures. Tape heads are the most common com-ponent to fail in a MTBF with approximately 40,000 hours of operation. Inthe event of a tape head failure, another drive unit can simply read the tapemedia.
Many different formats of tape are offered by vendors and/or consor-tiums of vendors. Formats are usually backwards-compatible over 2 or 3 pre-vious generations. Be aware that several tape formats use the compressedcapacity as the name of the format. For example, SDLT 320 holds only 160GB of uncompressed data and 320GB of data when compressed losslessly by a factor of 2.
PACS: A Guide to the Digi tal Revolut ion338
TABLE 16.3Tape Capacity and Performance Matrix
Tape Uncompressed Transfer Transfer Average FileType Capacity (GB) Rate (MB/s) Rate (GB/h) Access Time
(Seconds)
DLT 40 3 10.8 68SDLT 320 160 16 57.6 70SDLT 600 300 36 129.6 79AIT-1 35 4 14.4 27AIT-2 50 6 21.6 27AIT-3 100 12 43.2 27SAIT 500 30 108.0 70LTO-1 100 15 54.0 52LTO-2 200 35 126.0 52SLR50 25 2 7.2 55SLR100 50 5 18.0 58
DRE16 11/16/2005 9:51 AM Page 338
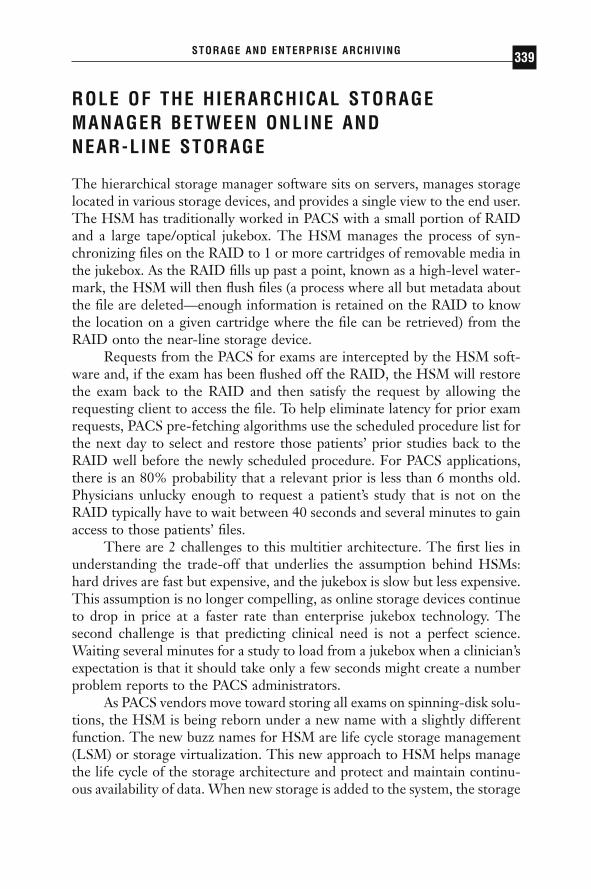
ROLE OF THE HIERARCHICAL STORAGEMANAGER BETWEEN ONLINE AND NEAR-LINE STORAGE
The hierarchical storage manager software sits on servers, manages storagelocated in various storage devices, and provides a single view to the end user.The HSM has traditionally worked in PACS with a small portion of RAIDand a large tape/optical jukebox. The HSM manages the process of syn-chronizing files on the RAID to 1 or more cartridges of removable media inthe jukebox. As the RAID fills up past a point, known as a high-level water-mark, the HSM will then flush files (a process where all but metadata aboutthe file are deleted—enough information is retained on the RAID to knowthe location on a given cartridge where the file can be retrieved) from theRAID onto the near-line storage device.
Requests from the PACS for exams are intercepted by the HSM soft-ware and, if the exam has been flushed off the RAID, the HSM will restorethe exam back to the RAID and then satisfy the request by allowing therequesting client to access the file. To help eliminate latency for prior examrequests, PACS pre-fetching algorithms use the scheduled procedure list forthe next day to select and restore those patients’ prior studies back to theRAID well before the newly scheduled procedure. For PACS applications,there is an 80% probability that a relevant prior is less than 6 months old.Physicians unlucky enough to request a patient’s study that is not on theRAID typically have to wait between 40 seconds and several minutes to gainaccess to those patients’ files.
There are 2 challenges to this multitier architecture. The first lies inunderstanding the trade-off that underlies the assumption behind HSMs:hard drives are fast but expensive, and the jukebox is slow but less expensive.This assumption is no longer compelling, as online storage devices continueto drop in price at a faster rate than enterprise jukebox technology. Thesecond challenge is that predicting clinical need is not a perfect science.Waiting several minutes for a study to load from a jukebox when a clinician’sexpectation is that it should take only a few seconds might create a numberproblem reports to the PACS administrators.
As PACS vendors move toward storing all exams on spinning-disk solu-tions, the HSM is being reborn under a new name with a slightly differentfunction. The new buzz names for HSM are life cycle storage management(LSM) or storage virtualization. This new approach to HSM helps managethe life cycle of the storage architecture and protect and maintain continu-ous availability of data. When new storage is added to the system, the storage
STORAGE AND ENTERPRISE ARCHIVING 339
DRE16 11/16/2005 9:51 AM Page 339

manager(SM) can have that additional storage appear seamlessly to the PACSapplication as 1 pool. An SM can also copy data from 1 disk array onto anew storage device in the background. This way, storage devices can beretired seamlessly, rebuilding and renaming new devices to take over theirpredecessors’ roles. This can be very useful in ensuring that storage devicesremain serviceable by the storage provider and that the department does notget caught with antiquated, unsupportable hardware. The HSM storagemanager can be utilized to duplicate copies of exams stored in separate geo-graphic locations to provide disaster recovery as well as better local per-formance. The logic of the SM can be placed at any level of storagearchitecture. It can reside as part of an SAN (integrated into the storagedevice level directly) or it could reside in the operating system at the filelevel. The SM could also reside as part of the PACS application. Since thefunctions of storage virtualizaton extend well beyond the PACS arena, thislogic should ideally be processed at the file or block level and not by theapplication. This gives the PACS vendor one less piece of the puzzle to figureout and also allows customers to enjoy the economy-of-scale benefits of theseapplications that are used well beyond the medical community. This alsogives more freedom to customers to select the best storage approach for theirneeds.
CONCLUSION
Storage is a fundamental enabling technology of the PACS industry. Theonly way to position ourselves to survive the onslaught of storage consump-tion is to be able to embrace the advances being made in the storage indus-try. Look for the continued trend toward commoditization through the useof well-accepted and proven industry standards such as copper Category 5Ethernet network cable for storage networks in IP-based SANS. ExpectPACS vendors to provide better encapsulation of their application from thestorage architecture to allow customers to better enjoy the technological andeconomic benefits of this competitive market.
ABBREVIATIONS
AIT Advanced intelligent tape
ATA AT advanced
PACS: A Guide to the Digi tal Revolut ion340
DRE16 11/16/2005 9:51 AM Page 340
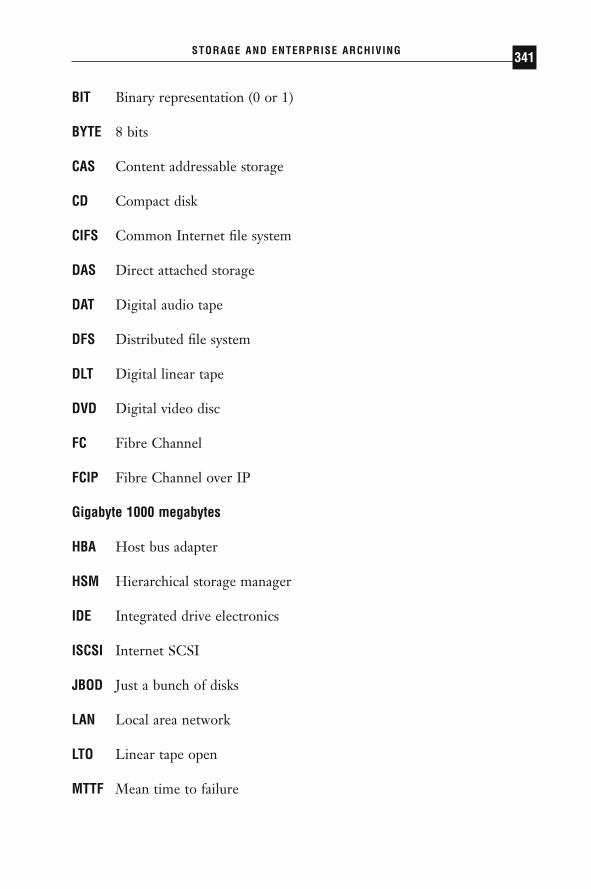
BIT Binary representation (0 or 1)
BYTE 8 bits
CAS Content addressable storage
CD Compact disk
CIFS Common Internet file system
DAS Direct attached storage
DAT Digital audio tape
DFS Distributed file system
DLT Digital linear tape
DVD Digital video disc
FC Fibre Channel
FCIP Fibre Channel over IP
Gigabyte 1000 megabytes
HBA Host bus adapter
HSM Hierarchical storage manager
IDE Integrated drive electronics
ISCSI Internet SCSI
JBOD Just a bunch of disks
LAN Local area network
LTO Linear tape open
MTTF Mean time to failure
STORAGE AND ENTERPRISE ARCHIVING 341
DRE16 11/16/2005 9:51 AM Page 341
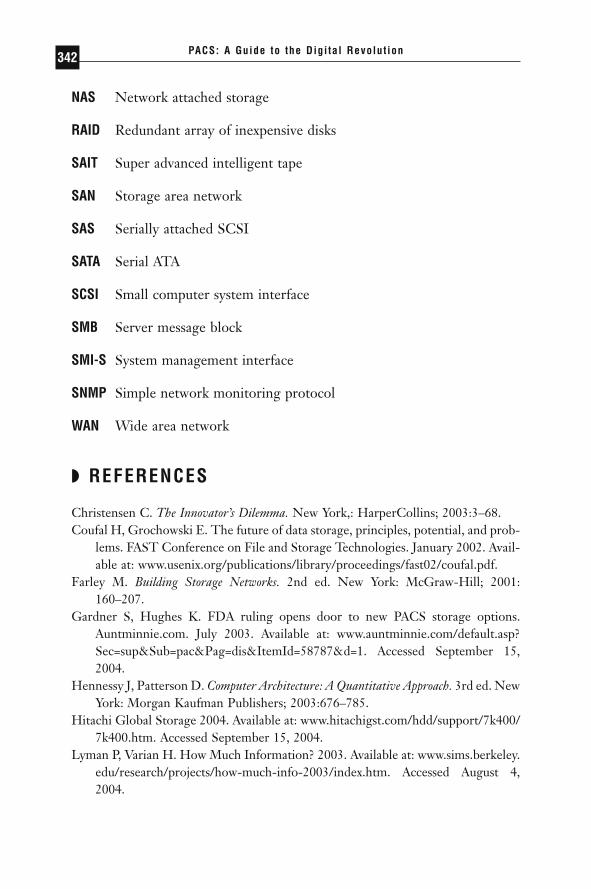
NAS Network attached storage
RAID Redundant array of inexpensive disks
SAIT Super advanced intelligent tape
SAN Storage area network
SAS Serially attached SCSI
SATA Serial ATA
SCSI Small computer system interface
SMB Server message block
SMI-S System management interface
SNMP Simple network monitoring protocol
WAN Wide area network
◗ REFERENCES
Christensen C. The Innovator’s Dilemma. New York,: HarperCollins; 2003:3–68.Coufal H, Grochowski E. The future of data storage, principles, potential, and prob-
lems. FAST Conference on File and Storage Technologies. January 2002. Avail-able at: www.usenix.org/publications/library/proceedings/fast02/coufal.pdf.
Farley M. Building Storage Networks. 2nd ed. New York: McGraw-Hill; 2001:160–207.
Gardner S, Hughes K. FDA ruling opens door to new PACS storage options. Auntminnie.com. July 2003. Available at: www.auntminnie.com/default.asp?Sec=sup&Sub=pac&Pag=dis&ItemId=58787&d=1. Accessed September 15,2004.
Hennessy J, Patterson D. Computer Architecture: A Quantitative Approach. 3rd ed. NewYork: Morgan Kaufman Publishers; 2003:676–785.
Hitachi Global Storage 2004. Available at: www.hitachigst.com/hdd/support/7k400/7k400.htm. Accessed September 15, 2004.
Lyman P, Varian H. How Much Information? 2003. Available at: www.sims.berkeley.edu/research/projects/how-much-info-2003/index.htm. Accessed August 4,2004.
PACS: A Guide to the Digi tal Revolut ion342
DRE16 11/16/2005 9:51 AM Page 342

Murray W, Maekawa K. Reliability evaluation of 3M magneto-optic media. Pro-ceedings of Magneto-Optical Recording International Symposium. J Magn SocJpn. 1996;20(suppl S1):309–314.
Nagy P, Farmer J. Demystifying data storage: archiving options for PACS. ApplRadiol. May 2004:18–22.
Nice K. How DVDs work. Available at: http://electronics.howstuffworks.com/dvd.htm. Accessed September 15, 2004.
Webster J. Everything you need to know about SMI-S. Infostor. 2004;8:28–32.
◗ SUGGESTED READING
Anderson M. The toll of downtime. Healthcare Informatics. April 2002. Available at: www.healthcare-informatics.com/issues/2002/04_02/leading.htm. AccessedSeptember 15, 2004.
Andriole KP, Avrin DE, Yin L, Gould RG, Luth DM, Arenson RL. Relevant priorsprefetching algorithm performance for a picture archiving and communicationsystem. J Digit Imaging. 2000;13(2 suppl 1):73–75.
Avrin DE, Andriole KP, Yin L, Gould R, Arenson RL. Simulation of disaster recov-ery of a picture archiving and communications system using off-site hierarchalstorage management. J Digit Imaging. 2000;13(2 suppl 1):168–170.
Avrin DE, Andriole KP, Yin L, Gould RG, Arenson RL. A hierarchical storage management (HSM) scheme for cost-effective on-line archival using lossy com-pression. J Digit Imaging. 2001;14:18–23.
Battaglia G, Maroldi R, Chiesa A. Evaluating the digital storage requirements for a partial picture archive and communication system. J Digit Imaging. 1990;3:54–59.
Bauman RA, Gell G, Dwyer SJ III. Large picture archiving and communicationsystems of the world. Part 2. J Digit Imaging. 1996;9:172–177.
Behlen F, Maughan J. Migrating data to the new PACS. Health Imaging & IT.May 2004. Available at: www.healthimaging.com/archives/HIIT/HIIT_2004/HIIT0205/HIIT020510.htm. Accessed September 15, 2004.
Benner A. Fibre Channel for SANS. New York: McGraw-Hill; 2001:5–12.Blado ME. Management of the picture archiving and communications system
archive at Texas Children’s Hospital. J Digit Imaging. 2001;14(2 suppl 1):84–88.
Blado ME, Tomlinson A. Monitoring the accuracy of a PACS image database. J DigitImaging. 2002;15(suppl 1):87–95.
Bui AA, McNitt-Gray MF, Goldin JG, Cardenas AF, Aberle DR. Problem-orientedprefetching for an integrated clinical imaging workstation. J Am Med InformAssoc. 2001;8:242–253.
STORAGE AND ENTERPRISE ARCHIVING 343
DRE16 11/16/2005 9:51 AM Page 343
Chesson E. Long-term image archiving. Health Imaging & IT. June 2004. Available at: www.healthimaging.com/archives/HIIT/HIIT_2004/HIIT0206/HIIT020607.htm. Accessed September 15, 2004.
Channin D, Parisot C, Wanchoo V, Leontiev A, Siegel E. Integrating the Health-care Enterprise: a primer: part 3. What does IHE do for ME? Radiographics.2001;21:1351–1358.
D’Arcy S, D’Arcy J. Securing data from disaster. Decis Imaging Economics. June 2003. Available at: www.imagingeconomics.com/library/200306-02.asp. AccessedSeptember 15, 2004.
Dumery B. Digital image archiving: challenges and choices. Radiol Manage. June2002. Available at: www.ahra.com/AHRAArticles/AHRAArticles.dll/Show?ID=328. Accessed September 15, 2004.
Erickson BJ, Persons KR, Hangiandreou NJ, James EM, Hanna CJ, Gehring DG.Requirements for an enterprise digital image archive. J Digit Imaging. 2001;14:72–82.
Henderson M, Behlen F, Parisot C, Siegel E, Channin D. Integrating the Health-care Enterprise: a primer: part 4. The role of existing standards in IHE. Radiographics. 2001;21:1597–1603.
Honeyman JC, Huda W, Frost MM, Palmer CK, Staab EV. Picture archiving andcommunication system bandwidth and storage requirements. J Digit Imaging.1996;9:60–66.
McEnery KW, Suitor CT, Thompson SK, Shepard JS, Murphy WA. Enterprise utilization of “always on-line” diagnostic study archive. J Digit Imaging. 2002;15(suppl 1):81–86.
Mendenhall R, Dewey M, Soutar I. Designing fault-tolerant distributed archives forpicture archiving and communication systems. J Digit Imaging. 2001;14(2 suppl1):80–83.
Nagy P. The ABC’s of storage technology. SCAR University: Educating Healthcare Pro-fessionals for Tomorrow’s Technology. Great Falls, VA: Society for Computer Appli-cations in Radiology; 2004:123–127.
Nagy P, Warnock M. Predicting PACS loading and performance metrics usingMonte Carlo and queuing methods. In: Proceedings of the International Society forPhoto-Optical Engineering. San Diego, CA: SPIE; 2003:46–55.
Nagy P, Daly M, Warnock M, Ehlers K. PACSPulse: A Web-based DICOM networktraffic monitor and analysis tool. Radiographics. 2003;23:795–801.
National Electrical Manufacturers Association. DICOM resources 2004. Availableat: http://medical.nema.org. Accessed September 15, 2004.
National Institute of Standards and Technology. Prefixes for binary multiples. Avail-able at: http://physics.nist.gov/cuu/Units/binary.html. Accessed September 15,2004.
Oosterwijk H. PACS Fundamentals. Aubrey, TX: Otech, Inc; 2004:53.
PACS: A Guide to the Digi tal Revolut ion344
DRE16 11/16/2005 9:51 AM Page 344

Pavlicek W, Zavalkovskiy B, Eversman WG. Performance and function of a high-speed multiple star topology image management system at Mayo Clinic Scotts-dale. J Digit Imaging. 1999;12(2 suppl 1):168–174.
Piedad F, Hawkins M. High Availability: Design, Techniques, and Processes. UpperSaddle River, NJ: Prentice Hall; 2001:13–29.
Qi H, Snyder WE. Content-based image retrieval in picture archiving and commu-nications systems. J Digit Imaging. 1999;12(2 suppl 1):81–83.
Shelton PD, Lyche DK, Norton GS, et al. Benchmark testing the Digital ImagingNetwork-Picture Archiving and Communications System proposal of theDepartment of Defense. J Digit Imaging. 1999;12:94–98.
Siegel E, Channin D. Integrating the Healthcare Enterprise: a primer: part 1. Intro-duction. Radiographics. 2001;21:1339–1341.
Smith EM, Wandtke J, Robinson A. The strategic and operational characteristics ofa distributed phased archive for a multivendor incremental implementation ofpicture archiving and communications systems. J Digit Imaging. 1999;12(2 suppl1):71–74.
Smith EM, Wright J, Fontaine MT, Robinson A. Archive selection for the MICAS,a multi-vendor incremental approach to PACS. J Digit Imaging. 1998;11(3 suppl1):32–34.
Smith R. Rethinking disaster recovery. Imaging Econ. December 2001. Available at: www.imagingeconomics.com/library/200112-06.asp. Accessed September15, 2004.
Tamm E, Thompson S, Venable S, McEnery K. Impact of multislice CT on PACSresources. J Digit Imaging. 2002;15(suppl 1):96–101.
Wong AW, Huang HK. Subsystem throughputs of a clinical picture archiving andcommunications system. J Digit Imaging. 1992;5:252–261.
Wong AW, Huang HK, Arenson RL, Lee JK. Digital archive system for radiologicimages. Radiographics. 1994;14:1119–1126.
STORAGE AND ENTERPRISE ARCHIVING 345
DRE16 11/16/2005 9:51 AM Page 345

IMAGE DISPLAYS
DAVID S. HIRSCHORN
HISTORY
Until the advent of picture archiving and communication systems (PACS) inthe early 1990s, film was the primary medium for radiologic image display.At the end of the 19th century, the first radiographs were acquired on a pieceof film. Radiography was the first modality of radiology, and even after ahundred years it remains the mainstay of the field, comprising about 70%of the study volume worldwide. Until the 1980s, the only way to acquire aradiograph was on film. Even when computed radiography was introducedin the 1980s, its images were initially printed to film for interpretation. Like-wise, as other modalities such as ultrasound, computed tomography (CT),magnetic resonance imaging (MRI), digital fluoroscopy, and nuclear medi-cine were developed during the 20th century, their inherently digital imageswere typically printed to film for viewing. PACS did not become a realityuntil computers and networks became fast and robust enough to handledigital image transfers and storage.
17CHAPTER
DRE17 11/16/2005 9:52 AM Page 347

But what about image display? Could the standard computer displaysof the early 1990s provide adequate image quality? It was quickly realizedthat the answer was no and that a specialized display would need to be devel-oped to support medical imaging. The primary deficiencies in the typicalcolor cathode-ray tube (CRT) displays of that time were in the areas of lumi-nance, spatial resolution, and contrast resolution, not to mention issues ofgeometric and other distortions. The quality of such displays was just notcomparable to that of radiographic film. Thus, a whole industry was startedto produce displays that were optimized to the requirements of radiologicimage display of radiographs.
Monochrome CRTs were created with special phosphors to producehigh luminance levels with less distortion and at higher spatial resolutions.These displays met the requirements for radiography. Because all the othermodalities seemed to have less stringent requirements, there was a basicassumption that what was good enough for radiography was good enoughfor everything else. While this was true, it was seldom considered whethersuch displays were really necessary for nonradiography images. In fact, ultrasound images are typically acquired on equipment with color CRT dis-plays. Furthermore, nuclear medicine workstations almost always had colorCRTs because color was so necessary in the diagnostic viewing of theseimages.
In the mid-1990s, liquid crystal display (LCD) displays were introducedto the general consumer market. Medical display manufacturers quicklyadapted this technology as they did for the CRT; they produced a mono-chrome version with higher luminance and higher spatial resolutions. Whilethese displays clearly outperformed their CRT predecessors, they made the question of nonradiography image viewing more acute. The old, commercial-grade, color CRTs did not meet minimum luminance require-ments, but the newer color, commercial-grade LCD displays did. Many radi-ologists began to wonder whether they really needed the more expensive monochrome displays to see what they needed to see, especially for nonradiography.
There is little reason left to buy CRTs for medical image viewing today.They are heavier, bulkier, hotter, and less durable than LCDs and providemuch less sharpness, especially over time. Rather, more attention is beingpaid to deciding which type of LCD to choose—monochrome or color, whatsize, and so forth. This chapter explores the basic features of medical imagingdisplays and their clinical relevance.
PACS: A Guide to the Digi tal Revolut ion348
DRE17 11/16/2005 9:52 AM Page 348

HOW MANY MONITORS?
For many years films were hung on film alternators in a 4-over-4 configu-ration so as to maximize the number of images that could be viewed at once.Changing the view meant having the machine mechanically rotate thepanels, a process that could take up to 15 seconds per change. Thus, radiol-ogists grew accustomed to looking at up to 8 films at once. The first PACSworkstations offered up to 4 monitors, and many departments purchasedthese configurations because they were the closest to what radiologists hadgrown used to seeing, albeit extremely expensive. However, over time, mostradiologists noticed that their viewing habits changed considerably withPACS. Once images could be scrolled rapidly in “cine” mode, they foundthat it was no longer necessary and in fact less desirable to view multiplepanels of images in the tile mode they had used for many years.
Siegel and Reiner examined radiologist productivity versus the numberof monitors. They found that while there was a significant gain in having 2imaging monitors instead of just 1, having more than 2 did not yield furthergain. Furthermore, radiologists usually do not compare more than 2 imagesat a time; it is usually just a frontal view to a lateral one, a current image toa prior one. It is usually desirable to view several pulse sequences at one timewith MRI images, but in those cases, since the native resolution of theseimages is so small, the screen is often split into 4 or more sections, obviat-ing the need for more than 2 monitors.
One exception to this rule may be mammography. Currently there isan influx of softcopy reading systems for digital mammography on themarket. Since a screening mammogram has 4 views and comparison to theprior mammogram is always performed when available, there may be justi-fication for an increased number of imaging displays in this case. Time willtell as they undergo more clinical usage.
The PACS workstation has evolved to the extent that the term is prob-ably outmoded. People do not refer to their desktop computers as word-processing workstations just because they use them for word processing. So,too, PACS viewing software is beginning to take its place as just anotherapplication on the radiologic interpretation computer. While it may be theprimary application for image interpretation, the same computer may beused for access to the radiology information system (RIS), the hospital infor-mation system (HIS), the electronic medical record (EMR), the Internet, e-mail, and even a speech recognition dictation system. As such, today’ssystems usually include one additional low-cost color LCD display for theseother functions, and sometimes even two. Even the exam selection portion
IMAGE DISPLAYS 349
DRE17 11/16/2005 9:52 AM Page 349

of the PACS viewing software itself is often better viewed this way, as itpermits the graphical user interface of this part of the system to employ color.
PHYSICAL SIZE
Image displays that have been optimized for medical image viewing are typically 21 in. diagonally. Displays larger than 25 in. can not be comfortablyviewed at the typical viewing distance of 18 in. without having to move one’shead around, thereby causing neck strain. Consumer displays range in sizefrom 17 up to 21 in. diagonally. The size of LCD displays usually corre-sponds to the resolution given in Table 17.1.
This measurement does not include the size of the bezel, which is theframe around the display. Bezels range in thickness from 0.5 to 2 in., areusually made from plastic, and may have several buttons to control thedisplay and some indicator lights. Some displays include audio speakers inthe bezel, which increases the size of the bezel. There has been a trend since
PACS: A Guide to the Digi tal Revolut ion350
TABLE 17.1Resolution and Pixel Pitch of Various Displays
Resolution
Display Width ¥Megapixels
PixelSize and Height Commonly PitchType (pixels) Actual Called (microns)
15-in color 1024 ¥ 768 0.79 1 29717-in color 1280 ¥ 1024 1.3 1 26418-in color 1280 ¥ 1024 1.3 1 28119-in color 1280 ¥ 1024 1.3 1 29420-in color 1600 ¥ 1200 1.9 2 25521-in color 1600 ¥ 1200 1.9 2 27021-in monochrome 3MP 1536 ¥ 2048 3.1 3 20721-in monochrome 5MP 2048 ¥ 2560 5.2 5 16522-in color 9MP 3840 ¥ 2400 9.2 9 125
DRE17 11/16/2005 9:52 AM Page 350

2003 to produce displays with thinner bezels, as this allows multiple displaysto be more closely placed side by side. For medical imaging, the ideal bezelis thin and black, as this de-emphasizes the bezel and allows the displayedimage to dominate.
Liquid crystal displays are much thinner than their CRT counterparts.Cathode-ray tube displays are usually somewhat cubical; their thicknessroughly equals their height and width. Liquid crystal displays are usuallyabout 2 to 3 in. thick, regardless of height and width. Accordingly, LCD dis-plays are lighter and easier to move around.
RESOLUTION AND PIXEL PITCH
DEFINITIONS
The actual display area of a display is divided into a matrix of picture elements called “pixels” (pix for “picture,” els for “elements”). The term “resolution” refers to the size of that matrix—either its length and width, orthe total number of pixels, which is obtained simply by multiplying the twodimensions. As demonstrated in Table 17.1, these range from 1 megapixel(MP) up to 9MP. Displays with 2000 pixels on one side are sometimes called“2K monitors.” However, since this term could mean either a 3MP or a 5MP display, it is less specific.
It should be apparent from Table 17.1 that as the display size in inchesincreases, so does the display resolution. However, this is not a 1 :1 rela-tionship; 1.3MP displays come in both 18- and 19-in. sizes, and 1.9MP comein 20- and 21-in. sizes. Furthermore, the relationship is not linear; thenumber of pixels increases faster than the display area.
This relationship between physical size of the display area and the res-olution is called the “pixel pitch.” It can be obtained by simply dividing thephysical width in microns by the width in pixels. Since pixels are typicallysquare, the same should be obtained using the physical height and the heightin pixels.
REQUIREMENTS
One question that is still being explored is, Just how much resolution doesone need for diagnostic viewing of radiologic images? To address this issue,a distinction needs to be made between two categories of images: radiogra-phy and nonradiography. Radiography includes the standard chest x-ray,
IMAGE DISPLAYS 351
DRE17 11/16/2005 9:52 AM Page 351

abdominal radiographs, bone radiographs, and so on. The actual acquisitionmodality can be either computed radiography (CR) or digital radiography(DR); it does not matter. It also includes mammography, but that will be discussed separately later in this chapter. Nonradiography is everything else: CT, MRI, ultrasound, nuclear medicine, fluoroscopy, and angiography.There are at least two major differences between these categories that affectdisplay requirements. One is the inherent contrast of the features normallyfound in the images; this will be discussed in the next section about lumi-nance. The other, which is germane to this section, is the native size and resolution of the images.
The typical chest x-ray has been obtained on a 14 ¥ 17-in. film cassettefor decades, and this cassette size has been perpetuated in CR and DRmachines. However, even displays that are specifically designed for medicalimaging have a viewable image size of only 12.5 ¥ 16.6 in. This means thatchest x-rays must be reduced by at least 20% to fit on the screen, and thisassumes that the orientation of the image and the display match (e.g., both are in portrait) and does not take into account the presence of buttons,labels, and a taskbar, which occupy screen space and further shrink the image.Such displays are usually placed in portrait orientation, which matches thatof posterior anterior (PA) and lateral exams but does not match the orienta-tion of the ubiquitous portable chest x-ray, which is typically obtained inlandscape orientation. The point is that in order to be displayed in itsentirety, a radiograph is often shrunk to fit into the physical viewable areaof the display. This is because the physical size of the display was not designedaround the size of the acquired image but rather around the human visual system.Larger displays are not only more costly to produce but also more difficultto view at a normal viewing distance of 18 in. Consider a picture of a house.No one would want the picture to be the same size as the house! Likewise,radiographs are shrunk somewhat to make them easier to view, and of coursethe radiologist can and does zoom and pan the image to examine differentparts more closely as needed.
Similarly, the pixel pitch of a display should match the limits of thehuman visual system at a typical viewing distance of 18 in. rather than thepixel pitch of the original image. Making the pixel pitch smaller than this thresh-old will not convey more information to the radiologist. Cramming more pixelsonto the screen may display more information, but radiologists will not seeit because it is below their visual threshold. One might argue that radiolo-gists will see more if they move their faces closer to the screen, which is whatradiologists and indeed people in general do in order to see things better—they move their eyes closer to the object. However, the same effect can beaccomplished on the computer display by simply zooming and panning the
PACS: A Guide to the Digi tal Revolut ion352
DRE17 11/16/2005 9:52 AM Page 352

image, and this involves far less neck strain, is more ergonomically sound,and is a lot less costly. Exactly what the perception threshold is depends onthe visual acuity of the radiologist and is a matter of debate. At the very least,it is unclear how many radiologists who view a 5MP display with 165 micronpixels at a viewing distance of 18 in. are actually seeing 5MP.
One rationale for the development of the 5-MP display may have beenthe size of radiographs. According to American College of Radiology recom-mendations, radiographs (CR or DR) should be acquired at a resolution of atleast 2.5 line pairs per millimeter (lp/mm). For a 14 ¥ 17-in. cassette, this trans-lates into about 4MP, and in practice the images are rendered at 5MP.However, as mentioned, images are often shrunk anyway due to elements ofthe graphical user interface such as buttons and a taskbar as well as mismatchesin image versus display orientation. Furthermore, it is more logical to matchthe resolution of the display to the limits of the human visual system than tothe resolution of the acquired image. Film mammography provides a goodinsight into this principle. Mammographers do move their eyes very close tothe film to see those microcalcifications, but they know that even that effortis not enough. They must also use a magnifying glass to be sure they are notmissing any such findings. In other words, the resolution of the acquired imageis higher than the limits of the human visual system, and important informa-tion may be missed if the mammographer does not use a magnifying glass.The magnifying glass brings down the higher resolution of the acquired imageinto the human viewable range. The advantage of a computer display systemis that, unlike film, it has a magnification system built in. Thus, it is not nec-essary for the display system to have the same number of pixels as the acquiredimage, so long as all the pixels of the acquired image can be viewed by zoomingand panning the displayed image. This last point is essentially what is statedin the American College of Radiology guidelines (ACR Technical Standardfor Digital Image Data Management, 2001 Revision).
Much smaller than radiographs, nonradiography images (CT, MRI,ultrasound, etc.) have different resolution requirements. The largest of theseare digital fluoroscopy images, which can be as large as 1MP. But CT imagesare 1/4 MP and MRI images are usually even smaller. When a radiologist isviewing these images in stack mode, a 1-MP display has more than enoughresolution. Thus, PACS workstations that are primarily dedicated to nonra-diography diagnosis do not need the higher resolutions offered by displaysdesigned around radiography. In fact, higher resolution displays can actually slowdown performance when viewing nonradiography images in stack mode. Considertrying to scroll through a CT exam with 100 images, each 1/4 MP in size, ona 1-MP display. Each image needs to be digitally magnified roughly by afactor of 4 before it can be displayed in order to make it fill most of the
IMAGE DISPLAYS 353
DRE17 11/16/2005 9:52 AM Page 353
screen. Now consider the same scenario with a 3-MP display—each imageneeds to be magnified by a factor of 12 instead. At current processor speeds,this creates a very noticeable difference in the speed with which one canscroll through the images. In sum, for scrolling through CT images, a 3-MPdisplay is overkill and can significantly slow down the process. For thisreason, most radiologists at Massachusetts General Hospital (MGH) havelearned to avoid using the higher-resolution displays for CT and MRIviewing.
As mentioned above, there is another difference between radiographyand nonradiography with regard to luminance requirements.
LUMINANCE
Luminance is the brightness of the display, expressed in foot-lamberts,candela per square meter, or nits (1 cd/m2 = 1 nit = 0.29 foot-lambert).Grayscale radiologic images usually contain 256 shades of gray in any givenpresentation state. What the ACR recommendations endeavor to do is tomake sure that the radiologist can see all 256 of those shades and perceivethem in a linear fashion (e.g., a pixel with a value of 200 appears twice asbright as one with a value of 100). To that end, they issued 2 recommenda-tions. The first is that the maximum luminance of the display should be at least 50 foot-lamberts. A display dimmer than may be able to produce 256 distinct shades of gray but not ones that the human eye can distinguish.The difference between each shade of gray and the next one must be at least1 JND (just noticeable difference). For this, at least 170 nits (50 foot-lamberts) are required. Most color CRTs never reached this brightness, andas such were not suitable for medical imaging. This was one of the factorsthat spawned the development of the “medical-grade” display. MonochromeCRTs have a luminance of about 400 nits, and their LCD counterparts goup to 700 nits. However, today’s color LCDs are typically 250 nits in bright-ness; in August 2004, a 400-nit color LCD was introduced to the generalconsumer market.
Is brighter better? To some degree it probably is. The brighter thedisplay, the greater the step change in luminance from one shade of gray tothe next; brighter displays have 2 to 3 JNDs from one pixel value to the next.Subtle findings tend to be more conspicuous on brighter displays. However,there is a point of diminishing returns. Too much light from large white areas(such as the diaphragm on a chest x-ray) on a very bright display can blindthe radiologist to subtle findings in the darker areas of the image.
PACS: A Guide to the Digi tal Revolut ion354
DRE17 11/16/2005 9:52 AM Page 354
The second recommendation of the ACR is in regard to the percep-tual linearization of the shades of gray. This is discussed in the next sectionon calibration.
CALIBRATION
Again, radiologic images typically contain 256 shades of gray in any givenpresentation state. In the case of MRI and CT, this means at any givenwindow/level setting, but the same applies to any image with more than 8bits of pixel depth. At first glance it might seem trivial to display an imagewith 256 shades of gray, as that is exactly the maximum amount possible onstandard consumer-grade display systems. Each pixel is comprised of 3 sub-pixels—1 red, 1 green, and 1 blue. Each subpixel can be modulated on a scaleof 0 to 255, which yields 2563 (about 16 million) possible color combina-tions. In order to produce a shade of gray, all one need do is set all 3 sub-pixels to the same value, hence 256 possible shades of gray.
There are 2 problems with this approach. The first is that it assumes auniform increase in luminance output per change in digital driving level(DDL), called a display function. That is, if a DDL of 50 yields 45 nits oflight, then a DDL of 100 should yield 90 nits of light. It turns out that manydisplays have wildly varying display functions. What one might assume to bea fairly linear function is often skewed and sometimes erratic due to a hostof factors in the manufacturing process. The second problem is that a linearfunction is not even what is desired. Why not? Because it turns out thatalthough 90 nits are indeed twice as bright as 45 nits, that difference inbrightness is not so perceived by the human eye. Human perception ofbrightness is not linear. A photometer will correctly measure the difference,but radiographs are still interpreted by humans at this point in time (this isshifting a bit; see Chapter 21, “Breast Imaging, Computer-Aided Detection,and Computer-Assisted Classification”). In a very rough sense, it takes a 1%change in luminance for the eye to detect the change. Reconsider the aboveexample. Let us say that the DDL of 50 yields 45 nits of light. DDL 51 needonly yield 0.45 nits more to produce 1 JND between the 2 DDLs. Let usalso say that a DDL of 200 yields 130 nits. DDL 201 will have to yield 1.3nits more in order to produce 1 JND between the 2 DDLs. This is a sim-plification of the Barten model of the human visual system that was adoptedby the ACR but illustrates the point that the light output of a display formedical imaging is supposed to follow a specific curve that is spelled out inthe DICOM Part 14 Grayscale Display Function (GSDF).
IMAGE DISPLAYS 355
DRE17 11/16/2005 9:52 AM Page 355

This curve is a mathematical function that depends on the minimumand maximum light output of the display (called the black level and whitelevel) and whose precision is infinite. The goal is to produce 256 discreteshades of gray that approximate this curve with the smallest possible devia-tions. The best way to do this is to produce a large pool of potential shadesof gray from which to pick the 256 best ones. The greater the number ofshades of gray a display system can produce, the closer the 256 best ones willbe to the curve. The number of potential shades of gray a display can producedepends on the limitations of the display itself and the video card that con-trols it. In the days of the medical-grade CRT, calibration precision was actu-ally a simpler matter. As an analog device, the CRT could produce an almostlimitless number of shades of gray; it all depended on the precision of thevoltages fed to it by the video card. The finer the card could modulate itsoutput voltages, the greater the number of intermediary shades of gray.Analog medical-grade video cards produced 1000 shades of gray or more,from which the best 256 were chosen during the calibration process to bemapped to the 256 DDLs.
Liquid crystal display technology presented a challenge to display cal-ibration, as LCDs are inherently digital devices. Consider an analog radiodial. With patience it can be carefully and slowly adjusted to tune in a givenradio station, say 100.1, for example. A digital radio tuner can be adjustedto reach the same station much more quickly. A favorite station can even besaved and reached with the press of a button. But what happens if the digitaltuner loses its calibration over time and reads 100.1 when it is actually tunedto 100.2? The digital scale only moves in increments of 0.2, so you can onlygo down to 99.9, which is actually 100.0, but you cannot reach 100.1. In adigital device, there is no “in between,” whereas with the analog dial thereis. You would not even have noticed if, over time, you needed to turn theanalog dial slightly more or less to reach 100.1. Medical-grade LCDs aremade from the same basic digital material as consumer-grade LCDs, andthese panels only accept 256 DDLs per subpixel. One saving grace is thatmedical-grade displays have the color filters left off the subpixels during themanufacturing process (a change in the standard manufacturing process thatis one of the factors that drives up the price for these displays). The colorfilters are left off because they attenuate the light coming through from theback of the panel, and medical displays are designed to be brighter thantypical consumer displays. But a side benefit of this is that now all 3 sub-pixels produce white light instead of colors, and as such the total number ofshades of gray that can be produced is 256 ¥ 3 = 768. The medical-gradedisplay manufacturers did not stop there, though. They employ temporalmodulation as well to achieve a bigger pool of shades of gray to choose from.
PACS: A Guide to the Digi tal Revolut ion356
DRE17 11/16/2005 9:52 AM Page 356

This involves leaving some subpixels on at a higher level for only a fractionof a screen refresh cycle. Theoretically, those subpixels are flashing higherand lower rapidly, and one might think that this would produce a flickereffect. But since it takes place so quickly, well above the human eye’s thresh-old for flicker, the eye perceives it as a slight static increase in brightness.The net result is once again a few thousand shades of gray from which tochoose the 256 best ones.
What about consumer-grade LCDs? At present they have no suchspecial circuitry for luminance calibration. It was long thought that the onlyway to calibrate them was to accept that the 256 shades of gray would haveto be chosen from the 256 shades produced by red = green = blue—essentially no choice at all. In fact, what actually happened was that some ofthe shades of gray were thrown away to minimize the overall errors of devi-ation from the ideal curve, so only 230 or so were used, clearly not an optimalsolution. Fortunately, in 2002 a technique was developed by Image Smiths,Inc., to calibrate almost any consumer-grade color LCD with any standardvideo card and achieve stunning precision, on par with that of the medical-grade display systems. Image Smiths basically challenged the assumption thatone must make red = green = blue in order to produce a shade of gray in apixel. Large deviations will of course produce hues, but what Image Smithsshowed was that very small deviations from that formula can producechanges in perception of luminance without changes in perception of color. Inother words, the rods in the human eye are more sensitive than the cones;therefore, the light output of a color display can be manipulated to producethousands of shades of gray without the perception of color in them. Again,a photometer would sense the subtle hues, but the human eye will not. Thus,even standard consumer-grade displays and video cards can be calibrated tothe DICOM Part 14 GSDF to a very fine precision.
Medical-grade displays come calibrated from the factory and come withcircuitry to maintain that calibration as long as possible. Some will even indi-cate when the display needs to be serviced. The main rate-limiting factor inthe durability of a display is its backlight. The basic assumption is that solong as the backlight’s light output can be kept constant, then the factorycalibration can be considered intact. The medical-grade displays have built-in sensors to monitor the light output and adjust it as necessary to keep itconstant. When the backlight’s output drops to a level at which maximumcompensation (usually increasing the voltage) is inadequate, the backlightneeds to be replaced by the manufacturer, at which point it will be recali-brated. Medical-grade LCD displays have not been around long enough togenerate significant durability statistics, but they are thought to well outlasttheir CRT predecessors. They should last about 5 years instead of the typical
IMAGE DISPLAYS 357
DRE17 11/16/2005 9:52 AM Page 357

1.5 to 2 years of CRTs. Some manufacturers advertise extra-long-life back-lights, but of course only time will tell if they really last.
MOUNT
Most LCD displays come with a standard Video Electronics Standards Asso-ciation (VESA) 100-mm mount in the back. This is desirable because itpermits flexibility in placement of the display. If desired, such a display caneasily be connected to a variety of wall, ceiling, and cart mounts and othertypes of mechanical arms. It is also desirable for the mount to permit pivot-ing the display between portrait and landscape modes.
GRAPHICS CARDS
The graphics card is what connects the display to the computer. Other names for it include graphics board, video board, and video card. Severalfactors affect the suitability of video cards for viewing radiologic images.They include the slot type, video random access memory (VRAM), lookuptables, ability to pivot, maximum resolution, and number and types ofoutputs.
SLOT TYPE
Also called the bus interface, the slot type specifies into which kind of slotthe card is inserted in the computer. This matters because not every card canfit into every computer. For the past 8 years or so, there have been 2 maintypes of expansion slots in a computer—the advanced graphics port (AGP)and peripheral component interconnect (PCI). By design there is only 1AGP slot that can tightly connect only 1 video card to the CPU. Additionalvideo cards, and all other cards such as network interface cards, modems,and sound cards, get plugged into slower PCI slots, of which there can beup to 5 in a single computer. Thus, if a computer already has 1 AGP videocard, additional cards must be PCI. Medical-grade video cards have largelyremained designed for the PCI slot because there was little to be gained byaccommodating the AGP slot and it would limit usability in multiple-monitor setups. Furthermore, some computers with a small form factorchassis can only take a half height AGP card, also called low profile. Such
PACS: A Guide to the Digi tal Revolut ion358
DRE17 11/16/2005 9:52 AM Page 358

computers also tend to have fewer PCI slots, some only 2, which gives lessflexibility for multimonitor setups. The speed differential between PCI and AGP is imperceptible for the static- and stack-mode image viewing ofmost PACS workstations. However, it may be noticeable during three-dimensional (3-D) animations and large cine sequences of ultrasound orcardiac angiography. A new slot type was introduced to the market in thesummer of 2004 called the PCI Express slot. It comes in 4 speeds: 1¥, 4¥,8¥, and 16¥. The 16¥ PCI Express slot replaces the AGP slot on newersystems, and the 1¥ slots are beginning to replace some of the PCI slots.One advantage of this design is that a smaller card (e.g., 1¥) can be used ina larger slot (e.g., 16¥) if so desired, whereas the AGP and PCI standardsare mutually exclusive.
VIDEO RANDOM ACCESS MEMORY
Most video cards come with plenty of VRAM to support 24-bit color depthat their full resolution. Thirty-two megabytes of RAM is plenty to drive a2-MP display, and many cards come with 64MB or more. Additional VRAMonly becomes an issue with complex 3-D rendering.
LOOKUP TABLES
The lookup table, also called a gamma correction table, is where the cor-rection factors from the DICOM calibration are stored. Since this is reallya function of the display, the best place for it is in the display itself. Whilethis may change in the future, most displays can not accommodate thelookup table, so it is stored in the video card instead, and the video cardapplies the corrections before it sends its signal out to the display. Theimportant thing to understand about lookup tables is that without them,DICOM calibration cannot be performed. Fortunately, all video cards todayhave a lookup table. However, one is needed for each display attached to thecard, and some dual-headed cards have only one lookup table. Therefore,only dual-headed cards with 2 lookup tables—one for each head, should beused for radiologic image viewing. Furthermore, if a multimonitor worksta-tion is calibrated, and then the cables are disconnected in order to move theworkstation, care must be taken to make sure the cables get reconnected totheir original video card heads. Otherwise, the calibrations will be appliedto the wrong displays.
IMAGE DISPLAYS 359
DRE17 11/16/2005 9:52 AM Page 359

PIVOTING
In order for a display to pivot between portrait and landscape modes, it must (1) have a base that pivots and (2) have a means of rotating the display contents 90 degrees. Many consumer-grade manufacturers include softwarethat will perform the rotation. While this may work fine for a single low-resolution display, it is inadvisable for higher-resolution and multimonitorsetups, as it places a considerable burden on the computer’s central process-ing unit (CPU) and will likely slow down system performance. It is prefer-able that the video card itself perform the rotation. Some do and some donot; this function needs to be checked before a card for such a purpose ispurchased.
RESOLUTION AND OUTPUTS
For many years the standard video graphics adapter (VGA) analog videooutput remained unchanged. So long as CRTs were used, there was no needto change it. But the introduction of flat-panel LCD displays brought a newtype of interface between the computer and the display called digital visualinterface (DVI). Bearing many more pins, the DVI connection can carry 1analog and up to 2 digital signals to a display. The intent is for the analogsignal method to be phased out over time. Today, the overwhelming major-ity of video cards in use have analog outputs only, so most users of digitalflat panels send them an analog signal. However, this involves taking thedigital signal from the computer’s CPU, converting it to an analog signal inthe video card, and then converting it back to a digital signal in the flat-paneldisplay. Clearly, this is illogical and is highly prone to artifacts from the twoconversions. This is especially noticeable in locations with significant elec-trical interference, which is quite common in hospitals. Therefore, when-ever possible, a digital DVI signal should always be connected to a flat panel forradiologic viewing. However, DVI outputs have some limitations that do notexist with analog outputs. Most analog outputs can drive up to 3MPs at afull 60Hz refresh rate and 24-bit color. In contrast, many DVI outputs arelimited to only 1.3MPs (1280 ¥ 1024) at 24-bit color. This is changing, andthere are several DVI cards available today that can support 2MP (1600 ¥1200) at 24-bit color.
There are very few color displays that run above 2MP today; those that do utilize multiple DVI connections to support their needs. It shouldbe pointed out that medical-grade displays typically come with their owncustom-designed video cards, which will provide the best performance from
PACS: A Guide to the Digi tal Revolut ion360
DRE17 11/16/2005 9:52 AM Page 360

these displays. Dual-headed display cards are often the best way to supportmultiple monitors, rather than using multiple single-headed cards. First, theytend to be cheaper; second, they conserve PCI slots. Some quad-headedcards exist, too.
GRAYSCALE VERSUS COLOR AND MEDICALGRADE VERSUS CONSUMER GRADE
Why have medical-grade displays traditionally been grayscale? The mainreason is luminance. What was true in the CRT world is true in the LCDworld, albeit for different reasons: a monochrome display is brighter than itscolor counterpart. The way LCD displays produce colors is by having eachpixel consist of 3 subpixels, each covered with a color filter: red, green, orblue. The way these filters produce their respective colors is by filtering outthe other two colors. The blue filter, for example, filters out red and green.The net impact is a considerable attenuation of the backlight in order toproduce these colors. Grayscale displays just have the filters left off duringthe manufacturing process, which lets more light shine through. The resultis a display with a maximum luminance of about 700 nits instead of the typical250 nits of consumer displays. While this may be desirable for radiography,it prevents viewing of color Doppler ultrasound signals, nuclear medicinecolor scale images, and positron emission tomography (PET)/CT fusionimages. Display of color is also becoming increasingly important as func-tional MRI (fMRI) and computer-aided diagnosis (CAD) move further intothe mainstream. Therefore, most PACS installations include a variety ofmonitor types, depending on the study mix at the institution and whichexams tend to get read where. Further flexibility is obtained by using colordisplays alongside grayscale displays, giving the radiologist a choice depend-ing on the type of exam he or she wants to view. As of this writing, a consumer-grade 1.3-MP display was recently introduced to the market witha luminance of 400 nits. It remains to be seen whether this will mark thebeginning of a trend toward brighter consumer-grade displays.
In sum, medical-grade higher-resolution grayscale displays have been optimized for radiography and are probably best suited for routineprimary diagnosis of radiography. But for other modalities and for non-routine viewing, consumer-grade, color flat-panel displays are becoming aviable and sometimes better alternative. As these displays evolve, the dis-tinction between the medical-grade and consumer-grade display will con-tinue to blur.
IMAGE DISPLAYS 361
DRE17 11/16/2005 9:52 AM Page 361

OPERATING ROOM DISPLAYS
Displaying images in the operating room (OR) presents a somewhat differ-ent set of challenges. Primary diagnosis is seldom performed here except forchecking intraoperative images. Furthermore, the ambient light is often sig-nificant and cannot be eliminated. Some surgeons prefer regular color flatpanels. These can be mounted on the wall, on a boom suspended from theceiling, or on a mobile cart. Some may insist on medical-grade grayscale dis-plays. Another possibility to consider is the large 30- and 40-in. LCD dis-plays. These displays are large in physical size, but only 1MP in resolution(1280 ¥ 768). Accordingly, their pixel pitch is on the order of 600mm—huge.These displays look good only at a minimum of 6 ft away; they are meantonly for distance viewing, like television screens. But they are brighter, too,at about 350 nits, to accommodate this distance. These displays have beeninstalled at both MGH and Staten Island University Hospital and have metwith measured success.
DISPLAY ERGONOMICS
Ergonomics is an important topic about which most radiologists are unfor-tunately uninformed. There are a few basic rules to follow to avoid injuryand strain from long hours reading at a diagnostic workstation. First, thechair should be adjusted so that the radiologist’s feet are resting flat on thefloor (not dangling), with the knees bent at 90 degrees. Next, the top of the displays should be level with the eyes, so that the displays lie in thenatural viewing angle for the neck. The keyboard and mouse should be levelwith the arms, which should be resting comfortably on armrests. Therefore,the chair should have an adjustable height and armrests. Also, the height ofthe monitors and the height of the keyboard and mouse should be inde-pendently adjustable. Such tables are available from at least 2 companies, andare targeted for the radiology profession.
PACS: A Guide to the Digi tal Revolut ion362
DRE17 11/16/2005 9:52 AM Page 362

DIGITALMAMMOGRAPHY
MARTIN J. YAFFE
The development of digital mammography was motivated by the potentialto improve sensitivity and specificity in detection of breast cancer. In
screen-film mammography, the processes of image acquisition, storage, anddisplay are all tightly linked, which necessitates important compromises. Forexample, as phosphor screens are made thicker to absorb x-rays more effi-ciently, the increased diffusion of light reduces spatial resolution. Film addsrandom fluctuation to the image due to its granularity, reducing the imagesignal-to-noise ratio (SNR). Furthermore, the response of the screen-filmcombination is highly nonlinear with x-ray exposure, causing both imagecontrast and SNR to fall off sharply outside a relatively narrow intermedi-ate range of exposures. Consequently, image quality deteriorates in areas ofthe image depicting the more radiolucent and radio-opaque parts of thebreast. The storage and retrieval of film mammograms is inefficient; filmsare occasionally lost and frequently misplaced. Because there is only a singleinstance of the image, consultation can only occur if the radiologist, the film,and the other discussant are all in the same room. Finally, it is difficult toextract quantitative information from a film image and the quality of thatinformation is limited because of the SNR problems already discussed.
18CHAPTER
DRE18 11/16/2005 9:53 AM Page 363
In digital mammography, the processes of image acquisition,storage/retrieval, and display are separated, allowing optimization of each.Acquisition is performed using an electronic x-ray detector whose output is digitized. The image is stored on disk and displayed either on a high-resolution softcopy device or on a film by laser printing. The initially con-tinuous x-ray image is spatially sampled, and the signal level is also discretelyquantized. Spatial sampling is performed either by using an x-ray detectorthat is pixelated, that is, divided into a matrix of discrete sensing elements,or by mechanical scanning of either the entire detector or the detectorreadout system. Sampling of signal level occurs in the analog-to-digital con-version process. The number of bits digitization must be adequate to repre-sent subtle difference in x-ray attenuation by tissue over a wide dynamicrange of x-ray exposure.
To be useful, the digital detector must image as much of the breasttissue as possible, and the spatial resolution must be high enough to allowadequate visualization of the fine detail structures in the breast, for example,morphology and clustering characteristics of microcalcifications and spicu-lations radiating from tumors. To attain high spatial resolution, the imageelement or pixel must be smaller (100mm or less) than that used for generalradiographic applications. The number of image elements required is justthe ratio between the overall image area and the area of the individual imageelement.
IMAGE ACQUISITION
In screen-film mammography, the overall limiting spatial resolution is typi-cally at least 16 line pairs per millimeter (lp/mm). Sampling theory impliesthat to provide such resolution, the required dimension of the image elementmust be 0.031mm (31mm) or less. In many cases, it is not practical with thetechnologies used to produce electronic detectors to fabricate devices withelements that small. Currently, digital mammography detectors with squaredetector elements (dels) of dimensions 50, 70, 85, and 100 mm are commer-cially available. One manufacturer of digital mammography equipment pro-vides the capability of producing a partial image with dels of 25mm.
The requirements for quantization of signal level are dictated by themaximum attenuation factor of the breast and the required precision in thepart of the image corresponding to the most attenuating region (thickest,densest part of the breast). If the exposure factors are properly chosen, it isreasonable that the attenuation factor can be restricted to at most 70 or so.For 1% precision, this implies that about 70/0.01 = 7000 discrete signal levels
PACS: A Guide to the Digi tal Revolut ion364
DRE18 11/16/2005 9:53 AM Page 364

are required. This scale can be represented by 13 to 14 bits of digitization.It is also possible to digitize the transmitted x-ray signal logarithmically. Thisis done in the case of systems using photostimulable phosphor plates asdetectors. This reduces the requirement to accommodate the dynamic rangeto 10 bits. In either case, however, 2 bytes of storage are required for eachimage element. This results in unused bits, “an overhead” of between 13%and 38%. The currently available digital mammography systems are sum-marized in Table 18.1 in terms of the number of bits used, the del size, thematrix dimensions, and the consequent size of the images.
In mammography, typically 4 views are acquired per bilateral exami-nation. The daily volume of data, V, in megabytes (MB), that must be storedfrom all the digital mammography units in a department is:
V = S * 4 * nd * nr
where S is the size (in MB) of each digital mammogram, nd is the numberof bilateral patient exams per day, and nr is the number of mammographyrooms. Table 18.2 gives the total annual data volumes produced from digitalmammography under a variety of operational scenarios.
Some mammography units provide output images at 2 levels. The raw image is essentially the image from the detector on which only some
DIGITAL MAMMOGRAPHY 365
TABLE 18.1Detector Element Size, Matrix Dimensions, Bit Depth, and Image Size(s) in MB for
Current Digital Mammography Systems
NominalDetectorElement Matrix Bit MB per
System Size (mm) Dimensions Depth Image
Fischer Senoscan 54 4095 ¥ 5625 12 43.9Fuji 50 4728 ¥ 5928 10 (log) 53.5 (32)
(3540 ¥ 4740)GE Senographe 2000DS 100 1914 ¥ 2294 14 8.4Lorad Selenia 70 3328 ¥ 4096 14 26 (16.3)
(2560 ¥ 3328)Sectra 50 4608 ¥ 5200 14 45.7XCounter 60 4000 ¥ 5000 17 57.2
DRE18 11/16/2005 9:53 AM Page 365
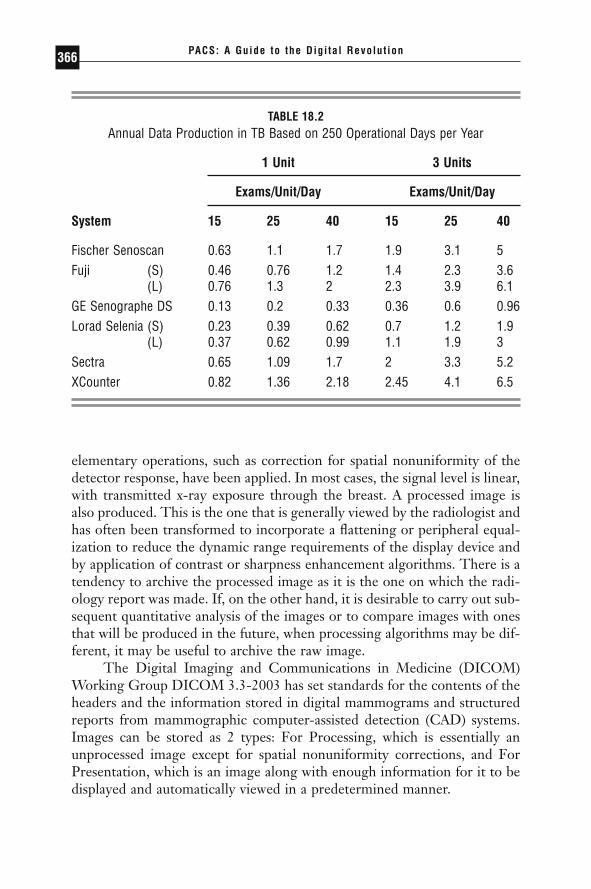
elementary operations, such as correction for spatial nonuniformity of thedetector response, have been applied. In most cases, the signal level is linear,with transmitted x-ray exposure through the breast. A processed image isalso produced. This is the one that is generally viewed by the radiologist andhas often been transformed to incorporate a flattening or peripheral equal-ization to reduce the dynamic range requirements of the display device andby application of contrast or sharpness enhancement algorithms. There is atendency to archive the processed image as it is the one on which the radi-ology report was made. If, on the other hand, it is desirable to carry out sub-sequent quantitative analysis of the images or to compare images with onesthat will be produced in the future, when processing algorithms may be dif-ferent, it may be useful to archive the raw image.
The Digital Imaging and Communications in Medicine (DICOM)Working Group DICOM 3.3-2003 has set standards for the contents of theheaders and the information stored in digital mammograms and structuredreports from mammographic computer-assisted detection (CAD) systems.Images can be stored as 2 types: For Processing, which is essentially anunprocessed image except for spatial nonuniformity corrections, and ForPresentation, which is an image along with enough information for it to bedisplayed and automatically viewed in a predetermined manner.
PACS: A Guide to the Digi tal Revolut ion366
TABLE 18.2Annual Data Production in TB Based on 250 Operational Days per Year
1 Unit 3 Units
Exams/Unit/Day Exams/Unit/Day
System 15 25 40 15 25 40
Fischer Senoscan 0.63 1.1 1.7 1.9 3.1 5Fuji (S) 0.46 0.76 1.2 1.4 2.3 3.6
(L) 0.76 1.3 2 2.3 3.9 6.1GE Senographe DS 0.13 0.2 0.33 0.36 0.6 0.96Lorad Selenia (S) 0.23 0.39 0.62 0.7 1.2 1.9
(L) 0.37 0.62 0.99 1.1 1.9 3Sectra 0.65 1.09 1.7 2 3.3 5.2XCounter 0.82 1.36 2.18 2.45 4.1 6.5
DRE18 11/16/2005 9:53 AM Page 366

The DICOM Grayscale Softcopy Presentation State is a separateDICOM object containing a group of tags identifying the image and variousdisplay parameters. It gives the ability to convey an intended presentationstate or record a desired presentation state. It includes capabilities for specifying:
◗ Output grayscale space in presentation values (P-Values)◗ Grayscale contrast transformation◗ Mask subtraction for multiframe images◗ Selection of the area of the image to display and whether to rotate
or flip it◗ Image and display relative annotations, including graphics, text, and
overlays
Softcopy Presentation State refers to the grayscale image transforma-tions that are to be applied in an explicitly defined manner to convert thestored image pixel data values in a Composite Image Storage Instance to P-Values when an image is displayed on a softcopy device. The P-Values arein a device-independent, perceptually linear space that is formally defined inDICOM PS 3.14 Grayscale Standard Display Function. At the present time,not all vendors of digital mammography systems support the DICOM Pre-sentation State or comply with the Standard DICOM Grayscale DisplayFunction.
IMAGE RETRIEVAL
As digital mammograms are very large and, in many cases, may have to bedownloaded from a central PACS archive to a specialized high-resolutionworkstation for review, it is essential that communication bandwidth be suf-ficient to avoid bottlenecks. Note that for image element sizes of 50mm and 100mm, transmission of a 4-view examination at standard modem rates(56Kb/s) would require about 7 hours and 1.8 hours, respectively. With full100Mb/s bandwidth, these times would be reduced to 14.4 and 3.8 seconds,although, in practice, bandwidth generally must be shared with other appli-cations. As mammography examinations are normally scheduled in advanceof the visit, most PACS systems use the worklist to pre-fetch, or downloadimages from previous examinations during low-demand periods, such as atnight, so that they are readily available when required for comparison.Images are often sent to the PACS system, as well as the diagnostic work-
DIGITAL MAMMOGRAPHY 367
DRE18 11/16/2005 9:53 AM Page 367

station used for that modality, so that they will be available for immediateviewing.
Data compression can significantly reduce the size of images. JPEGProcess 14 lossless compression, which is endorsed in the DICOM Standardcan provide a reduction in size by a factor of about 7 times for mammogramsin which there is a saturated background. This is accomplished by removingthe blank bits in each pixel value and using a technique such as run lengthencoding to represent the area outside the breast more efficiently. A PACSsystem should be able to store and expand images provided in compressionformats meeting DICOM specifications. Primarily for medico-legal reasonslossy compression is not currently considered acceptable for mammographicimaging.
Despite the claims of compliance with the DICOM standard made by the manufacturers of various digital mammography units and PACSsystems, it is still quite common to encounter compatibility problems when storing DICOM images to and retrieving them from PACS systems.This is particularly true when using technology from different vendors. The person(s) responsible for integrating the systems must carefully read the DICOM conformance statements of the different components. Theyshould also be prepared to spend considerable time and effort working with the vendors to ensure that images can be satisfactorily stored andretrieved.
IMAGE DISPLAY
As has been shown, digital mammograms are very large. Displaying themeffectively is challenging. The range of signal levels exceeds that of laser filmand also that which can be displayed simultaneously on either cathode-raytube (CRT) or liquid crystal display (LCD) flat-panel monitors. For hard-copy printing, it is therefore necessary to apply a lookup table to reduce thedynamic range, while rendering the most relevant features in the mammo-gram with good contrast. Generally some type of peripheral equalization isautomatically applied to the image data. Linear or nonlinear transformationscan then be performed. This can either be done automatically, generallybased on the image histogram of signal levels, or manually by the radiolo-gist or a technologist prior to printing.
For softcopy reading, similar transformations are applied, but they areusually done interactively as the image is viewed. This is effective but inef-ficient; it can take up a significant amount of a radiologist’s time as there isvirtually an infinite range of possible settings of the display lookup table. On
PACS: A Guide to the Digi tal Revolut ion368
DRE18 11/16/2005 9:53 AM Page 368
most systems, an attempt is made to arrive at initial “semi-optimal” displaysettings automatically and quickly. The radiologist may then choose to makesmall improvements in the settings as deemed necessary.
A softcopy workstation should allow rapid adjustment of the positionof individual images so that corresponding views can be matched to evalu-ate asymmetries. Additionally, it should be possible to adjust the contrast ofeither individual images or all images together as required.
Though laser printers have the spatial resolution capability to repre-sent the full number of acquired image elements in a digital mammogram(Table 18.1), except for the case of the smallest (GE) image, even the highest-resolution softcopy displays do not. For this reason, some facilities chooseto print images and view them on a standard mammographic transillumina-tor. This also allows multiple views of the current and a previous examina-tion to be simultaneously displayed in a convenient manner. Even in anall-digital department, there needs to be a high-quality mammographic viewbox in order to review previous films from patients and outside films.
On the other hand, once an image is printed, its display characteristicsare fixed and if it is desired to explore the signal level space to investigatesubtle structural findings, it would be necessary to readjust the image on softcopy and then reprint it. This is time consuming and detracts from thepotential value of having a digital image.
If digital mammograms are to be displayed in soft copy, it is necessaryto use specialized display strategies to represent all the acquired information.Current high-resolution displays have formats of 2048 ¥ 2500 (5 megapixel[MP] display) or 3840 ¥ 2400 (9.2MP display). For 100mm image elements,it is possible to represent each element by a pixel and display 1 image at fullacquired resolution on a monitor. For smaller elements or for multi-imagedisplay per monitor, this is not possible. To visualize the entire breast, imagescan be down-sampled by averaging adjacent elements, linearly interpolatingvalues or simply selecting appropriately spaced pixels to reduce the size ofthe image. This, of course, results in reduced spatial resolution. This can bedone to the point where 2 views can be displayed on the monitor back toback for correlation or comparison. These might be corresponding views ofeach breast, craniocaudal versus mediolateral oblique view, or correspondingcurrent and previous views. This overview allows the radiologist to lookglobally for signs of disease.
If suspicious areas are identified, then the image must be zoomed (areversal of the averaging process) to recover the full acquired resolution inviewing a region of interest in the breast. Of course, it is critical that signsof cancer must not be missed in viewing the initial, low-resolution versionof the image. In our own research, we are exploring one approach to avoid-
DIGITAL MAMMOGRAPHY 369
DRE18 11/16/2005 9:53 AM Page 369
ing such a problem by applying a CAD algorithm on the underlying acquiredimage data to indicate to the viewer the possible presence of suspiciousabnormalities.
Recent studies on the efficiency of digital mammography have shownthat the examination throughput is improved with respect to the imageacquisition by the technologist. Because of the manipulations describedabove, the time spent by the radiologist on image interpretation is longerwith digital compared to screen-film mammography. Some possibilities forautomated image adjustment have already been suggested. Additional strate-gies to streamline image viewing and navigation would be very desirable interms of making digital mammography more user friendly.
WORKSTATION DESIGN
The demands of softcopy display of digital mammography preclude the useof monitors with less than 5MP capacity for image interpretation. It is notsuitable to employ standard PC monitors for this purpose. In order to havereasonable efficiency of image reading, at least a 2-monitor workstation isnecessary. The system should allow rapid image “hanging” in different con-figurations and standard sequences that can be customized to suit the pre-ferred reading protocol of individual radiologists.
An effective means of comparing current digital and previous filmmammograms is very unlikely. Disparities in physical size of images and theneed to locate a bright illuminator near the workstation where stray lightcan shine on the surface of the digital monitor and reduce image quality arereal problems. One solution is to have the ability to digitize the old mam-mograms easily so that they could be presented alongside the current images.
Ideally, it should be possible to be able to display 8 digital mammo-graphic images at full resolution simultaneously—2 views of each breast forthe current and previous examinations. Because of the cost, limitations ofmonitors and viewing angle considerations, this is not practical, and it is nec-essary to move electronic images onto the display for making comparisons.
Throughput is a critical factor in mammography, and any design fea-tures contributing to improved efficiency of image interpretation would bevaluable. Such features might include integrated presentation of CAD marksthat could be toggled on and off and superimposed directly on the mam-mogram as well as voice recognition software that generates a textual radi-ologist’s report in a structured format.
Another opportunity to facilitate image interpretation is to bringsources of complementary information together on the same screen. For
PACS: A Guide to the Digi tal Revolut ion370
DRE18 11/16/2005 9:53 AM Page 370

example, the high spatial resolution anatomical information from digitalmammography can be fused with breast ultrasound and functional imageinformation on angiogenesis, water content, or metabolism from magneticresonance imaging, positron-emission tomography, and the like. Cursorsthat relate spatial locations between images would also speed the interaction.
INTERACTION BETWEEN MULTIPLE SYSTEMS
One of the impediments of digital mammography in its current implemen-tation is the tight linkage of workstations from 1 vendor to the image acqui-sition system for that vendor. To some extent this is historical and simplyreflects the necessity of communicating certain key pieces of informationbetween the systems to ensure the most effective display of images. If systemsconform in spirit with the DICOM standard, it should be possible for imagesacquired on any system to be displayed on any workstation meeting certainspecifications. In fact, future FDA approval of digital mammography systemsis likely to separate the acquisition and display systems in terms of how theyare handled. A possible requirement for primary display stations may be conformance with the DICOM Grayscale Display Standard, support for the DICOM Presentation States, and American Association of Physicists inMedicine (AAPM) Task Group 18 quality standards. It is probable that facil-ities will purchase digital mammography systems and other complementarybreast imaging systems from a range of manufacturers, so it is important thatindustry leaders work to facilitate interoperability.
◗ REFERENCES
Digital Imaging and Communications in Medicine (DICOM) PS 3.4-2003 NationalElectrical Manufacturers Association 1300 N. 17th Street Rosslyn, Virginia22209 USA DICOM PS 3.14 Grayscale Standard Display Function.
Digital Imaging and Communications in Medicine (DICOM) PS 3.5-2004 NationalElectrical Manufacturers Association 1300 N. 17th Street Rosslyn, Virginia22209 USA Part 5 Data Structures and Encoding, Section 8.2.1, p48 and AnnexA.4-3, p68.
Yaffe MJ. Detectors for digital mammography In: Pisano ED, Yaffe MJ, and KuzmiacCM, eds. Digital Mammography. Lippincott Williams and Wilkins, Philadel-phia 2004.
DIGITAL MAMMOGRAPHY 371
DRE18 11/16/2005 9:53 AM Page 371

WEB DISTRIBUTION
KEITH J. DREYER
At the heart of the digital radiology department are two main computa-tional systems, the radiology information system (RIS) and the picture
archiving and communication system (PACS) (Figure 19.1). Although thesetechnologies continue to converge, their functions within an enterpriseremain unchanged. The RIS encompasses many text-based computing func-tions including transcription, reporting, ordering, scheduling, tracking, andbilling. The PACS deals with image-based computing functions such asacquisition, interpretation, storage, and local image distribution. The properuse of these automated systems dramatically reduces the use of film and paper within a radiology department. However, removing film and paperremoves the conventional method for distributing radiology informationthroughout the hospital. Because the goal of any radiology department is to deliver timely and accurate interpretations to requesting clinicians, thedigital department needs a digital method to deliver its results. Enter theInternet.
19CHAPTER
DRE19 11/16/2005 9:55 AM Page 373

THE INTERNET
An introduction to the emerging world of enterprise image distributionrequires a basic understanding of the terminology and jargon associated withthe Internet and the World Wide Web. For some, this is new and funda-mental information; for others, a review.
The Internet (Figure 19.2) is a collection of computers (i.e., a network)communicating over a variety of transmission lines throughout the world,using a single common protocol known as transfer communication proto-
PACS: A Guide to the Digi tal Revolut ion374
FIGURE 19.1
The digital radiology department.
--
--
FIGURE 19.2
Advantages of the Internet.
DRE19 11/16/2005 9:55 AM Page 374

col/Internet protocol, or TCP/IP. This low-level protocol essentially allowsall the computers in the world to communicate. It allows computer users andprograms to communicate with each other using higher-level protocols suchas SMTP (simple mail transport protocol, i.e., e-mail) (Figure 19.3). Hyper-text transport protocol (HTTP) allows the distribution of text and images(and a variety of other media types) and is commonly referred to as the WorldWide Web (or the Web for short). It is easy to see why the idea of using auniversal way to transmit and receive text and images—the Web—to dis-tribute radiologic information is becoming so generally accepted. Essentially,it is the process of turning your digital radiology department into a Web site.And, as with all successful Web businesses, the Web does not change yourbusiness (radiology) or your customers (clinicians), it just changes the wayyou deliver your business to your customers. If done correctly, Web distri-bution can offer great efficiencies to you and your clinicians.
Of note, on top of the HTTP protocol sit several languages that definethe details of the Web pages. Hypertext markup language (HTML) is theWeb’s basic language and has been in place since 1994. Extensible markuplanguage (XML) is a newer language gaining steam in the Web world dueto its ability to separate data from display parameters, thus preserving thestructure of all data fields. What does this mean? It means, for example, thateven if a patient’s medical record number is deeply buried in the middle ofa Web page written in XML, a computer program reading that page (yes,they can read Web pages, too) could find it easily and use it to access moreinformation on the patient from a different Web site. Extensible markup lan-guage is becoming the de facto standard for electronic data interconnect
WEB DISTRIBUTION 375
SMTP—Simple Mail Transport Protocol
FTP—File Transport Protocol
HTTP—Hypertext Transport Prot Protocol- HTML—Hypertext Markup Language
- XML—Extensible Markup Language
FIGURE 19.3
Common protocols available over the Internet.
DRE19 11/16/2005 9:55 AM Page 375

(EDI), a way for computer programs (running on different computers) toreference each other through Web services, such as a radiology Web imageserver connecting to a hospital EMR (electronic medical record).
HOSPITAL-WIDE IMAGE DISTRIBUTION
With the installation of PACS at many institutions around the United States,the task of distributing images to referring clinicians becomes a challenge.In the legacy system, physicians who wish to view their images rely onobtaining their films from the radiology department’s film library. Often,these films are used to communicate with patients, family members, and con-sultants for patient education and patient management. The advent of PACSeliminates this classic film-based workflow. The use of preexisting intranetto distribute images is a well-accepted practice within hospitals due to itsubiquity, portability, and reasonable cost (Figure 19.4). (The intranet is thepart of the Internet that is behind your hospital’s firewall. See Chapter 14,“Networking Fundamentals,” for more detail.) The Internet, and associatedhospital intranets, has increasingly become the technological basis for bothimage management within the radiology department and image distributionto the enterprise (Figure 19.5). For hospitals with legacy PACS installationsthat have not been designed around Web technology, vendors are able toadd Web-based solutions with relative ease. Central to the appeal of Web-based distribution is the ability for any physician, anywhere, whether at home
PACS: A Guide to the Digi tal Revolut ion376
FIGURE 19.4
Typical components of a PACS intranet.
DRE19 11/16/2005 9:55 AM Page 376

or within the clinical setting, to use a personal computer as a virtual lightbox and view radiologic images and reports.
Early in the process, visionaries in the PACS arena predicted that the problem of image management and distribution should be approachedfrom an enterprise point of view—creating a digital imaging architecture inradiology that would be integrated into the electronic medical record. The guiding principle in system design should be that images go whereveralphanumeric medical information goes, a task best achieved by a flexible,integrated Web-based solution. The various protocols available allow thisflow of information with guaranteed connectivity (Figure 19.6).
WEB DISTRIBUTION 377
--
-
You Own ItVariety of Pipes with Guaranteed Speed
Good for Short Runs
FIGURE 19.5
Advantages and disadvantages of an intranet.
HL7—RIS and HIS
DICOM—PACS
HTTP—World Wide Web
FIGURE 19.6
Common hospital intranet protocols.
DRE19 11/16/2005 9:55 AM Page 377

COSTS
Many PACS vendors still charge high prices for their primary interpretationworkstations and thus do not offer a viable alternative for referring physi-cians who need to review their ordered examinations. The current ubiquityof the desktop PC is a resource that obviates the need for software-onlyprimary interpretation clients deployable via the Web. For example, Part-ners HealthCare System Inc., Boston, the parent corporation of Massachu-setts General Hospital, currently has more than 32,000 PCs on its intranet.Utilizing this resource for image distribution adds essentially no additionalcost, provided there is a software-only site-licensed client available over theintranet for primary interpretation.
There remains a confusion of pricing of Web-based PACS solutionswithin the industry. The alternatives include cost per user, cost per view (orclick), cost per maximum users, cost per concurrent users, cost per studiesstored, and a one-time cost in annual licensing. This range of pricing struc-tures often creates confusion when comparing products using a price per-formance analysis. In their selection process, hospitals should always requirevendors to converge on the same pricing model. It is the opinion of theauthor that the ideal pricing model is one that results in a one-time capitalexpense for a perpetual software-only license with a 10% to15% recurringannual software maintenance fee that secures all future upgrades. All hard-ware for the Web-based PACS, archive, and enterprise distribution systemshould be purchased directly from the hardware vendor to achieve maximumsavings and direct customer support.
INFRASTRUCTURE
Inherent in standard Web protocol is a client-server relationship. Whereasthe Web server is a computer that contains the images to be distributed forviewing, the client, in this example, is basically the clinician’s PC. The fol-lowing paragraphs describe the requirements for both the server and clientsystems of a typical radiology distribution system.
SERVER
A Web server used for radiology image distribution needs to perform severalfunctions, as follows:
PACS: A Guide to the Digi tal Revolut ion378
DRE19 11/16/2005 9:55 AM Page 378

◗ Accept images from a variety of DICOM sources.◗ Compress images in either a lossy or lossless format (or both).◗ Store compressed images in a local, fast access device (e.g., redun-
dant array of inexpensive disks [RAID]).◗ Archive all image data to a removable media archive (e.g., linear tape
open [LTO])◗ Act as an HTTP server waiting for Web requests over TCP/IP.
Typically, Web servers for radiology are Wintel-based PC servers, availablefrom a variety of vendors, with a range of performance specifications. Sizingthe system for this function requires several factors to be evaluated to provideoptimum performance throughout the enterprise. These factors include cost,speed, number of concurrent users, reliability, and support. If the hospitaldistribution workflow calls for more than one Web server, it should be deter-mined whether each server should have its own archive or if one archiveshould be shared among all servers. In most circumstances, a single archiveshould be shared, with each Web server accessing a common, compressedRAID. As demand increases from clinicians for Web access, more powerfulservers may be needed to maintain performance. One way to accommodatethis growing need is by increasing the server’s processing power and RAM.Another way is simply to increase the number of servers available for thetask. Beware, some vendors’ software architectures will allow for these levelsof upgrades, but others may run only as a single server, resulting in a muchmore expensive and limited upgrade path.
CLIENT
The client device is quite variable (i.e., it can be any form of computer withaccess to the Internet—PDA, Tablet PC, or wireless laptop). In fact, pos-sibly the only commonality necessary among clients is that they contain anHTTP browser to access the server. Further, the browser can be from avariety of manufacturers (Netscape Navigator and Microsoft Explorer arethe most common). Because of the large file sizes and video requirementsfor display of medical images and because the most common client in thehospital setting is an IBM-compatible PC, minimum configurations for PC-based client machines accessing radiology images should be defined by thehospital and supported by the software provider. Again, there is a widevariety among Web PACS vendors regarding minimum configurations. Hos-pitals need to be certain that any potential Web PACS software provides
WEB DISTRIBUTION 379
DRE19 11/16/2005 9:55 AM Page 379

functionality to as many existing PCs as possible within their current infra-structure.
This is one of the most challenging aspects of ubiquitous Web distri-bution. Because any computer on the intranet can access the radiology Webserver, it is often difficult to enforce a minimum client requirement. There-fore, performance is unpredictable. For a new institution, it is simple to recommend the purchase of a certain level of PC. But for most of us, thereis an existing fleet of PCs throughout our institutions that would probablyrequire upgrades to meet the core requirements. For a large institutionaldeployment of clients, it is best to evaluate users’ needs individually to assessthe intent of specific clinical access. Typically, some client computers arededicated to specific clinicians while other systems are common and avail-able to several users (ideally with individual logons and passwords).
EXAMPLE: THE WEB EXPERIENCE ATMASSACHUSETTS GENERAL HOSPITAL
A Web-based primary interpretation client (Figure 19.7) and server solutionwere installed for image distribution (Figure 19.8) as a film alternative thatwould allow the hospital to cost-effectively distribute radiology images to all
PACS: A Guide to the Digi tal Revolut ion380
FIGURE 19.7
Web-based enterprise solution. CR indicates computed radiography;MRI, magnetic resonance imaging; US, ultrasound; CT, computedtomography.
DRE19 11/16/2005 9:55 AM Page 380

clinicians. The growing popularity of the Web guaranteed a degree of famil-iarity with the client software (a browser), which was easy to use and installwith low support costs from the hospital information services department.It was felt that a Web server solution would layer onto any basic securitysystem, such as firewalls, token-delivered coded access numbers, passwordsand usernames, secure sockets layers (SSLs), and virtual private networks(VPNs) (Figure 19.9); and that these technologies, as they evolved, wouldenable the radiology department to ensure security and patient confiden-tiality regardless of the referring physician’s access method and location.Further, integration with the institution’s EMR has provided easy access to the enterprise for Health Insurance Portability and Accountability Act(HIPAA) tracking, central help-desk support, and integration with otherdepartmental result-reporting applications. Incorporated into the Web-based solution is a JPEG2000 wavelet image compressor/decompressor that rapidly distributes compressed images throughout the enterprise withsecondary access to lossless image data upon request. (No one, to date, hasrequested any.) The system is in its tenth year of deployment and continuesto provide real-time image access to more than 5000 users with tremendousreliability.
WEB DISTRIBUTION 381
PCT—Private Communication Technology
SET—Secure Electronic Transaction
S-HTTP—Secure Hypertext Transfer Protocol
SSL—Secure Sockets Layer
VPN—Virtual Private Networks
FIGURE 19.8
Internet security options.
DRE19 11/16/2005 9:55 AM Page 381

CONCLUSION
Converting from film-based radiology to filmless radiology is challenging,to say the least. Many of these challenges exist outside the department ofradiology. Replacing film means providing clinicians with another distribu-tion mechanism. While there is great momentum within hospitals to keepthe status quo, Web distribution offers many advantages over film. The successful deployment of Web servers and client viewers throughout the hospital enterprise will prove critical for the conversion to a truly digital radi-ology environment.
PACS: A Guide to the Digi tal Revolut ion382
FIGURE 19.9
Sample client Web image viewer for computed tomography withselected features from text depicted.
DRE19 11/16/2005 9:55 AM Page 382

CLINICAL ISSUESDAVID S. HIRSCHORN
IV
DRE20 11/16/2005 9:56 AM Page 383

PACSWORKSTATION
SOFTWARE
STEVEN C. HORII
BACKGROUND AND DEFINITIONS
Interpretation of radiographic images, for nearly the entire history of thespecialty, has been based on the viewing of photographic images on a trans-parent or reflective substrate. Early images were photographic emulsions onglass plates, and recent ones are on transparent plastic polymer sheets. Fun-damentally, however, the process is the same whether the images are on glassor plastic; x-radiation exposes areas of the film in inverse proportion to itsabsorption by the body interposed between the x-ray source and the film.This exposure results in a latent image in the silver halide that is convertedto varying amounts of metallic silver through the development process. Theadvent of intensifying screens meant that much of the film exposure was dueto the light emitted as the screens fluoresced in response to x-rays. The resultwas a tremendous effective amplification of the number of photons used to
20CHAPTER
DRE20 11/16/2005 9:56 AM Page 385

expose the film compared to a nonscreen exposure. A consequence, though,was that the spatial resolution of the radiograph was considerably reduced.This change was accepted primarily because of the concomitant decrease inexposure necessary to make the radiographs.
In recent years, images of anatomy that are based on processes otherthan transmission radiography have also been incorporated into radiology.Most notably, these include nuclear medicine images that use radionuclidesattached to molecules to target specific organs or functions, ultrasound thatuses reflected sound waves and magnetic resonance imaging that uses radiofrequency (RF) signals generated by the body in a high-strength magneticfield in response to pulses of external RF energy. Computed tomography(CT) uses a conventional x-ray source but reconstructs cross-sectional imageplanes through the body from the x-ray projected attenuation information.A popular digital replacement for conventional radiography is computedradiography (CR). Reusable phosphor plates replace conventional film-screen cassettes. The plates store the radiographic image as a latent image,and as the plates are scanned with a laser, the latent image fluoresces. Thisfluorescent output is digitized as the plate is scanned. The most currentsensors are arrays of phototransistors that are either direct x-ray detectorsor light-sensitive transistors coupled to a scintillator layer. This has beenreferred to as “direct capture” radiography as no film or phosphor plateintermediary is used.
These techniques require the computer processing of information toform the resulting images. The images, then, are in digital form. They canbe turned into film images by converting the digital values into modulatedlight that exposes film, or they can be turned into softcopy images displayedon a display device, typically a cathode-ray tube (CRT), but increasingly aliquid-crystal flat-panel display. For the purposes of this chapter, a work-station is a device that displays images in electronic form instead of film.This display will be referred to as softcopy as opposed to the hardcopy thatfilm represents.
A BRIEF HISTORY
The concept of a workstation extends back at least as far as the 1950s in thehistory of computer science. Early workstations were terminals connected tomainframe computers. This was a change from “batch” computing, in whicha user submitted a “job” to system operators and sometime later received theprinted output. With workstations, users could interact with the computer
PACS: A Guide to the Digi tal Revolut ion386
DRE20 11/16/2005 9:56 AM Page 386

directly. Early workstations also had a place in military applications, prima-rily owing to Cold War concerns about nuclear attacks on the United States.The Cape Cod air defense system (in the early 1950s) in the United Stateswas one of the first applications of user interaction with a graphical display.This system employed multiple CRT-based display stations with which theuser interacted using a light pen. Many of the individuals involved in theseearly efforts went on to careers that involved furthering the notion of dis-tributed, easy-to-use computing power. Work at the Xerox Palo AltoResearch Center (PARC), in particular, led to many of the concepts thatdefine the modern workstation. These early systems influenced developmentof the Apple Macintosh, X-Windows on UNIX machines, and, morerecently, Microsoft Windows by introducing the fundamental concepts ofthe graphical user interface. Among these concepts are the idea of the point-ing device (e.g., mouse or trackball) that initiates an action on a file orprogram by pointing to it and requiring a manual action (such as clicking amouse button).
Expansion beyond these early mainframe systems required that someof the power of the centralized computer be distributed to smaller com-puters. A most important step in the history of computer science was theintroduction of the microprocessor. This advancement in integrated circuitsput the majority of the circuitry of a room-sized mainframe computer ontoa series of silicon chips about 6 to 10mm on a side. Cost of these micro-processors was so low that true distributed computing became possible.Incorporation into personal computers and workstations took place fairlyrapidly.
The history of workstations for medical imaging is less clear than forworkstations used in more general computer science applications. To someextent, this depends on how one defines a workstation. Taking the definitionto be one of a computer graphics–intensive display device intended tosupport interactive display and manipulation of images by physicians or otherhealthcare professionals, the first “workstations” were likely those used as“independent consoles” for CT scanners, nuclear medicine systems, andradiation therapy planning systems. No doubt many readers of this chaptercan find the occasional example of the very early use of a computer graph-ics display device for medical imaging, but this chapter will concentrate moreon references from the radiological literature.
Very early references on medical imaging workstations are from themid- to late 1970s. Larsen described the application of an image-processingworkstation to CT scans of the head in 1976. Of interest is that Larsen notedthat one of the important ideas of the use of the image processing was that
PACS WORKSTATION SOFTWARE 387
DRE20 11/16/2005 9:56 AM Page 387

it would be interactive so that the user would get rapid visual feedback fromthe processing performed. Lemke et al., describe what may be the firstmedical picture archiving and communications system (PACS) in the litera-ture. The system was designed to perform image processing on head CTimages for enhancement and automated extraction of features such as ven-tricles. It included workstations for image processing and evaluation, a com-puter network for communicating the images, and a filing system for storingthem. Of importance is that this paper referred not only to the processingand display of images, but to the management of them and the integrationof information sources for the medical record such as text and voice anno-tation of the images.
By the time of the first International Workshop and Conference onPACS for Medical Applications in 1982, the concept of a PACS had clearlyspread through much of the radiology research community. The author andcolleagues described a system at that meeting (much like the one outlined byLemke). They constructed the workstation prototype from a minicomputer,graphics display subsystem, and magnetic tape drive. Dwyer and coworkersoutlined many of the requirements for a radiology PACS, including the dataon retrieval rates for radiological examinations that formed the basis of manydesigns for archives. Even from the beginning, many users and some vendorsdescribed the importance of user interfaces, integration with other infor-mation systems, and analysis of what it is that radiologists do when they read films.
THE ROLES OF THE WORKSTATION
The workstation has one of the more difficult jobs within a PACS. While all components of a PACS are needed for the system to operate, the work-station has the unique function in serving as the human interface for thedisplay role. As such, it has to support a user interface that is readily learnedand used, yet be flexible enough to meet the varied needs of different health-care professionals. The film-based environment that is so familiar to radiol-ogists has evolved to the point where the “user interface” is well known andthe roles played by support personnel are transparent unless there is aproblem (see Figure 20.1). Workstations also have to be able faithfully todisplay the information they are sent or, if they cannot, to provide some indi-cation to the user that some change from original data may have occurred.The speed of workstation operations has to be high enough so as not to resultin user frustration but not so high as to drive costs for the hardware toimpractical levels. This author also believes that workstations have to be
PACS: A Guide to the Digi tal Revolut ion388
DRE20 11/16/2005 9:56 AM Page 388

able to provide a clear advantage over film for the users, whether in speed,functions performed, or ability to do tasks not possible with film. If this isnot the case, much of the drive to switch from hardcopy to softcopy will beabsent.
It is important to examine in what roles a workstation will serve. Theone best known to radiologists is the diagnostic role. Many would say thatthis is also the most demanding, as the workstation is being used for primaryreading of examinations. Anything that detracts from the accuracy of theradiologist is likely to be a cause to reject the workstation. However, other
PACS WORKSTATION SOFTWARE 389
FIGURE 20.1
This photograph is of the “workstation” for film-based reading. Thisfilm multiviewer shows up to two panels of four 14 ¥ 17-inch (35¥ 43cm) films at one time. Switches allow any combination of the eight light boxes behind the films to be turned on or off. Thefootswitch on the floor causes the mechanism to move through the panels to display a particular set. The device on the right of thework surface is not a telephone but the digital dictation system.Radiologists are so used to this environment that it is hard for themto enumerate all of the tasks performed in addition to reading thefilms.
DRE20 11/16/2005 9:56 AM Page 389
roles also parallel the use of conventional light boxes and films. There is thereview role that the radiologist also does on examinations that have alreadybeen interpreted. This may be done for groups, as in a conference, or forindividuals, as when consulting specialists seek a radiologist’s opinion. Thereis a review function that the referring physician performs, usually on exam-inations that have already been interpreted by the radiologist. This is oftendone for learning and for confirming treatment decisions. A review use isalso required by other healthcare professionals, including physical therapists,nurse practitioners, respiratory therapists, and others. These roles are impor-tant not only because they help determine the level of performance and func-tions that will be needed, but also because they will shape the user interfacedesign. Certain workstation applications, such as those in an operating room,require special hardware configurations, designed to meet special electricalsafety requirements and with a user interface tailored to hands-free (or sterileoperable) controls.
The distinction between “diagnostic” and “review” workstations, thetwo major subclasses of user requirements, has been used to define hardwarerequirements and some software functions and was typically based onequipment location (“diagnostic” in radiology reading rooms; “review” else-where). However, with the increasing use of images for guiding therapy orplanning and performing surgery, the diagnostic role now extends beyondradiology into other specialties. Rather than divide workstations into cate-gories based on their location in a radiology department or outside of it, this author believes the classification should be based on the workstationapplication.
Different clinical specialists will likely have requirements for the work-station that vary from those of radiologists. The author conducted a studycomparing medical intensive care unit (MICU) physicians with radiologistsusing a workstation for portable chest radiographs done on CR plates. Hefound that some functions were used more frequently by the radiologiststhan by their MICU colleagues. In particular, the radiologists used thegrayscale adjustment (“window” and “level”) more frequently than did theMICU physicians. However, the MICU physicians used the other worksta-tion image manipulation functions (zoom, invert, and full-resolution display)more frequently than did the radiologists. In the task evaluated (readingportable chest radiographs), the radiologists were doing primary interpreta-tion of the images. Such studies tend to be limited to specific image cate-gories or reading conditions and should not be used to generalize a list ofworkstation functions. However, such studies may be useful in determiningwhich functions are most readily selected under different workstation usescenarios.
PACS: A Guide to the Digi tal Revolut ion390
DRE20 11/16/2005 9:56 AM Page 390

WORKSTATION HARDWARE
Aspects of workstation hardware are also discussed in other chapters of thisbook. However, a short overview of displays is provided here since the soft-ware interaction with the display devices is often close. Other sections of thischapter discuss aspects of the workstation hardware that influence, or areneeded by, the workstation software.
While being displayed, the image is stored in the same sort of memoryused for computer information: solid-state random-access memory (RAM).Since the type of CRT used in medical image displays does not store theimage, the memory is used to “refresh” the display, typically at a rate of 60 or more times per second. The type of liquid crystal display most com-monly used for medical imaging is the active matrix liquid crystal display(AMLCD, or simply LCD). These are the same as used in almost all laptopcomputers. Since each display element is a set of transistors that act asmemory, the display is refreshed only if the image on the screen changes.Since the refresh process for CRTs and the update for LCDs need to be fast,separate memory called a frame buffer is part of the display system. Incurrent workstations, this memory is on a separate circuit card that often has additional processing circuits on it to speed up the operations usuallydone on images (changing grayscale, displaying graphics elements, support-ing zoom operations). Most workstations also have some form of storage for the images not currently in the frame buffer. This is usually magneticdisk, but large amounts of RAM also sometimes serve as intermediatestorage. Images are transferred to this RAM area from magnetic disk, otherstorage devices, or the network, and can then be moved to the frame buffermuch more rapidly than if they were transferred directly from the otherstorage.
Displays, whether CRT or LCD, are characterized by whether they arecolor or monochrome and by how large an array of pixels they can display.Typical resolutions are described by the number of pixels that can be dis-played simultaneously. Note that the frame buffer memory may, in some circumstances, store a larger image pixel matrix than can be completely displayed on the connected display device. For reference, most personalcomputer displays are color, 1024 ¥ 768 pixels. This is referred to as a “three-quarter megapixel [MP]” display (the total is actually 786,432 pixels). Otherdisplay resolutions are often available on personal computers; increasing to1280 ¥ 960 pixels results in a “1.2 megapixel” display (actual: 1,228,800pixels). Medical displays are more typically monochrome with display matrixsizes ranging from 1280 ¥ 1024 (1.3MP) to 2560 ¥ 2048 (5MP). An inter-mediate display matrix of 2048 ¥ 1520 pixels (3MP) is becoming more
PACS WORKSTATION SOFTWARE 391
DRE20 11/16/2005 9:56 AM Page 391
popular for many clinical applications, including diagnostic work. Recentavailability of a 9-MPdisplay has resulted in some prototype workstationsthat use the display to show 2CR images simultaneously.
Many PACS workstation vendors are moving toward a “standard”hardware configuration of 3 LCD displays per workstation: a single colordisplay and a pair of 3-MP grayscale panels. A pair of 5-MP displays can besubstituted for tasks that commonly rely on high resolution (some pediatricand adult musculoskeletal work, digital mammography, and some chest radi-ography). The color flat panel is typically used for display of integrated dic-tation system controls, radiology information system (RIS) or electronicmedical record displays, and worklists. The color panel can also be used forthe display of color-containing images, such as ultrasound, nuclear medicine,and three-dimensional (3-D) rendered studies, when needed.
Most workstation CRTs are being replaced with LCD flat panels forsales of new systems and retrofitted to older systems, particularly as CRTsreach their end of life or PACS are updated.
WORKSTATION SOFTWARE: SOFTWARE FOROPERATIONS AND FUNCTIONS
The software running on the workstation determines what functions it supports and how the user interacts with it. Before one examines worksta-tion software design concepts, an examination of what users need to accomplish at workstations and how they interact with the software andhardware is a useful beginning. Workstation functions and the user interfaceare the two major areas of software design that will be considered in thissection.
A basic requirement for workstations is speed. Some types of film alter-nators (multiviewers) can move films so fast that they go by in a blur (thetransparent band types). Even the slower film alternators can move 8 sheetsof film (amounting to some 96 to 120 images for many of the cross-sectionalimaging methods) in some 3 to 5 seconds. This is a very high performanceto match in a workstation. For the example of CR films, moving 8 of themin 3 to 5 seconds amounts to a data rate of some 10 to 16 megabytes persecond. In general, an image display time of less than 2 seconds from thetime the image is selected for display is a desirable target speed. Most userswill not tolerate display times longer than this for routine displays. If theyunderstand that an ad hoc request is taking longer because of the time tofetch the study from the archive, they are more willing to tolerate a longer
PACS: A Guide to the Digi tal Revolut ion392
DRE20 11/16/2005 9:56 AM Page 392
delay. It is desirable to provide either a progress indicator for, or a noticeabout, how long such a retrieve will take. This avoids the problem of theuser being unaware about whether or not the system is working. With a multitasking workstation, a retrieve can be done in the background whileother processes (for example, reading another study) can take place in theforeground. A feature that was implemented on the workstation developedat the University of Pennsylvania took advantage of common user actions.Kept on local disk would be the current examination plus up to 4 priorstudies. However, icons for up to 4 studies older than the first 4 were alsodisplayed. The software automatically displayed the current examination plusthe most recent previous study, and users could select older examinations byclicking on the icons. Once a user selected the third prior study, the soft-ware would assume that even earlier studies might be desired and would ini-tiate a request from the archive for the older studies. In this way, if the usergot to the fifth older examination, it would either have been loaded from thearchive or the retrieve would be in process. Since most users did not requeststudies beyond the second or third, this avoided filling local storage withexaminations that were unlikely to be reviewed.
Workstations also have to provide for a navigation method for findingexaminations to be read, comparison studies (older examinations of the sametype), and correlation examinations (current or prior examinations of a dif-ferent type). This navigation process is related closely to the user interfaceand the mental model assumed. The user interface issues are discussed sub-sequently. Table 20.1 lists commonly encountered navigation functions. Onmost PACS workstations, the study navigation process is handled throughworklists. These are often developed specifically for a medical imagingdepartment and may vary by section of the department and by who isreading. Typically, worklists include such basics as unread studies, emergencystudies, and resident-interpreted studies for review. Since worklists will vary greatly by facility, it is more important to understand the concept of the worklist than to understand the specific types. The basic idea behind aworklist is to provide the radiologist with a list of work to be done. Ideally,the worklists are also managed by the PACS (or the RIS, or the PACS andRIS in conjunction) so that, for example, when a radiologist displays a study from a worklist of unread studies, it will be flagged so that anotherradiologist will see that it is being read and will progress to a different examination.
A method for adjusting grayscale is evident from most workstationdesigns and studies of those designs. Adjustment of window width and levelhas been consistently shown to be the image manipulation tool used mostfrequently. Other image manipulation tools typically include some form of
PACS WORKSTATION SOFTWARE 393
DRE20 11/16/2005 9:56 AM Page 393

PACS: A Guide to the Digi tal Revolut ion394
TABLE 20.1Navigation Functions
Worklist Display a list of examinations to be interpreted (should bereachable by a single keystroke equivalent). The usershould be able to sort the worklist chronologically, bypatient name, or by examination type with sub-sortingby date or patient name. Searching for a particularpatient should also be supported using any of theidentifiers as search keys (e.g., patient name, medicalrecord number, order/request number, etc.)
List all Display a list of all the current day’s examinations (orother time interval set by the user)—the daily list wouldbe typical (also reachable by a single keystrokeequivalent). It should be possible to sort this list as forthe worklist.
Folder display For each patient, show the analog of the master jacketImage icons In exam folders (within the patient folder), show icons of
images in studies.Next patient (exam) Moves to the next patient or examination on the worklist.Previous patient Moves to the prior patient or examination on the worklist.
(exam)Consult Interrupts current display, brings up “List all” or
“Worklist”, and allows selection and display of anotherpatient or examination for consultation purposes.
Consult remote For consultation between workstations. Invokes thedisplay of the same study on two workstations and twocursors, one controlled by each workstation so that thetwo users may point to different areas on the image.
Resume last Returns to exam interrupted by the Consult or Consultremote function (should return to images, format, andgrayscale settings as prior to invoking either Consultmode).
Mark as read Marks the examination as “read”. This should alter theappropriate flag in the image database so that otherslooking at the worklist or patient list will see the markedexaminations displayed as “read”. This function shouldalso: a) be restricted to use by those permitted to readexaminations, and b) prevent more than one personmarking the examination as “read”.
DRE20 11/16/2005 9:56 AM Page 394

PACS WORKSTATION SOFTWARE 395
TABLE 20.1Continued
Compare Brings up the patient folder so that a prior exam of thesame type or other examination can be displayed forcomparison and correlation purposes. Note that someexamination types should have a site-configurableautomatic display of prior examinations (e.g., chestradiographs will almost always be displayed with theprior examination). Display formats should be both site-and user-configurable.
Stack view/Tile view For cross-sectional and time-sequenced images, allowsrapid selection of the stack view (rapid sequentialimage display in a single image frame) or tile view(images arranged in sequence but spatially separatedmuch as photographed on conventional film). Ideally,stack view should be implementable with a selection onany image in a tile view display; ending the stack viewwould then return that frame to its original image.Stack view should also be applicable between andwithin (different series; e.g., non-contrast/contrast, orpulse sequences in MR) examinations for comparisonpurposes.
Cine loop view For time-sequenced images, allows variable-speed displayof the images to show dynamic phenomena.
Rearrange/Save Allows “drag and drop” rearrangement of the imagesdisplayed. While “hanging protocols” should beautomated as much as possible, rearrangement isimportant for comparison purposes. The undo functionshould return the display to the original configuration. A“Save” function should store the information about therearranged images so that the next time the same studyis called up, it is displayed as rearranged.
Note: Also see Table 20.3. There are functions, such as “worklist”, that crossboundaries between image navigation and management.
DRE20 11/16/2005 9:56 AM Page 395

magnification (either an overall magnify or the analog of a magnifying lens,or both), roaming (either moving around in the magnified image or movingthe magnifying window), video inversion (“black bone”), and rotation andflipping of the image, all typical of those provided. Some workstations alsoperform fast image processing to support edge enhancement, grayscale histogram equalization, and image arithmetic (adding or subtracting images).Specialty workstations may add additional image manipulation functions.Table 20.2 summarizes these image manipulation functions.
Measuring features on images and calculating pixel statistics are 2 commonly available functions. These are deemed a necessity for CT work-stations because of the heavy use of these operations on dedicated CT displayconsoles. Such measurements are diagnostically important and, in film-basedoperation, are often filmed as overlays on the image.
The rapid expansion of multidetector computed tomography (MDCT)has resulted in studies with large numbers of images. In many instances, the number of images per study has increased by an order of magnitude.Such large studies are proving a challenge to PACS and workstation devel-opers. In addition to the much increased data volume, there is the problemof how to present studies of 500 or more images for interpretation. Oneresult of this is an increased interest on the part of radiologists in having 3-D reconstruction tools built into the workstations usually used for cross-sectional imaging. At present, to create and view 3-D images, a separategraphics-intensive workstation is typically used. However, this means theradiologist has to move from one workstation to another; an undesirable situation.
A method for displaying the radiology reports of the examinationsbeing viewed is essential. In subspecialty radiology practices, it is very usefulto know how a correlative study was read when it is being viewed as part ofthe interpretation of an examination of a different type. In more generalistpractices, it is still important to know how a colleague read a prior exami-nation. Display of reports usually requires that some form of interface to theRIS or hospital information system (HIS) be operational.
To a large extent, a successful conversion from film-based reading tothe use of workstations for reading will also involve the replacement withautomated equivalents of many of the functions now done manually. Selec-tion of prior studies to display, arrangement of images when displayed, andclearing of films from the alternator when the readings are done are all exam-ples of image management functions that need to be supported in the work-station environment. If this is not done, the transition to workstations willalso mean the migration of support tasks to the radiologist. While this mightseem attractive at first because of potential personnel reductions, the radi-ologist’s time is very expensive and his or her productivity is very dependent
PACS: A Guide to the Digi tal Revolut ion396
DRE20 11/16/2005 9:56 AM Page 396

PACS WORKSTATION SOFTWARE 397
TABLE 20.2Image Manipulation Functions
Function Description
Window width Adjusts range of pixel bits sent to the display system. Shouldalways be accessible.
Window level Sets center of window width in the bits of the pixel. Should (center) always be accessible.
Grayscale reset Resets window width and level settings to initially displayedvalues.
Zoom/magnify Invokes an operation that maps the displayed image into a largerarea (zoom is typically by pixel replication; magnify uses pixelinterpolation).
Place ROI Places a preshaped (circle, square) or hand-drawn region ofinterest on the image. The controls should allow for the user tomove the ROI (region of interest) around the image and changeits size.
ROI magnify Magnifies within a movable ROI. This should allow for variabledegrees of magnification (may be in discrete steps) and shouldbe movable in real time using the manual input control.
Grayscale Reverses the meaning of the highest and lowest pixel values in invert terms of grayscale; for example, white bones would be
displayed as black.Window width Single keystroke equivalent selectable preset window
and level width/window level combinations, for example, lung, presets mediastinum, and bone for CT.
Image Image-processing functions are not commonly used while reading processing cases; however, access to such functions as edge
enhancement, histogram equalization, and application of user-defined filters could be provided through a button that bringsup a menu of such functions available.
Undo At least 1 level of being able to undo the function just completed.This should be accessible with a single keystroke equivalent.Note: An undo of some image-processing functions may bedifficult to implement unless a copy of the “original” image ismaintained.
Pixel statistics Reports the number, mean, and standard deviation of pixels in anROI.
Measure Provides linear, area, and angle measurements on an image.Annotate Allows a user to add text annotation to an image. This function
can be used with the display of an ROI or graphics arrows.Users should be able to toggle the annotation on and off. Suchannotation should be saved with the image.
DRE20 11/16/2005 9:56 AM Page 397

on these support functions being accomplished. Simply moving these oper-ations from clerks and other personnel to the radiologist will have a nega-tive impact on productivity. Table 20.3 lists a set of these image managementfunctions. It is the creation and management of worklists that encompassmost of these functions.
PACS: A Guide to the Digi tal Revolut ion398
TABLE 20.3Image Management Functions
Delete exam (local) Provides for deletion of an examination from the localstorage (with appropriate warnings).
Autodelete Provides for automated deletion of examinations fromlocal storage (if applicable) based on user-set criteria.
Mark for teaching file Flags the examination being read as one useful forteaching purposes.
Mark for nondeletion Flags the examination being read as one not to beautodeleted from workstation local storage (ifapplicable). Note that a site-configurable expiration timefor this “protection” is useful.
Redirect Allows sending of an examination to a particularworkstation. Even in a centralized storage PACS, thisfunction would allow sending the examination asviewed, annotated, and measured. DICOM has a way ofsupporting this through the “presentation state storage”service class.
Scrapbook Saves selected images (or pointers to images) in a file.Retrieving this file later would (optionally) first displaythe scrapbook images while providing access to the fullstudy, if requested. DICOM “key images” are an exampleof what would be put into the “scrapbook”.
Print Provides hardcopy printing of selected images (e.g., theScrapbook) or a whole study. Print options (film, paper,35mm slide) depend on devices in the system. Printfunction permission should be configured by type ofuser.
Local storage statistics If the system uses local storage for images, this functionshould display the percentage of capacity currentlyused.
DRE20 11/16/2005 9:56 AM Page 398
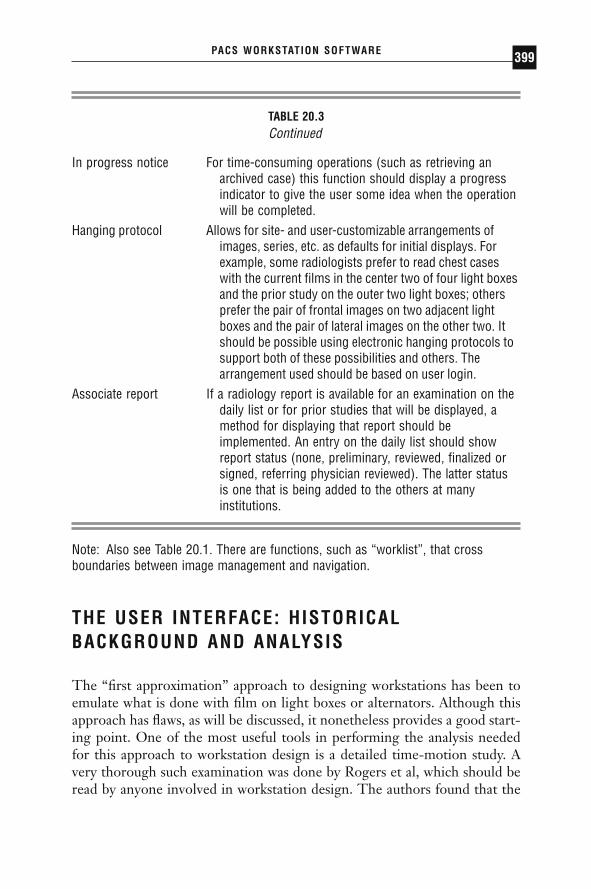
PACS WORKSTATION SOFTWARE 399
TABLE 20.3Continued
In progress notice For time-consuming operations (such as retrieving anarchived case) this function should display a progressindicator to give the user some idea when the operationwill be completed.
Hanging protocol Allows for site- and user-customizable arrangements ofimages, series, etc. as defaults for initial displays. Forexample, some radiologists prefer to read chest caseswith the current films in the center two of four light boxesand the prior study on the outer two light boxes; othersprefer the pair of frontal images on two adjacent lightboxes and the pair of lateral images on the other two. Itshould be possible using electronic hanging protocols tosupport both of these possibilities and others. Thearrangement used should be based on user login.
Associate report If a radiology report is available for an examination on thedaily list or for prior studies that will be displayed, amethod for displaying that report should beimplemented. An entry on the daily list should showreport status (none, preliminary, reviewed, finalized orsigned, referring physician reviewed). The latter statusis one that is being added to the others at manyinstitutions.
Note: Also see Table 20.1. There are functions, such as “worklist”, that crossboundaries between image management and navigation.
THE USER INTERFACE: HISTORICALBACKGROUND AND ANALYSIS
The “first approximation” approach to designing workstations has been toemulate what is done with film on light boxes or alternators. Although thisapproach has flaws, as will be discussed, it nonetheless provides a good start-ing point. One of the most useful tools in performing the analysis neededfor this approach to workstation design is a detailed time-motion study. Avery thorough such examination was done by Rogers et al, which should beread by anyone involved in workstation design. The authors found that the
DRE20 11/16/2005 9:56 AM Page 399

reading process could be divided into 3 stages. The first stage is a generalinformation-gathering period during which the patient’s history, radiologi-cal examination history, and other data are reviewed and a rapid sort throughthe films of the current study is undertaken. The second stage consists of arapid review of the image set directed at detecting candidate pathologicalstates. The third stage focuses attention on those candidate abnormalitieswith the dismissal of some as nonpathological and others as significant. Thisfinal stage is what most would think of as the actual “reading” or diagnosticphase. Some further analysis of that first stage, gathering information, wasdone by Levin et al and Haynor and Saarinen. Levin and colleagues did aworkflow analysis of all the activities required to bring together the infor-mation needed to support the interpretation of nuclear medicine ventila-tion/perfusion lung scans. This was done as an example to determine whichsteps could be done within a PACS, which were handled by other informa-tion systems, and which were manual operations. What emerged from thisstudy is that there are extensive interactions with multiple informationsources to support examination interpretation. Haynor and Saarinen lookedmore at the problem of finding any prior examinations of the same type thatthe patient has had and any correlative (cross-modality) examinations thatthe radiologist might want during reading. They found that inpatients hada higher frequency of prior studies compared with outpatients when con-sidering plain films. Also, the inpatients had old studies that were morerecent than those of the outpatients (an average of 15 days as opposed to 53days). For correlative studies, with plain films, ultrasound, and neuroradio-logic magnetic resonance (MR), the correlative study was a prior CT exam-ination. For neuroradiologic CT, it was a prior MR or myelogram. Whatthis study suggests is that relatively simple rules can be constructed for theautomated retrieval of these needed cases from a PACS archive.
Note that the above studies are primarily for activities taking place insupport of the reading task and secondarily for the actual reading process.Nonetheless, without such support processes, radiologists would be reluc-tant to interpret examinations. For a determination of the requirements ofdiagnostic workstations, there are several possible approaches. One involvesinterviewing radiologists in addition to watching what they do. Another isbased on using the actions identified in time-motion studies or building func-tional models of the radiologist’s working tasks and combining these withhuman-computer interaction principles. A third approach involves the build-ing of models or prototypes, having them evaluated by radiologists, refiningthem based on such evaluation, and repeating this cycle until requestedchanges reach a minimum or the users express a high degree of satisfactionwith the result.
PACS: A Guide to the Digi tal Revolut ion400
DRE20 11/16/2005 9:56 AM Page 400
The survey approach was taken by the author, by Hohman et al., in theUniversity of California, Los Angeles (UCLA), Department of RadiologicalSciences, and by Honeyman et al., among others. The work by the authorwas done when there were only prototype workstations in his departmentand most radiologists did not use them but did use the independent consolesof the CT machines to view images. The work by Hohman and colleagueswas done using the developmental PACS in place at UCLA. Honeyman andcolleagues took the approach of comparing features of 4 workstationsinstalled in their facility and also surveying attendees of the workstationexhibits at the Radiological Society of North America InfoRAD area. Ofinterest is that despite the 10 years that elapsed between the Horii andHohman papers, many of the responses were similar. From both studies, itis evident that controlling the grayscale of the display (window width andlevel adjustment) was the most frequently used function. For the Honeymansurvey, the importance of window/level, magnification, and flip/rotate functions was thought to be high enough that users were told to assume thatthe workstation had these features. One major difference seen between theHorii and Hohman studies is the change in acceptance of the mouse andmenu for control of the user interface. In the Horii study, the mouse rankedleast desirable and exactly the opposite was true in the Hohman survey. Thisdifference, the author believes, is readily explained by the rapid growth ofpersonal computers with graphical user interfaces for which the mouse andmenu is the predominant control mechanism. The Honeyman study alsoasked about “higher level” workstation functions—those that involve organ-ization of images or their management. The most important function in that study was the ability to view multiple studies on the same patient simultaneously.
Either a time-motion study coupled with human-computer interactionprinciples, or functional requirements modeling based on more informalobservation combined with ergonomic design is a popular method of arriv-ing at workstation requirements. A very detailed such analysis was done byMeyer-Ebrecht and proposed to use a well-defined set of image-processingprimitives to implement workstation functions. The previously cited paperby Rogers et al., analyzed the time-motion study they did and determined abasic set of functions that workstations supported by a PACS should perform.Included were access to patient history (text and prior images), window/levelpresets, controllable automatic progression through series, temporary imagemarkers to return quickly to a marked image, display of multiple images,magnification, and measurement (pixel value and dimensional). With thepossible exception of patient history (other than what is provided on the radiology requisition), most of these functions have been implemented. Of
PACS WORKSTATION SOFTWARE 401
DRE20 11/16/2005 9:56 AM Page 401

PACS: A Guide to the Digi tal Revolut ion402
interest is the “controllable automatic progression through series,” whichfrom the description in the paper is familiar now as the “stack view” modein which a user can move through a series of images very rapidly. For cross-sectional imaging, this display mode allows very rapid review of studies andprovides a 3-D sense of anatomic structures.
Most of the authors who use the model and human factors methodsarrive at similar conclusions; that a user interface developed from a simpleor intuitive mental model is easier to learn and use with a minimum of errors. Also, there is the indication that the radiology reading task is acomplex one, from the point of view of both the radiologist (the “internal”processes) and the infrastructure to support the radiologist (the “external”processes).
The idea of developing a prototype user interface and refining it by having different users work with it has also been well used. In effect, this same cycle happens with products installed by vendors but with a longer cycle time. In the prototyping method, trial user interfaces are constructed and refined before they are committed to “production” hard-ware. Among the researchers who used this method, the work by Belangerand van der Voorde is important in that a great deal of time was spent with radiologists and nonradiologists in evaluating or developing the userinterface. Both Belanger at Ottawa Civic Hospital and van der Voorde at theHospital of the University of Pennsylvania developed workstations thatwould be used extensively by referring physicians. Rather than assume that functional requirements were the same as for radiologists, they soughtthe advice of the physician population that would be using the workstation.The result in both cases was a high degree of acceptance by the nonradiol-ogist users.
SYSTEM DESIGN CONSIDERATIONS
The overall architecture of a PACS will determine the hardware design ofthe workstations connected to it. The typical components of a workstationare those of a personal computer: the computer “box” (contains the proces-sor, memory, power supply, and slots for other circuit cards), thedisplay/graphics processor card, the display device, and input devices (typi-cally a keyboard and mouse). The design of the PACS will largely determineboth the hardware specifications and software functions for the workstation.There are basically 2 major PACS designs, the centralized storage versionand the distributed storage version. The design chosen for the Departmentof Defense Medical Diagnostic Imaging Support (MDIS) System is thearchetype of centralized systems. All images are stored in a very-high-speed
DRE20 11/16/2005 9:56 AM Page 402
PACS WORKSTATION SOFTWARE 403
magnetic disk array that is supported by a database management computerand a long-term optical disk archive. The high-speed, wideband nature ofthe storage system means that workstations do not have to store imageslocally and that the workstation hardware does not need to include a large-capacity magnetic disk of its own. The MDIS design does include local magnetic disk, but for storage of the workstation software and utilities, not images. Images are stored locally in the display memory only. The centralized design must have speed and bandwidth necessary to support fast retrieval of images from multiple workstations. In the MDIS system, forexample, any workstation can retrieve images from the central storage systemin 1 second or less per image. This performance also requires that thenetwork connecting the central storage device and the workstations be veryfast, or else the high speed of the storage is of little advantage.
The alternative design is a distributed system in which there may beone or more short- and long-term storage devices, but the images in currentuse are stored at the workstation. In this case, the workstation needs to haveenough local magnetic disk to store as many images as needed for a typicalreading session. This also must include any prior or correlative examinationsretrieved from long-term storage. In some senses, this design trades offworkstation local storage against network performance. Low-cost local areanetworks (LANs) can be used to implement the image transmission network,subject to constraints of the management system. Distributed systems alsoneed to have good image management so that images are moved to wherethey will be needed (workstation local disk) to avoid long transmission delaysresulting from network performance. Use of a distributed design with a mod-erate speed (about 10 megabits per second) LAN is possible with such goodimage management and also benefits from predictable loads and behaviors.If radiologists and other users tend to view images from the same locationsand if the number of ad hoc requests (those not predicted from RIS or HISinformation) is low, such designs can work quite well. These considerationsalso do not include the impact of data compression, particularly lossy com-pression, which can reduce data per image by a factor of 10 or more. Otherchapters in this book discuss the compression issue in more detail. Withrecent availability of much faster LAN hardware (100 and 1000 megabits persecond), many PACS designs are shifting to a centralized storage model asthe network is less of a bottleneck. Countering this is the growth of exami-nations with large numbers of images; moving such studies across even fastLANs can be a problem when there are a large number of such studies tobe moved.
The two models are not mutually exclusive; there are designs that arehybrids of both. In particular, there are PACS made up of interconnectedsmaller systems that may themselves be centralized-storage designs. Such
DRE20 11/16/2005 9:56 AM Page 403

designs tend to be those that have “grown” rather than installed as a singlesystem. In some senses, this is a good design, if somewhat engineering-intensive, as each subsystem can be optimized for its particular tasks.
Chapters 13 and 16 of this volume detail the designs and storagesystems of PACS. The design alternatives are discussed here as well becausethey have an impact on workstation software. A current model of storage isvery different from the “traditional” design in that it does not rely on a large-capacity robotic media library. Instead, the proposal is to keep all studies“online” for the required legal storage duration. In this model, storage ispurchased as needed. This takes advantage of steadily declining prices ofmagnetic disk systems. The typical increase in magnetic disk storage capac-ity quoted by the industry is that it doubles about every 18 months. Theimpact of this sort of design on PACS workstations is the very rapid avail-ability of even old studies.
In both the central and distributed storage models of PACS, the work-station software supports the various functions the user needs. The softwareto do all this requires many steps and is usually a large program as a result.An emerging model for PACS and workstations takes a very differentapproach. Instead of having all the functions implemented in a program thatresides on the workstation computer, a fast server could perform many ofthese tasks; the workstation would then need to manage only requests fromthe user and responses from the server. As a result, the program to do thiswould be much smaller. The familiar example of this sort of design is theWorld Wide Web and the use of browsers. The browser program itself issimply an interpreter of user actions and the programming needed to convertuser requests into the language of the Web and convert the server responsesback into a user-friendly form. The Web uses a special language, hypertextmarkup language, or HTML, as the way of encoding what is requested andwhat is sent back for display. If special functions are needed (for example,software to display animation) at the user’s computer, the Web protocolallows these functions to be loaded into the user’s computer at the time theyare needed. What this means for the user is that the browser software is arelatively small program compared to software that would be needed to carryout all the functions available on the Web. A system design that moves manyof the computing (and storage) functions to the network and servers and that,as a result, relies on a smaller program on user machines is a “client-server”model with a “thin client.” The term “thin” refers to the fact that the soft-ware at the user computer does not have programming built in for many ofits functions; it relies on the server for them (as opposed to “thick client”designs, in which many of the functions are coded into the workstation software).
PACS: A Guide to the Digi tal Revolut ion404
DRE20 11/16/2005 9:56 AM Page 404
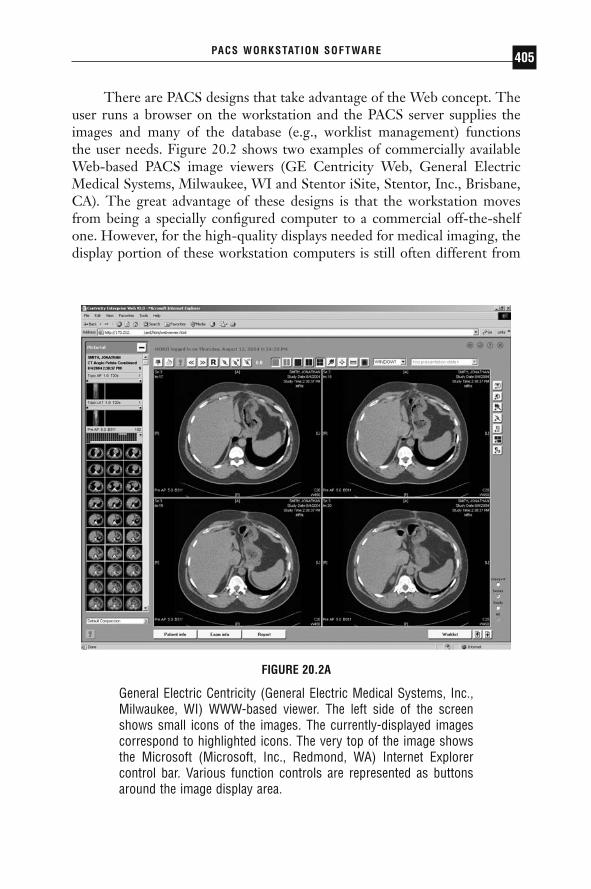
PACS WORKSTATION SOFTWARE 405
FIGURE 20.2A
General Electric Centricity (General Electric Medical Systems, Inc.,Milwaukee, WI) WWW-based viewer. The left side of the screenshows small icons of the images. The currently-displayed imagescorrespond to highlighted icons. The very top of the image showsthe Microsoft (Microsoft, Inc., Redmond, WA) Internet Explorercontrol bar. Various function controls are represented as buttonsaround the image display area.
There are PACS designs that take advantage of the Web concept. Theuser runs a browser on the workstation and the PACS server supplies theimages and many of the database (e.g., worklist management) functions the user needs. Figure 20.2 shows two examples of commercially availableWeb-based PACS image viewers (GE Centricity Web, General ElectricMedical Systems, Milwaukee, WI and Stentor iSite, Stentor, Inc., Brisbane,CA). The great advantage of these designs is that the workstation movesfrom being a specially configured computer to a commercial off-the-shelfone. However, for the high-quality displays needed for medical imaging, thedisplay portion of these workstation computers is still often different from
DRE20 11/16/2005 9:56 AM Page 405

PACS: A Guide to the Digi tal Revolut ion406
FIGURE 20.2B
Stentor iSite (Stentor, Inc., Brisbane, CA) WWW-based viewershowing ultrasound images. Note that the very top of the imageshows the same Internet Explorer control bar as for the GE Centricityapplication. What is different is the application running in thewindow. The bar above the images is used to show a timeline of theexamination history for this patient. In this case, the patient has onlythis examination in the “folder”. The row of images below thetimeline provide an overview of the entire study and, if there aremore images than can be displayed on the screen, the row can bescrolled back and forth to view all the images. A double-click on anyimage expands it to a larger size. Note that there are fewer buttonsfor functions than shown in Figure 20.2A. This applicationimplements most of the same functions with mouse clicks andposition-sensitive menus.
consumer hardware. Another major advantage of these Web-based designsis that much of the software that had to be specially developed for PACS isalready available for Web applications. An example is for security; theencryption of confidential medical information can be handled in a mannerthat is used on the Web for activities like credit card transactions.
DRE20 11/16/2005 9:56 AM Page 406

IMPLEMENTATION
There is little doubt that the most heavily discussed aspect of workstationsfor medical imaging is the user interface. In part, this is because there is wideopinion about how such an interface should work. The “classic” model ofemulating the operation of a film alternator is now countered by the conceptof going beyond what can be done with film. Manufacturers have tended to use the user interface design to differentiate one product from another because the hardware is often the same or similar across multiplemanufacturers.
One difficulty with user interface design is that objective study of theresulting interface is difficult and time consuming. Users will find theobvious problems with a design very quickly; it is the more subtle difficul-ties that may not have immediately evident impact, and only thorough exam-ination will reveal them. At best, they may cause problems such as longerreading time or complaints of fatigue. At worst, they will degrade diagnos-tic accuracy.
The reader is urged to become familiar with the early work on work-station user interfaces done by groups at the University of North Carolina(UNC) and the University of Arizona. The author believes that this work isstill relevant to modern PACS workstation software. These groups haveapplied well-validated methods of industrial psychology to the evaluation ofuser interfaces for medical imaging workstations. The results are sometimescounterintuitive. Beard and colleagues at UNC Chapel Hill, for example,found that a very fast, single-screen workstation could be as effective forreading CT studies as multiple films on light boxes. This is despite the widelyheld opinion that multiple-monitor workstations are needed for CT reading.More recently, Reiner and colleagues have shown that the reading timedecreases significantly when moving from a single-monitor to a 2-monitorworkstation; but the decrease in reading time from 2- to 4-monitor work-stations was not significant.
Krupinski and Lund at the University of Arizona conducted a veryimportant study of visual gaze fixation during the image-reading task. Theyfound that not only did it take longer to fixate on an abnormality on work-station displays compared to film, but overall viewing time was longer onthe workstation. Of considerable importance is that they also found thatwhile for film all eye fixations were confined to the image area, for the work-station display, about 20 percent of the fixations were in the area of the menuthat displayed the image-processing functions. In other words, the radiolo-gists set their gaze on a nonimage area for about a fifth of all fixations. Ifthey were to spend the same amount of overall time looking at the image,
PACS WORKSTATION SOFTWARE 407
DRE20 11/16/2005 9:57 AM Page 407
those additional gaze fixations would add to the viewing time per image. Amore serious potential problem occurs if the gaze fixations on the controlmenus decrease the number of fixations on the image, possibly decreasingdetection of abnormalities. This should give some pause to workstationdesigners who have continued to add controls and functions to on-screenmenus or buttons.
From such research, several key points have emerged. A basic princi-ple of human computer interface (HCI) design is that the user interfaceshould follow a logical and simple mental model. Since the task of readingfrom a workstation is likely to be different from the film-reading one, themental model of the workstation interface should also be simple to learn. Ifradiologists are confronted with an unfamiliar film alternator (or multi-viewer), they are likely to make a few mistakes until they learn how toadvance or back up the panels and how to turn on and off the separate illu-minators. The number of errors they make until they become facile with thesystem is a measure of how simple the interface is to learn. An example of acommon user interface control is the familiar computer mouse. On a flatdesk, moving the mouse away from the user generally moves the cursor onthe screen in an upward direction, with mouse movement toward the userbeing down, and right and left movement corresponding to those directions.Switching these directions is very difficult for almost all users to get used to;the controls run counter to the mental model. This sort of control inversioncan have disastrous consequences in other settings. Aircraft that use a joy-stick respond to pulling back on the joystick by climbing and to pushingforward on the joystick by diving. If the airplane becomes inverted and thepilot disoriented, the reversal of the control responses may not be realized;pulling back on the joystick (a typical response in an emergency) will thenput the airplane into a dive instead of a climb.
This author (along with those who have done user interface analysis;Paul Chang and David Beard are two others who have also proposed thisidea) has often noted a good test of a user interface: if a person can figureout how to use it without having to refer to a manual, it is probably basedon a good mental model. One of the significant advances in personal com-puters was popularized by Apple Computer (Apple Computer Corporation,Cupertino, Calif) in its Macintosh computer line. Developers were told toadhere to a particular set of interface guidelines. This meant that most appli-cation programs operated in a similar fashion. If software developers adheredto these principles, it was possible for users to accomplish most basic oper-ations in any program without having to read volumes of documentation.Unlike other operating systems of the time (e.g., DOS and Unix [Bell Tele-phone Laboratories, Holmdel, NJ]), the user did not have to remember com-
PACS: A Guide to the Digi tal Revolut ion408
DRE20 11/16/2005 9:57 AM Page 408
mands or the syntax of many of them. The Macintosh environment was, andis, highly graphical, and, though not the first graphical user interface (GUI),it became the first widely popular one, with Microsoft Windows (MicrosoftCorporation, Redmond, Wash) rapidly following.
From the mental model of “How do I make this thing do what I want?”comes the development of logical controls to perform those tasks. It is thisprocess, turning operations done in a conventional system into controls andtheir effects in the computer-based system, that constitutes development ofa user interface. The trend in medical imaging workstations has been toadopt the GUI-based user interface. Figure 20.3 shows a workstation displaydesigned for viewing ultrasound (Siemens KinetDx, Siemens MedicalSystems, Malvern, PA). As noted from the work by Krupinski and Lund,however, that may not be the best possible choice. There have been, mostlyin historical workstations, significant departures from the GUI paradigm.Examples include the General Electric Medical Systems IndependentConsole (G.E. Medical Systems, Milwaukee, Wis) for which multiple keyswere traded off against a GUI. The plasma panel of that console did allowfor flexible “soft” buttons to be used as well, vastly increasing the number ofthings that could be done without making the number of function keysimpossibly large. The idea used for this console, that commonly used func-tions would be represented on dedicated keys and those that were neededfor specific operations would be on the plasma display, has also been trans-lated into more modern workstation designs. In addition, the control panelsof many types of imaging equipment have a similar strategy so as not tooverwhelm the user with buttons. Many current PACS workstations have“soft” keys displayed in a fixed portion of the menu on the monitor(s) toperform the common functions. Operation-specific functions are selectablefrom menu portions that change with the operation being done. The verycommonly used functions, such as window width and level adjustment, areusually always available under mouse control. The work by Krupinski andLund for display of radiographic images on workstations and that of Beardfor CT images would argue for a minimal set of controls that do not requireusers to look at them to operate them. The author refers to such a controlset as “low visual effort controls.” A low visual effort control set was notavailable from medical imaging workstation manufacturers at the time thischapter was written, though many current workstations allow “mapping” ofcommonly used functions to keyboard keys. If the function and position ofthese keys is memorized, many functions can be performed without havingto find a control button on the screen. Another common feature of currentuser interfaces is the context- or position-sensitive menu. Clicking on theimage with one of the mouse buttons will bring up a menu with image-
PACS WORKSTATION SOFTWARE 409
DRE20 11/16/2005 9:57 AM Page 409

PACS: A Guide to the Digi tal Revolut ion410
manipulation specific functions. Figure 20.4 shows an example of “dropdown” menus (GE Centricity Web, General Electric Medical Systems, Milwaukee, WI). Clicking on the border surrounding the image will bringup a different menu, for example, functions that affect the display of thewhole study or a linkage of one image to another. This avoids having todisplay a large number of controls or buttons on the screen in addition tothe images.
The navigation method most commonly used is based on the model ofthe paper worklist (usually posted on the side of the film alternator) and film
FIGURE 20.3
Siemens KinetDx (Siemens Medical Solutions, Malvern, PA)ultrasound PACS display. Unlike the displays of Figure 20.2, this isnot a Web-based application. Note that the functions are clusteredas “soft” buttons across the top of the images. The rectangular areain the upper left of the control bar is actually a shortcut to theworklist. Clicking on it results in a pull-down list sorted accordingto what was selected for the worklist (in this case, called “study list”on the control bar). Clicking on the “study list” button results in thedisplay shown in Figure 20.5B.
DRE20 11/16/2005 9:57 AM Page 410

PACS WORKSTATION SOFTWARE 411
FIGURE 20.4
General Electric Centricity (General Electric Medical Systems, Inc.,Milwaukee, WI) WWW-based viewer showing drop down menus.This is the same application shown in Figure 20.2A. In this instance,the right button on the computer mouse was clicked while the cursorwas on the image. The menu near the center of the image thenopened. By moving the cursor down through the menu, specificfunctions or actions can be invoked. In this case, the “Annotation”item was highlighted and this opened a second menu (the middleone) in which yet another choice (“create”) was highlighted. A thirdmenu (the farthest on the right) shows the choices available underthe “create” choice. In this example, “box ROI” (box region ofinterest) has been chosen. It is important to note that this is donewith a “click and drag” followed by a single click and not withmultiple clicks. Clicking on the “box ROI” choice would result indisplaying a rectangular region of interest (for pixel valuemeasurements, etc.) on the image.
DRE20 11/16/2005 9:57 AM Page 411

PACS: A Guide to the Digi tal Revolut ion412
jacket. This concept was put forward very early in the development of PACSby Feingold, Seshadri, and Arenson, who referred to such functions as the“folder manager.” In a hierarchical display, the electronic patient “jacket” isshown with the studies it contains. The user then selects the study (andsometimes the series) to be displayed. On most workstations, the worklist
FIGURE 20.5A
General Electric Centricity (General Electric Medical Systems, Inc.,Milwaukee, WI) WWW-based viewer worklist. In this example, “allexaminations” was chosen as the worklist, but for a particularpatient. Other choices would also be available by clicking on thesmall arrow next to the “worklist” box. The empty boxes above thelist of examinations found would allow for searching and sorting the worklist based on criteria typed in those boxes. Notice that thereare four “modality” check boxes in the lower left of the worklistscreen. These are labeled “CR, CT, MR, OT” for the different imagetypes (“OT” stands for “other”). Checking or unchecking these is away to filter the worklist. The worklist shows the patient medicalrecord number (the “last four” is used as some practices use thelast four digits of the MRN for an identifier), the procedure, and themodality.
DRE20 11/16/2005 9:57 AM Page 412

PACS WORKSTATION SOFTWARE 413
shows a list of patients and selecting a patient then displays the “jacket.”Figure 20.5 shows examples of worklists implemented on different PACSworkstations (GE Centricity Web, General Electric Medical Systems, Milwaukee, WI; Siemens KinetDx, Siemens Medical Systems, Malvern, PA;Stentor iSite Radiology; Stentor, Inc., Brisbane, CA). The worklist is a verypowerful tool; with appropriate workstation software and an interface of thePACS to a radiology information system, worklists are used to help manage
FIGURE 20.5B
Siemens KinetDx (Siemens Medical Solutions, Malvern, PA)worklist. This is the worklist screen from a non-WWW ultrasoundPACS. In this example, the worklist chosen is “Today’s” (meaning,“today’s examinations”). This is selected with the box near the upperright of the screen. In the upper center of the screen, there is a“quick search” box. This allows a search of the database by patientname or medical record number. The “study type” column displaysthe examination code used by the departmental RIS. There is a“modality” column as this PACS can display images from otherimaging equipment. Note the scroll bar at the bottom of the worklist;there are other database information items that are not shown inthis view but scrolling allows users to access them. Double-clickingon any patient in the list results in a display of the images.
DRE20 11/16/2005 9:57 AM Page 413
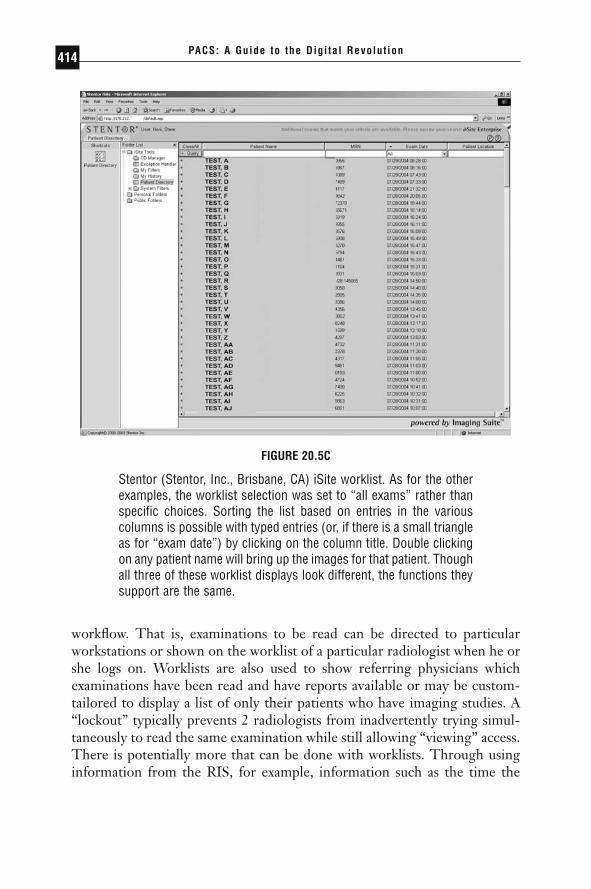
PACS: A Guide to the Digi tal Revolut ion414
workflow. That is, examinations to be read can be directed to particularworkstations or shown on the worklist of a particular radiologist when he orshe logs on. Worklists are also used to show referring physicians which examinations have been read and have reports available or may be custom-tailored to display a list of only their patients who have imaging studies. A“lockout” typically prevents 2 radiologists from inadvertently trying simul-taneously to read the same examination while still allowing “viewing” access.There is potentially more that can be done with worklists. Through usinginformation from the RIS, for example, information such as the time the
FIGURE 20.5C
Stentor (Stentor, Inc., Brisbane, CA) iSite worklist. As for the otherexamples, the worklist selection was set to “all exams” rather thanspecific choices. Sorting the list based on entries in the variouscolumns is possible with typed entries (or, if there is a small triangleas for “exam date”) by clicking on the column title. Double clickingon any patient name will bring up the images for that patient. Thoughall three of these worklist displays look different, the functions theysupport are the same.
DRE20 11/16/2005 9:57 AM Page 414

PACS WORKSTATION SOFTWARE 415
patient has been waiting, “stat” status, or the patient’s appointment time withthe referring physician could be used to help the radiologist prioritizereading order. Paying more attention to the design of the navigation processis one area in which workstations can be made to improve on film-basedmethods. Beard developed a rapid prototyping and evaluation method in partfor examining the human-computer interactions involved in the navigationprocess.
A significant part of image navigation is some form of automatedarrangement of the images in an examination when there are multipleimages. This has come to be called the “hanging protocol” after the mannerin which films are arranged on light boxes or alternator panels for reading.For sectional imaging, such as CT, MR, and nuclear medicine positron-emission tomography and single photon emission computed tomography,the ability to sort images by series, by time of acquisition, by anatomic location, and by imaging protocol (such as pulse sequence for MR) is of great importance. In the conventional film-based operation, this sorting isoften done by the technologist as the examination is filmed. Automation ofsuch sorting facilitates interpreting these examination types at workstations.For plain radiographic images, the hanging protocols are also of some impor-tance. In the scenario of a trauma patient who has multiple radiographs done,sorting them simply by examination time may be wholly inadequate. Fortrauma patients in particular, the radiologist may request additional viewsdone after the first images are obtained. Displayed strictly in chronologicalorder, these additional images will appear either at the end of the examina-tion or the beginning, but not grouped with the earlier views of the anatomicarea in question. Other criteria, such as anatomic area being radiographed,also have to be considered. In addition, the sorting of sectional images andthe arrangement of radiographic ones is also governed to some extent by theindividual desires of the radiologist. All these requirements dictate that suchsorting and arrangement be both automated and customizable.
Controls and displays in general could benefit the user if they were customizable. The number of images displayed simultaneously for sectionalimaging, the window width and level preset values, the initial image displayparameters (very useful for MR imaging), and even the location and arrange-ment of on-screen controls could all be based on who logs in, so that per-sonalized setups are automatically set. If this sounds extravagant, readersshould recall that many such functions were done in film-based operationand were done in a fashion “transparent” to the radiologist by technologists,file room clerks, and radiology residents who quickly learned the preferencesof the radiologist with whom they were working.
DRE20 11/16/2005 9:57 AM Page 415

An important aspect of user interfaces is error recovery. In the best ofcircumstances, users may still make mistakes. How a user interface allowsthe correction of such errors is important; if the error-correction process isdeemed too taxing by the user, it may be ignored and errors may propagate.Aside from preventing erroneous conditions that are detectable, there is thematter of reversing a function or operation that was inadvertently selected.There are 2 levels of such reversal; the “Undo what I just did” version thatcan be thought of as allowing a user to back up a step, and the “Take meback to where I started” choice that resets starting conditions.
In the case of the undo function, some things, such as selecting a presetimage arrangement choice, can be reversed fairly simply. Others, particularlyoperations that manipulate pixel data, may be irreversible. Some forms ofedge sharpening, for example, cannot readily be reversed. In some instances,warnings to the user prior to executing such an operation may be warranted.Erasing images is a typical example (though a well-designed user interfacewill provide a safety option for even this action).
The reset function, analogous to a panic button, is useful when a userhas gotten so far off the desired functional direction that only resetting tothe starting conditions will be helpful. Such a reset, however, should ordi-narily not be the equivalent of shutting down and restarting the workstation;a well-designed reset should just reestablish starting conditions and do soquickly.
A manner of quantifying the user effort required to invoke undo andreset functions is based on a model proposed in the MDIS Specification.This model relies on the number of keystrokes or their equivalent (a mousebutton click) used to implement workstation functions and has also been usedby Beard in developing workstation designs. With the increasing use of computer mouses or trackballs for workstation controls, another interestingmetric for user effort is to determine the total distance the mouse or track-ball was moved to accomplish various tasks. Larger distances may translateinto more user fatigue or repetitive motion injuries. For users contemplat-ing the purchase of PACS workstations, determining the number of key-stroke equivalents needed to perform common functions is a good methodof comparing the effort involved in using different workstations. Forexample, if a workstation required 6 keystroke equivalents to perform thewindow width and level functions, this would be, by almost anyone’smeasure, far too cumbersome. Typically, such a commonly used functionwould be either always available or 1 to 2 keystroke equivalents away at amaximum.
User interfaces are a complex subject, and many believe a matter of per-sonal choice. Nonetheless, principles including simplicity of the mental model
PACS: A Guide to the Digi tal Revolut ion416
DRE20 11/16/2005 9:57 AM Page 416

behind the interface and minimum actions to perform common functions areapplicable across many users and levels of experience. To provide some guid-ance in developing the workstation section of a PACS request for proposal(RFP), Table 20.4 lists some questions that should be asked of PACS users andvendors. Note that this list is not exhaustive and may have different contentbased on local experience and requirements. The use of a workstation hashuman factors concerns that extend beyond the workstation proper. The nextsection examines the environment in which the workstation is used andstresses its importance on both user comfort and performance.
WORKSTATION ENVIRONMENTS
THE WORKSTATION ENVIRONMENT DEFINED
Since interpreting of radiological images has evolved using film illuminatedby light boxes, the reading rooms in which such interpretation is done arealso suited to such work. The square footage devoted to film viewers, theirspacing, power requirements, heat dissipation, and ambient lighting are allbased on devices waith high luminance. The traffic-flow patterns of peopleto put films on and remove films from these devices, the radiologists whoread the cases, and the referring physicians who come to review the imageswith the radiologist are also part of the reading room design. In many cases,reading rooms are ad hoc affairs, fit in wherever space is left over or can betaken from other departmental functions.
The problem for workstations is that they do not operate like film-viewing devices. Their luminance is much lower. Though personnel do nothave to access them to put images up, they still have to be usable for reviewof studies with referring physicians or with residents who are being trained.Power requirements and heat dissipation may be lower, but the quality ofthe electrical power often has to be higher. The voltage spikes and sags, andthe electrical noise that light boxes can tolerate might cause damage to aworkstation’s electronics. There will be more electrical cables and networkwiring to be considered. Work surfaces have to accommodate control panelsand other input devices and still have sufficient room for the inevitablemanual tasks required, such as reading charts or taking notes.
The workstation environment, then, consists of all the elements of thereading room plus the heating, ventilation, and air conditioning and com-munications and electrical power that are supplied from outside. Aside fromthe physical layout, the workstation environment is also dynamic and needs
PACS WORKSTATION SOFTWARE 417
DRE20 11/16/2005 9:57 AM Page 417

PACS: A Guide to the Digi tal Revolut ion418
TABLE 20.4Basic Workstation Questions
Question Comments
Who is going to use this workstation? Establishes the user population to Please answer with a list of all users consider.and about what percentage of the time they will use the workstation.
What types of examinations will be A list of examinations normally interpreted or reviewed at this read/reviewed. This helps establish workstation? display system requirements and
number of monitors needed.What comparison and correlation This list should be exhaustive—failing
examinations are needed? to include, for example, color flow ultrasound may mean that the workstation will have no colordisplay capability.
With what frequency will (a) comparison May need data from existing work and (b) correlation examinations be patterns.used?
How many examinations per day will be To determine workload.read or reviewed at this workstation?
What is the projected growth rate in this To allow for growth—failure to number per day? consider this may result in obsolete
workstations very quickly.About how many hours per day do you This helps establish a reading rate—
spend reading the examinations you how many examinations per unit are answering these questions about? time need to be read.
Do you have a relatively “set” way of This helps determine whether arranging the films of an examination? automated hanging protocols can be
used.If so, who does this arranging now? This will determine whether this task is
done by the viewer or by someone else.
At present, does the way films are To determine whether hangingarranged vary from user to user in protocols need to be customized onyour setting? a per-user basis.
DRE20 11/16/2005 9:57 AM Page 418

PACS WORKSTATION SOFTWARE 419
TABLE 20.4Continued
Question Comments
Do you work from a list of examinations Establishes need for a worklist.to be read/reviewed?
If so, who or what system creates this Manual or automatic worklist at list? present—determines if an interface
to an external system may be needed for this. For example, theworklist is generated from the RIS.
Once an examination is read or Determines how the user notes anreviewed, do you need to notify examination as “read.” This may besomeone or some system of that? automatic—see the follow-up
question, next.What system, or whom, do you notify, Most RIS software includes a function
or is this triggered from your that changes the status of an dictation? examination when a report on it is
dictated, when that report istranscribed, and when it is finalized. This question is to determine whether a workstation would need to communicate with the RIS about this so that the examination will bemarked as “read” or removed from the worklist. If the user reports this to a person, that person’s tasks need to be elaborated.
How do you get comparison and To determine who does this—this correlation examinations? function likely needs to be
automated. This question is to help make sure that this function is not left out.
What image manipulation (window Establishes image manipulation width and level, bright light, grayscale functions used with film. Tell the alteration, etc.) do you, or does user that window width and level someone else, do presently? Please changes or presets used by make the answer to this question a technologists when filming an list of things done. examination are examples of image
manipulation done by someone else for the user.
(Continued)
DRE20 11/16/2005 9:57 AM Page 419

PACS: A Guide to the Digi tal Revolut ion420
TABLE 20.4Basic Workstation Questions (Continued)
Question Comments
What measurements do you make, or Example: pixel statistics (ROI) for CT.are made for you, on the examinations you read/review? Please make the answer to this question a list ofmeasurements done.
If an error is made in the process of To establish how quality control/qualityperforming the examination (for assurance is done in some PACS; example, the wrong patient name is the QC-QA steps may take longer“flashed” on the film or the right/left than for conventional film.marker is incorrectly placed), who corrects such errors and about how long does that process take?
Are most errors with examinations Helps determine control points for caught before you see the films to image movement—that is, the QC-read? QA workstation the technologist
uses may be used to correct errors so that they are rarely sent to the reading workstation.
Do you now read/review, and will you be Determines the need for group viewing reading/reviewing, examinations with and teaching functions.others? If so, how many?
Have you used electronic workstations Helps establish the experience offor reading or reviewing examinations the user.before?
to account for the movement of personnel and access to the workstationsand the people using them.
If nothing else, lighting requirements are very different from film-based to workstation reading. The low luminance of workstations comparedto light boxes means that the whole of the ambient lighting has to be lowerfor workstations. The adverse effects of high ambient lighting have been longknown in radiology and were described both before and after the introduc-tion of softcopy displays. These studies all demonstrated that diagnosticaccuracy was compromised as a result of high ambient light levels. Thecurved surfaces of most CRT monitor screens means that glare lighting
DRE20 11/16/2005 9:57 AM Page 420

PACS WORKSTATION SOFTWARE 421
sources have to be controlled carefully. This concern also applies to LCDdisplays, albeit somewhat less so because their surfaces are flat and oftencovered with an antiglare coating. The lower overall ambient light mayrequire that task lighting be provided for reading or writing activities. Thisauthor has described some guidelines for reading room design for work-stations. These include indirect lighting (bounced and diffused from theceiling or wall), avoiding placement of workstations opposite each other, andthe use of partial room partitions or barriers between workstations to controlboth sound and light spill. If workstations and film viewing have to coexistin a single reading room, then partitions between light boxes or alternatorsand workstations are a must, and placing alternators and workstations oppo-site each other is absolutely contraindicated.
A well-established quality assurance process for workstation displaysshould help equalize ambient lighting requirements across reading areas.The DICOM standard (Part 14) describes a process that supports a mathe-matically defined function that maps the digital input to display devices intoperceptually linear output. What this means is that even across differentdisplay types (CRT, LCD, film), if calibrated to this standard, equal changesin digital pixel value will result in the same perception of changes in graylevel of the displayed pixel. Many of the vendors of medical imaging displaysnow support hardware and software to make calibration to this standard atleast semiautomated. The American Association of Physicists in Medicine(AAPM) formed Task Group 18 with the specific charge of assessing displaysused for medical imaging. Their work is a superset, and makes use, of theDICOM Part 14 standard. Readers are referred to the report as it is a com-prehensive view of items important to evaluation and quality assurance ofmedical imaging displays.
Architects familiar with design of radiology departments should be consulted as they have a very good understanding of traffic flow based onroom functions. Many architectural offices themselves now use workstationsinstead of conventional drafting tables, so they have some familiarity withthe problems that workstations pose. This author would caution, however,that design principles used for office environments in which workstations areused may not be applied successfully to the medical imaging environment.Many office-based workstation tasks involve very-high-contrast subjectmatter (e.g., text displays), and higher levels of ambient light are not onlytolerated but needed. The ideas about imaging workstation furniture, par-ticularly seating and work surfaces, do have some counterpart in office envi-ronments and so can be used as guidelines. An architect with a particularinterest in healthcare facilities, Rostenberg has written a book on design ofradiology departments that is more up-to-date as of the time this is being
DRE20 11/16/2005 9:57 AM Page 421

written than other books on such design. The author of this chapter, andReiner and colleagues, have also written about the importance and impactof reading room design on radiologist performance.
There are anecdotal, but numerous, reports of increased fatigue whenreading at workstations compared to film on alternators. The reasons for thisare not fully known, but a review of the work of Rogers et al., shows thatradiologists spend time performing actions that take them away from thealternator, or at least serve as a break in the reading process. Examples citedby Rogers include reviewing the patient history including the requisition andother paperwork, sorting through films and hanging them, and removing afilm from the view box for “hot light” viewing or repositioning. With work-stations, particularly those that do support an RIS interface, these tasks aredone at the workstation. This author believes that at least some componentof the fatigue is due to the lack of the short breaks afforded by the tasks asso-ciated with the reading process for film. The increased time spent lookingat nonimage areas to perform operations, as noted by Krupinski, may alsocontribute to this feeling of fatigue since the amount of eye movementinvolved in the reading task is increased.
Better attention to both the ergonomics of the workstation and theworkstation environment should help increase acceptance of workstationsfor primary diagnosis and decrease user physical discomfort while doing so.
THE FUTURE OF WORKSTATIONS
One problem with the development of user interfaces and specification ofworkstation functions is that the model used is film-based operation. Whilethis is a good base on which to build, it tends to obscure the things that canbe done with digital imaging workstations that cannot be done with film.Some techniques, such as window width and level adjustment, have becomea routine function on workstations that is not possible with film without photographing the image at multiple window width and level settings (whichis typically still done in film-based CT reading). For ultrasound, nuclearmedicine, and cardiac angiography, cine or dynamic displays can be donewith film or videotape, but they are much easier to do on workstations. The“stack view” mode, in which cross-sectional images are viewed rapidly as though moving through a stack, is also readily accomplished on mostworkstations.
The author has experimented with a technique from the aerial recon-naissance field, sometimes called the “window shade” display. This wouldpotentially allow a display of 2 images to be compared on 1 monitor. A
PACS: A Guide to the Digi tal Revolut ion422
DRE20 11/16/2005 9:57 AM Page 422

PACS WORKSTATION SOFTWARE 423
movable bar or region of interest (ROI) would show the image “underneath”(see Figure 20.6). Though formal studies of this technique have not beendone in radiology, those radiologists who tried the prototype expressed inter-est in it. One advantage is that the viewer does not have to turn his or herhead to view the comparison image on another monitor.
A method employing the registration and subtraction of 2 temporallyspaced images (temporal subtraction) has been demonstrated by Kano andcolleagues from the University of Chicago. In this technique, the 2 imagesto be subtracted are first registered so that differences due to patient posi-tion are minimized. The subtraction image then shows areas of change asblack. Such areas can be used to direct the viewer’s attention during inspec-tion of the image to be read.
Also pioneered by the University of Chicago has been the use of com-puter-aided detection (CAD). Software for automated detection of breastmasses is now in increasing clinical use; there are commercial vendors ofsuch system software. At present, such software is not intended to replacethe radiologist but rather to reduce the false negative rate in circumstancesin which the consequences of the false negative are severe. The programscan display what they detect as a graphic overlay on the image. The size or
FIGURE 20.6
These are two images of the same screen and show a displaymethod that the author has experimented with for comparison oftwo images. There are two images are placed “on top of” each other.By sliding a bar (vertically in this example, but also configurablehorizontally or as a region of interest box) more or less of the image“underneath” is revealed. No attempt was made to align the images(as is apparent from the differing position of the ribs). This allowscomparison without having to move one’s gaze from one monitorto another. It might also be useful for showing a processed, differentgrayscale adjusted, or annotated image together with the original.
DRE20 11/16/2005 9:57 AM Page 423
shape of the graphical elements used can indicate the computed likelihoodof a real lesion based on the decision criteria the program uses. The radio-logist then evaluates these areas on the image and decides whether thedetected structure represents pathology.
Aside from functions and methods employed to enhance usability ordiagnostic accuracy, workstations must also address the problem of imageavailability in diverse locations. Haskin noted some years ago that most hos-pitals have a very large number of light boxes, which implied that there area large number of locations in which images are viewed. Contemporaryhealthcare systems involve very large networks of facilities of varying sizes,from physician offices to large medical centers. Since the patient populationis served by combinations of these facilities, some manner of distributingimages and other information is needed to support the level of service thatsuch networks are advocating.
The Web-based workstation described above is rapidly proving to bea useful way to provide very wide distribution of images to clinical users.Experience with the Internet has allowed intranets to be developed. Essen-tially, these are local (or even wide) area networks that are either private orthat have secure connections between them and the Internet. Chapter 14 ofthis book discusses networks to a greater extent.
For historical interest, the use of personal computers with a browserto access medical information has been described by several authors. Move-ment of the Internet Web search service software to intranets means that the capability to search even very large databases will be available forintranets.
Workstations also permit on a desktop what used to require a main-frame computer: reconstruction of two-dimensional (2-D) slice data into 3-D images that may be manipulated in real-time. This is, in itself, a large topicdeserving of much greater explanation than can be given here. Computergraphics methods add yet another dimension to abilities beyond what filmcan accomplish. The reference by Vannier provides an overview of thesubject. A current trend is to support these complex graphics-intensive operations at the same workstation for which conventional projection radiographic as well as 2-D cross-sectional imaging is interpreted. Theincreasing power of the personal computers and graphics display cards usedin workstations is making it possible to incorporate into the workstation soft-ware that previously needed special high-performance graphics hardware.The client-server approach is also being used, with the very high perform-ance of a centralized graphics processor being made available with a thinclient application on the workstation (e.g., TeraRecon, Inc, San Mateo,Calif ).
PACS: A Guide to the Digi tal Revolut ion424
DRE20 11/16/2005 9:57 AM Page 424

PACS WORKSTATION SOFTWARE 425
It is important to know about another development in workstation soft-ware. Though a small effort in comparison to commercial vendors’ software,there are a number of software packages available for free that perform manyof the functions of commercial software. Some of these are also “opensource” developments, and those who wrote the software are making thesource code (the programming of the software, not just the “runtime” part)so that others can add to the effort. The operating system Linux is anexample of an open source software project that has been very successful.The topic of open source software development is a very extensive one andis well beyond the scope of this chapter, but the future importance formedical imaging is unmistakable.
The author has collected a number of references specifically to freesoftware for viewing DICOM images. He has personally used a programcalled IrfanView for converting various image formats, ezDICOM as a PC-based viewer that has many workstation features, and Osirix, which is a verypowerful Macintosh-based image viewer. The reader is encouraged to do Internet searches for “DICOM viewers” as a way to find the latest suchofferings.
It is likely that displays will continue to evolve. Plasma and LCD dis-plays are now prevalent in consumer televisions. Some of these are physi-cally large enough and have the ability to display pixel matrices sufficient forviewing medical images from a distance and so may find use in conferenceand operating rooms. Other flat-panel and novel display technologies,notably the organic light emitting diode (OLED) and micromirror (alsoknown as the digital light processor, DLP [DLP, Texas Instruments Inc,Plano, Tex]) are likely to find application in medical imaging. The micro-mirror display is already widely used in the digital projectors and some large-screen projection television sets. The micromirror is a set of microscopicmirrors and drive electronics fabricated on a silicon wafer using the sametechniques used to make other integrated circuit chips. Unlike flat panels,this display uses the mirrors to modulate a beam of light reflected from theirsurface. The OLED potentially allows for very thin, “flexible” displays.These could be applied to a wide variety of surfaces or built into monitorcases. Unlike LCDs, the OLED is a light-emitting device, so it does notneed backlights. Potential production costs are low compared to LCDs. Newdisplay technology can mean new applications for workstations as they canbe used in locations and for purposes not possible with other workstationdisplays.
DRE20 11/16/2005 9:57 AM Page 425
PACS: A Guide to the Digi tal Revolut ion426
CONCLUSION
Workstations are replacing or will replace conventional film for the diag-nostic and review tasks for medical imaging. For this to happen on a largescale, the barriers to acceptance (lack of adaptability, automation, and inte-gration) will have to be overcome. This, in turn, requires that the users ofworkstations expend more effort in understanding their work in detail andwith a knowledge of the human factors involved. Manufacturers need to usethis understanding and knowledge in the development of the next genera-tion of workstations. Department administration and the architects who plandepartments should learn, preferably by firsthand observation, that the envi-ronments into which workstations will be placed are critical to their use andacceptance.
Those who are impatient for workstations to replace film-based readingshould recall that radiologists have a hundred-year experience with film.There are those who pessimistically note that the “paperless office” and“bookless library” have not come to pass despite the availability of the tech-nology to make these possible should also note that where electronicmethods are superior to paper and books and where the applications devel-oped are simpler to use, computer-based technology has prevailed. Theexamples of electronic mail and computerized literature searches readilycome to mind. This author would agree, though, that more widespreadacceptance of workstations is dependent on their further evaluation andrefinement and that it is the efforts of those who have pioneered electronicimaging in medicine that are enabling this progress.
◗ REFERENCES
Alter AJ, Kargas GA, Kargas SA, Cameron JR, McDermott JC. The influence ofambient and viewbox light upon visual detection of low-contrast targets in aradiograph. Invest Radiol. 1982;17:402–406.
American College of Radiology. ACR Standard for Teleradiology. Reston, VA: American College of Radiology; 1994.
Arenson RL, Chakraborty DP, Seshadri SB, Kundel HL. The digital imaging work-station. Radiology. 1990;176:303–315.
Asher RW, Martin H. Cathode ray devices. In: Luxenberg HR, Kuehn RL, eds.Display Systems Engineering. New York: McGraw-Hill; 1968:237–276.
Augarten S. Bit by Bit: An Illustrated History of Computers. New York: Ticknor andFields; 1984:263–281.
DRE20 11/16/2005 9:57 AM Page 426

PACS WORKSTATION SOFTWARE 427
Baxter B, Ravindra H, Norman RA. Changes in lesion detectability caused by lightadaptation in retinal photoreceptors. Invest Radiol. 1982;17:394.
Beard D, Pizer S, Rogers D, et al. A prototype single-screen PACs console devel-opment using human-computer interaction techniques. Proc SPIE. 1987;767:646–653.
Beard DV. Designing a radiology workstation: a focus on navigation during the inter-pretation task. J Digit Imaging. 1990;3(3):152–163.
Beard DV, Walker JGF, Bell I, Cromartie R. Evolved design of a radiology work-station using time-motion analysis and the keystroke model. SPIE Phys MedImaging. 1989;1091:121–131.
Beard DV, Hemminger BM, Perry JR, et al. Interpretation of CT studies: single-screen workstation versus film alternator. Radiology. 1993;187(2):565–569.
Beard DV, Pisano ED, Denelsbeck KM, Johnston RE. Eye movement during com-puted tomography interpretation: eyetracker results and image display-timeimplications. J Digit Imaging. 1994;7(4):189–192.
Bell CG. Toward a history of (personal) workstations. In: Goldberg, A, ed. A Historyof Personal Workstations. New York: ACM Press; 1988:4–36.
Chang PJ, Hoffman E. Multimodality workstation featuring multiband cine modeand real-time distributed interactive consultation. RSNA; 1993:InfoRADExhibit 9507WS.
DeJesus EX. The searchable kingdom. Byte. 1996;22(6):92NA1–92NA12.Derbyshire K. Beyond AMLCDs: Field emission displays? Electronics Design.
October 1994:56–66.Duerinckx AJ, ed. Picture Archiving and Communications Systems for Medical Applica-
tions, Parts I and II. Bellingham, WA: SPIE; 1982. Proc. SPIE; vol 318:Dwyer SJ III, Templeton AW, Anderson WH, et al. Salient characteristics of a dis-
tributed diagnostic imaging management system for a radiology department.SPIE Phys Med Imaging. 1982;318:194–204.
el-Saden SM, Hademenos GJ, Zhu W. Assessment of intraaxial and extraaxial brainlesions with digitized computed tomographic images versus film: ROC analysis.Acad Radiol. 1997;4(2):90–95.
Engelbart D. The augmented knowledge workshop. In: Goldberg A, ed. A Historyof Personal Workstations. New York: ACM Press; 1988:187–232.
Feingold E, Seshadri SB, Arenson RL. Folder management on a multimodalityPACS display station. SPIE Phys Med Imaging. 1991;1446:211–216.
Feingold ER, Grevera GJ, Mezrich RS, et al. Web-based radiology applications forclinicians and radiologists. SPIE Phys Med Imaging. 1997;3035:60–71.
Fujino T. Simulation and Computer Aided Surgery. Chichester, UK: John Wiley andSons; 1994.
Greenes RA. Toward more effective radiologic workstation consultation: Design ofa desktop workstation to aid in the selection and interpretation of diagnostic
DRE20 11/16/2005 9:57 AM Page 427
procedures. In: Proceedings of the Eighth Conference of Computer Applications inRadiology. American College of Radiology; 1984:554–561.
Greenes RA, Bauman RA. The era of healthcare reform and the information super-highway. Radiol Clin North Am. 1996;34(3):463–468.
Goldberg A, ed. A History of Personal Workstations. New York: ACM Press; 1988.Gray HT, Sune CT, Jones GW. Silicon field emitter arrays for cathodoluminescent
flat-panel displays. J Soc Info Display. 1993;1(2):143–146.Hafner K, Lyon M. Where Wizards Stay Up Late: The Origins of the Internet. New
York: Simon and Schuster; 1996.Haskin ME, Haskin PH, Laffey PA, et al. Data versus information: which should we
exchange? SPIE Phys Med Imaging. 1985;536:37–42.Hohman SA, Johnson SJ, Valentino DJ. Radiologists’ requirements for primary diag-
nosis workstations: Preliminary results of task-based design surveys. SPIE PhysMed Imaging. 1994;2165:2–7.
Honeyman JC, Arenson RL, Frost MM, et al. Functional requirements for diag-nostic workstations. SPIE Phys Med Imaging. 1993;1899:103–109.
Horii SC. Electronic imaging workstations: ergonomic issues and the user interface.Radio-Graphics. 1992;12:773–787.
Horii SC, Horii HN, Mun SK, Benson HR, Zeman RK. Environmental designs forreading from imaging workstations: ergonomic and architectural features. J Digit Imaging. 1989;2(3):156–162.
Horii SC, Kishore S, Stevens JF, et al. Overlapped image display method: a tech-nique for comparing medical images on a workstation. SPIE Phys Med Imaging.1994;2164:456–466.
Horii SC, Feingold ER, Kundel HL, et al. PACS workstation usage differencesbetween radiologists and MICU physicians. SPIE Phys Med Imaging. 1996;2711:266–271.
Huo Z, Giger ML, Vyborny CJ, Wolverton DE, Doi K, Schmidt RA. Computer-ized classification of malignant and benign masses on digitized mammograms.Acad Radiol. 1998;5(3):155–168.
Jost RG, et al. An electronic multiviewer. In: Proceedings of the Eighth Conference ofComputer Applications in Radiology. American College of Radiology; 1984:304–311.
Kano A, Doi K, MacMahon H, Hassell DD, Giger ML. Digital image subtractionof temporally sequential chest images for detection of interval change. Med Phys.1994;21(3):453–461.
Krupinski EA, Lund PJ. Comparison of film vs. monitor viewing of CR films usingeye-position recording. Proc SCAR ’96. 1996:269–274.
Kundel HL. How much spatial resolution is enough? A meta-analysis of observerperformance studies comparing plain films and digital hard copy. SPIE Phys MedImaging. 1993;1899:86–89.
PACS: A Guide to the Digi tal Revolut ion428
DRE20 11/16/2005 9:57 AM Page 428
Lampson BW. Personal distributed computing: the Alto and Ethernet software. In:Goldberg A, ed. A History of Personal Workstations. New York: ACM Press;1988:293–335.
Larsen GN. Interactive Image Processing for Computerized Tomography [PhD thesis].Columbia: Department of Electronics and Electrical Engineering, University ofMissouri at Columbia; 1976.
Lawrence A. Acoustic design. In: Ruck NC, ed. Building Design and Human Perfor-mance. New York: Van Nostrand Reinhold; 1989:117.
Lemke HU, Stiehl HS, Scharnweber N, Jackel D. Applications of picture process-ing, image analysis, and computer graphics techniques to cranial CT scans. In:Proceedings of the Sixth Conference on Computer Applications in Radiology and Computer/Aided Analysis of Radiological Images. IEEE Computer Society Press;1979:341–354. Reprinted in: J Dig Imaging 2003;16(1):11–28.
Leung KT, Ho KBT, Chao W, et al. Image navigation for PACS workstations. SPIEPhys Med Imaging. 1995;2435:43–49.
Li X, Valentino DJ, So GJ, et al. World Wide Web telemedicine system. SPIE PhysMed Imaging. 1995;2711:427–439.
Licklider JCR. Some reflections on early history. In: Goldberg A, ed. A History ofPersonal Workstations. New York: ACM Press; 1988:117–130.
Maguire GQ Jr, Zeleznik MP, Horii SC, et al. Image processing requirements inhospitals and an integrated systems approach. SPIE Phys Med Imaging.1982;318:206–213.
Mann S. Cyborg seeks community. Technol Rev. 1999;102(3):36–42.Mascarini C, Ratib O, Trayser G, Ligier Y, Appel RD. In-house access to PACS
images and related data through World Wide Web. SPIE Phys Med Imaging.1995;2711:531–537.
MDIS Technical Development Team. Medical Diagnostic Imaging Support System:Acquisition Document. Huntsville, AL: US Army Engineer Division; 1991.
Motamedi ME, Wu MC, Pister KSJ. Micro-opto-electro-mechanical devices andon-chip optical processing. Opt Eng. 1997;36(5):1282–1297.
Perry J, Prior F. Purchasing a PACS: an RFP toolkit. In: Siegel EL, Kolodner RM,eds. Filmless Radiology. New York: Springer-Verlag; 1999:33–84.
Ravindra H, Norman RA, Baxter B. The effect of extraneous light on lesiondetectability: a demonstration. Invest Radiol. 1983;18:105.
Robb RA. Volume visualization and virtual reality in medicine and biology. In:Lemke HU, Vannier MW, Inamura K, Farman AG, eds. Proceedings of CAR ’98:Computer Assisted Radiology and Surgery. Amsterdam: Elsevier; 1998:131– 142.
Rogers DC, Johnston RE. Effect of ambient light on electronically displayed medicalimages as measured by luminance-discrimination thresholds. J Opt Soc Am.1984;A4:976.
PACS WORKSTATION SOFTWARE 429
DRE20 11/16/2005 9:57 AM Page 429

Ross DT. A personal view of the personal work station. In: Goldberg A, ed. A Historyof Personal Workstations. New York: ACM Press; 1988:54–111.
Rossman K. Image quality. Radiol Clin North Am. 1969;7(3):419–433.Rostenberg B. The Architecture of Imaging. Chicago: American Hospital Publishing;
1995.Sampsell JB. An overview of the digital micromirror device and its application to
projection displays. SID International Symposium Digest of Technical Papers.1993;24:1012.
Say DL, Hedler RA, Maninger LL, et al. Monochrome and color image-displaydevices. In: Benson KB, ed. Television Engineering Handbook. New York:McGraw-Hill; 1986:12.1–12.53.
Sezan MI, Yip KL, Daly SJ. An investigation of the effects of uniform perceptualquantization in the context of digital radiography. SPIE Phys Med Imaging.1987;767:622–630.
Scott WW Jr, Bluemke DA, Mysko WK, et al. Interpretation of EmergencyDepartment radiographs by radiologists and emergency medicine physicians:teleradiology workstation versus radiograph readings. Radiology. 1995;195:223–229.
Sherr S. Electronic Displays. 2nd ed. New York: John Wiley and Sons; 1993:201–340.Shyankay J. Diamond films used in flat panel displays. R&D Magazine. April 1995:
44.Slasky BS, Gur D, Good WF, et al. Receiver operating characteristic analysis of chest
image interpretation with conventional, laser printed, and high-resolution work-station images. Radiology. 1990;174:775–780.
Spindt CA, Brodie I, Hamphrey L, Westerberg ER. Physical properties of thin-filmfield emission cathodes with molybdenum cones. J Appl Phys. 1976;47(12):5248–5251.
Taira RK, Wong C, Johnson D, et al. Design of a graphical user interface for anintelligent multimedia information system for radiology research. SPIE PhysMed Imaging. 1995;2435:11–23.
Taylor JH. Vision. In: Parker JF, West VR, eds. Bioastronautics Data Book. 2nd ed.Washington, DC: NASA; 1973:611–665.
ter Haar Romeny BM, Raymakers J, van Waes PFGM, et al. The Dutch PACSproject: Philosophy, design of a digital reading room and first observations inthe Utrecht University Hospital in the Netherlands. SPIE Phys Med Imaging.1987;767:787–792.
Thacker CP. Personal distributed computing: the Alto and Ethernet hardware. In:Goldberg A, ed. A History of Personal Workstations. New York: ACM Press;1988:267–289.
van der Voorde F, Arenson R, Kundel H, et al. Development of a physician-friendlydigital image display console. SPIE Phys Med Imaging. 1986;626:541–548.
PACS: A Guide to the Digi tal Revolut ion430
DRE20 11/16/2005 9:57 AM Page 430

Vannier MW, Marsh JL. Three-dimensional imaging, surgical planning, and image-guided therapy. Radiol Clin North Am. 1996;34(3):545–563.
Vining DJ. Virtual endoscopy: is it reality? Radiology. 1996;200:30–31.Xu XW, Doi K, Kobayashi T, MacMahon H, Giger ML. Development of an
improved CAD scheme for automated detection of lung nodules in digital chestimages. Med Phys. 1997;24(9):395–403.
PACS WORKSTATION SOFTWARE 431
DRE20 11/16/2005 9:57 AM Page 431
BREAST IMAGING,COMPUTER-AIDEDDETECTION, AND
COMPUTER-ASSISTED
CLASSIFICATION
SHALOM S. BUCHBINDER
Mammography, the primary screening and diagnostic tool for the detec-tion and diagnosis of breast cancer, in many ways represents the
extremes on the timeline in the shift of radiology toward full digital imaging.Mammography was the first modality to be digitally converted and to apply
21CHAPTER
DRE21 11/16/2005 9:58 AM Page 433

computer-associated artificial intelligence to diagnosis. However, it was alsothe last major modality to have a commercially marketed digital system. Fur-thermore, in many departments mammography is the last division convertedto digital format.
The delay in the development and deployment of full field digital mam-mography (FFDM) primarily relates to the exacting spatial resolutionrequired in order to detect and correctly analyze microcalcifications. Manymalignant microcalcifications may be as small as 0.3mm in size, 1 order ofmagnitude smaller than most radiographically identified abnormalities. Con-troversy still exists regarding the optimum, cost-effective acquired pixel sizefor the appropriate visualization and analysis of microcalcifications. Forexample, a 50 or 100mm pixel pitch might enable the identification of smallclusters of microcalcifications. However, a 25mm pixel pitch may enable amore rigorous analysis of the morphology of the individual microcalcifica-tions, thus improving specificity by allowing better discrimination betweenbenign and malignant microcalcifications. However, with each halving ofacquired pixel pitch, there is a quadrupling of the number of pixels, whichsubstantially increases the cost of storage and time required for processingand network transmission of the data.
A second major challenge faced by digital mammography is the needfor superb contrast over a wide dynamic range. The breast contains benign,dense fibroglandular tissue and lucent fatty tissue as well as masses and/ormicrocalcifications that may be of benign or malignant origin. Uniformlydense mammograms and even mammograms with a combination of differ-ent densities can make discriminating subtle areas of malignancy most chal-lenging. Improving visualization requires improved contrast resolution,which entails optimizing the bit depth of each pixel since contrast resolutionis a function of the bit depth. Improved contrast resolution must also be opti-mized from a cost-benefit perspective similar to that for spatial resolution.The requirements for a wide dynamic range, with optimal spatial and con-trast resolution, have been met through extensive research and confirmedwith the approval process’s mandatory equivalency testing, allowing for theultimate introduction of digital mammography into the marketplace.Because of these technological advances, new applications are being devel-oped for FFDM. For example, tomosynthesis shows promise as a techniqueto improve visualization of breast cancer.
In addition to the acquisition of the digital mammogram, downstreamrequirements for processing (as well as computer-aided detection [CAD] andpotentially computer-assisted classification [CAC]) had to be developed. Therigorous requirements related to the display for softcopy interpretation,which is the preferred manner for digital interpretation, and production of
PACS: A Guide to the Digi tal Revolut ion434
DRE21 11/16/2005 9:58 AM Page 434
high-resolution hard copies (as needed) required extensive evaluation andapproval. The data storage requirements also had to be met in a cost-effective manner. FFDM storage requirements, by virtue of the optimumcontrast and spatial resolution needed, are particularly large and hence costly.Facilities with robust picture archiving and communication systems (PACS)usually have a cost-effective archive. However, smaller radiology practices orfreestanding mammography boutiques may need to employ a specializedmammography PACS or utilize offsite digital archiving, which adds signifi-cantly to the cost of FFDM.
Due to these requirements, the overall cost for complete FFDMsystems is substantially higher than for conventional mammography. Thiscost has been partially mitigated by increased patient throughput availablewith FFDM, which is in the range of 150% to 200% of standard film-screenexaminations. In addition, increased reimbursement for each case is allowedby most health insurers, which is frequently 150% of the standard rate.
Now that FFDM has become a reality, the major benefits of the digitalimage—CAD, CAC, and PACS—can be exploited. The digital image mayallow improved accuracy with the utilization of the CAD and CAC software.Integration into a PACS allows optimized distribution and storage. However,as these benefits are fundamentally related to the digital image, similar benefits may potentially be obtained from computed radiography (CR) technology once its ability to provide diagnostic accuracy is proven toapproximate conventional film-screen images and FFDM. Computed radi-ography mammography, when introduced, potentially has the benefit ofreduced costs, which in the competitive mammography marketplace mayexert downward pressure on the cost of FFDM.
COMPUTER-AIDED DETECTION AND COMPUTER-ASSISTED CLASSIFICATION
Early and accurate detection of breast cancer is important for optimizingtherapy and affording the patient a better prognosis. Mammography, in con-junction with physical examination, is the most effective tool available todayfor mass screening for the early detection of breast cancer. It can potentiallyreduce mortality by as much as 40% to 63%. Various studies have shownthat a significant number of biopsy-proven malignancies are not detected bymammography. Mammography has particular difficulty in detecting breastcancers in women with dense breast tissue that may obscure the lesion ormake it more difficult to identify even if visible. Subtle areas of architecturaldistortion can also be challenging. Other false negatives may relate to visible
BREAST IMAGING, CAD, AND CAC 435
DRE21 11/16/2005 9:58 AM Page 435

cancers being misinterpreted or overlooked because of inexperience, dis-traction, or fatigue caused by the large number of examinations presented to the limited number of mammographers or by suboptimal film quality.Therefore, methods that can overcome these difficulties in interpretingmammograms are of major importance. It has been shown that breast cancerdetection rates can be substantially improved by using second readers.However, in many instances it is not feasible to perform a second read byhuman mammographers. Potentially, even after a second reader’s interpre-tation, significant numbers of missed cancers might still exist and may bedetected by the addition of computer software.
For this reason CAD appears to be one of the most important or, assome suggest, the most important collateral benefit from the availability ofdigital mammography, since it allows cost-effective and efficient acquisitionof the digital image to computer software that can then serve as the secondreviewer (or even the third reviewer after the double reading by the humanmammographers) to optimize the detection of abnormalities. CAD can over-come much of the difficulty and expense inherent in a reading by a secondmammographer and may conceptually be even more accurate than somemammographers in detecting abnormalities.
These detection systems are popularly known by the acronym CAD,which has been used to represent varied abbreviations including computer-aided detection, computer-aided diagnosis, computer-assisted detection, andcomputer-assisted diagnosis. In this chapter, CAD will be used to representcomputer software that detects abnormalities. In addition, the data can alsobe analyzed by specialized software that can help classify the likelihood ofmalignancy of any identified abnormalities. These systems will be calledCAC in this chapter, representing computer-assisted classification.
This idea of using computers in facilitating the mammography exam-ination is not a new one. In August of 1967, Winsberg, Elkin, et al., fromthe Albert Einstein College of Medicine of Yeshiva University, authored anarticle in Radiology titled “Detection of Radiographic Abnormalities in Mam-mograms by Means of Optical Scanning and Computer Analysis,” in whichthey noted, “Because of the problems inherent in the routine viewing of largenumbers of examinations of presumably asymptomatic patients we have proposed the automation of reading of the radiographs by means of opticalscanning and computer interpretation.” It has taken over 35 years to evenapproximate this idealized vision of mammography.
After the digital image is acquired, software algorithms are employedto meticulously review the data and search for areas that appear to be dif-ferent from the surrounding tissue. These algorithms can identify microcal-cifications and masses. However, the relatively rare but visually challenging
PACS: A Guide to the Digi tal Revolut ion436
DRE21 11/16/2005 9:58 AM Page 436

areas of architectural distortion are not as well identified by CAD, requir-ing more research. Integration of data from both breasts, which would allowidentification of potential asymmetry, is also presently under development.Integration of prior mammograms may also be useful in identifying devel-oping densities or other interval changes.
The sensitivity of detection of abnormalities, the prime role of CAD,is related to a great extent to the specificity of the system. For example, usingjust the number of microcalcifications as a discretionary feature, a system setfor a minimum threshold of 5 microcalcifications per area may discount earlymalignancies that manifest themselves with only 4 microcalcifications.However a threshold level set at 3 microcalcifications would identify thosemalignant clusters as well as any other clusters of 4 microcalcifications. Thus,to maximize true positive identifications (reduce false negatives) it is neces-sary to allow for more false positives, although too many false positives maybe disturbing and potentially discredit the CAD system for some users.Potentially, practices whose referral base has little tolerance for a low sensi-tivity and will readily accept lower specificity can have their needs met byincreasing the false positives allowed. A “dial up or down” feature to allowfor practices or mammographers to set their own sensitivity/specificity levelwould be a desirable feature.
The utilization of a CAD system requires a digital image. This digitalimage can be derived from 3 different mechanisms: (1) manual digitizationof a conventional film-screen mammogram, which is labor intensive, (2) aFFDM machine, or (3) CR (potentially). Conceptually, the end result is adigital image representing the underlying breast tissue. However, there areinherent problems associated with digitization of conventional film-screenmammograms. This is because of the lack of reproducibility of the digitizedimage. The use of calibration strips can allow for an approximation, but eachtime an analog image is digitized, the results are slightly different, and thiscould affect the results of the CAD analysis. A slightly different input dueto fluctuations in the digitization process could yield a very different output,which could create medicolegal difficulties. Thus, it is simpler to deal withimages that are inherently digital instead of trying to digitize analog ones.Inherently digital images can also be sent more efficiently through a CADsystem because they require no digitization step (although no definitivestudies have yet been published on this). For this reason, the CAD-markedimages should not have to be archived, as long as the version of the CADsystem used is documented and can be reproduced as needed in the futurein conjunction with the original digital mammography data.
Because there are 2 different primary signs of breast cancer, microcal-cifications and masses, it is necessary to have 2 different detection algorithms.
BREAST IMAGING, CAD, AND CAC 437
DRE21 11/16/2005 9:58 AM Page 437

The microcalcification algorithm identifies and evaluates pixels that may rep-resent calcium. The individual microcalcifications can be outlined, their sizequantified, and the features of each analyzed. The cluster as a whole is alsoanalyzed. The minimum number of adjacent calcifications within a pre-scribed area may be calculated and compared to the software’s minimumthreshold level deemed appropriate for analysis. Mathematical models arethen used to evaluate the combined data and determine which cluster ofmicrocalcifications should be presented to the mammographer for furtherevaluation. With respect to the evaluation of masses, the software can searchfor an area with different characteristics from the background. It can refineits analysis with evaluation of the mass’s density and its border characteris-tics, such as spiculation.
CAD has been successful in detecting approximately 80% to 90% ofall malignancies. However, the systems at present appear to be more sensi-tive in detecting clusters of microcalcifications than masses, with microcal-cifications detected in the upper 90% range and masses detected in the 80%to 90% range. The less frequently occurring architectural distortion is rel-atively poorly identified. As can be expected, CAD will benefit some radiol-ogists more than others. Experience appears to be inversely proportional tothe amount of improvement seen with CAD.
Computer-aided detection is primarily a sensitivity-enhancing tool,with potentially deleterious effects not only to specificity, but also to recallrates and positive predictable value. Recall rates appear to have a modestdeterioration that appears because of the sensitivity improvement. Similarly,there have been only minimal effects on positive predictive value (PPV). Thisis because the additional false positive biopsies recommended are offset bythe additional true positives. When the two are combined, the PPVapproaches the original PPV, but with more cancers detected. Therefore, itis better if abnormalities detected by either the mammographer or CAD canbe directed to a CAC system. Such a classification system can then evaluateand exclude many questionable areas, thereby making the correct diagnosisas accurate, sensitive, and specific as possible while maintaining reasonablerecall rates. Similar to CAD, these classification systems also need to havedifferent algorithms to classify microcalcifications and masses, but they donot use the same algorithms as those used for detection. Once detected, eachmicrocalcification is characterized according to several properties, includingbrightness, area, length, and shape. After these quantitative parameters areobtained, the microcalcification cluster can be classified into each of 3 majorsubdivisions: first is a group that characterizes variables in morphology ofthe individual calcifications; second is a group that reflects the heterogene-ity of the morphologic features related to the individual calcifications; third
PACS: A Guide to the Digi tal Revolut ion438
DRE21 11/16/2005 9:58 AM Page 438

is a group that characterizes variables in the distribution of the calcificationswithin a cluster. The spatial orientation appears to be most helpful in dis-tinguishing benign from malignant clusters. Artificial intelligence then cananalyze all the information and compare it to known statistics representingfrequency of malignancy. The system then can give a final assessment as tothe likelihood of an abnormality being malignant (see Figure 21.1). Thisanalysis cannot be performed by the mammographer because many of theunderlying features analyzed are too small (malignant microcalcifications arein the 0.3mm range) and the calculations too complex, making the analysisbeyond human capability. Algorithms for evaluating masses include analysisof features that characterize shape, definition of the margins, and variousaspects of spiculation (see Figure 21.2). The information derived can be usedto approximate the likelihood of malignancy (high, intermediate, or low) ofany abnormalities identified.
Prototype classification schemes that give gross estimates of malig-nancy are currently being evaluated and show promise in initially being used
BREAST IMAGING, CAD, AND CAC 439
FIGURE 21.1
Computer analysis of a cluster of microcalcifications. (Courtesy ofProfessor Isaac Leichter, Siemens Computer Aided Diagnosis Ltd.)
DRE21 11/16/2005 9:58 AM Page 439

by physicians to potentially (and at their discretion) modify Breast ImagingReporting and Data System (BIRADS) assessments. Systems of this naturemay be particularly helpful in evaluating abnormalities that have a prelimi-nary diagnosis of probably benign. With more refinements, the CAC systemsmay ultimately be able to give a probability range of an abnormality’s poten-tial to be malignant, for example, 20% to 25% chance. The referring physi-cian and patient can then incorporate these data to more accurately assessrisk-benefit relationships of the various options for management of the iden-tified abnormality. In addition, combination systems with CAD and CAC,in tandem, are also being evaluated and appear to be on the horizon to aidthe mammographer’s interpretation.
Ultimately, robust algorithms combining CAD and CAC systems maybe employed to prescreen the large number of screening mammograms fromthe patients recommended to have this examination. Only selected cases that
PACS: A Guide to the Digi tal Revolut ion440
FIGURE 21.2
Computer analysis of a breast mass. (Courtesy of Professor IsaacLeichter, Siemens Computer Aided Diagnosis Ltd.)
DRE21 11/16/2005 9:58 AM Page 440

fall outside predetermined threshold levels for probability of disease will thenneed to be evaluated by the mammographer for final assessment. Similarcomputer methods have been applied medically for cervical cancer screen-ing and also in nonmedical commercial endeavors. Despite the significantresearch that has already been undertaken, particularly over the past decade,additional research is required to fulfill the promise envisioned by Winsberg,Elkin, et al., in 1967 to make mammography as sensitive, specific, readilyavailable, and cost effective as possible.
PACS AND BREAST IMAGING
The integration of breast imaging into PACS is associated with severalunique challenges with respect to softcopy image interpretation, communi-cation for consultation, and archival storage. When an organization commitsto FFDM, it must decide how the images will be interpreted. The preferredmethod of interpretation is via softcopy display, although some practices maystill prefer printed film displayed on a view box. Softcopy reading requireshigh-resolution monitors to enable the physician to visualize the minutedetails for accurate diagnosis. Printed film interpretation of images derivedfrom FFDM requires a specialized high-resolution printing capability.
If the decision is to use the digital image for only softcopy interpreta-tion, no hardcopy production should be necessary unless specifically requiredfor distribution outside the institution. Using the PAC system’s existingarchive appears intuitively to be the most appropriate method. However,during a transition phase (which in mammography usually takes up to 3years), previous images are needed for comparison in order to optimize diag-nosis. The comparison with the previous examinations enables appropriatediagnoses of any new masses or microcalcifications or allows for the identi-fication of any developing densities. Therefore, in the interim, adjacent tosoftcopy monitors used for FFDM acquired images, a view box for the con-ventional historical image review is necessary. An alternative is the digitiza-tion of the historic films with subsequent archiving into the PACS systemand visualization as necessary on a softcopy monitor for direct comparisonto the FFDM image. This process, in addition to being costly and tedious,has the inherent limitation of potential loss of information related to the dig-itization process. Therefore, most institutions have chosen to have a dual-method display: softcopy for the current FFDM images and films on a viewbox for the historical image comparison.
With respect to distribution of images, 3 separate situations must beconsidered. Many facilities run screening programs. Approximately 5% to
BREAST IMAGING, CAD, AND CAC 441
DRE21 11/16/2005 9:58 AM Page 441
15% of patients who are seen at a screening facility will require immediateadditional imaging, usually performed within 2 weeks at a diagnostic facil-ity. This will require the screening images to be available in order to appro-priately work up the abnormality. Other patients who have had FFDMperformed will need to have images distributed to referring physicians, suchas breast surgeons or other consultants (and potentially to the operatingroom during a surgical procedure). There are also images that the patientmay wish to distribute for a second opinion to physicians not affiliated withthe original practice. With respect to patients who have had screeningimages, the site where the screening images were obtained may either beFFDM or conventional film-screen, and the site where the patient willundergo the diagnostic study may likewise have either of the 2 types ofimaging equipment. As with the routine comparison with historic films, 1set of images may be on softcopy display and the second set of images maybe on a film view box.
Distribution to referring physicians and/or the operating room withinthe institution for gross visualization (not primary diagnosis) may be per-formed over the PACS enterprise distribution system (typically a Webbrowser–based interface) even though the display systems on most of theclients is not suitable for primary diagnosis. For most exams, this wouldappear to be adequate particularly for abnormalities such as large masses orclusters. For off-site distribution, facilities must use high-resolution copiers,which need to be specifically approved by the FDA for use with mammog-raphy images obtained with FFDM. These images can be shipped as anyother images and/or given to the patients for personal distribution. Directelectronic image distribution to off-site locations would be desirable pro-vided that necessary issues, such as network security, bandwidth, and HealthInsurance Portability and Accountability Act (HIPAA) regulations, areworked out.
Mammography images, by virtue of their high spatial resolution andneed for contrast over a large dynamic range, require relatively largeamounts of storage. Currently, mammography images are stored with loss-less compression. No studies have been performed yet with respect to storingmammography in a lossy form. This burden on a PACS system is substan-tial and clearly has to be calculated into the size of storage requirementswhen an organization with a PACS is contemplating FFDM integration orwhen an FFDM system is bought for a freestanding organization without aPACS already in place.
It is unclear whether it is really necessary to store the outputs of CADand CAC. So long as the version of the algorithms used at the time of diag-nosis is clearly documented, the results should be completely reproducible.
PACS: A Guide to the Digi tal Revolut ion442
DRE21 11/16/2005 9:58 AM Page 442
This is analogous to the use of window and leveling in computed tomogra-phy (CT) exams. Even though the radiologist often views CT images under3 different window/level settings, there is no need to store a separate copyof the images for each window/level setting used. Rather, applying the stan-dard settings to the original pixel data will consistently yield the same results.So, too, knowing which versions of CAD and CAC were used should permitpresentation of the marking data at any future time exactly as they were pre-sented to the mammographer at the time of initial interpretation.
In summary, mammography has had a long history with the digital rev-olution, but it is only now with the advent of FFDM that the benefits ofCAD, CAC, and PACS can be realized.
◗ REFERENCES
Australian Health Technology Assessment Commission. Review of automated andsemi-automated cervical screening devices—a summary. Canberra, Australia:Commonwealth Department of Health and Family Services; 1998.
Baker JA, Rosen EL, Lo JY, et al. Computer-aided detection (CAD) in screeningmammography: sensitivity of commercial CAD systems for detecting architec-tural distortion. AJR Am J Roentgenol. October 2003;181:1083–1088.
Bamberger P, Novak B, Fields, S. Optimizing parameters for computer aided diag-nosis of microcalcifications in mammography. Acad Radiol. 2000;7:406–412.
Beam CA, Sullivan DC, Layde PM. Effect of human variability on independentdouble reading in screening mammography. Acad Radiol. 1996;3:891–897.
Bird RE, Wallace TW, Yankaskas BC. Analysis of cancers missed at screening mam-mography. Radiology. 1992;184:613–617.
Birdwell RL, Ikeda DM, O’Shaughnessy KF, Sickles EA. Mammographic charac-teristics of 115 missed cancers later detected with screening mammography and the potential utility of computer-aided detection. Radiology. 2001;219:192–202.
Brem RF, Baum J, Lechner M, et al. Improvement in sensitivity of screening mam-mography with computer-aided detection: a multiinstitutional trial. AJR Am JRoentgenol. September 2003;181(3):687–693.
Buchbinder S, Novak B. Quantitative characterization of mass lesions on digitizedmammograms for computer assisted diagnosis. Invest Radiol. 2000;35:366–372.
Buchbinder S, Leichter I, Bamberger P, et al. Analysis of clustered microcalcifica-tion using a single numeric classifier extracted from mammographic digitalimages. Acad Radiol. November 1998;5:779–784.
Buchbinder S, Leichter I, Lederman R, et al. Can the size of microcalcificationspredict malignancy of clusters in mammography? Acad Radiol. 2002;9:18–25.
BREAST IMAGING, CAD, AND CAC 443
DRE21 11/16/2005 9:58 AM Page 443

Buchbinder S, Leichter I, Lederman R, et al. Computer-aided classification of BI-RADS category 3 breast lesions. Radiology. 2004;230:820–823.
Burhenne LW, Wood S, D’Orsi C, et al. Potential contribution of computer-aideddetection to the sensitivity of screening mammography. Radiology. 2000;215:554–562.
Cady B, Michaelson JS. The life sparing potential of mammographic screening.Cancer. 2001;91:1699–1703.
Ciatto S, Del Turco MR, Morrone D, et al. Independent double reading of screen-ing mammograms. J Med Screen. 1995;2:99–101.
Destounis SV, Dinitto P, Young-Logan W, et al. Can computer-aided detection withdouble reading of screening mammograms help decrease the false-negative rate?Initial experience. RSNA. 2004;578:584–585.
Duffy SW, Tabar L, Chen HH, et al. The impact of organized mammography servicescreening on breast carcinoma mortality in seven Swedish counties. Cancer.2002;95:458–469.
Fields S, Lederman R, Buchbinder S, et al. Improved mammographic accuracy withCAD assisted ranking of lesions. In: Proceedings of the 6th International Work-shop on Digital Mammography, June 2002, Bremen, Germany.
Fields S, Leichter I, Lederman R, et al. Improving the Performance of Mammo-graphic Assessment by the use of an Advanced Two-tiered CAD/CAC System.In: Proceedings of the 7th International Workshop on Digital Mammography,June 2004, Charolotte, NC, USA.
Freer T, Ulissey M. Screening mammography with computer-aided detection:prospective study of 12,860 patients in a community breast center. Radiology.2001;220:781–786.
Helvie MA, Hadijiiski L, Makariou E, et al. Sensitivity of Noncommercial Com-puter-aided Detection System for Mammographic Breast Cancer Detection:Pilot Clinical Trial RSNA. 2004;208:214.
Improving the performance of mammographic assessment by the use of an advancedtwo-tiered CAD/CAC system. Digital Mammography. 2002.
Kopans D. Breast Imaging. 2nd ed. Philadelphia: Lippincott-Raven; 1998.Leichter I, Fields S, Nirel R, et al. Improved mammographic interpretations of
masses using computer-aided diagnosis: Eur Radiol. 2000;10:377–383.Leichter I, Lederman R, Buchbinder S. Mammographic lesions: what diagnostic role
does the individual mc’s shape play compared to the cluster geometry? AJR AmJ Roentgenol. 2004;182:705–712.
Leichter I, Lederman R, Novak B, et al. The use of interactive software programfor quantitative characterization of microcalcifications of digitized film-screenmammograms. Invest Radiol. June 1999;34:394–400.
Lederman R, Leichter I, Buchbinder S, et al. Stratification of mammographic computerized analysis by BIRADS categories, Eur Radiol. 2003;13:347–353.
PACS: A Guide to the Digi tal Revolut ion444
DRE21 11/16/2005 9:58 AM Page 444

Malich A, Azhari T, Bohm T, et al. Reproducibility: an important factor determin-ing the quality of computer-aided detection (CAD) systems. Eur Radiol.2000;36:170–174.
Malich A, Marx C, Facius M, et al. Tumor detection rate of a new commerciallyavailable computer-aided detection system. Eur Radiol. 2001;11:2454–2459.
Nelson MT, Lechner MC. Comparison of three commercially available FDAapproved computer-aided detection (CAD) systems [abstract]. Radiology. 2002;225(P):600.
Oestmann JW. Digital mammography. In: Radiological Diagnosis of Breast Disease.Friedrich M, Sickles EA, eds. Berlin: Springer Verlag; 1997:65–73.
Petrick N, Sahiner B, Chan HP, et al. Breast cancer detection: evaluation of a massdetection algorithm for computer-aided diagnosis-experience in 263 patients.Radiology. 2002;224:217–224.
Tabar L, Vitak B, Chen HC, et al. Beyond randomized controlled trials; organizedmammographic screening substantially reduces breast carcinoma mortality.Cancer. 2001;91:1724–1731.
Thurfjell EL, Lernevall KA, Taube AA. Benefit of independent double reading in apopulation-based mammography screening program. Radiology. 1994;191:241–244.
Winsberg F, Elkin M, Macy J, et al. Detection of radiographic abnormalities inmammograms by means of optical scanning and computer analysis. Radiology.1967;89:211–215.
Zheng B, Hardesty L, Poller WR, et al. Mammography with computer-aided detec-tion: reproducibility assessment—initial experience. Radiology. 2003;228:58–62.
BREAST IMAGING, CAD, AND CAC 445
DRE21 11/16/2005 9:58 AM Page 445

THREE-DIMENSIONALIMAGING INRADIOLOGY
GORDON J. HARRIS
The purpose of this chapter is to explore the growing need for three-dimensional (3-D) imaging services, as well as the challenges and oppor-
tunities associated with implementing 3-D imaging in conjunction with apicture archive and communication system (PACS) environment. Theadvantages of 3-D imaging services are discussed, as well as the workflowinvolved in integration of 3-D imaging with PACS and radiology informa-tion systems (RIS), the staff and equipment needed for providing 3-D serv-ices, and issues with proper coding of claims and obtaining reimbursementfrom insurance.
Radiological images were initially reviewed as transmission x-ray films,and, during the past 30 years, as cross-sectional images with the advent ofcomputed tomography (CT) and magnetic resonance (MR) imaging. During
22CHAPTER
DRE22 11/16/2005 9:59 AM Page 447

the first century of radiology (1896 to 1996), all these images were read pri-marily in the same paradigm, that is, viewed on films printed with a fixedpreselected window and level setting and displayed before a lighting sourcesuch as a light box. Thus, the image review process for CT and MR imagingfor the radiologist was similar in its workflow to that for x-ray films. Pri-marily during the past decade, PACS softcopy reading has replaced film atmany institutions. While these images can be interactively adjusted forwindow/level, zoom, and so forth, PACS softcopy reading, as with filmreading, generally is limited to viewing the transmission or cross-sectionalimages in their fixed orientations as provided by the original scan. Recentimprovements in computing power, networking speeds, and image standardsfor digital image communications (Digital Imaging and Communications inMedicine [DICOM]) have allowed medical images to be transferred amongmodalities, image archives, and vendor computer-imaging platforms rela-tively seamlessly and quickly. These advances, combined with a dramaticimprovement in the speed, usability, and affordability of 3-D workstationhardware and software, make it feasible to apply computer image-processing techniques for 3-D imaging and computer-aided diagnosis (CAD)within the routine clinical workflow of a PACS environment. This mayinvolve image post-processing on specialized 3-D imaging workstations nowavailable from a variety of vendors, or 3-D imaging techniques may be inte-grated and available directly through the PACS workstations themselves.
Three-dimensional medical imaging has revolutionized both radiolog-ical diagnosis and surgical planning. Three-dimensional reconstructionsprovide lifelike views that can quickly summarize the relationship amonganatomic structures to facilitate accurate diagnosis or to identify the optimaltreatment plan before the patient is in the operating room (OR). The ben-efits include decreased exploratory time in the OR, less damage to healthytissues, and a lower risk of complications for the patient, all of which con-tribute to reduced surgical morbidity. Increased diagnostic sensitivity acrossall specialties and the likelihood of shorter OR time per procedure contributeto reduce costs. Thus, the quality of care is greatly enhanced, often with adecrease in cost compared to alternative procedures such as catheter angiog-raphy. For example, prior to the establishment of the Massachusetts GeneralHospital (MGH) 3D Imaging Service in February 1999, the standard pro-tocol at MGH and other institutions for assessing laparoscopic living renaldonor candidates involved a catheter angiogram to assess the renal vascula-ture (number, location, and relationships among renal arteries and veins) plusan intravenous pyelogram (IVP) to assess the configuration of the uretersand renal collecting system. These procedures involved exposing the patient(in this case a healthy renal donor candidate) to a significant health risk
PACS: A Guide to the Digi tal Revolut ion448
DRE22 11/16/2005 9:59 AM Page 448
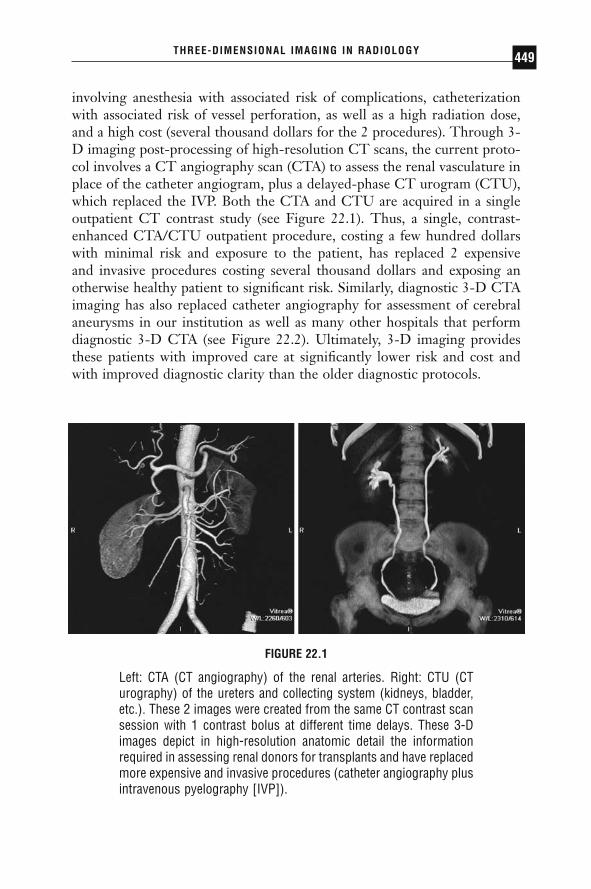
involving anesthesia with associated risk of complications, catheterizationwith associated risk of vessel perforation, as well as a high radiation dose,and a high cost (several thousand dollars for the 2 procedures). Through 3-D imaging post-processing of high-resolution CT scans, the current proto-col involves a CT angiography scan (CTA) to assess the renal vasculature inplace of the catheter angiogram, plus a delayed-phase CT urogram (CTU),which replaced the IVP. Both the CTA and CTU are acquired in a singleoutpatient CT contrast study (see Figure 22.1). Thus, a single, contrast-enhanced CTA/CTU outpatient procedure, costing a few hundred dollarswith minimal risk and exposure to the patient, has replaced 2 expensive and invasive procedures costing several thousand dollars and exposing anotherwise healthy patient to significant risk. Similarly, diagnostic 3-D CTAimaging has also replaced catheter angiography for assessment of cerebralaneurysms in our institution as well as many other hospitals that performdiagnostic 3-D CTA (see Figure 22.2). Ultimately, 3-D imaging providesthese patients with improved care at significantly lower risk and cost andwith improved diagnostic clarity than the older diagnostic protocols.
THREE-DIMENSIONAL IMAGING IN RADIOLOGY 449
FIGURE 22.1
Left: CTA (CT angiography) of the renal arteries. Right: CTU (CTurography) of the ureters and collecting system (kidneys, bladder,etc.). These 2 images were created from the same CT contrast scansession with 1 contrast bolus at different time delays. These 3-Dimages depict in high-resolution anatomic detail the informationrequired in assessing renal donors for transplants and have replacedmore expensive and invasive procedures (catheter angiography plusintravenous pyelography [IVP]).
DRE22 11/16/2005 9:59 AM Page 449

Multidetector CT (MDCT) has opened new possibilities and demandfor 3-D imaging. Rapid acquisition using thin slices and improved render-ing algorithms facilitate exquisite 3-D images and reformats. The pace ofprogress is being hastened by rapid developments in MDCT technologywith availability of 4-, 8-, 16-, 32, and 64-slice scanners and more recentlyvolume CT. From a practical standpoint, developments in MDCT scanningallow multiple thin slices to be acquired with increased z-axis coverageresulting in an extraordinary increase in the quantity of acquired data. Inparallel with the developments in MDCT, MR imaging has also advancedsuch that MR studies often involve larger numbers of images, with thinnerslices, scanned with multiple series of varying scan sequences and scan ori-entations, all of which contribute to increased image review workload to the
PACS: A Guide to the Digi tal Revolut ion450
FIGURE 22.2
CTA showing a right middle cerebral artery aneurysm. The right orbitand skull base have been digitally segmented out from the image toallow a view of the aneurysm and feeding artery. CTA can replacecatheter angiography for assessing cerebral aneurysms and provideclear views of vascular geometry to allow critical treatment planningdecisions.
DRE22 11/16/2005 9:59 AM Page 450

radiologist. Review of large numbers of images from modern MDCT andMR scanners, often hundreds or even thousands of slices per study, posessignificant challenges to radiologists’ efficiency and may simply be imprac-tical for most radiology departments. Having 3-D capability available fordiagnosis and surgical planning allows the radiologists and referring physi-cians to first get a summary view of the entire anatomy in a few conciseanatomically clear 3-D views and then refer back to the original two-dimensional (2-D) data for comparison and confirmation. Thus, 3-D recon-struction is more frequently becoming a valuable technique to summarize ina concise and clear way the overwhelming number of slices produced bymodern CT and MR scanners.
CLINICAL THREE-DIMENSIONAL IMAGING SERVICES
THREE-DIMENSIONAL IMAGING TECHNIQUES ANDCLINICAL APPLICATIONS
The variety of tools and techniques comprised by 3-D imaging may involvea single image-processing operation or a combination of image segmenta-tion, filtering, visualization, and feature-extraction algorithms to extract the clinical information of interest from the scan. There are many resourcesavailable for review of image-processing techniques. Computed tomographyand MR collect a series of 2-D slices through the region of the body understudy. These 2-D slices can be “stacked” and combined into a single 3-Dvolume of data. However, this requires relatively thin slice acquisition forhigh-quality 3-D imaging. The thinner the slices and the closer to isotropicvoxel dimensions, the better the resolution of the reformatted images. Forexample, most 3-D protocols involve 0.5- to 3.0-mm thick slice data, whilethicker slices, such as 5mm, produce blurred reconstructions and reformatswith a stepping artifact orthogonal to the original acquisition plane.
To create post-processed images from the original CT or MR sourceimages, it is necessary to load the slice data into a computer that has 3-Dimage post-processing software. This may involve loading the scan onto aseparate 3-D imaging workstation, running a 3-D software program inte-grated on the PACS workstation, or loading a client-server–based 3-D soft-ware program remotely through a thin-client or Web-based applet. Thereare several vendors providing various solutions such as these to enableadvanced 3-D image post-processing of CT or MR source 2-D datasets.
THREE-DIMENSIONAL IMAGING IN RADIOLOGY 451
DRE22 11/16/2005 9:59 AM Page 451

Once the data are imported into a 3-D imaging system (workstation,PACS plug-in, client-server, etc.), the 3-D volumetric dataset can be resam-pled in different planes or visualized through various volumetric viewingtechniques. The simplest type of 3-D operation is multiplanar reconstruc-tion (MPR), in which the 3 primary orthogonal views are produced. If theseviews are sampled with a slice thickness greater than the original slice thick-ness (for example, with volume-rendered orthogonal slabs), this becomesmultiplanar volume reconstruction (MPVR). The reconstructed planes canalso be rotated and images created in any oblique plane or produced in acurved reformat to create a reconstructed view that follows a curved struc-ture such as a blood vessel, the spinal cord, or the inferior alveolar nervecanal.
The next level of volumetric visualization involves maximum-intensityprojection (MIP), average-intensity projection (AveIP), or minimum-intensity projection (MinIP), which display the maximum, average, orminimum value through the volume along each ray drawn from a particularviewpoint. These techniques are good for instances where the interpretingphysician does not want the image blocked at the surface, for example, invisualizing vascular stenosis or craniosynostoses. However, MIP views do notprovide good depth cues since the brightest voxel can be at any distance fromthe viewpoint. Therefore, MIP images are often created in a rotational batchseries to provide parallax depth cues through rotational orientation changes.Volume and surface rendering provide an anatomical model that allowsselected tissues to be either displayed or stripped away to reveal the struc-tures of interest. Surface rendering involves segmenting the image into abinary mask from which a 3-D surface is created. The segmentation caninvolve various techniques to select the surface to be rendered, such as settinga threshold and/or manually carving portions out from the desired anatomyof interest to be viewed. Because the surface is created based on a binarymask, no voxel intensity information is appreciable in the surface renderingsince all surface points are displayed uniformly, with differences resultingonly from lighting and depth cues. Volume rendering involves applicationof opacity maps based on the image histogram values, as well as differentgrayscale and/or color lookup maps, such that a voxel may be displayed witha variable opacity as well as variable intensity/color depending on the voxelvalues that are displayed in a continuous range. Surface rendering andvolume rendering are useful in viewing bony anatomy, organ surfaces suchas brain gyral/sulcal patterns, as well as for visualizing blood vessels for plan-ning treatment approaches for aneurysms. Volume rendering also allowsvariable viewing of different tissues such that multiple components of the
PACS: A Guide to the Digi tal Revolut ion452
DRE22 11/16/2005 9:59 AM Page 452
image may be represented in different brightness, color, or relative trans-parency, such as bone versus tendons or blood vessels.
The specific type of image reconstruction depends on the anatomy, thepurpose (diagnosis or surgical planning), and the customer needs (radiolo-gist or surgeon). In general, diagnostic radiologists often prefer MIP viewsrather than volume- or surface-rendered views because image data areretained and can be retrieved by window/level adjustments and rotation,while the surface- and volume-rendered views make some objects transpar-ent in a user-dependent manner. Maximum-intensity projection views havethe shortcoming, however, that objects within a high-signal object may beobstructed from view, since only the brightest pixel along a ray is displayed.For example, a contrast-enhanced lesion with a necrotic nonenhancing corewill have only the surface enhancement displayed since the necrotic core willnot be visible through the surrounding enhancement in the MIP view.Average-intensity projection views may allow a more transparent view insuch cases and can be used as a simulation of transmission x-ray imagingviews. Surgeons, however, often prefer surface-rendered views because theyare more anatomically realistic for surgical planning purposes. However,these views may create a threshold artifact that may give a false impressionof abnormality, which is why radiologists often feel more comfortable withMIP or AveIP views rather than surface- or volume-rendered views whenlooking at vascular structures, for example.
THREE-DIMENSIONAL IMAGING IN A PACSENVIRONMENT: MASSACHUSETTS GENERALHOSPITAL EXAMPLE
Currently, the 3D Imaging Service at MGH processes an average of 100exams per day, which represents approximately 10 percent of the hospital’sCT scan volume, plus about 20 percent of the MR and ultrasound (US)volume. The 3D Imaging Service processes exams for vascular, orthopedic,chest, breast MR, gastrointestinal/genitourinary, emergency, and pediatricexams. However, about half of the 3-D exams are neuroradiology studies of the brain, head, and neck. Many neuroradiology exams involve studies ofthe carotid and/or cerebral vasculature with CT or MR angiography (CTA; MRA). In addition, a variety of neurology, neurosurgery, and oral-maxillofacial exams are reconstructed with 3-D imaging, including brainsurface renderings for neurosurgical planning, stroke and aneurysm imaging,brain tumor volumetric measurements, as well as imaging of facial malfor-
THREE-DIMENSIONAL IMAGING IN RADIOLOGY 453
DRE22 11/16/2005 9:59 AM Page 453
mations, craniosynostoses, complex facial fractures/trauma, and surgicalplanning for dental implants, extractions, and nerve damage evaluations. The3-D Imaging Service also processes vascular studies of the body, includingscans of the aorta, renal, hepatic, and/or pancreatic vasculature and periph-eral runoff CTA and MRA exams. High-quality, consistent, reliable 3-Dreconstructions are essential to diagnosis and treatment planning of vascu-lar imaging. For example, aortic aneurysm, liver resection, and living liverand renal donor assessments are greatly aided by presurgical 3-D-imagingvascular evaluation and treatment planning on computer rather than explo-ration in the OR. Three-dimensional imaging is also effective in assessingpancreatic cancer and associated vascular involvement and for virtualendoscopy, such as virtual colonography for assessing colon polyps.
At MGH, we are able to manage this high volume of clinical 3-D imageprocessing as a direct result of the successful implementation of a PACSsystem with a high-speed image network (1000base T or gigabit). When the3-D Imaging Service was established in February 1999, the MGH radiologydepartment was already nearly entirely filmless. All CT and MR images wereavailable both on PACS for radiologists and on a hospital-wide enterpriseimage server, via a Web-browser plug-in applet, for all referring physicians.This plug-in applet was also integrated with the electronic medical record(EMR) such that all images are available online and are a mouse click awayfrom the patient medical history, clinical test results, and clinical reports.
The successful implementation of the 3-D Imaging Service requiredthat the clinical workflow, protocols, billing, and staffing issues were estab-lished in a way that would enable routing clinical 3-D imaging with rapidturnaround, and consistent, high-quality, clinically relevant post-processedimages. The 3-D Imaging Service has worked closely on an ongoing basiswith hospital billing and compliance, coding, and PACS to establish work-flow, and with the radiologists, referring clinicians, and CT and MR scandepartments to establish clinical 3-D and scan protocols optimized for clin-ically useful 3-D imaging.
Within the PACS environment at MGH, the routine 3-D imagerouting begins with the original 2-D scan being completed at the CT or MRscanner. The exam descriptor is then appended with a 3-D modifier (“/3D”)either by the scheduling department or by the scan technologist to indicatethat the study requires 3-D post-processing. The scan technologist sends thescan to a PACS relay, where the scan header information is checked againstthe patient information in the RIS and corrected for errors if necessary. Oncethe scan information is validated at the relay, the original 2-D scan is trans-mitted to a PACS gateway, where it is available for review from PACS terminals throughout the radiology department. The original scan is also
PACS: A Guide to the Digi tal Revolut ion454
DRE22 11/16/2005 9:59 AM Page 454

transmitted to the enterprise image server, where the original 2-D scan is made available for review on PCs throughout the hospital via a Webbrowser–based applet, as well as integrated with the EMR (see Figure 22.3A).
The 3-D exam modifier (“/3D”) informs the PACS routing table toautomatically send the scan to the 3-D lab and also sends a message to the3-D lab pager with the study identifier to indicate that the scan is pendingpost-processing. If the “/3D” modifier is inadvertently left off the examdescriptor, the 3-D technologists can locate the study through a programthat searches the RIS system for exam descriptors that involve 3-D imagingas standard protocol or by manual searching throughout the day of the RISexam lists. Once a scan has been identified for 3-D post-processing by oneof these methods, the 3-D workflow next involves downloading the original
THREE-DIMENSIONAL IMAGING IN RADIOLOGY 455
FIGURE 22.3A
Workflow of standard CT or MR 2-D imaging in a PACS environ-ment. The original scan is transmitted from a CT or MR scanner toa PACS gateway, where it may be forwarded to an enterprise-wideimage web server. The images are viewable from the radiologist’sPACS review station, and also from the physician’s desktop PC viaweb-browser DICOM viewer.
DRE22 11/16/2005 9:59 AM Page 455

2-D scan from the PACS archive and loading the 3-D volume image datainto 3-D imaging software. Once the 3-D images have been post-processed,a summary series of 3-D images is produced, and this series is sent back tothe PACS gateway, where the original 2-D study resides. The 3-D technol-ogist completes the 3-D exam code appropriate for the study in the RIS.This 3-D series has a new unique identifier (UID), with the same studynumber (“accession number”), such that the PACS routing recognizes thatthis is a new “series” within the same “study.” The PACS appends the newseries to the original study, and also forwards the new series to the enter-
PACS: A Guide to the Digi tal Revolut ion456
FIGURE 22.3B
Three-dimensional imaging workflow diagram involves the samepathways for the original 2-D CT or MR scan. The original 2-D scanis also routed to a 3-D imaging workstation or software where the2-D study is converted into a 3-D dataset and a series of 3-D imagesare created and sent back to the PACS gateway and forwarded tothe enterprise-wide image Web server. The 3-D images become anew series attached to the original study and are viewable with theoriginal 2-D images at the radiologist’s PACS review station and atthe physician’s desktop PC via Web browser DICOM viewer.
DRE22 11/16/2005 9:59 AM Page 456

prise image server so that the new 3-D series is available both on the PACSand at the physicians’ desktop computer together with the original 2-D scan(see Figure 22.3B). The 3-D processing may take 20 minutes to an hour, andeither it is available at the time of the preliminary clinical read, or the 3-Dimages are reviewed afterward and comments are added to the report as anaddendum associated with the primary exam report. It is necessary to reportthat the 3-D images were reviewed and indicate any additional findings inorder to bill for the 3-D exam code when appropriate.
THREE-DIMENSIONAL IMAGING SERVICE—STAFFING ISSUES
There are 2 major hurdles to developing a consistent, reliable, and cost-effective 3-D imaging service at a facility: (1) determining who will performthe 3-D processing (i.e., appropriate staffing) and (2) capturing sufficientrevenue to cover the costs of the service, (i.e., reimbursement). One consid-eration in determining the cost-effectiveness of the service would be the costof not having a dedicated 3-D imaging service. For example, if a radiologistwere to spend a few hours per day performing 3-D processing, he or shewould be diverted from reading additional clinical cases, which would havegenerated added revenue, and the facility might need to hire additional radi-ologists or moonlighters to read exams. Likewise, if CT or MR technicianswere to perform 3-D imaging between scans, it would slow down the scannerthroughput, also decreasing revenue. A primary objective in establishing a3-D imaging service should be to allow the technologists and radiologists tofocus on their primary revenue-generation modes for the practice and hos-pital, namely scanning the patient and acquiring the images, and interpret-ing the exams, respectively. Meanwhile, a dedicated staff for 3-D imagingservices can provide an efficient and consistently processed set of 3-D views.By having a dedicated 3-D technologist processing exams, it is also possibleto create greater uniformity and consistency across exams, as opposed tohaving 3-D images produced by a variety of radiologists or technologists whoare not trained to produce a clinically determined set of 3-D imaging pro-tocols. However, smaller facilities may not have the resources or clinicalvolume to support a 3-D technologist, and thus, 3-D may be performed ona more ad hoc basis by a radiologist or technologist, may be outsourced toan outside 3-D imaging service, or might not be available or performed atall.
Many complex 3-D exams, CTA, for example, require 45 to 60 minutesor more to process all the associated views, while other, less-complicated
THREE-DIMENSIONAL IMAGING IN RADIOLOGY 457
DRE22 11/16/2005 9:59 AM Page 457
3-D exams may take only 15 to 30 minutes each to process. If the clinicalvolume at a facility is sufficient, it would be cost effective to have one ormore dedicated 3-D technologists process these exams (or alternatively, con-sider outsourcing the 3-D image processing to a centralized 3-D service). Adedicated 3-D technologist should be hired as an experienced, trained, andcertified CT or MR technologist who can work closely with the radiologistsand referring physicians to create 3-D protocols that generate the mostuseful views for each type of exam. The dedicated 3-D technologist is akinto a computer graphics medical artist who can take the cross-sectional scansand craft them into a beautiful set of concise, anatomically detailed 3-Dviews. To accomplish this, the 3-D technologist must understand the cross-sectional anatomy and pathology in depth, as well as scan artifacts, and mustlearn to operate complex computer software. This is a very complex set ofskills and experience, and thus the training period for a dedicated 3-D tech-nologist ranges from 3 to 6 months at our institution.
Many hospitals, including MGH, have established a 3-D imagingservice that has become an integral part of the clinical workflow for radiol-ogists and referring clinicians. The 3-D Imaging Service at MGH has beenin operation since February 1999, with a staff that has grown to 6 full-time3-D technologists and 2 image-analysis specialists, a billing coordinator/administrator, a technical director, a systems administrator, and a director.The 3-D Imaging Service at MGH is supported entirely by revenue gener-ated from these services.
WHEN AND HOW TO CHARGE FOR THREE-DIMENSIONAL IMAGING
BILLING COMPLIANCE
The second hurdle in justifying a 3-D imaging service is to determine howto capture revenue to which the facility is entitled in order to support the 3-D imaging staff and equipment cost and to demonstrate cost-effectiveness.Carrier reimbursement from Medicare and other health insurers is the mainsource of revenue to support 3-D imaging, but it is critical that services only bebilled to Medicare and other payers when it is appropriate to do so. In all circum-stances, the 3-D reconstructions must be performed on software that has therequired FDA clearances when billing Medicare.
At MGH, Medicare coverage guidelines are used as the benchmark forall carriers. Because payer mix varies widely among hospitals, it is important
PACS: A Guide to the Digi tal Revolut ion458
DRE22 11/16/2005 9:59 AM Page 458

to confirm the similarity between commercial/private carriers in a specificgeographical region with Medicare. This discussion will focus on Medicarereimbursement as the revenue framework for 3-D imaging.
Medicare reimbursement is based on the medical necessity of theservice and procedural code definitions. For example, medical necessity ofCTA or MRA can be supported by the need to image the vasculature. Thisshould be reflected in the radiology report by documenting the patient’shistory and/or indications for the exam as specified by the referral or patient’smedical record. Appropriate codes must be used to reflect the services provided.
With the exception of CTA, MRA, and CT colonography, in which the3-D post-processing is considered part of the primary exam and not billedseparately (see following sections for more detail on billing codes), 3-Dimaging is a separately reportable and billable service with CT, MR, or USprocedural codes (3-D add-on CPT code 76375).* However, for reimburse-ment, Medicare requires that both the initial exam and the 3-D imaging aremedically necessary.
Medical necessity can be supported by the radiologist’s documentationof the patient history or indications for the exam. In addition, the medicalnecessity of 3-D imaging must be supported in 1 of 3 ways. The first scenariois a direct order from the requesting physician for 3-D imaging in addition tothe primary exam request (e.g., a surgeon requests a CT or MR exam with 3-D reconstruction for surgical planning purposes). The second category is thepresence of positive findings by the radiologist during an ordered exam requir-ing additional views for clarification or confirmation of diagnosis; both thepositive findings and the reason for the additional view(s) must appear in the radiology report to support the medical necessity of the 3-D imaging. Thethird approach involves carefully monitored radiology departmental policies,procedures, and protocols. The radiologist writes a protocol policy for anexam to be associated with 3-D imaging that presents medical necessity, rea-sonableness, and standard of care as supported in the medical literature. Thepolicy is then reviewed for medical necessity, coding accuracy, and billingcompliance by the chief of radiology, billing and coding offices (professionaland technical), compliance offices (professional and intermediary), and radi-ology administration. When the policy is approved, a notice is sent to all refer-ring physicians to notify them of the medical necessity and rationale forperforming 3-D in association with a particular exam. The referring physi-cians are also informed that a 3-D charge will be billed to the beneficiary in
THREE-DIMENSIONAL IMAGING IN RADIOLOGY 459
* CPT® is a registered trademark of the American Medical Association.
DRE22 11/16/2005 9:59 AM Page 459

addition to the charge for the primary requested exam. These policies arerestricted to specific diagnostic situations in which omitting 3-D imagingwould lower diagnostic confidence below practice stadards and compromisepatient care. The notice also needs to provide the requesting physician withdirections on who to contact with questions or concerns regarding the medicalnecessity of the 3-D exam. Once the new policy notice has been communi-cated to requesting physicians, the policy is made available on request in thedepartment of radiology and placed in the radiology policies and protocolmanual. To monitor ongoing billing compliance, this type of policy is subjectto rigorous interdepartmental review on a yearly basis.
REIMBURSEMENT FOR THREE-DIMENSIONAL IMAGING
For 3-D reconstruction (other than CTA, MRA, and CT colonography asdiscussed below), the image post-processing is billed as an add-on to theprimary CT, MR, or US exam under CPT code 76375, “coronal, sagittal,multiplanar, oblique, 3-dimensional and/or holographic reconstruction ofcomputerized tomography, magnetic resonance imaging, or other tomo-graphic modality.” This CPT code was originally created for 2-D reformat-ting using “Coronal, Sagittal, Multiplanar and/or oblique Reconstruction”of CT scans, generally performed on the scanner console at the time of thescan. Then, in 1988, 3-D was added to the code description, and in 1998,the description was expanded to include other tomographic modalities suchas MR imaging and 3-D US.
Insurance reimbursement is an important factor in developing a self-supporting clinical 3-D imaging service. For Medicare outpatients, depend-ing on whether the technical costs (3-D staff, 3-D workstations, etc.) arefunded by the radiology practice or through the hospital, the technical com-ponent of the service would either be billed under the Medicare HospitalOutpatient Prospective Payment System (HOPPS) ambulatory paymentclassification (APC) for hospital billing, or under the Medicare Physician FeeSchedule (MPFS) under the relative value unit (RVU) system for nonhospitalbilling. The technical component for hospital-based billing under HOPPSfor CPT 76375 is approximately $92 (2004 national average) and for free-standing clinics or where the 3-D staff and equipment is funded by the pro-fessional organization, billing under the MPFS is about $160. (At MGH, the3-D Imaging Service was established and funded through the physicians’organization, with services billed under MPFS, not hospital billing.) Theprofessional component (“-26” billing) is minimal (~$9).
PACS: A Guide to the Digi tal Revolut ion460
DRE22 11/16/2005 9:59 AM Page 460
There is a separate reimbursement code (G0288) for aortic aneurysmstent planning and surveillance. This code was originally instituted in July2001 specific to a particular centralized service vendor’s analysis system. In2003, the code was revised to be more general. This code has a technicalreimbursement only for hospital billing under HOPPS (no professionalcomponent), with national average of $267 in 2005, and a technical reim-bursement only for non-hospital billing under MPFS (TC only, no profes-sional component), of $425 national average reimbursement.
REIMBURSEMENT CHANGES: COMPUTEDTOMOGRAPHY ANGIOGRAPHY, MAGNETICRESONANCE ANGIOGRAPHY, AND COMPUTEDTOMOGRAPHY COLONOGRAPHY
The Medicare payment for 3-D images that are created as part of a CTA,MRA, or CT colonography, which do not allow separate billing and paymentfor the add-on code (CPT 76375), has been the source of financial concern.A detailed description of the problems associated with CTA and MRA reim-bursements appears in a recent article. To summarize here, prior to 2001,appropriate billing for CTA included 2 separate CPT codes: CT for the specific anatomy involved, plus the 3-D reconstruction add-on code, CPT76375. Thus, 3-D reconstructions for CTA, as well as for MRA, could beappropriately billed separately, as with other reconstructions, as an add-onto the primary exam. However, effective January 2001, the American MedicalAssociation’s (AMA) CPT editorial panel created new codes specifically forCTA indicating that 3-D reconstructions must be performed or these examsare not considered CTA. The code descriptor for CTA includes the phrase“without contrast material(s), followed by contrast material(s) and furthersections, including image post-processing.” Thus, the add-on CPT code for3-D reconstruction may not be billed with CTA or MRA as of 2001.
Unfortunately, when the Centers for Medicare and Medicaid Services(CMS) established payment rates for the new CTA codes, it did not recog-nize the additional facility costs of performing CTA as compared with ordinary CT (i.e., the additional 3-D imaging reconstruction in a CTA).Therefore, CMS assigned CTA the same payment rate as the lesser CTservice, effectively eliminating all reimbursement for 3-D post-processing ofCTA and MRA; of course, the facility had to bear the costs of the additionalequipment and staff time to create the 3-D post-processed images that dis-tinguished CTA from CT.
THREE-DIMENSIONAL IMAGING IN RADIOLOGY 461
DRE22 11/16/2005 9:59 AM Page 461

This change in coding for CTA and MRA has had a significant impacton the cost justification for 3-D imaging services. CTA and MRA accountfor half of all 3-D exams processed at MGH. Prior to the coding change in2001, the added $160 reimbursement for 3-D reconstructions under CPT76375 supported the costs of 3-D workstations, technologist time, and extraimages for the 3-D Imaging Service, but since 2001, the add-on 3-D codecan no longer be billed separately for these exams. The 3-D Imaging Serviceat MGH negotiated with the hospital finance department in 2001 to developa reimbursement-sharing model that allows for the 3-D Imaging Service toobtain a portion of the total hospital payments for the CTA and MRA serv-ices to support the 3-D processing costs of providing this service.
During the past 2 years, the 3-D Imaging Service at MGH, togetherwith the American College of Radiology, has worked to successfully petitionCMS to allow for a differential payment for CTA by creating a new CTAreimbursement APC (0662) separate from the CT without and with contrastAPC 0333, effective 2003. However, to set reimbursements, CMS looks athospital charges, adjusted by the hospital-specific cost-to-charge ratio, todetermine an “imputed cost.” It is these costs that are the basis for each APCpayment rate.
Unfortunately, CMS uses Medicare claims data to determine thepayment rate for the 2 separate APC groups, and these data, based on 2001and 2002 Medicare claims, were not a valid reflection of differential hospi-tal resource use. An analysis of the 2001 and 2002 claims data found that lessthan half of all hospitals that submitted CTA claims charged more for CTAthan CT—clearly indicating that claims were not reflective of the additionalresources needed. Since a CTA involves all the costs of CT plus the addi-tional 3-D post-processing, CTA should always be a higher-cost procedurerelative to CT, and thus, the claims data was not possibly accurate if CTAwas being charged less than CT at most hospitals. This may have partlyresulted from erroneous and conflicting coding advice in 2001 from theAMA on whether the 3-D charge (CPT code 76375) could be billed withCTA. Thus, despite the separation of CT and CTA into 2 APC groups toallow for differential payment, the net differential was only $5 in 2003, andonly $24 in the 2004 proposed rule.
Considering that Medicare rates are based on hospital charges, adjustedby a cost-to-charge ratio, it is imperative that all hospitals consider thecharges for the new CTA codes carefully. Advocates for CTA urge hospitalradiology administrators to consult with their chargemaster managers andrevise the CTA charges at their hospital so that CTA charges reflect the CTplus the 3-D reconstruction costs. If hospitals that are charging erroneously(charging less for CTA than for CT) will make this adjustment to reflect the
PACS: A Guide to the Digi tal Revolut ion462
DRE22 11/16/2005 9:59 AM Page 462

added costs involved with CTA versus CT, then the claims data will be morevalid, and, over the next few years, the differential for CTA reimbursementswill rise accordingly. Otherwise, it will be more challenging for new 3-D labsto justify their added costs of staff and equipment to the hospital, and forhospitals to justify the lost revenue of shifting from more invasive proce-dures such as catheter angiography to less expensive and less invasive 3-Dimaging procedures such as CTA and MRA, which translates into betterpatient care.
Similarly, in July 2004, new codes were created for screening (0066T)and diagnostic (0067T) CT colonography, which include the 3-D post-processing component. Previously, diagnostic CT colonography was prop-erly coded and billed as a CT abdomen and pelvis scan plus 3-D recon-struction (76375) add-on code. Currently, there is no reimbursement valueassociated with these codes, and for the most part, there are no paymentsfrom Medicare or other insurers. We encourage hospitals performing CTcolonography to raise this issue with their local Medicare Part B carriers totry to create reimbursement policies for these exams.
CONCLUSION
Three-dimensional imaging in radiology has made major inroads in the pastdecade in routine clinical practice. These images both are visually compellingand have clinical impact. However, there is a cost and a learning curveinvolved in producing optimal clinical 3-D imaging. The benefits of imple-menting 3-D imaging services can include improved confidence in diagno-sis and treatment/surgical planning, reduced cost and invasiveness ofprocedures, presurgical planning rather than exploratory surgery, and ulti-mately less risk to the patient and improved patient care.
◗ REFERENCES
American Medical Association. CPT Assistant. April 1996;6(4):11.American Medical Association. CPT Assistant. July 2001;11(7):3.American Medical Association. CPT 2001 Coding Symposium—Radiology, Com-
monly Asked Questions, 2001.Berland LL, Smith JK. Multidetector-array CT: once again, technology creates new
opportunities. Radiology. 1998;209:327–239.Bogetti JD, Herts BR, Sands MJ, Carroll JF, Vogt DP, Henderson JM. Accuracy and
utility of 3-dimensional computed tomography in evaluating donors for adultliving related liver transplants. Liver Transpl. 2001;7:687–692.
THREE-DIMENSIONAL IMAGING IN RADIOLOGY 463
DRE22 11/16/2005 9:59 AM Page 463

Center for Medicare and Medicaid Services. CMS Program Manuals—MedicareCarrier (Pub 14), Part 3—Claims Process. October 25, 2002;Transmittal 1776:1.
Center for Medicare and Medicaid Services. CMS Program Manuals—MedicareCarrier (Pub 14), Part 3—Claims Process: 15021 Ordering of Diagnostic Tests.October 25, 2002;Transmittal 1776:1–5.
Cline HE, Lorensen WE, Ludke S, Crawford CR, Teeter BC. Two algorithms for thethree-dimensional reconstruction of tomograms. Med Phys. 1988;15:320–327.
Damadian R. Tumor detection by nuclear magnetic resonance. Science.1971;171:1151–1153.
Drebin RA, Carpenter L, Hanrahan P. Volume rendering. Comput Graph. 1988;22:65–74.
Fenlon HM, Nunes DP, Schroy PC, Barish MA, Clarke PD, Ferrucci JT. A com-parison of virtual and conventional colonoscopy for the detection of colorectalpolyps. N Engl J Med. 1999;341:1496–1503.
Fishman EK, Horton KM. Imaging pancreatic cancer: the role of multidetector CTwith three-dimensional CT angiography. Pancreatology. 2001;1:610–624.
Glasser OWC. Roentgen and the discovery of the Roentgen rays. AJR Am JRoentgenol. 1995;165:1033–1040.
Gonzalez RC, Woods RE. Digital Image Processing. Boston: Addison-Wesley; 2002.Harris GJ, Kassing P, Linton P, Levy-Zuckerman P. Economics of the third dimen-
sion. Decis Imaging Econ. November 2003:32–38.Herfarth C, Lamade W, Fischer L, et al. The effect of virtual reality and training
on liver operation planning. Swiss Surg. 2002;8:67–73.Hounsfield GN. Computerized transverse axial scanning (tomography). 1. Descrip-
tion of system. Br J Radiol. 1973;46:1016–1022.Hu H, He HD, Foley WD, Fox SH. Four multidetector-row helical CT: image
quality and volume coverage speed. Radiology. 2000;215:55–62.Kaufman A, Cohen D, Yagel R. Volume graphics. Computer. 1993;26:51–64.Kawamoto S, Montgomery RA, Lawler LP, Horton KM, Fishman EK. Multidetec-
tor CT angiography for preoperative evaluation of living laparoscopic kidneydonors. AJR Am J Roentgenol. 2003;180:1633–1638.
Klingenbeck-Regn K, Schaller S, Flohr T, Ohnesorge B, Kopp AF, Baum U. Sub-second multi-slice computed tomography: basics and applications. Eur J Radiol.1999;31:110–124.
Lauterbur PC. Cancer detection by nuclear magnetic resonance zeugmatographicimaging. Cancer. 1986;57:1899–1904.
Levoy M. Volume rendering. IEEE Comp Graph Appl. 1990;10:33–40.Lorenson W, Cline H. A high resolution 3-D surface construction algorithm. Comp
Graph. 1982;21:163–169.Mansfield P, Morris PG, Ordidge R, Coupland RE, Bishop HM, Blamey RW. Car-
cinoma of the breast imaged by nuclear magnetic resonance (NMR). Br J Radiol.1979;52:242–243.
PACS: A Guide to the Digi tal Revolut ion464
DRE22 11/16/2005 9:59 AM Page 464

Robb RA. Biomedical Imaging, Visualization, and Analysis. New York: Wiley-Liss;1999.
Rubin GD. 3-D imaging with MDCT. Eur J Radiol. 2003;45(suppl 1):S37–S41.Rubin GD, Beaulieu CF, Argiro V, et al. Perspective volume rendering of CT and
MR images: applications for endoscopic imaging. Radiology. 1996;199:321–330.Russ JC. The Image Processing Handbook. Boca Raton, FL: CRC Press, 1992:445.Sonka M, Hlavac V, Boyle R. Image Processing, Analysis and Machine Vision. Pacific
Grove, CA: Brooks/Cole Publishing; 1999:57.Suri JS, Setarehdan SK, Singh S. Advanced Algorithmic Approaches to Medical Image
Segmentation : State-of-the-Art Applications in Cardiology, Neurology, Mammogra-phy and Pathology. New York: Springer-Verlag; 2002:660.
ter Haar Romeny BM, Zuiderveld KJ, Van Waes PF, et al. Advances in three-dimensional diagnostic radiology. J Anat. 1998;193:363–371.
Tillich M, Hill, Desbrun M, Schrodder P, et al. Prediction of aortoiliac stent-graftlength: comparison of measurement methods. Radiology. 2001;220:475–483.
Wigmore SJ, Redhead DN, Yan XJ, et al. Virtual hepatic resection using three-dimensional reconstruction of helical computed tomography angioportograms.Ann Surg. 2001;233:221–226.
Wood Z, Desbrun M, Schroder P, et al. Semiregular mesh extraction from volumes.Proc Vis 2000. 2000:275–282.
THREE-DIMENSIONAL IMAGING IN RADIOLOGY 465
DRE22 11/16/2005 9:59 AM Page 465

VOICERECOGNITION
MICHAEL J. MARDINI • AMIT MEHTA
Perhaps no new technology introduced into radiology has evoked moredebate and raw emotion than the use of speech recognition technology
for radiology reporting. As adoption of the technology has increased, thecontroversy has increased, with arguments both for and against its overallvalue to a radiology service. Among those that use the technology, approxi-mately 20% strongly oppose it, 20% strongly favor it, and the remaining60% fall somewhere in between. Regardless of who is right, there is noarguing the fact that successfully adopting speech technology has a positiveeffect on many of the areas in which a radiology service is measured. Thereduced report turnaround time, decreased costs associated with producinga report, and overall decrease in confusion about report availability and distribution all support the adoption of this technology. One of the largestissues has been the question of the effect on radiologists’ productivity andworkload. Does it slow the radiologist down to unacceptable productionlevels, as some claim, or is it just a matter of changing some work habits toallow the user to maintain and ultimately improve productivity, as othersclaim? Real results from sites using this technology appear to support thelatter.
23CHAPTER
DRE23 11/16/2005 10:01 AM Page 467

The underlying cause for successful adoption of this technology seemsto be the belief that it is no longer enough just to interpret images and dictatefindings. Now that we have the technology to do so, it is necessary to takethe extra step to communicate all findings, not just critical ones, to cliniciansand patients efficiently. With increased competition for business and the avail-ability of images through Web distribution, it simply comes down to beingclinically relevant to patient care. If the report is unavailable but the imagesare, the clinician down the street may feel that he can view and interpretthem to his satisfaction and disregard the radiologist’s report entirely. Atwhat point do he start billing for the service?
HISTORY
The use of computers to recognize human speech has a long history withinmedicine. In the late 1980s, radiologists and other medical subspecialistsstarted to use expensive dedicated hardware systems that employed special-ized vocabulary to recognize reports dictated in a discrete speaking style.After several years of use, it was deemed that voice recognition technologywas not mature enough to handle the high-volume demand for the tran-scription requirements of most radiology practices. The late 1980s and early1990s saw limited usage and general nonacceptance of voice recognitiontechnology for commercial applications. However, despite the lack of wide-spread use, development and distribution continued. By 1994, speech recog-nition systems in American English running on computers with increasedprocessing power had progressed, and speech recognition engines had vastlyimproved. These developments led to accuracy rates that became acceptablefor commercial applications, especially medicine.
It became apparent once development began that no specialty wasbetter suited to voice recognition applications than radiology for the fol-lowing reasons:
◗ A strong need to reduce report turnaround time for improved serviceprovided operational motivation.
◗ Financial pressures and a shortage of qualified medical transcrip-tionists presented a strong financial motivation.
◗ A vocabulary that was limited and predictable provided the ability todevelop systems that were accurate enough for high-volume use.
◗ A defined number of stationary users provided an environment for asupportable application.
PACS: A Guide to the Digi tal Revolut ion468
DRE23 11/16/2005 10:01 AM Page 468

◗ High-volume, daily use created an opportunity for users to becomeproficient relatively quickly.
Currently, there are more than 900 radiology installations of various voicerecognition systems throughout the United States and continued interestthroughout the world. The technology has encountered both acceptance andrejection based on several factors. As the technology becomes more avail-able as an option on picture archiving and communication system (PACS)and radiology information system (RIS) workstations, the barriers to adop-tion continue to recede.
ACCEPTANCE AND CONTINUED INTEREST
Speech recognition software packages offer many advantages that promoteacceptance by radiologists. First, continuous speech recognition systemsrequire limited amounts of learning and adaptation compared to other tran-scription systems and methods. The systems are designed to conform topeople’s most natural way of communicating and essentially do not requirethe user to alter this method short of speaking more clearly. Second, the ability of the software package to integrate almost seamlessly into exist-ing radiology and hospital information workflows makes the transition easier.The biggest barriers are often resistance to change and fear of technology.As these are overcome, the benefits become more apparent and user acceptance increases. This, in turn, encourages developers to continuedevelopment.
Several factors drive interest in speech recognition. First, continueddevelopment coupled with increasing processing power lead to improvedaccuracy rates and the easier use of natural speech. Second, a shortage ofmedical transcriptionists is occurring in most medical markets. This forceshealthcare institutions and practice groups to seek alternative strategies tofoster growth and maintain services. Third, there is an immediate return oninvestment, with decreased operating costs and improved services. Fourth,when thoroughly analyzed, this technique does not require physicians todrastically change their practice in terms of transcription, a feature settingit far apart from competing technologies. Fifth, pressure to be clinically rel-evant by providing results quickly has increased dramatically as imagesbecome easily available through Web distribution. Finally, integration on thedesktop with PACS and RIS systems to provide seamless workflow andimproved reporting capabilities such as the creation of multimedia and struc-tured reports will further attract attention.
VOICE RECOGNITION 469
DRE23 11/16/2005 10:01 AM Page 469

RESISTANCE TO ADOPTION
Despite the bright future for this technology, several factors delay its wide-spread implementation. Physicians and people, in general, have an inherentresistance to change. As the next generation of medical practitioners whohave been trained on computer systems begin to practice, we will see achange in the dissemination of new technologies. Users who resist the tech-nology claim that they are forced to do more work by editing their ownreports. However, an analysis of the current dictation-to-transcriptionistmethod uncovers the same editing requirements, so why the complaints?The fact is that radiologists typically browse through a report returned fromtranscription 24 hours later. They may uncover glaring and obvious typo-graphical errors but have a slim chance of correcting errors involving contentbecause they may not remember what they said. For example, a user willmost likely miss a mistake of a transcriptionist typing “left” instead of “right”unless “left” was misspelled. In contrast, a report dictated and edited imme-diately using voice recognition usually receives a more careful review of theresulting text not simply because the software makes different types of mis-takes but also because the content is still at the forefront of the radiologist’smind. This is a very important difference and often overlooked when eval-uating this technology. Furthermore, when the time spent reviewing thetranscribed reports is added to the time spent initially dictating them, it isunclear whether the total is really any different that that spent with voicerecognition systems. Over the next few years, as the technology continuesto improve, workflow options increase through integration with RIS andPACS systems, and continued market pressures for improved service anddecreased costs drive need, this technology will become ubiquitous and aroutine part of a radiologist’s tools.
CURRENT OFFERINGS
There are a number of sources for this technology. The most common arecompanies that have built stand-alone applications that include the compo-nents and workflow options needed for radiology reporting. The most preva-lent of these in the market are Dictaphone’s PowerScribe and Agfa’s TalkTechnology TalkStation. These 2 products comprise over 90% of the systemsin use for radiology today. Both of these companies are undergoing somechanges that have hindered their ability to continue developing and sup-porting the product offerings and have created an opportunity for some ofthe newer players to enter the market, such as Lanier/Medquist’s SpeechQ
PACS: A Guide to the Digi tal Revolut ion470
DRE23 11/16/2005 10:01 AM Page 470

(Mount Laurel, NJ), Provox’s VoxReports (Roanoke, VA), and Commissure’sRadWhere (New York), which combines structured reporting with voicerecognition.
Solutions may also be obtained through various RIS and PACS vendors.Most have simply integrated with one or both of the above products, whileothers have opted to integrate a speech engine such as IBM ViaVoice(Wizard Software, Pittsburgh, PA), Philips SpeechMagic (Vienna) or DragonNaturallySpeaking (Scansoft, Burlington, MA) into their own reportingworkflow application. Regardless of how the application is purchased, thereare 6 key components to any viable solution to bear in mind:
1. The core speech engine2. The language model3. The application and workflow4. The interface and integration components5. Implementation services6. Ongoing support and customization
CORE SPEECH ENGINE
The speech engine is the starting point for any application driven by speechrecognition. Think of the speech engine as a keyboard replacement. Thereare different types of speech engines. Some recognize only commands andcan work on a number of platforms, from PDAs to a PC. Many are built fortelephonic applications such as airline scheduling and customer serviceanswering systems. The continuous speech recognition engine is the oneused for dictation solutions in medicine. This type of speech recognitionallows users to speak in their natural style and will also allow a properlydesigned application to be controlled by voice command. This is among themost advanced speech technology and among the most processing-powerintensive.
Speech engines use a number of proven algorithms and models to rec-ognize speech. Words are spoken into a microphone. Some microphonestransmit the analog sound signal to the sound card of the computer, whichthen digitizes the signal for processing. Others digitize the analog soundsignal immediately within the microphone itself and then send the digitalsignal to the computer, typically via the universal serial bus (USB) port. Thelatter method seems more robust, as it eliminates the distortions caused tothe analog signal from surrounding interference (common in a hospital
VOICE RECOGNITION 471
DRE23 11/16/2005 10:01 AM Page 471

setting) as it travels down the wire to reach the sound card. Digital signalsare essentially unaffected by such interference. The speech engine “listens”to these digital signals and compares them to acoustic models stored in thesoftware. The engine tries to find the best word match for the acoustic signalto recognize it and convert it to text. Speech engines can typically handle atotal vocabulary of more than 60,000 words. However, there are very fewapplications in which using more than 15,000 is necessary. Shakespeare’stotal works comprised fewer than 13,000 words. The average college grad-uate uses a vocabulary of fewer than 7,000 words in everyday conversation.More specifically, an analysis of more than 4 million radiology reports col-lected from more than 15 different hospitals produced fewer than 25,000unique words, including proper nouns.
Nonetheless, building acoustic and language models is a time-consuming process that costs many person-hours to successfully complete.In fact, speech recognition technology has been under development since1966. It is the longest-running continuously funded research and develop-ment (R & D) effort in the history of IBM. Philips has made a significant R& D effort, too, and there are literally dozens of other development effortscontinuing. Perhaps the biggest indicator that the time for speech recogni-tion has come is that Microsoft has built its own speech development labsand is likely outspending all other engine developers combined to advancethis technology for the human-machine interface.
LANGUAGE MODEL
The language model is a layer on top of the speech engine that allows forthe recognition of specialty-specific terms and reporting structures. Appli-cation providers build these language models using programming tools thatare included with the speech engine tool kits they have integrated into theirapplications.
There are actually 3 layers to the language model. The first typicallycontains a base vocabulary of 30,000 to 60,000 words that come from the manufacturer. These are from everyday English or New York TimesEnglish. They include many medical terms as well. This layer also containsthe acoustic models associated with those words. The acoustic models are what allow an engine to differentiate one spoken sound from another.Commercial off-the-shelf packages typically provide only this base languagemodel.
The second layer is used to build specialty models that allow applica-tion providers to customize and weight the vocabulary for certain topics or
PACS: A Guide to the Digi tal Revolut ion472
DRE23 11/16/2005 10:01 AM Page 472

subject matters. This layer is in addition to the base model. Hence, in mostcases, radiology-specific applications still contain many nonradiology wordsthat are also active in the vocabulary. However, the words in the customiza-tion layer will be more heavily weighted than those in the base model whenthe engine is working to recognize text, resulting in improved accuracy. Thebetter the effort to build this layer is, the better the overall accuracy of theproduct will be. It is common to use in excess of 2 million reports to builda language model for medical reporting.
The final layer is the user-specific layer. This layer gets built and opti-mized as the user dictates and corrects words. If a user adds a word or dic-tates in a specific style, this layer will learn the style, resulting in improvedaccuracy. In most cases, 2 to 4 weeks of use will optimize this layer foroptimum accuracy. There is a method of speeding this process with a utilityinherent in some products that will allow a user to feed up to 3 megabytes(MB) of reports to learn new words and reporting style from previously dic-tated documents. A properly built language model is very important to a suc-cessful implementation of speech recognition.
APPLICATION COMPONENT
The application is the most important component of a solution. A functionalapplication for radiology reporting is comprised of many things. Theseinclude a database, an interface engine, a desktop workflow application forthe radiologist, administrative tools, voice file management tools, and dis-tribution and integration capabilities. Figure 23.1 represents how data flowsin a properly designed reporting application.
The database includes all the data elements necessary for receivingorder data and allowing for the creation and distribution of a report and asso-ciated information. It should mirror many of the tables in the RIS database.By integrating workstations into a network, a user can dictate at any PC andnot be restricted to a particular workstation. The network link also allowsintegration with the RIS through the voice recognition server and ultimatelyinto the hospital information system (HIS) and PACS.
FEATURES NEEDED FOR SPEECH REPORTING
Besides the ability to support speech recognition and communicate withinthe existing information technology (IT) infrastructure, there are a few basicfeatures a speech reporting solution should have, as follows.
VOICE RECOGNITION 473
DRE23 11/16/2005 10:01 AM Page 473

SYSTEM SECURITY AND LOG-ON
The voice recognition software package must ensure that security is main-tained by requiring each radiologist to enter a user identification code andpassword to sign on and begin dictation. This is also a utility in the speakeridentification and verification function to ensure high accuracy rates. In addi-tion, most systems require the radiologist to enter the same password oranother predefined password in order to sign off on the dictated report andallow its transfer to the RIS and HIS. This second password feature ensuresthat the user is the designated physician identified by the system as dictat-ing the report. Further security measures include the inability to log on tomultiple workstations within a facility, which ensures that user workstationsare not left unattended. The system will also not allow an order to be openmore than once at any one time.
PACS: A Guide to the Digi tal Revolut ion474
FIGURE 23.1
Diagram shows how data flows in a properly designed reportingapplication. HL7 indicates Health Level Seven; IP, Internet protocol;RIS, radiology information system.
DRE23 11/16/2005 10:01 AM Page 474
STANDARD REPORTS
A speech recognition system should allow members of the radiology depart-ment to create predefined reports for individual radiologists or the institu-tion. These predefined reports may be categorized for normal studies orcommonly performed studies. For example, there is typically a predefinedreport for the normal chest radiograph, which would describe the normalcardiomediastinal silhouette and clear lungs. Standard reports should beeasily called up either by voice command or mouse click. Some systems may also bring up standard reports based on the type of exam being interpreted.
TEMPLATES AND MACROS
As an extension of the standard report function, many systems allow the creation of standard reports with customizable templates and fields. Thetemplate capability gives the radiologist the flexibility to create a form withblank areas that get filled in during dictation. For items such as procedures,the radiologist is able to dictate the necessary components to fill in theblanks. This feature has great value when describing different dosages orinstruments. Most systems contain a feature-filled macro/template cre-ation/editing utility. Using this function during report generation greatlyimproves the efficiency of the radiologist and decreases the time required todictate reports.
CUSTOMIZABLE FIELDS
Most packages permit custom definitions by the institution of multiple fieldsassociated with a report. These fields may include ICD-9, current proceduralterminology (CPT), Breast Imaging Reporting and Data System (BIRADS),American College of Radiology (ACR)/National Electrical ManufacturersAssociation (NEMA) codes, or ACR pathology identifiers. The data enteredinto these fields may be shared with other information systems, such as theHIS-RIS integration interface. The integration of these fields into a speechrecognition solution allows many collateral benefits. For example, an institu-tion may generate a database that can be used for research and education pur-poses. By defining cases by ACR codes, trainees can retrospectively reviewcases with selected words. By employing ICD-9 codes, radiology billing serv-ices are greatly facilitated. The various uses of these fields are innumerable.
VOICE RECOGNITION 475
DRE23 11/16/2005 10:01 AM Page 475

DESKTOP INTEGRATION
Desktop integration with PACS or RIS workstations has become increas-ingly important as the proliferation of PACS has advanced. There are manyways for a speech reporting solution to sit on a radiologist’s desktop. In anonintegrated environment there are 2 workstations, each with a mouse anda keyboard. These systems do not communicate, and the user must selectand sign cases individually within each application. In a semi-integrated envi-ronment, there are still 2 separate workstations. However, they communi-cate such that order selection and signing happen just once, typically on thePACS but sometimes on the RIS. In a fully integrated environment, theapplications reside on a single workstation and communicate almost trans-parently on the workstation. From a usability perspective, this is the idealscenario. However, PACS and speech recognition are 2 of the most demand-ing applications for a PC to run. The author has not yet seen these 2 appli-cations run simultaneously on a workstation and consistently performoptimally over an extended period of time. There are also issues with sharingscreen real estate, although this can be overcome by adding more inexpen-sive color LCD displays. Currently, the most reliable integration is semi-integration. This allows for the use of context sharing and a single workflowpoint while also providing enough PC horsepower for both applications torun optimally.
RIS/HIS INTERFACE
Any system needs to provide links to the existing IT infrastructure, allow-ing seamless integration with the RIS, HIS, PACS, and the billing system.Most software packages incorporate back-end transparent interfaces thatallow the speech recognition system to query the RIS for demographic dataas well as report status. In addition, the system allows the upload of dictatedreports to the RIS and ultimately to the HIS. To achieve this task, most soft-ware packages contain Health Level Seven (HL7)-compliant applicationprogramming interfaces that use standard formats and protocols. Depend-ing on the level of HL7 interface, most systems allow the radiologist to createa worklist by modality, date, or wildcard categories. Here is an explanationof how HL7 messaging works and some sample messages related to a report-ing system.
The HL7 protocol is a simple messaging system in which all data aretransferred as ASCII data, not unlike a simple text file. Each transaction con-sists of a message unit (file) that consists of segments (lines or rows) that
PACS: A Guide to the Digi tal Revolut ion476
DRE23 11/16/2005 10:01 AM Page 476

consist of fields. The fields are formatted according to their HL7 data type.Each message, segment, and field is of variable length and uses ASCII char-acters for delimiters. An example portion of a message follows:
MSH|^~/&|Radiology|RDW|Radiology||19960412|ORU||||||
PID|||0123456||Smith^James^T||19610122|M
The first segment is a message header (MSH). It contains the delimiter char-acters to be used in the message (^~/&|), the message type (ORU), and othermessage control information. The PID segment contains patient demo-graphics, such as name and date of birth (DOB). Notice the format of theDOB, “19610122.” This is an HL7 data type called TS (time stamp). TheTS is defined as YYMMDDHHMM[SS]. There are numerous HL7 datatypes, ranging from tightly restricted formats such as TS to very looserestrictions such as ST, which is any string data. Also notice that some fieldscontain no data. These are optional fields. For a more detailed descriptionof HL7, refer to the HL7 Standard Specification (Version 2.1 or higher).
There are 2 types of communications that occur between a RIS and aspeech reporting solution. The first is the sending of an order to the report-ing system so that it is aware of what needs to be dictated. These are verysimilar to orders sent from an RIS to a PACS. The second is the sending ofa result from the reporting system to the RIS. An example of an ordermessage that an RIS might send is:
MSH|^~\&|||||||ORU|0123456
PID|||012-345||Doe^John^P||19610122|M|||1 FairwayLane||||||||012-34-
5678OBR|||9901|26345^Head,left
view|||199604181202|||||||||1234^Welby
This example contains basic patient data, exam type, accession number, andthe ordering physician information. An example of a result message sent tothe RIS is:
MSH|^~\&|||||||ORU|2345678
PID|||012-345
ORC|RE
OBR|||9901|201A2||||||||||||||||||199604201055|||F||||||||D12345
VOICE RECOGNITION 477
DRE23 11/16/2005 10:01 AM Page 477
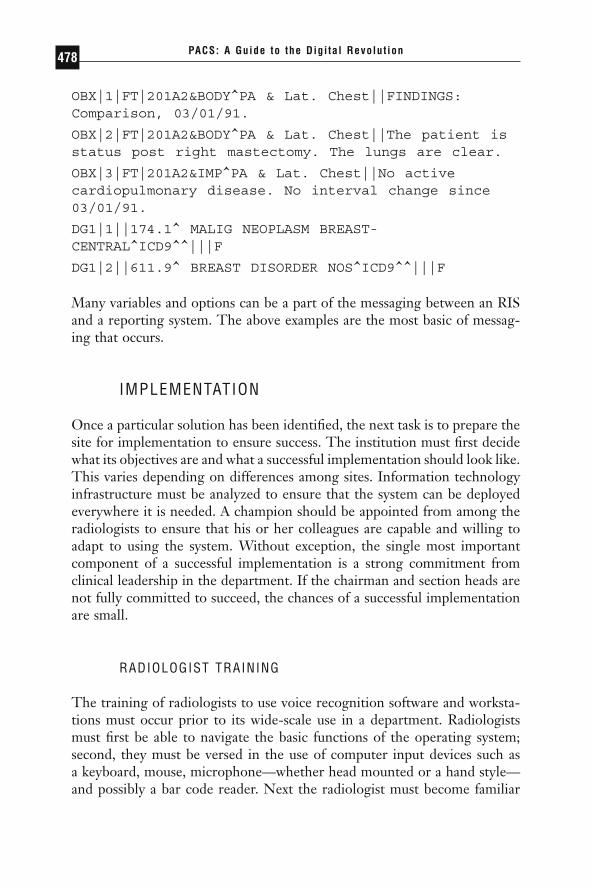
OBX|1|FT|201A2&BODY^PA & Lat. Chest||FINDINGS:Comparison, 03/01/91.
OBX|2|FT|201A2&BODY^PA & Lat. Chest||The patient isstatus post right mastectomy. The lungs are clear.
OBX|3|FT|201A2&IMP^PA & Lat. Chest||No activecardiopulmonary disease. No interval change since03/01/91.
DG1|1||174.1^ MALIG NEOPLASM BREAST-CENTRAL^ICD9^^|||F
DG1|2||611.9^ BREAST DISORDER NOS^ICD9^^|||F
Many variables and options can be a part of the messaging between an RISand a reporting system. The above examples are the most basic of messag-ing that occurs.
IMPLEMENTATION
Once a particular solution has been identified, the next task is to prepare thesite for implementation to ensure success. The institution must first decidewhat its objectives are and what a successful implementation should look like.This varies depending on differences among sites. Information technologyinfrastructure must be analyzed to ensure that the system can be deployedeverywhere it is needed. A champion should be appointed from among theradiologists to ensure that his or her colleagues are capable and willing toadapt to using the system. Without exception, the single most importantcomponent of a successful implementation is a strong commitment fromclinical leadership in the department. If the chairman and section heads arenot fully committed to succeed, the chances of a successful implementationare small.
RADIOLOGIST TRAINING
The training of radiologists to use voice recognition software and worksta-tions must occur prior to its wide-scale use in a department. Radiologistsmust first be able to navigate the basic functions of the operating system;second, they must be versed in the use of computer input devices such as a keyboard, mouse, microphone—whether head mounted or a hand style—and possibly a bar code reader. Next the radiologist must become familiar
PACS: A Guide to the Digi tal Revolut ion478
DRE23 11/16/2005 10:01 AM Page 478
with the software interface of the voice recognition package. Many packagesoffer navigation by voice, which requires the user to remember the namesof each function, such as “Accept and sign” or “Save as preliminary.” Otherpackages require mouse clicks to perform these same functions. Some allowa variety of methods and prompt the user with these commonly used com-mands to decrease the need to memorize commands immediately. Usually,the champion of the transition is a key radiologist who facilitates learningand eases the implementation. Such an individual can be instrumental in pro-moting acceptance and training colleagues in the use of the new system. Thevendor will typically schedule enough training for all users. Follow-up train-ing some weeks after go-live is highly recommended.
TRAINING MATERIALS AND TOOLS
Providing users with a written review of the steps they have performed servesto reinforce computer-based training. Vendors should provide written mate-rial that is graphically intensive and easy to follow. It should be in a quick-reference format and easily accessed on the workstation.
TECHNICAL SUPPORT
All devices stop working at times. Whether the affected component is amouse, a monitor, or the entire workstation, problems invariably occur atone time or another to a PC. This is obvious to all users and inherent in all computers despite precautions taken to prevent downtime. However, a reporting system plays a mission-critical role in the life of a radiologydepartment. Downtime can cost thousands of dollars in radiologist time and can have a severe negative effect on service. In most cases, vendor help-desk support is simply not enough to tend to the needs of a radiologist with a down workstation. Having in-department or hospital support staffthat can respond to basic issues in real time is an expense but well worth theeffort.
OPERATIONS
From the initial thought of employing a voice recognition system to all stagesduring the deployment, close attention to operational planning is necessary.This attention must be generated both departmentally as well as individually.
VOICE RECOGNITION 479
DRE23 11/16/2005 10:01 AM Page 479

The first impressions of voice recognition systems are that they are slowand often cause significant delays with large volumes. It is always difficult to foster change in a department, especially when the ultimate benefits ofimproved report turnaround times and departmental cost savings seem tooccur at the expense of the radiologists’ time. To successfully overcome thesehurdles, there must be a general understanding, especially by those whochampion such an effort, of the impact a system shift of this magnitude willhave on the radiologists’ daily workflow. Only with acknowledgment of thesegains by the designated leadership will it be feasible to achieve milestonesand communicate the required steps to the members of the department.Beyond these operational issues, specific issues must be addressed during theintegration of voice recognition into a department.
SPECIFIC DELIVERY
During the installation of a system, 4 operational issues should be consid-ered prior to its full-time use in the practice. One first needs a firm grasp ofthe hardware and infrastructure requirements necessary to create the supportsystems that would allow seamless integration into the department. Second,individuals need to be identified who can assist radiologists with technicalissues promptly and effectively. Third, timely operational checks with closefollow-up are necessary to monitor that users are productive with the newsystem. By ensuring that individual users are effectively operating with thenew system, enterprise benefits can be realized. The final operationalrequirement is a plan for the removal of the legacy dictation system so thatpenetration of the newer system is guaranteed.
OPERATIONAL CHECKS
For continued success in voice recognition system implementation, thedepartment must make a commitment to guarantee continued support anduse. First and foremost, technical support must be quick, knowledgeable, andcourteous. The time that lapses between the request for support and theresponse to a “distressed” user should be monitored because once fullyimplemented, a nonfunctioning voice recognition system is costly to boththe productivity and the morale of the department. A workstation thatcrashes usually results in the complete cessation of workflow because of itsabsolute necessity, especially once 100% penetration has been achieved.Often, users will resort to using legacy dictation systems if they are avail-
PACS: A Guide to the Digi tal Revolut ion480
DRE23 11/16/2005 10:01 AM Page 480

able, but this further hampers the operational benefits of the system. Second,the support team must follow up on all outstanding events to prevent recur-rence of common problems. There should be a well-documented contin-gency plan in the event of system failure and a means of communicating thisto both radiologists and other users of the system.
REMOVAL OF OLDER DICTATION SYSTEMS
During the phase-in of the voice recognition system, a point is reached atwhich a well-organized and timely removal of legacy dictation systems mustoccur. The removal of these alternate dictation systems ensures both pri-marily use of the voice recognition system as well as a commitment on thepart of the department to the radiologists. It also demonstrates that a well-planned contingency structure is in place in the event of failure. Experiencehas demonstrated that every department has users who resist change and willcontinue to use legacy systems if they are available (and in some cases evenif they are not readily available). However, the removal of older dictationsystems once the voice recognition system is in place, coupled with encour-agement from department heads and senior management, allows usage tosteadily increase and goals to be reached.
COST SAVINGS
Several areas of cost savings are associated with the implementation of a voicerecognition system. The obvious and most apparent in the radiology prac-tice is the transcription cost. With the direct dictation and transcription ofthe report, the number of personnel who handle the transcription processcan be decreased. The cost savings are realized not only in terms of salariesand benefits but also in the host of other costs associated with personnel.
The indirect cost savings are realized through the use of computersystems. Although this may appear as an added cost due to the purchase ofhardware, the actual savings come from the multiple uses of a desktop PC.With the integration of the medical record to include radiology, pathology,and other image-based specialties, the practice of radiology is undergoingdrastic changes in the availability of information to the radiologist. Housingthe voice recognition system on a conventional desktop PC allows otherinformation agents, including references, paging systems, and HIS-RISapplications, to be coupled to this system. Adding these services to a unify-ing system saves both time and physical space.
VOICE RECOGNITION 481
DRE23 11/16/2005 10:01 AM Page 481

REPORT TURNAROUND
There is no arguing that report turnaround times decrease dramaticallywhen using a speech recognition system. In most cases, times drop by morethan 90%. If coupled with proper distribution methods, reports can be deliv-ered to ordering physicians before the patient leaves the department orarrives home. Considering the level of service this represents and the factthat images are now available via the Web from most PACS, it becomes a necessity to implement this type of service to remain current and competitive.
CONCLUSION
There is no doubt that radiology must take the path that leads to improvedservice and more efficient delivery of results. The demands of more timelyand improved patient care are greater than ever. The documentation processmust be improved, and no technology has demonstrated itself to be more ofan aid toward attaining this goal than speech recognition. Perhaps speech incombination with some clinical content and structured reporting will be thepinnacle of functional reporting systems. The technology has improved dra-matically over the years. Vendors have learned and advanced their applica-tions to be true workflow improvement tools. Now is the time to considerimplementing speech recognition as a means to improve service and remainclinically relevant to patient care.
PACS: A Guide to the Digi tal Revolut ion482
DRE23 11/16/2005 10:01 AM Page 482

ORDER ENTRY INRADIOLOGY
DANIEL I. ROSENTHAL
Electronic order entry for diagnostic imaging offers many potential advan-tages for both the radiology department and its referring community.
Despite this, it is not a widely available service, especially for outpatient prac-tices. This lack of penetration may be due to the cost and complexity of initialdeployment. However, it may also represent failure to comprehend the fullrange of possible benefits or to understand the barriers to acceptance by cli-nicians and radiology personnel.
Implementation of an electronic system is a major investment in timeand effort. It is also an exercise in change management in regards to boththe referring practices and the radiology department. Electronic order entrymay be perceived either as positive or negative depending on whether theusers acknowledge the problems that the system is designed to address. Forexample, it is very difficult to persuade referring offices to comply with asystem whose primary benefit is to enhance radiology billing. For this reason,in our large (more than 100 radiologists, 5 locations) academic medicalcenter, we believe that it is very important that the order-entry system bedesigned with the needs of both user groups in mind. Only then will theinitial effort of learning a new procedure appear worthwhile.
24CHAPTER
DRE24 11/16/2005 10:02 AM Page 483
At present, there are no widely accepted, radiology-specific electronicorder-entry systems on the market. We have created our own electronicorder-entry system that functions very well. It is described here to demon-strate what can be accomplished when such as system is tailored for radiol-ogy instead of being just a part of a generic order-entry system. Our systemwas designed empirically and has undergone constant growth and modifica-tion as new capabilities were recognized. It is hoped that systems such as thiswill soon be commercially available.
PRINCIPLES
Our outpatient Web-based order-entry system was designed with severalbasic principles in mind:
1. The minimum essential information needed to perform the exami-nation must be captured through the use of mandatory fields. This includespatient, doctor, and examination identification, as well as enough clinicalinformation to assign at least one ICD-9 code (required for billing).
2. All information is electronically transferred to the radiology infor-mation system (RIS).
3. Total time for use of the system must not exceed that for a manualsystem. Keystrokes are kept to a minimum. Since use of the system requiresaccess to a computer, it may be perceived as less convenient than a papersystem for ordering, especially for inexperienced users. However, improvedscheduling more than compensates for this. Therefore, we have found it important for initial user acceptance to focus on those examinations that require advance appointments (most procedures other than plain radiography).
4. Not every examination can be included. We do not think that electronic order entry is appropriate for urgent or “stat” cases because of the risk that they may not be noted rapidly enough. Interventional proce-dures require more detailed communication than the system is designed tohandle.
5. Some adjustments by “expert users” will continue to be required. Itappears unreasonable to burden the users with the full range of possible pro-cedure codes. The final assignment is done within the radiology departmenteither by schedulers or by technologists.
PACS: A Guide to the Digi tal Revolut ion484
DRE24 11/16/2005 10:02 AM Page 484
DESIGN
In the mind of the user, the process of ordering a diagnostic imaging testprobably includes the process of scheduling. Different individuals may beresponsible for these 2 components. The physician or nurse may write anorder in a patient record. The task of scheduling the appointment is oftenleft for a secretarial assistant. We think that it is important that the elec-tronic system provide for both functions, as the greatest advantages for thereferring practices are in scheduling convenience.
Our system requires a password-protected log-on for all users, includ-ing both physicians and office assistants. At the time of initial registration,each user must indicate for whom he or she is authorized to order exams.Physicians generally order only for themselves. Office staff may sometimesorder examinations for a few physicians. This information is stored in theorder-entry database and can be edited if required. For each subsequent use,the user sees only the authorized names on a pull-down menu.
Patient identification is done by means of the medical record number.The system verifies the validity of the number and returns the patient namefor additional verification.
After identification of the doctor and the patient, the main orderingscreen appears (Figure 24.1). This is a listing of modalities (computedtomography [CT], magnetic resonance imaging [MRI], etc.). A click on themodality icon reveals a pull-down menu of examinations (chest, abdomen,head, etc.). When the proper examination is selected, the specific orderingscreen appears.
All ordering screens have the same basic structure, intended to mirrorclinical practice. A checklist of indications is offered, permitting selectionfrom 3 different categories (Figure 24.2):
1. A sign or symptom2. A known diagnosis3. An abnormal previous test
Selection of at least 1 of these boxes is mandatory for scheduling to proceed.Multiple selections may be made, and a free-text box (optional) is providedfor additional information. In addition, a listing of common special consid-erations is offered. These are intended to minimize the need for free textand include common requests such as the use of contrast, conditions to ruleout, requests for “wet readings,” or additional physicians to be sent reports.Selection of 1 or more of the special considerations is optional.
ORDER ENTRY IN RADIOLOGY 485
DRE24 11/16/2005 10:02 AM Page 485

The lists of common indications and special considerations for eachexamination were developed using a multistep process. Billing submissionsfrom the years prior to order entry were reviewed to identify commonly usedterms. These lists were validated against published listings of medical appro-priateness. The lists were then verified by subspecialist radiologists. Finally,prior to creation of the electronic system, the lists of indications were pilotedin paper form. Indications were added as needed and removed if not used.Modification of these lists is ongoing.
Once the necessary information has been provided, the user has theoption to save the order or proceed to schedule an appointment. Physiciansmay prefer to have their office staff do the latter.
Clicking on the Schedule icon brings up a screen showing a list of sitesat which the procedure is available. A calendar is displayed for the selectedsite. Days with available appointments are identified in color. Clicking on
PACS: A Guide to the Digi tal Revolut ion486
FIGURE 24.1
The opening screen: a listing of imaging modalities. Clicking on thedesired modality produces a pull-down listing of examination types.
DRE24 11/16/2005 10:02 AM Page 486

the hyperlink shows a listing of available appointments. A limited numberof appointments are reserved for same-day use. These times are hidden untilthe day for which they are offered.
Selection of an appointment time secures the time, removes it from thelist of available times, and completes the process. A reminder slip is printedfor the patient with instructions for examination preparation. If 1 of oursatellite facilities has been selected, driving directions are included.
This system functions independently of the RIS. To avoid conflicts,appointments made available on the order-entry system are blocked in the
ORDER ENTRY IN RADIOLOGY 487
FIGURE 24.2
A typical order screen, showing the categories of information:special considerations, signs and symptoms, known diagnoses, andadditional information. Selection of at least 1 sign, symptom, orknown diagnosis is mandatory for scheduling to proceed.
DRE24 11/16/2005 10:02 AM Page 487

RIS scheduling template. To prevent times from being unused, blocked timesare released for general scheduling 24 hours ahead, and thus the majority ofour order entry appointments are available at least one day into the future.A small number of appointments is reserved for same-day availability.
Order-entry data are stored in a Structured Query Language (SQL)database. A Visual Basic script allows the transfer of information from Radi-ology Order Entry (ROE) to the RIS. Fields are transferred automaticallyby pressing a single function key, similar to a cut-and-paste operation,thereby drastically reducing the errors invariably associated with data entry.Technical details such as assignment of proper examination codes and systemresources are done manually by radiology department personnel.
ADVANTAGES
ACCURACY
The order-entry system has resulted in important improvements in the accu-racy of the information provided to the radiology department. Althoughidentification of the patient was rarely a problem with the paper system,doctor identification was much more problematic. This occurred because inour large system many physicians have similar names and because theirwritten signatures were often hard to read. Electronic orders eliminate thisproblem.
Handwritten history presented problems for similar reasons andbecause the clerical staff who transcribed it might be unfamiliar with themedical vocabulary. Information absolutely necessary for performance of thetest (side, level) might be overlooked. The mandatory fields of the order-entry system have made this a problem of the past.
Specific requests for the radiology department (such as “wet readings”)might be overlooked or their significance not comprehended. In addition,there was a further problem due to the fact that the written forms might notarrive in advance of the scheduled appointment.
CONVENIENCE
Our system offers significant conveniences for the referring office and thepatient. The alternative method for obtaining an appointment requires atelephone call to the radiology department. During peak hours, there maybe a delay until a service representative is available. Information communi-cated by telephone may be incomplete or poorly understood. The telephone
PACS: A Guide to the Digi tal Revolut ion488
DRE24 11/16/2005 10:02 AM Page 488

communication is difficult to structure, resulting in information that mightnot be helpful for interpretation or not suitable for billing. Delays in theprocess often require the clinician’s office to schedule the appointment afterthe patient has left, leading to yet another communication problem, and anincreased chance of a no-show.
Because the electronic system is fast and easy to use, patient appoint-ments tend to be arranged while the patient is in the physician’s office. Thisfacilitates an interactive process that allows the patient to participate in selec-tion of the appointment, thus minimizing the need to reschedule and therisk of no-show.
Our referring offices prefer not to access multiple systems. Therefore,we provide access to reports through the order-entry system. An icon on themain page allows the referring office to view and print reports on theirpatients as well as the status of cases not yet performed or reported. Reportsnot previously viewed by them are searchable separately from those alreadyseen, helping them to keep track of patient flow.
Although we have not as yet done this, in principle, some appointments(such as screening mammography) could be scheduled directly by the patient.
There are also significant advantages for the radiology department.The most obvious advantage is that less time is needed to schedule anappointment by ROE than is needed to schedule an appointment by tele-phone. Therefore, fewer service representatives can schedule more proce-dures. In addition, the clerical function of entering data into the RIS takesplace without delaying the referring office or patient.
Perhaps less obvious is the fact that the order-entry system becomes auseful conduit for information concerning radiology services. We use bannersto announce the availability of new sites and new procedures [such as positronemission tomography-computed tomography (PET-CT)] and to provide tipsfor earliest appointments. For example, banners have been used to indicatethat the earliest appointments for a particular type of exam are available at aparticular satellite center. In addition, the choice of defaults helps to guide theselection of appointments to those sites with greatest availability. Finally,because it keeps track of cancellations and rescheduled procedures, the order-entry system provides important insight into the ways in which different refer-ring practices use (and misuse) our scheduling service. This knowledge hasproven valuable in our education and marketing operations.
REQUIRED INFORMATION
The era of managed care has brought about specific information require-ments that are often extraneous to the traditional care process. For example,
ORDER ENTRY IN RADIOLOGY 489
DRE24 11/16/2005 10:02 AM Page 489
to submit a bill for diagnostic imaging services, an ICD-9 code must be pro-vided. The ICD-9 code classifies the patient abnormality (a sign, symptom,or pathological state). In our experience, it has been impossible to educatethe referring offices to the need for specific information that might be usedfor ICD-9 coding. Prior to the order-entry system, large numbers of requestscontinued to arrive with only the name of the condition that was beingsought (e.g., “rule out tumor”) but lacking any information concerningpatient complaint.
In addition, certain insurance plans require precertifications for certainprocedures and provide the precertification based on clinical information.The order-entry system ensures that the required information is collectedand can be provided in electronic form should the insurance plan be willingto accept it.
HEALTH INSURANCE PORTABILITY ANDACCOUNTABILITY ACT OF 1996
We believe that the electronic order-entry system represents a clear improve-ment in compliance with the Health Insurance Portability and Accountabil-ity Act of 1996 (HIPAA). Unlike our prior telephone-based schedulingsystem, the identification of the user is verified through a secure identifier(ID). Report-viewing privileges are limited to those doctors for whom sched-uling is performed. Although our system permits adjustments to the list ofphysicians for whom scheduling and report viewing are performed, logs aremaintained of each interaction with the system, and inappropriate use canbe identified.
SPECIAL CAPABILITIES
Several additional special capabilities of electronic order entry should benoted. Decision support (advice about the appropriate use of imagingstudies) can be provided at the time the examination is requested. Our systemprovides a “utility score” for the requested examination based on the historyprovided, similar to the American College of Radiology appropriateness cri-teria. This function is targeted to the physicians who use the system, as cler-ical staff are not at liberty to change orders and are unlikely to serve asconduits for this type of advice. It is too early to determine what effect, ifany, this information may have on clinical practice.
PACS: A Guide to the Digi tal Revolut ion490
DRE24 11/16/2005 10:02 AM Page 490
In addition, our system provides information concerning potentialduplication. If a patient has had a similar examination within the past month,a warning is displayed on the ordering screen. Similar examinations are notnecessarily of the same type. For example, an alert concerning possible dupli-cation would appear if a CT scan of the head is requested when an MRI ofthe head had recently been done.
PROBLEMS
As the use of the electronic system has grown, it has been necessary to allo-cate a steadily increasing fraction of the potential times to it. Because we lacka direct interface to the RIS, this requires continual balancing.
Radiologists have occasionally complained that the histories providedby the checklists sound generic. It has also been suggested that the check-lists are too easy to use and that perhaps unqualified personnel are takingthe “path of least resistance,” resulting in histories that may not be accurate.It is difficult to verify these concerns or to determine whether similar issuesexisted prior to order entry; however, ongoing surveillance of the quality ofinformation is required.
An unanticipated source of resistance has been from within the radiol-ogy department. Modality managers may regard the order-entry system aslessening their control over their environment. By demystifying the sched-uling process, the role of the expert is diminished. Further, the ability to dofavors for colleagues by providing access to limited appointment times is asource of pride and power, especially in an environment of scarcity.
THE FUTURE
The development of large healthcare networks and the increasing growth inimaging volume have undermined the type of personal referrals that onceformed the basis of radiology practice. Radiology staff, and even the radiol-ogists, may not know the physicians who send patients. Indeed, in somelarger practices, radiology office staff may not even know their own radiol-ogists. Multiple physicians may have the same or similar names, especiallyin large academic centers. Knowledge of medical terminology may belimited, leading to misspelled or even incomprehensible requests. Suchtrends will probably continue, making development of sophisticated knowl-edge-based, error-resistant systems ever more important.
ORDER ENTRY IN RADIOLOGY 491
DRE24 11/16/2005 10:02 AM Page 491

It has become increasingly clear that tight integration of informationsystems is essential to capture their full benefits. For example, use of a“broker” to coordinate Digital Imaging and Communications in Medicine(DICOM) images stored on picture archiving and communication systems(PACS) with patient information in the RIS introduces complexity that mayresult in use of outdated information. Newer system designs are tending toincorporate the broker function directly into the RIS. Ideally, the order-entrysystem should communicate directly with the RIS. In the near future, ourRIS will likely be able to handle such interaction, thereby simplifying thewhole process even further.
Implementation of a computerized order-entry system in a neonatalintensive care unit has already been shown to shorten the radiology responsetime (interval between order and image display) by almost 25%. Integrationof technology will bring many further gains. Doubtless the future evolutionof continuous speech recognition systems will include order entry, makingthese systems even faster and more convenient.
As progress is made in coordination of the components, there will beimproved understanding of the possible failure points, leading to develop-ment of system tools that understand and monitor information flow.
Perhaps, as reality comes closer to concept, radiology order-entrysystems may be integrated with electronic patient records, appropriatenesscriteria, and practice guidelines. Such computer-based practice guidelinesmight also include additional didactic material, such as images, videos,sounds, simulations, and links to bibliographic databases. Given patient data,these future systems might even select the most appropriate imaging studyautomatically.
◗ REFERENCES
Clark KW, Melson DL, Moore SM, et al. Tools for managing image flow in themodality to clinical-image-review chain. J Digit Imaging. September 2003;16(3):310–317.
Cordero L, Kuehn L, Kumar RR, Mekhjian HS. Impact of computerized physicianorder entry on clinical practice in a newborn intensive care unit. J Perinatol. Feb-ruary 2004;24(2):88–93.
Langer S. Radiology speech recognition: workflow, integration, and productivityissues. Curr Probl Diagn Radiol. May–June 2002;31(3):95–104.
Mulvaney J. The case for RIS/PACS integration. Radiol Manage. May–Jun 2002;24(3):24–29.
PACS: A Guide to the Digi tal Revolut ion492
DRE24 11/16/2005 10:02 AM Page 492

St. Anthony’s Guide to Code Linkage, CPT and ICD-9 CM Code Connection. St.Anthony’s Publishing; January, June 1997.
Tjahjono D, Kahn CE Jr. Promoting the online use of radiology appropriatenesscriteria. Radiographics. November–December 1999;19(6):1673–1681.
ORDER ENTRY IN RADIOLOGY 493
DRE24 11/16/2005 10:02 AM Page 493
DIGITAL TEACHINGFILES ANDEDUCATION
KHAN M. SIDDIQUI • BARTON F. BRANSTETTER IV
The learning process in radiology requires systematic study of a largeknowledge base of medical images. The Residency Review Committee
(RRC) for diagnostic radiology of the Accreditation Council for GraduateMedical Education (ACGME) mandates resident education and competencyrequirements. These requirements include core competencies stressing theimportance of computer-aided applications in medicine and the use of onlineresources for educational and patient care purposes. Patient care require-ments include the use of information technology (IT) to support both patientcare decisions and patient education. Practice-based learning and improve-ment requirements demand that residents use IT to access online medicalinformation and support their own education. As part of competency in professionalism, residents are expected to show ongoing professional development. Residency programs are expected to teach residents computerapplications in radiology, practice management, and quality improvement.
25CHAPTER
DRE25 11/16/2005 10:03 AM Page 495
Residency programs are also required to develop a system to assess and doc-ument residents’ competence in these areas. ACGME requirements alsostate that “[t]eaching files (electronic or film) must be available for use byresidents and these files should contain a minimum of 1000 cases that areactively maintained and continually enhanced with new cases” (emphasis added).This underscores the importance of addressing teaching file requirementsduring the transition to filmless imaging.
Traditionally, case-based hardcopy teaching files have been createdfrom radiology studies of real patients. Such teaching files consist of radiol-ogy images accompanied by relevant clinical data and a short write-up of thepathological condition. Libraries of representative teaching files are highlydesirable in radiology teaching programs, but the organization and mainte-nance of collections can become problematic.
With the advent of picture archive and communication systems(PACS), the acquisition, viewing, and organization of medical images forteaching and research should be simplified, because such data are digital fromthe start. Moreover, in the electronic environment, powerful and versatiletools have been developed and can be customized to maintain, organize, andsearch for images. However, no PACS vendor now provides a solution forthe creation of electronic teaching files (ETF) as a commercial option.Hence, the potential for PACS as a teaching and research tool has not beenmaximized. Many teaching hospitals and universities have designed in-housesolutions, employing a variety of methods to create their own ETF libraries.
MEDICAL IMAGE RESOURCE CENTER
The Radiological Society of North America (RSNA) has defined standardsfor a medical image resource center (MIRC). A set of extensible markup lan-guage (XML) schemas for information exchange, such as MIRC query,MIRC query result, MIRC site index, and MIRC document, have beendeveloped. By complying with these schemas, individual teaching file serversaround the world can be linked together through the World Wide Web toform a global MIRC community. Thus MIRC has the potential to becomethe worldwide standard for teaching and research data exchange, in the sameway that the Digital Imaging and Communications in Medicine (DICOM)standards have been accepted and incorporated into PACS.
MIRC was originally conceived as a large, central database of imagesand related clinical information that would be maintained by the RSNA foropen access by the medical imaging community. It soon became evident that a more effective strategy would be to leverage existing online electronic
PACS: A Guide to the Digi tal Revolut ion496
DRE25 11/16/2005 10:03 AM Page 496

resources in addition to creating new ones. A decision was made to create avirtual community of medical image libraries that would benefit from a dis-tributed index mechanism and also support a distributed search mecha-nism—in other words, to create a kind of radiologic Napster. The final resultwas MIRC, an open community of medical imaging libraries and teachingfiles from around the world, sharing information through a common queryformat. The system has evolved to provide support for a community of co-operating libraries that can be managed at multiple levels, ranging from anindividual working at a laptop or personal computer (PC) to a level at whicha user can access global content as if it were in a single library. The virtuallibraries provide all kinds of digital information, including teaching files,clinical and technical documents, electronic presentations, and imagingdatasets for research (Figure 25.1).
The objective of the MIRC project is to support the production,storage, indexing, and distribution of medical imaging resources, such asteaching files, scientific and technical documentation, research images anddatasets, and clinical trials data.
DIGITAL TEACHING FILES AND EDUCATION 497
FIGURE 25.1
Medical image resource center (MIRC) community diagram.
DRE25 11/16/2005 10:03 AM Page 497

Authors may use a MIRC-defined format to construct teaching filesand other documents in a common structure that allows libraries to indexthe documents in medically meaningful ways (Figure 25.2). The RSNA hasalso developed a MIRC authoring tool, known as MIRCat, as well as a Web-based MIRC authoring service.
An indexing mechanism provides users great flexibility in searching theMIRC community. Users can perform free-text searches on the contents ofdocuments, as well as structured searches on patient criteria (e.g., sex, age)or image criteria (e.g., modality, anatomical region, storage format, com-pression), all through a standard Web browser (Figure 25.3). Any MIRC sitecan function as either an access point for users (called a query service) or anindexed information library (called a storage service) or both. A query serviceprovides a point of access to the entire MIRC community. It provides a queryform to the user, distributes the search criteria to all selected storage serv-ices, collates the responses, and presents them to the user. A storage serviceresponds to the query received from the query service, searches its index fordocuments meeting the search criteria, and returns abstracts and locationsof the matching documents to the query service.
PACS: A Guide to the Digi tal Revolut ion498
FIGURE 25.2
MIRC teaching file (mircTF) case display format.
DRE25 11/16/2005 10:03 AM Page 498

As of this writing, the international MIRC community includes 10 sites,from Switzerland to Singapore, accessible through the RSNA MIRC site,plus others running the RSNA MIRC software privately. The RSNA MIRCsoftware now supports teaching files, research datasets, scientific and tech-nical documents, and clinical trial image acquisition and distribution.
The current software release supports public, restricted, and privateteaching files, all on the same server, allowing authors to use MIRC as a per-sonal archive as well as a publication mechanism to group, department, andglobal audiences. The software now includes a server-based editor, facilitat-ing online creation of teaching file cases and other documents without anyspecial software on the author’s system.
The current software release also includes a DICOM storage servicethat automatically creates clinical trial documents in response to the receiptof images from local modalities or participating clinical trial sites. It allowsdistribution of DICOM images to other participating clinical trial sites in awide range of topologies. The clinical trial service also supports researchdataset acquisition, with automatically created documents that can be editedthrough the author service. The service also allows capture of commentary
DIGITAL TEACHING FILES AND EDUCATION 499
FIGURE 25.3
MIRC query page used to search through the MIRC community.
DRE25 11/16/2005 10:03 AM Page 499

on images and studies, making them more easily searchable. More informa-tion about MIRC is available at http://mirc.rsna.org.
OTHER TEACHING FILE RESOURCES
A wide range of online teaching file resources is available to radiologists intraining or in clinical practice who want to increase their breadth of knowl-edge or who wish to use these resources as electronic decision support toolsduring daily practice or to anonymize and store interesting cases for depart-mental or personal teaching file collections. A simple search for the keywords“radiology teaching file” on http://www.Google.com at the time of prepara-tion for this chapter yielded 81,100 hits. Some of the more popular teach-ing file resources are listed in Table 25.1.
PACS: A Guide to the Digi tal Revolut ion500
TABLE 25.1Selected Digital Teaching File Resources
Digital Teaching File Web Address
MedPix http://rad.usuhs.mil/index.htmlMyPACS http://www.mypacs.netCasImage http://www.casimage.comEuroRad http://www.eurorad.orgCTisUS http://www.ctisus.comBrighamRad http://brighamrad.harvard.edu/Auntminnie—Indiana University http://www.auntminnie.comMallinckrodt http://gamma.wustl.edu/home.htmlAmerican College of Radiology http://www.learningfile.com
Learning FileThomas Jefferson Neuroradiology http://popeye.rad.tju.edu:8080/mirc/queryUniversity of California at San Francisco http://128.218.59.127/GlobalRad http://www.globalrad.com
Source: Data from Branstetter BF, Siddiqui KM, Lionetti DM, Chang PJ. Defining adigital teaching file workflow: specifications for software development. J DigitImaging. 2003;16(suppl 1):37–40.
DRE25 11/16/2005 10:03 AM Page 500
SPECIFICATIONS FOR DEVELOPMENT OFTEACHING FILES
Despite advances toward an all-digital environment in academic radiologydepartments, the teaching file—perhaps the most distinguishing and tradition-honored feature of medical imaging pedagogy—has been slow toadapt to the full range of informatics possibilities. One complicating elementhas been the requirements imposed by compliance with the Health Insur-ance Portability and Accountability Act (HIPAA). Because most traditionalteaching files are not sufficiently anonymized, they are noncompliant withHIPAA requirements. To get around this difficulty, many academic institu-tions have developed in-house digital teaching files (DTFs); Web-based andstandardized formats have been developed for sharing cases between insti-tutions. However, most PACS vendors have yet to incorporate DTFs directlyinto their PACS offerings. Without an easy teaching file solution integratedwithin the PACS system to allow users to create teaching file cases easily andeffectively, user compliance and integration of teaching files into all-digitaldepartment academic activities will continue to pose difficulties.
INTEGRATING THE HEALTHCARE ENTERPRISE TEACHING FILE INFORMATIONEXPORT PROFILE
The Integrating Healthcare Enterprise (IHE) initiative is a project designedto advance the state of data integration in health care. Sponsored by theRSNA and the Healthcare Information and Management Systems Society(HIMSS), it brings together medical professionals and the healthcare infor-mation and imaging systems industry to agree on, document, and demon-strate standards-based methods of sharing information in support of optimalpatient care. A proposal for a teaching file information export profile is underconsideration by the IHE that, once released, will address uniform methodsfor capturing information for teaching file cases across various PACSvendors.
Although the IHE profile will address workflow implications for cre-ating a case at the PACS workstation, specific data captured for cases maydiffer for each user or institution. General format and data elements for aDTF are detailed in Table 25.2. Included in the following sections are pro-posed specifications that should be addressed by an ideal DTF softwarepackage; the focus is on the importance of workflow integration.
DIGITAL TEACHING FILES AND EDUCATION 501
DRE25 11/16/2005 10:03 AM Page 501

PACS: A Guide to the Digi tal Revolut ion502
TABLE 25.2General Format for Digital Teaching Files
Basic data elements for a DTF (mandatory fields)a. Patient name*b. Medical record number*c. Accession numbers*d. Category
◗ Users should be permitted to develop their own tree structures forcategorizing diseases, although using some standard terminology will makeintegration with other DTF solutions easier. Note that a patient may appearmore than once, either because a disease fits 2 categories or because apatient has 2 diseases.
◗ It is important to have a different field that defines or differentiates an adultfrom a pediatric patient. Simply defining a category for pediatric radiologymay not be sufficient, because this would not divide the topics intoanatomic- or system-based categories.
◗ Some teaching file vendors fail to define a hematology/oncology category,which is important because some multisystem malignancies are notcovered in other standard categories.
e. Diagnosisf. Modalities
◗ Included in “modality” is the encoding of detailed image attributes. Formagnetic resonance, in particular, a list of pulse sequences should begenerated. Ideally, this list would be generated automatically as part of thePACS integration. The list of modalities and possible attributes mustcontinually expand to accommodate new technologies.
2. Secondary data elements (useful, but not mandatory)a. Keywords: Keywords are used to search or filter.b. User flags
◗ An arbitrary number of flags should be available to users, and these shouldbe user definable. Examples of user flags include “board review,” “followup,” or “potential AFIP [Armed Forces Institute of Pathology] case.”
c. Publication flag: To prevent duplicate publication within the medical literature.d. American College of Radiology codee. Patient genderf. Date of birth*g. Date of exam*
3. Key images: Access to the full examination should be maintained. Key imagesmay differ when a patient appears more than once in the database.
Source: Data from Branstetter BF, Siddiqui KM, Lionetti DM, Chang PJ. Defining adigital teaching file workflow: specifications for software development. J DigitImaging. 2003;16(suppl 1):37–40.* Patient identifiers may be hidden or encoded, depending on the specific use.
DRE25 11/16/2005 10:03 AM Page 502

TYPES OF TEACHING CASES
At an academic institution, there are many situations in which a physicianneeds a group of radiology studies to be stored together. Digital teachingfiles are widely discussed but are only one application of the more generic“case collection.” Case conferences, teaching conferences, tumor boards,morbidity and mortality conferences, clinical research protocols, and boardreviews are among the many uses for case collections. A complete DTF soft-ware package would focus on the needs of an institutional teaching file butbe flexible enough to accommodate other uses. The critical element that islacking in current DTF solutions is integration. Digital teaching file soft-ware requires an efficient workflow so that cases can be rapidly added to listsduring readouts, with a minimum of interruption. Familiar authoring toolsfor annotation of images can be applied later when these will have less work-flow impact. None of the current DTF solutions specifically addresses theusual academic reading room workflow, and most are not integrated with thePACS.
WORKFLOW INTEGRATION
Flagging a case for the teaching file should be an instinctive task, completelyintegrated into the workflow of the daily reading session. Flagged casesshould be assigned an owner, who should be reminded at a convenient timethat teaching file cases are available for processing. A 1-line description (e.g.,“otosclerosis vs. Paget’s”) would be useful to direct the owner to the appro-priate images while reviewing a case. The DTF database should be availableon the same machine that displays the PACS images so that interesting com-parisons and counterexamples can be used to reinforce cases during readoutand so that users can benefit from the DTF as a decision support tool.
SHARING CASES WITH COLLEAGUES
In an academic setting, the identified PACS user is often the resident in train-ing, but it is the attending radiologist who wants the cases stored. Similarly,a radiologist may find a case that would be of greater interest to a colleaguethan it is to him- or herself. It is critical that users be permitted to alertothers to an interesting case at the time the case is chosen. This is anotheraspect of workflow integration.
DIGITAL TEACHING FILES AND EDUCATION 503
DRE25 11/16/2005 10:03 AM Page 503

PRIVATE FILES
Users may wish to keep individual cases private but make the rest of theteaching file available to trainees. Such private cases might include boardreview cases, test cases, or cases pending publication. Private cases should beinterspersed with public cases within the category tree rather than relegatedto a distinct section of the database.
PUBLIC FILES
Authorized users within an institution should have full access to “public” filesfor teaching purposes. Presentation of cases may be simple (a few key images)or complex (unknown cases for case-based learning). Anonymizing cases iscritical for HIPAA compliance.
DIVISIONAL FILES
The divisional file is the digital counterpart of the conventional film-basedteaching file. Cases in the divisional file have been contributed by membersof that division for the purpose of teaching residents and fellows. Ideally,there is an individual gatekeeper from each division who verifies the qualityand legitimacy of each case and prevents excessive duplication of content.
PUBLISHED FILES
Sharing of files across institutions provides greater opportunities for residenteducation, particularly in rare diseases. Sharing files for research collabora-tion is also desirable. Cases that are available outside an institution are con-sidered “published cases.” This should not be confused with formalpublication in the medical literature.
MEDICAL IMAGE RESOURCE CENTER COMPATIBILITY
Although many different teaching file indexing schemas are available, it iscrucial that vendors and institutions adhere to a standard format for cross-compatibility and easy case querying. The RSNA MIRC project described
PACS: A Guide to the Digi tal Revolut ion504
DRE25 11/16/2005 10:03 AM Page 504

previously is currently the only schema with the potential to be a worldwidestandard for teaching file indexing and development. Any vendor DTF solu-tion should have the capacity to comply with the MIRC document schemaso that individual institutions can make anonymized public cases availablefor review to the entire radiology community when they choose to do so.
ELECTRONIC MEDICAL RECORD INTEGRATION
For a DTF system to provide a robust and crucial decision support role inday-to-day radiology practice, it is important that the system be able to com-municate with multiple databases and information systems throughout thehospital. This will enable the DTF system to notify users when the statusfor a specific case is changed or some needed information is available toupdate the case.
HOSPITAL INFORMATION SYSTEM INTEGRATION
Using the IHE profiles, DTF software should be able to query the hospitalinformation system (HIS) to obtain pathology results, laboratory results, andrelated data.
NOTIFICATION
Cases that have pending results (e.g., biopsies performed under image guid-ance) should be flagged. The system should poll for pending results on aregular basis and notify the owner of the case when results are received. Sim-ilarly, when a follow-up radiological examination is expected on an interest-ing case, the owner of the case should be notified when the follow-up imagesbecome available. The DTF system should be able to do this while keepingthe cases anonymized, without compromising the patient’s identity.
SUPPLEMENTAL IMAGES
Images from nonradiological modalities (endoscopy, pathology, or clinicalimages), as well as digitized images from outside sources (e.g., noninstitu-tional examinations), should be accepted by the DTF system. These sup-plemental digitized radiographic images may be supplied in a variety of
DIGITAL TEACHING FILES AND EDUCATION 505
DRE25 11/16/2005 10:03 AM Page 505

formats (e.g., JPEG, GIF, TIFF, PNG, MPEG, AVI) but are best convertedto a DICOM format with appropriate headers for ease of manipulation (e.g.,window and level changes, etc.).
PERSISTENCE
Some cases, such as those for teaching conferences or planning conferences,are needed for only a short time. Others, such as teaching files, require per-manent archiving. Institutions that archive old examinations must eitherexempt DTF cases from removal or make copies of the DTF cases in a sep-arate section of the PACS.
ANONYMIZATION
HEALTH INSURANCE PORTABILITY ANDACCOUNTABILITY ACT
The Health Insurance Portability and Accountability Act (HIPAA) wasdesigned to protect patient privacy by restricting access to identifiablepatient information or protected health information (PHI) for treatment,planning, or operations only. These regulations explicitly define 18 demo-graphic elements that might be used to uniquely identify a patient. Teach-ing files fall outside treatment, planning, or operations and are intended tobe viewed by large numbers of trainees; therefore, they should not containPHI. Most film-based teaching files were developed before the HIPAA reg-ulations were formulated and contain identifiable data that may render themnoncompliant. Patients should be assigned identification numbers unique tothe DTF system. Because there is often a need to obtain additional data fromthe radiology information system (RIS) or HIS at a later time, the systemmust be able to decode the unique identifier for the purpose of querying theelectronic medical record (EMR). Institutions and departments shouldspecifically address these operational issues and their countermeasures intheir local HIPAA policy. A complete description of patient care–relatedtasks and events should be in place to cover daily user interactions with thePHI for creating and updating teaching files. Some institutions requestwaivers from patients to allow the use of their PHI in teaching tasks. Thisstrategy may satisfy HIPAA compliance locally, but disclosure of the PHIoutside the covered entity may still be a HIPAA violation. In a similar
PACS: A Guide to the Digi tal Revolut ion506
DRE25 11/16/2005 10:03 AM Page 506

process, a patient could conceivably sign away rights to privacy and PHIsecurity and allow his or her studies to be shared over the Internet.
EXEMPTIONS
Some case collections, such as those for treatment planning conferences, maybe exempt from anonymization so that clinicians can appropriately care forpatients. Such collections should have limited persistence in the DTF data-base or be de-identified after a certain time period.
DEPTH
Some teaching files are thoroughly researched and include discussions ofclinical presentation, lengthy differentials, and literature references. Butsometimes the user needs only a pointer to find the case for future refer-ence. The clinical information present in the different types of teaching filedocuments can be categorized as follows:
LIST
The list is a quick pointer to the case, with fields for diagnosis and keywords.No images are needed, and no annotation is performed.
KEY IMAGE
In this case, a few key images are selected. There may be annotation on thoseimages, but no lengthy prose is associated. These are useful for quick exam-ples to demonstrate a point during teaching rounds.
FULL DIGITAL TEACHING FILE
Complete teaching cases with images, history, findings, differential diagno-sis, final diagnosis, discussion, and references are a staple of teaching insti-tutions. The DTF software should support links to related teaching file casesor to Internet references.
DIGITAL TEACHING FILES AND EDUCATION 507
DRE25 11/16/2005 10:03 AM Page 507
QUALITY ASSURANCE
AUTHORIZATION
Full DTF cases should undergo review by a subspecialist before inclusion inthe formal institutional teaching file. A division might allow any member tosponsor a teaching file or might assign a single individual to act as a gate-keeper. Robust review and notification tools are necessary to ensure thatteaching file cases are reviewed in a timely manner upon submission.
PEER REVIEW
More than 1 expert may vouch for the quality of a single case. Secure track-ing of cross-institutional peer review would allow users to assess the qualityand accuracy of a published case.
USER REVIEW
Accuracy of material is not the only measure of the quality of a teaching case.Users should be able to rate the teaching quality of the case presentation.
The validity of the averaged results may be questionable, but this givesusers further guidance when sifting through the myriad of cases that mayeventually be available over the Internet.
AUTHORING TOOLS
INTEGRATION
Authoring tools need not be fully integrated into the PACS. When the PACSallows a case to be flagged for later processing, that processing can be per-formed at another site (back in the office or in the residents’ lounge) bypassing the information for the flagged case to the enterprise-wide, Web-based PACS viewer. This keeps high-end PACS resources free for readouts.
THIN AND THICK CLIENTS
Web-based thin clients have the advantage of universal availability and wouldbe useful if users are expected to author cases from outside the institution.
PACS: A Guide to the Digi tal Revolut ion508
DRE25 11/16/2005 10:03 AM Page 508

Thin-client applications do not require a great deal of processing power andcan be installed on almost any PC. A Web browser–based client eliminatesthe need to install the DTF application on various computers, because it canbe accessed from anywhere using a standard Web browser. However, thick-client applications require much more processing power and therefore areavailable only at specialized workstations or beefed-up PCs. They mayprovide more robust and advanced image-processing tools and may be thepreferred solution within an institution, although thin-client applications canprovide equally robust tools.
IMAGE ANNOTATION
Original image data, without demographic or image attribute text, should bestored in the DTF. Annotations should be stored in a separate layer (orlayers), so that they may be hidden during self-tests or teaching conferences.Vector encoding of annotations is generally more compact than raster encod-ing. Possible annotations should include at least key image ordering (the order in which images should be presented), arrows, circles, text, andmeasurements.
USER ROLES
TRAINEE
The turnover among trainees is high, and they are expected to create casesunder the supervision of an attending imaging specialist. The attending canthen take ownership of the case when the trainee leaves. Although thiscreates a small additional workload for the sponsoring attending at the timethe case is created, it prevents interesting cases from being lost when thetrainee leaves for another institution.
ATTENDING
Attending or staff radiologists have the highest level of access. This level ofaccess may not be needed for individuals outside the radiology department,unless the DTF system also provides case storage solutions for other depart-ments, such as cardiology, dermatology, or pathology. Departmental policy
DIGITAL TEACHING FILES AND EDUCATION 509
DRE25 11/16/2005 10:03 AM Page 509

should govern the cases that are left behind when an attending leaves theinstitution.
RESEARCHERS
Researchers may make anonymous patient lists by utilizing a teaching filesystem as a research file system for a research project or clinical trials, butthese cases should have a limited persistence that is directly related to theexpected length of the research project. Appropriate institutional researchboard (IRB) consent should be secured before creating any list for researchpurposes.
POST-PROCESSING
CASE COLLECTIONS
Users should be able to conveniently group cases for teaching conferencesor lecture preparation. These groupings can cross the boundaries of the category tree structure. Boolean searches incorporating keyword, diagnosis,American College of Radiology code, and/or user-defined fields are needed.
PRESENTATION TOOLS
The DTF software should provide tools to efficiently create case-basedexams, assign teaching file creation (e.g., case of the week), and present casesin a classroom or conference setting. If these tools are Web based, they willbe available throughout the institution and should obviate the need to handcarry media or hardware. Users, particularly medical students and residents,should be able to request full DTF cases from a given category to be pre-sented as unknowns for the purpose of self-testing.
PUBLISH TO PRESENTATION SOFTWARE
Integration with established presentation software would allow a user to take,for example, all the key images from a case collection and send them intoMicrosoft PowerPoint (Microsoft Corporation, Redmond, Wash.) in a com-patible image format, 1 image per slide, preserving annotation.
PACS: A Guide to the Digi tal Revolut ion510
DRE25 11/16/2005 10:03 AM Page 510

BURN A CD
The DTF solution should have the ability to quickly store case collectionson CDs, either as key images only or as entire studies. A simple case viewershould also be burned on each CD for portability.
Maintaining an active teaching file is a requirement for the accredita-tion of radiology residency programs. Academic institutions should considerthe importance of integrated teaching file software when choosing a PACSvendor. In the future, institutions should demand that vendors provide con-formance with the IHE teaching file information export profile. The pro-posed software specifications for digital teaching files may be helpful toprogrammers and PACS vendors in understanding the functionality neededfor DTFs in academic practice. The importance of workflow analysis andintegration cannot be overemphasized.
IMAGING INFORMATICS EDUCATION
If one searches for the meaning of medical informatics, a number of diver-gent and confusing definitions can be found. One definition states thatmedical informatics is an emerging discipline focusing on the study, inven-tion, and implementation of structures and algorithms to improve commu-nication, understanding, and management of medical information. The endobjective is the coalescing of data, knowledge, and the tools necessary toapply such data in the medical decision-making process. Another definitiondescribes medical informatics as an evolving scientific discipline that dealswith the collection, storage, retrieval, communication, and optimal use ofhealth-related data, information, and knowledge. In the end, the commondenominators in most definitions are information management and tech-nology, which are at the core of informatics. For the imaging community,information management relates to medical images and extends to themanner in which imaging data are acquired, stored, distributed, interpreted,and communicated. Hence, the field of imaging informatics could be definedas being concerned with “management of information from the point atwhich a physician decides to order an imaging study to the point at whichan informed interpretation of the results of that study are delivered back tothe physician.” An imaging informatician is an individual who bridges theknowledge and communication gaps among radiologists, physicists, and ITpersonnel. Although such a skill is not listed in most job descriptions forradiologists, it is becoming more and more important as imaging depart-ments transition from film-based to filmless imaging, adopt and integrate
DIGITAL TEACHING FILES AND EDUCATION 511
DRE25 11/16/2005 10:03 AM Page 511
PACS with the HIS and RIS, and add new modalities that rely heavily on IT.
EVOLUTION OF IMAGING INFORMATICS AS A RADIOLOGY SUBSPECIALTY
Advantages that occur when 2 different institutions merge to form a newentity can result in much more rapid change over a given period of time thancan be achieved by a single entity. When different scientific disciplinesborrow from one another and combine to form a new specialty, this can alsoresult in dramatic advances in a relatively short period of time.
From its origins in mathematics and military ballistics, digital technol-ogy has evolved to become an integral part of endeavors as diverse as com-munication, commerce, entertainment, and medicine. The field of computerscience continues to evolve into a wide variety of subspecialties. It is becom-ing increasingly evident that just as amalgamation between the field of med-icine and the study of the physics of the x-ray resulted in the field ofradiology, the union between radiology and IT is resulting in a new specialty:imaging informatics.
This emerging subspecialty has practical applications that transcend thetraditional modality/anatomic-based radiology subspecialties. As medicalimaging undergoes a paradigm shift from traditional film-based to filmlessoperation, many of the traditional concepts of medical imaging becomeobsolete. The fundamental processes of image acquisition, display, storage,distribution, interpretation, and reporting undergo fundamental change with the implementation of digital imaging, PACS, advanced image pro-cessing, decision support tools, speech recognition, and structured report-ing. With accompanying changes in image acquisition, larger and morecomplex imaging datasets are being created that bring new challenges forradiologists. One obvious example is the widespread adoption of multi-detector computed tomography (CT), which has increased the number ofindividual CT images by 3- to 6-fold for routine studies. The radiologistwho continues to review and interpret these imaging datasets in the con-ventional tile mode format will quickly become overwhelmed. Such chal-lenges transcend all modalities, anatomic regions, and imagingsubspecialties. The angiographer must cope with complex CT and magneticresonance (MR) angiography, the breast imager with digital mammographyand computer-assisted diagnosis (CAD) software, the oncologic imaging spe-cialist with positron emission tomography (PET)/CT fusion datasets, and
PACS: A Guide to the Digi tal Revolut ion512
DRE25 11/16/2005 10:03 AM Page 512

the chest specialist with dual-energy subtraction and tomosynthesis. Thefield of imaging informatics can address many of these challenges that tran-scend the various imaging subspecialties.
LATENT POWER OF IMAGING INFORMATICS
“Information is power,” according to an old adage, but in the case of theradiology community, where do we go to acquire the information we willneed to maintain power? With these new computer-based applications, manytraditional concepts of image acquisition, archiving, interpretation, andreporting will disappear. If we are to maintain our power and role as medicalimaging experts, we need to learn how technology and information man-agement define the digital imaging practice. To accomplish this task, in-depth training is required and should begin during residency. Ironically, fewif any radiology residency programs offer formal imaging informatics train-ing, resulting in a distinct knowledge void among new radiology residencygraduates. This is particularly detrimental in the private practice radiologycommunity, which often relies on the most recently trained radiologists aschampions of new technologies.
While some in the private practice radiologist community are lament-ing their relative lack of expertise in imaging informatics, academic radiol-ogy is not far behind. Academic radiology has long been the bastion ofradiology “purists,” who define and set the standard of practice for the radi-ology community at large. When new modalities or applications are adopted,it is representatives from these academic programs who define how thesenew applications will become incorporated into everyday practice. Thisincludes such mundane aspects as the establishment of exam protocols andindications and extends into broader areas, such as radiologist education andcertification. Traditionally, these academic challenges have been assigned tothe various modality and anatomic-based subspecialists within the academicranks. When a new modality, such as magnetic resonance imaging (MRI), isintroduced, a new breed of subspecialists is born from within the existingacademic ranks. By the very nature of being an early adopter of this newtechnology and performing the pioneering research in its use, these acade-micians define the new subspecialty and serve as benefactors to the radiolo-gist community at large.
The problem with imaging informatics is that research and educationhave not kept up with either the speed of development or the rapid imple-
DIGITAL TEACHING FILES AND EDUCATION 513
DRE25 11/16/2005 10:03 AM Page 513

mentation of the technology. Modality vendors market and sell multidetec-tor CT scanners, for example, to customers who have almost no under-standing of the fundamental change in the application and the challengesthat will inevitably result. To date, little if any research has been performedto identify best-practice guidelines for this technology as it relates to optimalimaging plane, slice thickness, compression algorithm, or default display—essential elements in interpretation quality and effective workflow. The samevendors that sell these scanners also offer the same customers elaborateadvanced image-processing workstations, but in many cases this only adds alayer of confusing options to the review/interpretation dilemma. Who is the responsible party for image processing and reconstruction? Is this the role of the technologist or radiologist? How can decision support soft-ware be incorporated into the process to facilitate improved diagnosis andworkflow? Appropriate research has not been performed to answer thesebasic questions, and the result is that many imaging practitioners have expensive, data-intensive technologies but little understanding of theiroptimal use.
The same challenges within the imaging departments also extendthroughout the filmless/paperless medical enterprise. With the implementa-tion of the EMR and telemedicine, new challenges exist in terms of patientconfidentiality, data security, and best-practice standards. These clinicalissues go beyond the expertise and training of IT staff and must largely restin the hands of medical experts. What other medical group is better equippedto address these challenges than radiologists? The key, of course, is to ensurethat the radiologist community is well educated in all aspects of imaginginformatics and takes a proactive role in related research.
MAKING THE CASE FOR INFORMATICS RESEARCH
The good news, however, is that nature abhors a vacuum, which createsunlimited opportunity for the willing (and naive). Residents and fellows intraining have the unique opportunity to quickly become experts in this bur-geoning discipline. A number of important research opportunities exist withgreat relevance and potential significance to the radiology community atlarge.
To date, the relative lack of awareness of imaging informatics withinthe radiology community has extended to radiology residents, whose role is to become the thought leaders of the profession in the near future. It is
PACS: A Guide to the Digi tal Revolut ion514
DRE25 11/16/2005 10:03 AM Page 514

therefore critical that radiologists in training understand the clinical, eco-nomic, and political importance of this emerging subspecialty. To accom-plish this, imaging informatics education and research must be prioritizedwithin academic radiology programs. Imaging informatics research has thedual role of legitimizing the subspecialty as well as solidifying its place withinthe radiology domain. An intimate synergy exists between technology andresearch within radiology. Whoever controls the research controls the tech-nology. And whoever controls the technology can dictate its clinical appli-cation. In the past, other medical specialties have effectively seized controlof imaging technologies by co-opting research applications. One examplecan be seen in cardiac angiography and echocardiography, which were oncethe domain of the radiologist and are now firmly under the control of thecardiologist. It is therefore imperative that all radiologists, especially thosein training, understand the long-term implications of what is at stake andthe tremendous potential for those who embrace the challenges that lieahead.
The best method to inform and create understanding of imaging infor-matics is to educate as many participants in the field as possible. Imaginginformatics must become an integral part of resident education, and institu-tions and radiology departments must modify radiology residency curriculato incorporate informatics education. A suitable curriculum would describethe expected training issues through a 4-year radiology residency. Knowl-edge and experience should be imparted through didactic lectures, informalreview of topics during reading sessions, review of journal articles, outsideconferences, and self-study programs. Many informatics topics overlapdirectly with physics instruction and other imaging subspecialties, wheremodifications to existing curricula should be considered. Included here is asample 4-year imaging informatics curriculum currently in place in the radi-ology department at Geisinger Medical Center (Danville, Penn.) (Table25.3). This curriculum adheres to the ACGME guidelines for dividing thecourse of study to cover patient care, medical knowledge, practice-basedlearning and improvement, interpersonal and communication skills, profes-sionalism, and systems-based practice.
This outline is designed to provide guidance for development of infor-matics curricula as they relate to resident education. More detailed trainingis needed when a professional chooses imaging informatics as a career. Thecurriculum for such training should incorporate more detailed understand-ing of digital imaging technologies as well as computer sciences. Multipleadvanced fellowship programs are available to provide such training, and alist of current imaging informatics training programs is available on the Website for the Society for Computer Applications in Radiology.
DIGITAL TEACHING FILES AND EDUCATION 515
DRE25 11/16/2005 10:03 AM Page 515

PACS: A Guide to the Digi tal Revolut ion516
TABLE 25.3Outline of Informatics Curriculum for Radiology Resident Education
First Year of TrainingThe resident entering the first year of residency should be encouraged to develop atleast moderate general computer skills. Unlike clinical skills, the basic use of PACS,dictation, and information systems software can be performed without in-depthknowledge of structure and function. Because the use of these systems is essentialfor clinical tasks, the first-year curriculum should focus on practical use issues.
Patient CareBasic use of the PACS workstationPatient worklist functionalityKnowledge and use of RIS and HIS user interface
Medical KnowledgeInstructions on basic physics of MR, CT, general radiography, ultrasound, andnuclear medicine should be given and coordinated with the physics curriculum
Practice-Based Learning and ImprovementUse of the Internet as a decision support tool to search for knowledge from existingonline education resources
Interpersonal and Communication SkillsElectronic communication skills, including personal and group e-mailBasic instructions in use of Microsoft WordPreparing and using PowerPoint for presentationsClinical use of digital dictation, speech recognition, and structured reportingConcise, meaningful, and accurate reporting of radiology findings
ProfessionalismPatient privacy issues as they relate to electronic dataEthical use of downloads
System-Based PracticeUse of RIS for accessing patient dataUse of HIS for accessing clinical information, messaging, patient orders, andprogress notes
DRE25 11/16/2005 10:03 AM Page 516
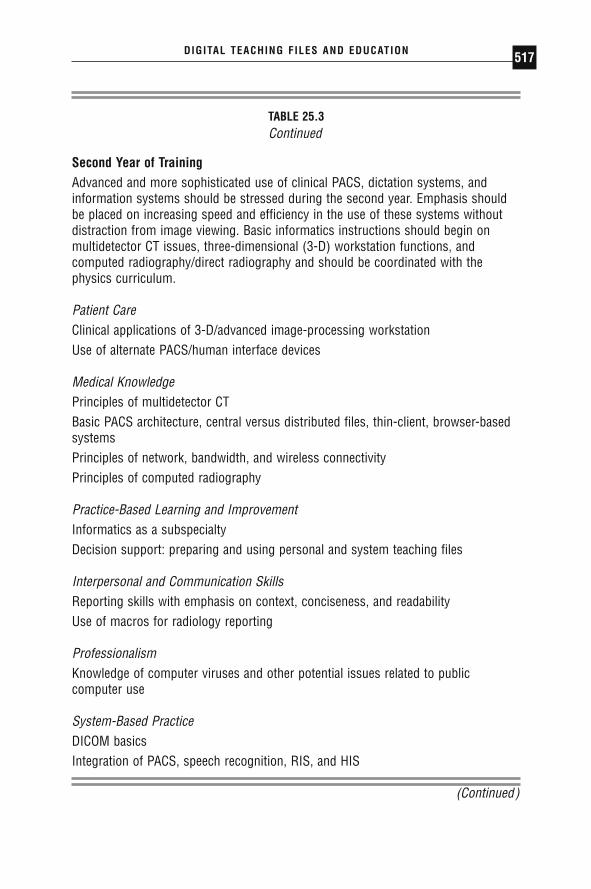
DIGITAL TEACHING FILES AND EDUCATION 517
TABLE 25.3Continued
Second Year of TrainingAdvanced and more sophisticated use of clinical PACS, dictation systems, andinformation systems should be stressed during the second year. Emphasis shouldbe placed on increasing speed and efficiency in the use of these systems withoutdistraction from image viewing. Basic informatics instructions should begin onmultidetector CT issues, three-dimensional (3-D) workstation functions, andcomputed radiography/direct radiography and should be coordinated with thephysics curriculum.
Patient CareClinical applications of 3-D/advanced image-processing workstationUse of alternate PACS/human interface devices
Medical KnowledgePrinciples of multidetector CTBasic PACS architecture, central versus distributed files, thin-client, browser-basedsystemsPrinciples of network, bandwidth, and wireless connectivityPrinciples of computed radiography
Practice-Based Learning and ImprovementInformatics as a subspecialtyDecision support: preparing and using personal and system teaching files
Interpersonal and Communication SkillsReporting skills with emphasis on context, conciseness, and readabilityUse of macros for radiology reporting
ProfessionalismKnowledge of computer viruses and other potential issues related to publiccomputer use
System-Based PracticeDICOM basicsIntegration of PACS, speech recognition, RIS, and HIS
(Continued)
DRE25 11/16/2005 10:03 AM Page 517
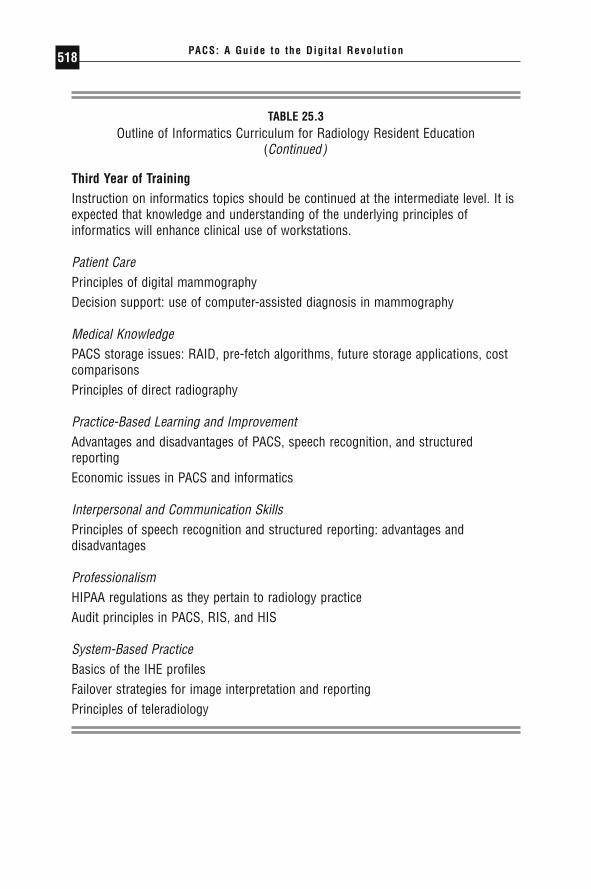
PACS: A Guide to the Digi tal Revolut ion518
TABLE 25.3Outline of Informatics Curriculum for Radiology Resident Education
(Continued)
Third Year of TrainingInstruction on informatics topics should be continued at the intermediate level. It isexpected that knowledge and understanding of the underlying principles ofinformatics will enhance clinical use of workstations.
Patient CarePrinciples of digital mammographyDecision support: use of computer-assisted diagnosis in mammography
Medical KnowledgePACS storage issues: RAID, pre-fetch algorithms, future storage applications, costcomparisonsPrinciples of direct radiography
Practice-Based Learning and ImprovementAdvantages and disadvantages of PACS, speech recognition, and structuredreportingEconomic issues in PACS and informatics
Interpersonal and Communication SkillsPrinciples of speech recognition and structured reporting: advantages anddisadvantages
ProfessionalismHIPAA regulations as they pertain to radiology practiceAudit principles in PACS, RIS, and HIS
System-Based PracticeBasics of the IHE profilesFailover strategies for image interpretation and reportingPrinciples of teleradiology
DRE25 11/16/2005 10:03 AM Page 518
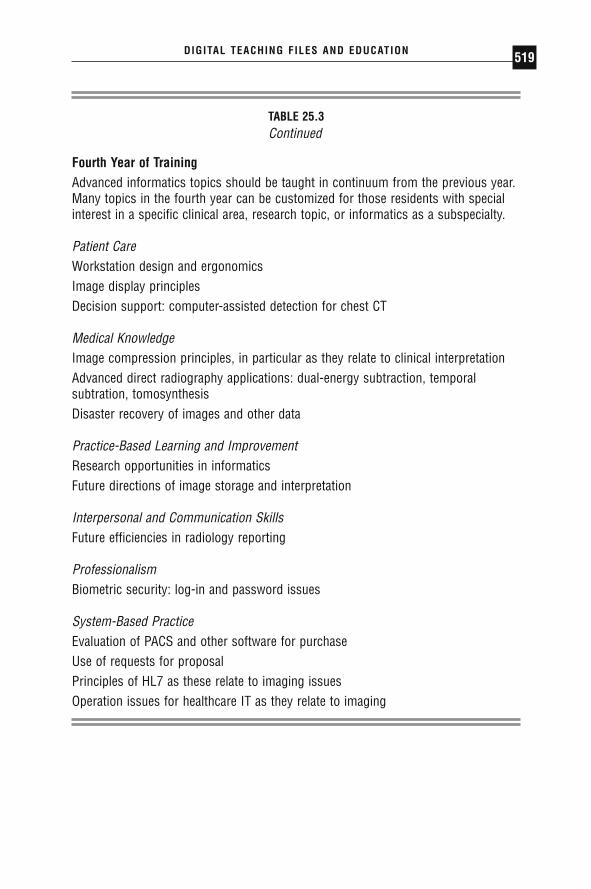
DIGITAL TEACHING FILES AND EDUCATION 519
TABLE 25.3Continued
Fourth Year of TrainingAdvanced informatics topics should be taught in continuum from the previous year.Many topics in the fourth year can be customized for those residents with specialinterest in a specific clinical area, research topic, or informatics as a subspecialty.
Patient CareWorkstation design and ergonomicsImage display principlesDecision support: computer-assisted detection for chest CT
Medical KnowledgeImage compression principles, in particular as they relate to clinical interpretationAdvanced direct radiography applications: dual-energy subtraction, temporalsubtration, tomosynthesisDisaster recovery of images and other data
Practice-Based Learning and ImprovementResearch opportunities in informaticsFuture directions of image storage and interpretation
Interpersonal and Communication SkillsFuture efficiencies in radiology reporting
ProfessionalismBiometric security: log-in and password issues
System-Based PracticeEvaluation of PACS and other software for purchaseUse of requests for proposalPrinciples of HL7 as these relate to imaging issuesOperation issues for healthcare IT as they relate to imaging
DRE25 11/16/2005 10:03 AM Page 519

CONCLUSION
Imaging practitioners today are faced with the important task of making crit-ical decisions concerning technology implementation and integration, radi-ologist workflow, imaging economics, and standards for quality and security.Demands for imaging services are at an all-time high, and the supply of qual-ified radiologists cannot keep up. The common denominator to addressingthese needs is technology, which provides radiologists with an opportunityto improve quality, timeliness, and security of services. Unfortunately, tech-nology is a double-edged sword. It must be used judiciously to succeed inmaximizing potential benefit, but if used inappropriately might actually bedeleterious.
Although radiology has always been technology driven, many of thenew digital applications in medicine go beyond the experience and expert-ise of practicing radiologists. If radiology is to maintain a technology lead-ership role within the medical enterprise, additional computer-based trainingand expertise are required. New technologies will play an important role infuture radiology practice and will require dedicated research to enhance inte-gration and application of information technologies within the clinicalimaging practice. This provides the foundation for imaging informatics as anew and uniting radiology subspecialty.
◗ REFERENCES
Bartholmai BJ, Erickson BJ, Hartman TE, et al. The electronic imaging technologyspecialist: the role of a new radiology subspecialty for the 21st century. J DigitImaging. 2002;15(suppl 1):184–188.
Bernardini A, Alonzi M, Campioni P, Vecchioli A, Marano P. IHE: Integrating theHealthcare Enterprise, towards complete integration of healthcare informationsystems. Rays. 2003;28:83–93.
Bramble JM, Insana MF, Dwyer SJ 3rd. Information retrieval for teaching files: apreliminary study. J Digit Imaging. 1990;3:164–169.
Branstetter BF, Siddiqui KM, Lionetti DM, Chang PJ. Defining a digital teachingfile workflow: specifications for software development. J Digit Imaging. 2003;16:37–40.
Carr CD, Moore SM. IHE: a model for driving adoption of standards. Comput MedImaging Graph. 2003;27:137–146.
Channin DS. Integrating the healthcare enterprise: a primer. Part 6: the fellowshipof IHE: year 4 additions and extensions. Radiographics. 2002;22:1555–1560.
PACS: A Guide to the Digi tal Revolut ion520
DRE25 11/16/2005 10:03 AM Page 520

Chronaki CE, Zabulis X, Orphanoudakis SC. I2Cnet medical image annotationservice. Med Inform (Lond). 1997;22:337–347.
Flanders AE, Carrino JA. Understanding DICOM and IHE. Semin Roentgenol.2003;38:270–281.
Goldberg DJ, DeMarco JK, Parikh T. Internet-based interactive teaching file forneuroradiology. AJR Am J Roentgenol. 2000;175:1371–1373.
Halsted MJ, Perry LA, Cripe TP, et al. Improving patient care: the use of a digitalteaching file to enhance clinicians’ access to the intellectual capital of inter-departmental conferences. AJR Am J Roentgenol. 2004;182:307–309.
Health Informatics in New Zealand. Available at: http://www.hinz.org.nz. AccessedJuly 15, 2004.
Henderson B, Camorlinga S, DeGagne JC. A cost-effective Web-based teaching filesystem. J Digit Imaging. 2004;17:87–91.
IHE (Integrating the Healthcare Enterprise). Available at: http://www.rsna.org/ihe/.Accessed July 15, 2004.
IHE integration profiles: guidelines for buyers. Radiol Manage. 2001;23:37–40.Khorasani R, Lester JM, Davis SD, et al. Web-based digital radiology teaching file:
facilitating case input at time of interpretation. AJR Am J Roentgenol. 1998;170:1165–1167.
Lim CC, Yang GL, Nowinski WL, Hui F. Medical Image Resource Center—makingelectronic teaching files from PACS. J Digit Imaging. 2003;16:331–336.
Macura KJ, Macura RT, Morstad BD. Digital case library: a resource for teaching,learning, and diagnosis support in radiology. Radiographics. 1995;15:155–164.
Markivee CR. Automated filing of “teaching” radiographs under the ACR Index ofRoentgen Diagnosis. AJR Am J Roentgenol. 1990;154:659.
Nagy P, Leblanc DA, Bartholmai B, Branstetter BF, Siddiqui KM. The Web Warrior’s Workshop. 2004. Available at: http://www.scarnet.net/2004presentations.html/. Accessed July 15, 2004.
Piraino D, Recht M, Richmond B. Implementation of an electronic teaching fileusing Web technology. J Digit Imaging. 1997;10:190–192.
Radiological Society of North America. MIRC committee publications. 2004. Avail-able at: http://www.rsna.org/mirc/index.html. Accessed July 15, 2004.
Radiological Society of North America (RSNA). MIRC documentation index. 2004.Available at: http://mirc.rsna.org/mircstorage/documents/documentation/MIRCdocumentationindex.xml. Accessed July 15, 2004.
Radiological Society of North America. MIRC Web site. 2004. Available at:http://mirc.rsna.org/. Accessed July 15, 2004.
Reiner B. Introduction: researching the impact of information technologies on radi-ology technologists: “taking it to the streets.” J Digit Imaging. 2002;15:118–120.
Rode D. Understanding HIPAA transactions and code sets. J AHIMA. 2001;72:42–49.
DIGITAL TEACHING FILES AND EDUCATION 521
DRE25 11/16/2005 10:03 AM Page 521

Rodriguez TA. HIPAA privacy regulations clarified: let calm prevail. J Med PractManage. 2003;19:61–66.
Rosset A, Muller H, Martins M, Dfouni N, Vallee JP, Ratib O. Casimage project: adigital teaching files authoring environment. J Thorac Imaging. 2004;19:103–108.
Rosset A, Ratib O, Geissbuhler A, Vallee JP. Integration of a multimedia teachingand reference database in a PACS environment. Radiographics. 2002;22:1567–1577.
Seshadri SB, Arenson RL. The impact of PACS on research and education. Int JBiomed Comput. 1992;30:263–266.
Seshadri SB, Arenson R, Khalsa S, Brikman I, Voorde F. Prototype Medical ImageManagement System (MIMS) at the University of Pennsylvania: software designconsiderations. J Digit Imaging. 2003;16:96–102.
Siddiqui KM. A practical guide to planning and implementing privacy and securitysystems. In: Dwyer SJ III, Reiner BI, Siegel EL, eds. Security Issues in the DigitalMedical Environment. 2nd ed. Great Falls, VA: Society for Computer Applica-tions in Radiology; 2004:49–58.
Siegel E, Reiner B. Electronic teaching files: seven-year experience using a com-mercial picture archiving and communication system. J Digit Imaging. 2001;14:125–127.
Siegel EL, Reiner BI, Siddiqui KM. Clinical impact of security on radiology. In:Dwyer SJ III, Reiner BI, Siegel EL, eds. Security Issues in the Digital Medical Envi-ronment. 2nd ed. Great Falls, VA: Society for Computer Applications in Radi-ology; 2004:1–8.
Siegel EL, Diaconis JN, Pomerantz S, Allman R, Briscoe B. Making filmless radiology work. J Digit Imaging. 1995;8:151–155.
Siegel EL, Perry J, Langlotz C, Reiner BI, Siddiqui KM. The RSNA’s MIRC andRadLex initiatives: 2004 update. 2004. Paper presented at: 21st Meeting of theSociety for Computer Applications in Radiology; May 2004; Vancouver, BritishColumbia, Canada.
Sinha S, Sinha U, Kangarloo H, Huang HK. A PACS-based interactive teachingmodule for radiologic sciences. AJR Am J Roentgenol. 1992;159:199–205.
Society for Computer Applications in Radiology. Radiology Informatics FellowshipList. 2004. Available at: http://www.scarnet.net/residents/Fellowshiplist.html.Accessed July 15, 2004.
Vanderbilt University Medical Center. What is Biomedical Informatics? Available at:http://www.mc.vanderbilt.edu/dbmi/informatics.html. Accessed July 15, 2004.
Weiss DL, Siddiqui KM, Scopelliti J. Radiology residency informatics curriculum:incorporating the six general competencies of the ACGME. 2004. Paper pre-sented at: Radiological Society of North America 90th Scientific Assembly andAnnual Meeting; November 28–December 3, 2004; Chicago, Ill.
PACS: A Guide to the Digi tal Revolut ion522
DRE25 11/16/2005 10:03 AM Page 522

TELERADIOLOGY
GILES BOLAND • JONATHAN T. SCHLAKMAN •JAMES H. THRALL
The conversion from analog to digital methods in the medical imagingworld and the emergence of widely available mechanisms to quickly and
affordably transmit digital data over large distances have fueled the rapidgrowth of teleradiology. In modern radiology departments in both the aca-demic and private sectors it has become commonplace to select the locationof a fully functioning picture and archiving communications system (PACS)workstation based on manpower and workflow considerations rather thanproximity to the site of image acquisition. In addition, affordable scaled-down teleradiology solutions have allowed referring physicians and radiolo-gists to access imaging from the convenience of their homes and offices.
This chapter summarizes some of the key issues in image acquisition,transmission, and interpretation. These summaries are followed by a dis-cussion of the clinical practice of teleradiology, sharing knowledge gainedfrom practical experience that can be useful in helping a teleradiologyprogram meet its full potential. Diagrams of a typical teleradiology systemare shown in Figures 26.1 and 26.2.
26CHAPTER
DRE26 11/16/2005 10:04 AM Page 523

IMAGE ACQUISITION AND IMAGE DIGITIZATION
Although any type of medical image may be transmitted by teleradiology, allimages must be in a digital form before transmission can occur. Conven-tional hardcopy images from any modality can be digitized by special high-
PACS: A Guide to the Digi tal Revolut ion524
FIGURE 26.1
Schematic diagram of different approaches to image acquisiton inteleradiology.
FIGURE 26.2
Schematic layout of a teleradiology interpretation site.
DRE26 11/16/2005 10:04 AM Page 524

resolution laser or charge-coupled device (CCD) scanners (Figure 26.1).Simplistically, film scanners for teleradiology function similarly to faxmachines by scanning analog data and converting it into digital form.Charge-coupled device scanners using the same technology as video camerashave tiny photocells that acquire data from a transilluminated film. Laserscanners offer better signal-to-noise ratios than CCD scanners, leading tosuperior contrast resolution. They are, however, more expensive. Additionalstudies are required to determine whether the superior contrast resolutionoffered by laser scanners is diagnostically significant.
Another alternative to image digitization of hardcopy films is the useof a video camera to view a film on a light box. The analog video signal canthen be converted into a digital format. This approach was very common inthe early days of teleradiology but has been largely abandoned due to inad-equate image quality.
Many images are inherently digital: computed tomography, magneticresonance, ultrasound, nuclear medicine, computed radiography, digitalradiography, and digital fluoroscopy. All can be directly linked to a teleradi-ology system if they are in a standard format (Figure 26.1). Fortunately, moreand more imaging devices are complying with the ACR-NEMA (AmericanCollege of Radiology and National Electrical Manufacturers Association)DICOM 3 standard (Digital Imaging and Communications in Medicine—version 3). The DICOM 3 standard is important to teleradiology because adirect digital connection can be made from the image source to the tele-radiology server and then from the teleradiology-receiving computer to adiagnostic workstation. Furthermore, DICOM 3 offers no loss of the full12-bit dataset (2056 grayscales) generated from digitally acquired images,exhibits no image degradation, and has full capability to adjust image windowand level settings. The DICOM 3 standard is a great step forward, althoughimplementation of the standard is still not uniform. Some manufacturers maybe DICOM compliant, but the standard allows enough flexibility that imple-mentations can vary from one manufacturer to another. However, theseincompatibilities are usually resolved with the cooperation of the respectivevendors.
In practice, many digitally acquired images cannot be directly linked toteleradiology systems because they are acquired on older equipment that isnot DICOM compliant. Different manufacturers of imaging equipment his-torically used proprietary file formats and communications protocols, whichprevent direct interfacing to communications networks. These digitallyacquired data need to be converted into the standard DICOM 3 formatbefore image transmission can occur (Figure 26.1).
TELERADIOLOGY 525
DRE26 11/16/2005 10:04 AM Page 525
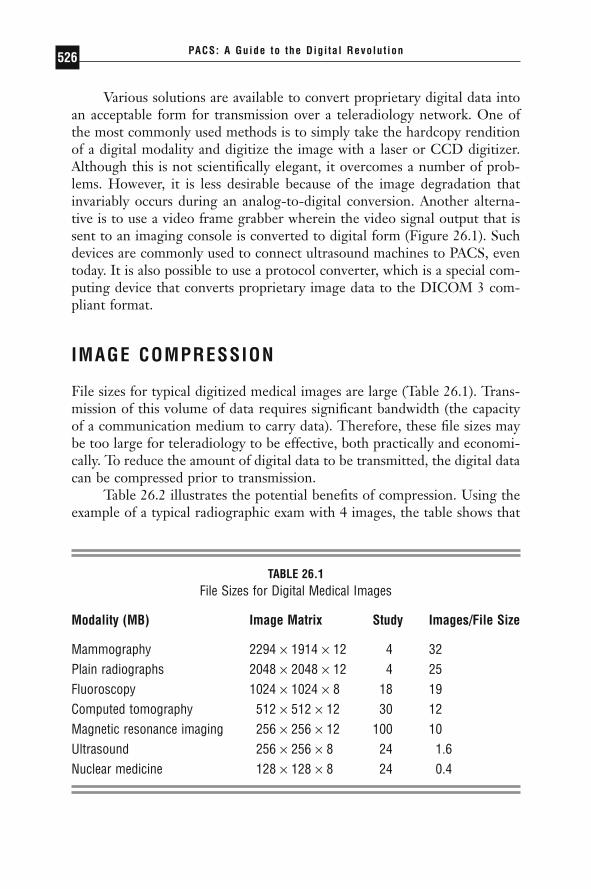
Various solutions are available to convert proprietary digital data intoan acceptable form for transmission over a teleradiology network. One ofthe most commonly used methods is to simply take the hardcopy renditionof a digital modality and digitize the image with a laser or CCD digitizer.Although this is not scientifically elegant, it overcomes a number of prob-lems. However, it is less desirable because of the image degradation thatinvariably occurs during an analog-to-digital conversion. Another alterna-tive is to use a video frame grabber wherein the video signal output that issent to an imaging console is converted to digital form (Figure 26.1). Suchdevices are commonly used to connect ultrasound machines to PACS, eventoday. It is also possible to use a protocol converter, which is a special com-puting device that converts proprietary image data to the DICOM 3 com-pliant format.
IMAGE COMPRESSION
File sizes for typical digitized medical images are large (Table 26.1). Trans-mission of this volume of data requires significant bandwidth (the capacityof a communication medium to carry data). Therefore, these file sizes maybe too large for teleradiology to be effective, both practically and economi-cally. To reduce the amount of digital data to be transmitted, the digital datacan be compressed prior to transmission.
Table 26.2 illustrates the potential benefits of compression. Using theexample of a typical radiographic exam with 4 images, the table shows that
PACS: A Guide to the Digi tal Revolut ion526
TABLE 26.1File Sizes for Digital Medical Images
Modality (MB) Image Matrix Study Images/File Size
Mammography 2294 ¥ 1914 ¥ 12 4 32Plain radiographs 2048 ¥ 2048 ¥ 12 4 25Fluoroscopy 1024 ¥ 1024 ¥ 8 18 19Computed tomography 512 ¥ 512 ¥ 12 30 12Magnetic resonance imaging 256 ¥ 256 ¥ 12 100 10Ultrasound 256 ¥ 256 ¥ 8 24 1.6Nuclear medicine 128 ¥ 128 ¥ 8 24 0.4
DRE26 11/16/2005 10:04 AM Page 526
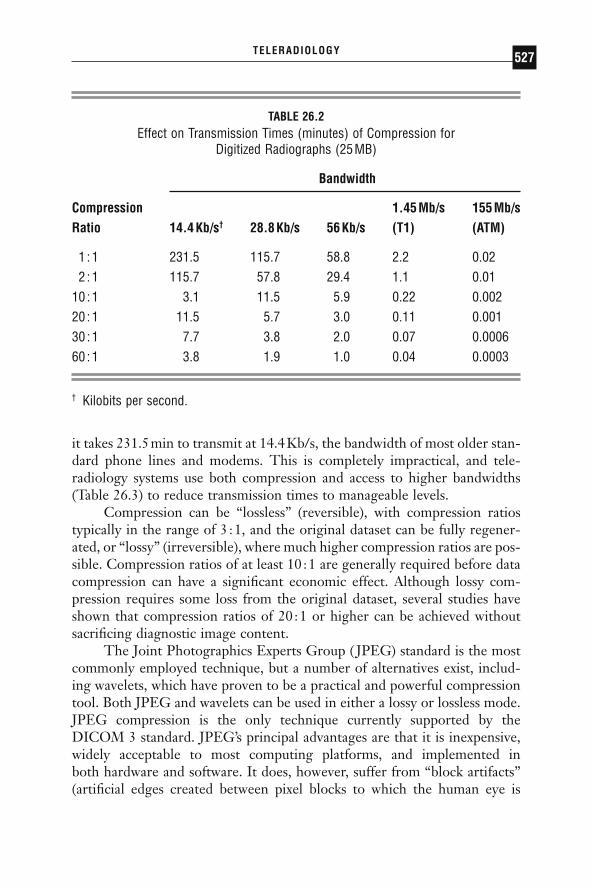
it takes 231.5min to transmit at 14.4Kb/s, the bandwidth of most older stan-dard phone lines and modems. This is completely impractical, and tele-radiology systems use both compression and access to higher bandwidths(Table 26.3) to reduce transmission times to manageable levels.
Compression can be “lossless” (reversible), with compression ratiostypically in the range of 3 :1, and the original dataset can be fully regener-ated, or “lossy” (irreversible), where much higher compression ratios are pos-sible. Compression ratios of at least 10 :1 are generally required before datacompression can have a significant economic effect. Although lossy com-pression requires some loss from the original dataset, several studies haveshown that compression ratios of 20 :1 or higher can be achieved withoutsacrificing diagnostic image content.
The Joint Photographics Experts Group ( JPEG) standard is the mostcommonly employed technique, but a number of alternatives exist, includ-ing wavelets, which have proven to be a practical and powerful compressiontool. Both JPEG and wavelets can be used in either a lossy or lossless mode.JPEG compression is the only technique currently supported by theDICOM 3 standard. JPEG’s principal advantages are that it is inexpensive,widely acceptable to most computing platforms, and implemented in both hardware and software. It does, however, suffer from “block artifacts”(artificial edges created between pixel blocks to which the human eye is
TELERADIOLOGY 527
TABLE 26.2Effect on Transmission Times (minutes) of Compression for
Digitized Radiographs (25MB)
Bandwidth
Compression 1.45Mb/s 155Mb/s Ratio 14.4Kb/s† 28.8Kb/s 56Kb/s (T1) (ATM)
1 :1 231.5 115.7 58.8 2.2 0.022 :1 115.7 57.8 29.4 1.1 0.01
10 :1 3.1 11.5 5.9 0.22 0.00220 :1 11.5 5.7 3.0 0.11 0.00130 :1 7.7 3.8 2.0 0.07 0.000660 :1 3.8 1.9 1.0 0.04 0.0003
† Kilobits per second.
DRE26 11/16/2005 10:04 AM Page 527

sensitive), particularly at higher compression ratios. Wavelet compressionmay be advantageous at higher compression ratios, which may be requiredfor implementation of a teleradiology system that is both practical and eco-nomical. The DICOM working group on compression (Group 4) is evalu-ating alternative compression techniques such as wavelets for inclusion inthe standard.
A major advantage of wavelet compression over JPEG compression isthat it permits substantially higher compression ratios while maintainingimage quality. This has practical implications for high-volume teleradiology,particularly from international sites, where the cost of data transmissionbecomes a significant factor in the overall cost of the teleradiology system.Several studies have now confirmed that compression ratios of up to 20 :1are diagnostically acceptable. Film transmission times can therefore be sig-nificantly reduced, thereby permitting images to reach the referral site withina fraction of the time at significantly reduced costs (Table 26.2). Real-timeteleradiology therefore becomes a reality, enabling remote consultationswhile the patient is still in the doctor’s office or emergency room (ER) at theremote site.
Wavelet compression algorithms consist of 3 basic functions: (1) trans-formation, (2) quantization, and (3) lossless coding. Once discrete wavelettransformation has occurred, the image is processed using quantization,which is the lossy step in the compression algorithm. Care must be taken at
PACS: A Guide to the Digi tal Revolut ion528
TABLE 26.3Effect of Bandwidth on the Transmission Times of Medical Images
Bandwidth
1.544Mb/s 155Mb/sModality 14.4Kb/s* 28.8Kb/s 56Kb/s (T1) (ATM)
Plain radiographs 231.5† 115.7 58.8 2.2 0.02Fluoroscopy 176 88 44 1.6 0.02Computed tomography 111 55.5 27.8 1.0 0.04Magnetic resonance 94 47.5 23.5 0.9 0.01
imagingNuclear medicine 6.4 3.2 1.6 0.03 0.0003
* Kilobits per second.† All transmission times in minutes.
DRE26 11/16/2005 10:04 AM Page 528

this stage not to lose image quality because of the lossy step in the process.Finally, lossless coding is performed, which removes redundant informationfrom the dataset. Once compressed, the image is transferred to the remotesite, where it requires decompression before it can be interpreted. The loss-less step that was performed as the last step in image compression is reversed.Quantization cannot be reversed, as it is a lossy function. Finally, the imageis reconstructed using an inverse transformation process, which is then avail-able for image interpretation.
Although image degradation occurs at higher compression ratios usingwavelet compression, these artifacts produce less image degradation thanJPEG artifacts at similar compression ratios. Practical image quality is main-tained up to compression ratios of 20 :1 and even higher.
IMAGE TRANSMISSION
Several forms of transmission media exist with different bandwidths (Table26.3), including: conventional dial-up telephone lines (9.6 to 28.8 kilobitspersecond [Kb/s]), switched digital service (56Kb/s), frame relay (up to T1),integrated services digital network, or ISDN (128Kb/s), T1 lines (1.54Mb/s), digital signal level 3, or DS3 (44.736Mb/s), and asynchronoustransfer mode, or ATM (typically 155Mb/s). Although ATM can beextremely fast, it is expensive. As broadband has penetrated the home market,most homes in the developed world can access the Internet via either digitalsubscriber line (DSL) over a telephone wire or over a television cable, withspeeds varying from 750Kb/s up to 10Mb/s. However, actual transmissionspeeds depend on the total route the data need to travel; the longer the dis-tance, the longer it will typically take. It also varies with the amount of com-peting traffic on the network segments involved. Dedicated T1 and ISDNlines are variably deployed and may be expensive for small-volume teleradi-ology. Ultimately, the choice of line depends on the customer’s needs, thevolume of studies to be transmitted, the types of studies, turnaround times,and expected peak activity. If all the images are transmitted during one periodof the day, then higher bandwidth may be required. As indicated in Table26.3, if sufficient bandwidth is available, transmission times become quiteshort even for uncompressed large image files.
Transmission of digitized data requires communication equipment.The nature of the equipment depends on the communication medium beingused. This may be a modem for conventional telephone lines, a terminaladapter for an ISDN line, a channel service unit (CSU) for a T1 line, a DSLmodem, or a cable modem.
TELERADIOLOGY 529
DRE26 11/16/2005 10:04 AM Page 529

IMAGE INTERPRETATION
Once images are received from the wide area network (WAN) at the inter-pretation site, they can be sent directly to an interpretation workstation orto an image server that permits distribution within the institution (Figure26.2). Archiving or storing the images for long periods may not be required,as is necessary for PACS. Provided images are online for several days tohandle delays in processing (i.e., weekends and holidays) or to respond toclinical questions pertinent to the case; longer-term storage usually is notnecessary because the images are typically archived in the department oforigin.
The type of monitor used to read the studies depends on whether fullprimary readings are being performed or the system is being used for on-call emergencies. The American College of Radiology (ACR) recommendsa minimum resolution of 2000 ¥ 2000 pixels ¥ 12 bits for image acquisitionfor conventional radiographs. However, this does not mean that the monitormust be capable of displaying all the pixels of the image at once. In fact, thede facto standard in radiology departments for the display of 5-megapixel(MP) radiographs is a 3-MP display. Even on 5-MP displays, 5-MP radi-ographs are almost never displayed at their full native resolution. They are almost always minified to make room for other elements of the screensuch as buttons and menus, and when a landscape-oriented portable chest x-ray is displayed on a portrait-oriented display (a common occurrence), the image is shrunk even more to make it fit. The requirements for tele-radiology are certainly not more stringent than those used in the radiologydepartment. However, even 3-MP monitors are expensive and may beimpractical for general home use when on call. For lower-resolution images(CT, MRI, ultrasound, and nuclear medicine), 512 ¥ 512 pixels ¥ 8-bit resolution is adequate, for which most monitors used for home personalcomputers suffice.
ACCURACY OF TELERADIOLOGY
Improvements in teleradiology systems and the imperatives of contemporarymedical practice have led to the widespread use of teleradiology. Two of themajor concerns by early adopters have been whether radiologists wouldaccept softcopy review of images on computer workstation screens versustraditional hard copy, and whether the accuracy of interpretation was suffi-cient to justify deployment of clinical teleradiology. Both questions have
PACS: A Guide to the Digi tal Revolut ion530
DRE26 11/16/2005 10:04 AM Page 530

now been answered to variable degrees. First, radiologists have readilyadapted to computer viewing to the point that many departments are usingit not only for teleradiology cases but also for routine work. At Massachu-setts General Hospital (MGH), substantially all modalities, including plainradiography, fluoroscopy, angiography, CT, MRI, ultrasound, and nuclearmedicine, are routinely acquired, viewed, interpreted, and managed in adigital electronic environment. In most cases, hardcopy films are no longerprinted, and there is a growing consensus that in many applications theability to optimize image contrast and intensity greatly facilitates the radi-ologist’s practice.
With respect to accuracy of interpretation of softcopy versus hardcopy,the issues are more complex. For the relatively low-resolution cross-sectionalmodalities, including CT, MRI, ultrasound, and nuclear medicine, the accu-racy of softcopy interpretation has, for all practical purposes, not been anissue. It has not been the subject of intense clinical research investigation.Radiologists have simply switched with a collective subjective impression ofequal or superior interpretive accuracy. The relatively low resolution of thesestudies is easily encompassed by the resolution of commonly available mon-itors. The ability to use flexible viewing formats, such as “stack mode,” whichallows the radiologist to move quickly back and forth through a series oftomographic sections, has supported the change in practice from hardcopyto softcopy viewing of these modalities. In the teleradiology application, soft-copy viewing of these modalities is no different remotely than locally, onceacquisition of the original digital datasets has been accomplished.
With respect to conventional radiographic images, the question ofaccuracy is less clear. A significant body of literature compares accuracy ofinterpretation of original hardcopy radiographs with digitized radiographsviewed in softcopy mode. As pointed out by Larson et al., among others,there is an inevitable loss of spatial and contrast resolution in the digitiza-tion process, with some subjective decrease in image quality. However, intheir study of the sensitivity for detecting nodules, pneumothoraces, inter-stitial lung disease, and fractures, there were no statistically significant dif-ferences between the original hardcopy analog radiographs and the digitizedimages viewed on a 1280 ¥ 1024-pixel matrix monitor equipped with an 8-bit/pixel grayscale display. An important point in Larson et al.’s study isthat the overall accuracy for detection of conditions such as nodules andpneumothoraces is less than optimal in the first place, averaging 60% and77%, respectively. These numbers are in keeping with the literature and indi-cate that the real issue is finding more accurate ways of detecting subtleabnormalities regardless of viewing method. Computer-assisted diagnostic
TELERADIOLOGY 531
DRE26 11/16/2005 10:04 AM Page 531
techniques will probably be required to boost detection of subtle nodulesand pneumothoraces from historic levels.
Another problem in assessing the accuracy of softcopy interpretationof radiographs is the low resolution and low quality of much of the equip-ment, including digitizers and workstations used for these analyses. Forexample, papers by Ackerman and Scott demonstrated statistically lowerdetection rates for digitized radiographs versus analog radiographs for pneu-monia and fractures. However, the digitizer used in their studies had a spotsize of 210mm compared with the 100-mm spot size used in Larson et al.’swork. Also, the monitor resolution was either 1280 ¥ 1024 or 1200 ¥ 1600pixels. Each of these is lower than the minimum standard recommended bythe American College of Radiology of 2.5 line pairs per millimeter (lp/mm)at a 10-bit depth. This line-pair resolution requires a equates to a roughly2000 ¥ 2500-resolution matrix for a 14 ¥ 17-in radiograph.
Optimistically, some studies with high-resolution monitors havedemonstrated substantial equivalency between hardcopy and softcopy inter-pretation. Goldberg’s prospective study of 685 cases of double-read softcopyand hardcopy produced overall agreement in 97% of cases without a statis-tical advantage for either approach. Ten cases were judged to be false negative by softcopy interpretation, 3 cases were judged to be hardcopyinterpretation errors, and 1 case was unresolved as observer variation. InRajavi’s series of 239 pediatric cases, no significant difference was foundbetween hardcopy interpretation and use of high-resolution 2000 ¥ 2000-pixel softcopy images on a CRT monitor. The clearly agreed-upon excep-tion to softcopy viewing is mammography, which requires higher spatialresolution than is available on current monitors.
The major problem in sorting through the literature on the accuracyof softcopy interpretation of radiographs is the lack of standardization. Digitizers of widely varying spot size and workstations with different spatial resolutions, luminosities, and functional characteristics have beenused, and there is no widespread use of standard sets of reference images,making true comparisons between observers difficult. Work on defining thenecessary parameters for optimal softcopy viewing continues. In the mean-time, the practice of softcopy interpretation of radiographs is rapidly becom-ing widespread as departments of radiology become increasingly digital.There is also no question that the quality of radiographs obtained by com-puted radiography or direct digital capture are superior to radiographsobtained in original analog hardcopy format and secondarily digitized by aCCD or laser digitizer. The optimal configuration for teleradiology of allmodalities is direct digital capture with transmission of the full digitaldataset.
PACS: A Guide to the Digi tal Revolut ion532
DRE26 11/16/2005 10:04 AM Page 532
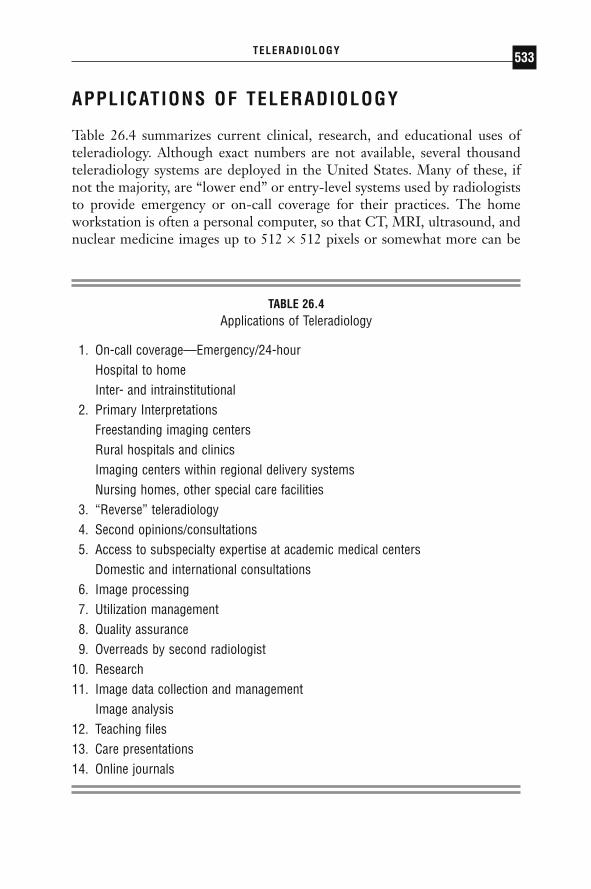
APPLICATIONS OF TELERADIOLOGY
Table 26.4 summarizes current clinical, research, and educational uses of teleradiology. Although exact numbers are not available, several thousandteleradiology systems are deployed in the United States. Many of these, ifnot the majority, are “lower end” or entry-level systems used by radiologiststo provide emergency or on-call coverage for their practices. The homeworkstation is often a personal computer, so that CT, MRI, ultrasound, andnuclear medicine images up to 512 ¥ 512 pixels or somewhat more can be
TELERADIOLOGY 533
TABLE 26.4Applications of Teleradiology
1. On-call coverage—Emergency/24-hourHospital to homeInter- and intrainstitutional
2. Primary InterpretationsFreestanding imaging centersRural hospitals and clinicsImaging centers within regional delivery systemsNursing homes, other special care facilities
3. “Reverse” teleradiology4. Second opinions/consultations5. Access to subspecialty expertise at academic medical centers
Domestic and international consultations6. Image processing7. Utilization management8. Quality assurance9. Overreads by second radiologist
10. Research11. Image data collection and management
Image analysis12. Teaching files13. Care presentations14. Online journals
DRE26 11/16/2005 10:04 AM Page 533
displayed at full resolution. These systems often allow image magnificationso that plain films may be viewed at nominal full resolution according to theAmerican College of Radiology standards, as noted. Full resolution is equiv-alent to roughly 2000 ¥ 2500 pixels.
On-call applications are proving extremely valuable in the clinical prac-tice of radiology. Radiologists are able to provide more rapid consultationsthan would be possible if physical travel to the hospital were required. Radi-ologists can cover multiple institutions simultaneously, and subspecialistswithin a group can provide on-call coverage more flexibly. Many teleradiol-ogy companies have formed in recent years that offer emergency radiologycoverage during overnight hours and weekends. These services can help radi-ologists face the challenge of meeting ever-increasing on-call demands in thesetting of a relative shortage of radiologists. As round-the-clock service isimpractical for solo practitioners or small groups, teleradiology offers theopportunity for contemporaneous interpretation without having to be on callan undue or impractical percentage of the time.
One of the best documented teleradiology programs in the UnitedStates providing services to rural hospitals and clinics is at the University ofIowa. Franken et al., have studied patterns of use and have tried to deter-mine what value is added by radiologists’ consultation versus having studiesreviewed by nonradiologists. They have confirmed that higher accuracy isachieved by radiologists. For example, in one of their teleradiology series,radiologists demonstrated a 92% versus 86% sensitivity compared withfamily practitioners in interpreting studies of the chest and extremities.
Another growing application of teleradiology is coverage for free-standing imaging centers, outpatient clinics, nursing homes, and smaller hospitals. In these applications, common themes are improved coverage,improved access to subspecialist radiologists, and lower cost of service pro-vided. Using the experience with the MGH as an example, teleradiology isused for all the purposes cited. Prior to teleradiology, if a clinician in a neigh-borhood health center needed an immediate interpretation, films were putinto a taxicab and taken to the MGH main campus. This cumbersome andexpensive solution was never satisfactory and is being replaced by teleradi-ology, with essentially real-time, online interpretative services becomingavailable throughout the MGH service region. Routine interpretations fromthe affiliated imaging centers had been available only through batch readingof cases brought twice a day to the MGH main campus or one of the largersatellite centers. Now, every case can be read immediately by a subspecialistradiologist. The MGH experience highlights the observation that teleradi-ology will be used extensively by regional integrated delivery systems toimprove radiology coverage.
PACS: A Guide to the Digi tal Revolut ion534
DRE26 11/16/2005 10:04 AM Page 534

The rapid growth in freestanding imaging centers, often dedicated tocross-sectional imaging, has provided another impetus for teleradiology.Hundreds of these centers across the country have been established by non-radiologist entrepreneurs, who then approach the radiology community forprofessional interpretation support. Teleradiology is an efficient way forgroups of radiologists to work with these imaging centers to expand theirpractices and benefit from the growth in demand for imaging studies withoutunduly disrupting the logistics of their practices, especially in the case of hospital-based radiology groups.
A number of institutions, including MGH as well as the US military,are exploring the concept of “reverse teleradiology” by sending cases fromlarger centers to smaller centers. In some situations, small departmentsrequire a radiologist to do procedures or to meet requirements for directsupervision but do not generate enough work to keep them busy or justifytheir cost. By sending cases from busier departments, the presence of theon-site radiologist can be cost justified, with the added benefit of improvingthe quality of care offered at the smaller location. At MGH, this model pro-vides coverage for a series of high-tech imaging centers that the departmenthas established in the community surrounding Boston. This allows thedepartment to place a staff radiologist at each location without loss of productivity.
Teleradiology also provides access to subspecialty expertise at academicmedical centers or to second opinions and consultations among larger radi-ology groups. This practice is growing both domestically and internation-ally and is being highly influenced by the Internet. Patients, physicians,third-party payers, and government agencies all need second opinions fromtime to time. Web sites on the Internet are being established to solicit andaccommodate these opinions. In other cases, academic practices, larger radi-ology groups, and commercial enterprises dedicated to teleradiology aremaking their services available for second opinions and consultations.
The increasing importance of image post-processing suggests anotherapplication of teleradiology that has been used in the early days of CT andmay become common. Smaller facilities without on-site access to three-dimensional rendering software or personnel with image-processing expert-ise can readily access both via teleradiology. Multisite institutions send imagesets to central processing.
The possibility for radiology groups to help each other in their qualityassurance programs is another potential use of teleradiology. In this model,a statistical sampling of cases from 1 group can be sent to another group viateleradiology for a quality assurance overread. This model is also useful forhelping radiology groups initiate services in a new modality. For example, if
TELERADIOLOGY 535
DRE26 11/16/2005 10:04 AM Page 535
a group that has not provided MRI services begins doing so, as they comeup to speed they can use teleradiology to send cases to a more experiencedgroup for an overreading function. This was a common practice in the earlydays of MRI, although the cases were often sent as hard copy.
Research and educational applications of teleradiology are less wellpublicized than direct clinical applications. The radiology department atMGH has used teleradiology to manage clinical trials in which imaging isan important part of the data collection. This application is likely to growdramatically with the increased use of imaging-based surrogate endpoints indrug trials and the establishment of the ACRIN (American College of Radi-ology Imaging Network) by the American College of Radiology for thepurpose of organizing clinical trials aimed at assessing the efficacy of imaging technologies.
Educational applications of teleradiology are burgeoning over theInternet. Many academic departments have Web sites with extensive teach-ing files. These files are often augmented by case presentations. Some sitesoffer radiologists the opportunity for online continuing medical educationcredits. The American Board of Radiology is exploring the possibility ofadministering its certifying examinations electronically. Major journals haveextensive Web sites providing a range of services for their subscribers andeven for nonsubscribers, and it is likely that the applications of remote edu-cation will become among the most prevalent uses of teleradiology.
MEETING THE GOALS OF TELERADIOLOGY
Ultimately, the purpose of off-site image interpretation is to provide betterand faster delivery of patient care. When organizing a teleradiologyprogram, it is important to take the necessary steps to ensure that this objec-tive is met and that referring physicians, imagers, and patients are highly satisfied.
SPEED
The ability to quickly move images from place to place lends itself to theprovision of fast and responsive imaging interpretation. The implementa-tion of a teleradiology program should be associated with improved deliveryof services by those who utilize radiology most frequently.
A prerequisite for fast report turnaround times is the ability of the radiologist to access images quickly. This is crucial for teleradiologists
PACS: A Guide to the Digi tal Revolut ion536
DRE26 11/16/2005 10:04 AM Page 536

providing emergency coverage. An appropriate compression mechanism anddegree should be chosen to maximize speed of transmission without dimin-ishing practical image quality. The range of size of the typical exam files thatwill be sent should be taken into account. This can be dependent on the typeof scanners utilized by a particular practice, as new, multislice CT scannerscan generate very large datasets. The teleradiology system should be testedin advance at the site in which it will be stationed using the workstation andbandwidth connection that will be utilized. Testing should be done duringthe same time of day that the system will be used, as this can have a signif-icant effect on speed at both the sending and receiving sites when certainInternet connectivity options are employed.
For the truly emergent patients it is very helpful to have a system thatallows the radiologist to see the images as they are being downloaded locallyonto a workstation. Some systems allow lower-resolution images to be visu-alized almost immediately while the case is in the process of downloading.This allows the radiologist to quickly visualize a crucial finding such as a rup-tured aortic aneurysm in seconds and begin to take the necessary steps toensure that prompt care is provided to the patient. It avoids the frustrationof staring at a blank computer screen while a case is being transmitted afterhaving been told by a technologist or trauma surgeon that a patient may havea critical finding.
Also important in emergency teleradiology is the ability to choose theparts of a case to download preferentially. In the age of multislice CT scan-ning, it is not uncommon to have a study that contains 750 or more images.If transmission speed is at all an issue given a particular bandwidth connec-tion, it can be critically important to be able to download standard imagesin a single plane without waiting for the entire study to arrive. In this way aradiologist can begin to interpret an exam and spot most of the importantfindings during the time that images in multiple additional planes and spe-cialized algorithms and delayed images are being downloaded in the back-ground. Furthermore, a single computer error is less likely to stop the entirelengthy process and leave an interpreter without any images to view.
Speed can also be enhanced using a system that can be configured todisplay the most recently completed examinations at the top of a patient list.This allows a radiologist to begin to access a study before a technologist evennotifies him or her of the case. In some settings this can save a significantamount of time. In the emergency setting, technologists should be encour-aged to communicate with the radiologist as soon as there is a new study tobe read and not wait to batch studies. Batching studies can be particularlytroubling when using a teleradiology system that allows just 1 exam to betransmitted at a time. These steps can avoid the uncomfortable phone call
TELERADIOLOGY 537
DRE26 11/16/2005 10:04 AM Page 537

from a technologist informing the radiologist that there are 3 patients’studies to be read and there is an ER physician demanding results on thefirst patient, who returned from the CT scanner over an hour ago.
The ability to download multiple cases in parallel is an important com-ponent of a teleradiology system for workflow and patient care issues. At theworst end of the spectrum are systems that allow for the download of only1 series of 1 study at a time. This means that only after reviewing the axialimages of a cervical spine CT can a radiologist request the saggital or coronalreconstructions and wait for them to arrive. Only at the completion of thisprocess can the next trauma patient’s exam be requested. An old exam like-wise cannot be retrieved or reviewed simultaneously with a current exam onthese systems. In practice, this will decrease the number of cases that will becompared to old exams and could impact negatively on patient care. In sharpcontrast, other teleradiology systems are available that can download multi-ple exams or components of exams at the same time. On some of thesesystems, old exams and old reports are easy to locate and can be synchro-nized by table position with a current study for convenient comparison.
In choosing a mechanism to secure patient information and the hospi-tal’s network, it is important to balance security concerns with issues of speedand reliability. Cumbersome access mechanisms with frequent automatic ter-minations may provide security at the cost of valuable minutes in report turn-around times and more frequent downtimes. It is important to work closelywith the information technology department to ensure adequate security,while at the same time allowing for convenient, reliable, and fast access bythe teleradiologist.
MANPOWER
Manpower is perhaps the most critical component for the consistent deliv-ery of timely care. This can be relatively easy to calculate for elective imagingneeds, but quite difficult for emergency coverage. By its very nature, emer-gency radiology comes in bursts. Maintaining the manpower requirementsto provide immediate attention to potentially critical patients during thesebursts can be very inefficient for the vast majority of time when the ER paceis not as frenzied. This can be true for small departments where even a singleradiologist is not needed for most of the overnight hours and for largerdepartments where a single radiologist may have difficulty keeping up duringthe busiest spurts, but 2 radiologists would be unnecessary for the vast major-ity of the time.
Efficiency and responsiveness could be optimized if radiologists inter-preting elective cases could be quickly recruited for emergency work when
PACS: A Guide to the Digi tal Revolut ion538
DRE26 11/16/2005 10:04 AM Page 538

needed. Though this is typical for many practices during the daytime, it canbe highly impractical for most departments to achieve 24 hours per day. Overthe last several years, some radiology practices have made this happen byusing teleradiology to its full advantage. These practices have made the nightshift attractive by establishing an office in an exotic or otherwise desirablepart of the world where it is daytime during the overnight hours at the localhospital. Experts in emergency radiology modalities voluntarily relocate orrotate to this office for blocks of time while maintaining an affiliation withthe home practice.
Newly formed teleradiology companies offer radiology departmentsthe ability, in effect, to hire the portion of a dedicated night radiology work-force that they need. Ideally, this workforce should be composed of expertsin ER radiology working with a schedule or in a location that is conduciveto their being rested and alert. A potential disadvantage of this type ofarrangement is the perception amongst colleagues of having “outsourced”the undesirable portion of the radiologists’ responsibilities. Additionally,studies done overnight are interpreted by radiologists unfamiliar to the refer-ring doctors. These disadvantages can be overcome, however, if there is adequate communication between the night radiologists and the referringdoctors and if higher-quality reports can be generated with faster turnaroundtimes.
RELATIONSHIPS WITH COLLEAGUES
The knowledge that radiologists are working from home or from a beach-front office in Hawaii does not necessarily impart an endearing first impres-sion to nonradiologists that spend long hours each day in hospital wards. Tomaximize the success of a teleradiology practice, it is imperative to providethese doctors with benefits that they would not have expected from theirradiology departments prior to the implementation of teleradiology. In anelective setting this can be done by maximizing the percentage of studies thatare read by subspecialist radiologists. In an emergency setting, increasedavailability of a radiologist during off-hours will be appreciated. In manydepartments, referring physicians have grown accustomed to the limitedavailability of an on-call radiologist. Emergency room physicians quicklylearn to appreciate having a radiologist colleague that is freely available forconsultation, protocol questions, report clarifications, and interpretations oftimelier follow-up examinations. Faster report turnaround times that can befacilitated with the use of voice recognition technology or on-site transcrip-tion will be welcomed in any clinical setting. Outpatient doctors that beginto receive same-day reports from subspecialists on patients sent to an
TELERADIOLOGY 539
DRE26 11/16/2005 10:04 AM Page 539

imaging center and ER physicians that start to get head CT results beforetheir patients return from the scanner are more likely to write complimen-tary letters to a radiology chairman than to be bothered by where a radiol-ogist may sitting while the images are being interpreted.
Teleradiology should not result in weaker relationships between radiologists and colleagues in other fields. If referring physicians do not seea teleradiologist’s face, effort should be made to ensure that they recognizetheir teleradiologist’s voice and personality. In addition to the usual phonecalls for unexpected or emergent findings, teleradiologists should considerother occasions to call the ordering doctors such as for interesting cases orfor follow-up. Relationships build confidence, which is critical for any radi-ology department. This can also help improve the clinical histories that aremade available for the teleradiologist and increase the amount of times thatmeaningful follow-up is received.
PATIENT CARE
The benefits of teleradiology that result in better service will by their natureimpact patient care. Ultimately, it is the patients who benefit most by havingtheir imaging interpreted by a subspecialist. In many instances, teleradiol-ogy has put an end to common practices that used to be quite difficult formany patients. For instance, a modern teleradiology program should guar-antee that ER patients no longer have to lie for hours in cervical spine collarswaiting for their spine imaging to be reviewed by a radiologist in themorning. In the not-too-distant past this was a common occurrence in manycommunity hospitals because it was difficult to quickly move large radio-logical examinations from place to place. In the most emergent settings, awell-run teleradiology practice will ensure that a radiologist is immediatelyavailable to turn his or her full attention to patients who have sustained sig-nificant trauma or present for other critical indications.
Night call has often been considered by many to be the least desirablepart of a radiologist’s practice. Many departments demand that all full-timemembers share this responsibility equally. This can mean that subspecializedradiologists who do not routinely interpret important emergency imagingmodalities such as CT in the daytime are forced to provide coverage for thesemodalities at night. With no backup readily available, vital decisions on ERand trauma patients must be made by these radiologists all night long.Transmitting images to ER radiology experts who are in favorable time zonesor are working dedicated shifts can greatly improve nighttime coverage. Thiscan also prevent having an important patient examination sent to be read by
PACS: A Guide to the Digi tal Revolut ion540
DRE26 11/16/2005 10:04 AM Page 540

a radiologist who was just woken from sleep after having worked the previ-ous 18 hours.
The capabilities of the teleradiology system can also have a surprisinglyimportant impact on the quality of patient care. When making purchasingdecisions it can be easy to reason that one will be able to make do with certaininconveniences while off-site. While this may be true for very low-volumepractices, this is certainly not the case for busy ones. There are systems cur-rently in use that require a combination of greater than 10 mouse clicks andbutton pushes to change from a standard to a subdural window. Over time,patient care will likely be compromised if a radiologist begins thinking inthe midst of a busy stream of pending studies that standard brain windowsare probably adequate in order to avoid the time and loss of concentrationneeded to change windows. If a teleradiology system is not capable of cal-culating a region of interest (ROI) measurement, it is extremely difficult toexpect that a radiologist will telephone a technologist to have this done asfrequently as may be appropriate. Similarly, features that are available butare clumsy or inconvenient may not be utilized as often as needed. A goodsystem should give the radiologist the ability to easily window/level, changebetween frequently used preset values, and electronically measure, cross-reference, magnify, and synchronize images for easy comparison.
Redundancy in a teleradiology system is crucial to minimize downtimeand delays in patient care. Alternate options should be considered for eachcomponent of a teleradiology system, including computers, monitors, powersources, phone lines, fax machines, and Internet connectivity at both thesending and receiving sites. If downtime does occur, a backup plan shouldbe in place to get the images as quickly as possible to a radiologist who caninterpret them before there is any negative outcome for the patient or dis-satisfaction from the referring physician.
In the current market, there are affordable teleradiology systems andadequate bandwidth options that allow off-site radiologists to rapidly andreliably access high-quality, convenient-to-manipulate images. These readilyavailable technologies will facilitate the realization of the many potentialbenefits of bringing radiological examinations to radiologists that are alertand expert in the type of modality or body system being imaged.
JOB SATISFACTION
Working off-site can add many administrative steps to a radiology operation.Hiring adequate support staff to assist the radiologist is an essential compo-nent of a busy teleradiology practice. Receipt of information on cases to be
TELERADIOLOGY 541
DRE26 11/16/2005 10:04 AM Page 541
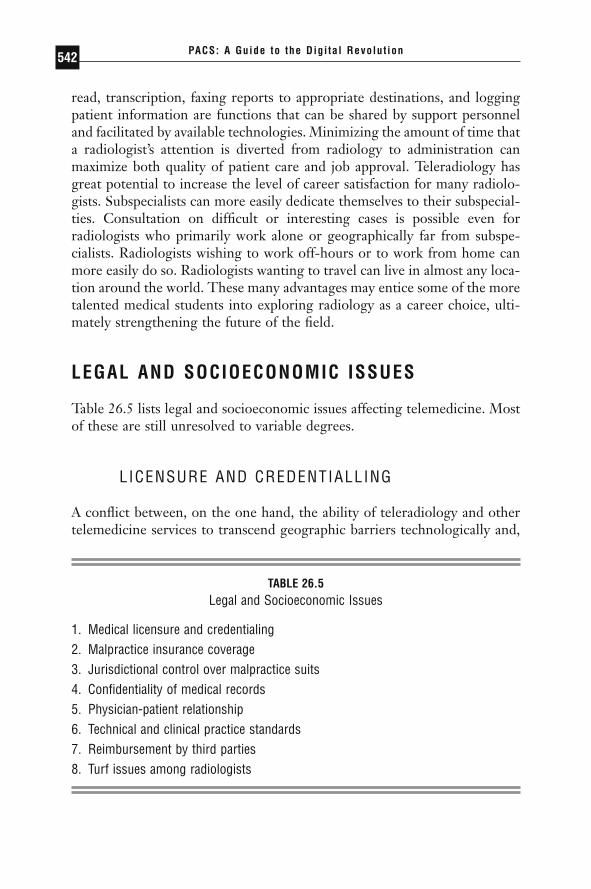
read, transcription, faxing reports to appropriate destinations, and loggingpatient information are functions that can be shared by support personneland facilitated by available technologies. Minimizing the amount of time thata radiologist’s attention is diverted from radiology to administration canmaximize both quality of patient care and job approval. Teleradiology hasgreat potential to increase the level of career satisfaction for many radiolo-gists. Subspecialists can more easily dedicate themselves to their subspecial-ties. Consultation on difficult or interesting cases is possible even forradiologists who primarily work alone or geographically far from subspe-cialists. Radiologists wishing to work off-hours or to work from home canmore easily do so. Radiologists wanting to travel can live in almost any loca-tion around the world. These many advantages may entice some of the moretalented medical students into exploring radiology as a career choice, ulti-mately strengthening the future of the field.
LEGAL AND SOCIOECONOMIC ISSUES
Table 26.5 lists legal and socioeconomic issues affecting telemedicine. Mostof these are still unresolved to variable degrees.
LICENSURE AND CREDENTIALLING
A conflict between, on the one hand, the ability of teleradiology and othertelemedicine services to transcend geographic barriers technologically and,
PACS: A Guide to the Digi tal Revolut ion542
TABLE 26.5Legal and Socioeconomic Issues
1. Medical licensure and credentialing2. Malpractice insurance coverage3. Jurisdictional control over malpractice suits4. Confidentiality of medical records5. Physician-patient relationship6. Technical and clinical practice standards7. Reimbursement by third parties8. Turf issues among radiologists
DRE26 11/16/2005 10:04 AM Page 542

on the other, the legal responsibilities of medical licensing authorities withinindividual states has increased. Both the American Medical Association andthe American College of Radiology have adopted policies that recommendfull licensure in states where teleradiology or other forms of telemedicineare practiced. The ACR policy says, “[S]tates and their Medical Board shouldrequire a full and unrestricted medical license in the state in which the exam-ination originates, with no differentiation by specialty, for physicians whowish to regularly practice telemedicine.” This means that a physician mustbe licensed in both the state of his or her residence and in the other statewhere the image originated. Many states have either passed legislation orimplemented rulings by state medical boards to this effect. These laws andrulings are summarized in Chapter 8. Requirements for full licensure arepending in several additional states, and a number of states are consideringa limited license or registration program, with the proviso that the providerphysician be licensed in another state. The Federation of State MedicalBoards favors special-purpose licensure providing telemedicine services.
In addition to licensure, most hospitals require teleradiology providersto apply for staff credentials. The new Joint Commission on Accreditationof Healthcare Organizations ( JCAHO) guidelines have a provision allowinghospitals to use telemedicine services of physicians that are credentialed at adistant site that is JCAHO certified even if they are not credentialed at theoriginating site. It is not yet clear how many hospitals will feel comfortableenough using the services of physicians that they have not credentialed totake advantage of this provision.
MALPRACTICE INSURANCE COVERAGE
Radiologists providing teleradiology services must have malpractice insur-ance that will extend coverage to lawsuits brought in all of the states in whichthey are providing coverage. As noted by Berlin, it is an established legalprinciple that the state in which the injury occurs and that has the greatestconnection to the injury possesses jurisdiction over the lawsuit. Unfortu-nately, many malpractice insurers have regional limitations on their cover-age. These have been set up due to the difficulties in defending a lawsuit ina remote location where the insurance company does not have relationshipswith malpractice attorneys that will defend the case and where the defend-ing physician may be seen as an outsider. In addition, the current malpracticeclimate has turned many regions into very difficult malpractice environmentsthat carriers are reluctant to become involved in. For these reasons, a radi-ologist practicing in many different states will often have to turn to excess
TELERADIOLOGY 543
DRE26 11/16/2005 10:04 AM Page 543

and surplus-lines carriers, which can be very expensive. Furthermore, radi-ologists practicing outside of the United States may face additional difficultyfinding malpractice carriers that have confidence that an overseas radiolo-gist will return to the state of origin to properly defend a possible lawsuit.As the field of teleradiology continues to advance and malpractice risk levelsbecome clarified, it is likely that insurers will gain enough comfort to respondto the unique coverage needs of teleradiology.
PATIENT CONFIDENTIALITY
Ensuring patient confidentiality is of utmost importance, and formal proce-dures for doing so have been mandated with the passing of HIPAA (HealthInsurance Portability and Accountability Act) legislation by congress. Thislegislation provides guidelines for the protection of patient privacy that hos-pitals, imaging centers, and doctors must adhere to. For teleradiology, theimage-compression process encrypts the image in a way that prevents casualtheft, and Internet-based systems can be protected using virtual private networks or secure sockets layer technology. With a secure mechanism forimage transmission in place, a teleradiology office must take the usual stepsfor patient privacy that other medical offices would take.
STANDARDS
As noted in the telemedicine report to Congress from the US Departmentof Commerce, there are no specialty-generated technical standards, proto-cols, or clinical guidelines for telemedicine, with the exception of the ACR,which has developed practice guidelines for teleradiology. The AmericanMedical Association, the American Telemedicine Association, and a numberof other professional societies are currently developing practice standards fortelemedicine. The Department of Commerce report also notes that the Foodand Drug Administration (FDA) is the lead federal agency with responsibil-ity for ensuring the safety and effectiveness of telemedicine devices marketedin the United States.
The ACR has deemed that several criteria in the teleradiology processshould meet minimum standards. (The ACR guidelines are included as anappendix to this chapter.) It would be prudent for anyone providing tele-radiology services to review the ACR standards. Highlights from the guide-lines include:
PACS: A Guide to the Digi tal Revolut ion544
DRE26 11/16/2005 10:04 AM Page 544

◗ For small matrix studies (e.g., CT, MRI, ultrasound, nuclear medi-cine, digital fluorography, and digital angiography), 512 ¥ 512 ¥8-bit acquisition datasets should be used; for large matrix images(e.g., conventional radiographs), datasets should be a minimum of 2.5 lp/mm at a minimum 10-bit depth.
◗ Minimum display resolution is not specified, although the displaydevice should be capable of displaying all acquired data. This doesnot mean that the entire image needs to be able to be displayed atfull native resolution, but rather that the software allows the user tozoom and pan the image sufficiently to view any part of an image atits native resolution. Thus a 3-MP display used for radiography inregular PACS workstations can certainly be used for teleradiology.The same would apply for 1–2-MP displays that are used for smallmatrix studies (nonradiography).
◗ Image annotation (patient demographics and examination informa-tion) should be included.
◗ Image display stations should provide functionality for window widthand level settings, inverting contrast, image rotation, measurementfunction, and magnification.
◗ Display brightness of at least 50 foot-lamberts should be achieved.◗ Compression ratios should be displayed with the image (no specifi-
cation for what type or level of compression).◗ Reasonable measures must be taken to protect patient
confidentiality.
REIMBURSEMENT
There has been fairly uniform recognition of teleradiology for reimburse-ment by private insurance companies and government programs includingMedicare and Medicaid. The exception to this is for interpretations renderedoutside the United States, for which Medicare will not pay. Some privateinsurers have followed Medicare on this issue as well. The ACR task forceon international teleradiology put out a report in April 2004 recognizing thatthere is no inherent technological difference between teleradiology inter-pretations generated in the United States and those generated outside theUnited States. This task force felt that payment for international teleradiol-ogy reports is appropriate provided that the following criteria are met:
TELERADIOLOGY 545
DRE26 11/16/2005 10:04 AM Page 545

1. The person interpreting the examination and submitting the reportto the referring physician are one and the same.
2. The person rendering the report is licensed in the state and cre-dentialed as a member of the medical staff at the institution per-forming the examination and receiving the report.
3. The person performing the interpretation and rendering the reportis available for consultation.
4. The report meets the guidelines for diagnostic reports as promul-gated by the ACR.
5. The ACR Technical Standard for Teleradiology is met.
Despite the ACR recommendations, it remains to be seen whether Medicarewill alter its policy. In the meantime, the ACR report also indicated that itis unethical for a radiologist who did not personally interpret the images ina study to sign his or her name to a report in a manner that would indicatethat this radiologist interpreted the study.
TURF ISSUES
The radiology community is divided on the issue of teleradiology. Althoughthe general concept has been widely embraced throughout different practicesettings—from the largest academic institutions to solo practitioners inprivate practice—the practice of teleradiology continues to create contro-versy. Some people in the radiology community have expressed concern thatlarger groups, including academic medical centers, will use their financialresources, prestige, and clout to invade the turf of smaller groups, who regardtheir geographic service area as inviolable. In defending this view, the pointis made that it is important for radiologists to provide more than just inter-pretations and to take part in the medical life of the respective hospital orhealthcare community. Counterarguments include the view that teleradiol-ogy provides patients and their attending physicians the opportunity toaccess more highly subspecialized experts than may be available in the localcommunity, and that it is not appropriate for individual radiologists to standbetween the patient and such expert opinions.
It is far from clear how the issues of mistrust and suspicion on the partof community radiologists versus the desire of larger subspecialist groups tooffer their expertise more broadly will be resolved. However, one opportu-nity open to community radiologists is to come together among themselvesto form larger networks in which individuals can begin to subspecialize and,
PACS: A Guide to the Digi tal Revolut ion546
DRE26 11/16/2005 10:04 AM Page 546
as discussed above, where smaller groups can provide coverage to oneanother for a variety of purposes. The one thing abundantly obvious in theInternet age is that patients will increasingly expect electronic access whenthey see it as beneficial to their interests and needs. Doctors, including radi-ologists, will be ill-served to stand in the way of that new and increasingimperative.
CONCLUSION
Teleradiology has transitioned from its infancy and is no longer a techno-logical curiosity. It is already part of daily practice. It is here, it works, andit will have an enduring role in shaping the future of radiology. It is likelythat, in less than a decade, the term “teleradiology” will be obsolete for thesimple reason that remote interpretations and consultations will be such anintegral part of radiology practice that referring to them will neither requirenor occasion a special term.
ACKNOWLEDGMENT
Portions of this chapter were published as Thrall JH, Boland G. Telemedi-cine in practice. Semin Nucl Med. 1998;28:142–157 (with permission of Elsevier).
◗ REFERENCES
Aberle DR, Gleeson F, Sayre JW, et al. The effect of irreversible image compressionon diagnostic accuracy in thoracic imaging. Invest Radiol. 1993;28:398–403.
Ackerman S, Gitlin JW, Gayler RW, Flagle CD, Bryan RN. Receiver operating characteristic analysis of fracture and pneumonia detection: Comparison laser-digitized workstation images and conventional analog radiographs. Radiology.1993;186:263–268.
ACR Bulletin. 1997;53:13.American College of Radiology. ACR standard for teleradiology. In ACR Practice
Guidelines and Technical Standards. Reston, VA: ACR; 2004:709–718.Andrus WS, Bird KT. Teleradiology: evolution through bias to reality. Chest.
1972;62:655–657.Baer L, Cukor P, Jenike MA, Leahy L, O’Laughlen J, Coyle JT. Pilot studies of
telemedicine for patients with obsessive-compulsive disorder. Am J Psychiatry.1995;152:1383–1385.
TELERADIOLOGY 547
DRE26 11/16/2005 10:04 AM Page 547

Baer L, Jacobs DG, Cukor P, O’Laughlen J, Coyle JT, Magruder KM. Automatedtelephone screening survey for depression. JAMA. 1995;273:1943–1944.
Berlin L. Malpractice issues in radiology: telereadiology. AJR Am J Roentgenol.1998;170:1417–1422.
Bird KT. Cardiopulmonary frontiers: quality health care via interactive television.Chest. 1972;61:204–207.
Black-Schaffer S, Flotte TJ. Current issues in telepathology. Telemed J. 1995;1:95–106.Calcagni DE, Clyburn CA, Tomkins G, et al. Operation Joint Endeavor in Bosnia:
telemedicine systems and case reports. Telemed J. 1996;2:211–224.Cawthon MA, Goeringer F, Telepak RJ, et al. Preliminary assessment of computed
tomography and satellite teleradiology from Operation Desert Storm. InvestRadiol. 1991;26:854–857.
Dakins D. Market targets 1997. Telemed Telehealth Networks. 1997;3:25–29.Elam EA, Rehm K, Hillman BJ, Maloney K, Fajardo LL, McNeill K. Efficacy of
digital radiography for detection of pneumothorax: comparison with conven-tional chest radiography. AJR Am J Roentgenol. 1992;158:509–514.
Fosberg DA. Quality assurance in teleradiology. Telemed J. 1995;1:38–44.Franken EA Jr, Bergus GR, Koch TJ, Berbaum KS, Smith WL. Added value of radi-
ologist consultation to family practitioners in the outpatient setting. Radiology.1995;197:759–762.
Franken EA, Harkens KL, Berbaum KS. Teleradiology consultation for a rural hos-pital: patterns of use. Acad Radiol. 1997;14:492–496.
Fuchs M. Provider attitudes toward STARPAHC, a telemedicine project on thePapago Reservation. Med Care. 1979;17:59–68.
Gagner M, Begin E, Hurteau R, Pomp A. Robotic interactive laparoscopic chole-cystectomy. Lancet. 1994;343:596–597.
Goldberg MA. Teleradiology and telemedicine. Radiol Clin North Am. 1996;43:647–665.
Goldberg MA, Rosenthal DI, Chew FS, Blickman JG, Miller SW, Mueller PR. Newhigh resolution teleradiology system: prospective study of diagnostic accurracyin 685 transmitted clinical cases. Radiology. 1993;186:429–434.
Goldberg MA, Pivovarov M, Mayo-Smith WW, et al. Application of wavelet com-pression to digitized radiographs. AJR Am J Roentgenol. 1994;163:463–468.
Goldberg MA, et al. Effect of 3-D wavelet compression on the detection of focalhepatic lesions at CT. Radiology. 1997;202:159–165.
Gomez E, Poropatich R, Karinch MA, Zajtchuk J. Tertiary telemedicine supportduring global military humanitarian missions. Telemed J. 1996;2:201–210.
Gorden JW, Knapp CF, Sanders JH. Ophthalmologic electronic imaging and datatransfer. J Ky Med Assoc. 1991;89:115–117.
Grigsby J, Kaehny MM, Sandberg EJ, Schlenker RE, Shaughnessy PW. Effects andeffectiveness of telemedicine. Health Care Financ Rev. 1995;17:115–131.
PACS: A Guide to the Digi tal Revolut ion548
DRE26 11/16/2005 10:04 AM Page 548

Ho BKT, et al. A mathematical model to quantify JPEG block artifacts. SPIE PhysMed Imaging. 1993;1987:169–274.
Hubble JP, Pahwa R, Michalek DK, Thomas C, Koller WC. Interactive video con-ferencing: a means of providing interim care to Parkinson’s disease patients. MovDisord. 1993;8:380–382.
Jutra A. Teleroentgen diagnosis by means of videotape recording. AJR Am JRoentgenol. 1959;82:1099–1102.
Kvedar JC, Edwards RA, Menn ER, et al. The substitution of digital images for der-matologic physical examination. Arch Dermatol. 1997;133:161–167.
Larson A, Lynch DA, Zeligman B, et al. Accuracy of diagnosis of subtle chest diseaseand subtle fractures with a teleradiology system. AJR Am J Roentgenol.1998;170:19–22.
Mullick FG, Fontelo P, Pemble C. Telemedicine and telepathology at the ArmedForces Institute of Pathology: history and current mission. Telemed J.1996;2:187–194.
Murphy RLH, Bird KT. Telediagnosis: a new community health resource. Am JPublic Health. 1974;64:113–119.
Murphy RL Jr, Fitzpatrick TB, Haynes HA, Bird KT, Sheridan TB. Accuracy of dermatologic diagnosis by television. Arch Dermatol. 1972;105:833–835.
Perednia DA, Allen A. Telemedicine technology and clinical applications. JAMA.1995;273:483–488.
Rajavi M, Sayre JW, Taira RK, et al. Receiver-operating-characteristic study of chestradiographs in children: digital hard-copy film versus 2K32K soft copy images.AJR Am J Roentgenol. 1992;158:443–448.
Rayman BR. Telemedicine: military applications. Aviat Space Environ Med. 1992;63:135–137.
Sanders JH, Tedesco FJ. Telemedicine: bringing medical care to isolated communi-tites. J Med Assoc Ga. 1993;82:237–241.
Satava RM. Robotics, telepresence and virtual reality: a critical analysis of the futureof surgery. Minim Invasive Ther. 1992;1:357–363.
Satava RM. Virtual reality surgery simulator: the first steps. Surg Endosc. 1993;7:203–205.
Satava RM, Jones SB. Virtual reality and telemedicine: exploring advanced concepts.Telemed J. 1996;2:195–200.
Scott WW Jr, Rosenbaum JE, Ackerman SJ, et al. Subtle orthopedic fractures: teleradiology workstation versus film interpretation. Radiology. 1993;187:811–815.
Scott WW Jr, Bluemke DA, Mysko WK, et al. Interpretation of emergency depart-ment radiographs by radiologists and emergency physicians: teleradiology work-station versus radiographic readings. Radiology. 1995;195:223–229.
TELERADIOLOGY 549
DRE26 11/16/2005 10:04 AM Page 549
Slasky BS, Gur D, Good WF, et al. Receiver operating characteristic analysis of chestimage interpretation with conventional, laser printed and high-resolution work-station images. Radiology. 1990;174:775–780.
US Department of Commerce. Telemedicine Report to Congress. January 31, 1997.Van Moore A. Report of the ACR Task Force on International Teleradiology. April 30,
2004.Wilson AJ, Hodge JC. Digitized radiographs in skeletal trauma: a performance com-
parison between a digital workstation and the original film images. Radiology.1995;196:565–568.
Wittson CL, Affleck DC, Johnson V. Two-way television group therapy. Ment Hosp.1961;12:22–23.
Zajtchuk JT, Zajtchuk, R. Strategy for medical readiness: transition to the digital age.Telemed J. 1996;2:179–186.
APPENDIX
ACR STANDARD FOR TELERADIOLOGY
ACKNOWLEDGMENT
Reprinted with permission of the American College of Radiology. No otherrepresentation of this article is authorized without express, written permis-sion from the American College of Radiology.
The American College of Radiology, with more than 30,000 members,is the principal organization of radiologists, radiation oncologists, and clin-ical medical physicists in the United States. The College is a nonprofit professional society whose primary purposes are to advance the science ofradiology, improve radiologic services to the patient, study the socioeco-nomic aspects of the practice of radiology, and encourage continuing edu-cation for radiologists, radiation oncologists, medical physicists, and personspracticing in allied professional fields. The American College of Radiologywill periodically define new practice guidelines and technical standards forradiologic practice to help advance the science of radiology and to improvethe quality of service to patients throughout the United States. Existing prac-tice guidelines and technical standards will be reviewed for revision orrenewal, as appropriate, on their fifth anniversary or sooner, if indicated.Each practice guideline and technical standard, representing a policy state-ment by the College, has undergone a thorough consensus process in whichit has been subjected to extensive review, requiring the approval of the Com-mission on Quality and Safety as well as the ACR Board of Chancellors, theACR Council Steering Committee, and the ACR Council. The practice
PACS: A Guide to the Digi tal Revolut ion550
DRE26 11/16/2005 10:04 AM Page 550
guidelines and technical standards recognize that the safe and effective useof diagnostic and therapeutic radiology requires specific training, skills, andtechniques, as described in each document. Reproduction or modification ofthe published practice guideline and technical standard by those entities notproviding these services is not authorized. 1994 (Res. 21) Revised 1995 (Res.26)Revised 1998 (Res. 35)Revised 2002 (Res. 11) Effective 1/1/03
ACR TECHNICAL STANDARD FOR TELERADIOLOGY PREAMBLE
These guidelines are an educational tool designed to assist practitioners inproviding appropriate radiologic care for patients. They are not inflexiblerules or requirements of practice and are not intended, nor should they beused, to establish a legal standard of care. For these reasons and those setforth below, the American College of Radiology cautions against the use ofthese guidelines in litigation in which the clinical decisions of a practitionerare called into question. The ultimate judgment regarding the propriety ofany specific procedure or course of action must be made by the physician or medical physicist in light of all the circumstances presented. Thus, anapproach that differs from the guidelines, standing alone, does not neces-sarily imply that the approach was below the standard of care. To the con-trary, a conscientious practitioner may responsibly adopt a course of actiondifferent from that set forth in the guidelines when, in the reasonable judg-ment of the practitioner, such course of action is indicated by the conditionof the patient, limitations on available resources or advances in knowledgeor technology subsequent to publication of the guidelines. However, a prac-titioner who employs an approach substantially different from these guide-lines is advised to document in the patient record information sufficient toexplain the approach taken. The practice of medicine involves not only thescience, but also the art of dealing with the prevention, diagnosis, alleviationand treatment of disease. The variety and complexity of human conditionsmake it impossible to always reach the most appropriate diagnosis or topredict with certainty a particular response to treatment. It should be rec-ognized; therefore, that adherence to these guidelines will not assure anaccurate diagnosis or a successful outcome. All that should be expected isthat the practitioner will follow a reasonable course of action based oncurrent knowledge, available resources, and the needs of the patient todeliver effective and safe medical care. The sole purpose of these guidelinesis to assist practitioners in achieving this objective.
TELERADIOLOGY 551
DRE26 11/16/2005 10:04 AM Page 551

I . INTRODUCTION AND DEFINITION
Teleradiology is the electronic transmission of radiologic images from onelocation to another for the purposes of interpretation and/or consultation.Teleradiology may allow more timely interpretation of radiologic images andgive greater access to secondary consultations and to improved continuingeducation. Users in different locations may simultaneously view images.Appropriately utilized, teleradiology may improve access to radiologic inter-pretations and thus significantly improve patient care. Teleradiology is notappropriate if the available teleradiology system does not provide images ofsufficient quality to perform the indicated task. When a teleradiology systemis used to render the official interpretation,1 there should not be a clinicallysignificant loss of data from image acquisition through transmission to finalimage display. For transmission of images for display use only, the imagequality should be sufficient to satisfy the needs of the clinical circumstance.
This standard defines goals, qualifications of personnel, equipmentguidelines, licensing, credentialing, liability, communication, quality control,and quality improvement for teleradiology. While not all-inclusive, the stan-dard should serve as a model for all physicians and healthcare workers whoutilize teleradiology. A glossary of commonly used terminology (notreprinted here) and a reference list are included.
I I . GOALS
Teleradiology is an evolving technology. New goals will continue to emerge.The current goals of teleradiology include:
A. Providing consultative and interpretative radiologic services.B. Making radiologic consultations available in medical facilities
without on-site radiologic support.C. Providing timely availability of radiologic images and image inter-
pretation in emergent and nonemergent clinical care areas.
PACS: A Guide to the Digi tal Revolut ion552
1 The ACR Medical Legal Committee defines official interpretation as that writtenreport (and any supplements or amendments thereto) that attach to the patient’s perma-nent record. In healthcare facilities with a privilege delineation system, such a writtenreport is prepared only by a qualified physician who has been granted specific delineatedclinical privileges for that purpose by the facility’s governing body upon the recommen-dation of the medical staff.
DRE26 11/16/2005 10:04 AM Page 552
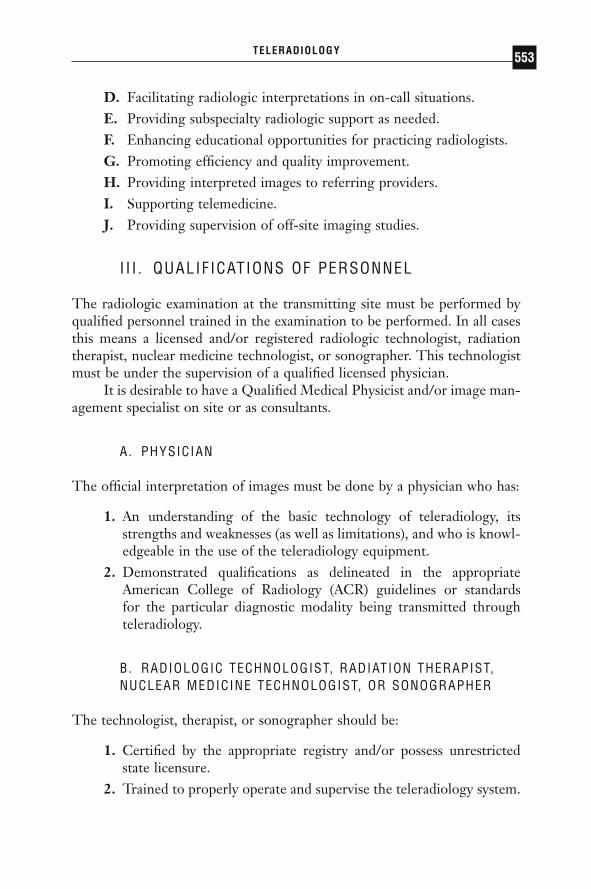
D. Facilitating radiologic interpretations in on-call situations.E. Providing subspecialty radiologic support as needed.F. Enhancing educational opportunities for practicing radiologists.G. Promoting efficiency and quality improvement.H. Providing interpreted images to referring providers.I. Supporting telemedicine.J. Providing supervision of off-site imaging studies.
I I I . QUALIFICATIONS OF PERSONNEL
The radiologic examination at the transmitting site must be performed byqualified personnel trained in the examination to be performed. In all casesthis means a licensed and/or registered radiologic technologist, radiationtherapist, nuclear medicine technologist, or sonographer. This technologistmust be under the supervision of a qualified licensed physician.
It is desirable to have a Qualified Medical Physicist and/or image man-agement specialist on site or as consultants.
A. PHYSICIAN
The official interpretation of images must be done by a physician who has:
1. An understanding of the basic technology of teleradiology, itsstrengths and weaknesses (as well as limitations), and who is knowl-edgeable in the use of the teleradiology equipment.
2. Demonstrated qualifications as delineated in the appropriate American College of Radiology (ACR) guidelines or standardsfor the particular diagnostic modality being transmitted through teleradiology.
B. RADIOLOGIC TECHNOLOGIST, RADIATION THERAPIST,NUCLEAR MEDICINE TECHNOLOGIST, OR SONOGRAPHER
The technologist, therapist, or sonographer should be:
1. Certified by the appropriate registry and/or possess unrestrictedstate licensure.
2. Trained to properly operate and supervise the teleradiology system.
TELERADIOLOGY 553
DRE26 11/16/2005 10:04 AM Page 553

C. QUALIFIED MEDICAL PHYSICIST
A Qualified Medical Physicist is an individual who is competent to practiceindependently in one or more of the subfields in medical physics. The ACRconsiders that certification and continuing education in the appropriate sub-field(s) demonstrate that an individual is competent to practice one or moreof the subfields in medical physics and to be a Qualified Medical Physicist.The ACR recommends that the individual be certified in the appropriatesubfield(s) by the American Board of Radiology (ABR).
The appropriate subfields of medical physics for this standard areTherapeutic Radiological Physics, Diagnostic Radiological Physics, MedicalNuclear Physics, and Radiological Physics.
The continuing education of a Qualified Medical Physicist should bein accordance with the ACR Practice Guideline for Continuing MedicalEducation (CME).
D. IMAGE MANAGEMENT SPECIALIST
1. The image management specialist is an individual who is qualifiedto assess and provide problem-solving input, initiate repair, and coordinatesystem-wide maintenance programs to assure sustainable high-image qualityand system function. This individual would also be directly involved withany system expansion programs.
2. This specialist should be available in a timely manner in case of mal-function to facilitate return to optimal system functionality.
IV. EQUIPMENT SPECIFICATIONS
Specifications for equipment used in teleradiology will vary depending onthe individual facility’s needs, but in all cases it should provide image qualityand availability appropriate to the clinical need.
Compliance with the ACR/NEMA (National Electrical ManufacturersAssociation) Digital Imaging and Communication in Medicine (DICOM)standard is strongly recommended for all new equipment acquisitions, andconsideration of periodic upgrades incorporating the expanding features ofthat standard should be part of the continuing quality improvementprogram.
Equipment guidelines cover two basic categories of teleradiology whenused for rendering the official interpretation: small matrix size (e.g., com-
PACS: A Guide to the Digi tal Revolut ion554
DRE26 11/16/2005 10:04 AM Page 554

puted tomography [CT], magnetic resonance imaging [MRI], ultrasound,nuclear medicine, digital fluorography, and digital angiography) and largematrix size (e.g., digital radiography and digitized radiographic films).
Small matrix: The data set should provide a minimum of 512 ¥ 512matrix size at a minimum 8-bit pixel depth for processing or manip-ulation with no loss of matrix size or bit depth at display.
Large matrix: The data set should allow a minimum of 2.5 lp/mmspatial resolution at a minimum 10-bit pixel depth.
A. ACQUISITION OR DIGITIZATION
Initial image acquisition should be performed in accordance with the appro-priate ACR modality or examination guideline or standard.
1. DIRECT IMAGE CAPTURE The entire image data set produced by thedigital modality in terms of both image matrix size and pixel bit depth, shouldbe transferred to the teleradiology system. It is recommended that theDICOM standard be used.
2. SECONDARY IMAGE CAPTURE
a. Small matrix images: Each individual image should be digitized toa matrix size as large as or larger than that of the original image bythe imaging modality. The images should be digitized to a minimumof 8 bits pixel depth. Film digitization or video frame grab systemsconforming to the above specifications are acceptable.
b. Large matrix images: These images should be digitized to a matrixsize corresponding to 2.5 lp/mm or greater, measured in the origi-nal detector plane. These images should be digitized to a minimumof 10 bits pixel depth.
3. GENERAL REQUIREMENTS At the time of acquisition (small or largematrix), the system must include annotation capabilities including patientname, identification number, date and time of examination, name of facilityor institution of acquisition, type of examination, patient or anatomic partorientation (e.g., right, left, superior, inferior), and amount and method ofdata compression.
The capability to record a brief patient history is desirable.
TELERADIOLOGY 555
DRE26 11/16/2005 10:04 AM Page 555

B. COMPRESSION
Data compression may be used to increase transmission speed and reducestorage requirements. Several methods, including both reversible and irre-versible techniques, may be used, under the direction of a qualified physi-cian, with no reduction in clinically significant diagnostic image quality. Thetypes and ratios of compression used for different imaging studies transmit-ted and stored by the system should be selected and periodically reviewedby the responsible physician to ensure appropriate clinical image quality.
C. TRANSMISSION
The type and specifications of the transmission devices used will be dictatedby the environment of the studies to be transmitted. In all cases, for officialinterpretation, the digital data received at the receiving end of any trans-mission must have no loss of clinically significant information. The trans-mission system shall have adequate error-checking capability.
D. DISPLAY CAPABILITIES
Display workstations used for official interpretation and employed for small-matrix and large-matrix systems should provide the following characteristics:
1. Luminance of the gray-scale monitors should be at least 50 foot-lamberts.
2. Lighting in the reading room that can be controlled to eliminatereflections in the monitor and to lower the ambient lighting levelas much as is feasible.
3. Capability for selecting image sequence.4. Capability of accurately associating the patient and study demo-
graphic characterizations with the study images.5. Capability of window and level adjustment, if those data are
available.6. Capability of pan and zoom functions.7. Capability of rotating or flipping the images provided correct
labeling of patient orientation is preserved.
PACS: A Guide to the Digi tal Revolut ion556
DRE26 11/16/2005 10:04 AM Page 556

8. Capability of calculating and displaying accurate linear measure-ments and pixel value determinations in appropriate values for themodality (e.g., Hounsfield units for CT images), if those data areavailable.
9. Capability of displaying prior image compression ratio, processing,or cropping.
10. The following elements of display:a. Matrix size.b. Bit depth.c. Total number of images acquired in the study.d. Clinically relevant technical parameters.
When the display systems are not used for the official interpretation, theyneed not meet all the characteristics listed above.
E. ARCHIVING AND RETRIEVAL
If electronic archiving is to be employed, the guidelines listed below shouldbe followed:
1. Teleradiology systems should provide storage capacity sufficient tocomply with all facility, state, and federal regulations regarding medicalrecord retention. Images stored at either site should meet the jurisdictionalrequirements of the transmitting site. Images interpreted off-site need notbe stored at the receiving facility, provided they are stored at the transmit-ting site. However, if the images are retained at the receiving site, the reten-tion period of that jurisdiction must be met as well. The policy on recordretention must be in writing.
2. Each examination data file must have an accurate correspondingpatient and examination database record that includes patient name, identi-fication number, examination date, type of examination, and facility at whichexamination was performed. It is desirable that space be available for a briefclinical history.
3. Prior examinations should be retrievable from archives in a timeframe appropriate to the clinical needs of the facility and medical staff.
4. Each facility should have policies and procedures for archiving andstorage of digital image data equivalent to the policies for protection of hard-copy storage media to preserve imaging records.
TELERADIOLOGY 557
DRE26 11/16/2005 10:04 AM Page 557
F. SECURITY
Teleradiology systems should provide network and software security proto-cols to protect the confidentiality of patients’ identification and imaging dataconsistent with federal and state legal requirements. There should be meas-ures to safeguard the data and to ensure data integrity against intentional orunintentional corruption of the data.
G. RELIABILITY AND REDUNDANCY
Quality patient care may depend on timely availability of the image inter-pretation. Written policies and procedures should be in place to ensure con-tinuity of teleradiology services at a level consistent with those for hard-copyimaging studies and medical records within a facility or institution. Thisshould include internal redundancy systems, backup telecommunicationlinks, and a disaster plan.
V. LICENSING, CREDENTIALING, AND LIABILITY
Physicians who provide the official interpretation of images transmitted byteleradiology should maintain licensure as may be required for provision ofradiologic service at both the transmitting and receiving sites. When pro-viding the official interpretation of images from a hospital, the physicianshould be credentialed and obtain appropriate privileges at that institution.These physicians should consult with their professional liability carrier to ensure coverage in both the sending and receiving sites (state or jurisdiction).
The physician performing the official interpretations is responsible forthe quality of the images being reviewed.2
Images stored at either site should meet the jurisdictional requirementsof the transmitting site. Images interpreted off-site need not be stored at thereceiving facility, provided they are stored at the transmitting site. However,
PACS: A Guide to the Digi tal Revolut ion558
2 The ACR Rules of Ethics state: “it is proper for a diagnostic radiologist to provide aconsultative opinion on radiographs and other images regardless of their origin. A diag-nostic radiologist should regularly interpret radiographs and other images only when theradiologist reasonably participates in the quality of medical imaging, utilization review,and matters of policy which affect the quality of patient care.”
DRE26 11/16/2005 10:04 AM Page 558

if images are retained at the receiving site, the retention period of that juris-diction must be met as well. The policy on record retention should be inwriting.
The physicians who are involved in practicing teleradiology willconduct their practice in a manner consistent with the bylaws, rules, and reg-ulations for patient care at the transmitting site.
VI. DOCUMENTATION
Communication is a critical component of teleradiology. Physicians inter-preting teleradiology examinations should render reports in accordance withthe ACR Practice Guideline for Communication: Diagnostic Radiology.
VII . QUALITY CONTROL AND IMPROVEMENT,SAFETY, INFECTION CONTROL, AND PATIENTEDUCATION CONCERNS
Policies and procedures related to quality, patient education, infectioncontrol, and safety should be developed and implemented in accordance withthe ACR Policy on Quality Control and Improvement, Safety, InfectionControl, and Patient Education Concerns appearing elsewhere in the ACRPractice Guidelines and Technical Standards book.
Any facility using a teleradiology system must have documented poli-cies and procedures for monitoring and evaluating the effective management,safety, and proper performance of acquisition, digitization, compression,transmission, archiving, and retrieval functions of the system. The qualitycontrol program should be designed to maximize the quality and accessibil-ity of diagnostic information.
A test image, such as the SMPTE test pattern, should be captured,transmitted, archived, retrieved, and displayed at appropriate intervals, butat least monthly, to test the overall operation of the system under conditionsthat simulate the normal operation of the system. As a spatial resolution test, at least 512 ¥ 512 resolution should be confirmed for small-matrix official interpretation, and 2.5 lp/mm resolutions for large-matrix officialinterpretation.
As a test of the display, SMPTE pattern data files sized to occupy thefull area used to display images on the monitor should be displayed. Theoverall SMPTE image appearance should be inspected to assure the absenceof gross artifacts (e.g., blurring or bleeding of bright display areas into dark
TELERADIOLOGY 559
DRE26 11/16/2005 10:04 AM Page 559

areas or aliasing of spatial resolution patterns). Display monitors used forprimary interpretation should be tested at least monthly. As a dynamic rangetest, both the 5% and the 95% areas should be seen as distinct from therespective adjacent 0% and 100% areas.
The use of teleradiology does not reduce the responsibilities for themanagement and supervision of radiologic medicine.
PACS: A Guide to the Digi tal Revolut ion560
DRE26 11/16/2005 10:04 AM Page 560

AAbnormality, communication, speed of,
114Accelerated graphics port (AGP), 178Access time, hard drive, 322Acronis, 311Active-active clustering, 308Administrator accounts, 315Agfa-Gevaert, computed radiography
(CR) systems, 203–204Alberts v. Devine, 167American College of Radiology (ACR)
on digital image data management,151–152
on image storage, 166–167, 190–191NEMA 2.0 standard, 190–191standard (Appendix), 550–560standard, overview of, 150–151,
544–545American Medical Association (AMA),
teleradiology policy, 152–153Analog-to-digital converters (ADC), 196
Annotation capabilities, images, 150Antivirus software, 313Appendices, request for proposal (RFP),
63Appletalk protocol, 275Application entities (AE), 191Application program interface (API), 304Architecture. See PACS architectureArchiving. See Disaster recovery; Image
archive; StorageArrival process, queuing analysis of,
86–87Artifacts
computed radiography (CR), 209–210double exposures, 209–210lightbulb effect, 209
Asynchronous transfer mode (ATM),292–293
advantages of, 292, 299cards, 275compared to Ethernet, 292limitations of, 293, 529
INDEX
DRE(Index) 11/16/2005 10:05 AM Page 561
Index562
AT advanced (ATA) interface, 323–324Authentication, 314Autorouting, image manager, 53Average-intensity projection (AveIP)
images, 452
BBandwidth, 284–287
and cabling, 285defined, 526networks/speeds, 285transmission media differences, 529
Big bang approach, implementation, 57Binary digits, and CPU operation,
176–177, 284Bits, 284Black bone technique, 206–207, 396Bottlenecks, 288–289Breakeven analysis, 135–137Breast cancer
computer-aided diagnosis (CAD),423–424, 436–441
See also Mammography, digitalBridging, networks, 278–280, 282Bright-lighting film, 202Broker, RIS/PACS interface, 22Browsers, Internet, 404Bus, computer function, 177–178Bytes, 284
CCables
networks, 274and transmission speed, 285
Calibration, monitors, 355–358Capital expenditures, 137–138
types of, 43, 138Cash flow, 126–128
costs, 127–128payback period, 128–129
Cassetteless computed radiography (CR)systems, 204
Centera, 264Centralized model, 259–261, 402–404Central processing unit (CPU), operation
of, 176–177Charge coupled device (CCD) scanners,
196, 525
C language, 179Clerical personnel
PACS, impact on job, 77–79workflow analysis, 77–79
Client devices, 379–380Clientless backup, 330Clinical archive, 252–253Clinical review workstation, request for
proposal (RFP) description, 55–56Clinical review section, request for
proposal (RFP), 49Clinicians
PACS impact on, 112–114time and cost-savings, 142
Clusteringactive-active clustering, 308clustered failover model, 307–308PACS components, 255
Compact disc (CD)digital teaching files (DTFs)
information, 511storage media, 336
Competitionimpact of PACS implementation, 143market share analysis, 37–39
Compression methods. See Imagecompression
CompuServe, Inc. v. Patterson, 165Computed radiography (CR), 200–211
contrast enhancement algorithms,206–207
contrast resolution, 201–202detective quantum efficiency (DQE),
200–201development of systems, 202–203compared to digital radiography, 19–20,
211, 215–217dynamic range control processing
algorithm, 208image acquisition process, 197–199image artifacts, 209–210image compression, 240image production flowchart, 199image segmentation algorithms,
205–206increase in use of, 197multiscale image contrast amplification
(MUSICA), 208
DRE(Index) 11/16/2005 10:05 AM Page 562

Index 563
noise, 202operation of, 18quality assurance-quality control
(QA-QC), 220compared with screen-film, 199–200,
202separation of functions of, 18spatial frequency processing algorithms,
207–208spatial resolution, 201system features, 199–200technological advances, 203–205, 221uses of, 18
Computed tomography (CT)image compression, 241multidetector computed tomography
(MDCT), 108, 396, 450–451, 5123-D scans, 449–450
Computer-aided diagnosis (CAD)classification schemes, 439–440as diagnosis confirmation, 423–424effectiveness rate, 438image requirements, 437limitations of, 238for mammography, 423–424, 436–441as measure of compression, 238, 240
Computer functionsapplication programs, 180–181bus, 177–178computer languages, 179–180input, 174memory, 175–176operating systems, 178–179output, 175processing, 176–177
ConfidentialityHIPAA privacy rule, 158, 506, 544record-keeping, 166–167
Content addressable storage (CAS), 264,334–335
companies offering, 264Contracts
maintenance contract, 61–62negotiation with vendors, 70–71
Contrast enhancement algorithms,206–207
Contrast resolution. See ResolutionCore servers. See Servers
Costs, 43–44, 127–128, 137–138capital expenditures, 43, 137–138fixed, 135irrelevant costs, 127–128sunk costs, 127variable, 135–136
Cost-savings, 138–143clinician time, 142film-costs, 32, 36, 140film library cost, 140–141lost/misplaced film, 141multiple sites, reduction of, 142multisite image reading, 142–143network costs, 300–301patient outcomes, 143per-exam basis example, 138–139redos, 141speech recognition system, 481
Credentialing, 543
DDatabase
backups, 312information stored, 250
Database managerfunctions of, 20optimal system, components of, 52–53request for proposal (RFP) description,
52–53software used, 20
Data link layer, networks, 275Data transfer rate, hard drive, 323DAX Archiving Solutions, 311Decision-making
decision support and order entry, 490decision support tools, 107decision model, vendor selection,
66–69Default display protocols (DDPs), 105Default shares, disabling, 316Dent v. West Virginia, 158Design of system, 402–406Desktop integration, speech recognition
system, 476Detective quantum efficiency (DQE),
200–201Diagnostic review section, request for
proposal (RFP), 49
DRE(Index) 11/16/2005 10:05 AM Page 563

Index564
Diagnostic workstationsoperation of, 24–25, 390request for proposal (RFP) description,
54–55software options, 55
DICOMautorouting destinations, 53digital mammography standard,
366–367header, example of, 191–192and IHE initiative, 84image acquisition standards, 20, 50–51,
150, 189–194image compression standard,
235–236language structure, 191lookup tables, 359medical image resource center (MIRC),
499system readiness and vendor, 51worklist standards, 102, 193–194,
251–252DICOM servers
functions of, 252as image servers, 305–307
Digital, meaning of, 10Digital cameras, 196Digital driving level (DDL), 355–356Digital format
clinical effectiveness, 11HIPAA requirement, 10, 53needs in medical environment,
11–12quality issues, 10
Digital imagescompression methods, 150, 221–222construction of, 184–185enhancement tools, 106–107,
186–187future imaging modalities, 220–221grayscale, 185–186image analysis, 187image manipulation tools, 150, 393,
396–397image processing, 186–187image understanding, 187matrix categories, 149volumetric navigation, 107, 109
Digital Imaging and Communications inMedicine (DICOM) standards. SeeDICOM
Digital linear tape (DLT), 311–312Digital radiography (DR), 211–217
compared to computed radiography(CR), 19–20, 211, 215–217
cost factors, 214direct digital radiography (DDR), 19,
212image compression, 240image production process, 212–213image quality, 215indirect digital radiography, 213operation of, 18–19system features, 213–215
Digital teaching files (DTFs), 500–511authoring tools, 508–509case collections, 510CDs for case collections, 511development specifications, 501divisional files, 504flagged cases, 503full file, 507general format for, 502image annotations, 509key images, 507lists, 507medical record integration,
505–506MIRC compatibility, 504–505patient privacy, 506–507presentation tools, 510private files, 504public files, 504published files, 504quality assurance, 508teaching cases, types of, 503users of, 509–510Web resources, 500
Digital visual interface (DVI), 360,360–361
Digitization devices, 17Direct attached storage (DAS), 253–254,
328–329set-up diagram, 329
Direct digital radiography (DDR), 19,212
DRE(Index) 11/16/2005 10:05 AM Page 564
Index 565
Direct image capture, 150benefits of, 195elements of, 16–17, 194–195viewing levels, 195
Disaster recovery, 262–267database backups, 312disk-to-disk strategy, 262–264and exam priority, 267and mean time to failure, 324–325operating system imaging, 311as PAC archive, 252removable media, 264–265, 311–312request for proposal (RFP) description,
51–52solution requirements, 266–267uninterruptible power supply (UPS),
310–311See also Security
Discount rate, 131, 133Discrete cosine function (DCT), 233Disk-to-disk, disaster recovery strategy,
262–264Display protocols. See Hanging protocolsDisplays. See MonitorsDistributed file system (DFS), 334Distributed model, 257–259, 403–404Doctor-patient relationship, radiologist
malpractice, 164Double exposures, computed radiography
(CR), 209–210Downtime contingency plan, 43DVD storage, 336–337Dynamic range control processing
algorithm, 208
EEdge enhancement, 107EDictation, 471Education. See Digital teaching files
(DTFs); Imaging informaticsElectronic data interconnect (EDI), and
XML, 375–376E-mail, authorized-only delivery, 314Encryption
new technology file system (NTFS),316
user authentication, 314See also Security
Enterprise medical record (EMR),purpose of, 11
Ergonomicsguidelines, 362workstation environment, 417, 420–422
Error-checkingdata transmission, 150RIS-HIS interface, 192–193, 218
Error recovery, by user, 416Ethernet
compared to ATM, 292cards, 275complex network, example, 295–298gigabit Ethernet, 299–300resource reservation protocol (RSVP),
299shared, 276–278speeds, 285–286
“Everyone” group, avoiding, 315ExaGrid, 264Exams, RIS scheduling of, 13–14Expenses, types of, 43–44Extensible markup language (XML),
375–376
FFAT files, 328Fault tolerance, PACS architecture,
254–257Federal regulations. See Legal/regulatory
issuesFiber-optic cable, 274, 285Fibre Channel, 323–324
and storage area network (SAN),330–331
Filers. See Network attached storage(NAS)
File systems, 327–328FAT file system, 328new technology file system (NTFS),
316, 328Film, cost-savings, 32, 36, 140Film digitizers, 17, 196–197
charge coupled device (CCD) scanners,196, 525
laser scanners, 197, 525Filmless operation, 101Film library, cost-savings, 140–141
DRE(Index) 11/16/2005 10:05 AM Page 565
Index566
Financial analysis, 125–143breakeven analysis, 135–137cash flow, 126–128cost reduction, 32, 36, 138–143costs, 43–44, 137–138expenses, types of, 43–44internal rate of return, 133–135net present value (NPV), 129–133objectives of, 126operating expenses, 43–44PACS trade-off, 137See also Impact analysis
First approximation approach, 3995-MP display, 353, 370, 391–392, 530Fixed costs, 135Fixed noise, computed radiography (CR),
202Fluoroscopy, image compression,
241–242Food and Drug Administration (FDA)
Medical Devices Amendment (1976),154–155
teleradiology policy statement, 155–156Frame-grabbing image acquisition, 16Frame mode, 107Fuji, computed radiography (CR) systems,
203–204Future demand, impact analysis, 39–41Future trends
image acquisition, 220–222, 225image compression, 242–245order entry, 491–492PACS networks, 299–301workstations, 422–425
GGamma correction table, 359Gateways, 276Gigabit Ethernet, 299–300Gigabits, 285Goals
request for proposal (RFP), 47strategic, 29
Graphical processing unit (GPU), 178Graphical user interface (GUI), 179Graphics cards, 358–361
medical-grade, 358–359slot type, 358–359
video random access memory (VRAM),359
Grayscale, 185–186adjustment, 393, 396future enhancement, 221medical-grade grayscale, 361
Grid servers, 334Grid storage, 264, 334
set-up example, 335
HHand v. Tavera, 164Hanging protocols, 104–106
default display protocols (DDPs), 105defined, 399methods of use, 105, 415
Hard drives, 321–323access time, 322data transfer rate, 323highest capacity, 323interfaces, 323–324operation of, 321–323RAID controller, 325–326
Hardwareservers, companies offering, 309workstations, 391–392
Health Care Financing Administration(HCFA), 156–157
Internet Security Policy, 156–157Health Insurance Portability and
Accountability Act (HIPAA),157–158
digital format requirement, 10, 53impact of, 145–146and order-entry systems, 490privacy rule, 158, 506security rule, 158transaction rule, 158
Health Level Seven (HL7)and IHE initiative, 84, 102as RIS-HIS standard, 193, 476–477server, functions of, 250–251
Helium-neon (HeNe) gas laser scanner,197
Hierarchical storage management (HSM),254–255, 264–265, 334, 339–340
Hospital information system (HIS)method
DRE(Index) 11/16/2005 10:05 AM Page 566

Index 567
scheduling, 14speech recognition system interface,
476–478Human visual system (HVS)-based
compression, 244–245Hypertext markup language (HTML),
404Hypertext transport protocol (HTTP),
375
IImage acquisition, 16–20, 189–225
common problems, 218–219and computed radiography (CR),
18–20, 200–211DICOM standards, 20, 50–51, 150,
189–194and digital radiography (DR), 18–20,
211–217direct capture, 16–17, 150, 194–195and film digitizers, 17, 196–197frame-grabbing, 16future trends, 220–222, 225image digitization, 17mammography, digital, 364–367with multidetector scanner, 108non-digital methods, 196quality control procedures, 219–220request for proposal (RFP) description,
50–51RIS-HIS data transfer modes,
193–194secondary capture, 150
Image archiveclinical archive, 252–253comparison of approaches, 265disaster recovery, 252, 262–267operation of, 20–21software used, 20standards, 150, 152See also Disaster recovery; Storage
Image compression, 231–245benefits of, 526–527computed radiography (CR), 240computed tomography (CT), 241and CPU power, 232DICOM standard, 235–236digital radiography (DR), 240
fluoroscopy, 241–242future view, 242–245irreversible (lossy) compression, 150,
232–235, 252, 527JPEG2000, 235–236, 240–241, 252,
381, 527magnetic resonance imaging (MRI),
241mammography, 239–240maximization of compression ratio,
237–238medical images, bits per pixel, 235nuclear medicine, 242quality factor, 232reversible (lossless) compression, 150,
231–232, 527trade-offs, 236–237ultrasound, 242wavelet transform, 222, 233–234,
528–529Image displays. See MonitorsImage distribution, 374–382
cost factors, 378hospital intranet, 376–377image distribution servers, 253Internet. See Web-based distributionmammography, digital, 442
Image managementACR standard, 151–152functions of, 21image management specialist, 149software, 399workflow flowchart, 23
Image managerautorouting capabilities, 53functions of, 53purge by, 53request for proposal (RFP) description,
53Image manipulation tools, 150, 393,
396–397Image retrieval, mammography, digital,
367–368Images
annotation capabilities, 150overload, control of, 108–110transmission methods, 529See also Digital images
DRE(Index) 11/16/2005 10:05 AM Page 567

Index568
Image segmentation algorithms, 205–206Image servers, DICOM, 305–307Imaging informatics, 511–519
challenges related to, 513–514defined, 511imaging informatician, role of, 511as radiology subspecialty, 512–513and resident education, 515–519
Imaging modalitiesrequest for proposal (RFP)
descriptions, 48–49types of, 48–49
Imaging plate (IP) computed radiography(CR), 197–198
Imaging technology, benefits of, 10Impact analysis, 32–37
on film-handling activities, 36–37on film-related expense, 32, 36of future demand, 39–41market share analysis, 37–39See also Financial analysis
Implementation planbig bang approach, 57phased approach, 57–58request for proposal (RFP) description,
57–58of strategic plan, 31–35
Indirect digital radiography, 213Information objects (IO), 191Input devices, for computers, 174Installation of system, request for
proposal (RFP) description, 59–60Insurance coverage
Medicare coverage, 458–505, 545–546out-of-state malpractice incidents, 1663-D imaging, 460–463
Integrating the Healthcare Enterprise(IHE) initiative
on compatibility, 102purpose of, 84
Interfaceshard drive, 323–324RIS-HIS error-checking, 192–193,
218RIS-PACS interface, 22–23speech recognition system interface,
476–478See also User interface
Internal rate of return, 133–135tables, 134–135
International Classification of Disease(ICD-9), order entry codes, 490
International Organization forStandardization (ISO), networkmodel, 270–272
International Shoe v. Washington, 165Internet, 374–376
browsers, 404elements of, 374protocols, 375virtual private networks (VPNs), 300
Internet Security Policyauthentication procedures, 157Health Care Financing Administration
(HCFA), 156–157Interpretation process, 106–110
clinical information, retrieval of,106–108
image overload, control of, 108–110volumetric imaging issues, 109–110
Intranetcomponents of, 376cost factors, 378image distribution, 376–377pros/cons of, 377protocols, 377
Introduction section, request for proposal(RFP), 47
IPX protocol, 275–276, 278Iron Mountain, 263, 265Irrelevant costs, 127–128Irreversible (lossy) compression, 150,
232–235, 252, 527transformation in, 233
ISDN lines, 529Itemized pricing, vendors, 64
JJava, 180Joint Photographic Experts Group
( JPEG), 233compression standard, 235–236,
240–241, 252, 381, 528Jukebox, 20Just noticeable difference (JND),
354
DRE(Index) 11/16/2005 10:05 AM Page 568

Index 569
KKey images, digital teaching files (DTFs),
507Kodak, computed radiography (CR)
systems, 202–204Konica, computed radiography (CR),
203
LLandscape mode, 360Language model, speech recognition
system, 472–473Languages, computer, 179–180Laser scanners, 197Layers
file system, 327–328layer 3 switching, 300networks, 272–275
Legal/regulatory issues, 145–167American College of Radiology (ACR)
standard, 151–152, 544–545,550–560
American Medical Association (AMA)policy, 152–153
confidentiality/security, 167, 544credentialing, 543Digital Imaging and Communications
in Medicine (DICOM), 20, 84, 149Food and Drug Administration (FDA)
regulation, 154–156Health Care Financing Administration
(HCFA) policy, 156–157Health Insurance Portability and
Accountability Act (HIPAA),157–158
Health Level Seven (HL7), 84, 102,193
insurance coverage issues, 165–166,545–546
malpractice issues, 163–165, 543–544matrix categories, 149National Electrical Manufacturers
Association (NEMA), 149record-keeping regulations, 166–167standards/practice guidelines, 544–545state initiatives, 163state licensure, 158–163, 542–543
Legatto, 265
Licensure, state requirements, 158–163,543
Life cycle management, 254–255, 264–265Lightbulb effect, 209Lighting environment, for workstations,
420–421Light photon noise, computed
radiography (CR), 202Linear media, 176Line spread function (LSF), computed
radiography (CR), 201Linked stack mode, 107Liquid crystal displays (LCDs), 348,
391–392digital visual interface (DVI), 360luminescence, 356–357medical-grade, 357–358mount, 358
Lists, digital teaching files (DTFs), 507Load-balancing model, 305–307Lockouts, 414Lookup tables, 206, 359Lossless compression, 150, 231–232, 527Lossy compression, 150, 232–235, 252,
527transformation in, 233
Lost film, PACS cost-saving, 141Luminance, monitors, 354–355, 361Lumisys, computed radiography (CR)
systems, 203
MMacros, speech recognition system, 475Magnetic resonance imaging (MRI),
image compression, 241Magneto-optical (MO) drives, 337Mainframe systems, 386–387Maintenance/support of system, request
for proposal (RFP) description,61–62
Malpractice claims, 163–165out-of-state actions, 165–166, 543–544state laws, 165successful, elements of, 163–164
Mammography, false negatives, 435–436Mammography, digital, 363–371, 441–443
challenges related to, 434–435,441–442
DRE(Index) 11/16/2005 10:05 AM Page 569

Index570
Mammography, digital (cont.) computer-aided diagnosis (CAD),
423–424, 436–441DICOM standard, 366–367image acquisition, 364–367compression, 239–240image display, 368–369image distribution, 442image retrieval, 367–368levels of output, 365–366multiple systems, 370–371printing, 368–369quality assurance mandate, 89workstation, 370
Management of systemand strategic plan, 42–43See also Image management; Image
managerMarket share analysis, 37–39Matrix categories
future advances, 221image interpretation, 149
Maximum-intensity projection (MIP)images, 452–453
McKinney v. Schlatter, 164Mean time to failure, 324–325, 338Mean time to recovery, 326Medical Devices Amendment (1976),
154–155Medical Diagnostic Imaging Support
(MDIS), 402–403Medical-grade grayscale, 361Medical image resource center (MIRC),
496–500community diagram, 497DICOM images, 499indexing and searching, 498international community, 499objectives of, 497teaching files compatibility, 504–505
Medicare coverageteleradiology criteria, 545–5463-D imaging, 458–463
Megabits, 284Megabytes, 284, 320Memory
computer, types of, 175–176random access memory (RAM), 391
Mental model, user interface, 408–409Microsoft SQL Server, 20Minimum-intensity projection (MinIP)
images, 452Mirrored storage system, 100–101Modality worklist (MWL), 251–252Modulation transfer function (MTF),
computed radiography (CR), 201
Monitors, 348–362calibration, 355–358development of, 348digital visual interface (DVI),
360–3615-MP display, 353, 370, 391–392,
530graphics cards, 358–361liquid crystal displays (LCDs), 348lookup tables, 359luminance, 354–355, 361mammography, digital, 368–369medical-grade grayscale, 361mounting of, 358number for PACS system, 349–350operating room displays, 362physical size, 350–351pivoting, 360pixel pitch, 350–352radiologic imaging requirements,
351–354resolution/pitch, 350–351, 353, 530standards, 150
Moore, Gordon, 320Moore’s law, 230, 320Motherboard, 177Mottle, computed radiography (CR),
202Multidetector computed tomography
(MDCT), 396, 512scanner, 1083-D images, 450–451
Multi-institutional PACS, 115–116WAN virtual radiology department,
115–116Multiscale image contrast amplification
(MUSICA), 208Multiserver model, 304, 306MUMPS operating system, 178
DRE(Index) 11/16/2005 10:05 AM Page 570

Index 571
NNational Electrical Manufacturers
Association (NEMA), 149on image storage, 149, 190–191
NaturallySpeaking, 471Navigation process, 393–396, 415Near-line storage, 320–321Near line-storage, 51–53Near-line storage
automatic archive, 53optical storage, 336–337request for proposal (RFP) description,
51–52tape storage, 337–338
Needle-phosphor technology, 205Negligence, malpractice issue,
164–165Net present value (NPV), 129–133
formula, 130internal rate of return, 133–135risks of PACS, 131–133
Network Appliance, 264Network attached storage (NAS),
253–254, 263–264, 332–334companies offering, 264distributed file system (DFS), 334set-up diagrams, 329, 333
Network infrastructure, request forproposal (RFP) description, 56
Networksbandwidth, 284–287bottlenecks, 288–289bridging, 278–280, 282building, aspects of, 287–289cabling, 274cards, types of, 275data link layer, 275future trends, 299–301gateways, 276ISO standard, 270–272packets, 286–287, 292physical layer, 274postal system example, 273protocols, 275–276routing, 280–282shared Ethernet example, 276–278simple, components of, 271–275switching, 283, 287, 289
upgrading, 289–290See also PACS networks
New technology file system (NTFS), 316,328
Noise, computed radiography (CR), 202Nuclear medicine, image compression,
242
OOffline storage, 321Online storage, 320Operating expenses
financial analysis, 43–44types of, 43
Operating room displays, 362Operating systems
operating systems imaging, 311patches, 312–313security, 312–316types of, 178–179, 309–310
Operational fit, and PACS architecture,256
Optical storage, 336–337compact disc (CD) storage, 336DVD storage, 336–337magneto-optical (MO) drives, 337storing/handling, 337
Oracle, 20Order entry, 483–492
advantages of, 488–491basic principles, 484decision support, 490design of system, 485–488future trends, 491–492and HIPAA compliance, 490ICD-9 code, 490limitations of, 491
Orex CR system, 203Organic light emitting diode (OLED),
425OS/2 operating system, 178–179Output devices, for computers, 175
PPackets, networks, 286–287, 292PACS
benefits of, 3–4database manager, 20
DRE(Index) 11/16/2005 10:05 AM Page 571

Index572
PACS (cont.)financial analysis for, 43–44image acquisition, 16–20image archive, 20–21image distribution, 374–382image management, 21image retrieval tools, 106–107image routing, 14multi-institutional PACS, 115–116request for proposal (RFP), 45–71and RIS, 4, 13–15, 22–24and speech recognition system, 4strategic plan, 28–41technical strategic plan, 41–43Web-based system, 24–25workflow engineering, 74–92workflow flowchart, 23
PACS architecture, 250–267centralized model, 259–261, 402–404combined distributed/centralized
model, 261–262distributed model, 257–259, 403–404fault tolerance, 255–257and operational fit, 256scalability, 256and versatility, 256
PACS components, 15–16, 250–255archive system, 252–253clustering of, 255database, 250DICOM server, 252Health Level Seven (HL7) server,
250–251image distribution servers, 253modality worklist (MWL), 251–252monitors, 348–362servers, 250, 304–310storage, 253–254workstations, 24–25, 253
PACS networks, 291–301asynchronous transfer mode (ATM),
292–293complex, components of, 295–298disaster recovery, 310–312future trends, 299–301security measures, 312–316simple, example of, 294–295star typology, 297–298
compared to typical networks, 291wide-area networks (WANs), 293–294
Paperless operation, 101Passwords, 313–314
construction of, 314protection of screensaver, 315speech recognition system, 474
Patches, operating system, 312–313Patient information
appointment scheduling, 487–488error-checking, 192–193, 218indications, lists of, 485–486order entry system, 485–488
Patient outcomes, improved, 143Payback analysis
PAC pros/cons, 129payback period, 128–129
PCI Express slot, 359Penalty box, 218Phased approach, implementation, 57–58Photomultiplier tube (PMT), 198–199Photostimulable phosphor (PSP)-based
image sensor, 197–199Physical layer, networks, 274Physical security, 314–315Physicians, PACS impact on, 112–114Picture archiving and communication
systems (PACS). See entries underPACS
Pivoting, 360Pixels, 184–185
monitor pixel pitch, 350–352subpixels, 355
Portrait mode, 352, 360Powerquest, 311PowerScribe, 470Power supply, uninterruptible, 310–311Pre-fetch, 103–104
process of, 14strategies, 103–104
Presentation tools, digital teaching files(DTFs), 510
Printing, mammography, digital, 368–369
Privacydigital teaching files (DTFs), 506–507HIPAA rule, 158, 506
Privacy Act (1974), 156–157
DRE(Index) 11/16/2005 10:05 AM Page 572
Index 573
Processing, computer function, 176–177Productivity, quality assurance, 89–91Projection methods
computed radiography (CR), 18–20,200–211
digital radiography (DR), 18–20,211–217
film digitizers, 17, 196–197“Promotion of Quality Telemedicine,
The”, 152Protocols
HL7, 476–477Internet, 375intranet, 377networks, 275–276
Protocol stack, networks, 272
QQuality assurance-quality control (QA-
QC)digital teaching files (DTFs), 508federal mandate, 89image acquisition, 219–220in productivity/workflow, 89–91
Queuing analysis, 85–88of arrival process, 86–87issues to address, 88and queue characteristics, 87–88of service process, 87
RRadiologic technologists (RTs)
PACS, impact on job, 80–83in paper-based environments, 101time, cost-savings, 142workflow of. See Workflow analysis
Radiologistseducation. See Digital teaching files
(DTFs); Imaging informaticsmalpractice issues, 163–165, 543–544
Radiologynecessity of, 184traditional digital infrastructure, 13See also Teleradiology
Radiology information system (RIS). SeeRIS
RAID. See Redundant array ofinexpensive disks (RAID)
Random access memory (RAM), 176, 391Readiness assessment, for PACS, 30–31,
41–42Reading room, PACS set-up, 116–117Record-keeping, legal requirements,
166–167Redos, cost-savings, 141Redundant array of inexpensive disks
(RAID), 20–21, 176, 325–326hierarchical storage management
(HSM), 254–255online storage, 51versus pre-fetch, 103–104pros/cons of, 100RAID 0, 325RAID 1, 325RAID 3, 325RAID 4, 325–326RAID 5, 326RAID 6, 326RAID 10, 325
Regional Bell Operating Companies(RBOCs), leased networks, 293–294,296–297
Regius, 203Regulatory issues. See Legal/regulatory
issuesRemovable media
companies offering, 265, 311–312disaster recovery strategy, 264–265security measures, 315
Reporting process, 110–112speech recognition system, 110–111,
475, 482structured reporting, 111–112
Request for proposal (RFP), 45–71appendices, 63basic guidelines, 46–47clinical operations overview, 47–49clinical review section, 49clinical review workstation, 55–56contract negotiation, 70–71database manager, 52–53decision model, use of, 66–69diagnostic review, 49diagnostic review workstation, 54–55DICOM Query/Retrieve functionality,
53
DRE(Index) 11/16/2005 10:05 AM Page 573

Index574
Request for proposal (RFP) (cont.)disaster recovery subsystem, 51–52distribution of, 65image acquisition, 50–51image distribution via Web server, 55image manager, 53imaging modalities, workflow
description, 48implementation plan, 57–58installation of system, 59–60introduction section, 47near-line storage, 51–52network infrastructure description, 56objectives of, 46response time, 60–61RIS interface, 53–54site-specific operations, 48site visits, 67, 70storage system, 51strategic goals, 47system architecture, 50system reliability/uptime, 60–61system throughput/performance, 57technologist Q/A workstation, 56teleradiology operations, 50training program, 58–59vendor evaluation/selection, 65–70vendor information/selection, 62–63vendor maintenance/support, 61–62vendor response form, 63–64warranty period, 61
Reset function, 416Resolution
computed radiography (CR), 201–202monitors, 350–351, 353, 530
Resource reservation protocol (RSVP),299
Response time, request for proposal(RFP) description, 60–61
Return-on-investment (ROI), 37–39Reverse contrast scale, 206–207Reverse teleradiology, 535Reversible (lossless) compression, 150,
231–232, 527Review workstations, 25, 390RIS, 13–15, 22–24
error-checking HIS interface, 192–193,218
functions of, 13and HL7 server, 250–251, 476–477image routing, 14operational features, 13–15PACS interface with, 22–23pre-fetching, 14request for proposal (RFP) description,
53–54RIS-HIS data transfer mode, 193–194speech recognition system interface,
476–478Risks
net present value (NVP) calculation,131–133
of PAC implementation, 130–133Robustness, PACS architecture, 258Routing, networks, 280–282
SScalability, PACS architecture, 256ScanHead CR, 204–205Scanners
charge coupled device (CCD) scanners,196, 525
laser scanners, 197, 525Scheduling
hospital information system (HIS)method, 14
and RIS, 13–14Web-based method, 14
Screen-film, compared to computedradiography (CR), 199–200, 202
Screensaver, password protection, 315Secondary image capture, 150Sectors, hard drive, 321–322Secure sockets layers (SSLs), 381Security
administrator accounts, 315default shares, disabling, 316e-mail, authorized-only delivery, 314encrypted user authentication, 314“everyone” group, avoiding, 315new technology file system (NTFS),
316operating system patches, 312–313passwords, 313–314physical security, 314–315screensaver password protection, 315
DRE(Index) 11/16/2005 10:05 AM Page 574

Index 575
speech recognition system, 474standards related to, 158, 167virtual private networks (VPNs), 300viruses, 316–317virus protection, 313for Windows-based systems, 315–316
Servers, 250, 304–310clustered failover model, 307–308DICOM servers, 252, 305–307grid servers, 334hardware, 309load-balancing model, 305–307multiserver model, 304, 306operating systems, 309–310single server model, 304–305Web servers, 304–305, 378–382
Service class providers (SCP), 191Service class users (SCU), 191Service process, queuing analysis of, 87Set Partitioning in Hierarchical Trees
(SPIHT), 233Showstoppers, 131Signal-to-noise ratio (SNR), 363Silicon field-effect transistor (FET), 212Simple mail transfer protocol (SMTP),
314Simple network management protocol
(SNMP), 327Site visits, scope of, 67, 70Slots, graphics cards, 358–359Small computer system interface (SCSI),
323, 331–332Smoothing, 107Snappy Appliances, 264Software, 392–398
basic functions of, 180–181image management, 399image manipulation tools, 393,
396–397navigation process, 393–396
Solid-state diode laser scanner, 197Space requirements, assessment of, 42Spatial frequency processing algorithms,
207–208Spatial resolution
computed radiography (CR), 201file size trade-off, 201
SpeechMagic, 471
Speech Q, 470–471Speech recognition system, 110–111,
467–482application component, 473capture of report, 15companies offering, 470–471cost-savings, 481customizable fields, 475desktop integration, 476development of, 468–469, 472implementation of, 478, 481input devices, 471, 478language model, 472–473macros, 475necessity of, 4, 111, 468–469operational checks, 480–481operational issues, 480radiologist training, 478–479reports, 110–111, 475, 482resistance to use, 469RIS-HIS interface, 476–478speech engine, 471–472system security, 474technical support, 479templates, 475voice navigation, 479
Speedabnormal findings information, 114and emergency teleradiology, 536–538workstations, 392
Stack view mode, 107, 402Standards
International Organization forStandardization (ISO), 270–272
teleradiology. See Legal/regulatoryissues
Star typology, PACS networks, 297–298States
licensure requirements, 158–163malpractice insurance coverage,
165–166, 543–544teleradiology initiatives, 163
Static mode, 107Statis softcopy interpretation, 107Storage, 253–254
American College of Radiology (ACR)standard, 166–167, 190–191
archiving, 252–253
DRE(Index) 11/16/2005 10:05 AM Page 575

Index576
Storage (cont.)content addressable storage (CAS), 264,
334–335direct attached storage (DAS), 253–254,
328file system, 327–328formats, 320–321grid storage, 264, 334hard drives, 321–324hierarchical storage management
(HSM), 254–255, 339–340image manager, 53mean time to failure, 324–325mirrored system, 100–101Moore’s law, 230, 320National Electrical Manufacturers
Association (NEMA) format, 149,190–191
near-line storage, 51–53network attached storage (NAS),
253–254, 263–264, 332–334optical storage, 336–337redundant array of inexpensive disks
(RAID), 20–21, 51, 100, 254–255,325–326
request for proposal (RFP) description,51
storage area network (SAN), 253–254,263, 328–332
and switching vendors, 267tape storage, 337–338terminology (powers of 10), 320
Storage area density, 320Storage area network (SAN), 253–254,
328–332advantages/limitations, 330–331and Fibre Channel, 330–331set-up diagrams, 329, 331storage companies, 263
Storage Management InitiativeSpecification (SNIA), 327
StorageTek, 265Strategic plan, 28–41
documentation requirements, 28–29downtime contingency plan, 43future demands, analysis of, 39–41goals/objectives, PACS alignment to,
29
hospital roles, contributions of, 30–31,41
impact analysis, 32–37implementation plan, 31–35management of system, 42–43market share analysis, 37–39PACS readiness assessment, 30–31,
41–42technical, 41–43
Structured reporting, 111–112Subpixels, 355Sunk costs, 127Surface rendering, 3-D imaging, 452–453Switching
layer 3 switching, 300networks, 283, 287, 289
Sybase, 20System architecture, request for proposal
(RFP) description, 50System reliability, request for proposal
(RFP) description, 60–61System throughput, request for proposal
(RFP) description, 57
TT1 line, 293, 296–297, 529Talk Technology TalkStation, 470Tape storage, 337–338
capacities, 338mean time between failures, 338
Teaching files. See Digital teaching files(DTFs)
Technologist Q/A workstation, requestfor proposal (RFP) description, 56
Teleradiology, 523–547accuracy of, 530–532applications of, 533–536emergency manpower, 538–539image acquisition, 524–526image compression, 526–529image interpretation, 530image transmission, 529interpretation site, layout, 524job satisfaction, 541–542licensure/credentialing, 542–543operations section, request for proposal
(RFP), 50patient care, 540–541
DRE(Index) 11/16/2005 10:05 AM Page 576

Index 577
radiologist/clinician relationships,539–540
regulations. See Legal/regulatory issues
reverse teleradiology, 535speed, importance of, 536–538
Templates, speech recognition system, 475
Thick client application, 253Thin client application, 253, 404Thin-film-transistor (TFT), 212–2133-D imaging, 447–463
average-intensity projection (AveIP)images, 452
benefits of, 448–449computed tomography (CT) scans,
449–450cost of service, 458–460image compression limitations, 243imaging service staffing, 457–458insurance reimbursement, 460–463issues related to, 109maximum-intensity projection (MIP)
images, 452–453Medicare coverage, 458–463minimum-intensity projection (MinIP)
images, 452multidetector computed tomography
(MDCT), 450–451and multidetector CT (MDCT),
450–451in PACS hospital environment, example
of, 453–457post-processed images, creating,
451–457surface/volume rendering, 452–4533-D exam modifier, 455–457volumetric navigation, 107, 109volumetric viewing, 452voxels, 184
Time-motion studies, 400Tivoli, 265Token ring cards, 275Topology, networks, 275–276Tracks, hard drive, 321Training, request for proposal (RFP)
description, 58–59Transaction rule, HIPAA, 158
Transfer communicationprotocol/Internet (TCP/IP) protocol,275–276, 278, 374–375
Transformationsdigital mammography display, 368in irreversible (lossy) compression,
233Trojan horse, 317
UUltrasound, image compression, 242Undo, 416Uninterruptible power supply (UPS),
310–311Universal Serial Bus 2 (USB-2), 178Unshielded twisted pair (UTP) cable,
274, 285Uptime
definitions, 60request for proposal (RFP) description,
60User interface, 407–417
early studies, 407–408error recovery, 416hanging protocols, 415mental model as basis, 408–409studies related to, 399–402worklists, 410–415
VVariable costs, 135–136Vendors
contract negotiation, 70–71evaluation/selection process, 65–70final decision-making about, 67, 70and itemized pricing, 64maintenance/support, 61–62request for proposal (RFP) response
form, 63–64request for proposal information/
selection description, 62–63switching and stored data, 267warranty period, 61
Veritas, 308Versatility, and PACS architecture,
256ViaVoice, 471Video cards. See Graphics cards
DRE(Index) 11/16/2005 10:05 AM Page 577

Index578
Video Electronics Standards Association(VESA) mount, 358
Video random access memory (VRAM),359
View box, PAC alternative to, 104–106Virtual private networks (VPNs), 300,
381Viruses, 316–317
operation of, 316–317Trojan horse, 317virus protection, 313worms, 317
Visual C, 179–180Voice recognition. See Speech recognition
systemVolumetric visualization. See 3-D imagingVoxels, 184VoxReports, 471
WWarranty period, request for proposal
(RFP) description, 61Wavelet transform, 222, 233–234,
528–529Web-based image distribution, 374–382,
424–425cost factors, 378Web servers, 378–379
Web-based PACSfunctions of, 24–25scheduling, 14workstations, 25
Web servers, 378–379client device, 379–380functions of, 304–305, 379hospital example, 380–382image distribution request for proposal
(RFP) description, 55needs analysis, 43–44
Wide-area networks (WANs), 293–294leased circuits, 293–294virtual radiology department, 115–116
Winchester Systems, 263Windows-based systems, security
guidelines, 315–316Window shade display, 422–423Workflow analysis, 76–88
auditing workflow process, 117–118
for clerical personnel, 77–79communication of abnormality, 114interpretation process, 106–110multi-institutional PACS, 115–116PACS impact on physicians/clinicians,
112–114queuing analysis, 85–88for radiologic technologists (RTs),
79–83reading room environment, 116–117reporting methods, 110–112
Workflow control. See Imagemanagement
Workflow engineering, 74–92and digital image environment, 75hanging protocols/display, 104–106industrialized approach to, 75interactive workstations, 110–111for new type of technologist, 85pre-fetch strategies, 103–104purpose of, 74quality assurance, 89–91structured reporting, 111–112workflow analysis, 76–88worklists, 101–102workstation tools, 106–110
Worklists, 101–102advantages of, 193–194contents of, 393, 410–415DICOM standards, 102, 193–194generation of, 102modality worklist (MWL), 251–252
Workstations, 24–25, 253choosing, questions to ask, 418–420clinical review, 25and design of system, 402–406,
418–420development of, 386–388diagnostic, 24–25, 390environment for set-up, 417, 420–422ergonomic factors, 417, 420–422functions of, 388–390future trends, 422–425grayscale adjustment, 393, 396hardware, 391–392lighting environment of, 420–421for mammography, digital, 370operation, studies of, 399–402
DRE(Index) 11/16/2005 10:05 AM Page 578

Index 579
review, 390software, 392–398speed, 392thin and thick client, 253, 404user interface, 399–402, 407–417Web-based, 25, 253workstation tools, 106–110
Write once read many (WORM), 337
XXPress, 203X-ray dose-dependent noise, computed
radiography (CR), 202
DRE(Index) 11/16/2005 10:05 AM Page 579