Package ‘splm’ - The Comprehensive R Archive Network · Package ‘splm’ July 14, 2018 Title...
27
Package ‘splm’ July 14, 2018 Title Econometric Models for Spatial Panel Data Version 1.4-11 Date 2018-07-13 Author Giovanni Millo [aut, cre], Gianfranco Piras [aut] Maintainer Giovanni Millo <[email protected]> Description ML and GM estimation and diagnostic testing of econometric models for spatial panel data. Depends R (>= 2.12.0), spdep Imports plm, maxLik, MASS, bdsmatrix, ibdreg, nlme, Matrix, spam, methods License GPL-2 LazyLoad yes Repository CRAN Repository/R-Forge/Project splm Repository/R-Forge/Revision 220 Repository/R-Forge/DateTimeStamp 2018-07-13 13:05:47 Date/Publication 2018-07-14 08:50:02 UTC NeedsCompilation no R topics documented: bsjktest ........................................... 2 bsktest ............................................ 3 effects.splm ......................................... 4 Insurance .......................................... 5 itaww ............................................ 7 listw2dgCMatrix ...................................... 7 print.splm .......................................... 8 RiceFarms .......................................... 9 riceww ............................................ 10 1
Transcript of Package ‘splm’ - The Comprehensive R Archive Network · Package ‘splm’ July 14, 2018 Title...

Package ‘splm’July 14, 2018
Title Econometric Models for Spatial Panel Data
Version 1.4-11
Date 2018-07-13
Author Giovanni Millo [aut, cre],Gianfranco Piras [aut]
Maintainer Giovanni Millo <[email protected]>
DescriptionML and GM estimation and diagnostic testing of econometric models for spatial panel data.
Depends R (>= 2.12.0), spdep
Imports plm, maxLik, MASS, bdsmatrix, ibdreg, nlme, Matrix, spam,methods
License GPL-2
LazyLoad yes
Repository CRAN
Repository/R-Forge/Project splm
Repository/R-Forge/Revision 220
Repository/R-Forge/DateTimeStamp 2018-07-13 13:05:47
Date/Publication 2018-07-14 08:50:02 UTC
NeedsCompilation no
R topics documented:bsjktest . . . . . . . . . . . . . . . . . . . . . . . . . . . . . . . . . . . . . . . . . . . 2bsktest . . . . . . . . . . . . . . . . . . . . . . . . . . . . . . . . . . . . . . . . . . . . 3effects.splm . . . . . . . . . . . . . . . . . . . . . . . . . . . . . . . . . . . . . . . . . 4Insurance . . . . . . . . . . . . . . . . . . . . . . . . . . . . . . . . . . . . . . . . . . 5itaww . . . . . . . . . . . . . . . . . . . . . . . . . . . . . . . . . . . . . . . . . . . . 7listw2dgCMatrix . . . . . . . . . . . . . . . . . . . . . . . . . . . . . . . . . . . . . . 7print.splm . . . . . . . . . . . . . . . . . . . . . . . . . . . . . . . . . . . . . . . . . . 8RiceFarms . . . . . . . . . . . . . . . . . . . . . . . . . . . . . . . . . . . . . . . . . . 9riceww . . . . . . . . . . . . . . . . . . . . . . . . . . . . . . . . . . . . . . . . . . . . 10
1

2 bsjktest
rwtest . . . . . . . . . . . . . . . . . . . . . . . . . . . . . . . . . . . . . . . . . . . . 10slag . . . . . . . . . . . . . . . . . . . . . . . . . . . . . . . . . . . . . . . . . . . . . 13slmtest . . . . . . . . . . . . . . . . . . . . . . . . . . . . . . . . . . . . . . . . . . . . 14spgm . . . . . . . . . . . . . . . . . . . . . . . . . . . . . . . . . . . . . . . . . . . . . 15sphtest . . . . . . . . . . . . . . . . . . . . . . . . . . . . . . . . . . . . . . . . . . . . 18spml . . . . . . . . . . . . . . . . . . . . . . . . . . . . . . . . . . . . . . . . . . . . . 20spreml . . . . . . . . . . . . . . . . . . . . . . . . . . . . . . . . . . . . . . . . . . . . 22summary.splm . . . . . . . . . . . . . . . . . . . . . . . . . . . . . . . . . . . . . . . . 24usaww . . . . . . . . . . . . . . . . . . . . . . . . . . . . . . . . . . . . . . . . . . . . 25vcov.splm . . . . . . . . . . . . . . . . . . . . . . . . . . . . . . . . . . . . . . . . . . 26
Index 27
bsjktest Baltagi, Song, Jung and Koh LM test for spatial panels
Description
Baltagi, Song, Jung and Koh joint or conditional LM test for spatial error correlation or serialcorrelation sub spatial, serial correlation and random effects in panel models
Usage
bsjktest(x,...)## S3 method for class 'formula'bsjktest(x, data, index=NULL, listw,test=c("C.1","C.2","C.3","J"), ...)
Arguments
x an object of class formula
data a data.frame or pdata.frame containing the variables in the model
index either NULL (default) or a character vector to identify the indexes among thecolumns of the data.frame
listw either a matrix or a listw representing the spatial structure
test one of c("C.1","C.2","C.3","J"), the test to be performed.
... additional arguments to be passed
Value
an object of class htest
Author(s)
Giovanni Millo
bsktest 3
References
Baltagi, B.H., Song, S.H., Jung B. and Koh, W. (2007) Testing panel data regression models withspatial and serial error correlation. Journal of Econometrics, 140, 5-51.
See Also
bsktest
Examples
data(Produc, package="plm")data(usaww)fm <- log(gsp)~log(pcap)+log(pc)+log(emp)+unempbsjktest(fm, data=Produc, listw = usaww, test="C.1")
bsktest Baltagi, Song and Koh LM test for spatial panels
Description
Baltagi, Song and Koh marginal or conditional LM test for spatial error correlation or randomeffects in panel models
Usage
bsktest(x,...)## S3 method for class 'formula'bsktest(x, data, index=NULL, listw,test=c("LMH","LM1","LM2","CLMlambda","CLMmu"),standardize=FALSE, method = "eigen", ...)
Arguments
x a formula
data a data.frame or pdata.frame containing the variables in the model
index either NULL (default) or a character vector to identify the indexes among thecolumns of the data.frame
listw a listw representing the spatial structure
test one of c("LMH","LM1","LM2","CLMlambda","CLMmu"), the test to be performed
standardize whether to standardize the test statistic or not (applies only to LM1 and LM2)
method select a method for ML in "CLMmu". the default is "eigen"
... additional arguments to be passed
Value
an object of class htest

4 effects.splm
Author(s)
Gianfranco Piras
References
Baltagi, B.H., Song, S.H. and Koh, W. (2003) Testing panel data regression models with spatialerror correlation. Journal of Econometrics, 117, 123–150.
Millo, G., Piras, G. (2012) splm: Spatial Panel Data Models in R. Journal of Statistical Software,47(1), 1–38. URL http://www.jstatsoft.org/v47/i01/.
See Also
sphtest
Examples
data(Produc, package="plm")data(usaww)fm <- log(gsp)~log(pcap)+log(pc)+log(emp)+unempbsktest(fm,data=Produc, listw = mat2listw(usaww),
test="LM1")
effects.splm method for extracting fixed effects
Description
Methods used for extracting fixed effects from objects of class splm where type is one of "fixedeffects lag" or "fixed effects error"
Usage
## S3 method for class 'splm'effects(object,...)
Arguments
object an object of class 'splm'
... additional arguments to be passed over
Details
If the argument object is not of class splm the function will terminate with an error.
If the argument object is of class splm but type is not one of "fixed effects lag" or "fixed effectserror", the function will terminate with an error.
Insurance 5
Value
An object of class effects.splm
res a list whose elements are various type of fixed effects and the intercept (whenpresent)
Author(s)
Gianfranco Piras
References
Elhorst, J.P. (2003) Specification and estimation of spatial panel data models, International Re-gional Science Review, 26, pages 244–268.
Elhorst, J.P. (2009) Spatial panel data models, In Fischer, M.M. and Getis, A. (eds), Handbook ofApplied Spatial Analysis Springer, Berlin.
See Also
spml summary.effects.splm
Examples
data(Produc, package = "plm")data(usaww)fm <- log(gsp) ~ log(pcap) + log(pc) + log(emp) + unemperr <- spml(fm, data = Produc, listw = mat2listw(usaww), model="within")summary(err)eff <- effects(err)print(eff)
Insurance Insurance consumption across Italian provinces, 1998-2002
Description
A panel of 103 observations
number of observations : 515
observation : provinces
country : Italy
Usage
data(Insurance)

6 Insurance
Format
A dataframe containing :
code the province code according to Istat
year the year of observation
ppcd real per capita premiums in 2000 euros, non-life insurance excluding mandatory motor third-party liability
rgdp real per-capita GDP
bank real per-capita bank deposits
den population density per square Km
rirs real interest rate on lending to families and small enterprises
agen density of insurance agencies per 1000 inhabitants
school share of people with second grade schooling or more
vaagr share of value added, agriculture
fam average number of family members
inef judicial inefficiency index: average years to settle first degree of civil case
trust survey result to the question "do you trust others?"
dXX year dummies
NorthWest macroregional dummy
NorthEast macroregional dummy
Centre macroregional dummy
South macroregional dummy
Islands macroregional dummy (Sicily and Sardinia)
Author(s)
Giovanni Millo
Source
Giovanni Millo and Gaetano Carmeci, (2011) “Non-life insurance consumption in Italy: a sub-regional panel data analysis”, Journal of Geographical Systems, 13:273–298.

itaww 7
itaww Spatial weights matrix - Italian provinces
Description
Spatial weights matrix of the 103 Italian provinces as in 1992-2005.
Usage
data(itaww)
Format
A matrix with elements different from zero if province i and j are neighbors. Weights are row-standardized. Messina and Reggio Calabria, divided by the Messina Strait, are considered neigh-bours.
Author(s)
Giovanni Millo
listw2dgCMatrix Interface between Matrix class objects and weights list
Description
Interface between Matrix class objects and weights list
Usage
listw2dgCMatrix(listw, zero.policy = NULL)
Arguments
listw a listw object created for example by nb2listw
zero.policy See lagsarlm for details
Value
Matrix class object: a sparse Matrix
Author(s)
Gianfranco Piras
8 print.splm
Examples
data(columbus, package="spdep")listw<-nb2listw(col.gal.nb)spW<-listw2dgCMatrix(listw)
print.splm print method for class splm
Description
Method to print objects of class summary.splm and splm
Usage
## S3 method for class 'splm'print(x, digits = max(3,getOption("digits") -3), ...)
Arguments
x an object of class splm
digits minimal number of significant digits, see print.default
... additional arguments to be passed
Details
The summary function summary.splm returns an objects of class ’splm’ organized in a coefficientmatrix.
Also a matrix for the error components, or the spatial coefficients will be generated depending onthe estimated model.
Author(s)
Giovanni Millo, Gianfranco Piras
See Also
spml, spgm
Examples
data(Produc, package = "plm")data(usaww)spremod<-spml(log(gsp)~log(pcap)+log(pc)+log(emp)+unemp, data=Produc,listw = mat2listw(usaww), model="random", lag=TRUE, spatial.error="none")summary(spremod)

RiceFarms 9
RiceFarms Production of Rice in India
Description
yearly observations of 171 farms
number of observations : 1026
country : Indonesia
economic topic : producer behavior
econometrics topic : error component
Usage
data(RiceFarms)
Format
A dataframe containing :
id the farm identifiertime the growing seasonsize the total area cultivated with rice, measured in hectaresstatus land status, on of 'owner' (non sharecroppers, owner operators or leasholders or both),
'share' (sharecroppers), 'mixed' (mixed of the two previous status)varieties one of 'trad' (traditional varieties), 'high' (high yielding varieties) and 'mixed' (mixed
varieties)bimas bIMAS is an intensification program ; one of 'no' (non-bimas famer), 'yes' (bimas farmer)
or 'mixed' (part but not all of farmer’s land was registered to be in the bimas program)seed seed in kilogramurea urea in kilogramphosphate phosphate in kilogrampesticide pesticide cost in Rupiahpseed price of seed in Rupiah per kgpurea price of urea in Rupiah per kgpphosph price of phosphate in Rupiah per kghiredlabor hired labor in hoursfamlabor family labor in hourstotlabor total labor (excluding harvest labor)wage labor wage in Rupiah per hourgoutput gross output of rice in kgnoutput net output, gross output minus harvesting cost (paid in terms of rice)price price of rough rice in Rupiah per kgregion one of 'wargabinangun', 'langan', 'gunungwangi', 'malausma', 'sukaambit', 'ciwangi'

10 rwtest
Source
Journal of Applied Econometrics data archive : http://jae.wiley.com/.
References
Qu Feng and William C. Horrace, (2012) “Alternative Measures of Technical Efficiency: Skew,Bias and Scale”, Journal of Applied Econometrics, forthcoming.
Horrace, W.C. and P. Schmidt (1996) “Confidence statements for efficiency estimates from stochas-tic frontier models”, Journal of Productivity Analysis, 7, 257–282.
riceww Spatial weights matrix of Indonesian rice farms
Description
Spatial weights matrix of the 171 farms in the Indonesian Rice Farming example. Farms in thesame village (out of six) are considered contiguous.
Usage
data(riceww)
Format
A matrix with elements different from zero if farms i and j are neighbors. Farms are consideredneighbors if in the same village. Weights are row-standardized.
Author(s)
Giovanni Millo, data provided by Yves Croissant
rwtest Randomization-based test of spatial dependence for panel models
Description
Randomization-based test of spatial dependence for panel models, robust to global dependenceinduced by common factors and to persistence (serial correlation) in the data
rwtest 11
Usage
rwtest(x, ...)## S3 method for class 'formula'rwtest(x, data, w, index = NULL, model = NULL,
replications = 99, seed=NULL, order=1,mc=1, test = c("rho", "cd", "sclm"),alternative=c("twosided", "onesided",
"symmetric"), ...)## S3 method for class 'panelmodel'rwtest(x, w, replications = 99, seed=NULL,
order=1, mc=1,test = c("rho", "cd", "sclm"),alternative=c("twosided", "onesided",
"symmetric"), ...)## S3 method for class 'pseries'rwtest(x, w, replications = 99, seed=NULL,
order=1, mc=1,test = c("rho", "cd", "sclm"),alternative=c("twosided", "onesided",
"symmetric"), ...)
Arguments
x an object of class formula, panelmodel, or pseries (depending on the respec-tive interface) describing the model to be tested
data a data.frame
w a n x n matrix describing proximity between individuals, with wij = a wherea is any number such that as.logical(a)==TRUE, if i, j are neighbours, 0 orany number b such that as.logical(b)==FALSE elsewhere. Only the lowertriangluar part (without diagonal) of w after coercing by as.logical() is eval-uated for neighbouring information (but w can be symmetric). See also Detailsand Examples.
index an optional numerical index, in case data has to be formatted by plm.data
model an optional character string indicating which type of model to estimate; if left toNULL, the original heterogeneous specification of Pesaran is used
replications the number of Monte Carlo randomizations of the neighbourhood matrix (de-fault: 99),
seed the optional random seed,
order the order of neighbourhood to test for,
mc the number of parallel threads to execute; defaults to 1 (serial execution); islimited to the number of execution cores actually available, and depends onoperating system support.
test the type of test statistic to be returned. One of
• "rho" for the average correlation coefficient,

12 rwtest
• "cd" for Pesaran’s CD statistic, or• "sclm" for the scaled version of Breusch and Pagan’s LM statistic,
alternative the alternative hypothesis for the test, defaulting to (asymmetric) twosided,
... further arguments to be passed on to plm, such as e.g. effect or random.method
Details
This test is meant as a generalization of Pesaran’s spatial dependence test "CD(p)" for robustnessagainst global dependence (perhaps of the factor type) and persistence in the data, both of whichthe original test does not tolerate.
The procedure can be applied to model residuals as well as to individual pseries. See the com-ments in pcdtest as for the different methods.
Space is defined supplying a proximity matrix (elements coercible to logical) with argument wwhich provides information on whether any pair of individuals are neighbours or not. If order=1,only first-order neighbouring pairs will be used in computing the test; else, w will be transformedin the neighbourhood matrix of the appropriate order. The matrix need not be binary, so commonlyused “row–standardized” matrices can be employed as well. nb objects from spdep must instead betransformed into matrices by spdep’s function nb2mat before using.
Notice that the "rho" and "cd" tests are permutationally equivalent.
The test is suitable also for unbalanced panels.
The test on a pseries is the same as a test on a pooled regression model of that variable on a con-stant, i.e. rwtest(some_pseries) is equivalent to rwtest(plm(some_var ~ 1, data = some_pdata.frame, model ="pooling") and also equivalent to rwtest(some_var ~ 1, data = some_data), wheresome_var is the variable name in the data which corresponds to some_pseries.
Value
An object of class "htest".
Author(s)
Giovanni Millo
References
Millo, G. (2016), A simple randomization test for spatial dependence in the presence of commonfactors and serial correlation, (unpublished), xx(x), pp. xxx–xxx. Pesaran, M.H. (2004), GeneralDiagnostic Tests for Cross Section Dependence in Panels, CESifo Working Paper 1229. Pesaran,M.H. (2015), Testing Weak Cross–Sectional Dependence in Large Panels, Econometric Reviews,34(6-10), pp. 1089–1117.
Examples
data(Produc, package = "plm")data(usaww)fm <- log(gsp) ~ log(pcap) + log(pc) + log(emp) + unemp## test on heterogeneous model (separate time series regressions)rwtest(fm, data = Produc, w=usaww, index = c("state", "year"))

slag 13
## test on two-way fixed effects homogeneous modelrwtest(fm, data = Produc, w=usaww, index = c("state", "year"),
model = "within", effect = "twoways")
## test on panelmodel objectlibrary(plm)g <- plm(fm, data = Produc)rwtest(g, w=usaww)
## test on pseries, higher-order neighbourhoodpprod <- pdata.frame(Produc)rwtest(pprod$gsp, w=usaww, order=3)
slag Spatial lag operator
Description
Spatial lagging method for vectors or pseries objects.
Usage
## S3 method for class 'pseries'slag(x, listw, maxlag, ...)
Arguments
x an object of class pserieslistw an object of class listwmaxlag the spatial lag order (including lower)... additional arguments to be passed
Value
a pseries
Author(s)
Giovanni Millo
Examples
data(Produc, package="plm")data(usaww)usalw <- mat2listw(usaww)fm <- log(gsp)~log(pcap)+log(pc)+log(emp)+unemp+slag(log(pcap),
listw=usalw)slxmod <- spreml(fm, data=Produc, w = usaww,
model="pooling", lag=FALSE, errors="ols")

14 slmtest
slmtest Locally robust panel Lagrange Multiplier tests for spatial dependence
Description
Locally robust LM tests for spatial lag (error) correlation sub spatial error (lag) correlation in panelmodels
Usage
slmtest(x,...)## S3 method for class 'formula'slmtest(formula, data, listw, model="pooling",test=c("lme","lml","rlme","rlml"), index=NULL, ...)
## S3 method for class 'plm'slmtest(x, listw,test=c("lme","lml","rlme","rlml"), ...)
Arguments
formula an object of class formula
data a data.frame or pdata.frame containing the variables in the model
x an object of class plm
listw either a matrix or a listw representing the spatial structure
model a character value specifying the transformation to be applied to the data.
test one of c("lme","lml","rlme","rlml"), the test to be performed.
index either NULL (default) or a character vector to identify the indexes among thecolumns of the data.frame
... additional arguments to be passed
Details
This tests are panel versions of the locally robust LM tests of Anselin et al. (1996), based ona pooling assumption: i.e., they do not allow for any kind of individual effect. Therefore it isadvisable to employ a within transformation whenever individual effects cannot be ruled out.
It must be kept in mind that these locally robust procedures have been designed for situations inwhich the "other" effect is not of substantial magnitude, and can behave suboptimally otherwise.
Four tests are available to be chosen through the test argument: "lml" for "LM lag" and, re-spectively, "lme" for "LM error" are the standard, non-robust versions, obtained simply poolingthe cross-sectional versions; "rlml" and "rlme" are, respectively, the locally robust test for lag,allowing for a spatial error; and for error, allowing for a spatial lag.
The model argument, specified according to the standards of plm, is passed on internally and em-ployed to determine the panel data transformation to be applied before calculating the test. Defaultsto "pooling" (no transformation).
spgm 15
Value
an object of class htest
Author(s)
Giovanni Millo
References
Anselin, L., Bera, A.K., Florax, R. and Yoon, M.J. (1996) Simple diagnostic tests for spatial depen-dence. Regional Science and Urban Economics, 26(1), 77-104. Elhorst, J.P. (2014) Spatial Paneldata Models, in Spatial Econometrics (Springer) 37-93.
Examples
data(Produc, package="plm")data(usaww)fm <- log(gsp)~log(pcap)+log(pc)+log(emp)+unemp## robust LM test for spatial error sub spatial lag## model on original data, pooling hypothesisslmtest(fm, data=Produc, listw = usaww, test="rlme")## model on within-transformed (time-demeaned) data,## eliminates individual effectsslmtest(fm, data=Produc, listw = usaww, test="rlme",
model="within")
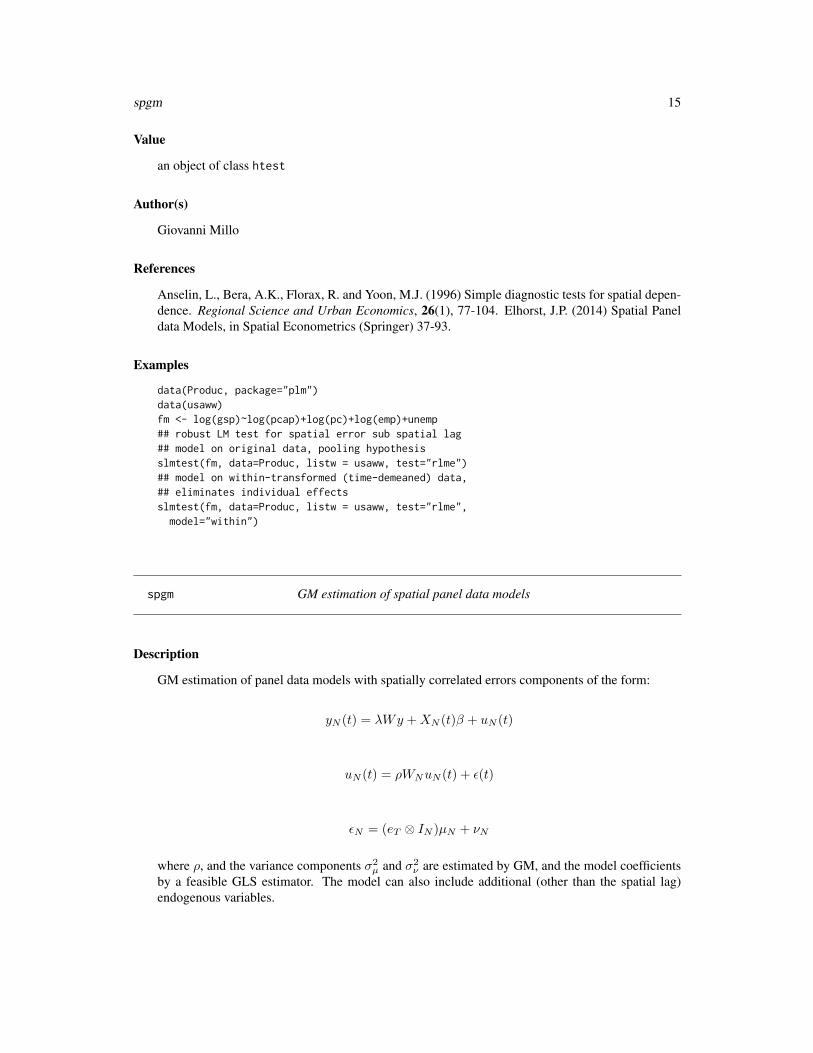
spgm GM estimation of spatial panel data models
Description
GM estimation of panel data models with spatially correlated errors components of the form:
yN (t) = λWy +XN (t)β + uN (t)
uN (t) = ρWNuN (t) + ε(t)
εN = (eT ⊗ IN )µN + νN
where ρ, and the variance components σ2µ and σ2
ν are estimated by GM, and the model coefficientsby a feasible GLS estimator. The model can also include additional (other than the spatial lag)endogenous variables.

16 spgm
Usage
spgm(formula, data=list(), index=NULL, listw =NULL, listw2 = NULL,model=c("within","random"), lag = FALSE, spatial.error=TRUE,moments = c("initial", "weights", "fullweights"), endog = NULL,instruments= NULL, lag.instruments = FALSE, verbose = FALSE,method = c("w2sls", "b2sls", "g2sls", "ec2sls"), control = list(),optim.method = "nlminb", pars = NULL)
Arguments
formula a description of the model to be fit. The details of model specification are givenfor lm
data an object of class data.frame or pdata.frame. An optional data frame con-taining the variables in the model. When the obect is a data.frame, the firsttwo columns may contain the indexes. See index
index if not NULL (default), a character vector to identify the indexes among thecolumns of the data.frame
listw an object of class listw, matrix, or Matrix.
listw2 an object of class listw, matrix, or Matrix. Only if both lag and spatial.errorare both TRUE
model One of "within" or "random". The assumption made on the individual effects
lag if TRUE a spatial lag of the dependent variable is added to the regression equation
spatial.error a logic vector. If TRUE the spatial autoregressive error term is added to the modeland an estimate for ρ is produced
moments "initial" (default) defines the set of GM estimator to be used. Alternativesare "weights" and "fullweights" (See Details)
endog additional endogenous variables. Default NULL. If not NULL should be specifiedas a formula with no dependent variable (endog = ~ x1 + x2). Note the ~ beforethe expression.
instruments external instruments. Default NULL. If not NULL should be specified as a formulawith no dependent variable (instruments = ~ x1 + x2). Note the ~ before theexpression.
lag.instruments
should the external instruments be spatially lagged?
verbose default FALSE, If TRUE reports function values during optimization
method One of "w2sls", "b2sls", "g2sls", "ec2sls". (See Details)
control a list of control parameters for the optimization
optim.method default set to "nlminb". or optionally a method passed to optim to use analternative optimizer.
pars initial values of the parameter rho and sigmav. The default for rho is to startfrom a regression of the spatially lagged residuals on the residuals (dependingon the model). For sigmav the starting value is the variance of the residuals(again this depends on the model).

spgm 17
Details
The function is a very general interface to estimate various nested specifications of the generalmodel including additional endogenous variables described above. When both spatial.errorand lag are FALSE the model reduces to a panel data model with an additional endogeneous vari-able. The function then uses ivsplm to perform the Instrumental Variables and two-stage leastsquares for panel data model. method = "w2sls" corresponds to the fixed effects estimator,method = "b2sls" to the between effects model, method = "g2sls" to the GLS random ef-fects model, and method = "ec2sls" to the Baltagi’s EC2SLS.
When spatial.error is TRUE and lag is FALSE the model is one with spatially autocorrelatederror components. If effects is "random", the Kapoor et al. (2007) GM estimator is performedand the residuals in the first step come from an OLS regression. When moments is "initial",the initial estimator is calculated. This first set of GM estimators is based only on a subset of themoments conditions and assigns equal weigths to each of them. When moments is "fullweights",the second set of GM estimators is calculated. This estimator is based on the full set of momentsconditions. It also involves the expression for the variance covariance matrix of the sample momentscalculated under the assumption of normally distributed innovations. The calculation of the traceterms in the expression of the variance covariance matrix of the sample moments uses codes fromthe Matrix package. When moments is"weights", the third set of GM estimator is used. Thisis motivated by computational issues. The procedure is analogous to the second one but uses asimplified expression for the variance covariance matrix of the sample moments. If effects is"fixed", the initial estimator is a within estimator and the moments conditions of Kapoor et al.(2007) are modified accordingly.
Finally, when both spatial.error and lag are TRUE the complete model is estimated (with orwithout additional endogenous variables). OLS residuals are no longer consistent because of thespatially lagged dependent variable. If effects is "random", two initial estimators are computed: awithin two-stage least squares and a between two stage least squares. The two sets of correspondingresiduals are used in the spatial generalized moments estimator (GM) where the moments conditionsof Kapoor et al. (2007) are again modified accordingly. If effects is "fixed", the initial estimatoris a within two stage least squares estimator and the moments conditions of Kapoor et al. (2007)are modified accordingly.
Note that for the random effects models, σ2µ is not reported. σ2
1 is reported instead. However, avalue for σ2
µ can easily be obtained from:
σ21 = σ2
ν + Tσ2µ
The function also produces an estimate for θ which is a function of the variance components.
Value
An object of class "splm".
coefficients GLS coefficients estimate of the model parameters
vcov the variance covariance matrix of the estimated coefficients
residuals the GLS residuals
fitted.values difference between response variable and residuals
sigma2 GLS residuals variance
type ’random effect GM’

18 sphtest
rho a vector including the spatial parameter and the variance components (see De-tails)
model the matrix of the data used
call the call used to create the object
Author(s)
Gianfranco Piras
References
Kapoor, M., Kelejian, H.H. and Prucha, I.R. (2007) Panel data model with spatially correlated errorcomponents, Journal of Econometrics, 140, pages 97–130.
Mutl, J., and Pfaffermayr, M. (2011) The Hausman test in a Cliff and Ord panel model, Economet-rics Journal, 14, pages 48–76.
Kelejian, H.H. and Prucha, I.R. (1999) A Generalized Moments Estimator for the AutoregressiveParameter in a Spatial Model, International Economic Review, 40, pages 509–533.
Kelejian, H.H. and Prucha, I.R. (1999) A Generalized Spatial Two Stage Least Square Procedurefor Estimating a Spatial Autoregressive Model with Autoregressive Disturbances, Journal of RealEstate Finance and Economics, 17, pages 99–121.
Millo, G., Piras, G. (2012) splm: Spatial Panel Data Models in R. Journal of Statistical Software,47(1), 1–38. URL http://www.jstatsoft.org/v47/i01/.
Examples
data(Produc, package = "plm")data(usaww)GM <- spgm(log(gsp)~log(pcap)+log(pc)+log(emp)+unemp, data=Produc,
listw = usaww, moments="fullweights", spatial.error = TRUE)summary(GM)
sphtest Hausman test for spatial panel data models
Description
Hausman specification test for spatial panel data models
Usage
sphtest(x, ...)## S3 method for class 'formula'sphtest(x, data, index = NULL, listw,
spatial.model = c("lag", "error", "sarar"),method = c("ML", "GM"), errors = c("KKP", "BSK"),...)
## S3 method for class 'splm'sphtest(x, x2, ...)

sphtest 19
Arguments
x an object of class formula or splm
x2 an object of class splm
data an object of class data.frame or pdata.frame. An optional data frame con-taining the variables in the model. When the obect is a data.frame, the firsttwo columns may contain the indexes. See index
index if not NULL (default), a character vector to identify the indexes among thecolumns of the data.frame
listw an object of class listw created for example by nb2listw
spatial.model one of c("lag","error","sarar"), the model to be estimated (only lag, onlyerror, both lag and error dependence)
method one of c("ML","GM")
errors one of c("BSK","KPP"). When method is "ML" defines the specification of theinnovations
... additional arguments to be passed
Value
an object of class htest
Author(s)
Gianfranco Piras
References
Millo, G., Piras, G. (2012) splm: Spatial Panel Data Models in R. Journal of Statistical Software,47(1), 1–38. URL http://www.jstatsoft.org/v47/i01/.
See Also
spgm
Examples
data(Produc, package="plm")data(usaww)fm <- log(gsp)~log(pcap)+log(pc)+log(emp)+unemptest1<-sphtest(fm,data=Produc, listw = mat2listw(usaww),
spatial.model = "error", method="GM")test1mod1<- spgm(fm, data=Produc, listw = usaww, model = "random",
spatial.error = TRUE, moments="fullweights")mod2<- spgm(fm, data=Produc, listw = usaww, model = "within",
spatial.error = TRUE)test2<-sphtest(mod1, mod2)test2
20 spml
spml Spatial Panel Model by Maximum Likelihood
Description
Maximum likelihood (ML) estimation of spatial panel models, possibly with fixed or random ef-fects.
Usage
spml(formula, data, index=NULL, listw, listw2=listw, na.action,model=c("within","random","pooling"),effect=c("individual","time","twoways"),lag=FALSE, spatial.error=c("b","kkp","none"),...)
Arguments
formula a symbolic description of the model to be estimated
data an object of class data.frame or pdata.frame. A data frame containing thevariables in the model. When the object is a data.frame, the first two columnsshall contain the indexes, unless otherwise specified. See index
index if not NULL (default), a character vector to identify the indexes among thecolumns of the data.frame
listw an object of class listw or a matrix. It represents the spatial weights to be usedin estimation.
listw2 an object of class listw or a matrix. Second of set spatial weights for estima-tion, if different from the first (e.g., in a ’sarar’ model).
na.action see spdep for more details.
model one of c("within", "random", "pooling").
effect one of c("individual","time","twoways"); the effects introduced in themodel.
lag default=FALSE. If TRUE, a spatial lag of the dependent variable is added.
spatial.error one of c("b","kkp","none"). The type of spatial error in the specification, ifany. See details.
... additional argument to pass over to other functions
Details
The models are estimated by two-step Maximum Likelihood. Further optional parameters to bepassed on to the estimator may be: pvar: if TRUE the pvar function is called hess: if TRUE usenumerical Hessian instead of GLS for the standard errors of the estimates quiet: if FALSE reportfunction and parameters values during optimization initval: one of c("zeros", "estimate"), theinitial values for the parameters. If "zeros" a vector of zeros is used. if "estimate" the initial
spml 21
values are retreived from the estimation of the nested specifications. Alternatively, a numeric vectorcan be specified. x.tol: Tolerance. See nlminb for details. rel.tol: Relative tolerance. See nlminbfor details.
Value
An object of class "splm".
coefficients coefficients estimate of the model parameters
arcoef the coefficient for the spatial lag on y
errcomp the estimates of the error variance components
vcov the asymptotic variance covariance matrix of the estimated coefficients
vcov.arcoef the asymptotic variance of the estimated spatial lag parameter
vcov.errcomp the asymptotic variance covariance matrix of the estimated error covariance pa-rameters
type ’random effects ML’
residuals the model residuals
fitted.values the fitted values, calculated as y = Xβ
sigma2 GLS residuals variance
model the matrix of the data used
call the call used to create the object
logLik the value of the log likelihood function at the optimum
errors the value of the errors argument
Author(s)
Giovanni Millo
References
Baltagi, B.H., Song, S.H., Jung B. and Koh, W. (2007) Testing panel data regression models withspatial and serial error correlation. Journal of Econometrics, 140, 5-51.
Millo, G., Piras, G. (2012) splm: Spatial Panel Data Models in R. Journal of Statistical Software,47(1), 1–38. URL http://www.jstatsoft.org/v47/i01/.
See Also
spgm

22 spreml
Examples
data(Produc, package = "plm")data(usaww)fm <- log(gsp) ~ log(pcap) + log(pc) + log(emp) + unemp## the two standard specifications (SEM and SAR) one with FE## and the other with RE:## fixed effects panel with spatial errorsfespaterr <- spml(fm, data = Produc, listw = mat2listw(usaww),
model="within", spatial.error="b", Hess = FALSE)summary(fespaterr)## random effects panel with spatial lagrespatlag <- spml(fm, data = Produc, listw = mat2listw(usaww),
model="random", spatial.error="none", lag=TRUE)summary(respatlag)## calculate impact measuresimpac1 <- impacts(respatlag, listw = mat2listw(usaww, style = "W"), time = 17)summary(impac1, zstats=TRUE, short=TRUE)
spreml Spatial Panel Model with Random Effects by Maximum Likelihood
Description
Maximum likelihood (ML) estimation of spatial panel models with random effects and serial errorcorrelation.
Usage
spreml(formula, data, index = NULL, w, w2=w, lag = FALSE,errors = c("semsrre", "semsr", "srre", "semre","re", "sr", "sem","ols", "sem2srre", "sem2re"),pvar = FALSE, hess = FALSE, quiet = TRUE,initval = c("zeros", "estimate"),x.tol = 1.5e-18, rel.tol = 1e-15, ...)
Arguments
formula a symbolic description of the model to be estimated
data an object of class data.frame or pdata.frame. A data frame containing thevariables in the model. When the object is a data.frame, the first two columnsshall contain the indexes, unless otherwise specified. See index
index if not NULL (default), a character vector to identify the indexes among thecolumns of the data.frame
w an object of class listw or a matrix. It represents the spatial weights to be usedin estimation.
w2 an object of class listw or a matrix. Second set of spatial weights for estima-tion, if different from the first (e.g., in a ’sarar’ model).

spreml 23
lag default=FALSE. If TRUE, a spatial lag of the dependent variable is added.
errors Specifies the error covariance structure. See details.
pvar legacy parameter here only for compatibility.
hess default=FALSE. If TRUE estimate the covariance for beta_hat by numerical Hes-sian instead of GLS at optimal values.
quiet default=TRUE. If FALSE, report function and parameters values during optimiza-tion.
initval one of c("zeros", "estimate"), the initial values for the parameters. If"zeros" a vector of zeros is used. if "estimate" the initial values are retreivedfrom the estimation of the nested specifications. Alternatively, a numeric vectorcan be specified.
x.tol control parameter for tolerance. See nlminb for details.
rel.tol control parameter for relative tolerance. See nlminb for details.
... additional arguments to pass over to other functions, e.g. method.
Details
Second-level wrapper for estimation of random effects models with serial and spatial correlation.The specifications without serial correlation (no "sr" in errors) can be called through spml, theextended ones only through spreml. The models are estimated by two-step Maximum Likelihood.Abbreviations in errors correspond to: "sem" Anselin-Baltagi type spatial autoregressive error:if present, random effects are not spatially correlated; "sem2" Kapoor, Kelejian and Prucha-typespatial autoregressive error model with spatially correlated random effects; "sr" serially correlatedremainder errors; "re" random effects; "ols" spherical errors (usually combined with lag=T). Theoptimization method can be passed on as optional parameter. Default is "nlminb"; all constrainedoptimization methods from maxLik are allowed ("BFGS", "NM", "SANN") but the latter two arestill experimental.
Value
An object of class "splm".
coefficients coefficients estimate of the model parameters
arcoef the coefficient for the spatial lag on y
errcomp the estimates of the error variance components
vcov the asymptotic variance covariance matrix of the estimated coefficients
vcov.arcoef the asymptotic variance of the estimated spatial lag parameter
vcov.errcomp the asymptotic variance covariance matrix of the estimated error covariance pa-rameters
type ’random effects ML’
residuals the model residuals
fitted.values the fitted values, calculated as y = Xβ
sigma2 GLS residuals variance
model the matrix of the data used
24 summary.splm
call the call used to create the object
logLik the value of the log likelihood function at the optimum
errors the value of the errors argument
Author(s)
Giovanni Millo
References
Millo, G. (2014) Maximum likelihood estimation of spatially and serially correlated panels withrandom effects. Computational Statistics and Data Analysis, 71, 914–933.
See Also
spml
Examples
data(Produc, package = "plm")data(usaww)fm <- log(gsp) ~ log(pcap) + log(pc) + log(emp) + unemp## random effects panel with spatial lag and serial error correlation## optimization method set to "BFGS"sarsrmod <- spreml(fm, data = Produc, w = usaww, errors="sr", lag=TRUE,
method="BFGS")summary(sarsrmod)
summary.splm summary method for class splm
Description
Method for summarizing the results of objects of class 'splm'
Usage
## S3 method for class 'splm'summary(object,...)
Arguments
object an object of class 'splm'
... additional arguments to be passed

usaww 25
Details
The summary function summary.splm returns an objects of class ’splm’ organized in a coefficientmatrix.
Also a matrix for the error components, or the spatial coefficients will be generated depending onthe estimated model.
When the 'splm' is produced by the function ’spsegm’, the summary will be generated loopingover the number of equations in the system.
Value
An object of class 'summary.splm'
Author(s)
Giovanni Millo, Gianfranco Piras
See Also
spml, spgm
Examples
data(Produc, package = "plm")data(usaww)GM <- spgm(log(gsp)~log(pcap)+log(pc)+log(emp)+unemp, data=Produc,
listw=usaww, moments = "fullweights", spatial.error = TRUE)summary(GM)
usaww Spatial weights matrix - US states
Description
Spatial weights matrix of the 48 continental US States based on the queen contiguity criterium.
Usage
data(usaww)
Format
A matrix with elements different from zero if state i and j are neighbors. Weights are row stan-dardized. According to the queen contiguity criterium, Arizona and Colorado are considered neigh-bours.
Author(s)
Giovanni Millo

26 vcov.splm
vcov.splm Covariance extractor method for splm objects
Description
Covariance extractor method for splm objects. Seldom used as such but needed, e.g., for interoper-ability with testing functions in lmtest and car.
Usage
## S3 method for class 'splm'vcov(object, ...)
Arguments
object an object of class splm
... additional arguments to be passed; currently not used
Value
a covariance matrix of beta coefficients
Author(s)
Giovanni Millo
References
Zeileis, A. (2006) Object-Oriented Computation of Sandwich Estimators. Journal of StatisticalSoftware, 16(9), 1-16.
Examples
## not run:## data(Produc, package="plm")## data(usaww)## fm <- log(gsp)~log(pcap)+log(pc)+log(emp)+unemp## sarremod <- spml(fm, data=Produc, listw = mat2listw(usaww),## model="random", lag=TRUE, spatial.error="none")## ## compact representation of betas## library(lmtest)## coeftest(sarremod)## ## linear hypothesis test## library(car)## lht(sarremod, "log(pcap)=log(pc)")

Index
∗Topic datasetsInsurance, 5itaww, 7RiceFarms, 9riceww, 10usaww, 25
∗Topic htestbsjktest, 2bsktest, 3rwtest, 10slmtest, 14sphtest, 18
∗Topic slagslag, 13
∗Topic spatialeffects.splm, 4listw2dgCMatrix, 7print.splm, 8spgm, 15spml, 20spreml, 22summary.splm, 24
∗Topic vcovvcov.splm, 26
bsjktest, 2bsktest, 3
effects.splm, 4
Insurance, 5itaww, 7ivsplm (spgm), 15
listw2dgCMatrix, 7
print.effects.splm (effects.splm), 4print.splm, 8
RiceFarms, 9riceww, 10
rwtest, 10
slag, 13slmtest, 14sperrorgm (spgm), 15spgm, 15sphtest, 18spml, 20spreml, 22spsarargm (spgm), 15summary.splm, 24
usaww, 25
vcov.splm, 26
27