Package ‘sdm’ fileadd 3 Arguments x Either a list, or an object generated by getmethod function...
46
Package ‘sdm’ February 26, 2019 Type Package Title Species Distribution Modelling Version 1.0-67 Date 2019-02-26 Author Babak Naimi, Miguel B. Araujo Maintainer Babak Naimi <[email protected]> Depends methods, sp (>= 1.2-0), R (>= 3.0.0) Imports raster Suggests R.rsp, shinyBS, shiny, dismo, rmarkdown Description An extensible framework for developing species distribution models using individual and community-based approaches, generate ensembles of models, evaluate the models, and predict species potential distributions in space and time. For more information, please check the following paper: Naimi, B., Araujo, M.B. (2016) <doi:10.1111/ecog.01881>. License GPL (>= 3) URL http://biogeoinformatics.org VignetteBuilder R.rsp NeedsCompilation no Repository CRAN Date/Publication 2019-02-26 13:00:03 UTC R topics documented: add .............................................. 2 Arith-methods ........................................ 4 as.data.frame ........................................ 5 boxplot ........................................... 6 calibration .......................................... 7 coordinates ......................................... 8 density ............................................ 9 1
Transcript of Package ‘sdm’ fileadd 3 Arguments x Either a list, or an object generated by getmethod function...

Package ‘sdm’February 26, 2019
Type Package
Title Species Distribution Modelling
Version 1.0-67
Date 2019-02-26
Author Babak Naimi, Miguel B. Araujo
Maintainer Babak Naimi <[email protected]>
Depends methods, sp (>= 1.2-0), R (>= 3.0.0)
Imports raster
Suggests R.rsp, shinyBS, shiny, dismo, rmarkdown
Description An extensible framework for developing species distributionmodels using individual and community-based approaches, generate ensembles ofmodels, evaluate the models, and predict species potential distributions inspace and time. For more information, please check the following paper:Naimi, B., Araujo, M.B. (2016) <doi:10.1111/ecog.01881>.
License GPL (>= 3)
URL http://biogeoinformatics.org
VignetteBuilder R.rsp
NeedsCompilation no
Repository CRAN
Date/Publication 2019-02-26 13:00:03 UTC
R topics documented:add . . . . . . . . . . . . . . . . . . . . . . . . . . . . . . . . . . . . . . . . . . . . . . 2Arith-methods . . . . . . . . . . . . . . . . . . . . . . . . . . . . . . . . . . . . . . . . 4as.data.frame . . . . . . . . . . . . . . . . . . . . . . . . . . . . . . . . . . . . . . . . 5boxplot . . . . . . . . . . . . . . . . . . . . . . . . . . . . . . . . . . . . . . . . . . . 6calibration . . . . . . . . . . . . . . . . . . . . . . . . . . . . . . . . . . . . . . . . . . 7coordinates . . . . . . . . . . . . . . . . . . . . . . . . . . . . . . . . . . . . . . . . . 8density . . . . . . . . . . . . . . . . . . . . . . . . . . . . . . . . . . . . . . . . . . . . 9
1

2 add
ensemble . . . . . . . . . . . . . . . . . . . . . . . . . . . . . . . . . . . . . . . . . . 10evaluates . . . . . . . . . . . . . . . . . . . . . . . . . . . . . . . . . . . . . . . . . . . 12Extract by index . . . . . . . . . . . . . . . . . . . . . . . . . . . . . . . . . . . . . . . 14featuresFrame-class . . . . . . . . . . . . . . . . . . . . . . . . . . . . . . . . . . . . . 15get models’ outputs . . . . . . . . . . . . . . . . . . . . . . . . . . . . . . . . . . . . . 16getVarImp . . . . . . . . . . . . . . . . . . . . . . . . . . . . . . . . . . . . . . . . . . 17gui . . . . . . . . . . . . . . . . . . . . . . . . . . . . . . . . . . . . . . . . . . . . . . 18installAll . . . . . . . . . . . . . . . . . . . . . . . . . . . . . . . . . . . . . . . . . . 19names . . . . . . . . . . . . . . . . . . . . . . . . . . . . . . . . . . . . . . . . . . . . 20niche . . . . . . . . . . . . . . . . . . . . . . . . . . . . . . . . . . . . . . . . . . . . . 22predict . . . . . . . . . . . . . . . . . . . . . . . . . . . . . . . . . . . . . . . . . . . . 24rcurve . . . . . . . . . . . . . . . . . . . . . . . . . . . . . . . . . . . . . . . . . . . . 26read.sdm . . . . . . . . . . . . . . . . . . . . . . . . . . . . . . . . . . . . . . . . . . . 28roc . . . . . . . . . . . . . . . . . . . . . . . . . . . . . . . . . . . . . . . . . . . . . . 29sdm . . . . . . . . . . . . . . . . . . . . . . . . . . . . . . . . . . . . . . . . . . . . . 31sdmCorrelativeMethod-class . . . . . . . . . . . . . . . . . . . . . . . . . . . . . . . . 33sdmData . . . . . . . . . . . . . . . . . . . . . . . . . . . . . . . . . . . . . . . . . . . 34sdmdata-class . . . . . . . . . . . . . . . . . . . . . . . . . . . . . . . . . . . . . . . . 38sdmModels-classes . . . . . . . . . . . . . . . . . . . . . . . . . . . . . . . . . . . . . 39sdmSetting . . . . . . . . . . . . . . . . . . . . . . . . . . . . . . . . . . . . . . . . . 40subset . . . . . . . . . . . . . . . . . . . . . . . . . . . . . . . . . . . . . . . . . . . . 42
Index 44
add add a new method to the package
Description
This function is an interface to extend the package. A user can define a new method band add itto the package. When the method is successfully added, it can be used together with all existingmethods. The names of available methods in the package can be seen using getmethodNames. It isnot limited only to modelling (fitting) methods, but can be a replication method, or one to generatepseudo-absences, etc.
You can get an object of an existing method through getmethod.
Usage
add(x,w,echo,...)
getmethod(x,w,...)
getmethodNames(w,...)

add 3
Arguments
x Either a list, or an object generated by getmethod function
w specify which group of methods the new method belongs to. "sdm" (default)can be used for modelling method
echo logical (default=TRUE), determines whether a message should be printed toreport if the adding is successful
... additional arguments. see details
Details
These functions provide flexibility to extend the package by adding new methods. It is also possibleto add several instances of an existing method to have, for example, a method with different settingsat the same time. Whetevet the new method is, it can also be shared and used by other users.
Value
getmethod gives an object of an appropriate class depending on w.
getmethodNames generate a list (if alt=TRUE is provided as additional argument) containing thename of methods and all alternative names (aliases) specified for each method, or a character vector(if alt=FALSE) containing the main names.
Author(s)
Babak Naimi <[email protected]>
http://r-gis.net
http://biogeoinformatics.org
References
Naimi, B., Araujo, M.B. (2016) sdm: a reproducible and extensible R platform for species distribu-tion modelling, Ecography, 39:368-375, DOI: 10.1111/ecog.01881
Examples
## Not run:getmethodNames('sdm')
## End(Not run)
4 Arith-methods
Arith-methods Combine (merge) two sdmModels into a single object
Description
If two sets of models fitted in two separate sdmModels objects, they can be merged into a singlesdmModels objects using ‘+‘
Value
an object of class sdmModels
Author(s)
Babak Naimi <[email protected]>
http://r-gis.net
http://biogeoinformatics.org
References
Naimi, B., Araujo, M.B. (2016) sdm: a reproducible and extensible R platform for species distribu-tion modelling, Ecography, 39:368-375, DOI: 10.1111/ecog.01881
Examples
## Not run:file <- system.file("external/pa_df.csv", package="sdm")
df <- read.csv(file)
head(df)
d <- sdmData(sp~b15+NDVI,train=df)
d#----
m1 <- sdm(sp~b15+NDVI,data=d,methods=c('glm','gbm'))
m1
m2 <- sdm(sp~b15+NDVI,data=d,methods=c('svm'))
m2
m <- m1 + m2
m

as.data.frame 5
## End(Not run)
as.data.frame Get a data.frame with record id values (rID)
Description
Converts a sdmdata object to a data.frame. By additional arguments, it is possible to make aquary on the dataset (see details).
Usage
## S4 method for signature 'sdmdata'as.data.frame(x, ...)
Arguments
x sdmdata object
... Additional arguments (optional, see details)
Details
Following additional arguments optionally can be used to get a subset of data by specifying therecord IDs; or using a query by specifying the name of species, and/or the name of data groups,and/or range of times (if time information are available):
ind: an intiger vector containing the record Ids; sp: a character vector of the name of species grp:a character vector of the group names (e.g., ’test’; if indipendent test is available) time: a vector oftimes (an appropriate time class or a character that can be converted into a time format)
Value
data.frame
Author(s)
Babak Naimi <[email protected]>
http://r-gis.net
http://biogeoinformatics.org
References
Naimi, B., Araujo, M.B. (2016) sdm: a reproducible and extensible R platform for species distribu-tion modelling, Ecography, 39:368-375, DOI: 10.1111/ecog.01881
6 boxplot
Examples
## Not run:file <- system.file("external/data.sdd", package="sdm")
d <- read.sdm(file)
d # a sdmdata object
df <- as.data.frame(d)head(df)
# only the records with rID == c(1,2,3):as.data.frame(d, ind=1:3)
## End(Not run)
boxplot boxplot
Description
Make a box plot of model evaluation data, i.e., the model predictions for known presence andabsence points.
Details
Arguments:
x Object of class sdmEvaluate names Optional, the x-axis label for the group of data (e.g., ’Ab-sence’, ’Presence’) ... Additional arguments that can be passed to boxplot
Author(s)
Babak Naimi <[email protected]>
http://r-gis.net
http://biogeoinformatics.org
References
Naimi, B., Araujo, M.B. (2016) sdm: a reproducible and extensible R platform for species distribu-tion modelling, Ecography, DOI: 10.1111/ecog.01881
calibration 7
Examples
e <- evaluates(x=c(1,1,0,1,0,0,0,1,1,1,0),p=c(0.69,0.04,0.05,0.95,0.04,0.65,0.09,0.61,0.75,0.84,0.15))
boxplot(e)
calibration Calibration
Description
evaluates for calibration
Usage
calibration(x,p,nbin,weight,...)
Arguments
x a numeric vector including the observed values; or a sdmEvaluate objectp a numeric vector including the predicted valuesnbin number of bins to discretize the predicted values into the specified bins (default:
10); instead, it can be the keyword of ’seek’ to ask for seeking the best numberweight logical, specifies whether a weight should be calculated based on the number
of records at each bin. The weight will be used to summarize the calibrationstatistic
... additional arguments (not implemented yet.)
Details
The output of this function can be used in the plot function to generate Calibration plot. Thecalibration statistic is calculated using a method developed by the authors of this package (thejournal article is not published yet, but in preparation)
Value
an object of class .sdmCalibration
Author(s)
Babak Naimi <[email protected]>
http://r-gis.net
http://biogeoinformatics.org
8 coordinates
References
Naimi, B., Niamir, A., Jimenez-Valverde, A., Araujo, M.B. (In preparation) Measuring calibrationcapacity of statistical models: a new statistic.
Naimi, B., Araujo, M.B. (2016) sdm: a reproducible and extensible R platform for species distribu-tion modelling, Ecography, DOI: 10.1111/ecog.01881
Examples
ca <- calibration(x=c(1,1,0,1,0,0,0,1,1,1,0),p=c(0.69,0.04,0.05,0.95,0.04,0.65,0.09,0.61,0.75,0.84,0.15))
ca
plot(ca)
coordinates get or set spatial coordinates of species data
Description
Get or set spatial coordiates of a sdmdata object.
Usage
## S4 method for signature 'sdmdata'coordinates(obj)
## S4 replacement method for signature 'sdmdata'coordinates(object)<-value
Arguments
obj speciesData (either of singleSpecies, multiple Species or SpeciesDataList) ob-ject
object same as obj
value spatial coordinates either a matrix, or data.frame, or column name as character,or a formula (e.g., ~x+y, or ~coords(x+y))
... Additional arguments

density 9
Value
matrix, or if the coordinates set, the sdmdata object is returned.
Author(s)
Babak Naimi <[email protected]>
http://r-gis.net
http://biogeoinformatics.org
References
Naimi, B., Araujo, M.B. (2016) sdm: a reproducible and extensible R platform for species distribu-tion modelling, Ecography, DOI: 10.1111/ecog.01881
Examples
file <- system.file("external/data.sdd", package="sdm")d <- read.sdm(file)
d # a sdmdata object
coordinates(d)
density density
Description
Create a density plots of presence and absence data
Value
A density plot. Presence data are in darkblue, and absence data are in red.
Methods
density(x, ...)
x Object of class ’sdmEvaluate’ (or a numeric vector of observed presence/absence)
Author(s)
Babak Naimi <[email protected]>
http://r-gis.net
http://biogeoinformatics.org

10 ensemble
References
Naimi, B., Araujo, M.B. (2016) sdm: a reproducible and extensible R platform for species distribu-tion modelling, Ecography, DOI: 10.1111/ecog.01881
Examples
e <- evaluates(x=c(1,1,0,1,0,0,0,1,1,1,0),p=c(0.69,0.04,0.05,0.95,0.04,0.65,0.09,0.61,0.75,0.84,0.15))
density(e)
ensemble Ensemble Forecasting of SDMs
Description
Make a Raster object with a weighted averaging over all predictions from several fitted model in asdmModel object.
Usage
## S4 method for signature 'sdmModels'ensemble(x, newdata, filename="",setting,...)
Arguments
x a sdmModels object
newdata Raster* object or data.frame
filename character, output file name
setting list, contains the parameters that are used in the ensemble procedure; see details
... additional arguments passed to the predict function
Details
ensemble function uses the fitted models in an sdmModels object to generate an ensemble/consensusof predictions by individual models. Several methods do exist for this procedure, that are (or will be)implemented in this function, and can be defined in the method argument. A list can be introducedin the setting argument in which several parameters can be set including:
- method: specify which ensemble method should be used. Currently, ’unweighted’ (unweightedaveraging), and ’weighted’ (weighted averaging) are implemented, but more methods will be added.
ensemble 11
- stat: if the method=’weighted’ is used, this specify which evaluation statistics can be used asweight in the weighted averaging procedure. Alternatively, one may directly introduce weights (seethe next argument)
- weights: an optional numeric vector (with a length equal to the models that are successfully fitted)to specify the weights for weighted averaging procedure (if the method=’weighted’ is specified)
- id: specify the model IDs that should be considered in the ensemble procedure. If missing, all themodels that are successfully fitted are considered.
- wtest: specify which test dataset ("training","test.dep","test.indep") should be used to extract thestatistic (stat) values as weights (if a relevant method is specified)
Value
- a Raster object if predictors is a Raster object
- a numeric vector if predictors is a data.frame object
Author(s)
Babak Naimi <[email protected]>
http://biogeoinformatics.org
References
#
See Also
#
Examples
## Not run:
file <- system.file("external/species.shp", package="sdm") # get the location of the species data
species <- shapefile(file) # read the shapefile
path <- system.file("external", package="sdm") # path to the folder contains the data
lst <- list.files(path=path,pattern='asc$',full.names = T) # list the name of the raster files
# stack is a function in the raster package, to read/create a multi-layers raster datasetpreds <- stack(lst) # making a raster object
d <- sdmData(formula=Occurrence~., train=species, predictors=preds)
d
# fit the models (5 methods, and 10 replications using bootstrapping procedure):

12 evaluates
m <- sdm(Occurrence~.,data=d,methods=c('rf','tree','fda','mars','svm'),replicatin='boot',n=10)
# ensemble using weighted averaging based on AUC statistic:p1 <- ensemble(m, newdata=preds, filename='ens.img',setting=list(method='weighted',stat='AUC'))plot(p1)
# ensemble using weighted averaging based on TSS statistic# and optimum threshold critesion 2 (i.e., Max(spe+sen)) :p2 <- ensemble(m, newdata=preds, filename='ens2.img',setting=list(method='weighted',
stat='TSS',opt=2))plot(p2)
## End(Not run)
evaluates evaluate for accuracy
Description
evaluates for accuracy
Usage
evaluates(x,p,...)
getEvaluation(x,w,wtest,stat,opt,...)
Arguments
x a numeric vector including the observed values; or a sdmModels object
p a numeric vector including the predicted values
w a numeric vector indicates model IDs
wtest which test, training, dep.test, or indep.test?
stat statistics that should be extracted from the sdmEvaluate object
opt a numeric value indicates which threshold optimisation criteria should be con-sidered if a threshold-based statistic is selected in stat
... additional arguments (see details)

evaluates 13
Details
Evaluates the preformance (accuracy) given the obsetved values, and the predicted values. Asadditional argument, the distribution of data can be specified (through distribution), that can beeither of 'binomial', 'gaussian', 'laplase', or 'poisson'. If not specified, it will be guessedby the function!
getEvaluation can be used to get the evaluation results from a fitted model (sdmModels object thatis output of the sdm function). Each model in sdmModels has a modelID, that can be specified in wargument. If w is not specified or more than a modelID is specified, then a data.frame is generatedthat contains the statistics specified in stat. For a single model (if length w is 1), stat can be 1 (thre-hold_independent statistics), or 2 (threshold_based statistics) or NULL (both groups). If more than amodel is specified (w is either NULL or has a length greater than 1), stat can be the name of statisticssuch as 'AUC', 'COR', 'Deviance', 'obs.prevalence', 'threshold', 'sensitivity', 'specificity', 'TSS', 'Kappa', 'NMI', 'phi', 'ppv', 'npv', 'ccr', 'prevalence'.If either of the thershold_based stats are selected, opt can be also specified to select one of the crite-ria for optimising the threshold. The possible value can be between 1 to 10 for "sp=se", "max(se+sp)", "min(cost)", "minROCdist", "max(kappa)", "max(ppv+npv)", "ppv=npv", "max(NMI)", "max(ccr)", "prevalence"criteria, respectively.
Value
an object of class sdmEvaluate from evaluates function
a list or data.frame from getEvaluation function
Author(s)
Babak Naimi <[email protected]>
http://r-gis.net
http://biogeoinformatics.org
References
Naimi, B., Araujo, M.B. (2016) sdm: a reproducible and extensible R platform for species distribu-tion modelling, Ecography, DOI: 10.1111/ecog.01881
See Also
#
Examples
## Not run:file <- system.file("external/model.sdm", package="sdm")
m <- read.sdm(file) # a sdmModels Object (fitted using sdm function)
getModelInfo(m)
# there are 4 models in the sdmModels objects
# so let's take a look at all the results for the model with modelID 1

14 Extract by index
# evaluation using training data (both threshod_independent and threshold_based groups):
getEvaluation(m,w=1,wtest='training')
getEvaluation(m,w=1,wtest='training',stat=1) # stat=1 (threshold_independent)
getEvaluation(m,w=1,wtest='test.dep',stat=2) # stat=2 (threshold_based)
getEvaluation(m,w=1:3,wtest='test.dep',stat=c('AUC','TSS'),opt=2)
getEvaluation(m,opt=1) # all models
getEvaluation(m,stat=c('TSS','Kappa','AUC'),opt=1) # all models
############
example for evaluation:
evaluates(x=c(1,1,0,1,0,0,0,1,1,1,0),p=c(0.69,0.04,0.05,0.95,0.04,0.65,0.09,0.61,0.75,0.84,0.15))
## End(Not run)
Extract by index Indexing to extract records of a sdmdata object
Description
This function extracts records of a sdmdata object and generates a new object of the same type (ifdrop=FALSE; otherwise a data.frame). In sdmdata, rID is the unique ID for each record.
Methods
x[i]
Arguments
x a Raster* objecti an index: record id (rID) in sdmdata objectdrop If TRUE, a data.frame is returned, otherwise a sdmdata object is returned.
Author(s)
Babak Naimi <[email protected]>
http://r-gis.net
http://biogeoinformatics.org

featuresFrame-class 15
References
Naimi, B., Araujo, M.B. (2016) sdm: a reproducible and extensible R platform for species distribu-tion modelling, Ecography, 39:368-375, DOI: 10.1111/ecog.01881
Examples
file <- system.file("external/data.sdd", package="sdm")
d <- read.sdm(file)
# see the number of records:d
d2 <- d[1:10]
d2
d3 <- d[1:10,drop=TRUE]
d3
featuresFrame-class featureFrame class
Description
An S4 class contains the information of features used to fit a model
Slots
vars A character vector containing the name of variabes from the dataset used to generate thefeatures
feature.types A list containing the definition of featuresresponse.specific NULL, or a list containing the definition of features that their definitions are
according to the response variable (i.e. species)
Author(s)
Babak Naimi <[email protected]>
http://r-gis.net
http://biogeoinformatics.org
References
Naimi, B., Araujo, M.B. (2016) sdm: a reproducible and extensible R platform for species distribu-tion modelling, Ecography, DOI: 10.1111/ecog.01881

16 get models’ outputs
get models’ outputs Get information/modelIDs relevant to fitted models in a sdmModelsobject
Description
When SDMs are fitted using the sdm function, a sdmModels object is generated containing all theinformation and objects created through fitting and evaluation procedures for all species and meth-ods. To each model, a unique modelID is assigned. getModelInfo returns a data.frame summaris-ing some information relevant to the fitted models including modelID, method name, whether themodel is fitted successfully, whether and what replication procedure is used for data partitioning,etc. getModelInfo helps to get the unique model IDs for all or certain models given the parametersthat users specify.
Usage
getModelId(x,success,species,method,replication, run)
getModelInfo(x,...)
Arguments
x a sdmModel object
success logical; specifies whether the info/ids should be returned only for the modelsthat are successfully fitted or not (default is TRUE)
species optional; a character vector specifies the name of species for which the infoshould be returned (default is NULL meaning for all species)
method optional; a character vector specifies the name of methods for which the infoshould be returned (default is NULL meaning for all methods)
replication optional; a character vector specifies the name of replication method for whichthe info should be returned (default is NULL meaning for all species)
run optional; a numeric vector specifies for which replication runs the info shouldbe returned (default is NULL meaning for all runs)
... additional arguments. see details
Details
in getModelInfo, as additional arguments, you can use the arguments in the function getModelIdto specify which records should be returned.
Value
getModelInfo: data.frame getModelId: a numeric vector

getVarImp 17
Author(s)
Babak Naimi <[email protected]>
http://r-gis.net
http://biogeoinformatics.org
References
Naimi, B., Araujo, M.B. (2016) sdm: a reproducible and extensible R platform for species distribu-tion modelling, Ecography, 39:368-375, DOI: 10.1111/ecog.01881
See Also
#
Examples
file <- system.file("external/model.sdm", package="sdm")
m <- read.sdm(file)
getModelInfo(m)
# getModelId(m)
# getModelId(m,method='glm')
getVarImp variable importance
Description
Calculates relative importance of different variables in the models using several approaches.
Usage
getVarImp(x,id,wtest,...)
Arguments
x a numeric vector including the observed values; or a sdmEvaluate object
id a numeric vector including the predicted values
wtest specifies which dataset (’training’,’test.dep’,’test.indep’) should be used (if ex-ist) to calculate the importance of variables
... additional arguments (not implemented yet.)
18 gui
Details
getVarImp function returns an object including different measures of variable importance, and ifbe put in plot function, a barplot is generated:
Author(s)
Babak Naimi <[email protected]>
http://r-gis.net
http://biogeoinformatics.org
References
Naimi, B., Araujo, M.B. (2016) sdm: a reproducible and extensible R platform for species distribu-tion modelling, Ecography, DOI: 10.1111/ecog.01881
Examples
## Not run:# if m is a sdmModels object (output of sdm function) then:
getVarImp(m,id=1,wtest='training') # variable importance based on training dataset
vi <- getVarImp(m,id=1,wtest='test.dep')
plot(vi,'auc')
plot(vi,'cor')
## End(Not run)
gui Graphical User Interface
Description
Provides the possibility of using functions in the package through an interactive graphical userinterface (GUI). Depending on input, different GUIs are opened.
Usage
## S4 method for signature 'sdmModels'gui(x,...)

installAll 19
Arguments
x a sdm* object
... not implemented yet.
Details
When x is missing, a GUI is opened to facilitate all the steps required to create sdmData, specifythe settings for the different steps, and fit sdm models. Specifying x would be useful to interactwith sdm* object. For example, if x is a sdmModels (that is generated by sdm function), a user caninteractively explore the results (e.g., to see different plots of model evaluation results).
Value
A HTML page in browser is opened.
Author(s)
Babak Naimi <[email protected]>
http://r-gis.net
http://biogeoinformatics.org
Examples
## Not run:file <- system.file("external/model.sdm", package="sdm")
m <- read.sdm(file) # a sdmModels Object (fitted using sdm function)
m
gui(m)
## End(Not run)
installAll install all packages that may be required by the package
Description
This function facilitates to install the required packages that some functions are dependent on inthe sdm package. It first checks whether the package is already installed, and if not, it installs thepackages. If update=TRUE is used, the packages re-installed if they were already installed.

20 names
Usage
installAll(pkgs,update,...)
Arguments
pkgs optional. the user provided list of packages (not required for the purpose of thisfunction)
update logical (default=FALSE), specifies whether the packages re-installed if they arealready installed on the machine
... Additional arguments passed to the install.packages function
Author(s)
Babak Naimi <[email protected]>
http://r-gis.net
http://biogeoinformatics.org
References
Naimi, B., Araujo, M.B. (2016) sdm: a reproducible and extensible R platform for species distribu-tion modelling, Ecography, DOI: 10.1111/ecog.01881
See Also
#
Examples
## Not run:
installAll()
## End(Not run)
names Names of species
Description
Get or set the names of the species of a sdmdata object

names 21
Usage
## S4 method for signature 'sdmdata'names(x)
## S4 replacement method for signature 'sdmdata'names(x)<-value
Arguments
x A sdm data object (sdmdata
value character (vector)
Value
For names, a character
For names<-, the updated object.
Author(s)
Babak Naimi <[email protected]>
http://r-gis.net
http://biogeoinformatics.org
References
Naimi, B., Araujo, M.B. (2016) sdm: a reproducible and extensible R platform for species distribu-tion modelling, Ecography, 39:368-375, DOI: 10.1111/ecog.01881
Examples
file <- system.file("external/data.sdd", package="sdm")
d <- read.sdm(file)
d
names(d) # returns the names of species

22 niche
niche Generate and plot Ecological Niche
Description
This function maps the species data (either presence/absence or probability of occurrence/habitatsuitability) into a two-dimensional environmental space (i.e., based on two environmental variables)to characterise ecological niche based on the specified environmental variables.
Usage
niche(x,h,n,.size,plot,out,...)
Arguments
x A Raster* object (or sdmdata) containing environmental variables
h A RasterLayer, or SpatialPoints, or sdmdata object that represents speciesdata either in the form of habitat suitability (e.g., probability of occurrence) orpresence-absence (or even presence-only) data
n A character vector specifying the names of environmental variables (two names)that should be used to map the ecological niche; if h is a SpatialPoints orsdmdata object, a third name may be added specifying the species name (e.g.,the name of the column in SpatialPointsDataFrame contains species data)
.size optional; a numeric value (default: 1e6) specifies the size of the maximum num-ber of records should be used to generate the ecological niche map; would beuseful when the Raster* object introduced in x is big, then a random samplewith the specified .size will be drawn based on which the niche is generated
plot logical, specifies whether the generated niche should be plotted
out logical, specifies whether the niche should be returned by the function; it will beTRUE if plot is FALSE
... additional arguments includingthe argument gg (see details) and other argu-ments that passed to the plot function
Details
As an additional argument, a user may specify gg which is logical, specifies whether the plot shouldbe generated using the ggplot2 package (if the package is installed), otherwise, the raster packageis used to generate the plot.
- ...: additional arguments for the plot function (e.g., xlab, ylab, main, col, ...) can be used withthe function
Value
an object of class .nicheRaster that contains some information about the environmental variable,and a RasterLayer (100x100) that represents the two-dimensional ecological niche.

niche 23
Author(s)
Babak Naimi <[email protected]>
http://r-gis.net
http://biogeoinformatics.org
References
Naimi, B., Araujo, M.B. (2016) sdm: a reproducible and extensible R platform for species distribu-tion modelling, Ecography, 39:368-375, DOI: 10.1111/ecog.01881
Examples
## Not run:
file <- system.file("external/species.shp", package="sdm") # get the location of the species data
species <- shapefile(file) # read the shapefile
path <- system.file("external", package="sdm") # path to the folder contains the data
lst <- list.files(path=path,pattern='asc$',full.names = T) # list the name of the raster files
# stack is a function in the raster package, to read/create a multi-layers raster datasetpreds <- stack(lst) # making a raster object
names(preds) # 4 environmental variables are used!
d <- sdmData(formula=Occurrence~., train=species, predictors=preds)
d
# fit models:m <- sdm(Occurrence~.,data=d,methods=c('rf','glm','brt'))
# ensemble using weighted averaging based on AUC statistic:p1 <- ensemble(m, newdata=preds,filename='ens1.grd',setting=list(method='weighted',stat='AUC'))plot(p1, main='Habitat Suitability in Geographic Space')
# Mapping Ecological Niche using selected two variablesniche(x=preds, h=p1, c('precipitation','temperature'))
niche(x=preds, h=p1, c('vegetation','temperature'))
# in case if you do not have the habitat suitability map but species data:
niche(x=preds, h=species, c('vegetation','temperature','Occurrence'))
niche(x=preds, h=d, n=c('vegetation','temperature','Occurrence'))

24 predict
## End(Not run)
predict sdm model prediction
Description
Make a Raster or matrix object (depending on input dataset) with predictions from one or severalfitted models in sdmModels object.
Usage
## S4 method for signature 'sdmModels'predict(object, newdata, filename="", w=NULL,species=NULL
,method=NULL,replication=NULL,run=NULL,mean=FALSE,control=NULL,overwrite=TRUE,nc=1,obj.size=1, ...)
Arguments
object sdmModels object
newdata Raster* object, or data.frame
filename character, output file name, if missing, a name starts with sdm_prediction willbe generated
w numeric, specifies which model(s) should be used if the object contains severalmodels; with NULL all models are used
species character, (optional), specifies which species should be used if the object con-tains models for multiple species; with NULL all species are used
method character, names of fitted models, e.g., glm, brt, etc.
replication character, specifies the names of replication method,if NULL, all available repli-cations are considered
run numeric, works if replication with multiple runs are used
mean logical, works if replication with multiple runs are used to fit the models, andspecifies whether a mean should be calculated over all predictions of a replica-tion method (e.g., bootstrapping) for each modelling method.
control not implemented yet!
overwrite logical, whether the filename should be overwriten it it does exist
nc number of cores for parallel running of the function
obj.size the size of object can be kept in memory (default=1 Giga byte). Depending onthe available memory, this value can be changed
... additional arguments, as for writeRaster

predict 25
Details
predict uses the fitted models in the sdmModel to generate the prediction given newdata. A raster(if newdata is Raster object) or data.frame (if newdata is data.frame) will be created.
The predictions can be generated for a specific set of models in the input sdmModels by determiningeither or a combination of the name of
For each prediction, a name is assigned which is kind of abbreviation or codding that tells whichspecies, which method, which replication method, and which run is the prediction for. If the outputis a Raster object, setZ function can be used to get a full name of each layer.
Value
a Raster object or data.frame
Author(s)
Babak Naimi <[email protected]>
http://r-gis.net
http://biogeoinformatics.org
References
Naimi, B., Araujo, M.B. (2016) sdm: a reproducible and extensible R platform for species distribu-tion modelling, Ecography, 39:368-375, DOI: 10.1111/ecog.01881
See Also
#
Examples
## Not run:
file <- system.file("external/species.shp", package="sdm") # get the location of the species data
species <- shapefile(file) # read the shapefile
path <- system.file("external", package="sdm") # path to the folder contains the data
lst <- list.files(path=path,pattern='asc$',full.names = T) # list the name of the raster files
# stack is a function in the raster package, to read/create a multi-layers raster datasetpreds <- stack(lst) # making a raster object
d <- sdmData(formula=Occurrence~., train=species, predictors=preds)
d
# fit the models (5 methods, and 10 replications using bootstrapping procedure):

26 rcurve
m <- sdm(Occurrence~.,data=d,methods=c('rf','tree','fda','mars','svm'),replicatin='boot',n=10)
# predict for all the methods and replications:p1 <- predict(m, newdata=preds, filename='preds.img')plot(p1)
# predict for all the methods but take the mean over all replications for each replication method:p2 <- predict(m, newdata=preds, filename='preds.img',mean=T)plot(p2)
## End(Not run)
rcurve Generate and plot response curves
Description
Calculate the response of species to the range of values in each predictor variable based on the fittedmodels in a sdmModels object.
Usage
rcurve(x,n,id,mean,confidence,gg,...)
getResponseCurve(x,id,...)
Arguments
x A sdmModels object; in the function response, it can be a .responseCurveobject which is the output of the getResponse function
id specifies the modelIDs corresponding to the models in the sdmModels objectfor which the response curves should be generated
n A vector with the name of variables for which the response curve should begenerated
mean logical, specifies whether a mean should be calculated over responses to a vari-able when multiple models are specified in ids
confidence logical, specifies whether a confidence interval should be added to the curvewhen the mean response curve is calculated based on multiple models
gg logical, specifies whether the plot should be generated using the ggplot2 package(if the package is installed)
... additional arguments passed to plot function
rcurve 27
Details
getResponseCurve calculates the responses for the models that are specified in id argument, andput the results in a .responseCurve object. This object can be used as an input in the plot function,or rcurve function.
If you just need the response curve graphs (plots), you can put a sdmModels object directly in thercurve function, and do not need to first use getResponseCurve function.
In getResponseCurve function (or in rcurve when x is sdmModels), there are some additionalarguments:
- size: a numeric value; default is 100. Specifies the size of the variable sequence that is used asthe x-axis in the response curve plot. Greater number results to a smoother curve.
- includeTest: a logical value; default is FALSE; when a data object based on which a sdmModelsis created containing independent test data; it specifies whether those records should be includedinto the response curve generation or not.
- ...: additional arguments for the plot function (e.g., xlab, ylab, main, col, lwd, lty)
Value
an object of class .responseCurve or a series of graphs
Author(s)
Babak Naimi <[email protected]>
http://r-gis.net
http://biogeoinformatics.org
References
Naimi, B., Araujo, M.B. (2016) sdm: a reproducible and extensible R platform for species distribu-tion modelling, Ecography, 39:368-375, DOI: 10.1111/ecog.01881
Examples
## Not run:file <- system.file("external/model.sdm", package="sdm")
m <- read.sdm(file) # a sdmModels Object (fitted using sdm function)
rcurve(m)
rcurve(m,id=1) # for the first model
rcurve(m, id=1:2)
rcurve(m,method = 'glm',smooth = T) # only for models fitted using glm method & with smoothed curve
28 read.sdm
## End(Not run)
read.sdm read/write sdm* object from/to a file
Description
Read an sdm object from a file, or write it to a file.
Usage
read.sdm(filename,...)
write.sdm(x,filename,overwrite,...)
Arguments
filename Filename (character)
x a sdm object (e.g., sdmModels,sdmdata or sdmSetting)
overwrite Logical. If TRUE, "filename" will be overwritten if it exists (default is FALSE)
... additional arguments
Details
read.sdm function reads any files that has been writed by write.sdm. These functions use saveRDSand readRDS to write and read the sdm objects. Additional arguments ... pass to these functions.An sdmModels object is saved to a file with an extension of ".sdm". The file extensions for sdmdataand sdmSetting object are ".sdd", and "sds", respectively.
Author(s)
Babak Naimi
http://r-gis.net
http://biogeoinformatics.org
References
Naimi, B., Araujo, M.B. (2016) sdm: a reproducible and extensible R platform for species distribu-tion modelling, Ecography, 39:368-375, DOI: 10.1111/ecog.01881

roc 29
Examples
## Not run:
file <- system.file("external/data.sdd", package="sdm")
d <- read.sdm(file)
d# can be used to read sdm models (sdmModels) and sdmSettings as well.
write.sdm(d,'dataset')# extension is created for data, model and settings as .sdd, .sds, and .sdm respectively.
list.files(pattern='dataset')
## End(Not run)
roc plot ROC curves
Description
Plot the Receiver Operating Characteristics (ROC) curve with AUC statistic in the legend.
Usage
roc(x,p=NULL,species=NULL,method=NULL,replication=NULL,run=NULL,wtest=NULL,smooth=FALSE,legend=TRUE,...)
getRoc(x,p,...)
Arguments
x Either sdmModels, or sdmEvaluate object; or a numeric vector including ob-served binary values of species occurrence
p if x is sdmModels, p is an optional vector with model ID number(s) that shouldbe plotted (NULL (default means all models)); if x is a numeric vector, p is avector with the same length including the predicted values
species the name of species should be specified (required if x is sdmModels containingmodels for several species)
method a character vector with the name of modelling methods that one need to get theroc plot for (if NULL [default], all methods in the object are considered); onlyif x is sdmModels
replication a character vector with the name of replication methods (i.e., ’sub’,’cv’,’boot’)that one need to get the roc plot for

30 roc
run if x is sdmModels, and the models are fitted through a replication procedure, runspecifies which runs of the partitioning (replications) are required; if NULL, allare considered
wtest evaluation for which test datasets are required, maximum 2 names from ’train-ing’, ’test.dep’, ’test.indep’ (i.e., evaluation for training data, dependent testdataset, and independent test dataset, respectively)
smooth logical, specified whether the ROC curves should be smoothed through a splineprocedure
legend logical, specified whether a legend including AUC statistic is required on theplot
... additional arguments passed to plot function
Details
roc generates the plots of roc curves, and getRoc generate the values of ROC
Value
an object of class matrix
Author(s)
Babak Naimi <[email protected]>
http://r-gis.net
http://biogeoinformatics.org
References
Naimi, B., Araujo, M.B. (2016) sdm: a reproducible and extensible R platform for species distribu-tion modelling, Ecography, 39:368-375, DOI: 10.1111/ecog.01881
Examples
## Not run:file <- system.file("external/model.sdm", package="sdm")
m <- read.sdm(file) # a sdmModels Object (fitted using sdm function)
roc(m)
roc(m,1) # for the first model
roc(m, 1:2)
roc(m,method = 'glm',smooth = T) # only for models fitted using glm method & with smoothed curve
## End(Not run)

sdm 31
sdm Fit and evaluate species distribution models
Description
Fits sdm for single or multiple species using single or multiple methods specified by a user inmethods argument, and evaluates their performance.
Usage
sdm(formula, data, methods,...)
Arguments
formula Specifies the structure of the model, types of features, etc.
data a sdmdata object created using sdmData function
methods Character. Specifies the methods, used to fit the models
... additional arguments
Details
sdm fits multiple models and can be used to generate multiple runs (replicates) of each methodthrough partitioning (using one or several partitioning methods including: subsampling, cross-validation,and bootstrapping.
Each model is evaluated against training data, and if available, splitted data (through partitioning;called dependent test data as well, i.e., "dep.test") and/or indipendent test data ("indep.test").
User should make sure that the methods are available and the required packages for them are in-stalled before putting their names in the function, otherwise, the methods that cannot be run for anyreason, are excluded by the function. It is a good practice to call installAll function (just onetime when the sdm is installed), that tries to install all the packages that may be needed somewherein the sdm package.
A new method can be adopted and added to the package by a user using add function. It is alsopossible to get an instance of an existing method, override the setting and definition, and then addit with a new name (e.g., my.glm).
The output would be a single object (sdmModels) that can be read/reproduced everywhere (e.g., ona new machine). A setting object can also be taken (exported) out of the output sdmModels object,that can be used to reproduce the same practice but given new conditions (i.e., new dataset, area.etc.)
Value
an object of class sdmModels

32 sdm
Author(s)
Babak Naimi <[email protected]>
http://r-gis.net
http://biogeoinformatics.org
References
Naimi, B., Araujo, M.B. (2016) sdm: a reproducible and extensible R platform for species distribu-tion modelling, Ecography, 39:368-375, DOI: 10.1111/ecog.01881
Examples
## Not run:file <- system.file("external/pa_df.csv", package="sdm")
df <- read.csv(file)
head(df)
d <- sdmData(sp~b15+NDVI,train=df)
d#----# Example 1: fit using 3 models, and no evaluation (evaluation based on training dataset):
m <- sdm(sp~b15+NDVI,data=d,methods=c('glm','gam','gbm'))
m
# Example 3: fit using 5 models, and# evaluates using 10 runs of subsampling replications taking 30 percent as test:
m <- sdm(sp~b15+NDVI,data=d,methods=c('glm','gam','gbm','svm','rf'),replication='sub',test.percent=30,n=10)
m
# Example 3: fits using 5 models, and# evaluates using 10 runs of both 5-folds cross-validation and bootsrapping replication methods
m <- sdm(sp~.,data=d,methods=c('gbm','tree','mars','mda','fda'),replication=c('cv','boot'),cv.folds=5,n=10)
m
# Example 4: fit using 3 models; evaluate the models using subsampling,# and override the default settings for the method brt:
m <- sdm(sp~b15+NDVI,data=d,methods=c('glm','gam','brt'),test.p=30,modelSettings=list(brt=list(n.trees=500,train.fraction=0.8)))

sdmCorrelativeMethod-class 33
m
## End(Not run)
sdmCorrelativeMethod-class
sdmCorrelativeMethod class
Description
An S4 class representing sdm dataset
Slots
name Modelling method name
aliases Alternative names for the method
dataArgument.names A list keeps the name of data agruments in both fit and predict functions
packages The required external package by the method
modelTypes Specifies whether the model is presence-absence, presence-only, abundance, or multi-nomial
fitParams a list of parameters needed by the method
fitSettings a list of setting parameters for the method
settingRules a function that adjust the setting parameters according to data
fitFunction The main function use for fitting the model
tuneParams a list of parameters to be tuned before the final fitting
predictParams a list of parameters needed by predict function
predictSettings a list of setting parameters for prediction
predictFunction The main predict function
metadata a metadata object containing the information about who creates the object, date, etc.
.temp.env an environment object containing the functions defined by a user that is not from apackage

34 sdmData
sdmData creating sdm Data object
Description
Creates a sdmdata objects that holds species (single or multiple) and explanatory variates. In ad-dition, more information such as spatial coordinates, time, grouping variables, and metadata (e.g.,author, date, reference, etc.) can be included.
Usage
sdmData(formula,train, test,predictors,bg,filename, crs,...)
Arguments
formula Specifies which species and explanatory variables should be taken from the inputdata. Other information (e.g., spatial coordinates, grouping variables, time, etc.)can be determined as well
train Training data containing species observations as a data.frame or SpatialPointsor SpatialPointsDataFrames. It may contain predictor variables as well
test Independent test data with the same structure as the train data
predictors explanatory variables (predictors), defined as a raster object (RasterStack orRasterBrick). Required if train data only contain species records, or back-ground records (pseudo-absences) should be generated
bg Background data (pseudo-absence), as a data.frame. It can also be a list con-tains the settings to generate background data (a Raster object is required in thepredictors argument)
filename filename of the sdm data object to store in the disk
crs optional, coordinate reference system
... Additional arguments (optional) that are used to create a metadata object. Seedetails
Details
sdmData creates a data object, for single or multiple species. It can automatically detect the vari-ables containing species data (if a data.frame is provided in train), but it is recommended touse formula through which all species (in the left hand side, e.g., sp1+sp2+sp3 ~ .), and the ex-planatory variables (in the right hand side) can be determined. If there are additional informa-tion such as spatial coordinates, time, or some variables based on which the observation can begrouped, they can be determined in the right hand side of the formula in a flexsible way (e.g.,~ . + coords(x+y) + g(var); This right hand side formula, simply determines all variables (.)+ x and y as spatial coordinates + grouping observations based on the variable var; for grouping,the variable (var in this example) should be categorical, i.e., factor ).
Additional arguments can be provided to determine metadata information including: author, website,citation, help, description, date, and license

sdmData 35
Value
an object of class sdmdata
Author(s)
Babak Naimi <[email protected]>
http://r-gis.net
http://biogeoinformatics.org
References
Naimi, B., Araujo, M.B. (2016) sdm: a reproducible and extensible R platform for species distribu-tion modelling, Ecography, 39:368-375, DOI: 10.1111/ecog.01881
Examples
## Not run:# Example 1: a data.frame containing records for a species (sp) and two predictors (b15 & NDVI):
file <- system.file("external/pa_df.csv", package="sdm")
df <- read.csv(file)
head(df)
d <- sdmData(sp~b15+NDVI,train=df)
d
# or simply:d <- sdmData(sp~.,train=df)
d
#--------# if formula is not specified, function tries to detect species and covariates, it works well only# if dataset contains no additional columns but species and covariates!
d <- sdmData(train=df)
d
# # only right hand side of the formula is specified (one covariate), so function detects species:d <- sdmData(~NDVI,train=df)
d
#----------############ Example 2: a data.frame containing presence-absence records for 1 species, 4 covariates, and# x, y coordinates:
36 sdmData
file <- system.file("external/pa_df_with_xy.csv", package="sdm")
df <- read.csv(file)
head(df)
d <- sdmData(sp~b15+NDVI+categoric1+categoric2+coords(x+y),train=df)
d#----# categoric1 and categoric2 are categorical variables (factors), if not sure the data.frame has# them as factor, it can be specified in the formula:d <- sdmData(sp~b15+NDVI+f(categoric1)+f(categoric2)+coords(x+y),train=df)
d# more simple forms of the formula:d <- sdmData(sp~.+coords(x+y),train=df)
d
d <- sdmData(~.+coords(x+y),train=df) # function detects the species
d############### Example 3: a data.frame containing presence-absence records for 10 species:
file <- system.file("external/multi_pa_df.csv", package="sdm")
df <- read.csv(file)
head(df)
# in the following formula, spatial coordinates columns are specified, and the rest is asked to# be detected by the function:d <- sdmData(~.+coords(x+y),train=df)
d
#--- or it can be customized wich species and which covariates are needed:d <- sdmData(sp1+sp2+sp3~b15+NDVI+f(categoric1) + coords(x+y),train=df)
d # 3 species, 3 covariates, and coordinates# just be careful that if you put "." in the right hand side, while not all species columns or# additional columns (e.g., coordinates, time) are specified in the formula, then it takes those# columns as covariates which is NOT right!
########## Example 4: Spatial data:
file <- system.file("external/pa_spatial_points.shp", package="sdm") # path to a shapefile
# use a package like rgdal, or maptools, or shapefile function in package raster to read shapefile:

sdmData 37
p <- shapefile(file)class(p) # a "SpatialPointsDataFrame"
plot(p)
head(p) # it contains data for 3 species
# presence-absence plot for the first species (i.e., sp1)plot(p[p@data$sp1 == 1,],col='blue',pch=16, main='Presence-Absence for sp1')
points(p[p@data$sp1 == 0,],col='red',pch=16)
# Let's read raster dataset containing predictor variables for this study area:
file <- system.file("external/predictors.grd", package="sdm") # path to a raster object
r <- brick(file)
r # a RasterBrick object including 2 rasters (covariates)
plot(r)
# now, we can use the species points and predictor rasters in sdmData function:d <- sdmData(sp1+sp2+sp3~b15+NDVI,train=p,predictors = r)
d
################### Example 5: presence-only records:
file <- system.file("external/po_spatial_points.shp", package="sdm") # path to a shapefile
# use an appropriate function to read the shapefile (e.g., readOGR in rgdal, readShapeSpatial in# maptools, or shapefile in raster):
po <- shapefile(file)class(po) # a "SpatialPointsDataFrame"
head(po) # it contains data for one species (sp4) and the column has only presence records!
d <- sdmData(sp4~b15+NDVI,train=po,predictors = r)
d # as you see in the type, the data is Presence-Only
### we can add another argument (i.e., bg) to generate background (pseudo-absence) records:
#------ in bg, we are going to provide a list containing the setting to generate background#------ the setting includes n (number of background records), method (the method used for#------ background generation; gRandom refers to random in geographic space), and remove (whether

38 sdmdata-class
#------ points located in presence sites should be removed).
d <- sdmData(sp4~b15+NDVI,train=po,predictors = r,bg=list(n=1000,method='gRandom',remove=TRUE))
d # as you see in the type, the data is Presence-Background
# you can alternatively, put a data.frame including background records in bg!
## End(Not run)
sdmdata-class An S4 class representing sdm dataset
Description
An S4 class representing sdm dataset sdmdata
Slots
species.names The names of species
species Contains the species data
features.name The names of predictor variables
features A data.frame containing predictor variables
factors The names of categorical variables (if any)
info Other information such as coordinates, metadata, etc.
groups A list including information on groups in the dataset
sdmFormula An object of class sdmFormula containing the formula and its’ terms defined by user
errorLog Reports on errors in the data raised throgh data cleaning (e.g., NA, duplications, etc.)
Author(s)
Babak Naimi <[email protected]>
http://biogeoinformatics.org
References
Naimi, B., Araujo, M.B. (2016) sdm: a reproducible and extensible R platform for species distribu-tion modelling, Ecography, DOI: 10.1111/ecog.01881
sdmModels-classes 39
sdmModels-classes sdmModels classes
Description
An S4 class to keep all the information of fitted models as well as their evaluations.
Slots
Slots for sdmModels objects:
data a sdmdata object
recordIDs Contains the species data
setting A data.frame containing predictor variables
run.info a data.frame containing info on runs
replicates The names of categorical variables (if any)
models a list contains all fitted objects and relevant information (e.g., evaluation)Slots for sdmEvaluate objects:
observed a numeric vector of observed values
predicted a numeric vector of predicted values
statistics a list of threshold-independent statistics
threshold_based a data.frame of threshold-based statisticsSlots for sdmFormula objects:
formula input formula
vars character, name of variables
model.terms the formula terms used in model fitting
data.terms the formula terms used to manipulate data
Author(s)
Babak Naimi
http://r-gis.net
http://biogeoinformatics.org
40 sdmSetting
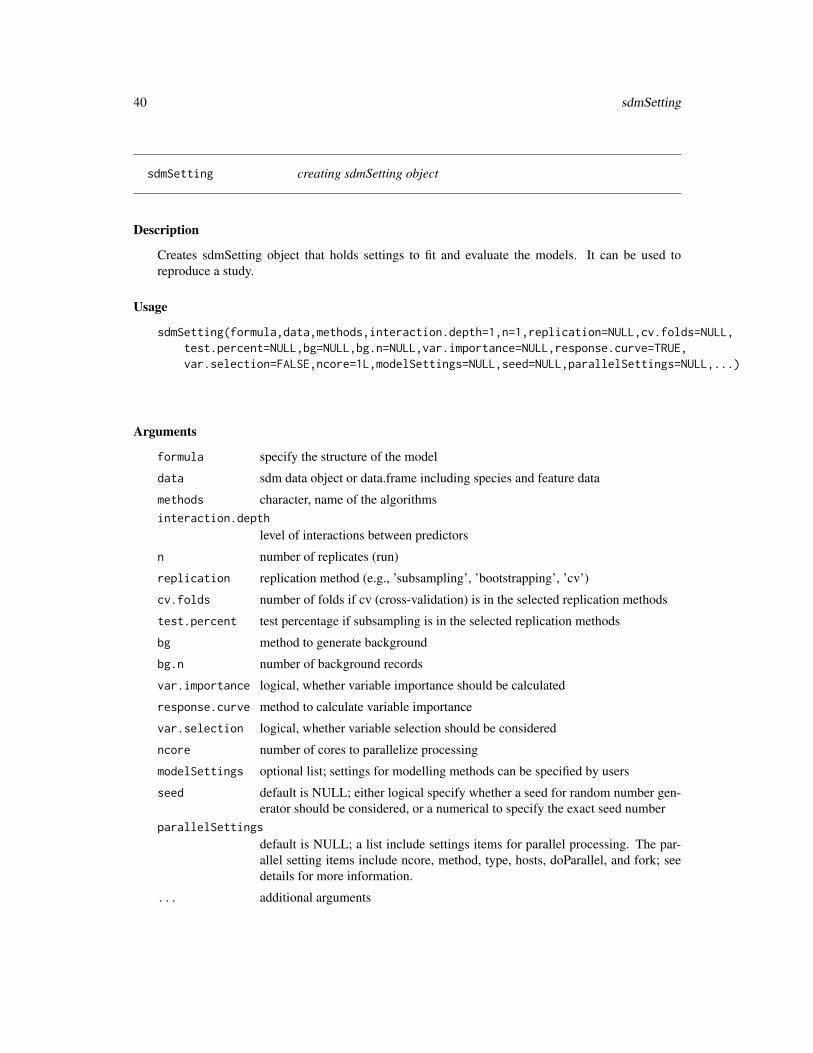
sdmSetting creating sdmSetting object
Description
Creates sdmSetting object that holds settings to fit and evaluate the models. It can be used toreproduce a study.
Usage
sdmSetting(formula,data,methods,interaction.depth=1,n=1,replication=NULL,cv.folds=NULL,test.percent=NULL,bg=NULL,bg.n=NULL,var.importance=NULL,response.curve=TRUE,var.selection=FALSE,ncore=1L,modelSettings=NULL,seed=NULL,parallelSettings=NULL,...)
Arguments
formula specify the structure of the model
data sdm data object or data.frame including species and feature data
methods character, name of the algorithmsinteraction.depth
level of interactions between predictors
n number of replicates (run)
replication replication method (e.g., ’subsampling’, ’bootstrapping’, ’cv’)
cv.folds number of folds if cv (cross-validation) is in the selected replication methods
test.percent test percentage if subsampling is in the selected replication methods
bg method to generate background
bg.n number of background records
var.importance logical, whether variable importance should be calculated
response.curve method to calculate variable importance
var.selection logical, whether variable selection should be considered
ncore number of cores to parallelize processing
modelSettings optional list; settings for modelling methods can be specified by users
seed default is NULL; either logical specify whether a seed for random number gen-erator should be considered, or a numerical to specify the exact seed number
parallelSettings
default is NULL; a list include settings items for parallel processing. The par-allel setting items include ncore, method, type, hosts, doParallel, and fork; seedetails for more information.
... additional arguments

sdmSetting 41
Details
using sdmSetting, the feature types, interaction.depth and all settings of the model can be defined.This function generate a sdmSetting object that can be specifically helpful for reproducibility. Theobject can be shared by a user that may be used for other studies.
If a user aims to reproduce the same results for every time the code is running with the same data andsettings, a seed number should be specified. Through the seed argument, a user can specify NULL,means a seed should not be set (if a random sampling is incorporated in the modelling procedure,for different runs the results would be different); TRUE, means a seed should be set (the seed numberis randomly selected and used everytime the same setting is incorporated); a number, means theseed will be set to the number specified by the user.
For parallel processing, a list of items can be passed to parallelSettings, include:
ncore: defines the number of cores (it can also be specified outside of this list, but will be removedin future)
method: defines the platform/set of functions to run the parallelisation. Currently, two options of’parallel’, and ’foreach’ is implemented. default is ’parallel’
doParallel: Optional, definition to register for a backend for parallel processing (currently whenmethod=’foreach’). It should be provided as an R expression.
cluster: Optional, if a cluster is already created and started, it can be introduced through this itemto be used as the parallel processing platform (currently when method=’parallel’)
hosts: A list of addresses for the accessible hosts (remote clusters) to be registered and used inparallel processing (may not work appropriately as it is still under development!)
fork: Logical, Available for non-windows operating system and specifies whether a fork solutionshould be used for the parallelisation. Default is TRUE.
Value
an object of class sdmSettings
Author(s)
Babak Naimi <[email protected]>
http://r-gis.net
http://biogeoinformatics.org
References
Naimi, B., Araujo, M.B. (2016) sdm: a reproducible and extensible R platform for species distribu-tion modelling, Ecography, DOI: 10.1111/ecog.01881
Examples
## Not run:file <- system.file("external/pa_df.csv", package="sdm")
df <- read.csv(file)

42 subset
head(df)
d <- sdmData(sp~b15+NDVI,train=df)
# generate sdmSettings object:s <- sdmSetting(sp~., methods=c('glm','gam','brt','svm','rf'),
replication='sub',test.percent=30,n=10,modelSettings=list(brt=list(n.trees=500)))
s
## End(Not run)
subset Subset models in a sdmModels object
Description
This function extracts a subset of models from a sdmModels object. In generates a new object ofthe same typeas the origical object. In sdmModels, modelID provides the unique IDs.
Instead of using the subset function, double brackes ’[[ ]]’ can be used.
Details
#
Value
sdmModels object
Methods
subset(x, subset, drop=TRUE, ...)
x[[i,...]]
Arguments:x - sdmModels objecti- integer. Indicates the index/id of the models (modelID) should be extracted from sdmMod-els objectsubset - Same as idrop - If TRUE, new modelIDs are generated, otherwise, the original modelIDs are kept in thenew object.... - additional arguments (not impplemented yet!)

subset 43
Author(s)
Babak Naimi <[email protected]>
http://r-gis.net
http://biogeoinformatics.org
References
Naimi, B., Araujo, M.B. (2016) sdm: a reproducible and extensible R platform for species distribu-tion modelling, Ecography, DOI: 10.1111/ecog.01881
Examples
## Not run:file <- system.file("external/model.sdm", package="sdm")
m <- read.sdm(file)
m
getModelInfo(m)
m1 <- m[[3:4]]
m1
getModelInfo(m1)
m2 <- m[[3:4,drop=FALSE]]
m2
getModelInfo(m2)
#---- the following is the same as previous:
m2 <- subset(m,3:4,drop=FALSE)
m2
getModelInfo(m2)
## End(Not run)

Index
∗Topic classessdmModels-classes, 39
∗Topic methodsas.data.frame, 5Extract by index, 14
∗Topic spatial,databoxplot, 6density, 9getVarImp, 17
∗Topic spatial,species,data, nicheniche, 22
∗Topic spatial,species,dataadd, 2calibration, 7ensemble, 10evaluates, 12featuresFrame-class, 15get models’ outputs, 16predict, 24rcurve, 26roc, 29sdmData, 34sdmdata-class, 38sdmSetting, 40
∗Topic spatial,species,sdm, modelArith-methods, 4sdm, 31
∗Topic spatialas.data.frame, 5coordinates, 8Extract by index, 14gui, 18names, 20sdmModels-classes, 39subset, 42
∗Topic utilities, datainstallAll, 19
∗Topic write, write sdmread.sdm, 28
+,sdmModels,sdmModels-method(Arith-methods), 4
[,sdmdata,ANY,ANY-method (Extract byindex), 14
[,sdmdata,missing,missing-method(Extract by index), 14
[[,sdmModels,ANY,ANY-method (subset), 42
add, 2, 31add,list,character-method (add), 2Arith-methods, 4as.data.frame, 5as.data.frame,sdmdata-method
(as.data.frame), 5
boxplot, 6, 6boxplot,sdmEvaluate-method (boxplot), 6
calibration, 7calibration,sdmEvaluate,missing-method
(calibration), 7calibration,vector,vector-method
(calibration), 7characterORmissing-class
(sdmModels-classes), 39characterORnull-class
(sdmModels-classes), 39coordinates, 8coordinates,sdmdata-method
(coordinates), 8coordinates,sdmModels-method
(coordinates), 8coordinates<- (coordinates), 8coordinates<-,sdmdata-method
(coordinates), 8CRSorNULL-class (sdmModels-classes), 39
data.frameORnull-class(sdmModels-classes), 39
density, 9
44

INDEX 45
density,sdmEvaluate-method (density), 9
ensemble, 10ensemble,sdmModels,data.frame-method
(ensemble), 10ensemble,sdmModels,Raster-method
(ensemble), 10ensemble,sdmModels-method (ensemble), 10environmentORnull-class
(sdmModels-classes), 39evaluates, 12evaluates,vector,vector-method
(evaluates), 12expressionORnull-class
(sdmModels-classes), 39Extract by index, 14
featuresFrame-class, 15formulaORnull-class
(sdmModels-classes), 39functionORcharacter-class
(sdmModels-classes), 39functionORnull-class
(sdmModels-classes), 39
get models’ outputs, 16getEvaluation (evaluates), 12getEvaluation,sdmModels-method
(evaluates), 12getmethod (add), 2getmethod,character-method (add), 2getmethodNames (add), 2getmethodNames,ANY-method (add), 2getModelId (get models’ outputs), 16getModelId,sdmModels-method (get
models’ outputs), 16getModelInfo (get models’ outputs), 16getModelInfo,sdmModels-method (get
models’ outputs), 16getResponseCurve (rcurve), 26getResponseCurve,sdmModels-method
(rcurve), 26getRoc (roc), 29getRoc,sdmModels,ANY-method (roc), 29getRoc,vector,vector-method (roc), 29getVarImp, 17getVarImp,sdmModels-method (getVarImp),
17gui, 18
gui,sdmModels-method (gui), 18
install.packages, 20installAll, 19, 31installAll,ANY-method (installAll), 19
listORcharacter-class(sdmModels-classes), 39
listORnull-class (sdmModels-classes), 39
matrixORnull-class (sdmModels-classes),39
names, 20names,sdmdata-method (names), 20names<- (names), 20names<-,sdmdata-method (names), 20niche, 22niche,RasterStackBrick,RasterLayer-method
(niche), 22niche,RasterStackBrick,sdmdata-method
(niche), 22niche,RasterStackBrick,SpatialPoints-method
(niche), 22niche,sdmdata,ANY-method (niche), 22numericORnull-class
(sdmModels-classes), 39
plot,.nicheRaster-method (niche), 22plot,.responseCurve-method (rcurve), 26predict, 24predict,.maxlikeModel-method (predict),
24predict,sdmModels-method (predict), 24
rcurve, 26rcurve,.responseCurve-method (rcurve),
26rcurve,sdmModels-method (rcurve), 26read.sdm, 28read.sdm,character-method (read.sdm), 28readRDS, 28roc, 29roc,sdmModels,ANY-method (roc), 29roc,sdmModels-method (roc), 29roc,vector,vector-method (roc), 29
saveRDS, 28sdm, 16, 31

46 INDEX
sdm,ANY,sdmdata,.sdmCorSetting-method(sdm), 31
sdm,ANY,sdmdata,character-method (sdm),31
sdm,sdmdata,.sdmCorSetting,ANY-method(sdm), 31
sdmCorrelativeMethod-class, 33sdmData, 31, 34sdmData,ANY,data.frame,ANY,missing-method
(sdmData), 34sdmData,ANY,data.frame,missing,missing-method
(sdmData), 34sdmData,ANY,SpatialPoints,ANY,missing-method
(sdmData), 34sdmData,ANY,SpatialPoints,ANY,Raster-method
(sdmData), 34sdmData,data.frame,formula,ANY,missing-method
(sdmData), 34sdmData,data.frame,missing,ANY,missing-method
(sdmData), 34sdmdata-class, 38sdmEvaluate-class (sdmModels-classes),
39sdmFormula-class (sdmModels-classes), 39sdmModels-class (sdmModels-classes), 39sdmModels-classes, 39sdmSetting, 40sdmSetting,ANY,sdmdata,character-method
(sdmSetting), 40setZ, 25show,sdmdata-method (sdmdata-class), 38show,sdmModels-method
(sdmModels-classes), 39show,sdmSetting-method (sdmSetting), 40subset, 42subset,sdmModels-method (subset), 42
write.sdm (read.sdm), 28write.sdm,.sdmCorSetting,character-method
(read.sdm), 28write.sdm,sdmdata,character-method
(read.sdm), 28write.sdm,sdmModels,character-method
(read.sdm), 28writeRaster, 24