Package ‘polysat’
98
Package ‘polysat’ September 5, 2013 Version 1.3-2 Date 2013-09-03 Title Tools for Polyploid Microsatellite Analysis Author Lindsay V. Clark <[email protected]> Maintainer Lindsay V. Clark <[email protected]> Depends combinat, methods Suggests ade4, adegenet Description polysat is a collection of tools to handle microsatellite data of any ploidy (and samples of mixed ploidy) where allele copy number is not known in partially heterozygous genotypes. It can import and export data in ABI GeneMapper, Structure, ATetra, Tetrasat/Tetra, Gen- oDive, SPAGeDi,POPDIST, STRand, and binary presence/absence formats. It can calculate pairwise distances between individuals using a stepwise mutation model or infinite alleles model, with or without taking ploidies and allele frequencies into account. These distances can be used for the calculation of clonal diversity statistics or used for further analysis in R. Allelic diversity statistics are also available. polysat can assist the user in estimating the ploidy of samples, and lastly it can estimate allele frequencies in populations, calculate pairwise Fst values based on those frequencies, and export allele frequencies to SPAGeDi and adegenet. License GPL-2 URL http://openwetware.org/wiki/Polysat R topics documented: Accessors .......................................... 3 alleleDiversity ........................................ 7 assignClones ........................................ 8 Bruvo.distance ....................................... 10 1
Transcript of Package ‘polysat’

Package ‘polysat’September 5, 2013
Version 1.3-2
Date 2013-09-03
Title Tools for Polyploid Microsatellite Analysis
Author Lindsay V. Clark <[email protected]>
Maintainer Lindsay V. Clark <[email protected]>
Depends combinat, methods
Suggests ade4, adegenet
Description polysat is a collection of tools to handle microsatellite data ofany ploidy (and samples of mixed ploidy) where allele copy number is notknown in partially heterozygous genotypes. It can import and export data inABI GeneMapper, Structure, ATetra, Tetrasat/Tetra, Gen-oDive, SPAGeDi,POPDIST, STRand, and binary presence/absence formats. It can calculatepairwise distances between individuals using a stepwise mutation model orinfinite alleles model, with or without taking ploidies and allele frequenciesinto account. These distances can be used for the calculation of clonaldiversity statistics or used for further analysis in R. Allelic diversitystatistics are also available. polysat can assist the user in estimating theploidy of samples, and lastly it can estimate allele frequencies inpopulations, calculate pairwise Fst values based on those frequencies, andexport allele frequencies to SPAGeDi and adegenet.
License GPL-2
URL http://openwetware.org/wiki/Polysat
R topics documented:Accessors . . . . . . . . . . . . . . . . . . . . . . . . . . . . . . . . . . . . . . . . . . 3alleleDiversity . . . . . . . . . . . . . . . . . . . . . . . . . . . . . . . . . . . . . . . . 7assignClones . . . . . . . . . . . . . . . . . . . . . . . . . . . . . . . . . . . . . . . . 8Bruvo.distance . . . . . . . . . . . . . . . . . . . . . . . . . . . . . . . . . . . . . . . 10
1
2 R topics documented:
Bruvo2.distance . . . . . . . . . . . . . . . . . . . . . . . . . . . . . . . . . . . . . . . 12calcFst . . . . . . . . . . . . . . . . . . . . . . . . . . . . . . . . . . . . . . . . . . . . 14deleteSamples . . . . . . . . . . . . . . . . . . . . . . . . . . . . . . . . . . . . . . . . 15deSilvaFreq . . . . . . . . . . . . . . . . . . . . . . . . . . . . . . . . . . . . . . . . . 17editGenotypes . . . . . . . . . . . . . . . . . . . . . . . . . . . . . . . . . . . . . . . . 20estimatePloidy . . . . . . . . . . . . . . . . . . . . . . . . . . . . . . . . . . . . . . . . 21FCRinfo . . . . . . . . . . . . . . . . . . . . . . . . . . . . . . . . . . . . . . . . . . . 23find.missing.gen . . . . . . . . . . . . . . . . . . . . . . . . . . . . . . . . . . . . . . . 24freq.to.genpop . . . . . . . . . . . . . . . . . . . . . . . . . . . . . . . . . . . . . . . . 25genambig-class . . . . . . . . . . . . . . . . . . . . . . . . . . . . . . . . . . . . . . . 26genambig.to.genbinary . . . . . . . . . . . . . . . . . . . . . . . . . . . . . . . . . . . 29genbinary-class . . . . . . . . . . . . . . . . . . . . . . . . . . . . . . . . . . . . . . . 31gendata-class . . . . . . . . . . . . . . . . . . . . . . . . . . . . . . . . . . . . . . . . 34gendata.to.genind . . . . . . . . . . . . . . . . . . . . . . . . . . . . . . . . . . . . . . 37genotypeDiversity . . . . . . . . . . . . . . . . . . . . . . . . . . . . . . . . . . . . . . 39genotypeProbs . . . . . . . . . . . . . . . . . . . . . . . . . . . . . . . . . . . . . . . . 41Internal Functions . . . . . . . . . . . . . . . . . . . . . . . . . . . . . . . . . . . . . . 43isMissing . . . . . . . . . . . . . . . . . . . . . . . . . . . . . . . . . . . . . . . . . . 45Lynch.distance . . . . . . . . . . . . . . . . . . . . . . . . . . . . . . . . . . . . . . . 47meandist.from.array . . . . . . . . . . . . . . . . . . . . . . . . . . . . . . . . . . . . . 48meandistance.matrix . . . . . . . . . . . . . . . . . . . . . . . . . . . . . . . . . . . . 50merge-methods . . . . . . . . . . . . . . . . . . . . . . . . . . . . . . . . . . . . . . . 52pld . . . . . . . . . . . . . . . . . . . . . . . . . . . . . . . . . . . . . . . . . . . . . . 54ploidysuper-class . . . . . . . . . . . . . . . . . . . . . . . . . . . . . . . . . . . . . . 55read.ATetra . . . . . . . . . . . . . . . . . . . . . . . . . . . . . . . . . . . . . . . . . 56read.GeneMapper . . . . . . . . . . . . . . . . . . . . . . . . . . . . . . . . . . . . . . 58read.GenoDive . . . . . . . . . . . . . . . . . . . . . . . . . . . . . . . . . . . . . . . 60read.POPDIST . . . . . . . . . . . . . . . . . . . . . . . . . . . . . . . . . . . . . . . 61read.SPAGeDi . . . . . . . . . . . . . . . . . . . . . . . . . . . . . . . . . . . . . . . . 63read.STRand . . . . . . . . . . . . . . . . . . . . . . . . . . . . . . . . . . . . . . . . 65read.Structure . . . . . . . . . . . . . . . . . . . . . . . . . . . . . . . . . . . . . . . . 67read.Tetrasat . . . . . . . . . . . . . . . . . . . . . . . . . . . . . . . . . . . . . . . . . 69reformatPloidies . . . . . . . . . . . . . . . . . . . . . . . . . . . . . . . . . . . . . . . 71simgen . . . . . . . . . . . . . . . . . . . . . . . . . . . . . . . . . . . . . . . . . . . . 73simpleFreq . . . . . . . . . . . . . . . . . . . . . . . . . . . . . . . . . . . . . . . . . 74testgenotypes . . . . . . . . . . . . . . . . . . . . . . . . . . . . . . . . . . . . . . . . 76viewGenotypes . . . . . . . . . . . . . . . . . . . . . . . . . . . . . . . . . . . . . . . 76write.ATetra . . . . . . . . . . . . . . . . . . . . . . . . . . . . . . . . . . . . . . . . . 77write.freq.SPAGeDi . . . . . . . . . . . . . . . . . . . . . . . . . . . . . . . . . . . . . 79write.GeneMapper . . . . . . . . . . . . . . . . . . . . . . . . . . . . . . . . . . . . . 81write.GenoDive . . . . . . . . . . . . . . . . . . . . . . . . . . . . . . . . . . . . . . . 83write.POPDIST . . . . . . . . . . . . . . . . . . . . . . . . . . . . . . . . . . . . . . . 85write.SPAGeDi . . . . . . . . . . . . . . . . . . . . . . . . . . . . . . . . . . . . . . . 87write.Structure . . . . . . . . . . . . . . . . . . . . . . . . . . . . . . . . . . . . . . . 89write.Tetrasat . . . . . . . . . . . . . . . . . . . . . . . . . . . . . . . . . . . . . . . . 92
Index 94

Accessors 3
Accessors Accessor and Replacement Functions for "gendata" Objects
Description
The accessor functions return information that is contained, either directly or indirectly, in theslots of a gendata object. The replacement functions alter information in one or more slots asappropriate.
Usage
Samples(object, populations, ploidies)Samples(object) <- valueLoci(object, usatnts, ploidies)Loci(object) <- valuePopInfo(object)PopInfo(object) <- valuePopNames(object)PopNames(object) <- valuePopNum(object, popname)PopNum(object, popname) <- valuePloidies(object, samples, loci)Ploidies(object) <- valueUsatnts(object)Usatnts(object) <- valueDescription(object)Description(object) <- valueMissing(object)Missing(object) <- valuePresent(object)Present(object) <- valueAbsent(object)Absent(object) <- valueGenotype(object, sample, locus)Genotype(object, sample, locus) <- valueGenotypes(object, samples = Samples(object), loci = Loci(object))Genotypes(object, samples = Samples(object), loci = Loci(object)) <- value
Arguments
object An object of the class gendata or one of its subclasses.
populations A character or numeric vector indicating from which populations to return sam-ples. (optional)
ploidies A numeric vector indicating ploidies, if only samples or loci with a certainploidy should be returned. (optional)
4 Accessors
sample A character string or number indicating the name or number of the sample whosegenotype should be returned.
locus A character string or number indicating the name or number of the locus whosegenotype should be returned.
samples A character or numeric vector indicating samples for which to return genotypesor ploidies. (optional)
loci A character or numeric vector indicating loci for which to return genotypes orploidies. (optional)
usatnts A numeric vector indicating microsatellite repeat lengths, where only loci ofthose repeat lengths should be returned. (optional)
popname Chacter string or vector. The name(s) of the population(s) for which to retrieveor replace the corresponding PopInfo number(s). The replacement functionshould only be used for one population at a time.
value • For Samples: a character vector of sample names.• For Loci: a character vector of locus names.• For PopInfo: A numeric vector (integer or can be coerced to integer) indi-
cating the population identities of samples.• For PopNames: A character vector indicating the names of populations.• For PopNum: A number (integer or can be coerced to integer) that should be
the new population number associated with popname.• For Ploidies: A numeric vector or matrix (integer or can be coerced to
integer) indicating the ploidy of each sample, locus, and/or the dataset. SeereformatPloidies and "ploidysuper".
• For Usatnts: A numeric vector (integer or can be coerced to integer) in-dicating the repeat type of each microsatellite locus. Dinucleotide repeatsshould be represented with 2, trinucleotide repeat with 3, and so on. If thealleles for a given locus are already stored in terms of repeat number ratherthan fragment length in nucleotides, the Usatnts value for that locus shouldbe 1.
• For Description: A character string or character vector describing thedataset.
• For Missing: A symbol (usually an integer) to be used to indicate missingdata.
• For Present: A symbol (usually an integer) to be used to indicate the pres-ence of an allele.
• For Absent: A symbol (usually an integer) to be used to indicate the ab-sence of an allele.
• For Genotype: a vector of alleles, if the object is of class genambig.• For Genotypes: A list of vectors (genotypes), of the same dimensionality asc(length(samples), length(loci)), if the object is of class genambig.If the object is of class genbinary, value should be a matrix, with columnnames of the form "locus.allele". See Genotypes<-,genbinary-methodfor more information.

Accessors 5
Details
Samples<- and Loci<- can only be used to change sample and locus names, not to add or removesamples and loci from the dataset.
For slots that require integer values, numerical values used in replacement functions will be coercedto integers. The replacement functions also ensure that all slots remain properly indexed.
The Missing<- function finds any genotypes with the old missing data symbol and changes themto the new missing data symbol, then assigns the new symbol to the slot that indicates what themissing data symbol is. Present<- and Absent<- work similarly for the genbinary class.
The Genotype access and replacement functions deal with individual genotypes, which are vec-tors in the genambig class. The Genotypes access and replacement functions deal with lists ofgenotypes.
The PopInfo<- replacement function also adds elements to PopNames(object) if necessary inorder to have names for all of the populations. These will be of the form "Pop" followed by thepopulation number, and can be later edited using PopNames<-.
The PopNum<- replacement function first finds all samples in the population popname, and replacesthe number in PopInfo(object) for those samples with value. It then inserts NA into the originalPopNames slot that contained popname, and inserts popname into PopNames(object)[value]. Ifthis results in two populations being merged into one, a message is printed to the console.
Value
PopInfo, PopNames, Missing, Description, Usatnts, Ploidies and Genotypes simply returnthe contents of the slots of the same names (or in the case of Ploidies, object@Ploidies@pld isreturned). Samples and Loci return character vectors taken from the names of other slots (PopInfoand Usatnts, respectively; the initialization and replacement methods ensure that these slots arealways named according to samples and loci). PopNum returns an integer vector indicating thepopulation number(s) of the population(s) named in popname. Genotype returns a single genotypefor a given sample and locus, which is a vector whose exact form will depend on the class of object.
Author(s)
Lindsay V. Clark
See Also
deleteSamples, deleteLoci, viewGenotypes, editGenotypes, isMissing, estimatePloidy,merge,gendata,gendata-method, gendata
Examples
# create a new genambig (subclass of gendata) object to manipulatemygen <- new("genambig", samples=c("a", "b", "c"), loci=c("locG","locH"))
# retrieve the sample and locus namesSamples(mygen)Loci(mygen)

6 Accessors
# change some of the sample and locus namesLoci(mygen) <- c("lG", "lH")Samples(mygen)[2] <- "b1"
# describe the datasetDescription(mygen) <- "Example dataset for documentation."
# name some populations and assign samples to themPopNames(mygen) <- c("PopL", "PopK")PopInfo(mygen) <- c(1,1,2)# now we can retrieve samples by populationSamples(mygen, populations="PopL")# we can also adjust the numbers if we want to make them# match another datasetPopNum(mygen, "PopK") <- 3PopNames(mygen)PopInfo(mygen)# change the population identity of just one samplePopInfo(mygen)["b1"] <- 3
# indicate that both loci are dinucleotide repeatsUsatnts(mygen) <- c(2,2)
# indicate that all samples are tetraploidPloidies(mygen) <- 4# orPloidies(mygen) <- rep(4, times = length(Samples(mygen)) * length(Loci(mygen)))# actually, one sample is triploidPloidies(mygen)["c",] <- 3# view ploidiesPloidies(mygen)
# view the genotype array as it currently is: filled with missing# valuesGenotypes(mygen)# fill in the genotypesGenotypes(mygen, loci="lG") <- list(c(120, 124, 130, 136), c(122, 120),
c(128, 130, 134))Genotypes(mygen, loci="lH") <- list(c(200, 202, 210), c(206, 208, 210,
214),c(208))
# genotypes can also be edited or retrieved by sampleGenotypes(mygen, samples="a")# fix a single genotypeGenotype(mygen, "a", "lH") <- c(200, 204, 210)# retrieve a single genotypeGenotype(mygen, "c", "lG")
# change a genotype to being missingGenotype(mygen, "c", "lH") <- Missing(mygen)# show the current missing data symbolMissing(mygen)# an example of genotypes where one contains the missing data symbol

alleleDiversity 7
Genotypes(mygen, samples="c")# change the missing data symbolMissing(mygen) <- as.integer(-1)# now look at the genotypesGenotypes(mygen, samples="c")
alleleDiversity Retrieve and Count Unique Alleles
Description
alleleDiversity returns the number of unique alleles and/or a list of vectors of all unique alleles,indexed by locus and population.
Usage
alleleDiversity(genobject, samples = Samples(genobject),loci = Loci(genobject), alleles = TRUE, counts = TRUE)
Arguments
genobject An object of the class "genambig".
samples Optional. A character or numeric vector indicating samples to include in theanalysis.
loci Optional. A character or numeric vector indicating loci to include in the analy-sis.
alleles Boolean, indicating whether or not to return the alleles themselves.
counts Boolean, indicating whether or not to return the number of unique alleles.
Value
Under default settings, a list is returned:
alleles A two dimensional list. The first dimension is indexed by population, with theadditional element “overall” representing the entire dataset. The second dimen-sion is indexed by locus. Each element of the list is a vector, containing allunique alleles found for that population and locus. Missing(genobject) is notcounted as an allele.
counts A matrix, indexed in the same way as alleles. Each element of the matrix isan integer indicating how many alleles were found at that population and locus.
If the argument alleles or counts is set to FALSE, then only one of the above list elements isreturned.
Author(s)
Lindsay V. Clark

8 assignClones
See Also
genotypeDiversity
Examples
# generate a dataset for this examplemygen <- new("genambig", samples=c("a","b","c","d"), loci=c("E","F"))PopInfo(mygen) <- c(1,1,2,2)Genotypes(mygen, loci="E") <- list(c(122,132),c(122,124,140),
c(124,130,132),c(132,136))Genotypes(mygen, loci="F") <- list(c(97,99,111),c(113,115),
c(99,113),c(111,115))
# look at unique allelesmyal <- alleleDiversity(mygen)myal$countsmyal$allelesmyal$alleles[["Pop1","E"]]myal$alleles[["overall","F"]]
assignClones Group Individuals Based on a Distance Threshold
Description
assignClones uses a distance matrix such as that produced by meandistance.matrix or meandistance.matrix2to place individuals into groups representing asexually-related ramets, or any other grouping basedon a distance threshold.
Usage
assignClones(d, samples = dimnames(d)[[1]], threshold = 0)
Arguments
d A symmetrical, square matrix containing genetic distances between individuals.Both dimensions should be named according to the names of the individuals(samples). A matrix produced by meandistance.matrix or meandistance.matrix2when all.distances = FALSE, or the matrix that is the second item in the listproduced if all.distances = TRUE, will be in the right format. meandist.from.arraywill also produce a matrix in the correct format.
samples A character vector containing the names of samples to analyze. This should beall or a subset of the names of d.
threshold A number indicating the maximum distance between two individuals that willbe placed into the same group.

assignClones 9
Details
This function groups individuals very similarly to the software GenoType (Meirmans and van Tien-deren, 2004). If a distance matrix from polysat is exported to GenoType, the results will be the sameas those from assignClones assuming the same threshold is used. Note that GenoType requiresthat distances be integers rather than decimals, so you will have to multiply the distances producedby polysat by a large number and round them to the nearest integer if you wish to export them toGenotype. When comparing the results of assignClones and GenoType using my own data, theonly differences I have seen have been the result of rounding; a decimal that was slightly above thethreshold in when analyzed in R was rounded down to the threshold when analyzed in GenoType.
The write.table function can be used for exporting the results to GenoDive. See the R documen-tation for information on how to make a tab-delimited file with no header.
Value
A numeric vector, named by samples. Each clone or group is given a number, and the number foreach sample indicates the clone or group to which it belongs.
Author(s)
Lindsay V. Clark
References
Meirmans, P. G. and Van Tienderen, P. H. (2004) GENOTYPE and GENODIVE: two programs forthe analysis of genetic diversity of asexual organisms. Molecular Ecology Notes 4, 792–794.
See Also
genotypeDiversity
Examples
# set up a simple matrix with three samplestest <- matrix(c(0,0,.5,0,0,.5,.5,.5,0), ncol=3, nrow=3)abc <- c("a", "b", "c")dimnames(test) <- list(abc,abc)
# assign clones with a threshold of zero or 0.5assignClones(test)assignClones(test, threshold=0.5)
10 Bruvo.distance
Bruvo.distance Genetic Distance Metric of Bruvo et al.
Description
This function calculates the distance between two individuals at one microsatellite locus using amethod based on that of Bruvo et al. (2004).
Usage
Bruvo.distance(genotype1, genotype2, maxl=9, usatnt=2, missing=-9)
Arguments
genotype1 A vector of alleles for one individual at one locus. Allele length is in nucleotidesor repeat count. Each unique allele corresponds to one element in the vector, andthe vector is no longer than it needs to be to contain all unique alleles for thisindividual at this locus.
genotype2 A vector of alleles for another individual at the same locus.
maxl If both individuals have more than this number of alleles at this locus, NA isreturned instead of a numerical distance.
usatnt Length of the repeat at this locus. For example usatnt=2 for dinucleotide re-peats, and usatnt=3 for trinucleotide repeats. If the alleles in genotype1 andgenotype2 are expressed in repeat count instead of nucleotides, set usatnt=1.
missing A numerical value that, when in the first allele position, indicates missing data.NA is returned if this value is found in either genotype.
Details
Since allele copy number is frequently unknown in polyploid microsatellite data, Bruvo et al. de-veloped a measure of genetic distance similar to band-sharing indices used with dominant data, buttaking into account mutational distances between alleles. A matrix is created containing all differ-ences in repeat count between the alleles of two individuals at one locus. These differences are thengeometrically transformed to reflect the probabilities of mutation from one allele to another. Thematrix is then searched to find the minimum sum if each allele from one individual is paired to oneallele from the other individual. This sum is divided by the number of alleles per individual.
If one genotype has more alleles than the other, ‘virtual alleles’ must be created so that bothgenotypes are the same length. There are three options for the value of these virtual alleles, butBruvo.distance only implements the simplest one, assuming that it is not known whether differ-ences in ploidy arose from genome addition or genome loss. Virtual alleles are set to infinity, suchthat the geometric distance between any allele and a virtual allele is 1.
In the original publication by Bruvo et al. (2004), ambiguous genotypes were dealt with by calcu-lating the distance for all possible unambiguous genotype combinations and averaging across all ofthem equally. When Bruvo.distance is called from meandistance.matrix, ploidy is unknownand all genotypes are simply treated as if they had one copy of each allele. When Bruvo.distance
Bruvo.distance 11
is called from meandistance.matrix2, the analysis is truer to the original, in that ploidy is knownand all possible unambiguous genotype combinations are considered. However, instead of all possi-ble unambiguous genotypes being weighted equally, in meandistance.matrix2 they are weightedbased on allele frequencies and selfing rate, since some unambiguous genotypes are more likelythan others.
Value
A number ranging from 0 to 1, with 0 indicating identical genotypes, and 1 being a theoreticalmaximum distance if all alleles from genotype1 differed by an infinite number of repeats fromall alleles in genotype2. NA is returned if both genotypes have more than maxl alleles or if eithergenotype has the symbol for missing data as its first allele.
Note
The processing time is a function of the factorial of the number of alleles, since each possiblecombination of allele pairs must be evaluated. For genotypes with a sufficiently large number ofalleles, it may be more efficient to estimate distances manually by creating the matrix in Exceland visually picking out the shortest distances between alleles. This is the purpose of the maxlargument. On my personal computer, if both genotypes had more than nine alleles, the calculationcould take an hour or more, and so this is the default limit. In this case, Bruvo.distance returnsNA.
Author(s)
Lindsay V. Clark
References
Bruvo, R., Michiels, N. K., D’Sousa, T. G., and Schulenberg, H. (2004) A simple method forcalculation of microsatellite genotypes irrespective of ploidy level. Molecular Ecology 13, 2101-2106.
See Also
meandistance.matrix, Lynch.distance, Bruvo2.distance
Examples
Bruvo.distance(c(202,206,210,220),c(204,206,216,222))Bruvo.distance(c(202,206,210,220),c(204,206,216,222),usatnt=4)Bruvo.distance(c(202,206,210,220),c(204,206,222))Bruvo.distance(c(202,206,210,220),c(204,206,216,222),maxl=3)Bruvo.distance(c(202,206,210,220),c(-9))

12 Bruvo2.distance
Bruvo2.distance Distance Measure of Bruvo et al. under Genome Loss and Addition
Description
This is an inter-individual distance measure similar to Bruvo.distance, except that where geno-types have different numbers of alleles, virtual alleles are equal to those from the longer and/orshorter genotype, rather than being equal to infinity.
Usage
Bruvo2.distance(genotype1, genotype2, maxl = 7, usatnt = 2,missing = -9, add = TRUE, loss = TRUE)
Arguments
genotype1 A numeric vector representing the genotype of one individual at one locus. Thistype of vector is produced by the Genotype method for "genambig" objects.
genotype2 The second genotype for the distance calculation, in the same format as genotype1.maxl The maximum number of alleles that either genotype can have. If it is exceeded,
NA is returned. This argument exists to prevent computations that would take inexcess of an hour; see Bruvo.distance.
usatnt The microsatellite repeat type for the locus. 2 for dinucleotide repeats, 3 fordinucleotide repeats, 1 if the alleles are already coded as repeat numbers, etc.See Usatnts.
missing The symbol that indicates missing data for a given sample and locus. SeeMissing.
add TRUE if the model of genome addition is being used, and FALSE if it is not. Ifthis model is used, the shorter genotype will have virtual alleles added from thesame genotype.
loss TRUE if the model of genome loss is being used, and FALSE if it is not. If thismodel is used, the shorter genotype will have virtual alleles added from thelonger genotype.
Details
Bruvo et al. (2004) describe multiple methods for calculating genetic distances between indi-viduals of different ploidy. (See “Special cases” starting on page 2102 of the paper.) The orig-inal Bruvo.distance function in polysat uses the method described for systems with complexchanges in ploidy, adding virtual alleles equal to infinity to the shorter genotype to make it thesame length as the longer genotype. This method, however, can exaggerate distances between in-dividuals of different ploidy, particularly when used with meandistance.matrix2 as opposed tomeandistance.matrix.
Bruvo2.distance calculates distances between individuals under the models of genome additionand genome loss. If add = TRUE and loss = TRUE, the distance produced is equal to that ofequation 6 in the paper.
Bruvo2.distance 13
If add = TRUE and loss = FALSE, the distance calculated is that under genome addition only.Likewise if add = FALSE and loss = TRUE the distance is calculated under genome loss only. Thelatter distance should be greater than the former. If both were averaged together, they would givethe identical result to that produced when add = TRUE and loss = TRUE. All three distances willbe less than that produced by Bruvo.distance.
If both genotypes have the same number of alleles, they are passed to Bruvo.distance for thecalculation. This also happens if add = FALSE and loss = FALSE. Otherwise, if the genotypeshave different numbers of alleles, all possible genotypes with virtual alleles are enumerated andpassed to Bruvo.distance one by one, and the results averaged.
The number of different genotypes simulated under genome loss or genome addition is ld, where lis the length of the genotype from which virtual alleles are being taken, and d is the difference inlength between the longer and shorter genotype. For example, under genome addition for a diploidindividual with alleles 1 and 2 being compared to a tetraploid individual, the genotypes 1211, 1212,1221, and 1222 will each be used once to represent the diploid individual.
Value
A decimal between 0 and 1, with 0 indicating complete identity of two genotypes, and 1 indicatingmaximum dissimilarity. NA is returned if one or both genotypes are missing or if maxl is exceeded.
Note
Figure 1B and 1C of Bruvo et al. (2004) illustrate an example of this distance measure. To performthe identical calculation to that listed directly under equation 6, you would type:
Bruvo2.distance(c(20,23,24), c(20,24,26,43), usatnt=1)
However, you will notice that the result, 0.401, is slightly different from that given in the paper.This is due to an error in the paper. For the distance under genome loss when the virtual allele is26, the result should be 1 instead of 1.75.
Author(s)
Lindsay V. Clark
References
Bruvo, R., Michiels, N. K., D’Sousa, T. G., and Schulenberg, H. (2004) A simple method forcalculation of microsatellite genotypes irrespective of ploidy level. Molecular Ecology 13, 2101–2106.
See Also
Lynch.distance, Bruvo.distance, meandistance.matrix2
Examples
Bruvo2.distance(c(102,104), c(104,104,106,110))Bruvo2.distance(c(102,104), c(104,104,106,110), add = FALSE)Bruvo2.distance(c(102,104), c(104,104,106,110), loss = FALSE)
14 calcFst
calcFst Calculate Wright’s Pairwise FST
Description
Given a data frame of allele frequencies and population sizes, calcFst calculates a matrix of pair-wise Fst values.
Usage
calcFst(freqs, pops = row.names(freqs), loci = unique(as.matrix(as.data.frame(strsplit(names(freqs), split = ".", fixed = TRUE),stringsAsFactors = FALSE))[1, ]))
Arguments
freqs A data frame of allele frequencies and population sizes such as that producedby simpleFreq or deSilvaFreq. Each population is in one row, and a columncalled Genomes (or multiple columns containing the locus names and “Genomes”seperated by a period) contains the relative size of each population. All othercolumns contain allele frequencies. The names of these columns are the locusname and allele name, separated by a period.
pops A character vector. Populations to analyze, which should be a subset of row.names(freqs).
loci A character vector indicating which loci to analyze. These should be a subset ofthe locus names as used in the column names of freqs.
Details
calcFst works by calculating HS and HT for each locus for each pair of populations, then averagingHS and HT across loci. FST is then calculated for each pair of populations as (HT-HS)/HT.
H values (expected heterozygosities for populations and combined populations) are calculated asone minus the sum of all squared allele frequencies at a locus. To calculte HT, allele frequenciesbetween two populations are averaged before the calculation. To calculate HS, H values are aver-aged after the calculation. In both cases, the averages are weighted by the relative sizes of the twopopulations (as indicated by freqs$Genomes).
Value
A square matrix containing FST values. The rows and columns of the matrix are both named bypopulation.
Author(s)
Lindsay V. Clark

deleteSamples 15
References
Nei, M. (1973) Analysis of gene diversity in subdivided populations. Proceedings of the NationalAcademy of Sciences of the United States of America 70, 3321–3323.
See Also
simpleFreq, deSilvaFreq
Examples
# create a data set (typically done by reading files)mygenotypes <- new("genambig", samples = paste("ind", 1:6, sep=""),
loci = c("loc1", "loc2"))Genotypes(mygenotypes, loci = "loc1") <- list(c(206), c(208,210),
c(204,206,210),c(196,198,202,208), c(196,200), c(198,200,202,204))
Genotypes(mygenotypes, loci = "loc2") <- list(c(130,134), c(138,140),c(130,136,140),
c(138), c(136,140), c(130,132,136))PopInfo(mygenotypes) <- c(1,1,1,2,2,2)mygenotypes <- reformatPloidies(mygenotypes, output="sample")Ploidies(mygenotypes) <- c(2,2,4,4,2,4)
# calculate allele frequenciesmyfreq <- simpleFreq(mygenotypes)
# calculate pairwise FSTmyfst <- calcFst(myfreq)
# examine the resultsmyfst
deleteSamples Remove Samples or Loci from an Object
Description
These functions remove samples or loci from all relevant slots of an object.
Usage
deleteSamples(object, samples)deleteLoci(object, loci)
Arguments
object An object containing the dataset of interest. Generally an object of some sub-class of gendata.
samples A numerical or character vector of samples to be removed.loci A numerical or character vector of loci to be removed.

16 deleteSamples
Details
These are generic functions with methods for genambig, genbinary, and gendata objects. Themethods for the subclasses remove samples or loci from the @Genotypes slot, then pass the objectto the method for gendata, which removes samples or loci from the @PopInfo, @Ploidies, and/or@Usatnts slots, as appropriate. The @PopNames slot is left untouched even if an entire populationis deleted, in order to preserve the connection between the numbers in @PopInfo and the names in@PopNames.
If your intent is to experiment with excluding samples or loci, it may be a better idea to createcharacter vectors of samples and loci that you want to use and then use these vectors as the samplesand loci arguments for analysis or export functions.
Value
An object identical to object, but with the specified samples or loci removed.
Note
These functions are somewhat redundant with the subscripting function "[", which also works forall gendata objects. However, they may be more convenient depending on whether the user prefersto specify the samples and loci to use or to exclude.
Author(s)
Lindsay V. Clark
See Also
Samples, Loci, merge,gendata,gendata-method
Examples
# set up genambig objectmygen <- new("genambig", samples = c("ind1", "ind2", "ind3", "ind4"),
loci = c("locA", "locB", "locC", "locD"))
# delete a sampleSamples(mygen)mygen <- deleteSamples(mygen, "ind1")Samples(mygen)
# delete some lociLoci(mygen)mygen <- deleteLoci(mygen, c("locB", "locC"))Loci(mygen)

deSilvaFreq 17
deSilvaFreq Estimate Allele Frequencies with EM Algorithm
Description
This function uses the method of De Silva et al. (2005) to estimate allele frequencies underpolysomic inheritance with a known selfing rate.
Usage
deSilvaFreq(object, self, samples = Samples(object),loci = Loci(object), initNull = 0.15,initFreq = simpleFreq(object[samples, loci]),tol = 1e-08)
Arguments
object A "genambig" or "genbinary" object containing the dataset of interest. Allploidies for samples and loci should be the same, and this should be an evennumber. PopInfo must also be filled in for samples.
self A number between 1 and 0, indicating the rate of selfing.
samples An optional character vector indicating a subset of samples to use in the calcu-lation.
loci An optional character vector indicating a subset of loci for which to calculateallele frequencies.
initNull A single value or numeric vector indicating initial frequencies to use for the nullallele at each locus.
initFreq A data frame containing allele frequencies (for non-null loci) to use for initial-ization. This needs to be in the same format as the output of simpleFreq with asingle “Genomes” column (similarly to the format of the output of deSilvaFreq).By default, the function will do a quick estimation of allele frequencies usingsimpleFreq and then initialize the EM algorithm at these frequencies.
tol The tolerance level for determining when the results have converged. Where p2and p1 are the current and previous vectors of allele frequencies, respectively,the EM algorithm stops if sum(abs(p2-p1)/(p2+p1)) <= tol.
Details
Most of the SAS code from the supplementary material of De Silva et al. (2005) is translated di-rectly into the R code for this function. The SIMSAMPLE (or CreateRandomSample in the SAScode) function is omitted so that the actual allelic phenotypes from the dataset can be used insteadof simulated phenotypes. deSilvaFreq loops through each locus and population, and in each looptallies the number of alleles and sets up matrices using GENLIST, PHENLIST, RANMUL, SELF-MAT, and CONVMAT as described in the paper. Frequencies of each allelic phenotype are thentallied across all samples in that population with non-missing data at the locus. Initial allele fre-quencies for that population and locus are then extraced from initFreq and adjusted according to
18 deSilvaFreq
initNull. The EM iteration then begins for that population and locus, as described in the paper(EXPECTATION, GPROBS, and MAXIMISATION).
Each repetition of the EM algorithm includes an expectation and maximization step. The expec-tation step uses allele frequencies and the selfing rate to calculate expected genotype frequencies,then uses observed phenotype frequencies and expected genotype frequencies to estimate genotypefrequencies for the population. The maximization step uses the estimated genotype frequencies tocalculate a new set of allele frequencies. The process is repeated until allele frequencies converge.
In addition to returning a data frame of allele frequencies, deSilvaFreq also prints to the consolethe number of EM repetitions used for each population and locus. When each locus and eachpopulation is begun, a message is printed to the console so that the user can monitor the progress ofthe computation.
Value
A data frame containing the estimated allele frequencies. The row names are population namesfrom PopNames(object). The first column shows how many genomes each population has. Allother columns represent alleles (including one null allele per locus). These column names are thelocus name and allele name separated by a period.
Note
It is possible to exceed memory limits for R if a locus has too many alleles in a population (e.g. 15alleles in a tetraploid if the memory limit is 1535 Mb, see memory.limit).
De Silva et al. mention that their estimation method could be extended to the case of disomic inheri-tence. A method for disomic inheritence is not implemented here, as it would require knowledge ofwhich alleles belong to which isoloci.
De Silva et al. also suggest a means of estimating the selfing rate with a least-squares method.Using the notation in the source code, this would be:
lsq <- smatt %*% EP - rvec
self <- as.vector((t(EP - rvec) %*% lsq)/(t(lsq) %*% lsq))
However, in my experimentation with this calculation, it sometimes yields selfing rates greater thanone. For this reason, it is not implemented here.
Author(s)
Lindsay V. Clark
References
De Silva, H. N., Hall, A. J., Rikkerink, E., and Fraser, L. G. (2005) Estimation of allele frequenciesin polyploids under certain patterns of inheritance. Heredity 95, 327–334
See Also
simpleFreq, write.freq.SPAGeDi, .genlist
deSilvaFreq 19
Examples
## Not run:## An example with a long run time due to the number of alleles
# create a dataset for this examplemygen <- new("genambig", samples=c(paste("A", 1:100, sep=""),
paste("B", 1:100, sep="")),loci=c("loc1", "loc2"))
PopNames(mygen) <- c("PopA", "PopB")PopInfo(mygen) <- c(rep(1, 100), rep(2, 100))mygen <- reformatPloidies(mygen, output="one")Ploidies(mygen) <- 4Usatnts(mygen) <- c(2, 2)Description(mygen) <- "An example for allele frequency calculation."
# create some genotypes at random for this examplefor(s in Samples(mygen)){
Genotype(mygen, s, "loc1") <- sample(seq(120, 140, by=2),sample(1:4, 1))
}for(s in Samples(mygen)){
Genotype(mygen, s, "loc2") <- sample(seq(130, 156, by=2),sample(1:4, 1))
}# make one genotype missingGenotype(mygen, "B4", "loc2") <- Missing(mygen)
# view the datasetsummary(mygen)viewGenotypes(mygen)
# calculate the allele frequencies if the rate of selfing is 0.2myfrequencies <- deSilvaFreq(mygen, self=0.2)
# view the resultsmyfrequencies
## End(Not run)
## An example with a shorter run time, for checking that the funciton## is working. Genotype simulation is also a bit more realistic here.
# Create a dataset for the example.mygen <- new("genambig", samples=paste("A", 1:100, sep=""), loci="loc1")PopNames(mygen) <- "PopA"PopInfo(mygen) <- rep(1, 100)mygen <- reformatPloidies(mygen, output="one")Ploidies(mygen) <- 4Usatnts(mygen) <- 2for(s in Samples(mygen)){
alleles <- unique(sample(c(122,124,126,0), 4, replace=TRUE,prob = c(0.3, 0.2, 0.4, 0.1)))

20 editGenotypes
Genotype(mygen, s, "loc1") <- alleles[alleles != 0]if(length(Genotype(mygen, s, "loc1"))==0)
Genotype(mygen, s, "loc1") <- Missing(mygen)}
# We have created a random mating populations with four alleles# including one null. The allele frequencies are given in the# ’prob’ argument.
# Estimate allele frequenciesmyfreq <- deSilvaFreq(mygen, self=0.01)myfreq
editGenotypes Edit Genotypes Using the Data Editor
Description
The genotypes from an object of one of the subclasses of gendata are converted to a data frame (ifnecessary), then displayed in the data editor. After the user makes the desired edits and closes thedata editor window, the new genotypes are written to the gendata object and the object is returned.
Usage
editGenotypes(object, maxalleles = max(Ploidies(object)),samples = Samples(object), loci = Loci(object))
Arguments
object An object of the class genambig or genbinary. Contains the genotypes to beedited.
maxalleles Numeric. The maximum number of alleles found in any given genotype. Themethod for genambig requires this information in order to determine how manycolumns to put in the data frame.
samples Character or numeric vector indicating which samples to edit.
loci Character or numeric vector indicating which loci to edit.
Details
The method for genambig lists sample and locus names in each row in order to identify the geno-types. However, only the alleles themselves should be edited. NA values and duplicate alleles in thedata editor will be omitted from the genotype vectors that are written back to the genambig object.
Value
An object identical to object but with edited genotypes.

estimatePloidy 21
Author(s)
Lindsay V. Clark
See Also
viewGenotypes, Genotype<-, Genotypes<-
Examples
if(interactive()){ #this line included for automated checking on CRAN
# set up "genambig" object to editmygen <- new("genambig", samples = c("a", "b", "c"),
loci = c("loc1", "loc2"))Genotypes(mygen, loci="loc1") <- list(c(133, 139, 142),
c(130, 136, 139, 145),c(136, 142))
Genotypes(mygen, loci="loc2") <- list(c(202, 204), Missing(mygen),c(200, 206, 208))
mygen <- reformatPloidies(mygen, output="one")Ploidies(mygen) <- 4
# open up the data editormygen <- editGenotypes(mygen)
# view the results of your editsviewGenotypes(mygen)
}
estimatePloidy Estimate Ploidies Based on Allele Counts
Description
estimatePloidy calculates the maximum and mean number of unique alleles for each sampleacross a given set of loci. These values are presented in a data editor, along with other pertinentinformation, so that the user can then edit the ploidy values for the object.
Usage
estimatePloidy(object, extrainfo, samples = Samples(object),loci = Loci(object))

22 estimatePloidy
Arguments
object The object containing genotype data, and to which ploidies will be written.
extrainfo A named or unnamed vector or data frame containing extra information (suchas morphological or flow cytometry data) to display in the data editor, to assistwith making decisions about ploidy. If unnamed, the vector (or the rows of thedata frame) is assumed to be in the same order as samples. An array can alsobe given as an argument here, and will be coerced to a data frame.
samples A numeric or character vector indicating a subset of samples to evaluate.
loci A numeric or character vector indicating a subset of loci to use in the calculationof mean and maximum allele number.
Details
estimatePloidy is a generic function with methods written for the genambig and genbinaryclasses.
If the Ploidies slot of object is not already a "ploidysample" object, the function will firstconvert the Ploidies slot to this format, deleting any data that is currently there. (Ploidies must beindexed by sample and not by locus.) If ploidies were already in the "ploidysample" format, anyploidy data already in the object is retained and put into the table (see below).
Population identities are displayed in the table only if more than one population identity is found inthe dataset. Likewise, the current ploidies of the dataset are only displayed if there is more than oneploidy level already found in Ploidies(object).
Missing genotypes are ignored; maximum and mean allele counts are only calculted across geno-types that are not missing. If all genotypes for a given sample are missing, NA is displayed in thecorresponding cells in the data editor.
The default values for new.ploidy are the maximum number of alleles per locus for each sample.
Value
object is returned, with Ploidies(object) now equal to the values set in the new.ploidy columnof the data editor.
Author(s)
Lindsay V. Clark
See Also
genambig, genbinary, Ploidies
Examples
if(interactive()){ #this line included for automated checking on CRAN
# create a dataset for this examplemygen <- new("genambig", samples=c("a", "b", "c"),
loci=c("loc1", "loc2"))

FCRinfo 23
Genotypes(mygen, loci="loc1") <- list(c(122, 126, 128), c(124, 130),c(120, 122, 124))
Genotypes(mygen, loci="loc2") <- list(c(140, 148), c(144, 150), Missing(mygen))
# estimate the ploidiesmygen <- estimatePloidy(mygen)
# view the ploidiesPloidies(mygen)
}
FCRinfo Additional Data on Rubus Samples
Description
For 20 Rubus samples, contains colors and symbols to use for plotting data.
Usage
data(FCRinfo)
Format
Data frame. FCRinfo$Plot.color contains character strings of the colors to be used to representspecies groups. FCR.info$Plot.symbol contains integers to be passed to pch to designate thesymbol used to represent each individual. These reflect chloroplast haplotypes.
Source
Clark and Jasieniuk, unpublished data
See Also
testgenotypes

24 find.missing.gen
find.missing.gen Find Missing Genotypes
Description
This function returns a data frame listing the locus and sample names of all genotypes with missingdata.
Usage
find.missing.gen(object, samples = Samples(object),loci = Loci(object))
Arguments
object A genambig or genbinary object containing the genotypes of interest.
samples A character vector of all samples to be searched. Must be a subset of Samples(object).
loci A character vector of all loci to be searched. Must be a subset of Loci(object).
Value
A data frame with no row names. The first column is named “Locus” and the second column isnamed “Sample”. Each row represents one missing genotype, and gives the locus and sample ofthat genotype.
Author(s)
Lindsay V. Clark
See Also
isMissing
Examples
# set up the genotype datasamples <- paste("ind", 1:4, sep="")samplesloci <- paste("loc", 1:3, sep="")locitestgen <- new("genambig", samples = samples, loci = loci)Genotypes(testgen, loci="loc1") <- list(c(-9), c(102,104),
c(100,106,108,110,114),c(102,104,106,110,112))
Genotypes(testgen, loci="loc2") <- list(c(77,79,83), c(79,85), c(-9),c(83,85,87,91))
Genotypes(testgen, loci="loc3") <- list(c(122,128), c(124,126,128,132),c(120,126), c(124,128,130))

freq.to.genpop 25
# look up which samples*loci have missing genotypesfind.missing.gen(testgen)
freq.to.genpop Convert Allele Frequencies for Adegenet
Description
Given a data frame of allele frequencies such as that produced by simpleFreq or deSilvaFreq,freq.to.genpop creates a data frame of allele counts that can be read by the as.genpop functionin the package adegenet.
Usage
freq.to.genpop(freqs, pops = row.names(freqs),loci =unique(as.matrix(as.data.frame(strsplit(names(freqs),split = ".", fixed = TRUE), stringsAsFactors = FALSE))[1, ]))
Arguments
freqs A data frame of allele frequencies. Row names are population names. The firstcolumn is called "Genomes" and indicates the size of each population in termsof number of haploid genomes. All other column names are the locus and alleleseparated by a period. These columns contain the frequencies of each allele ineach population. For each locus and population, all frequencies should total to1.
pops An optional character vector indicating the names of populations to use.
loci An optional character vector indicating the names of loci to use.
Details
adegenet expects one ploidy for the entire dataset. Therefore, data frames of allele frequencies withmultiple “Genomes” columns, such as those produced when ploidy varies by locus, are not allowedas the freqs argument.
Value
A data frame with row and column names identical to those in freqs, minus the "Genomes" columnand any columns for loci not included in loci. Allele frequencies are converted to counts bymultiplying by the values in the "Genomes" column and rounding to the nearest integer.
Author(s)
Lindsay V. Clark
26 genambig-class
References
Jombart, T. (2008) adegenet: a R package for the multivariate analysis of genetic markers. Bioin-formatics 24, 1403-1405.
See Also
simpleFreq, deSilvaFreq, write.freq.SPAGeDi, gendata.to.genind
Examples
# create a simple allele frequency table# (usually done with simpleFreq or deSilvaFreq)myfreq <- data.frame(row.names=c("popA","popB"), Genomes=c(120,100),
locG.152=c(0.1,0.4), locG.156=c(0.5, 0.3),locG.160=c(0.4, 0.3), locK.179=c(0.15, 0.25),locK.181=c(0.35, 0.6), locK.183=c(0.5, 0.15))
myfreq
# convert to adegenet formatgpfreq <- freq.to.genpop(myfreq)gpfreq
## Not run:# If you have adegenet installed, you can now make this into a# genpop object.require(adegenet)mygenpop <- genpop(gpfreq, ploidy=as.integer(4), type="codom")
# examine the object that has been [email protected]@[email protected]
# Perform a distance calculation with the objectdist.genpop(mygenpop)
## End(Not run)
genambig-class Class "genambig"
Description
Objects of this class store microsatellite datasets in which allele copy number is ambiguous. Geno-types are stored as a two-dimensional list of vectors, each vector containing all unique alleles for agiven sample at a given locus. genambig is a subclass of gendata.

genambig-class 27
Objects from the Class
Objects can be created by calls of the form new("genambig", samples, loci, ...). This auto-matically sets up a two-dimensional list in the Genotypes slot, with dimnames=list(samples, loci).This array-list is initially populated with the missing data symbol. All other slots are given initialvalues according to the initialize method for gendata. Data can then be inserted into the slotsusing the replacement functions (see Accessors).
Slots
Genotypes: Object of class "array". The first dimension of the array represents and is named bysamples, while the second dimension represents and is named by loci. Each element of thearray can contain a vector. Each vector should contain each unique allele for the genotypeonce. If an array element contains a vector of length 1 containing only the symbol that is inthe Missing slot, this indicates missing data for that sample and locus.
Description: Object of class "character". This stores a description of the dataset for the user’sconvenience.
Missing: Object of class "ANY". A symbol to be used to indicate missing data in the Genotypesslot. This is the integer -9 by default.
Usatnts: Object of class "integer". A vector, named by loci. Each element indicates the repeattype of the locus. 2 indicates dinucleotide repeats, 3 indicates trinucleotide repeats, and soon. If the alleles stored in the Genotypes slot for a given locus are already written in terms ofrepeat number, the Usatnts value for that locus should be 1. In other words, all alleles for alocus can be divided by the number in Usatnts to give alleles expressed in terms of relativerepeat number.
Ploidies: Object of class "integer". A vector, named by samples. This stores the ploidy of eachsample. NA indicates unknown ploidy. See Ploidies<- and estimatePloidy for ways to fillthis slot.
PopInfo: Object of class "integer". A vector, named by samples, containing the populationidentity of each sample.
PopNames: Object of class "character". A vector containing names for all populations. The posi-tion of a population name in the vector indicates the integer used to represent that populationin PopInfo.
Extends
Class "gendata", directly.
Methods
For more information on any of these methods, see the help files of their respective generic func-tions.
deleteLoci signature(object = "genambig"): Removes columns in the array in the Genotypesslot corresponding to the locus names supplied, then passes the arguments to the method forgendata.
deleteSamples signature(object = "genambig"): Removes rows in the array in the Genotypesslot corresponding to the sample names supplied, then passes the arguments to the method forgendata.

28 genambig-class
editGenotypes signature(object = "genambig"): Each vector in the Genotypes slot is placedinto the row of a data frame, along with the sample and locus name for this vector. The dataframe is then opened in the Data Editor so that the user can make changes. When the DataEditor window is closed, vectors are extracted back out of the data frame and written to theGenotypes slot.
estimatePloidy signature(object = "genambig"): Calculates the length of each genotype vec-tor (excluding those with the missing data symbol), and creates a data frame showing themaximum and mean number of alleles per locus for each sample. This data frame is thenopened in the Data Editor, where the user may edit ploidy levels. Once the Data Editor isclosed, the genambig object is returned with the new values written to the Ploidies slot.
Genotype signature(object = "genambig"): Retrieves a single genotype vector, as specifiedby sample and locus arguments.
Genotype<- signature(object = "genambig"): Replaces a single genotype vector.
Genotypes signature(object = "genambig"): Retrieves a two-dimensional list of genotypevectors.
Genotypes<- signature(object = "genambig"): Replaces a one- or two-dimensional list ofgenotype vectors.
initialize signature(.Object = "genambig"): When new is called to create a new genambigobject, the initialize method sets up a two dimensional list in the Genotypes slot indexedby sample and locus, and fills this list with the missing data symbol. The initialize methodfor gendata is then called.
isMissing signature(object = "genambig"): Given a set of samples and loci, each position inthe array in the Genotypes slot is checked to see if it matches the missing data value. A singleBoolean value or an array of Boolean values is returned.
Loci<- signature(object = "genambig"): For changing the names of loci. The names arechanged in the second dimension of the array in the Genotypes slot, and then the Loci<-method for gendata is called.
Missing<- signature(object = "genambig"): For changing the missing data symbol. All ele-ments of the Genotypes array that match the current missing data symbol are changed to thenew missing data symbol. The Missing<- method for gendata is then called.
Samples<- signature(object = "genambig"): For changing the names of samples. The namesare changed in the first dimension of the array in the Genotypes slot, and then the Samples<-method for gendata is called.
summary signature(object = "genambig"): Prints the dataset description (Description slot)to the console as well as the number of missing genotypes, then calls the summary method forgendata.
viewGenotypes signature(object = "genambig"): Prints a tab-delimited table of samples, loci,and genotype vectors to the console.
"[" signature(x = "genambig", i = "ANY", j = "ANY"): For subscipting genambig ob-jects. Should be of the form mygenambig[mysamples, myloci]. Returns a genambig object.The Genotypes slot is replaced by one containing only samples i and loci j. Likewise, thePopInfo and Ploidies slots are truncated to contain only samples i, and the Usatnts slot istruncated to contain only loci j. Other slots are left unaltered.
merge signature(x = "genambig", y = "genambig"): Merges two genotypes objects together.See merge,genambig,genambig-method.

genambig.to.genbinary 29
Author(s)
Lindsay V. Clark
See Also
gendata, Accessors, merge,genambig,genambig-method
Examples
# display class definitionshowClass("genambig")
# create a genambig objectmygen <- new("genambig", samples=c("a", "b", "c", "d"),
loci=c("L1", "L2", "L3"))# add some genotypesGenotypes(mygen)[,"L1"] <- list(c(133, 139, 145), c(142, 154),
c(130, 142, 148), Missing(mygen))Genotypes(mygen, loci="L2") <- list(c(105, 109, 113), c(111, 117),
c(103, 115), c(105, 109, 113))Genotypes(mygen, loci="L3") <- list(c(254, 258), Missing(mygen),
c(246, 250, 262), c(250, 258))
# see a summary of the objectsummary(mygen)# display some of the genotypesviewGenotypes(mygen[c("a", "b", "c"),])
genambig.to.genbinary Convert Between Genotype Object Classes
Description
These functions convert back and forth between the genambig and genbinary classes.
Usage
genambig.to.genbinary(object, samples = Samples(object),loci = Loci(object))
genbinary.to.genambig(object, samples = Samples(object),loci = Loci(object))
Arguments
object The object containing the genetic dataset. A genambig object for genambig.to.genbinary,or a genbinary object for genbinary.to.genambig.
samples An optional character vector indicating samples to include in the new object.loci An optional character vector indicating loci to include in the new object.

30 genambig.to.genbinary
Details
The slots Description, Ploidies, Usatnts, PopNames, and PopInfo are transferred as-is from theold object to the new. The value in the Genotypes slot is converted from one format to the other,with preservation of allele names.
Value
For genambig.to.genbinary: a genbinary object containing all of the data from object. Missing,Present, and Absent are set at their default values.
For genbinary.to.genambig: a genambig object containing all of the data from object. Missingis at the default value.
Author(s)
Lindsay V. Clark
See Also
genambig, genbinary
Examples
# set up a genambig object for this examplemygen <- new("genambig", samples = c("A", "B", "C", "D"),
loci = c("locJ", "locK"))PopNames(mygen) <- c("PopQ", "PopR")PopInfo(mygen) <- c(1,1,2,2)Usatnts(mygen) <- c(2,2)Genotypes(mygen, loci="locJ") <- list(c(178, 184, 186), c(174,186),
c(182, 188, 190),c(182, 184, 188))
Genotypes(mygen, loci="locK") <- list(c(133, 135, 141),c(131, 135, 137, 143),Missing(mygen), c(133, 137))
# convert it to a genbinary objectmygenB <- genambig.to.genbinary(mygen)
# check the resultsviewGenotypes(mygenB)viewGenotypes(mygen)PopInfo(mygenB)
# convert back to a genambig objectmygenA <- genbinary.to.genambig(mygenB)viewGenotypes(mygenA)
# note: identical(mygen, mygenA) returns FALSE, because the alleles# origninally input are not stored as integers, while the alleles# produced by genbinary.to.genambig are integers.

genbinary-class 31
genbinary-class Class "genbinary"
Description
This is a subclass of gendata that allows genotypes to be stored as a matrix indicating the presenceand absence of alleles.
Objects from the Class
Objects can be created by calls of the form new("genbinary", samples, loci, ...). Afterobjects are initialized with sample and locus names, data can be added to slots using the replacementfunctions.
Slots
Genotypes: Object of class "matrix". Row names of the matrix are sample names. Each columnname is a locus name and an allele separated by a period (e.g. "loc1.124"); each column rep-resents on allele. The number of alleles per locus is not limited and can be expanded even afterentering initial data. Each element of the matrix must be equal to either Present(object),Absent(object), or Missing(object). These symbols indicate, respectively, that a samplehas an allele, that a sample does not have an allele, or that data for the sample at that locus aremissing.
Present: Object of class "ANY". The integer 1 by default. This symbol is used in the Genotypesslot to indicate the presence of an allele in a sample.
Absent: Object of class "ANY". The integer 0 by default. This symbol is used in the Genotypesslot to indicate the absence of an allele in a sample.
Description: Object of class "character". A character string or vector describing the dataset,for the convenience of the user.
Missing: Object of class "ANY". The integer -9 by default. This symbol is used in the Genotypesslot to indicate that data are missing for a given sample and locus.
Usatnts: Object of class "integer". A vector, named by loci. This indicates the repeat length ofeach locus. 2 indicates dinucleotide repeats, 3 indicates trinucleotide repeats, and so on. If thealleles stored in the column names of the Genotypes slot for a given locus are already writtenin terms of repeat number, the Usatnts value for that locus should be 1. In other words, allalleles for a locus can be divided by the number in Usatnts to give alleles expressed in termsof relative repeat number.
Ploidies: Object of class "integer". A vector, named by samples. This indicates the ploidy ofeach sample.
PopInfo: Object of class "integer". A vector, named by samples. This indicates the populationidentity of each sample.
PopNames: Object of class "character". Names of each population. The position of the popu-lation name in the vector corresponds to the number used to represent that population in thePopInfo slot.

32 genbinary-class
Extends
Class "gendata", directly.
Methods
Absent signature(object = "genbinary"): Returns the symbol used to indicate that a givenallele is absent in a given sample.
Absent<- signature(object = "genbinary"): Changes the symbol used to indicate that a givenallele is absent in a given sample. The matrix in the Genotypes slot is searched for the oldsymbol, which is replaced by the new. The new symbol is then written to the Absent slot.
Genotype signature(object = "genbinary"): Returns a matrix containing the genotype for agiven sample and locus (by a call to Genotypes).
Genotypes signature(object = "genbinary"): Returns the matrix stored in the Genotypesslot, or a subset as specified by the samples and loci arguments.
Genotypes<- signature(object = "genbinary"): A method for adding or replacing geno-type data in the object. Note that allele columns cannot be removed from the matrix in theGenotypes slot using this method, although an entire column could be filled with zeros in or-der to effectively remove an allele from the dataset. If the order of rows in value (the matrixcontaining values to be assigned to the Genotypes slot) is not identical to Samples(object),the samples argument should be used to indicate row order. Row names in value are ignored.The loci argument can be left at the default, even if only a subset of loci are being assigned.Column names of value are important, and should be the locus name and allele name sepa-rated by a period, as they are in the Genotypes slot. After checking that the column name isvalid, the method checks for whether the column name already exists or not in the Genotypesslot. If it does exist, data from that column are replaced with data from value. If not, a col-umn is added to the matrix in the Genotypes slot for the new allele. If the column is new anddata are not being written for samples, the method automatically fills in Missing or Absentsymbols for additional samples, depending on whether or not data for the locus appear to bemissing for the sample or not.
initialize signature(.Object = "genbinary"): Sets up a genbinary object when new("genbinary")is called. If samples or loci arguments are missing, these are filled in with dummy values("ind1", "ind2", "loc1", "loc2"). The matrix is then set up in the Genotypes slot.Sample names are used for row names, and there are zero columns. The initialize methodfor gendata is then called.
Missing<- signature(object = "genbinary"): Replaces all elements in matrix in the Genotypesslot containing the old Missing symbol with the new Missing symbol. The method forgendata is then called to replace the value in the Missing slot.
Present signature(object = "genbinary"): Returns the symbol used to indicate that a givenallele is present in a given sample.
Present<- signature(object = "genbinary"): Changes the symbol used for indicating that agiven allele is present in a given sample. The symbol is first replaced in the Genotypes slot,and then in the Present slot.
Samples<- signature(object = "genbinary"): Changes sample names in the dataset. Changesthe row names in the Genotypes slot, then calls the method for gendata to change the namesin the PopInfo and Ploidies slots.

genbinary-class 33
Loci<- signature(object = "genbinary"): Changes locus names in the dataset. Replaces thelocus portion of the column names in the Genotypes slot, then calls the method for gendatato change the names in the Usatnts slot.
isMissing signature(object = "genbinary"): Returns Boolean values, by sample and locus,indicating whether genotypes are missing. If there are any missing data symbols within thegenotype, it is considered missing.
summary signature(object = "genbinary"): Prints description of dataset and number ofmissing genotypes, then calls the method for gendata to print additional information.
editGenotypes signature(object = "genbinary"): Opens the genotype matrix in the DataEditor for editing. Useful for making minor changes, although allele columns cannot be addedusing this method.
viewGenotypes signature(object = "genbinary"): Prints the genotype matrix to the console,one locus at a time.
deleteSamples signature(object = "genbinary"): Removes the specified samples from thegenotypes matrix, then calls the method for gendata.
deleteLoci signature(object = "genbinary"): Removes the specified loci from the genotypesmatrix, then calls the method for gendata.
"[" signature(x = "genbinary", i = "ANY", j = "ANY"): Subscripting method. Returns agenbinary object with a subset of the samples and/or loci from x. Usage: genobject[samples,loci].
estimatePloidy signature(object = "genbinary"): Creates a data frame of mean and maxi-mum number of alleles per sample, which is then opened in the Data Editor so that the usercan manually specify the ploidy of each sample. Ploidies are then written to the Ploidiesslot of the object.
merge signature(x = "genbinary", y = "genbinary"): Merges two genotype objects to-gether. See merge,genbinary,genbinary-method.
Author(s)
Lindsay V. Clark
See Also
gendata, Accessors, genambig
Examples
# show the class definitionshowClass("genbinary")
# create a genbinary objectmygen <- new("genbinary", samples = c("indA", "indB", "indC", "indD"),
loci = c("loc1", "loc2"))Description(mygen) <- "Example genbinary object for the documentation."Usatnts(mygen) <- c(2,3)PopNames(mygen) <- c("Maine", "Indiana")PopInfo(mygen) <- c(1,1,2,2)Genotypes(mygen) <- matrix(c(1,1,0,0, 1,0,0,1, 0,0,1,1,
34 gendata-class
1,-9,1,0, 0,-9,0,1, 1,-9,0,1, 0,-9,1,1),nrow=4, ncol=7, dimnames = list(NULL,c("loc1.140", "loc1.144", "loc1.150",
"loc2.97", "loc2.100", "loc2.106", "loc2.109")))
# view all of the data in the objectmygen
gendata-class Class "gendata"
Description
This is a superclass for other classes that contain population genetic datasets. It has slots for pop-ulation information, ploidy, microsatellite repeat lengths, and a missing data symbol, but does nothave a slot to store genotypes. Sample and locus names are stored as the names of vectors in theslots.
Objects from the Class
Objects can be created by calls of the form new("gendata", samples, loci, ...). The missingdata symbol will be set to -9 by default. The default initial value for PopNames is a character vectorof length 0, and for Description is the string "Insert dataset description here". The defaultinitial value for the Ploidies slot is a "ploidymatrix" object, containing a matrix filled with NAand named by samples in the first dimension and loci in the second dimension. For other slots,vectors filled with NA will be generated and will be named by samples (for PopInfo) or loci (forUsatnts). The slots can then be edited using the methods described below.
Note that in most cases you will want to instead create an object from one of gendata’s subclasses,such as genambig.
Slots
Description: Object of class "character". One or more character strings to name or describethe dataset.
Missing: Object of class "ANY". A value to indicate missing data in the genotypes of the dataset.-9 by default.
Usatnts: Object of class "integer". This vector must be named by locus names. Each elementshould be the length of the microsatellite repeat for that locus, given in nucleotides. Forexample, 2 would indicate a locus with dinucleotide repeats, and 3 would indicate a locus withtrinucleotide repeats. 1 should be used for mononucleotide repeats OR if alleles for that locusare already expressed in terms of repeat number rather than nucleotides. To put it another way,if you divided the number used to represent an allele by the corresponding number in Usatnts(and rounded if necessary), the result would be the number of repeats (plus some additionallength for flanking regions).
Ploidies: Object of class "ploidysuper". This object will contain a pld slot that is a matrixnamed by samples and loci, a vector named by samples or loci, or a single value, dependingon the subclass. Each element is an integer that represents ploidy. NA indicates unknownploidy.

gendata-class 35
PopInfo: Object of class "integer". This vector also must be named by sample names. Eachelement represents the number of the population to which each sample belongs.
PopNames: Object of class "character". An unnamed vector containing the name of each pop-ulation. If a number from PopInfo is used to index PopNames, it should find the correctpopulation name. For example, if the first element of PopNames is "ABC", then any sampleswith 1 as their PopInfo value belong to population "ABC".
Methods
deleteLoci signature(object = "gendata"): Permanently remove loci from the dataset. Thisremoves elements from Usatnts.
deleteSamples signature(object = "gendata"): Permanently remove samples from the dataset.This removes elements from PopInfo and Ploidies.
Description signature(object = "gendata"): Returns the character vector in the Descriptionslot.
Description<- signature(object = "gendata"): Assigns a new value to the character vector inthe Description slot.
initialize signature(.Object = "gendata"): This is called when the new("gendata") functionis used. A new gendata object is created with sample and locus names used to index theappropriate slots.
Loci signature(object = "gendata", usatnts = "missing", ploidies="missing"): Re-turns a character vector containing all locus names for the object. The method accomplishesthis by returning names(object@Usatnts).
Loci signature(object = "gendata", usatnts = "numeric", ploidies = "missing"):Returns a character vector of all loci for a given set of repeat lengths. For example, ifusatnts = 2 all loci with dinucleotide repeats will be returned.
Loci signature(object= "gendata", usatnts = "missing", ploidies = "numeric"):Returns a character vector of all loci for a given set of ploidies. Only works if object@Ploidiesis a "ploidylocus" object.
Loci signature(object = "gendata", usatnts = "numeric",ploidies = "numeric"):Returns a character vector of all loci that have one of the indicated repeat types and one of theindicated ploidies. Only works if object@Ploidies is a "ploidylocus" object.
Loci<- signature(object = "gendata"): Assigns new names to loci in the dataset (changesnames(object@Usants). Should not be used for adding or removing loci.
Missing signature(object = "gendata"): Returns the missing data symbol from object@Missing.
Missing<- signature(object = "gendata"): Assigns a new value to object@Missing (changesthe missing data symbol).
Ploidies signature(object = "gendata", samples = "ANY", loci = "ANY"): Returnsthe ploidies in the dataset (object@Ploidies), indexed by sample and locus if applicable..
Ploidies<- signature(object = "gendata"): Assigns new values to ploidies of samples in thedataset. The assigned values are coerced to integers by the method. Names in the assignedvector or matrix are ignored; sample and/or locus names already present in the gendata objectare used instead.
PopInfo signature(object = "gendata"): Returns the population numbers of samples in thedataset (object@PopInfo).

36 gendata-class
PopInfo<- signature(object = "gendata"): Assigns new population numbers to samples inthe dataset. The assigned values are coerced to integers by the method. Names in the assignedvector are ignored; sample names already present in the gendata object are used instead.
PopNames signature(object = "gendata"): Returns a character vector of population names(object@PopNames).
PopNames<- signature(object = "gendata"): Assigns new names to populations.PopNum signature(object = "gendata",popname="character"): Returns the number cor-
responding to a population name.PopNum<- signature(object = "gendata", popname = "character"): Changes the pop-
ulation number for a given population name, merging it with an existing population of thatnumber if applicable.
Samples signature(object = "gendata", populations = "character", ploidies = "missing"):Returns all sample names for a given set of population names.
Samples signature(object = "gendata", populations = "character", ploidies = "numeric"):Returns all sample names for a given set of population names and ploidies. Only samples thatfit both criteria will be returned.
Samples signature(object = "gendata", populations = "missing", ploidies = "missing"):Returns all sample names.
Samples signature(object = "gendata", populations = "missing", ploidies = "numeric"):Returns all sample names for a given set of ploidies. Only works if object@Ploidies is a"ploidysample" object.
Samples signature(object = "gendata", populations = "numeric", ploidies = "missing"):Returns all sample names for a given set of population numbers.
Samples signature(object = "gendata", populations = "numeric", ploidies = "numeric"):Returns all sample names for a given set of population numbers and ploidies. Only samplesthat fit both criteria will be returned. Only works if object@Ploidies is a "ploidysample"object.
Samples<- signature(object = "gendata"): Assigns new names to samples. This edits bothnames(object@PopInfo) and names(object@Ploidies). It should not be used for addingor removing samples from the dataset.
summary signature(object = "gendata"): Prints some informaton to the console, includingthe numbers of samples, loci, and populations, the ploidies present, and the types of mi-crosatellite repeats present.
Usatnts signature(object = "gendata"): Returns microsatellite repeat lengths for loci in thedataset (object@Usatnts).
Usatnts<- signature(object = "gendata"): Assigns new values to microsatellite repeat lengthsof loci (object@Usatnts). The assigned values are coerced to integers by the method. Namesin the assigned vector are ignored; locus names already present in the gendata object are usedinstead.
"[" signature(x = "gendata", i = "ANY", j = "ANY"): Subscripts the data by a subsetof samples and/or loci. Should be used in the format mygendata[mysamples, myloci].Returns a gendata object with PopInfo, Ploidies, and Usatnts truncated to only containthe samples and loci listed in i and j, respectively. Description, Missing, and PopNamesare left unaltered.
merge signature(x = "gendata", y = "gendata"): Merges two genotype objects. Seemerge,gendata,gendata-method.

gendata.to.genind 37
Author(s)
Lindsay V. Clark
See Also
genambig, genbinary, Accessors
Examples
# show class definitionshowClass("gendata")
# create an object of the class gendata# (in reality you would want to create an object belonging to one of the# subclasses, but the procedure is the same)mygen <- new("gendata", samples = c("a", "b", "c"),
loci = c("loc1", "loc2"))Description(mygen) <- "An example for the documentation"Usatnts(mygen) <- c(2,3)PopNames(mygen) <- c("PopV", "PopX")PopInfo(mygen) <- c(2,1,2)Ploidies(mygen) <- c(2,2,4,2,2,2)
# view a summary of the objectsummary(mygen)
gendata.to.genind Convert Data to genind Format
Description
This is a function for exporting data to the package adegenet.
Usage
gendata.to.genind(object, samples = Samples(object), loci = Loci(object))
Arguments
object A "genambig" or (preferably) a "genbinary" object.
samples A character vector indicating the samples to include in the output.
loci A character vector indicating the loci to include in the output.

38 gendata.to.genind
Details
gendata.to.genind converts a "genambig" or "genbinary" object to a "genind" object using thepackage adegenet. The data being converted must all be of a single ploidy. Ploidy and populationinformation are carried over to the new object. Data will be coded as presence/absence in the newobject. The locus names in the new object are locus and allele names seperated by a hyphen.
adegenet must be installed in order to use this function.
Value
A genetic dataset in the "genind" class, ready for use in adegenet.
Author(s)
Lindsay V. Clark
References
http://adegenet.r-forge.r-project.org/
Jombart, T. (2008) adegenet: a R package for the multivariate analysis of genetic markers. Bioin-formatics 24, 1403–1405.
See Also
freq.to.genpop
Examples
# create a "genambig" objectmydata <- new("genambig", samples=c("a","b","c","d"), loci=c("e","f"))PopNames(mydata) <- c("G","H")PopInfo(mydata) <- c(1,1,2,2)mydata <- reformatPloidies(mydata, output="one")Ploidies(mydata) <- 3Genotypes(mydata, loci="e") <- list(c(100),c(100,102),
c(98,102,104),c(102,106))Genotypes(mydata, loci="f") <- list(c(200,202,204),Missing(mydata),
c(210,212),c(204,210,214))
# convert to "genind"mydata2 <- gendata.to.genind(mydata)mydata2@[email protected]@[email protected]@pop

genotypeDiversity 39
genotypeDiversity Genotype Diversity Statistics
Description
genotypeDiversity calculates diversity statistics based on genotype frequencies, using a distancematrix to assign individuals to genotypes. The Shannon and Simpson functions are also availableto calculate these statistics directly from a vector of frequencies.
Usage
genotypeDiversity(genobject, samples = Samples(genobject),loci = Loci(genobject),d = meandistance.matrix(genobject, samples, loci,
all.distances = TRUE,distmetric = Lynch.distance),
threshold = 0, index = Shannon, ...)
Shannon(p, base = exp(1))
Simpson(p)
Simpson.var(p)
Arguments
genobject An object of the class "genambig" (or more generally, "gendata" if a value issupplied to d). If there is more than one population, the PopInfo slot shouldbe filled in. genobject is the dataset to be analyzed, although the genotypesthemselves will not be used if d has already been calculated. Missing genotypes,however, will indicate individuals that should be skipped in the analysis.
samples An optional character vector indicating a subset of samples to analyze.
loci An optional character vector indicating a subset of loci to analyze.
d A list such as that produced by meandistance.matrix or meandistance.matrix2when all.distances = TRUE. The first item in the list is a three dimensionalarray, with the first dimension indexed by locus and the second and third di-mensions indexed by sample. These are genetic distances between samples, bylocus. The second item in the list is the distance matrix averaged across loci.This mean matrix will be used only if all loci are being analyzed. If loci is asubset of the loci found in d, the mean matrix will be recalculated.
threshold The maximum genetic distance between two samples that can be considered tobe the same genotype.
index The diversity index to calculate. This should be Shannon, Simpson, or a user-defined function that takes as its first argument a vector of frequencies that sumto one.
40 genotypeDiversity
... Additional arguments to pass to index, for example the base argument forShannon.
p A vector of counts.
base The base of the logarithm for calculating the Shannon index. This is exp(1) forthe natural log, or 2 for log base 2.
Details
genotypeDiversity runs assignClones on distance matrices for individual loci and then for allloci, for each seperate population. The results of assignClones are used to calculate a vector ofgenotype frequencies, which is passed to index.
Shannon calculates the Shannon index, which is:
−∑ pi
Nln(
piN
)
(or log base 2 or any other base, using the base argument) given a vector p of genotype counts,where N is the sum of those counts.
Simpson calculates the Simpson index, which is:
∑ pi(pi − 1)
N(N − 1)
Simpson.var calculates the variance of the Simpson index:
4N(N − 1)(N − 2)∑
p3i + 2N(N − 1)∑
p2i − 2N(N − 1)(2N − 3)(∑
p2i )2
[N(N − 1)]2
The variance of the Simpson index can be used to calculate a confidence interval, for example theresults of Simpson plus or minus twice the square root of the results of Simpson.var would be the95% confidence interval.
Value
A matrix of diversity index results, with populations in rows and loci in columns. The final columnis called "overall" and gives the results when all loci are analyzed together.
Author(s)
Lindsay V. Clark
References
Shannon, C. E. (1948) A mathematical theory of communication. Bell System Technical Journal27:379–423 and 623–656.
Simpson, E. H. (1949) Measurement of diversity. Nature 163:688.
Lowe, A., Harris, S. and Ashton, P. (2004) Ecological Genetics: Design, Analysis, and Application.Wiley-Blackwell.

genotypeProbs 41
Arnaud-Haond, S., Duarte, M., Alberto, F. and Serrao, E. A. (2007) Standardizing methods toaddress clonality in population studies. Molecular Ecology 16:5115–5139.
http://darwin.phyloviz.net/ComparingPartitions/index.php?link=Tut4
See Also
assignClones, alleleDiversity
Examples
# set up datasetmydata <- new("genambig", samples=c("a","b","c"), loci=c("F","G"))Genotypes(mydata, loci="F") <- list(c(115,118,124),c(115,118,124),
c(121,124))Genotypes(mydata, loci="G") <- list(c(162,170,174),c(170,172),
c(166,180,182))Usatnts(mydata) <- c(3,2)
# get genetic distancesmydist <- meandistance.matrix(mydata, all.distances=TRUE)
# calculate diversity under various conditionsgenotypeDiversity(mydata, d=mydist)genotypeDiversity(mydata, d=mydist, base=2)genotypeDiversity(mydata, d=mydist, threshold=0.3)genotypeDiversity(mydata, d=mydist, index=Simpson)genotypeDiversity(mydata, d=mydist, index=Simpson.var)
genotypeProbs Calculate Probabilities of Unambiguous Genotypes
Description
Given an ambiguous genotype and either a data frame of allele frequencies or a vector of genotypeprobabilities, genotypeProbs calculates all possible unambiguous genotypes and their probabilitiesof being the true genotype.
Usage
genotypeProbs(object, sample, locus, freq = NULL, gprob = NULL,alleles = NULL)
Arguments
object An object of class "genambig". The Ploidies and PopInfo slots must be filledin for the sample and locus of interest.
sample Number or character string indicating the sample to evaluate.
locus Character string indicating the locus to evaluate.
42 genotypeProbs
freq A data frame of allele frequencies, such as that produced by simpleFreq ordeSilvaFreq. This argument should only be provided if the selfing rate is zero.
gprob A vector of genotype probabilities based on allele frequencies and selfing rate.This is generated by meandistance.matrix2 and passed to genotypeProbsonly if the selfing rate is greater than zero.
alleles An integer vector of all alleles. This argument should only be used if gprob isalso being used.
Details
This function is primarily designed to be called by meandistance.matrix2, in order to calculatedistances between all possible unambiguous genotypes. Ordinary users won’t use genotypeProbsunless they are designing a new analysis.
The genotype analyzed is Genotype(object, sample, locus). If the genotype is unambiguous(fully heterozygous or homozygous), a single unambiguous genotype is returned with a probabilityof one.
If the genotype is ambiguous (partially heterozygous), a recursive algorithm is used to generateall possible unambiguous genotypes (all possible duplications of alleles in the genotype, up to theploidy of the individual.)
If the freq argument is supplied:The probability of each unambiguous genotype is then calculated from the allele frequencies of theindividual’s population, under the assumption of random mating. Allele frequencies are normalizedso that the frequencies of the alleles in the ambiguous genotype sum to one; this converts eachfrequency to the probability of the allele being present in more than one copy. The product of theseprobabilities is multiplied by the appropriate polynomial coefficient to calculate the probability ofthe unambiguous genotype.
p =
n∏i=1
f cii ∗ (k − n)!∏n
i=1 ci!
where p is the probability of the unambiguous genotype, n is the number of alleles in the ambiguousgenotype, f is the normalized frequency of each allele, c is the number of duplicated copies (totalnumber of copies minus one) of the allele in the unambiguous genotype, and k is the ploidy of theindividual.
If the gprob and alleles arguments are supplied:The probabilities of all possible genotypes in the population have already been calculated, basedon allele frequencies and selfing rate. This is done in meandistance.matrix2 using code from DeSilva et al. (2005). Probabilities for the genotypes of interest (those that the ambiguous genotypecould represent) are normalized to sum to 1, in order to give the conditional probabilities of thepossible genotypes.
Value
probs A vector containing the probabilities of each unambiguous genotype.
genotypes A matrix. Each row represents one genotype, and the number of columns isequal to the ploidy of the individual. Each element of the matrix is an allele.

Internal Functions 43
Author(s)
Lindsay V. Clark
References
De Silva, H. N., Hall, A. J., Rikkerink, E., and Fraser, L. G. (2005) Estimation of allele frequenciesin polyploids under certain patterns of inheritance. Heredity 95, 327–334
See Also
meandistance.matrix2, .genlist
Examples
# get a data set and define ploidiesdata(testgenotypes)Ploidies(testgenotypes) <- c(8,8,8,4,8,8,rep(4,14))# get allele frequenciestfreq <- simpleFreq(testgenotypes)
# see results of genotypeProbs under different circumstancesGenotype(testgenotypes, "FCR7", "RhCBA15")genotypeProbs(testgenotypes, "FCR7", "RhCBA15", tfreq)Genotype(testgenotypes, "FCR10", "RhCBA15")genotypeProbs(testgenotypes, "FCR10", "RhCBA15", tfreq)Genotype(testgenotypes, "FCR1", "RhCBA15")genotypeProbs(testgenotypes, "FCR1", "RhCBA15", tfreq)Genotype(testgenotypes, "FCR2", "RhCBA23")genotypeProbs(testgenotypes, "FCR2", "RhCBA23", tfreq)Genotype(testgenotypes, "FCR3", "RhCBA23")genotypeProbs(testgenotypes, "FCR3", "RhCBA23", tfreq)
Internal Functions Internal Functions in polysat
Description
The internal functions .G, .indexg, .genlist, .ranmul, and .selfmat are used for calculating genotypeprobabilities under partial selfing. The internal function .unal1loc finds all unique alleles at a singlelocus.
Usage
.G(q, n)
.indexg(ag1, na1, m2)
.genlist(ng, na1, m2)
.ranmul(ng, na1, ag, m2)
.selfmat(ng, na1, ag, m2)
.unal1loc(object, samples, locus)

44 Internal Functions
Arguments
q Integer.
n Integer.
ag1 A vector representing an unambiguous genotype.
na1 Integer. The number of alleles, including a null.
m2 Integer. The ploidy.
ng Integer. The number of genotypes.
ag An array of genotypes such as that produced by .genlist.
object A "genambig" object.
samples Optional, a numeric or character vector indicating which samples to use.
locus A character string or number indicating which locus to use.
Value
.G returns
(n+ q)!
(q + 1)! ∗ (n− 1)!
.indexg returns an integer indicating the row containing a particular genotype in the matrix pro-duced by .genlist.
.genlist returns an array with dimensions ng, m2, containing all possible unambiguous genotypes,one in each row. The null allele is the highest-numbered allele.
.ranmul returns a list. The first item is a vector of polynomial coefficients for calculating genotypefrequencies under random mating. The second is an array showing how many copies of each alleleeach genotype has.
.selfmat returns the selfing matrix. Parental genotypes are represented in rows, and offspringgenotypes in columns. The numbers indicate relative amounts of offspring genotypes producedwhen the parental genotypes are self-fertilized.
.unal1loc returns a vector containing all unique alleles, not including Missing(object).
Author(s)
Lindsay V. Clark
References
De Silva, H. N., Hall, A. J., Rikkerink, E., and Fraser, L. G. (2005) Estimation of allele frequenciesin polyploids under certain patterns of inheritance. Heredity 95, 327–334
See Also
deSilvaFreq, meandistance.matrix2, genotypeProbs, genambig.to.genbinary, alleleDiversity

isMissing 45
Examples
# Calculation of genotype probabilities in a tetraploid with four# alleles plus a null, and a selfing rate of 0.5. This is a translation# of code in the supplementary material of De Silva et al. (2005).m2 <- 4m <- m2/2na1 <- 5self <- 0.5ng <- na1for(j in 2:m2){
ng <- ng*(na1+j-1)/j}ag <- polysat:::.genlist(ng, na1, m2)temp <- polysat:::.ranmul(ng, na1, ag, m2)rmul <- temp[[1]]arep <- temp[[2]]rm(temp)smat <- polysat:::.selfmat(ng, na1, ag, m2)smatdiv <- (polysat:::.G(m-1,m+1))^2p1 <- c(0.1, 0.4, 0.2, 0.2, 0.1) # allele frequencies
# GPROBS subroutinervec <- rep(0,ng)for(g in 1:ng){
rvec[g] <- rmul[g]for(j in 1:m2){
rvec[g] <- rvec[g]*p1[ag[g,j]]}
}id <- diag(nrow=ng)smatt <- smat/smatdivs3 <- id - self * smatts3inv <- solve(s3)gprob <- (1-self) * s3inv# gprob is a vector of probabilities of the seventy genotypes.
isMissing Determine Whether Genotypes Are Missing
Description
isMissing returns Boolean values indicating whether the genotypes for a given set of samples andloci are missing from the dataset.
Usage
isMissing(object, samples = Samples(object), loci = Loci(object))

46 isMissing
Arguments
object An object of one of the subclasses of gendata, containing the genotypes to betested.
samples A character or numeric vector indicating samples to be tested.
loci A character or numeric vector indicating loci to be tested.
Details
isMissing is a generic function with methods for genambig and genbinary objects.
For each genotype in a genambig object, the function evaluates and returns Genotype(object, sample, locus)[1] == Missing(object).For a genbinary object, TRUE %in% (Genotype(object, sample, locus) == Missing(object))is returned for the genotype. If only one sample and locus are being evaluated, this is the Booleanvalue that is returned. If multiple samples and/or loci are being evaluated, the function creates anarray of Boolean values and recursively calls itself to fill in the result for each element of the array.
Value
If both samples and loci are of length 1, a single Boolean value is returned, TRUE if the genotypeis missing, and FALSE if it isn’t. Otherwise, the function returns a named array with samples in thefirst dimension and loci in the second dimension, filled with Boolean values indicating whether thegenotype for each sample*locus combination is missing.
Author(s)
Lindsay V. Clark
See Also
Missing, Missing<-, Genotype, find.missing.gen
Examples
# set up a genambig object for this examplemygen <- new("genambig", samples=c("a", "b"), loci=c("locD", "locE"))Genotypes(mygen) <- array(list(c(122, 126), c(124, 128, 134),
Missing(mygen), c(156, 159)),dim=c(2,2))
viewGenotypes(mygen)
# test if some individual genotypes are missingisMissing(mygen, "a", "locD")isMissing(mygen, "a", "locE")
# test an array of genotypesisMissing(mygen, Samples(mygen), Loci(mygen))

Lynch.distance 47
Lynch.distance Calculate Band-Sharing Dissimilarity Between Genotypes
Description
Given two genotypes in the form of vectors of unique alleles, a dissimilarity is calculated as: 1 -(number of alleles in common)/(average number of alleles per genotype).
Usage
Lynch.distance(genotype1, genotype2, usatnt = NA, missing = -9)
Arguments
genotype1 A vector containing all alleles for a particular sample and locus. Each allele isonly present once in the vector.
genotype2 A vector of the same form as genotype1, for another sample at the same locus.
usatnt The microsatellite repeat length for this locus (ignored by the function).
missing The symbol used to indicate missing data in either genotype vector.
Details
Lynch (1990) defines a simple measure of similarity between DNA fingerprints. This is 2 times thenumber of bands that two fingerprints have in common, divided by the total number of bands thatthe two genotypes have. Lynch.distance returns a dissimilarity, which is 1 minus the similarity.
Value
If the first element of either or both input genotypes is equal to missing, NA is returned.
Otherwise, a numerical value is returned. This is one minus the similarity. The similarity is calcu-lated as the number of alleles that the two genotypes have in common divided by the mean lengthof the two genotypes.
Author(s)
Lindsay V. Clark
References
Lynch, M. (1990) The similarity index and DNA fingerprinting. Molecular Biology and Evolution7, 478-484.
See Also
Bruvo.distance, meandistance.matrix

48 meandist.from.array
Examples
Lynch.distance(c(100,102,104), c(100,104,108))Lynch.distance(-9, c(102,104,110))Lynch.distance(c(100), c(100,104,106))
meandist.from.array Tools for Working With Pairwise Distance Arrays
Description
meandist.from.array produces a mean distance matrix from an array of pairwise distances by lo-cus, such as that produced by meandistance.matrix when all.distances=TRUE. find.na.distfinds missing distances in such an array, and find.na.dist.not.missing finds missing distancesthat aren’t the result of missing genotypes.
Usage
meandist.from.array(distarray, samples = dimnames(distarray)[[2]],loci = dimnames(distarray)[[1]])
find.na.dist(distarray, samples = dimnames(distarray)[[2]],loci = dimnames(distarray)[[1]])
find.na.dist.not.missing(object, distarray,samples = dimnames(distarray)[[2]], loci = dimnames(distarray)[[1]])
Arguments
distarray A three-dimensional array of pairwise distances between samples, by locus.Loci are represented in the first dimension, and samples are represented in thesecond and third dimensions. Dimensions are named accordingly. Such an arrayis the first element of the list produced by meandistance.matrix if all.distances=TRUE.
samples Character vector. Samples to analyze.
loci Character vector. Loci to analyze.
object A genambig object. Typically the genotype object that was used to producedistarray.
Details
find.na.dist.not.missing is primarily intended to locate distances that were not calculated byBruvo.distance because both genotypes had too many alleles (more than maxl). The user maywish to estimate these distances manually and fill them into the array, then recalculate the meanmatrix using meandist.from.array.

meandist.from.array 49
Value
meandist.from.array returns a matrix, with both rows and columns named by samples, of dis-tances averaged across loci.
find.na.dist and find.na.dist.not.missing both return data frames with three columns: Lo-cus, Sample1, and Sample2. Each row represents the index in the array of an element containingNA.
Author(s)
Lindsay V. Clark
See Also
meandistance.matrix, Bruvo.distance, find.missing.gen
Examples
# set up the genotype datasamples <- paste("ind", 1:4, sep="")samplesloci <- paste("loc", 1:3, sep="")locitestgen <- new("genambig", samples=samples, loci=loci)Genotypes(testgen, loci="loc1") <- list(c(-9), c(102,104),
c(100,106,108,110,114),c(102,104,106,110,112))
Genotypes(testgen, loci="loc2") <- list(c(77,79,83), c(79,85), c(-9),c(83,85,87,91))
Genotypes(testgen, loci="loc3") <- list(c(122,128), c(124,126,128,132),c(120,126), c(124,128,130))
Usatnts(testgen) <- c(2,2,2)
# look up which samples*loci have missing genotypesfind.missing.gen(testgen)
# get the three-dimensional distance array and the mean of the arraygendist <- meandistance.matrix(testgen, distmetric=Bruvo.distance,
maxl=4, all.distances=TRUE)# look at the distances for loc1, where there is missing data and long genotypesgendist[[1]]["loc1",,]
# look up all missing distances in the arrayfind.na.dist(gendist[[1]])
# look up just the missing distances that don’t result from missing genotypesfind.na.dist.not.missing(testgen, gendist[[1]])
# Copy the array to edit the new copynewDistArray <- gendist[[1]]# calculate the distances that were NA from genotype lengths exceeding maxl# (in reality, if this were too computationally intensive you might estimate

50 meandistance.matrix
# it manually instead)subDist <- Bruvo.distance(c(100,106,108,110,114), c(102,104,106,110,112))subDist# insert this distance into the correct positionsnewDistArray["loc1","ind3","ind4"] <- subDistnewDistArray["loc1","ind4","ind3"] <- subDist# calculate the new mean distance matrixnewMeanMatrix <- meandist.from.array(newDistArray)# look at the difference between this matrix and the original.newMeanMatrixgendist[[2]]
meandistance.matrix Mean Pairwise Distance Matrix
Description
Given a genambig object, meandistance.matrix produces a symmetrical matrix of pairwise dis-tances between samples, averaged across all loci. An array of all distances prior to averaging mayalso be produced.
Usage
meandistance.matrix(object, samples = Samples(object),loci = Loci(object), all.distances=FALSE,distmetric = Bruvo.distance, progress = TRUE,...)
meandistance.matrix2(object, samples = Samples(object),loci = Loci(object),freq = simpleFreq(object, samples, loci), self = 0,all.distances = FALSE, distmetric = Bruvo.distance,progress = TRUE, ...)
Arguments
object A genambig object containing the genotypes to be analyzed. If distmetric = Bruvo.distance,the Usatnts slot should be filled in. For meandistance.matrix2, Ploidiesand PopInfo are also required.
samples A character vector of samples to be analyzed. These should be all or a subset ofthe sample names used in object.
loci A character vector of loci to be analyzed. These should be all or a subset of theloci names used in object.
freq A data frame of allele frequencies such as that produced by simpleFreq ordeSilvaFreq.
self A number ranging from 0 to 1, indicating the rate of selfing.

meandistance.matrix 51
all.distances If FALSE, only the mean distance matrix will be returned. If TRUE, a list will bereturned containing an array of all distances by locus and sample as well as themean distance matrix.
distmetric The function to be used to calculate distances between genotypes. Bruvo.distance,Lynch.distance, or a distance function written by the user.
progress If TRUE, loci and samples will be printed to the console as distances are calcu-lated, so that the user can monitor the progress of the computation.
... Additional arguments (such as maxl, add, and loss) to pass to distmetric.
Details
Each distance for the three-dimensional array is calculated only once, to save computation time.Since the array (and resulting mean matrix) is symmetrical, the distance is written to two positionsin the array at once.
meandistance.matrix uses ambiguous genotypes exactly as they are, whereas meandistance.matrix2uses genotypeProbs to calculate all possible unambiguous genotypes and their probabilities underrandom mating or partial selfing. The distance between each possible pair of unambiguous geno-types for the two samples is calculated with distmetric and weighted by the product of the proba-bilities of the two gentoypes. As you might expect, meandistance.matrix2 takes longer to processa given "genambig" object than meandistance.matrix does. Additionally, the distance betweentwo identical ambiguous genotypes will be zero when calculated with meandistance.matrix, andgreater than zero when calculated with meandistance.matrix2, due to potential differences incopy number of the alleles.
When Bruvo.distance is used, meandistance.matrix2 exaggerates distances between individu-als of different ploidy as compared to meandistance.matrix. The use of Bruvo2.distance withmeandistance.matrix2 allows individuals with different ploidies to have similar inter-individualdistances to those between individuals of the same ploidy. In general, it will be desirable to useBruvo.distance with meandistance.matrix for complex datasets with high ploidy levels, orBruvo.distance2 with meandistance.matrix2 for hexaploid or lower datasets (based on howlong it takes my personal computer to perform these calculations) where changes in ploidy are dueto genome doubling or genome loss. If all individuals have the same ploidy, Bruvo.distanceand Bruvo2.distance will give identical results regardless of whether meandistance.matrix ormeandistance.matrix2 is used.
meandistance.matrix2 does not allow a genotype to have more alleles than the ploidy of theindividual (as listed in the Ploidies slot). Additionally, if self is greater than zero, each populationmay only have one ploidy at each locus.
Value
A symmetrical matrix containing pairwise distances between all samples, averaged across all loci.Row and column names of the matrix will be the sample names provided in the samples argument.If all.distances=TRUE, a list will be produced containing the above matrix as well as a three-dimensional array containing all distances by locus and sample. The array is the first item in thelist, and the mean matrix is the second.
Author(s)
Lindsay V. Clark

52 merge-methods
See Also
Bruvo.distance, Bruvo2.distance, Lynch.distance, meandist.from.array, .genlist
Examples
# create a list of genotype datamygendata <- new("genambig", samples = c("ind1","ind2","ind3","ind4"),
loci = c("locus1","locus2","locus3","locus4"))Genotypes(mygendata) <-
array(list(c(124,128,138),c(122,130,140,142),c(122,132,136),c(122,134,140),c(203,212,218),c(197,206,221),c(215),c(200,218),c(140,144,148,150),c(-9),c(146,150),c(152,154,158),c(233,236,280),c(-9),c(-9),c(-9)))
Usatnts(mygendata) <- c(2,3,2,1)
# make index vectors of data to usemyloci <- c("locus1","locus2","locus3")mysamples <- c("ind1","ind2","ind4")
# calculate array and matrixmymat <- meandistance.matrix(mygendata, mysamples, myloci,
all.distances=TRUE)# view the resultsmymat[[1]]["locus1",,]mymat[[1]]["locus2",,]mymat[[1]]["locus3",,]mymat[[2]]
# add addtional info needed for meandistance.matrix2mygendata <- reformatPloidies(mygendata, output="one")Ploidies(mygendata) <- 4PopInfo(mygendata) <- c(1,1,1,1)
# calculate distances taking allele freqs into accountmymat2 <- meandistance.matrix2(mygendata, mysamples, myloci)mymat2# now do the same under selfingmymat3 <- meandistance.matrix2(mygendata, mysamples, myloci, self=0.3)mymat3
merge-methods Merge Two Genotype Objects into One
Description
The generic function merge has methods defined in polysat to merge two genotype objects of thesame class. Each method has optional samples and loci arguments for specifying subsets ofsamples and loci to be included in the merged object. Each method also has an optional overwriteargument to specify which of the two objects should not be used in the case of conflicting data.

merge-methods 53
Usage
merge(x, y, ...)
Arguments
x One of the objects to be merged. For the methods defined for polysat this shouldbe of class "gendata" or one of its subclasses.
y The other object to be merged. Should be of the same class as x. y@Ploidiesmust also be of the same class as x@Ploidies.
... Additional arguments specific to the method.
Methods
The methods for merge in polysat have four additional arguments: objectm, samples, loci, overwrite.
The samples and loci arguments can specify, using character vectors, a subset of the samples andloci found in x and y to write to the object that is returned.
If overwrite = "x", data from the second object will be used wherever there is contradictingdata. Likewise if overwrite = "y", data from the first object will be used wherever thereis contradicting data. If no overwrite argument is given, then any contradicting data between thetwo objects will produce an error indicating where the contradicting data were found.
The objectm argument is primarily for internal use (most users will not need it). If this argument isnot provided, a new genotype object is created and data from x and y are written to it. If objectmis provided, this is the object to which data will be written, and the object that will be returned.
signature(x = "genambig", y = "genambig") This method merges the genotype data from xand y. If the missing data symbols differ between the objects, overwrite is used to determinewhich missing data symbol to use, and all missing data symbols in the overwritten objectare converted. If overwrite is not provided and the missing data symbols differ betweenthe objects, an error will be given. The genotypes are then filled in. If certain sample*locuscombinations do not exist in either object (x and y have different samples as well as differentloci), missing data symbols are left in these positions. Again, for genotypes, overwritedetermines which object to preferentially use for data and whether to give an error if there isa disagreement.The merge method for gendata is then called.
signature(x = "genbinary", y = "genbinary") This method also merges genotype data forx and y, then calls the method for gendata. Missing, Present, and Absent are checkedfor consistency between objects similarly to what happens with Missing in the genambigmethod. Genotypes are then written to the merged object, and consistency between genotypesis checked.
signature(x = "gendata", y = "gendata") This method merges data about ploidy, repeat length,and population identity, as well as writing one or both dataset descriptions to the merged ob-ject.The same population numbers can have different meanings in PopInfo(x) and PopInfo(y).The unique PopNames are used instead to determine population identity, and the PopInfonumbers are changed if necessary. Therefore, it is important for identical populations to benamed the same way in both objects, but not important for identical populations to have thesame number in both objects.

54 pld
pld Accessor, Replacement, and Manipulation Functions for"ploidysuper" Objects
Description
pld accesses and replaces the pld slot of objects of "ploidysuper" subclasses. plCollapse testswhether an object of one of these classes can be converted to an object of a simpler one of theseclasses, and optionally returns the converted object. These are generic functions with methods forthe subclasses of "ploidysuper". These functions are primarily for internal use.
Usage
pld(object, samples, loci)pld(object) <- valueplCollapse(object, na.rm, returnvalue)
Arguments
object A "ploidysuper" object.
samples An optional character or numeric vector indexing the samples for which to returnploidy values.
loci An optional character or numeric vector indexing the loci for which to returnploidy values.
value A numeric vector or matrix that can be coerced to integers. These represent theploidies to store in the object@pld slot.
na.rm Boolean. If TRUE, NA values are ignored when testing to see if the ploidy formatcan be simplified. If the sample, locus, or entire dataset all has one ploidy asidefrom NA, the NA values will be overwritten by that ploidy when simplifying theploidy format. If FALSE, NA is treated as a unique ploidy.
returnvalue Boolean. If TRUE, a "ploidysuper" object will be returned if the ploidy formatcan be simplified, and FALSE will be returned if it cannot be simplified. If FALSE,only TRUE or FALSE will be returned to indicate if the ploidy format can besimplified or not.
Value
pld returns the vector or matrix containing the ploidy values. This is the contents of object@pld.
plCollapse either returns a Boolean value indicating whether the ploidy can be changed to asimpler format, or a new "ploidysuper" object with all of the ploidy data of object put into asimpler format. If object is a "ploidymatrix" object, a "ploidysample", "ploidylocus", or"ploidyone" object can be returned depending on how many unique ploidy values there are andhow they are distributed. If object is a "ploidysample" or "ploidylocus" object, a "ploidyone"object can be returned.

ploidysuper-class 55
Author(s)
Lindsay V. Clark
See Also
reformatPloidies, Ploidies
Examples
test <- new("ploidymatrix", samples=c("a","b","c"),loci=c("l1","l2","l3"))
pld(test) # view the ploidiespld(test) <- 2 # make it diploid at all samples and locipld(test)["a",] <- c(2,4,4) # change the ploidies for sample apld(test, samples=c("a","b")) # view ploidies at a subset of samples
# test to see if the ploidies can be simplifiedp <- plCollapse(test, na.rm=FALSE, returnvalue=TRUE)p# now change a ploidy and repeat the testpld(test)["a","l1"] <- 4p <- plCollapse(test, na.rm=FALSE, returnvalue=TRUE)p# change something else and collapse it furtherpld(p)["a"] <- 2p2 <- plCollapse(p, na.rm=FALSE, returnvalue=TRUE)p2
# if na.rm=FALSE, NA values are not ignored:pld(test)["a","l1"] <- NApld(test)plCollapse(test, na.rm=FALSE, returnvalue=TRUE)# NA values are ignored with na.rm=TRUEplCollapse(test, na.rm=TRUE, returnvalue=TRUE)
ploidysuper-class Class "ploidysuper" and Subclasses
Description
These classes contain ploidy data indexed by sample, locus, both, or neither. They are intended togo in the Ploidies slot of "gendata" objects.
Objects from the Class
"ploidysuper" is a virtual class: No objects may be created from it.
Objects of the subclasses "ploidymatrix", "ploidysample", "ploidylocus", and "ploidyone"can be created with the call new(ploidyclass, samples, loci, ...), where ploidyclass is a

56 read.ATetra
character string of one of the class names, and samples and loci are character vectors naming sam-ples and loci, respectively. The latter two arguments are optional depending on the class (whetherploidies are indexed by sample and/or locus). The typical user will not have to create an object inthis way, because other functions in polysat will do it for you.
Slots
pld: The only slot for objects of these classes. For "ploidymatrix", this is a matrix of integers,indexed in the first dimension by sample name and in the second dimension by locus name.Each element represents the ploidy at a given sample and locus. For "ploidysample" and"ploidylocus", the slot is an integer vector, named by sample or locus and indicating theploidy at each sample or locus, respectively. For "ploidyone", the slot contains a singleinteger representing the ploidy for the entire dataset.
Methods
pld signature(object= "ploidymatrix"): Returns the contents of object@pld: a matrix ofploidies indexed by sample and locus. The samples and loci arguments can be used, option-ally, to only return a subset of ploidies.
Author(s)
Lindsay V. Clark
See Also
reformatPloidies, pld, plCollapse, gendata
Examples
showClass("ploidysuper")
read.ATetra Read File in ATetra Format
Description
Given a file formatted for the software ATetra, read.ATetra produces a genambig object containinggenotypes, population identities, population names, and a dataset description from the file. Ploidyin the genambig object is automatically set to 4.
Usage
read.ATetra(infile)
Arguments
infile Character string. A file path to the file to be read.
read.ATetra 57
Details
read.ATetra reads text files in the exact format specified by the ATetra documentation. Note thatthis format only allows tetraploid data and that there can be no missing data.
Value
A genambig object as described above.
Author(s)
Lindsay V. Clark
References
http://www.vub.ac.be/APNA/ATetra_Manual-1-1.pdf
van Puyvelde, K., van Geert, A. and Triest, L. (2010) ATETRA, a new software program to ana-lyze tetraploid microsatellite data: comparison with TETRA and TETRASAT. Molecular EcologyResources 10, 331–334.
See Also
write.ATetra, read.Tetrasat, read.GeneMapper, read.Structure, read.GenoDive, read.SPAGeDi,read.POPDIST, read.STRand
Examples
# create a file to be read# (this would normally be done in a text editor or with ATetra’s Excel template)cat("TIT,Sample Rubus Data for ATetra", "LOC,1,CBA15","POP,1,1,Commonwealth", "IND,1,1,1,CMW1,197,208,211,213","IND,1,1,2,CMW2,197,207,211,212", "IND,1,1,3,CMW3,197,208,212,219","IND,1,1,4,CMW4,197,208,212,219", "IND,1,1,5,CMW5,197,208,211,212","POP,1,2,Fall Creek Lake", "IND,1,2,6,FCR4,197,207,211,212","IND,1,2,7,FCR7,197,208,212,218", "IND,1,2,8,FCR14,197,207,212,218","IND,1,2,9,FCR15,197,208,211,212", "IND,1,2,10,FCR16,197,208,211,212","IND,1,2,11,FCR17,197,207,212,218","LOC,2,CBA23","POP,2,1,Commonwealth","IND,2,1,1,CMW1,98,100,106,125","IND,2,1,2,CMW2,98,125,,","IND,2,1,3,CMW3,98,126,,","IND,2,1,4,CMW4,98,106,119,127","IND,2,1,5,CMW5,98,106,125,","POP,2,2,Fall Creek Lake","IND,2,2,6,FCR4,98,125,,","IND,2,2,7,FCR7,98,106,126,","IND,2,2,8,FCR14,98,127,,","IND,2,2,9,FCR15,98,108,117,","IND,2,2,10,FCR16,98,125,,","IND,2,2,11,FCR17,98,126,,","END",file = "atetraexample.txt", sep = "\n")
# Read the file and examine the dataexampledata <- read.ATetra("atetraexample.txt")summary(exampledata)PopNames(exampledata)viewGenotypes(exampledata)
58 read.GeneMapper
read.GeneMapper Read GeneMapper Genotypes Tables
Description
Given a vector of filepaths to tab-delimited text files containing genotype data in the ABI Gen-eMapper Genotypes Table format, read.GeneMapper produces a genambig object containing thegenotype data.
Usage
read.GeneMapper(infiles, forceInteger=TRUE)
Arguments
infiles A character vector of paths to the files to be read.
forceInteger Boolean. If TRUE, alleles will be coerced to integers. This is particularly use-ful for stripping any white space from allels and preventing alleles from beingimported as character strings. If FALSE, alleles will be imported as numeric orcharacter values, depending on the content of the input file(s).
Details
read.GeneMapper can read the genotypes tables that are exported by the Applied Biosystems Gen-eMapper software. The only alterations to the files that the user may have to make are 1) deleteany rows with missing data or fill in -9 in the first allele slot for that row, 2) make sure that allallele names are numeric representations of fragment length (no question marks or dashes), and 3)put sample names into the Sample Name column, if the names that you wish to use in analysis arenot already there. Each file should have the standard header row produced by the software. If anysample has more than one genotype listed for a given locus, only the last genotype listed will beused.
The file format is simple enough that the user can easily create files manually if GeneMapper isnot the software used in allele calling. The files are tab-delimited text files. There should be aheader row with column names. The column labeled “Sample Name” should contain the names ofthe samples, and the column labeled “Marker” should contain the names of the loci. You can haveas many or as few columns as needed to contain the alleles, and each of these columns should belabeled “Allele X” where X is a number unique to each column. Row labels and any other columnsare ignored. For any given sample, each allele is listed only once and is given as an integer that isthe length of the fragment in nucleotides. Alleles are separated by tabs. If you have more allelecolumns than alleles for any given sample, leave the extra cells blank so that read.table will readthem as NA. Example data files in this format are included in the package.
read.GeneMapper will read all of your data at once. It takes as its first argument a character vectorcontaining paths to all of the files to be read. How the data are distributed over these files does notmatter. The function finds all unique sample names and all unique markers across all the files, andautomatically puts a missing data symbol into the list if a particular sample and locus combination
read.GeneMapper 59
is not found. Rows in which all allele cells are blank should NOT be included in the input files;either delete these rows or put the missing data symbol into the first allele cell.
Sample and locus names must be consistent within and across the files. The object that is producedis indexed by these names.
If forceInteger=FALSE, alleles can be non-numeric values. Some functionality of polysat will belost in this case, but it could allow for the import of SNP data, for example.
Value
A genambig object containing genotypes from the files, stored as vectors of unique alleles in itsGenotypes slot. Other slots are left at the default values.
Note
A ‘subscript out of bounds’ error may mean that a sample name or marker was left blank in oneof the input files. A ‘NAs introduced by coercion’ warning when forceInteger=TRUE means thata non-numeric, non-whitespace character was included in one of the allele fields of the file(s), inwhich case the file(s) should be carefully checked and re-imported.
Author(s)
Lindsay V. Clark
References
http://www.appliedbiosystems.com/genemapper
See Also
genambig, read.Structure, read.GenoDive, read.SPAGeDi, read.Tetrasat, read.ATetra, write.GeneMapper,read.POPDIST, read.STRand
Examples
# create a table of datagentable <- data.frame(Sample.Name=rep(c("ind1","ind2","ind3"),2),
Marker=rep(c("loc1","loc2"), each=3),Allele.1=c(202,200,204,133,133,130),Allele.2=c(206,202,208,136,142,136),Allele.3=c(NA,208,212,145,148,NA),Allele.4=c(NA,216,NA,151,157,NA))
# create a file (inspect this file in a text editor or spreadsheet# software to see the required format)write.table(gentable, file="readGMtest.txt", quote=FALSE, sep="\t",
na="", row.names=FALSE, col.names=TRUE)
# read the filemygenotypes <- read.GeneMapper("readGMtest.txt")
# inspect the results

60 read.GenoDive
viewGenotypes(mygenotypes)
read.GenoDive Import Genotype Data from GenoDive File
Description
read.GenoDive takes a text file in the format for the software GenoDive and produces a genambigobject.
Usage
read.GenoDive(infile)
Arguments
infile A character string. The path to the file to be read.
Details
GenoDive is a Mac-only program for population genetic analysis that allows for polyploid data.read.GenoDive imports data from text files formatted for this program.
The first line of the file is a comment line, which is written to the Description slot of the genambigobject. On the second line, separated by tabs, are the number of individuals, number of populations,number of loci, maximum ploidy (ignored), and number of digits used to code alleles.
The following lines contain the names of populations, which are written to the PopNames slot of thegenambig object. After that is a header line for the genotype data. This line contains, separated bytabs, column headers for populations, clones (optional), and individuals, followed by the name ofeach locus. The locus names for the genotype object are derived from this line.
Each individual is on one line following the genotype header line. Separated by tabs are the pop-ulation number, the clone number (optional), the individual name (used as the sample name in theoutput) and the genotypes at each locus. Alleles at one locus are concatenated together in one stringwithout any characters to separate them. Each allele must have the same number of digits, althoughleading zeros can be omitted.
If the only alleles listed for a particular individual and locus are zeros, this is interpreted by read.GenoDiveas missing data, and Missing(object) (the default, -9) is written in that genotype slot in thegenambig object. GenoDive allows for a genotype to be partially missing but polysat does not;therefore, if an allele is coded as zero but other alleles are recorded for that sample and locus, theoutput genotype will just contain the alleles that are present, with the zeros thrown out.
Value
A genambig object containing the data from the file.
Author(s)
Lindsay V. Clark
read.POPDIST 61
References
Meirmans, P. G. and Van Tienderen, P. H. (2004) GENOTYPE and GENODIVE: two programs forthe analysis of genetic diversity of asexual organisms. Molecular Ecology Notes 4, 792-794.
http://www.bentleydrummer.nl/software/software/GenoDive.html
See Also
read.GeneMapper, write.GenoDive, read.Tetrasat, read.ATetra, read.Structure, read.SPAGeDi,read.POPDIST, read.STRand
Examples
# create data file (normally done in a text editor or spreadsheet software)cat(c("example comment line", "5\t2\t2\t3\t2", "pop1", "pop2",
"pop\tind\tloc1\tloc2", "1\tJohn\t102\t1214","1\tPaul\t202\t0", "2\tGeorge\t101\t121213","2\tRingo\t10304\t131414","1\tYoko\t10303\t120014"),
file = "genodiveExample.txt", sep = "\n")
# import file dataexampledata <- read.GenoDive("genodiveExample.txt")
# view datasummary(exampledata)viewGenotypes(exampledata)exampledata
read.POPDIST Read Genotype Data in POPDIST Format
Description
read.POPDIST reads one or more text files formatted for the software POPDIST and produces a"genambig" object containing genotypes, ploidies, and population identities from the file(s).
Usage
read.POPDIST(infiles)
Arguments
infiles A character vector of file paths to be read.

62 read.POPDIST
Details
The format for the software POPDIST is a modified version of the popular Genepop format. Thefirst line is a comment line, followed by a list of locus names, each on a separate line or on one lineseparated by commas. A line starting with the string “Pop” (“pop” and “POP” are also recognized)indicates the beginning of data for one population. Each individual is then represented on oneline, with the population name and individual genotype separated by a tab followed by a comma.Genotypes for different loci are separated by a tab or space. Each allele must be coded by twodigits. Zeros (“00”) indicate missing data, either for an entire locus or for a partially heterozygousgenotype. Partially heterozygous genotypes can also be represented by the arbitrary duplication ofalleles.
If more than one file is read at once, locus names must be consistent across all files. Locus andpopulation names should not start with “Pop”, “pop”, or “POP”, as read.POPDIST searches forthese character strings in order to identify the lines that delimit populations.
Value
A "genambig" object. The Description slot of the object is taken from the comment line of thefirst file. Locus names are taken from the files, and samples are given numbers instead of names.Each genotype consists of all unique non-zero integers for a given sample and locus. The Ploidiesslot is filled in based on how many alleles are present at each locus of each sample (the number ofcharacters for the genotype, divided by two). reformatPloidies is used internally by the functionto collapse the ploidies to the simplest format. Population names are taken from the individualgenotype lines, and population identities are recorded based on how the individuals are delimitedby “Pop” lines.
Author(s)
Lindsay V. Clark
References
http://gbi.agrsci.dk/~bernt/popgen/
Tomiuk, J., Guldbrandtsen, B. and Loeschcke, B. (2009) Genetic similarity of polyploids: a newversion of the computer program POPDIST (version 1.2.0) considers intraspecific genetic differen-tiation. Molecular Ecology Resources 9, 1364-1368.
Guldbrandtsen, B., Tomiuk, J. and Loeschcke, B. (2000) POPDIST version 1.1.1: A program tocalculate population genetic distance and identity measures. Journal of Heredity 91, 178-179.
See Also
write.POPDIST, read.Tetrasat, read.ATetra, read.Structure, read.SPAGeDi, read.GeneMapper,read.GenoDive, read.STRand
Examples
# Create a file to read (this is typically done in a text editor)cat("An example for the read.POPDIST documentation.","abcR",
read.SPAGeDi 63
"abcQ","Pop","Piscataqua\t, 0204 0505","Piscataqua\t, 0404 0307","Piscataqua\t, 050200 030509","Pop","Salmon Falls\t, 1006\t0805","Salmon Falls\t, 0510\t0308","Pop","Great Works\t, 050807 030800","Great Works\t, 0000 0408","Great Works\t, 0707 0305",file="testPOPDIST.txt", sep="\n")
# View the file in the R console (or open it in a text editor)cat(readLines("testPOPDIST.txt"), sep="\n")
# Read the file into a "genambig" objectfishes <- read.POPDIST("testPOPDIST.txt")
# View the data in the objectsummary(fishes)PopNames(fishes)PopInfo(fishes)Ploidies(fishes)viewGenotypes(fishes)
read.SPAGeDi Read Genotypes in SPAGeDi Format
Description
read.SPAGeDi can read a text file formatted for the SPAGeDi software and return a genambigobject, as well as optionally returning a data frame of spatial coordinates. The genambig objectincludes genotypes, ploidies, and population identities (from the category column, if present) fromthe file.
Usage
read.SPAGeDi(infile, allelesep = "/", returnspatcoord = FALSE)
Arguments
infile A character string indicating the path of the file to read.
allelesep The character that is used to delimit alleles within genotypes, or "" if alleleshave a fixed number of digits and are not delimited by any character. Otherexamples shown in section 3.2.1 of the SPAGeDi 1.3 manual include "/", " ",", ", ".", and "--".

64 read.SPAGeDi
returnspatcoord
Boolean. Indicates whether a data frame should be returned containing the spa-tial coordinates columns.
Details
SPAGeDi offers a lot of flexibility in how data files are formatted. read.SPAGeDi accomodatesmost of that flexibility. The primary exception is that alleles must be delimited in the same wayacross all genotypes, as specified by allelesep. Comment lines beginning with //, as well asblank lines, are ignored by read.SPAGeDi just as they are by SPAGeDi.
read.SPAGeDi is not designed to read dominant data (see section 3.2.2 of the SPAGeDi 1.3 man-ual). However, see genbinary.to.genambig for a way to read this type of data after some simplemanipulation in a spreadsheet program.
The first line of a SPAGeDi file contains information that is used by read.SPAGeDi. The ploidy asspecified in the 6th position of the first line is ignored, and is instead calculated by counting allelesfor each individual (including zeros on the right, but not the left, side of the genotype). The numberof digits specified in the 5th position of the first line is only used if allelesep="". All other valuesin the first line are important for the function.
If the only alleles found for a particular individual and locus are zeros, the genotype is interpretedas missing. Otherwise, zeros on the left side of a genotype are ignored, and zeros on the right sideof a genotype are used in calculating the ploidy but are not included in the genotype object that isreturned. If allelesep="", read.SPAGeDi checks that the number of characters in the genotypecan be evenly divided by the number of digits per allele. If not, zeros are added to the left of thegenotype string before splitting it into alleles.
The Ploidies slot of the "genambig" object that is created is initially indexed by both sample andlocus, with ploidy being written to the slot on a per-genotype basis. After all genotypes have beenimported, reformatPloidies is used to convert Ploidies to the simplest possible format beforethe object is returned.
Value
Under the default where returnspatcoord=FALSE, a genambig object is returned. Alleles areformatted as integers. The Ploidies slot is filled in according to the number of alleles per genotype,ignoring zeros on the left. If the first line of the file indicates that there are more than zero categories,the category column is used to fill in the PopNames and PopInfo slots.
Otherwise, a list is returned:
SpatCoord A data frame of spatial coordinates, unchanged from the file. The format of eachcolumn is determined under the default read.table settings. Row names areindividual names from the file. Column names are the same as in the file.
Dataset A genambig object as described above.
Author(s)
Lindsay V. Clark

read.STRand 65
References
http://ebe.ulb.ac.be/ebe/Software_files/manual_SPAGeDi_1-3.pdf
Hardy, O. J. and Vekemans, X. (2002) SPAGeDi: a versatile computer program to analyse spatialgenetic structure at the individual or population levels. Molecular Ecology Notes 2, 618–620.
See Also
write.SPAGeDi, genbinary.to.genambig, read.table, read.GeneMapper, read.GenoDive, read.Structure,read.ATetra, read.Tetrasat, read.POPDIST, read.STRand
Examples
# create a file to read (usually done with spreadsheet software or a# text editor):cat("// here’s a comment line at the beginning of the file","5\t0\t-2\t2\t2\t4","4\t5\t10\t50\t100","Ind\tLat\tLong\tloc1\tloc2","ind1\t39.5\t-120.8\t00003133\t00004040","ind2\t39.5\t-120.8\t3537\t4246","ind3\t42.6\t-121.1\t5083332\t40414500","ind4\t38.2\t-120.3\t00000000\t41430000","ind5\t38.2\t-120.3\t00053137\t00414200","END",sep="\n", file="SpagInputExample.txt")
# display the filecat(readLines("SpagInputExample.txt"), sep="\n")
# read the filemydata <- read.SPAGeDi("SpagInputExample.txt", allelesep = "",returnspatcoord = TRUE)
# view the datamydataviewGenotypes(mydata[[2]])
read.STRand Read Genotypes Produced by STRand Software
Description
This function reads in data in a format derived from the “BTH” format for exporting genotypesfrom the allele calling software STRand.
Usage
read.STRand(file, sep = "\t", popInSam = TRUE)

66 read.STRand
Arguments
file A text string indicating the file to read.
sep Field delimiter for the file. Tab by default.
popInSam Boolean. If TRUE, fields from the “Pop” and “Ind” columns will be concatenatedto create a sample name. If FALSE, only the “Ind” column will be used forsample names.
Details
This function does not read the files directly produced from STRand, but requires some simpleclean-up in spreadsheet software. The BTH format in STRand produces two columns per locus.One of these columns should be deleted so that there is just one column per locus. Loci namesshould remain in the column headers. The column containing sample names should be deleted orrenamed “Ind”. A “Pop” column will need to be added, containing population names. An “Ind”column is also necessary, containing either full sample names or a sample suffix to be concatenatedwith the population name (see popInSam argument).
STRand adds an asterisk to the end of any genotype with more than two alleles. read.STRand willautomatically strip this asterisk out of the genotype.
Missing data is indicated by a zero in the file.
Value
A "genambig" object containing genotypes, locus and sample names, population names, and pop-ulation identities from the file.
Author(s)
Lindsay V. Clark
References
http://www.vgl.ucdavis.edu/informatics/strand.php/
Toonen, R. J. and Hughes, S. (2001) Increased Throughput for Fragment Analysis on ABI Prism377 Automated Sequencer Using a Membrane Comb and STRand Software. Biotechniques 31,1320–1324.
See Also
read.table, read.GeneMapper, read.GenoDive, read.Structure, read.ATetra, read.Tetrasat,read.POPDIST, read.SPAGeDi
Examples
# generate file to readstrtemp <- data.frame(Pop=c("P1","P1","P2","P2"),
Ind=c("a","b","a","b"),LocD=c("0","172/174","170/172/178*","172/176"),LocG=c("130/136/138/142*","132/136","138","132/140/144*"))

read.Structure 67
write.table(strtemp, file="strtemp.txt", sep="\t")
# read the filemydata <- read.STRand("strtemp.txt")viewGenotypes(mydata)PopNames(mydata)
# alternative example with popInSam=FALSEstrtemp$Ind <- c("OH1","OH5","MT4","MT7")write.table(strtemp, file="strtemp.txt", sep="\t")mydata <- read.STRand("strtemp.txt", popInSam=FALSE)Samples(mydata)PopNames(mydata)
read.Structure Read Genotypes and Other Data from a Structure File
Description
read.Structure creates a genambig object by reading a text file formatted for the software Struc-ture. Ploidies and PopInfo (if available) are also written to the object, and data from additionalcolumns can optionally be extracted as well.
Usage
read.Structure(infile, ploidy, missingin = -9, sep = "\t",markernames = TRUE, labels = TRUE, extrarows = 1,popinfocol = 1, extracols = 1, getexcols = FALSE)
Arguments
infile Character string. The file path to be read.ploidy Integer. The ploidy of the file, i.e. how many rows there are for each individual.missingin The symbol used to represent missing data in the Structure file.sep The character used to delimit the fields of the Structure file (tab by default).markernames Boolean, indicating whether the file has a header containing marker names.labels Boolean, indicating whether the file has a column containing sample names.extrarows Integer. The number of extra rows that the file has, not counting marker names.
This could include rows for recessive alleles, inter-marker distances, or phaseinformation.
popinfocol Integer. The column number (after the labels column, if present) where the datato be used for PopInfo are stored. Can be NA to indicate that PopInfo shouldnot be extracted from the file.
extracols Integer. The number of extra columns that the file has, not counting samplenames (labels) but counting the column to be used for PopInfo. This couldinclude PopData, PopFlag, LocData, Phenotype, or any other extra columns.
getexcols Boolean, indicating whether the function should return the data from any extracolumns.
68 read.Structure
Details
The current version of read.Structure does not support the ONEROWPERIND option in thefile format. Each locus must only have one column. If your data are in ONEROWPERIND for-mat, it should be fairly simple to manipulate it in a spreadsheet program so that it can be read byread.GeneMapper instead.
read.Structure uses read.table to initially read the file into a data frame, then extracts informa-tion from the data frame. Because of this, any header rows (particularly the one containing markernames) should have leading tabs (or spaces if sep=" ") so that the marker names align correctlywith their corresponding genotypes. You should be able to open the file in a spreadsheet programand have everything align correctly.
If the file does not contain sample names, set labels=FALSE. The samples will be numbered instead,and if you like you can use the Samples<- function to edit the sample names of the genotype objectafter import. Likewise, if markernames=FALSE, the loci will be numbered automatically by thecolumn names that read.table creates, but these can also be edited after the fact.
The Ploidies slot of the "genambig" object that is created is initially indexed by both sample andlocus, with ploidy being written to the slot on a per-genotype basis. After all genotypes have beenimported, reformatPloidies is used to convert Ploidies to the simplest possible format beforethe object is returned.
Value
If getexcols=FALSE, the function returns only a genambig object.
If getexcols=TRUE, the function returns a list with two elements. The first, named ExtraCol, is adata frame, where the row names are the sample names and each column is one of the extra columnsfrom the file (but with each sample only once instead of being repeated ploidy number of times).The second element is named Dataset and is the genotype object described above.
Author(s)
Lindsay V. Clark
References
http://pritch.bsd.uchicago.edu/structure_software/release_versions/v2.3.3/structure_doc.pdf
Hubisz, M. J., Falush, D., Stephens, M. and Pritchard, J. K. (2009) Inferring weak populationstructure with the assistance of sample group information. Molecular Ecology Resources 9, 1322–1332.
Falush, D., Stephens, M. and Pritchard, J. K. (2007) Inferences of population structure using multi-locus genotype data: dominant markers and null alleles. Molecular Ecology Notes 7, 574–578.
See Also
write.Structure, read.GeneMapper, read.Tetrasat, read.ATetra, read.GenoDive, read.SPAGeDi,read.POPDIST, read.STRand
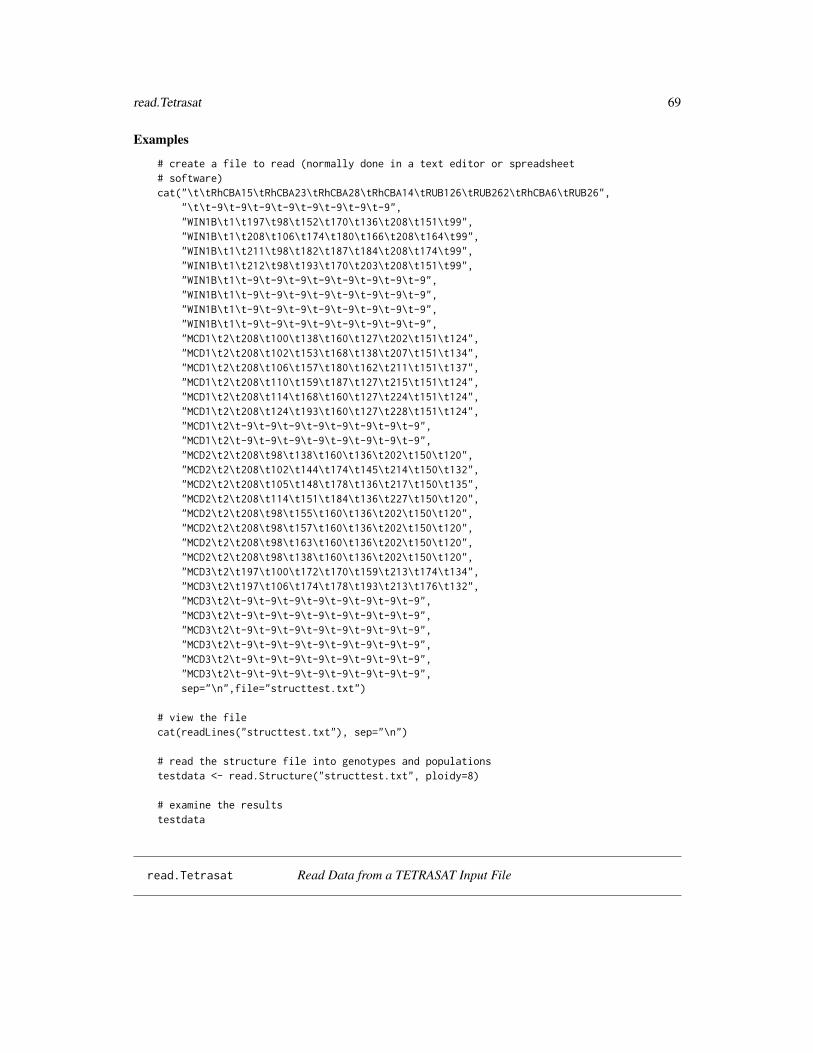
read.Tetrasat 69
Examples
# create a file to read (normally done in a text editor or spreadsheet# software)cat("\t\tRhCBA15\tRhCBA23\tRhCBA28\tRhCBA14\tRUB126\tRUB262\tRhCBA6\tRUB26",
"\t\t-9\t-9\t-9\t-9\t-9\t-9\t-9\t-9","WIN1B\t1\t197\t98\t152\t170\t136\t208\t151\t99","WIN1B\t1\t208\t106\t174\t180\t166\t208\t164\t99","WIN1B\t1\t211\t98\t182\t187\t184\t208\t174\t99","WIN1B\t1\t212\t98\t193\t170\t203\t208\t151\t99","WIN1B\t1\t-9\t-9\t-9\t-9\t-9\t-9\t-9\t-9","WIN1B\t1\t-9\t-9\t-9\t-9\t-9\t-9\t-9\t-9","WIN1B\t1\t-9\t-9\t-9\t-9\t-9\t-9\t-9\t-9","WIN1B\t1\t-9\t-9\t-9\t-9\t-9\t-9\t-9\t-9","MCD1\t2\t208\t100\t138\t160\t127\t202\t151\t124","MCD1\t2\t208\t102\t153\t168\t138\t207\t151\t134","MCD1\t2\t208\t106\t157\t180\t162\t211\t151\t137","MCD1\t2\t208\t110\t159\t187\t127\t215\t151\t124","MCD1\t2\t208\t114\t168\t160\t127\t224\t151\t124","MCD1\t2\t208\t124\t193\t160\t127\t228\t151\t124","MCD1\t2\t-9\t-9\t-9\t-9\t-9\t-9\t-9\t-9","MCD1\t2\t-9\t-9\t-9\t-9\t-9\t-9\t-9\t-9","MCD2\t2\t208\t98\t138\t160\t136\t202\t150\t120","MCD2\t2\t208\t102\t144\t174\t145\t214\t150\t132","MCD2\t2\t208\t105\t148\t178\t136\t217\t150\t135","MCD2\t2\t208\t114\t151\t184\t136\t227\t150\t120","MCD2\t2\t208\t98\t155\t160\t136\t202\t150\t120","MCD2\t2\t208\t98\t157\t160\t136\t202\t150\t120","MCD2\t2\t208\t98\t163\t160\t136\t202\t150\t120","MCD2\t2\t208\t98\t138\t160\t136\t202\t150\t120","MCD3\t2\t197\t100\t172\t170\t159\t213\t174\t134","MCD3\t2\t197\t106\t174\t178\t193\t213\t176\t132","MCD3\t2\t-9\t-9\t-9\t-9\t-9\t-9\t-9\t-9","MCD3\t2\t-9\t-9\t-9\t-9\t-9\t-9\t-9\t-9","MCD3\t2\t-9\t-9\t-9\t-9\t-9\t-9\t-9\t-9","MCD3\t2\t-9\t-9\t-9\t-9\t-9\t-9\t-9\t-9","MCD3\t2\t-9\t-9\t-9\t-9\t-9\t-9\t-9\t-9","MCD3\t2\t-9\t-9\t-9\t-9\t-9\t-9\t-9\t-9",sep="\n",file="structtest.txt")
# view the filecat(readLines("structtest.txt"), sep="\n")
# read the structure file into genotypes and populationstestdata <- read.Structure("structtest.txt", ploidy=8)
# examine the resultstestdata
read.Tetrasat Read Data from a TETRASAT Input File
70 read.Tetrasat
Description
Given a file containing genotypes in the TETRASAT format, read.Tetrasat produces a genambigobject containing genotypes and population identities from the file.
Usage
read.Tetrasat(infile)
Arguments
infile A character string of the file path to be read.
Details
read.Tetrasat reads text files that are in the exact format specified by the software TETRASATand TETRA (see references for more information). This is similar to the file format for GenePopbut allows for up to four alleles per locus. All alleles must be coded by two digits. Anotherdifference between the TETRASAT and GenePop formats is that in TETRASAT the sample nameand genotypes are not separated by a comma, because the columns of data have fixed widths.
Since TETRASAT files also contain information about which samples belong to which populations,this information is put into the PopInfo slot of the genambig object. Population names are not takenfrom the file. The Ploidies slot is filled with the number 4 (using the "ploidyone" class), becauseall individuals should be tetraploid. The first line of the file is put into the Description slot.
Locus names should not contain the letters "pop", uppercase or lowercase, adjacent to each other.
Value
A genambig object containing data from the file.
Author(s)
Lindsay V. Clark
References
http://markwith.freehomepage.com/tetrasat.html
Markwith, S. H., Stewart, D. J. and Dyer, J. L. (2006) TETRASAT: a program for the populationanalysis of allotetraploid microsatellite data. Molecular Ecology Notes 6, 586-589.
http://ecology.bnu.edu.cn/zhangdy/TETRA/TETRA.htm
Liao, W. J., Zhu, B. R., Zeng, Y. F. and Zhang, D. Y. (2008) TETRA: an improved program forpopulation genetic analysis of allotetraploid microsatellite data. Molecular Ecology Resources 8,1260–1262.
See Also
read.GeneMapper, write.Tetrasat, read.ATetra, read.GenoDive, read.Structure, read.SPAGeDi,read.POPDIST, read.STRand
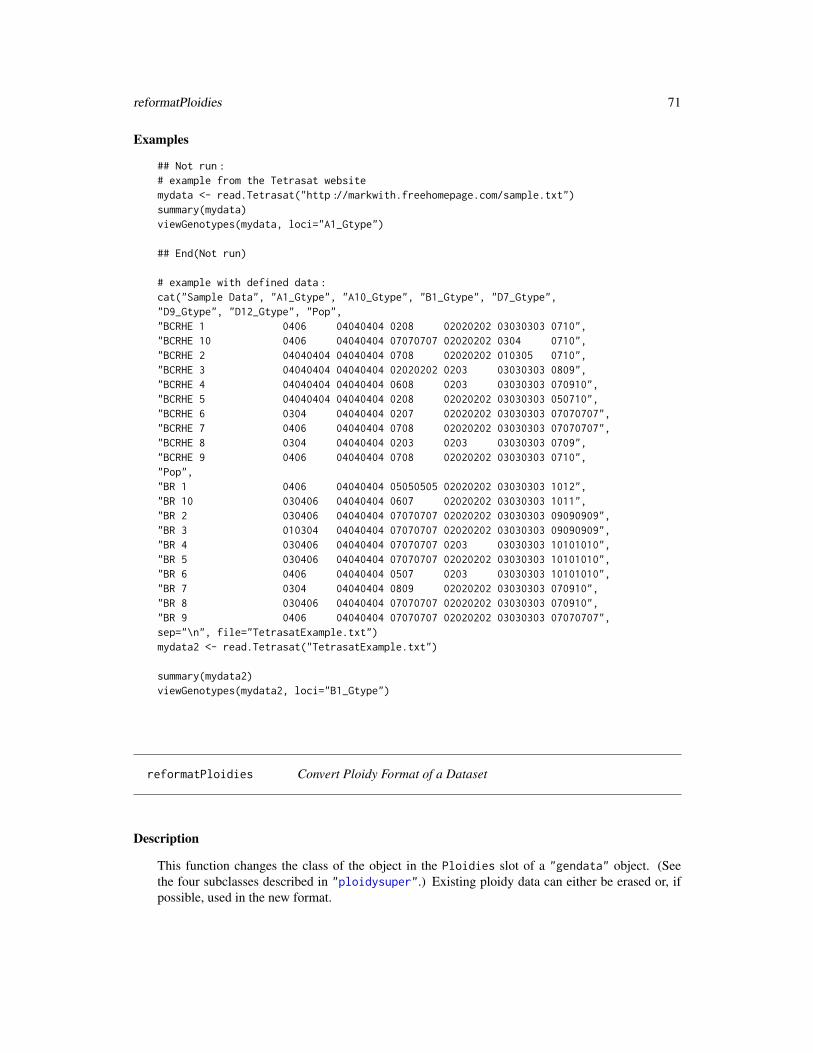
reformatPloidies 71
Examples
## Not run:# example from the Tetrasat websitemydata <- read.Tetrasat("http://markwith.freehomepage.com/sample.txt")summary(mydata)viewGenotypes(mydata, loci="A1_Gtype")
## End(Not run)
# example with defined data:cat("Sample Data", "A1_Gtype", "A10_Gtype", "B1_Gtype", "D7_Gtype","D9_Gtype", "D12_Gtype", "Pop","BCRHE 1 0406 04040404 0208 02020202 03030303 0710","BCRHE 10 0406 04040404 07070707 02020202 0304 0710","BCRHE 2 04040404 04040404 0708 02020202 010305 0710","BCRHE 3 04040404 04040404 02020202 0203 03030303 0809","BCRHE 4 04040404 04040404 0608 0203 03030303 070910","BCRHE 5 04040404 04040404 0208 02020202 03030303 050710","BCRHE 6 0304 04040404 0207 02020202 03030303 07070707","BCRHE 7 0406 04040404 0708 02020202 03030303 07070707","BCRHE 8 0304 04040404 0203 0203 03030303 0709","BCRHE 9 0406 04040404 0708 02020202 03030303 0710","Pop","BR 1 0406 04040404 05050505 02020202 03030303 1012","BR 10 030406 04040404 0607 02020202 03030303 1011","BR 2 030406 04040404 07070707 02020202 03030303 09090909","BR 3 010304 04040404 07070707 02020202 03030303 09090909","BR 4 030406 04040404 07070707 0203 03030303 10101010","BR 5 030406 04040404 07070707 02020202 03030303 10101010","BR 6 0406 04040404 0507 0203 03030303 10101010","BR 7 0304 04040404 0809 02020202 03030303 070910","BR 8 030406 04040404 07070707 02020202 03030303 070910","BR 9 0406 04040404 07070707 02020202 03030303 07070707",sep="\n", file="TetrasatExample.txt")mydata2 <- read.Tetrasat("TetrasatExample.txt")
summary(mydata2)viewGenotypes(mydata2, loci="B1_Gtype")
reformatPloidies Convert Ploidy Format of a Dataset
Description
This function changes the class of the object in the Ploidies slot of a "gendata" object. (Seethe four subclasses described in "ploidysuper".) Existing ploidy data can either be erased or, ifpossible, used in the new format.

72 reformatPloidies
Usage
reformatPloidies(object, output = "collapse", na.rm = FALSE, erase = FALSE)
Arguments
object A "gendata" object.
output A character string indicating the desired result of the conversion: "matrix"if ploidies should be indexed by both sample and locus, "sample" if ploidiesshould be indexed only by sample, "locus" if ploidies should be indexed onlyby locus, "one" if there should be one ploidy for the entire dataset, or "collapse"if ploidies should be converted to the simplest possible format.
na.rm Boolean. If FALSE, NA is treated as a unique ploidy. If TRUE, NA values areignored assuming that each sample and/or locus has only one ploidy otherwise.This argument is passed directly to plCollapse.
erase Boolean. If TRUE, the new Ploidies slot is simply filled with NA instead ofexisting ploidy values from object.
Details
This is a versatile function that can accomplish several tasks relating to the format of ploidies in thedataset:
If you wish to change how ploidy is indexed, but don’t care about keeping any data in the Ploidiesslot, set erase=TRUE and output to "matrix", "sample", "locus", or "one".
If you wish to keep ploidy data while moving from a simpler format to a more complex format (i.e.from "one" to any other format, or from "sample" or "locus" to "matrix"), leave erase=FALSEand set output to the desired format. Existing data will be duplicated to fill out the new format.For example, if ploidies were indexed by sample and you change to matrix format, the ploidy thathad previously been recorded for each sample will be duplicated for each locus.
If you wish to keep ploidy data while performing any other format conversions (e.g. "matrix" to"sample" or "sample" to "locus"), the function will check that there is one unique ploidy foreach sample, locus, or the entire dataset (as appropriate), and will produce an error if the conversioncannot be done without a loss of information.
If you wish to keep ploidy data and convert to the simplest possible format, set output="collapse".The function will automatically determine the simplest format for conversion without loss of data.(The read functions in polysat that take ploidy data from the input file use this option.)
Value
A "gendata" object that is a copy of object but with the Ploidies slot converted to a new class.
Author(s)
Lindsay V. Clark
See Also
plCollapse, "ploidysuper"
simgen 73
Examples
# Make a new "genambig" object for this exampletestdata <- new("genambig")Ploidies(testdata)
## If you need to reformat before you have entered any ploidy## information:
# convert from matrix to sample formattestdata <- reformatPloidies(testdata, output="sample")Ploidies(testdata)
## If you have entered ploidy information but realized you can use a## simpler format:
# Enter some ploidiesPloidies(testdata)[1] <- 2Ploidies(testdata)
# Convert from "sample" to "one" with na.rm=TRUEtestdata <- reformatPloidies(testdata, na.rm=TRUE, output="one")Ploidies(testdata)
## If you change your mind and want to go back to a more complex format
# Convert from "one" to "locus"testdata <- reformatPloidies(testdata, output="locus")Ploidies(testdata)
simgen Randomly Generated Data for Learning polysat
Description
genambig object containing simulated data from three populations with 100 individuals each, atthree loci. Individuals are a random mixture of diploids and tetraploids. Genotypes were generatedaccording to pre-set allele frequencies.
Usage
data(simgen)
Format
A genambig object with data in the Genotypes, PopInfo, PopNames, Ploidies and Usatnts slots.This is saved as an .RData file. simgen was created using the code found in the “simgen.R” file inthe “extdata” directory of the polysat package installation. This code may be useful for inspirationon how to create a simulated dataset.

74 simpleFreq
Source
simulated data
See Also
testgenotypes, genambig
simpleFreq Simple Allele Frequency Estimator
Description
Given genetic data, allele frequencies by population are calculated. This estimation method assumespolysomic inheritance. For genotypes with allele copy number ambiguity, all alleles are assumedto have an equal chance of being present in multiple copies. This function is best used to generateinitial values for more complex allele frequency estimation methods.
Usage
simpleFreq(object, samples = Samples(object), loci = Loci(object))
Arguments
object A genbinary or genambig object containing genotype data. No NA values are al-lowed for PopInfo(object)[samples] or Ploidies(object,samples,loci).(Population identity and ploidy are needed for allele frequency calculation.)
samples An optional character vector of samples to include in the calculation.loci An optional character vector of loci to include in the calculation.
Details
If object is of class genambig, it is converted to a genbinary object before allele frequency calcu-lations take place. Everything else being equal, the function will work more quickly if it is suppliedwith a genbinary object.
For each sample*locus, a conversion factor is generated that is the ploidy of the sample (and/orlocus) as specified in Ploidies(object) divided by the number of alleles that the sample has atthat locus. Each allele is then considered to be present in as many copies as the conversion factor(note that this is not necessarily an integer). The number of copies of an allele is totaled for thepopulation and is divided by the total number of genomes in the population (minus missing data atthe locus) in order to calculate allele frequency.
A major assumption of this calculation method is that each allele in a partially heterozygous geno-type has an equal chance of being present in more than one copy. This is almost never true, becausecommon alleles in a population are more likely to be partially homozygous in an individual. Theresult is that the frequency of common alleles is underestimated and the frequency of rare allelesis overestimated. Also note that the level of inbreeding in the population has an effect on the rela-tionship between genotype frequencies and allele frequencies, but is not taken into account in thiscalculation.

simpleFreq 75
Value
Data frame, where each population is in one row. If each sample in object has only one ploidy,the first column of the data frame is called Genomes and contains the number of genomes in eachpopulation. Otherwise, there is a Genomes column for each locus. Each remaining column containsfrequencies for one allele. Columns are named by locus and allele, separated by a period. Rownames are taken from PopNames(object).
Author(s)
Lindsay V. Clark
See Also
genbinary, genambig
Examples
# create a data set for this examplemygen <- new("genambig", samples = paste("ind", 1:6, sep=""),
loci = c("loc1", "loc2"))mygen <- reformatPloidies(mygen, output="sample")Genotypes(mygen, loci="loc1") <- list(c(206),c(208,210),c(204,206,210),
c(196,198,202,208),c(196,200),c(198,200,202,204))Genotypes(mygen, loci="loc2") <- list(c(130,134),c(138,140),c(130,136,140),
c(138),c(136,140),c(130,132,136))PopInfo(mygen) <- c(1,1,1,2,2,2)Ploidies(mygen) <- c(2,2,4,4,2,4)
# calculate allele frequenciesmyfreq <- simpleFreq(mygen)
# look at the resultsmyfreq
# an example where ploidy is indexed by locus insteadmygen2 <- new("genambig", samples = paste("ind", 1:6, sep=""),
loci = c("loc1", "loc2"))mygen2 <- reformatPloidies(mygen2, output="locus")PopInfo(mygen2) <- 1Ploidies(mygen2) <- c(2,4)Genotypes(mygen2, loci="loc1") <- list(c(198), c(200,204), c(200),
c(198,202), c(200), c(202,204))Genotypes(mygen2, loci="loc2") <- list(c(140,144,146), c(138,144),
c(136,138,144,148), c(140),c(140,142,146,150),c(142,148,150))
myfreq2 <- simpleFreq(mygen2)myfreq2

76 viewGenotypes
testgenotypes Rubus Genotype Data for Learning polysat
Description
genambig object containing alleles of 20 Rubus samples at three microsatellite loci.
Usage
data(testgenotypes)
Format
A genambig object with data in the Genotypes, PopInfo, PopNames, and Usatnts slots. This issaved as a .RData file. Population identities are used here to indicate two different species.
Source
Clark and Jasieniuk, unpublished data
See Also
FCRinfo, simgen, genambig
viewGenotypes Print Genotypes to the Console
Description
viewGenotypes prints a tab-delimited table of samples, loci, and alleles to the console so thatgenotypes can be easily viewed.
Usage
viewGenotypes(object, samples = Samples(object), loci = Loci(object))
Arguments
object An object of one of the gendata subclasses, containing genotypes to be viewed.
samples A numerical or character vector indicating which samples to display.
loci A numerical or character vector indicating which loci to display.

write.ATetra 77
Details
viewGenotypes is a generic function with methods for genambig and genbinary objects.
For a genambig object, a header line indicating sample, locus, and allele columns is printed. Geno-types are printed below this. Genotypes are ordered first by locus and second by sample.
For a genbinary object, the presence/absence matrix is printed, organized by locus. After thematrix for one locus is printed, a blank line is inserted and the matrix for the next locus is printed.
Value
No value is returned.
Author(s)
Lindsay V. Clark
See Also
Genotypes
Examples
# create a dataset for this examplemygen <- new("genambig", samples=c("ind1", "ind2", "ind3", "ind4"),
loci=c("locA", "locB"))Genotypes(mygen) <- array(list(c(98, 104, 108), c(100, 104, 110, 114),
c(102, 108, 110), Missing(mygen),c(132, 135), c(138, 141, 147),c(135, 141, 144), c(129, 150)),
dim=c(4,2))
# view the genotypesviewGenotypes(mygen)
write.ATetra Write Genotypes in ATetra Format
Description
write.ATetra uses genotype and population information contained in a genambig object to createa text file of genotypes in the ATetra format.
Usage
write.ATetra(object, samples = Samples(object),loci = Loci(object), file = "")

78 write.ATetra
Arguments
object A genambig object containing the dataset of interest. Genotypes, populationidentities, population names, and the dataset description are used for creatingthe file. Ploidies must be set to 4.
samples A character vector of samples to write to the file. This is a subset of Samples(object).
loci A character vector of loci to write to the file. This is a subset of Loci(object).
file A character string indicating the path and name to which to write the file.
Details
Note that missing data are not allowed in ATetra, although write.ATetra will still process missingdata. When it does so, it leaves all alleles blank in the file for that particular sample and locus, andalso prints a warning indicating which sample and locus had missing data.
Value
A file is written but no value is returned.
Author(s)
Lindsay V. Clark
References
http://www.vub.ac.be/APNA/ATetra_Manual-1-1.pdf
van Puyvelde, K., van Geert, A. and Triest, L. (2010) ATETRA, a new software program to ana-lyze tetraploid microsatellite data: comparison with TETRA and TETRASAT. Molecular EcologyResources 10, 331-334.
See Also
read.ATetra, write.Tetrasat, write.GeneMapper, write.POPDIST
Examples
# set up sample data (usually done by reading files)mysamples <- c("ind1", "ind2", "ind3", "ind4")myloci <- c("loc1", "loc2")mygendata <- new("genambig", samples=mysamples, loci=myloci)mygendata <- reformatPloidies(mygendata, output="one")Genotypes(mygendata, loci="loc1") <- list(c(202,204), c(204),
c(200,206,208,212),c(198,204,208))
Genotypes(mygendata, loci="loc2") <- list(c(78,81,84),c(75,90,93,96,99),c(87), c(-9))
PopInfo(mygendata) <- c(1,2,1,2)PopNames(mygendata) <- c("this pop", "that pop")Ploidies(mygendata) <- 4
write.freq.SPAGeDi 79
Description(mygendata) <- "Example for write.ATetra."
# write an ATetra filewrite.ATetra(mygendata, file="atetratest.txt")
# view the filecat(readLines("atetratest.txt"),sep="\n")
write.freq.SPAGeDi Create a File of Allele Frequencies for SPAGeDi
Description
A table of allele frequencies such as that produced by simpleFreq or deSilvaFreq is used tocalculate average allele frequencies for the entire dataset. These are then written in a format thatcan be read by the software SPAGeDi.
Usage
write.freq.SPAGeDi(freqs, usatnts, file = "", digits = 2,pops = row.names(freqs),
loci = unique(as.matrix(as.data.frame(strsplit(names(freqs), split =".", fixed = TRUE), stringsAsFactors = FALSE))[1, ]))
Arguments
freqs A data frame of population sizes and allele frequencies, such as that producedby simpleFreq or deSilvaFreq. Populations are in rows, and alleles are incolumns. A column is needed containing population sizes in number of genomes;this may either be a single column called “Genomes” or multiple columns namedby the locus and “Genomes”, sepearated by a period. All other columns containallele frequencies. The column names for these should be the locus and alleleseparated by a period.
usatnts An integer vector containing the lengths of the microsatellite repeats for the lociin the table. In most cases, if object is the "gendata" object used to generatefreqs, then you should set usatnts = Usatnts(object). This is needed toconvert allele names in the same way that write.SPAGeDi converts allele names.
file The name of the file to write.
digits The number of digits to use to represent each allele. This should be the sameas that used in write.SPAGeDi, so that allele names are consistent between thetwo files.
pops An optional character vector indicating a subset of populations from the table touse in calculating mean allele frequencies.
loci An optional character vector indicating a subset of loci to write to the file.
80 write.freq.SPAGeDi
Details
For some calculations of inter-individual relatedness and kinship coefficients, SPAGeDi can reada file of allele frequencies to use in the calculation. write.freq.SPAGeDi puts allele frequenciesfrom polysat into this format.
A weighted average of allele frequencies is calculated across all populations (or those specified bypops). The average is weighted by population size as specified in the “Genomes” column of freqs.
Allele names are converted to match those produced by write.SPAGeDi. Alleles are divided bythe numbers in usatnts in order to convert fragment length in nucleotides to repeat numbers. Ifnecessary, 10^(digits-1) is repeatedly subtracted from all alleles until they can be representedusing the right number of digits.
The file produced is tab-delimited and contains two columns per locus. The first column containsthe locus name followed by all allele names, and the second column contains the number of allelesfollowed by the allele frequencies.
Value
A file is written but no value is returned.
Note
SPAGeDi can already estimate allele frequencies in a way that is identical to that of simpleFreq.Therefore, if you have allele frequencies produced by simpleFreq, there is not much sense inexporting them to SPAGeDi. deSilvaFreq, however, is a more advanced and accurate allele fre-quency estimation than what is available in SPAGeDi v1.3. write.freq.SPAGeDi exists primarilyto export allele frequencies from deSilvaFreq.
Author(s)
Lindsay V. Clark
References
http://ebe.ulb.ac.be/ebe/Software_files/manual_SPAGeDi_1-3.pdf
Hardy, O. J. and Vekemans, X. (2002) SPAGeDi: a versatile computer program to analyse spatialgenetic structure at the individual or population levels. Molecular Ecology Notes 2, 618-620.
See Also
write.SPAGeDi, deSilvaFreq
Examples
## Not run:# set up a genambig object to use in this examplemygen <- new("genambig", samples=c(paste("G", 1:30, sep=""),
paste("R", 1:50, sep="")),loci=c("afrY", "ggP"))
PopNames(mygen) <- c("G", "R")

write.GeneMapper 81
PopInfo(mygen) <- c(rep(1, 30), rep(2, 50))mygen <- reformatPloidies(mygen, output="one")Ploidies(mygen) <- 4Usatnts(mygen) <- c(2, 2)
# randomly create genotypes according to pre-set allele frequenciesfor(s in Samples(mygen, populations=1)){
Genotype(mygen, s, "afrY") <-unique(sample(c(140, 142, 146, 150, 152), 4, TRUE,
c(.30, .12, .26, .08, .24)))Genotype(mygen, s, "ggP") <-
unique(sample(c(210, 214, 218, 220, 222), 4, TRUE,c(.21, .13, .27, .07, .32)))
}for(s in Samples(mygen, populations=2)){
Genotype(mygen, s, "afrY") <-unique(sample(c(140, 142, 144, 150, 152), 4, TRUE,
c(.05, .26, .17, .33, .19)))Genotype(mygen, s, "ggP") <-
unique(sample(c(212, 214, 220, 222, 224), 4, TRUE,c(.14, .04, .36, .20, .26)))
}
# write a SPAGeDi filewrite.SPAGeDi(mygen, file="SPAGdataFreqExample.txt")
# calculate allele frequeniesmyfreq <- deSilvaFreq(mygen, self = 0.05)
# write allele frequencies filewrite.freq.SPAGeDi(myfreq, usatnts=Usatnts(mygen),file="SPAGfreqExample.txt")
## End(Not run)
write.GeneMapper Write Genotypes to a Table Similarly to ABI GeneMapper
Description
Given a genambig object, write.GeneMapper writes a text file of a table containing columns forsample name, locus, and alleles.
Usage
write.GeneMapper(object, file = "", samples = Samples(object),loci = Loci(object))
82 write.GeneMapper
Arguments
object A genambig object containing genotype data to write to the file. The Ploidiesslot is used for determining how many allele columns to make.
file Character string. The path to which to write the file.
samples Character vector. Samples to write to the file. This should be a subset ofSamples(object).
loci Character vector. Loci to write to the file. This should be a subset of Loci(object).
Details
Although I do not know of any population genetic software other than polysat that will read thisdata format directly, the ABI GeneMapper Genotypes Table format is a convenient way for the userto store microsatellite genotype data and view it in a text editor or spreadsheet software. Each rowcontains the sample name, locus name, and alleles separated by tabs.
The number of allele columns needed is detected by the maximum value of Ploidies(object,samples,loci).The function will add additional columns if it encounters genotypes with more than this number ofalleles.
write.GeneMapper handles missing data in a very simple way, in that it writes the missing datasymbol directly to the table as though it were an allele. If you want missing data to be representeddifferently in the table, you can open it in spreadsheet software and use find/replace or conditionalformatting to locate missing data.
The file that is produced can be read back into R directly by read.GeneMapper, and therefore maybe a convenient way to backup genotype data for future analysis and manipulation in polysat. (savecan also be used to backup an R object more directly, including population and other information.)This can also enable the user to edit genotype data in spreadsheet software, if the editGenotypesfunction is not sufficient.
Value
A file is written but no value is returned.
Author(s)
Lindsay V. Clark
References
http://www.appliedbiosystems.com/genemapper
See Also
read.GeneMapper, write.Structure, write.GenoDive, write.Tetrasat, write.ATetra, write.POPDIST,write.SPAGeDi, editGenotypes
write.GenoDive 83
Examples
# create a genotype object (usually done by reading a file)mysamples <- c("ind1", "ind2", "ind3", "ind4")myloci <- c("loc1", "loc2")mygendata <- new("genambig", samples=mysamples, loci=myloci)mygendata <- reformatPloidies(mygendata, output="one")Genotypes(mygendata, loci="loc1") <- list(c(202,204), c(204),
c(200,206,208,212),c(198,204,208))
Genotypes(mygendata, loci="loc2") <- list(c(78,81,84),c(75,90,93,96,99),c(87), c(-9))
Ploidies(mygendata) <- 6
# write a GeneMapper filewrite.GeneMapper(mygendata, "exampleGMoutput.txt")
# view the file with read.tableread.table("exampleGMoutput.txt", sep="\t", header=TRUE)
write.GenoDive Write a File in GenoDive Format
Description
write.GenoDive uses data from a genambig object to create a file formatted for the software Gen-oDive.
Usage
write.GenoDive(object, digits = 2, file = "",samples = Samples(object), loci = Loci(object))
Arguments
object A genambig object containing genotypes, ploidies, population identities, mi-crosatellite repeat lengths, and description for the dataset of interest.
digits An integer indicating how many digits to use to represent each allele (usually 2or 3).
file A character string of the file path to which to write.
samples A character vector of samples to include in the file. A subset of Samples(object).
loci A character vector of loci to include in the file. A subset of Loci(object).

84 write.GenoDive
Details
The number of individuals, number of populations, number of loci, and maximum ploidy of thesample are calculated automatically and entered in the second line of the file. If the maximumploidy needs to be reduced by random removal of alleles, it is possible to do this in the softwareGenoDive after importing the data. The genambig object should not have individuals with morealleles than the highest ploidy level listed in its Ploidies slot.
Several steps happen in order to convert alleles to the right format. First, all instances of themissing data symbol are replaced with zero. Alleles are then divided by the numbers providedin Usatnts(object) (and rounded down if necessary) in order to convert them from nucleotides torepeat numbers. If the alleles are still too big to be represented by the number of digits specified,write.GenoDive repeatedly subtracts a number (10^(digits-1); 10 if digits=2) from all allelesat a locus until the alleles are small enough. Alleles are then converted to characters, and a leadingzero is added to an allele if it does not have enough digits. These alleles are concatenated at eachlocus so that each sample*locus genotype is an uninterrupted string of numbers.
Value
A file is written but no value is returned.
Author(s)
Lindsay V. Clark
References
Meirmans, P. G. and Van Tienderen P. H. (2004) GENOTYPE and GENODIVE: two programs forthe analysis of genetic diversity of asexual organisms. Molecular Ecology Notes 4, 792-794.
http://www.bentleydrummer.nl/software/software/GenoDive.html
See Also
read.GenoDive, write.Structure, write.ATetra, write.Tetrasat, write.GeneMapper, write.POPDIST,write.SPAGeDi
Examples
# set up the genotype object (usually done by reading a file)mysamples <- c("Mal", "Inara", "Kaylee", "Simon", "River", "Zoe",
"Wash", "Jayne", "Book")myloci <- c("loc1", "loc2")mygendata <- new("genambig", samples=mysamples, loci=myloci)mygendata <- reformatPloidies(mygendata, output="sample")Genotypes(mygendata, loci="loc1") <- list(c(304,306), c(302,310),
c(306), c(312,314),c(312,314), c(308,310), c(312), c(302,308,310), c(-9))
Genotypes(mygendata, loci="loc2") <- list(c(118,133), c(121,130),c(122,139), c(124,133),
c(118,124), c(121,127), c(124,136), c(124,127,136), c(121,130))Usatnts(mygendata) <- c(2,3)PopNames(mygendata) <- c("Core","Outer Rim")

write.POPDIST 85
PopInfo(mygendata) <- c(2,1,2,1,1,2,2,2,1)Ploidies(mygendata) <- c(2,2,2,2,2,2,2,3,2)Description(mygendata) <- "Serenity crew"
# write files (use file="" to write to the console instead)write.GenoDive(mygendata, digits=2, file="testGenoDive2.txt")write.GenoDive(mygendata, digits=3, file="testGenoDive3.txt")
write.POPDIST Write Genotypes to a POPDIST File
Description
write.POPDIST uses data from a "genambig" object to write a file formatted for the softwarePOPDIST.
Usage
write.POPDIST(object, samples = Samples(object),loci = Loci(object), file = "")
Arguments
object A "genambig" object. Ploidies and PopInfo are required, and if providedUsatnts may be used to convert alleles to repeat number in order to representeach allele with two digits. Locus names and PopNames are used in the file, butsample names are not.
samples An optional character vector of samples to use. Must be a subset of Samples(object).
loci An optional character vector of loci to use. Must be a subset of Loci(object).
file Character string. File path to which to write.
Details
POPDIST is a program that calculates inter-population distance measures, some of which are avail-able for polyploid samples with allele copy number ambiguity. Each population must be of uniformploidy, but different populations may have different ploidies.
Two types of warning messages may be printed by write.POPDIST. The first indicates that a popu-lation contains individuals of more than one ploidy. In this case a file is still written, but POPDISTmay not be able to read it. Separate populations with different ploidies are okay. The second typeof warning indicates that an individual has more alleles than its ploidy level. If this occurs, allelesare randomly removed from the genotype that is written to the file.
If necessary, write.POPDIST converts alleles into a two-digit format, similarly to write.Tetrasat.If the value of any allele for a given locus is greater than 99, the function first checks to see if thelocus has a Usatnts value greater than 1, and if so divides all alleles by this value and rounds down.If the locus still has alleles with more than two digits, a multiple of 10 is subtracted from all alleles.A zero is placed in front of any allele with one digit.

86 write.POPDIST
Value
A file is written but no value is returned.
Author(s)
Lindsay V. Clark
References
http://gbi.agrsci.dk/~bernt/popgen/
Tomiuk, J., Guldbrandtsen, B. and Loeschcke, B. (2009) Genetic similarity of polyploids: a newversion of the computer program POPDIST (version 1.2.0) considers intraspecific genetic differen-tiation. Molecular Ecology Resources 9, 1364-1368.
Guldbrandtsen, B., Tomiuk, J. and Loeschcke, B. (2000) POPDIST version 1.1.1: A program tocalculate population genetic distance and identity measures. Journal of Heredity 91, 178–179.
See Also
read.POPDIST, write.Tetrasat, write.ATetra, write.SPAGeDi, write.GenoDive, write.Structure,write.GeneMapper
Examples
# create a "genambig" object containing the datasetmygen <- new("genambig", samples=c("a", "b", "c", "d"),
loci=c("loc1", "loc27"))mygen <- reformatPloidies(mygen, output="sample")Description(mygen) <- "Some example data for POPDIST"PopInfo(mygen) <- c(1,1,2,2)PopNames(mygen) <- c("Old Orchard Beach", "York Beach")Ploidies(mygen) <- c(2,2,4,4)Usatnts(mygen) <- c(2,2)Genotypes(mygen, loci="loc1") <- list(c(128, 134), c(130),
Missing(mygen), c(126, 128, 132))Genotypes(mygen, loci="loc27") <- list(c(209,211), c(207,217),
c(207,209,215,221), c(211,223))
# write the filewrite.POPDIST(mygen, file="forPOPDIST.txt")
# view the filecat(readLines("forPOPDIST.txt"), sep="\n")

write.SPAGeDi 87
write.SPAGeDi Write Genotypes in SPAGeDi Format
Description
write.SPAGeDi uses data contained in a genambig object to create a file that can be read by thesoftware SPAGeDi. The user controls how the genotypes are formatted, and can provide a dataframe of spatial coordinates for each sample.
Usage
write.SPAGeDi(object, samples = Samples(object),loci = Loci(object), allelesep = "/",digits = 2, file = "",spatcoord = data.frame(X = rep(1, length(samples)),
Y = rep(1, length(samples)),row.names = samples))
Arguments
object A genambig object containing genotypes, ploidies, population identities, andmicrosatellite repeat lengths for the dataset of interest.
samples Character vector. Samples to write to the file. Must be a subset of Samples(object).
loci Character vector. Loci to write to the file. Must be a subset of Loci(object).
allelesep The character that will be used to separate alleles within a genotype. If eachallele should instead be a fixed number of digits, with no characters to delimitalleles, set allelesep = "".
digits Integer. The number of digits used to represent each allele.
file A character string indicating the path to which the file should be written.
spatcoord Data frame. Spatial coordinates of each sample. Column names are used forcolumn names in the file. Row names indicate sample, or if absent it is assumedthat the rows are in the same order as samples.
Details
The Categories column of the SPAGeDi file that is produced contains information from the PopNamesand PopInfo slots of object; the population name for each sample is written to the column.
The first line of the file contains the number of individuals, number of categories, number of spa-tial coordinates, number of loci, number of digits for coding alleles, and maximum ploidy, and isgenerated automatically from the data provided.
The function does not write distance intervals to the file, but instead writes 0 to the second line.
All alleles for a given locus are divided by the Usatnts value for that locus, after all missing datasymbols have been replaced with zeros. If necessary, a multiple of 10 is subtracted from all allelesat a locus in order to get the alleles down to the right number of digits.

88 write.SPAGeDi
If a genotype has fewer alleles than the Ploidies value for that sample and locus, zeros are addedup to the ploidy. If the genotype has more alleles than the ploidy, a random subset of alleles is usedand a warning is printed. If the genotype has only one allele (is fully heterozygous), then that alleleis replicated to the ploidy of the individual. Genotypes are then concatenated into strings, delimitedby allelesep. If allelesep="", leading zeros are first added to alleles as necessary to make themthe right number of digits.
Value
A file is written but no value is returned.
Author(s)
Lindsay V. Clark
References
http://ebe.ulb.ac.be/ebe/Software_files/manual_SPAGeDi_1-3.pdf
Hardy, O. J. and Vekemans, X. (2002) SPAGeDi: a versatile computer program to analyse spatialgenetic structure at the individual or population levels. Molecular Ecology Notes 2, 618–620.
See Also
read.SPAGeDi, write.freq.SPAGeDi, write.GenoDive, write.Structure, write.GeneMapper,write.ATetra, write.Tetrasat, write.POPDIST
Examples
# set up data to write (usually read from a file)mygendata <- new("genambig", samples = c("ind1","ind2","ind3","ind4"),
loci = c("loc1", "loc2"))mygendata <- reformatPloidies(mygendata, output="sample")Genotypes(mygendata, samples="ind1") <- list(c(102,106,108),c(207,210))Genotypes(mygendata, samples="ind2") <- list(c(104),c(204,210))Genotypes(mygendata, samples="ind3") <- list(c(100,102,108),c(201,213))Genotypes(mygendata, samples="ind4") <- list(c(102,112),c(-9))Ploidies(mygendata) <- c(3,2,2,2)Usatnts(mygendata) <- c(2,3)PopNames(mygendata) <- c("A", "B")PopInfo(mygendata) <- c(1,1,2,2)myspatcoord <- data.frame(X=c(27,29,24,30), Y=c(44,41,45,46),
row.names=c("ind1","ind2","ind3","ind4"))
# write a filewrite.SPAGeDi(mygendata, spatcoord = myspatcoord,
file="SpagOutExample.txt")

write.Structure 89
write.Structure Write Genotypes in Structure 2.3 Format
Description
Given a dataset stored in a genambig object, write.Structure produces a text file of the genotypesin a format readable by Structure 2.2 and higher. The user specifies the overall ploidy of the file,while the ploidy of each sample is extracted from the genambig object. PopInfo and other data canoptionally be written to the file as well.
Usage
write.Structure(object, ploidy, file="",samples = Samples(object), loci = Loci(object),writepopinfo = TRUE, extracols = NULL,missingout = -9)
Arguments
object A genambig object containing the data to write to the file. There must be non-NAvalues of Ploidies (and PopInfo if writepopinfo == TRUE) for samples.
ploidy PLOIDY for Structure, i.e. how many rows per individual to write.
file A character string specifying where the file should be written.
samples An optional character vector listing the names of samples to be written to thefile.
loci An optional character vector listing the names of the loci to be written to the file.
writepopinfo TRUE or FALSE, indicating whether to write values from the PopInfo slot ofobject to the file.
extracols An array, with the first dimension names corresponding to samples, of Pop-Data, PopFlag, LocData, Phenotype, or other values to be included in the extracolumns in the file.
missingout The number used to indicate missing data.
Details
Structure 2.2 and higher can process autopolyploid microsatellite data, although 2.3.3 or higher isrecommended for its improvements on polyploid handling. The input format of Structure requiresthat each locus take up one column and that each individual take up as many rows as the parameterPLOIDY. Because of the multiple rows per sample, each sample name must be duplicated, as well asany population, location, or phenotype data. Partially heterozygous genotypes also must have onearbitrary allele duplicated up to the ploidy of the sample, and samples that have a lower ploidy thanthat used in the file (for mixed polyploid data sets) must have a missing data symbol inserted to fillin the extra rows. Additionally, if some samples have more alleles than PLOIDY (if you are usinga lower PLOIDY to save processing time, or if there are extra alleles from scoring errors), some
90 write.Structure
alleles must be randomly removed from the data. write.Structure performs this duplication,insertion, and random deletion of data.
The sample names from samples will be used as row names in the Structure file. Each sample nameshould only be in the vector samples once, because write.Structure will duplicate the samplenames a number of times as dictated by ploidy.
In writing genotypes to the file, write.Structure compares the number of alleles in the genotype,the ploidy of the sample*locus as stored in Ploidies, and the ploidy of the file as stored in ploidy,and does one of six things (for a given sample x and locus loc):
1) If Ploidies(object,x,loc) is greater than or equal to ploidy, and length(Genotype(object, x, loc))is equal to ploidy, the genotype data are used as is.
2) If Ploidies(object,x,loc) is greater than or equal to ploidy, and length(Genotype(object, x, loc))is less than ploidy, the first allele is duplicated as many times as necessary for there to be as manyalleles as ploidy.
3) If Ploidies(object,x,loc) is greater than or equal to ploidy, and length(Genotype(object, x, loc))is greater than ploidy, a random sample of the alleles, without replacement, is used as the genotype.
4) If Ploidies(object,x,loc) is less than ploidy, and length(Genotype(object, x, loc))is equal to Ploidies(object,x,loc), the genotype data are used as is and missing data symbolsare inserted in the extra rows.
5) If Ploidies(object,x,loc) is less than ploidy, and length(Genotype(object, x, loc))is less than Ploidies(object,x,loc), the first allele is duplicated as many times as necessary forthere to be as many alleles as Ploidies(object,x,loc), and missing data symbols are inserted inthe extra rows.
6) If Ploidies(object,x,loc) is less than ploidy, and length(Genotype(object, x, loc)) isgreater than Ploidies(object,x,loc), a random sample, without replacement, of Ploidies(object)[x]alleles is used, and missing data symbols are inserted in the extra rows. (Alleles are removed eventhough there is room for them in the file.)
Two of the header rows that are optional for Structure are written by write.Structure. These are‘Marker Names’, containing the names of loci supplied in gendata, and ‘Recessive Alleles’, whichcontains the missing data symbol once for each locus. This indicates to the program that all allelesare codominant with copy number ambiguity.
The output file requires a few small modifications, done in a text editor or spreadsheet software, inorder to be read by Structure. In the upper left corner the words “rowlabel” and “missing” shouldbe deleted. Likewise the first and second rows for any non-locus columns should be deleted if theextracols argument was used and/or if writepopinfo == TRUE. These should include “PopInfo”and the second dimension names used in extracols, and zeros, respectively.
Value
No value is returned, but instead a file is written at the path specified.
Note
If extracols is a character array, make sure none of the elements contain white space.

write.Structure 91
Author(s)
Lindsay V. Clark
References
http://pritch.bsd.uchicago.edu/structure_software/release_versions/v2.3.3/structure_doc.pdf
Hubisz, M. J., Falush, D., Stephens, M. and Pritchard, J. K. (2009) Inferring weak populationstructure with the assistance of sample group information. Molecular Ecology Resources 9, 1322-1332.
Falush, D., Stephens, M. and Pritchard, J. K. (2007) Inferences of population structure using multi-locus genotype data: dominant markers and null alleles. Molecular Ecology Notes 7, 574-578.
See Also
read.Structure, write.GeneMapper, write.GenoDive, write.SPAGeDi, write.ATetra, write.Tetrasat,write.POPDIST
Examples
# input genotype data (this is usually done by reading a file)mygendata <- new("genambig", samples = c("ind1","ind2","ind3",
"ind4","ind5","ind6"),loci = c("locus1","locus2"))
Genotypes(mygendata) <- array(list(c(100,102,106,108,114,118),c(102,110),c(98,100,104,108,110,112,116),c(102,106,112,118),c(104,108,110),c(-9),c(204),c(206,208,210,212,220,224,226),c(202,206,208,212,214,218),c(200,204,206,208,212),c(-9),c(202,206)),
dim=c(6,2))Ploidies(mygendata) <- c(6,6,6,4,4,4)# Note that some of the above genotypes have more or fewer alleles than# the ploidy of the sample.
# create a vector of sample names to be used. Note that this excludes# ind6.mysamples <- c("ind1","ind2","ind3","ind4","ind5")
# Create an array containing data for additional columns to be written# to the file. You might also prefer to just read this and the ploidies# in from a file.myexcols <- array(data=c(1,2,1,2,1,1,1,0,0,0),dim=c(5,2),
dimnames=list(mysamples, c("PopData","PopFlag")))
# Write the Structure file, with six rows per individual.# Since outfile="", the data will be written to the console instead of a file.write.Structure(mygendata, 6, "", samples = mysamples, writepopinfo = FALSE,
extracols = myexcols)

92 write.Tetrasat
write.Tetrasat Write Genotype Data in Tetrasat Format
Description
Given a genambig object, write.Tetrasat creates a file that can be read by the software Tetrasatand Tetra.
Usage
write.Tetrasat(object, samples = Samples(object),loci = Loci(object), file = "")
Arguments
object A genambig object containing the dataset of interest. Genotypes, populationidentities, microsatellite repeat lengths, and the dataset description of objectare used by the function.
samples A character vector of samples to write to the file. Should be a subset of Samples(object).
loci A character vector of loci to write to the file. Should be a subset of Loci(object).
file A character string indicating the file to which to write.
Details
Tetrasat files are space-delimited text files in which all alleles at a locus are concatenated into astring eight characters long. Population names or numbers are not used in the file, but samples areordered by population, with the line “Pop” delimiting populations.
write.Tetrasat divides each allele by the length of the repeat and rounds down in order to convertalleles to repeat numbers. If necessary, it subtracts a multiple of 10 from all alleles at a locusto make all allele values less than 100, or puts a zero in front of the number if it only has onedigit. If the individual is fully homozygous at a locus, the single allele is repeated four times. Ifany genotype has more than four alleles, write.Tetrasat picks a random sample of four alleleswithout replacement, and prints a warning. Missing data are represented by blank spaces.
Sample names should be a maximum of 20 characters long in order for the file to be read correctlyby Tetrasat or Tetra.
Value
A file is written but no value is returned.
Author(s)
Lindsay V. Clark

write.Tetrasat 93
References
http://markwith.freehomepage.com/tetrasat.html
Markwith, S. H., Stewart, D. J. and Dyer, J. L. (2006) TETRASAT: a program for the populationanalysis of allotetraploid microsatellite data. Molecular Ecology Notes 6, 586-589.
http://ecology.bnu.edu.cn/zhangdy/TETRA/TETRA.htm
Liao, W. J., Zhu, B. R., Zeng, Y. F. and Zhang, D. Y. (2008) TETRA: an improved program forpopulation genetic analysis of allotetraploid microsatellite data. Molecular Ecology Resources 8,1260–1262.
See Also
read.Tetrasat, write.GeneMapper, write.ATetra, write.POPDIST
Examples
# set up sample data (usually done by reading files)mysamples <- c("ind1", "ind2", "ind3", "ind4")myloci <- c("loc1", "loc2")mygendata <- new("genambig", samples = mysamples, loci = myloci)mygendata <- reformatPloidies(mygendata, output="one")Usatnts(mygendata) <- c(2, 3)Genotypes(mygendata, loci="loc1") <- list(c(202,204), c(204),
c(200,206,208,212),c(198,204,208))
Genotypes(mygendata, loci="loc2") <- list(c(78,81,84),c(75,90,93,96,99),c(87), c(-9))
PopInfo(mygendata) <- c(1,2,1,2)Description(mygendata) <- "An example for write.Tetrasat."Ploidies(mygendata) <- 4
# write a Tetrasat filewrite.Tetrasat(mygendata, file="tetrasattest.txt")
# view the filecat(readLines("tetrasattest.txt"),sep="\n")

Index
∗Topic NAmeandist.from.array, 48
∗Topic arithalleleDiversity, 7assignClones, 8Bruvo.distance, 10Bruvo2.distance, 12calcFst, 14estimatePloidy, 21genotypeDiversity, 39Lynch.distance, 47meandist.from.array, 48meandistance.matrix, 50simpleFreq, 74
∗Topic arraycalcFst, 14deSilvaFreq, 17meandist.from.array, 48meandistance.matrix, 50write.freq.SPAGeDi, 79
∗Topic classesgenambig-class, 26genbinary-class, 31gendata-class, 34ploidysuper-class, 55
∗Topic datasetsFCRinfo, 23simgen, 73testgenotypes, 76
∗Topic distributiongenotypeProbs, 41Internal Functions, 43
∗Topic fileread.ATetra, 56read.GeneMapper, 58read.GenoDive, 60read.POPDIST, 61read.SPAGeDi, 63read.STRand, 65
read.Structure, 67read.Tetrasat, 69write.ATetra, 77write.freq.SPAGeDi, 79write.GeneMapper, 81write.GenoDive, 83write.POPDIST, 85write.SPAGeDi, 87write.Structure, 89write.Tetrasat, 92
∗Topic iterationdeSilvaFreq, 17
∗Topic manipdeleteSamples, 15editGenotypes, 20find.missing.gen, 24freq.to.genpop, 25genambig.to.genbinary, 29gendata.to.genind, 37isMissing, 45merge-methods, 52pld, 54reformatPloidies, 71
∗Topic methodsAccessors, 3estimatePloidy, 21merge-methods, 52pld, 54
∗Topic printviewGenotypes, 76
∗Topic symbolmathgenotypeProbs, 41
.G (Internal Functions), 43
.genlist, 18, 43, 52
.genlist (Internal Functions), 43
.indexg (Internal Functions), 43
.ranmul (Internal Functions), 43
.selfmat (Internal Functions), 43
.unal1loc (Internal Functions), 43
94

INDEX 95
[,genambig-method (genambig-class), 26[,genbinary-method (genbinary-class), 31[,gendata-method (gendata-class), 34
Absent (Accessors), 3Absent,genbinary-method
(genbinary-class), 31Absent<- (Accessors), 3Absent<-,genbinary-method
(genbinary-class), 31Accessors, 3, 27, 29, 33, 37alleleDiversity, 7, 41, 44assignClones, 8, 40, 41
Bruvo.distance, 10, 12, 13, 47, 49, 52Bruvo2.distance, 11, 12, 52
calcFst, 14
deleteLoci, 5deleteLoci (deleteSamples), 15deleteLoci,genambig-method
(genambig-class), 26deleteLoci,genbinary-method
(genbinary-class), 31deleteLoci,gendata-method
(gendata-class), 34deleteSamples, 5, 15deleteSamples,genambig-method
(genambig-class), 26deleteSamples,genbinary-method
(genbinary-class), 31deleteSamples,gendata-method
(gendata-class), 34Description (Accessors), 3Description,gendata-method
(gendata-class), 34Description<- (Accessors), 3Description<-,gendata-method
(gendata-class), 34deSilvaFreq, 15, 17, 26, 42, 44, 50, 80
editGenotypes, 5, 20, 82editGenotypes,genambig-method
(genambig-class), 26editGenotypes,genbinary-method
(genbinary-class), 31estimatePloidy, 5, 21, 27estimatePloidy,genambig-method
(genambig-class), 26
estimatePloidy,genbinary-method(genbinary-class), 31
FCRinfo, 23, 76find.missing.gen, 24, 46, 49find.na.dist (meandist.from.array), 48freq.to.genpop, 25, 38
genambig, 17, 22, 30, 33, 37, 59, 74–76genambig-class, 26genambig.to.genbinary, 29, 44genbinary, 17, 22, 30, 37, 75genbinary-class, 31genbinary.to.genambig, 65genbinary.to.genambig
(genambig.to.genbinary), 29gendata, 5, 27, 29, 32, 33, 55, 56gendata-class, 34gendata.to.genind, 26, 37Genotype, 12, 46Genotype (Accessors), 3Genotype,genambig-method
(genambig-class), 26Genotype,genbinary-method
(genbinary-class), 31Genotype<- (Accessors), 3Genotype<-,genambig-method
(genambig-class), 26genotypeDiversity, 8, 9, 39genotypeProbs, 41, 44, 51Genotypes, 77Genotypes (Accessors), 3Genotypes,genambig-method
(genambig-class), 26Genotypes,genbinary-method
(genbinary-class), 31Genotypes<- (Accessors), 3Genotypes<-,genambig-method
(genambig-class), 26Genotypes<-,genbinary-method
(genbinary-class), 31
initialize,genambig-method(genambig-class), 26
initialize,genbinary-method(genbinary-class), 31
initialize,gendata-method(gendata-class), 34
Internal Functions, 43

96 INDEX
isMissing, 5, 24, 45isMissing,genambig-method
(genambig-class), 26isMissing,genbinary-method
(genbinary-class), 31
Loci, 16Loci (Accessors), 3Loci,gendata,missing,missing-method
(gendata-class), 34Loci,gendata,missing,numeric-method
(gendata-class), 34Loci,gendata,numeric,missing-method
(gendata-class), 34Loci,gendata,numeric,numeric-method
(gendata-class), 34Loci<- (Accessors), 3Loci<-,genambig-method
(genambig-class), 26Loci<-,genbinary-method
(genbinary-class), 31Loci<-,gendata-method (gendata-class),
34Lynch.distance, 11, 13, 47, 52
meandist.from.array, 8, 48, 52meandistance.matrix, 8, 11, 12, 39, 47, 49,
50meandistance.matrix2, 8, 12, 13, 39, 42–44meandistance.matrix2
(meandistance.matrix), 50merge (merge-methods), 52merge,genambig,genambig-method
(merge-methods), 52merge,genbinary,genbinary-method
(merge-methods), 52merge,gendata,gendata-method
(merge-methods), 52merge-methods, 52Missing, 12, 46Missing (Accessors), 3Missing,gendata-method (gendata-class),
34Missing<- (Accessors), 3Missing<-,genambig-method
(genambig-class), 26Missing<-,genbinary-method
(genbinary-class), 31
Missing<-,gendata-method(gendata-class), 34
plCollapse, 56, 72plCollapse (pld), 54plCollapse,ploidylocus,logical,logical-method
(ploidysuper-class), 55plCollapse,ploidymatrix,logical,logical-method
(ploidysuper-class), 55plCollapse,ploidyone,logical,logical-method
(ploidysuper-class), 55plCollapse,ploidysample,logical,logical-method
(ploidysuper-class), 55pld, 54, 56pld,ploidylocus-method
(ploidysuper-class), 55pld,ploidymatrix-method
(ploidysuper-class), 55pld,ploidyone-method
(ploidysuper-class), 55pld,ploidysample-method
(ploidysuper-class), 55pld<- (pld), 54pld<-,ploidylocus-method
(ploidysuper-class), 55pld<-,ploidymatrix-method
(ploidysuper-class), 55pld<-,ploidyone-method
(ploidysuper-class), 55pld<-,ploidysample-method
(ploidysuper-class), 55Ploidies, 22, 55Ploidies (Accessors), 3Ploidies,gendata-method
(gendata-class), 34Ploidies<- (Accessors), 3Ploidies<-,gendata-method
(gendata-class), 34ploidylocus, 35ploidylocus-class (ploidysuper-class),
55ploidymatrix, 34ploidymatrix-class (ploidysuper-class),
55ploidyone, 70ploidyone-class (ploidysuper-class), 55ploidysample, 36ploidysample-class (ploidysuper-class),
55

INDEX 97
ploidysuper, 4, 54, 71, 72ploidysuper-class, 55PopInfo (Accessors), 3PopInfo,gendata-method (gendata-class),
34PopInfo<- (Accessors), 3PopInfo<-,gendata-method
(gendata-class), 34PopNames (Accessors), 3PopNames,gendata-method
(gendata-class), 34PopNames<- (Accessors), 3PopNames<-,gendata-method
(gendata-class), 34PopNum (Accessors), 3PopNum,gendata,character-method
(gendata-class), 34PopNum<- (Accessors), 3PopNum<-,gendata,character-method
(gendata-class), 34Present (Accessors), 3Present,genbinary-method
(genbinary-class), 31Present<- (Accessors), 3Present<-,genbinary-method
(genbinary-class), 31
read.ATetra, 56, 59, 61, 62, 65, 66, 68, 70, 78read.GeneMapper, 57, 58, 61, 62, 65, 66, 68,
70, 82read.GenoDive, 57, 59, 60, 62, 65, 66, 68, 70,
84read.POPDIST, 57, 59, 61, 61, 65, 66, 68, 70,
86read.SPAGeDi, 57, 59, 61, 62, 63, 66, 68, 70,
88read.STRand, 57, 59, 61, 62, 65, 65, 68, 70read.Structure, 57, 59, 61, 62, 65, 66, 67,
70, 91read.table, 65, 66read.Tetrasat, 57, 59, 61, 62, 65, 66, 68, 69,
93reformatPloidies, 4, 55, 56, 62, 64, 68, 71
Samples, 16Samples (Accessors), 3Samples,gendata,character,missing-method
(gendata-class), 34
Samples,gendata,character,numeric-method(gendata-class), 34
Samples,gendata,missing,missing-method(gendata-class), 34
Samples,gendata,missing,numeric-method(gendata-class), 34
Samples,gendata,numeric,missing-method(gendata-class), 34
Samples,gendata,numeric,numeric-method(gendata-class), 34
Samples<- (Accessors), 3Samples<-,genambig-method
(genambig-class), 26Samples<-,genbinary-method
(genbinary-class), 31Samples<-,gendata-method
(gendata-class), 34save, 82Shannon (genotypeDiversity), 39simgen, 73, 76simpleFreq, 15, 17, 18, 26, 42, 50, 74Simpson (genotypeDiversity), 39summary,genambig-method
(genambig-class), 26summary,genbinary-method
(genbinary-class), 31summary,gendata-method (gendata-class),
34
testgenotypes, 23, 74, 76
Usatnts, 12Usatnts (Accessors), 3Usatnts,gendata-method (gendata-class),
34Usatnts<- (Accessors), 3Usatnts<-,gendata-method
(gendata-class), 34
viewGenotypes, 5, 21, 76viewGenotypes,genambig-method
(genambig-class), 26viewGenotypes,genbinary-method
(genbinary-class), 31
write.ATetra, 57, 77, 82, 84, 86, 88, 91, 93write.freq.SPAGeDi, 18, 26, 79, 88write.GeneMapper, 59, 78, 81, 84, 86, 88, 91,
93
98 INDEX
write.GenoDive, 61, 82, 83, 86, 88, 91write.POPDIST, 62, 78, 82, 84, 85, 88, 91, 93write.SPAGeDi, 65, 80, 82, 84, 86, 87, 91write.Structure, 68, 82, 84, 86, 88, 89write.Tetrasat, 70, 78, 82, 84, 86, 88, 91, 92