Package 'Peptides'
40
Package ‘Peptides’ March 18, 2018 Version 2.3 Date 2018-03-18 Title Calculate Indices and Theoretical Physicochemical Properties of Protein Sequences URL https://github.com/dosorio/Peptides/ Suggests testthat Description Includes functions to calculate several physicochemical properties and indices for amino- acid sequences as well as to read and plot 'XVG' output files from the 'GROMACS' molecu- lar dynamics package. License GPL-2 LinkingTo Rcpp Imports Rcpp RoxygenNote 6.0.1 NeedsCompilation yes Author Daniel Osorio [aut, cre], Paola Rondon-Villarreal [aut, ths], Rodrigo Torres [aut, ths], J. Sebastian Paez [ctb] Maintainer Daniel Osorio <[email protected]> Repository CRAN Date/Publication 2018-03-18 17:36:57 UTC R topics documented: aaComp ........................................... 2 AAdata ........................................... 4 aaDescriptors ........................................ 9 aIndex ............................................ 10 autoCorrelation ....................................... 11 autoCovariance ....................................... 12 blosumIndices ........................................ 13 1
Transcript of Package 'Peptides'

Package ‘Peptides’March 18, 2018
Version 2.3
Date 2018-03-18
Title Calculate Indices and Theoretical Physicochemical Properties ofProtein Sequences
URL https://github.com/dosorio/Peptides/
Suggests testthat
Description Includes functions to calculate several physicochemical properties and indices for amino-acid sequences as well as to read and plot 'XVG' output files from the 'GROMACS' molecu-lar dynamics package.
License GPL-2
LinkingTo Rcpp
Imports Rcpp
RoxygenNote 6.0.1
NeedsCompilation yes
Author Daniel Osorio [aut, cre],Paola Rondon-Villarreal [aut, ths],Rodrigo Torres [aut, ths],J. Sebastian Paez [ctb]
Maintainer Daniel Osorio <[email protected]>
Repository CRAN
Date/Publication 2018-03-18 17:36:57 UTC
R topics documented:aaComp . . . . . . . . . . . . . . . . . . . . . . . . . . . . . . . . . . . . . . . . . . . 2AAdata . . . . . . . . . . . . . . . . . . . . . . . . . . . . . . . . . . . . . . . . . . . 4aaDescriptors . . . . . . . . . . . . . . . . . . . . . . . . . . . . . . . . . . . . . . . . 9aIndex . . . . . . . . . . . . . . . . . . . . . . . . . . . . . . . . . . . . . . . . . . . . 10autoCorrelation . . . . . . . . . . . . . . . . . . . . . . . . . . . . . . . . . . . . . . . 11autoCovariance . . . . . . . . . . . . . . . . . . . . . . . . . . . . . . . . . . . . . . . 12blosumIndices . . . . . . . . . . . . . . . . . . . . . . . . . . . . . . . . . . . . . . . . 13
1

2 aaComp
boman . . . . . . . . . . . . . . . . . . . . . . . . . . . . . . . . . . . . . . . . . . . . 14charge . . . . . . . . . . . . . . . . . . . . . . . . . . . . . . . . . . . . . . . . . . . . 15crossCovariance . . . . . . . . . . . . . . . . . . . . . . . . . . . . . . . . . . . . . . . 17crucianiProperties . . . . . . . . . . . . . . . . . . . . . . . . . . . . . . . . . . . . . . 18fasgaiVectors . . . . . . . . . . . . . . . . . . . . . . . . . . . . . . . . . . . . . . . . 19hmoment . . . . . . . . . . . . . . . . . . . . . . . . . . . . . . . . . . . . . . . . . . 20hydrophobicity . . . . . . . . . . . . . . . . . . . . . . . . . . . . . . . . . . . . . . . 21instaIndex . . . . . . . . . . . . . . . . . . . . . . . . . . . . . . . . . . . . . . . . . . 25kideraFactors . . . . . . . . . . . . . . . . . . . . . . . . . . . . . . . . . . . . . . . . 26lengthpep . . . . . . . . . . . . . . . . . . . . . . . . . . . . . . . . . . . . . . . . . . 27membpos . . . . . . . . . . . . . . . . . . . . . . . . . . . . . . . . . . . . . . . . . . 28mswhimScores . . . . . . . . . . . . . . . . . . . . . . . . . . . . . . . . . . . . . . . 29mw . . . . . . . . . . . . . . . . . . . . . . . . . . . . . . . . . . . . . . . . . . . . . 30pepdata . . . . . . . . . . . . . . . . . . . . . . . . . . . . . . . . . . . . . . . . . . . 31pI . . . . . . . . . . . . . . . . . . . . . . . . . . . . . . . . . . . . . . . . . . . . . . 32plotXVG . . . . . . . . . . . . . . . . . . . . . . . . . . . . . . . . . . . . . . . . . . 33protFP . . . . . . . . . . . . . . . . . . . . . . . . . . . . . . . . . . . . . . . . . . . . 34readXVG . . . . . . . . . . . . . . . . . . . . . . . . . . . . . . . . . . . . . . . . . . 35stScales . . . . . . . . . . . . . . . . . . . . . . . . . . . . . . . . . . . . . . . . . . . 36tScales . . . . . . . . . . . . . . . . . . . . . . . . . . . . . . . . . . . . . . . . . . . . 37vhseScales . . . . . . . . . . . . . . . . . . . . . . . . . . . . . . . . . . . . . . . . . . 38zScales . . . . . . . . . . . . . . . . . . . . . . . . . . . . . . . . . . . . . . . . . . . 39
Index 40
aaComp Compute the amino acid composition of a protein sequence
Description
This function calculates the amount of amino acids of a particular class and classified as: Tiny,Small, Aliphatic, Aromatic, Non-polar, Polar, Charged, Basic and Acidic based on their size andR-groups using same function implemented in EMBOSS ’pepstat’. The output is a matrix with thenumber and percentage of amino acids of a particular class
Usage
aaComp(seq)
Arguments
seq An amino-acid sequence
Details
Amino acids are zwitterionic molecules with an amine and a carboxyl group present in their struc-ture. Some amino acids possess side chains with specific properties that allow grouping them indifferent ways. The aaComp function classifies amino acids based on their size, side chains, hy-drophobicity, charge and their response to pH 7.

aaComp 3
Value
The output is a matrix with the number and percentage of amino acids of a particular class
• Tiny (A + C + G + S + T)
• Small (A + B + C + D + G + N + P + S + T + V)
• Aliphatic (A + I + L + V)
• Aromatic (F + H + W + Y)
• Non-polar (A + C + F + G + I + L + M + P + V + W + Y)
• Polar (D + E + H + K + N + Q + R + S + T + Z)
• Charged (B + D + E + H + K + R + Z)
• Basic (H + K + R)
• Acidic (B + D + E + Z)
Note
This function was originally written by Alan Bleasby ([email protected]) for the EMBOSS package.Further information: http://emboss.sourceforge.net/apps/cvs/emboss/apps/pepstats.html
References
Rice, Peter, Ian Longden, and Alan Bleasby. "EMBOSS: the European molecular biology opensoftware suite." Trends in genetics 16.6 (2000): 276-277.
Examples
# COMPARED TO PEPSTATS# http://emboss.bioinformatics.nl/cgi-bin/emboss/pepstats# Property Residues Number Mole%# Tiny (A+C+G+S+T) 4 19.048# Small (A+B+C+D+G+N+P+S+T+V) 4 19.048# Aliphatic (A+I+L+V) 5 23.810# Aromatic (F+H+W+Y) 5 23.810# Non-polar (A+C+F+G+I+L+M+P+V+W+Y) 11 52.381# Polar (D+E+H+K+N+Q+R+S+T+Z) 9 42.857# Charged (B+D+E+H+K+R+Z) 8 38.095# Basic (H+K+R) 8 38.095# Acidic (B+D+E+Z) 0 00.000
## AA composition of PDB: 1D9J Cecropin PeptideaaComp(seq= "KWKLFKKIGIGKFLHSAKKFX")
## Output# Number Mole %# Tiny 4 19.048# Small 4 19.048# Aliphatic 5 23.810# Aromatic 5 23.810# NonPolar 11 52.381

4 AAdata
# Polar 9 42.857# Charged 8 38.095# Basic 8 38.095# Acidic 0 0.000
AAdata Properties, scales and indices for the 20 naturally occurring aminoacids from various sources
Description
A list with a collection of properties, scales and indices for the 20 naturally occurring amino acidsfrom various sources.
Usage
data(AAdata)
Format
A list as follows:
• Hydrophobicity The hydrophobicity is an important stabilization force in protein folding; thisforce changes depending on the solvent in which the protein is found.
– Aboderin: Aboderin, A. A. (1971). An empirical hydrophobicity scale for alpha-amino-acids and some of its applications. International Journal of Biochemistry, 2(11), 537-544.
– AbrahamLeo: Abraham D.J., Leo A.J. Hydrophobicity (delta G1/2 cal). Proteins: Struc-ture, Function and Genetics 2:130-152(1987).
– Argos: Argos, P., Rao, J. K., & Hargrave, P. A. (1982). Structural Prediction of Membrane-Bound Proteins. European Journal of Biochemistry, 128(2-3), 565-575.
– BlackMould: Black S.D., Mould D.R. Hydrophobicity of physiological L-alpha aminoacids. Anal. Biochem. 193:72-82(1991).
– BullBreese: Bull H.B., Breese K. Hydrophobicity (free energy of transfer to surface inkcal/mole). Arch. Biochem. Biophys. 161:665-670(1974).
– Casari: Casari, G., & Sippl, M. J. (1992). Structure-derived hydrophobic potential: hy-drophobic potential derived from X-ray structures of globular proteins is able to identifynative folds. Journal of molecular biology, 224(3), 725-732.
– Chothia: Chothia, C. (1976). The nature of the accessible and buried surfaces in proteins.Journal of molecular biology, 105(1), 1-12.
– Cid: Cid, H., Bunster, M., Canales, M., & Gazitua, F. (1992). Hydrophobicity and struc-tural classes in proteins. Protein engineering, 5(5), 373-375.
– Cowan3.4: Cowan R., Whittaker R.G. Hydrophobicity indices at pH 3.4 determined byHPLC. Peptide Research 3:75-80(1990).
– Cowan7.5: Cowan R., Whittaker R.G. Hydrophobicity indices at pH 7.5 determined byHPLC. Peptide Research 3:75-80(1990).

AAdata 5
– Eisenberg: Eisenberg D., Schwarz E., Komarony M., Wall R. Normalized consensushydrophobicity scale. J. Mol. Biol. 179:125-142(1984).
– Engelman: Engelman, D. M., Steitz, T. A., & Goldman, A. (1986). Identifying nonpolartransbilayer helices in amino acid sequences of membrane proteins. Annual review ofbiophysics and biophysical chemistry, 15(1), 321-353.
– Fasman: Fasman, G. D. (Ed.). (1989). Prediction of protein structure and the principlesof protein conformation. Springer.
– Fauchere: Fauchere J.-L., Pliska V.E. Hydrophobicity scale (pi-r). Eur. J. Med. Chem.18:369-375(1983).
– Goldsack: Goldsack, D. E., & Chalifoux, R. C. (1973). Contribution of the free energyof mixing of hydrophobic side chains to the stability of the tertiary structure of proteins.Journal of theoretical biology, 39(3), 645-651.
– Guy: Guy H.R. Hydrophobicity scale based on free energy of transfer (kcal/mole). Bio-phys J. 47:61-70(1985).
– HoppWoods: Hopp T.P., Woods K.R. Hydrophilicity. Proc. Natl. Acad. Sci. U.S.A.78:3824-3828(1981).
– Janin: Janin J. Free energy of transfer from inside to outside of a globular protein. Nature277:491-492(1979).
– Jones: Jones, D. D. (1975). Amino acid properties and side-chain orientation in proteins:a cross correlation approach. Journal of theoretical biology, 50(1), 167-183.
– Juretic: Juretic, D., Lucic, B., Zucic, D., & Trinajstic, N. (1998). Protein transmembranestructure: recognition and prediction by using hydrophobicity scales through preferencefunctions. Theoretical and computational chemistry, 5, 405-445.
– Kidera: Kidera, A., Konishi, Y., Oka, M., Ooi, T., & Scheraga, H. A. (1985). Statisticalanalysis of the physical properties of the 20 naturally occurring amino acids. Journal ofProtein Chemistry, 4(1), 23-55.
– Kuhn: Kuhn, L. A., Swanson, C. A., Pique, M. E., Tainer, J. A., & Getzoff, E. D. (1995).Atomic and residue hydrophilicity in the context of folded protein structures. Proteins:Structure, Function, and Bioinformatics, 23(4), 536-547.
– KyteDoolittle: Kyte J., Doolittle R.F. Hydropathicity. J. Mol. Biol. 157:105-132(1982).– Levitt: Levitt, M. (1976). A simplified representation of protein conformations for rapid
simulation of protein folding. Journal of molecular biology, 104(1), 59-107.– Manavalan: Manavalan P., Ponnuswamy Average surrounding hydrophobicity. P.K. Na-
ture 275:673-674(1978).– Miyazawa: Miyazawa S., Jernigen R.L. Hydrophobicity scale (contact energy derived
from 3D data). Macromolecules 18:534-552(1985).– Parker: Parker J.M.R., Guo D., Hodges R.S. Hydrophilicity scale derived from HPLC
peptide retention times. Biochemistry 25:5425-5431(1986).– Ponnuswamy: Ponnuswamy, P. K. (1993). Hydrophobic charactesristics of folded pro-
teins. Progress in biophysics and molecular biology, 59(1), 57-103.– Prabhakaran: Prabhakaran, M. (1990). The distribution of physical, chemical and con-
formational properties in signal and nascent peptides. Biochem. J, 269, 691-696.– Rao: Rao M.J.K., Argos P. Membrane buried helix parameter. Biochim. Biophys. Acta
869:197-214(1986).– Rose: Rose G.D., Geselowitz A.R., Lesser G.J., Lee R.H., Zehfus M.H. Mean fractional
area loss (f) [average area buried/standard state area]. Science 229:834-838(1985)
6 AAdata
– Roseman: Roseman M.A. Hydrophobicity scale (pi-r). J. Mol. Biol. 200:513-522(1988).– Sweet: Sweet R.M., Eisenberg D. Optimized matching hydrophobicity (OMH). J. Mol.
Biol. 171:479-488(1983).– Tanford: Tanford C. Hydrophobicity scale (Contribution of hydrophobic interactions to
the stability of the globular conformation of proteins). J. Am. Chem. Soc. 84:4240-4274(1962).
– Welling: Welling G.W., Weijer W.J., Van der Zee R., Welling-Wester S. Antigenicityvalue X 10. FEBS Lett. 188:215-218(1985).
– Wilson: Wilson K.J., Honegger A., Stotzel R.P., Hughes G.J. Hydrophobic constantsderived from HPLC peptide retention times. Biochem. J. 199:31-41(1981).
– Wolfenden: Wolfenden R.V., Andersson L., Cullis P.M., Southgate C.C.F. Hydration po-tential (kcal/mole) at 25C. Biochemistry 20:849-855(1981).
– Zimmerman: Zimmerman, J. M., Eliezer, N., & Simha, R. (1968). The characterizationof amino acid sequences in proteins by statistical methods. Journal of theoretical biology,21(2), 170-201.
– interfaceScale_pH8 White, Stephen (2006-06-29). "Experimentally Determined Hydropho-bicity Scales". University of California, Irvine. Retrieved 2017-05-25
– interfaceScale_pH2 White, Stephen (2006-06-29). "Experimentally Determined Hydropho-bicity Scales". University of California, Irvine. Retrieved 2017-05-25
– octanolScale_pH8 White, Stephen (2006-06-29). "Experimentally Determined Hydropho-bicity Scales". University of California, Irvine. Retrieved 2017-05-25
– octanolScale_pH2 White, Stephen (2006-06-29). "Experimentally Determined Hydropho-bicity Scales". University of California, Irvine. Retrieved 2017-05-25
– oiScale_pH8 White, Stephen (2006-06-29). "Experimentally Determined Hydrophobic-ity Scales". University of California, Irvine. Retrieved 2017-05-25
– oiScale_pH2 White, Stephen (2006-06-29). "Experimentally Determined Hydrophobic-ity Scales". University of California, Irvine. Retrieved 2017-05-25
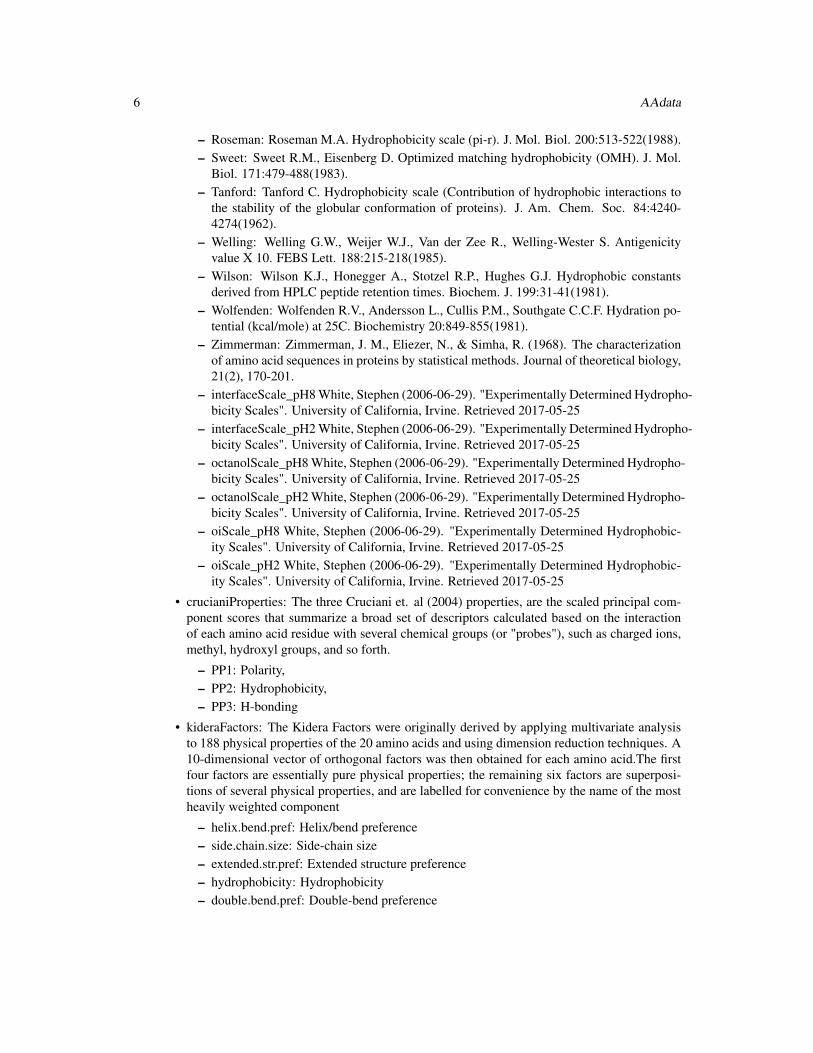
• crucianiProperties: The three Cruciani et. al (2004) properties, are the scaled principal com-ponent scores that summarize a broad set of descriptors calculated based on the interactionof each amino acid residue with several chemical groups (or "probes"), such as charged ions,methyl, hydroxyl groups, and so forth.
– PP1: Polarity,– PP2: Hydrophobicity,– PP3: H-bonding
• kideraFactors: The Kidera Factors were originally derived by applying multivariate analysisto 188 physical properties of the 20 amino acids and using dimension reduction techniques. A10-dimensional vector of orthogonal factors was then obtained for each amino acid.The firstfour factors are essentially pure physical properties; the remaining six factors are superposi-tions of several physical properties, and are labelled for convenience by the name of the mostheavily weighted component
– helix.bend.pref: Helix/bend preference– side.chain.size: Side-chain size– extended.str.pref: Extended structure preference– hydrophobicity: Hydrophobicity– double.bend.pref: Double-bend preference

AAdata 7
– partial.spec.vol: Partial specific volume– flat.ext.pref: Flat extended preference– occurrence.alpha.reg: Occurrence in alpha region– pK.C: pK-C– surrounding.hydrop: Surrounding hydrophobicity
• pK
– Bjellqvist: Bjellqvist, B., Hughes, G.J., Pasquali, Ch., Paquet, N., Ravier, F., Sanchez,J.Ch., Frutige,r S., Hochstrasser D. (1993) The focusing positions of polypeptides in im-mobilized pH gradients can be predicted from their amino acid sequences. Electrophore-sis, 14:1023-1031.
– Dawson: Dawson, R. M. C.; Elliot, D. C.; Elliot, W. H.; Jones, K. M. Data for biochemi-cal research. Oxford University Press, 1989; p. 592.
– EMBOSS: EMBOSS data are from http://emboss.sourceforge.net/apps/release/5.0/emboss/apps/iep.html.– Lehninger: Nelson, D. L.; Cox, M. M. Lehninger Principles of Biochemistry, Fourth
Edition; W. H. Freeman, 2004; p. 1100.– Murray: Murray, R.K., Granner, D.K., Rodwell, V.W. (2006) Harper’s illustrated Bio-
chemistry. 27th edition. Published by The McGraw-Hill Companies.– Rodwell: Rodwell, J. Heterogeneity of component bands in isoelectric focusing patterns.
Analytical Biochemistry, 1982, 119 (2), 440-449.– Sillero: Sillero, A., Maldonado, A. (2006) Isoelectric point determination of proteins and
other macromolecules: oscillating method. Comput Biol Med., 36:157-166.– Solomon: Solomon, T.W.G. (1998) Fundamentals of Organic Chemistry, 5th edition.
Published by Wiley.– Stryer: Stryer L. (1999) Biochemia. czwarta edycja. Wydawnictwo Naukowe PWN.
• zScales The five Sandberg et al. (1998) Z-scales describe each amino acid with numerical val-ues, descriptors, which represent the physicochemical properties of the amino acids includingNMR data and thin-layer chromatography (TLC) data.
– Z1: Lipophilicity– Z2: Steric properties (Steric bulk/Polarizability)– Z3: Electronic properties (Polarity / Charge)– Z4: Related to electronegativity, heat of formation, electrophilicity and hardness.– Z5: Related to electronegativity, heat of formation, electrophilicity and hardness.
• FASGAI Factor Analysis Scale of Generalized Amino Acid Information (FASGAI) proposedby Liang and Li (2007), is a set of amino acid descriptors, that reflects hydrophobicity, alphaand turn propensities, bulky properties, compositional characteristics, local flexibility, andelectronic properties, was derived from multi-dimensional properties of 20 naturally occurringamino acids.
– F1: Hydrophobicity index– F2: Alpha and turn propensities– F3: Bulky properties– F4: Compositional characteristic index– F5: Local flexibility– F6: Electronic properties

8 AAdata
• VHSE The principal components score Vectors of Hydrophobic, Steric, and Electronic prop-erties, is derived from principal components analysis (PCA) on independent families of 18hydrophobic properties, 17 steric properties, and 15 electronic properties, respectively, whichare included in total 50 physicochemical variables of 20 coded amino acids.
– VHSE1 and VHSE2: Hydrophobic properties– VHSE3 and VHSE4: Steric properties– VHSE5 to VHSE8: Electronic properties
Source
• Hydrophobicity
– ExPASy-Protscale (http://web.expasy.org/protscale/)– AAIndex Database (http://www.genome.jp/aaindex/)
• pK
– Kiraga, J. (2008) Analysis and computer simulations of variability of isoelectric point ofproteins in the proteomes. PhD thesis, University of Wroclaw, Poland.
References
• Hydrophobicity
– Nakai, K., Kidera, A., and Kanehisa, M.; Cluster analysis of amino acid indices forprediction of protein structure and function. Protein Eng. 2, 93-100 (1988).
– Tomii, K. and Kanehisa, M.; Analysis of amino acid indices and mutation matrices forsequence comparison and structure prediction of proteins. Protein Eng. 9, 27-36 (1996).
– Kawashima, S., Ogata, H., and Kanehisa, M.; AAindex: amino acid index database.Nucleic Acids Res. 27, 368-369 (1999).
– Kawashima, S. and Kanehisa, M.; AAindex: amino acid index database. Nucleic AcidsRes. 28, 374 (2000).
– Kawashima, S., Pokarowski, P., Pokarowska, M., Kolinski, A., Katayama, T., and Kane-hisa, M.; AAindex: amino acid index database, progress report 2008. Nucleic Acids Res.36, D202-D205 (2008).
• crucianiProperties:
– Cruciani, G., Baroni, M., Carosati, E., Clementi, M., Valigi, R., and Clementi, S. (2004)Peptide studies by means of principal properties of amino acids derived from MIF de-scriptors. J. Chemom. 18, 146-155.
• kideraFactors:
– Kidera, A., Konishi, Y., Oka, M., Ooi, T., & Scheraga, H. A. (1985). Statistical analysisof the physical properties of the 20 naturally occurring amino acids. Journal of ProteinChemistry, 4(1), 23-55.
• pK:
– Aronson, J. N. The Henderson-Hasselbalch equation revisited. Biochemical Education,1983, 11 (2), 68.
– Moore, D. S.. Amino acid and peptide net charges: A simple calculational procedure.Biochemical Education, 1986, 13 (1), 10-12.

aaDescriptors 9
– Goloborodko, A.A.; Levitsky, L.I.; Ivanov, M.V.; and Gorshkov, M.V. (2013) "Pyteomics- a Python Framework for Exploratory Data Analysis and Rapid Software Prototyping inProteomics", Journal of The American Society for Mass Spectrometry, 24(2), 301-304.
– Kiraga, J. (2008) Analysis and computer simulations of variability of isoelectric point ofproteins in the proteomes. PhD thesis, University of Wroclaw, Poland.
• zScales
– Sandberg M, Eriksson L, Jonsson J, Sjostrom M, Wold S: New chemical descriptorsrelevant for the design of biologically active peptides. A multivariate characterization of87 amino acids. J Med Chem 1998, 41:2481-2491.
• FASGAI
– Liang, G., & Li, Z. (2007). Factor analysis scale of generalized amino acid informa-tion as the source of a new set of descriptors for elucidating the structure and activityrelationships of cationic antimicrobial peptides. Molecular Informatics, 26(6), 754-763.
• VHSE
– Mei, H. U., Liao, Z. H., Zhou, Y., & Li, S. Z. (2005). A new set of amino acid descriptorsand its application in peptide QSARs. Peptide Science, 80(6), 775-786.
aaDescriptors Compute 66 descriptors for each amino acid of a protein sequence.
Description
The function return 66 amino acid descriptors for the 20 natural amino acids. Available descriptorsare:
• crucianiProperties: Cruciani, G., Baroni, M., Carosati, E., Clementi, M., Valigi, R., andClementi, S. (2004) Peptide studies by means of principal properties of amino acids derivedfrom MIF descriptors. J. Chemom. 18, 146-155.,
• kideraFactors: Kidera, A., Konishi, Y., Oka, M., Ooi, T., & Scheraga, H. A. (1985). Statisticalanalysis of the physical properties of the 20 naturally occurring amino acids. Journal of ProteinChemistry, 4(1), 23-55.,
• zScales: Sandberg M, Eriksson L, Jonsson J, Sjostrom M, Wold S: New chemical descriptorsrelevant for the design of biologically active peptides. A multivariate characterization of 87amino acids. J Med Chem 1998, 41:2481-2491.,
• FASGAI: Liang, G., & Li, Z. (2007). Factor analysis scale of generalized amino acid in-formation as the source of a new set of descriptors for elucidating the structure and activityrelationships of cationic antimicrobial peptides. Molecular Informatics, 26(6), 754-763.,
• tScales: Tian F, Zhou P, Li Z: T-scale as a novel vector of topological descriptors for aminoacids and its application in QSARs of peptides. J Mol Struct. 2007, 830: 106-115. 10.1016/j.molstruc.2006.07.004.,
• VHSE: VHSE-scales (principal components score Vectors of Hydrophobic, Steric, and Elec-tronic properties), is derived from principal components analysis (PCA) on independent fam-ilies of 18 hydrophobic properties, 17 steric properties, and 15 electronic properties, respec-tively, which are included in total 50 physicochemical variables of 20 coded amino acids.,

10 aIndex
• protFP: van Westen, G. J., Swier, R. F., Wegner, J. K., IJzerman, A. P., van Vlijmen, H. W., &Bender, A. (2013). Benchmarking of protein descriptor sets in proteochemometric modeling(part 1): comparative study of 13 amino acid descriptor sets. Journal of cheminformatics,5(1), 41.,
• stScales: Yang, L., Shu, M., Ma, K., Mei, H., Jiang, Y., & Li, Z. (2010). ST-scale as a novelamino acid descriptor and its application in QSAM of peptides and analogues. Amino acids,38(3), 805-816.,
• BLOSUM: Georgiev, A. G. (2009). Interpretable numerical descriptors of amino acid space.Journal of Computational Biology, 16(5), 703-723.,
• MSWHIM: Zaliani, A., & Gancia, E. (1999). MS-WHIM scores for amino acids: a new3D-description for peptide QSAR and QSPR studies. Journal of chemical information andcomputer sciences, 39(3), 525-533.
Usage
aaDescriptors(seq)
Arguments
seq An amino-acids sequence. If multiple sequences are given all of them must havethe same length (gap symbols are allowed.)
Value
a matrix with 66 amino acid descriptors for each aminoacid in a protein sequence.
Examples
aaDescriptors(seq = "KLKLLLLLKLK")
aIndex Compute the aliphatic index of a protein sequence
Description
This function calculates the Ikai (1980) aliphatic index of a protein. The aindex is defined as therelative volume occupied by aliphatic side chains (Alanine, Valine, Isoleucine, and Leucine). It maybe regarded as a positive factor for the increase of thermostability of globular proteins.
Usage
aIndex(seq)
Arguments
seq An amino-acids sequence

autoCorrelation 11
Details
Aliphatic amino acids (A, I, L and V) are responsible for the thermal stability of proteins. Thealiphatic index was proposed by Ikai (1980) and evaluates the thermostability of proteins based onthe percentage of each of the aliphatic amino acids that build up proteins.
Value
The computed aliphatic index for a given amino-acids sequence
References
Ikai (1980). Thermostability and aliphatic index of globular proteins. Journal of Biochemistry,88(6), 1895-1898.
Examples
# COMPARED TO ExPASy ALIPHATIC INDEX# http://web.expasy.org/protparam/# SEQUENCE: SDKEVDEVDAALSDLEITLE# Aliphatic index: 117.00
aIndex(seq = "SDKEVDEVDAALSDLEITLE")# [1] 117
autoCorrelation Compute the auto-correlation index of a protein sequence
Description
This function computes the Cruciani et al (2004) auto-correlation index. The autoCorrelationindex is calculated for a lag ’d’ using a descriptor ’f’ (centred) over a sequence of length ’L’.
Usage
autoCorrelation(sequence, lag, property, center = TRUE)
Arguments
sequence An amino-acids sequence
lag A value for a lag, the max value is equal to the length of shortest peptide minusone.
property A property to use as value to be correlated.
center A logical value TRUE or FALSE if the property must be centered.
Value
The computed auto-correlation index for a given amino-acids sequence

12 autoCovariance
References
Cruciani, G., Baroni, M., Carosati, E., Clementi, M., Valigi, R., and Clementi, S. (2004) Peptidestudies by means of principal properties of amino acids derived from MIF descriptors. J. Chemom.18, 146-155.
Examples
# Loading a property to evaluate its autocorrelationdata(AAdata)
# Calculate the auto-correlation index for a lag=1autoCorrelation(
sequence = "SDKEVDEVDAALSDLEITLE",lag = 1,property = AAdata$Hydrophobicity$KyteDoolittle,center = TRUE
)# [1] -0.3519908
# Calculate the auto-correlation index for a lag=5autoCorrelation(
sequence = "SDKEVDEVDAALSDLEITLE",lag = 5,property = AAdata$Hydrophobicity$KyteDoolittle,center = TRUE
)# [1] 0.001133553
autoCovariance Compute the auto-covariance index of a protein sequence
Description
This function computes the Cruciani et al (2004) auto-corvariance index. The autoCovarianceindex is calculated for a lag ’d’ using a descriptor ’f’ (centred) over a sequence of length ’L’.
Usage
autoCovariance(sequence, lag, property, center = TRUE)
Arguments
sequence An amino-acids sequence
lag A value for a lag, the max value is equal to the length of the shortest peptideminus one.
property A property to use as value to evaluate the covariance.
center A logical value TRUE or FALSE if the property must be centered.

blosumIndices 13
Value
The computed auto-covariance index for a given amino-acids sequence
References
Cruciani, G., Baroni, M., Carosati, E., Clementi, M., Valigi, R., and Clementi, S. (2004) Peptidestudies by means of principal properties of amino acids derived from MIF descriptors. J. Chemom.18, 146-155.
Examples
# Loading a property to evaluate its autocorrelationdata(AAdata)
# Calculate the auto-covariance index for a lag=1autoCovariance(
sequence = "SDKEVDEVDAALSDLEITLE",lag = 1,property = AAdata$Hydrophobicity$KyteDoolittle,center = TRUE
)# [1] -0.4140053
# Calculate the auto-covariance index for a lag=5autoCovariance(
sequence = "SDKEVDEVDAALSDLEITLE",lag = 5,property = AAdata$Hydrophobicity$KyteDoolittle,center = TRUE
)# [1] 0.001000336
blosumIndices Compute the BLOSUM62 derived indices of a protein sequence
Description
BLOSUM indices were derived of physicochemical properties that have been subjected to a VARI-MAX analyses and an alignment matrix of the 20 natural AAs using the BLOSUM62 matrix.
Usage
blosumIndices(seq)
Arguments
seq An amino-acids sequence

14 boman
Value
The computed average of BLOSUM indices of all the amino acids in the corresponding peptidesequence.
References
Georgiev, A. G. (2009). Interpretable numerical descriptors of amino acid space. Journal of Com-putational Biology, 16(5), 703-723.
Examples
blosumIndices(seq = "KLKLLLLLKLK")# [[1]]# BLOSUM1 BLOSUM2 BLOSUM3 BLOSUM4 BLOSUM5# -0.4827273 -0.5618182 -0.8509091 -0.4172727 0.3172727
# BLOSUM6 BLOSUM7 BLOSUM8 BLOSUM9 BLOSUM10# 0.2527273 0.1463636 0.1427273 -0.2145455 -0.3218182
boman Compute the Boman (Potential Protein Interaction) index
Description
This function computes the potential protein interaction index proposed by Boman (2003) basedin the amino acid sequence of a protein. The index is equal to the sum of the solubility values forall residues in a sequence, it might give an overall estimate of the potential of a peptide to bind tomembranes or other proteins as receptors, to normalize it is divided by the number of residues. Aprotein have high binding potential if the index value is higher than 2.48.
Usage
boman(seq)
Arguments
seq An amino-acid sequence
Details
The potential protein interaction index was proposed by Boman (2003) as an easy way to differ-entiate the action mechanism of hormones (protein-protein) and antimicrobial peptides (protein-membrane) through this index. This function predicts the potential peptide interaction with anotherprotein.
Value
The computed potential protein-protein interaction for a given amino-acids sequence

charge 15
References
Boman, H. G. (2003). Antibacterial peptides: basic facts and emerging concepts. Journal of InternalMedicine, 254(3), 197-215.
Examples
# COMPARED TO YADAMP DATABASE# http://yadamp.unisa.it/showItem.aspx?yadampid=845&x=0,4373912# SEQUENCE: FLPVLAGLTPSIVPKLVCLLTKKC# BOMAN INDEX -1.24
boman(seq= "FLPVLAGLTPSIVPKLVCLLTKKC")# [1] -1.235833
charge Compute the theoretical net charge of a protein sequence
Description
This function computes the net charge of a protein sequence based on the Henderson-Hasselbalchequation described by Moore, D. S. (1985). The net charge can be calculated at defined pH usingone of the 9 pKa scales availables: Bjellqvist, Dawson, EMBOSS, Lehninger, Murray, Rodwell,Sillero, Solomon or Stryer.
Usage
charge(seq, pH = 7, pKscale = "Lehninger")
Arguments
seq An amino-acids sequence
pH A pH value
pKscale A character string specifying the pKa scale to be used; must be one of "Bjellqvist","Dawson", "EMBOSS", "Lehninger", "Murray", "Rodwell", "Sillero", "Solomon"or "Stryer"
References
Kiraga, J. (2008) Analysis and computer simulations of variability of isoelectric point of proteinsin the proteomes. PhD thesis, University of Wroclaw, Poland.
Bjellqvist, B., Hughes, G.J., Pasquali, Ch., Paquet, N., Ravier, F., Sanchez, J.Ch., Frutige,r S.,Hochstrasser D. (1993) The focusing positions of polypeptides in immobilized pH gradients can bepredicted from their amino acid sequences. Electrophoresis, 14:1023-1031.
Dawson, R. M. C.; Elliot, D. C.; Elliot, W. H.; Jones, K. M. Data for biochemical research. OxfordUniversity Press, 1989; p. 592.

16 charge
EMBOSS data are from http://emboss.sourceforge.net/apps/release/5.0/emboss/apps/iep.html.
Nelson, D. L.; Cox, M. M. Lehninger Principles of Biochemistry, Fourth Edition; W. H. Freeman,2004; p. 1100.
Murray, R.K., Granner, D.K., Rodwell, V.W. (2006) Harper’s illustrated Biochemistry. 27th edition.Published by The McGraw-Hill Companies.
Rodwell, J. Heterogeneity of component bands in isoelectric focusing patterns. Analytical Bio-chemistry, 1982, 119 (2), 440-449.
Sillero, A., Maldonado, A. (2006) Isoelectric point determination of proteins and other macro-molecules: oscillating method. Comput Biol Med., 36:157-166.
Solomon, T.W.G. (1998) Fundamentals of Organic Chemistry, 5th edition. Published by Wiley.
Stryer L. (1999) Biochemia. czwarta edycja. Wydawnictwo Naukowe PWN.
Examples
# COMPARED TO EMBOSS PEPSTATS# http://emboss.bioinformatics.nl/cgi-bin/emboss/pepstats# SEQUENCE: FLPVLAGLTPSIVPKLVCLLTKKC# Charge = 3.0
charge(seq= "FLPVLAGLTPSIVPKLVCLLTKKC",pH= 7, pKscale= "Bjellqvist")# [1] 2.737303charge(seq= "FLPVLAGLTPSIVPKLVCLLTKKC",pH= 7, pKscale= "EMBOSS")# [1] 2.914112charge(seq= "FLPVLAGLTPSIVPKLVCLLTKKC",pH= 7, pKscale= "Murray")# [1] 2.907541charge(seq= "FLPVLAGLTPSIVPKLVCLLTKKC",pH= 7, pKscale= "Sillero")# [1] 2.919812charge(seq= "FLPVLAGLTPSIVPKLVCLLTKKC",pH= 7, pKscale= "Solomon")# [1] 2.844406charge(seq= "FLPVLAGLTPSIVPKLVCLLTKKC",pH= 7, pKscale= "Stryer")# [1] 2.876504charge(seq= "FLPVLAGLTPSIVPKLVCLLTKKC",pH= 7, pKscale= "Lehninger")# [1] 2.87315charge(seq= "FLPVLAGLTPSIVPKLVCLLTKKC",pH= 7, pKscale= "Dawson")# [1] 2.844406charge(seq= "FLPVLAGLTPSIVPKLVCLLTKKC",pH= 7, pKscale= "Rodwell")# [1] 2.819755
# COMPARED TO YADAMP# http://yadamp.unisa.it/showItem.aspx?yadampid=845&x=0,7055475# SEQUENCE: FLPVLAGLTPSIVPKLVCLLTKKC# CHARGE pH5: 3.00# CHARGE pH7: 2.91# CHARGE pH9: 1.09charge(seq= "FLPVLAGLTPSIVPKLVCLLTKKC",pH= 5, pKscale= "EMBOSS")# [1] 3.037398charge(seq= "FLPVLAGLTPSIVPKLVCLLTKKC",pH= 7, pKscale= "EMBOSS")# [1] 2.914112charge(seq= "FLPVLAGLTPSIVPKLVCLLTKKC",pH= 9, pKscale= "EMBOSS")# [1] 0.7184524

crossCovariance 17
# JUST ONE COMMANDcharge(seq= "FLPVLAGLTPSIVPKLVCLLTKKC",pH= seq(from = 5,to = 9,by = 2), pKscale= "EMBOSS")# [1] 3.0373984 2.9141123 0.7184524
crossCovariance Compute the cross-covariance index of a protein sequence
Description
This function computes the Cruciani et al (2004) cross-covariance index. The lagged crossCovarianceindex is calculated for a lag ’d’ using two descriptors ’f1’ and ’f2’ (centred) over a sequence oflength ’L’.
Usage
crossCovariance(sequence, lag, property1, property2, center = TRUE)
Arguments
sequence An amino-acids sequence
lag A value for a lag, the max value is equal to the length of the shortest peptideminus one.
property1 A property to use as value to evaluate the cross-covariance.
property2 A property to use as value to evaluate the cross-covariance.
center A logical value TRUE or FALSE if the property must be centered.
Value
The computed cross-covariance index for a given amino-acids sequence
References
Cruciani, G., Baroni, M., Carosati, E., Clementi, M., Valigi, R., and Clementi, S. (2004) Peptidestudies by means of principal properties of amino acids derived from MIF descriptors. J. Chemom.18, 146-155.
Examples
# Loading a property to evaluate its autocorrelationdata(AAdata)
# Calculate the cross-covariance index for a lag=1crossCovariance(
sequence = "SDKEVDEVDAALSDLEITLE",lag = 1,property1 = AAdata$Hydrophobicity$KyteDoolittle,property2 = AAdata$Hydrophobicity$Eisenberg,

18 crucianiProperties
center = TRUE)# [1] -0.3026609
# Calculate the cross-correlation index for a lag=5crossCovariance(
sequence = "SDKEVDEVDAALSDLEITLE",lag = 5,property1 = AAdata$Hydrophobicity$KyteDoolittle,property2 = AAdata$Hydrophobicity$Eisenberg,center = TRUE
)# [1] 0.02598035
crucianiProperties Compute the Cruciani properties of a protein sequence
Description
This function calculates the Cruciani properties of an amino-acids sequence using the scaled princi-pal component scores that summarize a broad set of descriptors calculated based on the interactionof each amino acid residue with several chemical groups (or "probes"), such as charged ions, methyl,hydroxyl groups, and so forth.
Usage
crucianiProperties(seq)
Arguments
seq An amino-acids sequence
Value
The computed average of Cruciani properties of all the amino acids in the corresponding peptidesequence. Each PP represent an amino-acid property as follows:
• PP1: Polarity,
• PP2: Hydrophobicity,
• PP3: H-bonding
References
Cruciani, G., Baroni, M., Carosati, E., Clementi, M., Valigi, R., and Clementi, S. (2004) Peptidestudies by means of principal properties of amino acids derived from MIF descriptors. J. Chemom.18, 146-155.

fasgaiVectors 19
Examples
crucianiProperties(seq = "QWGRRCCGWGPGRRYCVRWC")# PP1 PP2 PP3# -0.1130 -0.0220 0.2735
fasgaiVectors Compute the FASGAI vectors of a protein sequence
Description
The FASGAI vectors (Factor Analysis Scales of Generalized Amino Acid Information) is a set ofamino acid descriptors, that reflects hydrophobicity, alpha and turn propensities, bulky properties,compositional characteristics, local flexibility, and electronic properties, that can be utilized to rep-resent the sequence structural features of peptides or protein motifs.
Usage
fasgaiVectors(seq)
Arguments
seq An amino-acids sequence
Value
The computed average of FASGAI factors of all the amino acids in the corresponding peptidesequence. Each factor represent an amino-acid property as follows:
• F1: Hydrophobicity index,
• F2: Alpha and turn propensities,
• F3: Bulky properties,
• F4: Compositional characteristic index,
• F5: Local flexibility,
• F6: Electronic properties
References
Liang, G., & Li, Z. (2007). Factor analysis scale of generalized amino acid information as thesource of a new set of descriptors for elucidating the structure and activity relationships of cationicantimicrobial peptides. Molecular Informatics, 26(6), 754-763.
Examples
fasgaiVectors(seq = "QWGRRCCGWGPGRRYCVRWC")# [[1]]# F1 F2 F3 F4 F5 F6# -0.13675 -0.45485 -0.11695 -0.45800 -0.38015 0.52740
20 hmoment
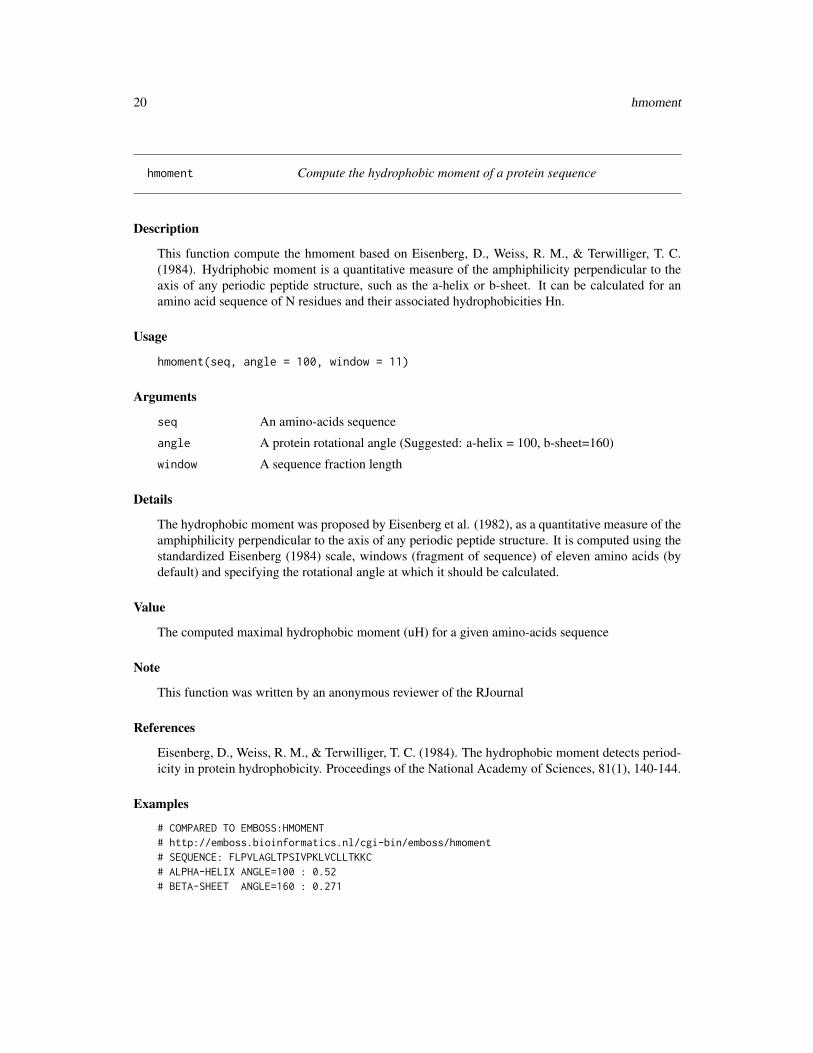
hmoment Compute the hydrophobic moment of a protein sequence
Description
This function compute the hmoment based on Eisenberg, D., Weiss, R. M., & Terwilliger, T. C.(1984). Hydriphobic moment is a quantitative measure of the amphiphilicity perpendicular to theaxis of any periodic peptide structure, such as the a-helix or b-sheet. It can be calculated for anamino acid sequence of N residues and their associated hydrophobicities Hn.
Usage
hmoment(seq, angle = 100, window = 11)
Arguments
seq An amino-acids sequence
angle A protein rotational angle (Suggested: a-helix = 100, b-sheet=160)
window A sequence fraction length
Details
The hydrophobic moment was proposed by Eisenberg et al. (1982), as a quantitative measure of theamphiphilicity perpendicular to the axis of any periodic peptide structure. It is computed using thestandardized Eisenberg (1984) scale, windows (fragment of sequence) of eleven amino acids (bydefault) and specifying the rotational angle at which it should be calculated.
Value
The computed maximal hydrophobic moment (uH) for a given amino-acids sequence
Note
This function was written by an anonymous reviewer of the RJournal
References
Eisenberg, D., Weiss, R. M., & Terwilliger, T. C. (1984). The hydrophobic moment detects period-icity in protein hydrophobicity. Proceedings of the National Academy of Sciences, 81(1), 140-144.
Examples
# COMPARED TO EMBOSS:HMOMENT# http://emboss.bioinformatics.nl/cgi-bin/emboss/hmoment# SEQUENCE: FLPVLAGLTPSIVPKLVCLLTKKC# ALPHA-HELIX ANGLE=100 : 0.52# BETA-SHEET ANGLE=160 : 0.271

hydrophobicity 21
# ALPHA HELIX VALUEhmoment(seq = "FLPVLAGLTPSIVPKLVCLLTKKC", angle = 100, window = 11)# [1] 0.5199226
# BETA SHEET VALUEhmoment(seq = "FLPVLAGLTPSIVPKLVCLLTKKC", angle = 160, window = 11)# [1] 0.2705906
hydrophobicity Compute the hydrophobicity index of a protein sequence
Description
This function calculates the GRAVY hydrophobicity index of an amino acids sequence using oneof the 38 scales from different sources.
Usage
hydrophobicity(seq, scale = "KyteDoolittle")
Arguments
seq An amino-acids sequence
scale A character string specifying the hydophobicity scale to be used; must be one of"Aboderin", "AbrahamLeo", "Argos", "BlackMould", "BullBreese", "Casari","Chothia", "Cid", "Cowan3.4", "Cowan7.5", "Eisenberg", "Engelman", "Fasman","Fauchere", "Goldsack", "Guy", "HoppWoods", "Janin", "Jones", "Juretic","Kidera", "Kuhn", "KyteDoolittle", "Levitt", "Manavalan", "Miyazawa","Parker", "Ponnuswamy", "Prabhakaran", "Rao", "Rose", "Roseman", "Sweet","Tanford", "Welling", "Wilson", "Wolfenden", "Zimmerman", "interfaceScale_pH8","interfaceScale_pH2", "octanolScale_pH8", "octanolScale_pH2", "oiScale_pH8"or "oiScale_pH2".
Details
The hydrophobicity is an important stabilization force in protein folding; this force changes depend-ing on the solvent in which the protein is found. The hydrophobicity index is calculated adding thehydrophobicity of individual amino acids and dividing this value by the length of the sequence.
Value
The computed GRAVY index for a given amino-acid sequence

22 hydrophobicity
References
Aboderin, A. A. (1971). An empirical hydrophobicity scale for alpha-amino-acids and some of itsapplications. International Journal of Biochemistry, 2(11), 537-544.
Abraham D.J., Leo A.J. Hydrophobicity (delta G1/2 cal). Proteins: Structure, Function and Genet-ics 2:130-152(1987).
Argos, P., Rao, J. K., & Hargrave, P. A. (1982). Structural Prediction of Membrane-Bound Proteins.European Journal of Biochemistry, 128(2-3), 565-575.
Black S.D., Mould D.R. Hydrophobicity of physiological L-alpha amino acids. Anal. Biochem.193:72-82(1991).
Bull H.B., Breese K. Hydrophobicity (free energy of transfer to surface in kcal/mole). Arch.Biochem. Biophys. 161:665-670(1974).
Casari, G., & Sippl, M. J. (1992). Structure-derived hydrophobic potential: hydrophobic poten-tial derived from X-ray structures of globular proteins is able to identify native folds. Journal ofmolecular biology, 224(3), 725-732.
Chothia, C. (1976). The nature of the accessible and buried surfaces in proteins. Journal of molec-ular biology, 105(1), 1-12.
Cid, H., Bunster, M., Canales, M., & Gazitua, F. (1992). Hydrophobicity and structural classes inproteins. Protein engineering, 5(5), 373-375.
Cowan R., Whittaker R.G. Hydrophobicity indices at pH 3.4 determined by HPLC. Peptide Re-search 3:75-80(1990).
Cowan R., Whittaker R.G. Hydrophobicity indices at pH 7.5 determined by HPLC. Peptide Re-search 3:75-80(1990).
Eisenberg D., Schwarz E., Komarony M., Wall R. Normalized consensus hydrophobicity scale. J.Mol. Biol. 179:125-142(1984).
Engelman, D. M., Steitz, T. A., & Goldman, A. (1986). Identifying nonpolar transbilayer helices inamino acid sequences of membrane proteins. Annual review of biophysics and biophysical chem-istry, 15(1), 321-353.
Fasman, G. D. (Ed.). (1989). Prediction of protein structure and the principles of protein confor-mation. Springer.
Fauchere J.-L., Pliska V.E. Hydrophobicity scale (pi-r). Eur. J. Med. Chem. 18:369-375(1983).
Goldsack, D. E., & Chalifoux, R. C. (1973). Contribution of the free energy of mixing of hydropho-bic side chains to the stability of the tertiary structure of proteins. Journal of theoretical biology,39(3), 645-651.
Guy H.R. Hydrophobicity scale based on free energy of transfer (kcal/mole). Biophys J. 47:61-70(1985).
Hopp T.P., Woods K.R. Hydrophilicity. Proc. Natl. Acad. Sci. U.S.A. 78:3824-3828(1981).
Janin J. Free energy of transfer from inside to outside of a globular protein. Nature 277:491-492(1979).
Jones, D. D. (1975). Amino acid properties and side-chain orientation in proteins: a cross correla-tion approach. Journal of theoretical biology, 50(1), 167-183.
Juretic, D., Lucic, B., Zucic, D., & Trinajstic, N. (1998). Protein transmembrane structure: recog-nition and prediction by using hydrophobicity scales through preference functions. Theoretical andcomputational chemistry, 5, 405-445.

hydrophobicity 23
Kidera, A., Konishi, Y., Oka, M., Ooi, T., & Scheraga, H. A. (1985). Statistical analysis of thephysical properties of the 20 naturally occurring amino acids. Journal of Protein Chemistry, 4(1),23-55.
Kuhn, L. A., Swanson, C. A., Pique, M. E., Tainer, J. A., & Getzoff, E. D. (1995). Atomic andresidue hydrophilicity in the context of folded protein structures. Proteins: Structure, Function, andBioinformatics, 23(4), 536-547.
Kyte J., Doolittle R.F. Hydropathicity. J. Mol. Biol. 157:105-132(1982).
Levitt, M. (1976). A simplified representation of protein conformations for rapid simulation ofprotein folding. Journal of molecular biology, 104(1), 59-107.
Manavalan P., Ponnuswamy Average surrounding hydrophobicity. P.K. Nature 275:673-674(1978).
Miyazawa S., Jernigen R.L. Hydrophobicity scale (contact energy derived from 3D data). Macro-molecules 18:534-552(1985).
Parker J.M.R., Guo D., Hodges R.S. Hydrophilicity scale derived from HPLC peptide retentiontimes. Biochemistry 25:5425-5431(1986).
Ponnuswamy, P. K. (1993). Hydrophobic charactesristics of folded proteins. Progress in biophysicsand molecular biology, 59(1), 57-103.
Prabhakaran, M. (1990). The distribution of physical, chemical and conformational properties insignal and nascent peptides. Biochem. J, 269, 691-696.
Rao M.J.K., Argos P. Membrane buried helix parameter. Biochim. Biophys. Acta 869:197-214(1986).
Rose G.D., Geselowitz A.R., Lesser G.J., Lee R.H., Zehfus M.H. Mean fractional area loss (f)[average area buried/standard state area]. Science 229:834-838(1985)
Roseman M.A. Hydrophobicity scale (pi-r). J. Mol. Biol. 200:513-522(1988).
Sweet R.M., Eisenberg D. Optimized matching hydrophobicity (OMH). J. Mol. Biol. 171:479-488(1983).
Tanford C. Hydrophobicity scale (Contribution of hydrophobic interactions to the stability of theglobular conformation of proteins). J. Am. Chem. Soc. 84:4240-4274(1962).
Welling G.W., Weijer W.J., Van der Zee R., Welling-Wester S. Antigenicity value X 10. FEBS Lett.188:215-218(1985).
Wilson K.J., Honegger A., Stotzel R.P., Hughes G.J. Hydrophobic constants derived from HPLCpeptide retention times. Biochem. J. 199:31-41(1981).
Wolfenden R.V., Andersson L., Cullis P.M., Southgate C.C.F. Hydration potential (kcal/mole) at25C. Biochemistry 20:849-855(1981).
Zimmerman, J. M., Eliezer, N., & Simha, R. (1968). The characterization of amino acid sequencesin proteins by statistical methods. Journal of theoretical biology, 21(2), 170-201.
Nakai, K., Kidera, A., and Kanehisa, M.; Cluster analysis of amino acid indices for prediction ofprotein structure and function. Protein Eng. 2, 93-100 (1988).
Tomii, K. and Kanehisa, M.; Analysis of amino acid indices and mutation matrices for sequencecomparison and structure prediction of proteins. Protein Eng. 9, 27-36 (1996).
Kawashima, S., Ogata, H., and Kanehisa, M.; AAindex: amino acid index database. Nucleic AcidsRes. 27, 368-369 (1999).

24 hydrophobicity
Kawashima, S. and Kanehisa, M.; AAindex: amino acid index database. Nucleic Acids Res. 28,374 (2000).
Kawashima, S., Pokarowski, P., Pokarowska, M., Kolinski, A., Katayama, T., and Kanehisa, M.;AAindex: amino acid index database, progress report 2008. Nucleic Acids Res. 36, D202-D205(2008).
White, Stephen (2006-06-29). "Experimentally Determined Hydrophobicity Scales". University ofCalifornia, Irvine. Retrieved 2017-05-25
Examples
# COMPARED TO GRAVY Grand average of hydropathicity (GRAVY) ExPASy# http://web.expasy.org/cgi-bin/protparam/protparam# SEQUENCE: QWGRRCCGWGPGRRYCVRWC# GRAVY: -0.950
hydrophobicity(seq = "QWGRRCCGWGPGRRYCVRWC",scale = "Aboderin")#[1] 3.84hydrophobicity(seq = "QWGRRCCGWGPGRRYCVRWC",scale = "AbrahamLeo")#[1] 0.092hydrophobicity(seq = "QWGRRCCGWGPGRRYCVRWC",scale = "Argos")#[1] 1.033hydrophobicity(seq = "QWGRRCCGWGPGRRYCVRWC",scale = "BlackMould")#[1] 0.50125hydrophobicity(seq = "QWGRRCCGWGPGRRYCVRWC",scale = "BullBreese")#[1] 0.1575hydrophobicity(seq = "QWGRRCCGWGPGRRYCVRWC",scale = "Casari")#[1] 0.38hydrophobicity(seq = "QWGRRCCGWGPGRRYCVRWC",scale = "Chothia")#[1] 0.262hydrophobicity(seq = "QWGRRCCGWGPGRRYCVRWC",scale = "Cid")#[1] 0.198hydrophobicity(seq = "QWGRRCCGWGPGRRYCVRWC",scale = "Cowan3.4")#[1] 0.0845hydrophobicity(seq = "QWGRRCCGWGPGRRYCVRWC",scale = "Cowan7.5")#[1] 0.0605hydrophobicity(seq = "QWGRRCCGWGPGRRYCVRWC",scale = "Eisenberg")#[1] -0.3265hydrophobicity(seq = "QWGRRCCGWGPGRRYCVRWC",scale = "Engelman")#[1] 2.31hydrophobicity(seq = "QWGRRCCGWGPGRRYCVRWC",scale = "Fasman")#[1] -1.2905hydrophobicity(seq = "QWGRRCCGWGPGRRYCVRWC",scale = "Fauchere")#[1] 0.527hydrophobicity(seq = "QWGRRCCGWGPGRRYCVRWC",scale = "Goldsack")#[1] 1.2245hydrophobicity(seq = "QWGRRCCGWGPGRRYCVRWC",scale = "Guy")#[1] 0.193hydrophobicity(seq = "QWGRRCCGWGPGRRYCVRWC",scale = "HoppWoods")#[1] -0.14hydrophobicity(seq = "QWGRRCCGWGPGRRYCVRWC",scale = "Janin")#[1] -0.105hydrophobicity(seq = "QWGRRCCGWGPGRRYCVRWC",scale = "Jones")

instaIndex 25
#[1] 1.4675hydrophobicity(seq = "QWGRRCCGWGPGRRYCVRWC",scale = "Juretic")#[1] -1.106hydrophobicity(seq = "QWGRRCCGWGPGRRYCVRWC",scale = "Kidera")#[1] -0.0405hydrophobicity(seq = "QWGRRCCGWGPGRRYCVRWC",scale = "Kuhn")#[1] 0.9155hydrophobicity(seq = "QWGRRCCGWGPGRRYCVRWC",scale = "KyteDoolittle")#[1] -0.95hydrophobicity(seq = "QWGRRCCGWGPGRRYCVRWC",scale = "Levitt")#[1] -0.21hydrophobicity(seq = "QWGRRCCGWGPGRRYCVRWC",scale = "Manavalan")#[1] 13.0445hydrophobicity(seq = "QWGRRCCGWGPGRRYCVRWC",scale = "Miyazawa")#[1] 5.739hydrophobicity(seq = "QWGRRCCGWGPGRRYCVRWC",scale = "Parker")#[1] 1.095hydrophobicity(seq = "QWGRRCCGWGPGRRYCVRWC",scale = "Ponnuswamy")#[1] 0.851hydrophobicity(seq = "QWGRRCCGWGPGRRYCVRWC",scale = "Prabhakaran")#[1] 9.67hydrophobicity(seq = "QWGRRCCGWGPGRRYCVRWC",scale = "Rao")#[1] 0.813hydrophobicity(seq = "QWGRRCCGWGPGRRYCVRWC",scale = "Rose")#[1] 0.7575hydrophobicity(seq = "QWGRRCCGWGPGRRYCVRWC",scale = "Roseman")#[1] -0.495hydrophobicity(seq = "QWGRRCCGWGPGRRYCVRWC",scale = "Sweet")#[1] -0.1135hydrophobicity(seq = "QWGRRCCGWGPGRRYCVRWC",scale = "Tanford")#[1] -0.2905hydrophobicity(seq = "QWGRRCCGWGPGRRYCVRWC",scale = "Welling")#[1] -0.666hydrophobicity(seq = "QWGRRCCGWGPGRRYCVRWC",scale = "Wilson")#[1] 3.16hydrophobicity(seq = "QWGRRCCGWGPGRRYCVRWC",scale = "Wolfenden")#[1] -6.307hydrophobicity(seq = "QWGRRCCGWGPGRRYCVRWC",scale = "Zimmerman")#[1] 0.943
instaIndex Compute the instability index of a protein sequence
Description
This function calculates the instability index proposed by Guruprasad (1990). This index predictsthe stability of a protein based on its amino acid composition, a protein whose instability index issmaller than 40 is predicted as stable, a value above 40 predicts that the protein may be unstable.

26 kideraFactors
Usage
instaIndex(seq)
Arguments
seq An amino-acids sequence
Value
The computed instability index for a given amino-acids sequence
References
Guruprasad K, Reddy BV, Pandit MW (1990). "Correlation between stability of a protein and itsdipeptide composition: a novel approach for predicting in vivo stability of a protein from its primarysequence". Protein Eng. 4 (2): 155 - 61. doi:10.1093/protein/4.2.155
Examples
# COMPARED TO ExPASy INSTAINDEX# http://web.expasy.org/protparam/# SEQUENCE: QWGRRCCGWGPGRRYCVRWC# The instability index (II) is computed to be 83.68
instaIndex(seq = "QWGRRCCGWGPGRRYCVRWC")# [1] 83.68
kideraFactors Compute the Kidera factors of a protein sequence
Description
The Kidera Factors were originally derived by applying multivariate analysis to 188 physical prop-erties of the 20 amino acids and using dimension reduction techniques. This function calculates theaverage of the ten Kidera factors for a protein sequence.
Usage
kideraFactors(seq)
Arguments
seq An amino-acids sequence

lengthpep 27
Value
A list with the average of the ten Kidera factors. The first four factors are essentially pure physi-cal properties; the remaining six factors are superpositions of several physical properties, and arelabelled for convenience by the name of the most heavily weighted component.
• KF1: Helix/bend preference,
• KF2: Side-chain size,
• KF3: Extended structure preference,
• KF4: Hydrophobicity,
• KF5: Double-bend preference,
• KF6: Partial specific volume,
• KF7: Flat extended preference,
• KF8: Occurrence in alpha region,
• KF9: pK-C,
• KF10: Surrounding hydrophobicity
References
Kidera, A., Konishi, Y., Oka, M., Ooi, T., & Scheraga, H. A. (1985). Statistical analysis of thephysical properties of the 20 naturally occurring amino acids. Journal of Protein Chemistry, 4(1),23-55.
Examples
kideraFactors(seq = "KLKLLLLLKLK")# [[1]]# KF1 KF2 KF3 KF4 KF5# -0.78545455 0.29818182 -0.23636364 -0.08181818 0.21000000# KF6 KF7 KF8 KF9 KF10# -1.89363636 1.02909091 -0.51272727 0.11181818 0.81000000
lengthpep Compute the amino acid length of a protein sequence
Description
This function counts the number of amino acids in a protein sequence
Usage
lengthpep(seq)
Arguments
seq An amino-acids sequence

28 membpos
Details
All proteins are formed by linear chains of small residues known as amino acids attached to eachother by peptide bonds. The function lengthpep counts the number of amino acids in a sequenceand returns a vector with the count for each peptide used as argument.
Examples
# COMPARED TO ExPASy ProtParam# http://web.expasy.org/protparam# SEQUENCE: QWGRRCCGWGPGRRYCVRWC# Number of amino acids: 20
lengthpep(seq = "QWGRRCCGWGPGRRYCVRWC")# [1] 20
membpos Compute theoretically the class of a protein sequence
Description
This function calculates the theoretical class of a protein sequence based on the relationship betweenthe hydrophobic moment and hydrophobicity scale proposed by Eisenberg (1984).
Usage
membpos(seq, angle = 100)
Arguments
seq An amino-acids sequence
angle A protein rotational angle
Details
Eisenberg et al. (1982) found a correlation between hydrophobicity and hydrophobic moment thatdefines the protein section as globular, transmembrane or superficial. The function calculates thehydrophobicity (H) and hydrophobic moment (uH) based on the standardized scale of Eisenberg(1984) using windows of 11 amino acids for calculate the theoretical fragment type.
Value
A data frame for each sequence given with the calculated class for each window of eleven amino-acids

mswhimScores 29
References
Eisenberg, David. "Three-dimensional structure of membrane and surface proteins." Annual reviewof biochemistry 53.1 (1984): 595-623.
D. Eisenberg, R. M. Weiss, and T. C. Terwilliger. The helical hydrophobic moment: A measure ofthe amphiphilicity of a helix. Nature, 299(5881):371-374, 1982. [p7, 8]
Examples
membpos(seq = "ARQQNLFINFCLILIFLLLI",angle = 100)# Pep H uH MembPos# 1 ARQQNLFINFCL 0.083 0.353 Globular# 2 RQQNLFINFCLI 0.147 0.317 Globular# 3 QQNLFINFCLIL 0.446 0.274 Globular# 4 QNLFINFCLILI 0.632 0.274 Transmembrane# 5 NLFINFCLILIF 0.802 0.253 Surface# 6 LFINFCLILIFL 0.955 0.113 Transmembrane# 7 FINFCLILIFLL 0.955 0.113 Transmembrane# 8 INFCLILIFLLL 0.944 0.108 Transmembrane# 9 NFCLILIFLLLI 0.944 0.132 Transmembrane
membpos(seq = "ARQQNLFINFCLILIFLLLI",angle = 160)# Pep H uH MembPos# 1 ARQQNLFINFCL 0.083 0.467 Globular# 2 RQQNLFINFCLI 0.147 0.467 Globular# 3 QQNLFINFCLIL 0.446 0.285 Globular# 4 QNLFINFCLILI 0.632 0.358 Surface# 5 NLFINFCLILIF 0.802 0.358 Surface# 6 LFINFCLILIFL 0.955 0.269 Surface# 7 FINFCLILIFLL 0.955 0.269 Surface# 8 INFCLILIFLLL 0.944 0.257 Surface# 9 NFCLILIFLLLI 0.944 0.229 Surface
mswhimScores Compute the MS-WHIM scores of a protein sequence
Description
MS-WHIM scores were derived from 36 electrostatic potential properties derived from the three-dimensional structure of the 20 natural amino acids
Usage
mswhimScores(seq)
Arguments
seq An amino-acids sequence
30 mw
Value
The computed average of MS-WHIM scores of all the amino acids in the corresponding peptidesequence.
References
Zaliani, A., & Gancia, E. (1999). MS-WHIM scores for amino acids: a new 3D-description forpeptide QSAR and QSPR studies. Journal of chemical information and computer sciences, 39(3),525-533.
Examples
mswhimScores(seq = "KLKLLLLLKLK")# [[1]]# MSWHIM1 MSWHIM2 MSWHIM3# -0.6563636 0.4872727 0.1163636
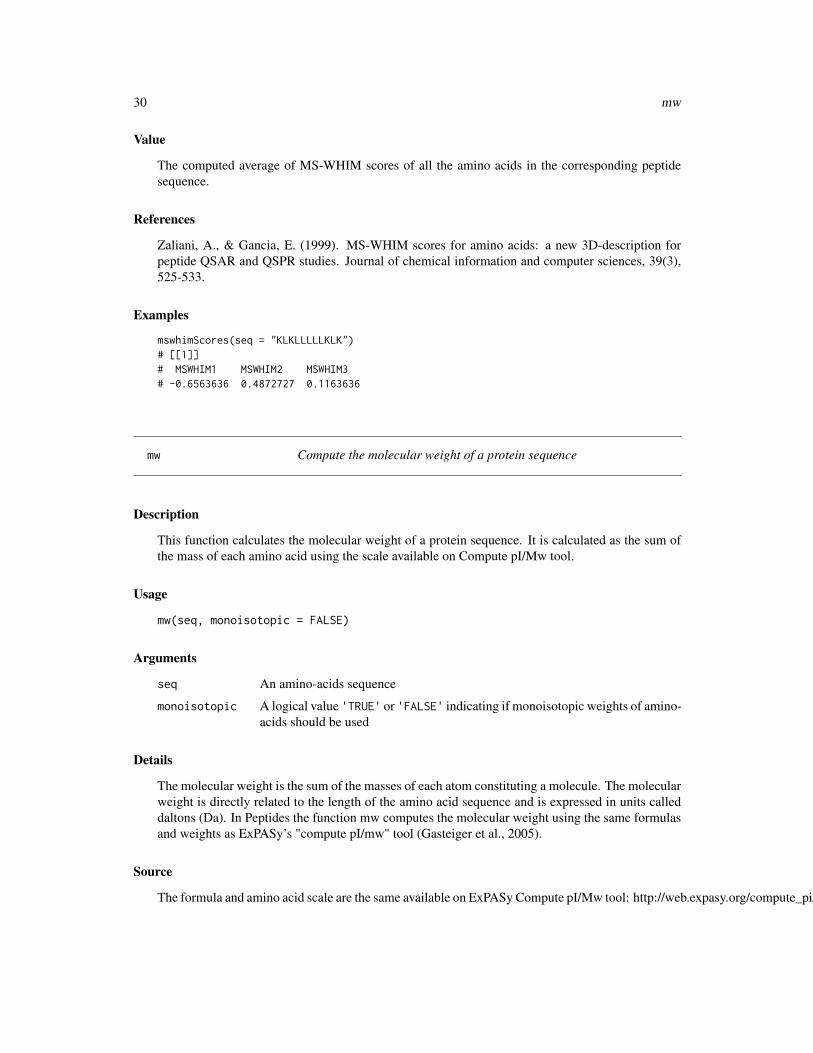
mw Compute the molecular weight of a protein sequence
Description
This function calculates the molecular weight of a protein sequence. It is calculated as the sum ofthe mass of each amino acid using the scale available on Compute pI/Mw tool.
Usage
mw(seq, monoisotopic = FALSE)
Arguments
seq An amino-acids sequence
monoisotopic A logical value 'TRUE' or 'FALSE' indicating if monoisotopic weights of amino-acids should be used
Details
The molecular weight is the sum of the masses of each atom constituting a molecule. The molecularweight is directly related to the length of the amino acid sequence and is expressed in units calleddaltons (Da). In Peptides the function mw computes the molecular weight using the same formulasand weights as ExPASy’s "compute pI/mw" tool (Gasteiger et al., 2005).
Source
The formula and amino acid scale are the same available on ExPASy Compute pI/Mw tool: http://web.expasy.org/compute_pi/

pepdata 31
References
Gasteiger, E., Hoogland, C., Gattiker, A., Wilkins, M. R., Appel, R. D., & Bairoch, A. (2005). Pro-tein identification and analysis tools on the ExPASy server. In The proteomics protocols handbook(pp. 571-607). Humana Press. Chicago
Examples
# COMPARED TO ExPASy Compute pI/Mw tool# http://web.expasy.org/compute_pi/# SEQUENCE: QWGRRCCGWGPGRRYCVRWC# Theoretical pI/Mw: 9.88 / 2485.91
mw(seq = "QWGRRCCGWGPGRRYCVRWC",monoisotopic = FALSE)# [1] 2485.911
mw(seq = "QWGRRCCGWGPGRRYCVRWC",monoisotopic = TRUE)# [1] 2484.12
pepdata Physicochemical properties and indices from 100 amino acid se-quences
Description
Physicochemical properties and indices from 100 amino acid sequences (50 antimicrobial and 50non antimicrobial)
Usage
data(pepdata)
Format
A data frame with 100 observations on the following 23 variables.
sequence a character vector with the sequences of 100 peptides (50 antimicrobial and 50 non-antimicrobial)
group Integrer vector with the group code "0" for non antimicrobial and "1" for antimicrobial
length a numeric vector with the length of the amino acid sequence
mw a numeric vector with the molecular weight of the amino acid sequence
tinyAA A numeric vector with the fraction (as percent) of tiny amino acids that make up the se-quence
smallAA A numeric vector with the fraction (as percent) of small amino acids that make up thesequence
aliphaticAA A numeric vector with the fraction (as percent) of aliphatic amino acids that makeup the sequence
32 pI
aromaticAA A numeric vector with the fraction (as percent) of aromatic amino acids that make upthe sequence
nonpolarAA A numeric vector with the fraction (as percent) of non-polar amino acids that makeup the sequence
polarAA A numeric vector with the fraction (as percent) of polar amino acids that make up thesequence
chargedAA A numeric vector with the fraction (as percent) of charged amino acids that make upthe sequence
basicAA A numeric vector with the fraction (as percent) of basic amino acids that make up thesequence
acidicAA A numeric vector with the fraction (as percent) of acid amino acids that make up thesequence
charge a numeric vector with the charge of the amino acid sequencepI a numeric vector with the isoelectric point of the amino acid sequenceaindex a numeric vector with the aliphatic index of the amino acid sequenceinstaindex a numeric vector with the instability index of the amino acid sequenceboman a numeric vector with the potential peptide-interaction index of the amino acid sequencehydrophobicity a numeric vector with the hydrophobicity index of the amino acid sequencehmoment a numeric vector with the hydrophobic moment of the amino acid sequencetransmembrane A numeric vector with the fraction of Transmembrane windows of 11 amino acids
that make up the sequencesurface A numeric vector with the fraction of Surface windows of 11 amino acids that make up
the sequenceglobular A numeric vector with the fraction of Globular windows of 11 amino acids that make up
the sequence
pI Compute the isoelectic point (pI) of a protein sequence
Description
The isoelectric point (pI), is the pH at which a particular molecule or surface carries no net electricalcharge.
Usage
pI(seq, pKscale = "EMBOSS")
Arguments
seq An amino-acids sequencepKscale A character string specifying the pK scale to be used; must be one of "Bjellqvist",
"EMBOSS", "Murray", "Sillero", "Solomon", "Stryer", "Lehninger", "Dawson"or "Rodwell"

plotXVG 33
Details
The isoelectric point (pI) is the pH at which the net charge of the protein is equal to 0. It is a variablethat affects the solubility of the peptides under certain conditions of pH. When the pH of the solventis equal to the pI of the protein, it tends to precipitate and loose its biological function.
Examples
# COMPARED TO ExPASy ProtParam# http://web.expasy.org/cgi-bin/protparam/protparam# SEQUENCE: QWGRRCCGWGPGRRYCVRWC# Theoretical pI: 9.88
pI(seq= "QWGRRCCGWGPGRRYCVRWC",pKscale= "Bjellqvist")# [1] 9.881
# COMPARED TO EMBOSS PEPSTATS# http://emboss.bioinformatics.nl/cgi-bin/emboss/pepstats# SEQUENCE: QWGRRCCGWGPGRRYCVRWC# Isoelectric Point = 9.7158
pI(seq= "QWGRRCCGWGPGRRYCVRWC",pKscale= "EMBOSS")# [1] 9.716
# OTHER SCALES
pI(seq= "QWGRRCCGWGPGRRYCVRWC",pKscale= "Murray")# [1] 9.818pI(seq= "QWGRRCCGWGPGRRYCVRWC",pKscale= "Sillero")# [1] 9.891pI(seq= "QWGRRCCGWGPGRRYCVRWC",pKscale= "Solomon")# [1] 9.582pI(seq= "QWGRRCCGWGPGRRYCVRWC",pKscale= "Stryer")# [1] 9.623pI(seq= "QWGRRCCGWGPGRRYCVRWC",pKscale= "Lehninger")# [1] 9.931pI(seq= "QWGRRCCGWGPGRRYCVRWC",pKscale= "Dawson")# [1] 9.568pI(seq= "QWGRRCCGWGPGRRYCVRWC",pKscale= "Rodwell")# [1] 9.718
plotXVG Plot time series from GROMACS XVG files
Description
Read and plot output data from a XVG format file.
Usage
plotXVG(XVGfile, ...)

34 protFP
Arguments
XVGfile A .XVG output file of the GROMACS molecular dynamics package
... Arguments to be passed to methods, such as graphical parameters.
Details
GROMACS (GROningen MAchine for Chemical Simulations) is a molecular dynamics packagedesigned for simulations of proteins, lipids and nucleic acids. It is free, open source softwarereleased under the GNU General Public License. The file format used by GROMACS is XVG. Thisformat can be displayed in graphical form through the GRACE program on UNIX/LINUX systemsand the GNUPlot program on Windows. XVG files are plain text files containing tabular dataseparated by tabulators and two types of comments which contain data labels. Although manualediting is possible, this is not a viable option when working with multiple files of this type. For easeof reading, information management and data plotting, the functions read.xvg and plot.xvg wereincorporated.
Author(s)
Latest: J. Sebastian Paez <[email protected]>
Original: Daniel Osorio <[email protected]>
References
Pronk, S., Pall, S., Schulz, R., Larsson, P., Bjelkmar, P., Apostolov, R., ... & Lindahl, E. (2013).GROMACS 4.5: a high-throughput and highly parallel open source molecular simulation toolkit.Bioinformatics, 29 (7), 845-854.
Examples
XVGfile <- system.file("xvg-files/epot.xvg",package="Peptides")plotXVG(XVGfile)
protFP Compute the protFP descriptors of a protein sequence
Description
The ProtFP descriptor set was constructed from a large initial selection of indices obtained from theAAindex database for all 20 naturally occurring amino acids.
Usage
protFP(seq)
Arguments
seq An amino-acids sequence

readXVG 35
Value
The computed average of protFP descriptors of all the amino acids in the corresponding peptidesequence.
References
van Westen, G. J., Swier, R. F., Wegner, J. K., IJzerman, A. P., van Vlijmen, H. W., & Bender, A.(2013). Benchmarking of protein descriptor sets in proteochemometric modeling (part 1): compar-ative study of 13 amino acid descriptor sets. Journal of cheminformatics, 5(1), 41.
Examples
protFP(seq = "QWGRRCCGWGPGRRYCVRWC")# [[1]]# ProtFP1 ProtFP2 ProtFP3 ProtFP4 ProtFP5 ProtFP6 ProtFP7 ProtFP8# 0.2065 -0.0565 1.9930 -0.2845 0.7315 0.7000 0.1715 0.1135
readXVG Read output data from a XVG format file.
Description
XVG is the default format file of the GROMACS molecular dynamics package, contains data for-matted to be imported into the Grace 2-D plotting program.
Usage
readXVG(file)
Arguments
file A .XVG output file of the GROMACS molecular dynamics package
Details
GROMACS (GROningen MAchine for Chemical Simulations) is a molecular dynamics packagedesigned for simulations of proteins, lipids and nucleic acids. It is free, open source softwarereleased under the GNU General Public License. The file format used by GROMACS is XVG. Thisformat can be displayed in graphical form through the GRACE program on UNIX/LINUX systemsand the GNUPlot program on Windows. XVG files are plain text files containing tabular dataseparated by tabulators and two types of comments which contain data labels. Although manualediting is possible, this is not a viable option when working with multiple files of this type. For easeof reading, information management and data plotting, the functions read.xvg and plot.xvg wereincorporated.

36 stScales
Author(s)
Latest: J. Sebastian Paez <[email protected]>
Original: Daniel Osorio <[email protected]>
References
Pronk, S., Pall, S., Schulz, R., Larsson, P., Bjelkmar, P., Apostolov, R., ... & Lindahl, E. (2013).GROMACS 4.5: a high-throughput and highly parallel open source molecular simulation toolkit.Bioinformatics, 29 (7), 845-854.
Examples
# READING FILEXVGfile <- system.file("xvg-files/epot.xvg",package="Peptides")readXVG(XVGfile)
# Time (ps) Potential# 1 1 6672471040# 2 2 6516461568# 3 3 6351947264# 4 4 6183133184# 5 5 6015310336# 6 6 5854271488
stScales Compute the ST-scales of a protein sequence
Description
ST-scales were proposed by Yang et al, taking 827 properties into account which are mainly con-stitutional, topological, geometrical, hydrophobic, elec- tronic, and steric properties of a total set of167 AAs.
Usage
stScales(seq)
Arguments
seq An amino-acids sequence
Value
The computed average of ST-scales of all the amino acids in the corresponding peptide sequence.
References
Yang, L., Shu, M., Ma, K., Mei, H., Jiang, Y., & Li, Z. (2010). ST-scale as a novel amino aciddescriptor and its application in QSAM of peptides and analogues. Amino acids, 38(3), 805-816.
tScales 37
Examples
stScales(seq = "QWGRRCCGWGPGRRYCVRWC")# [[1]]# ST1 ST2 ST3 ST4 ST5 ST6 ST7 ST8# -0.63760 0.07965 0.05150 0.07135 -0.27905 -0.80995 0.58020 0.54400
tScales Compute the T-scales of a protein sequence
Description
T-scales are based on 67 common topological descriptors of 135 amino acids. These topologicaldescriptors are based on the connectivity table of amino acids alone, and to not explicitly consider3D properties of each structure.
Usage
tScales(seq)
Arguments
seq An amino-acids sequence
Value
The computed average of T-scales of all the amino acids in the corresponding peptide sequence.
References
Tian F, Zhou P, Li Z: T-scale as a novel vector of topological descriptors for amino acids and its ap-plication in QSARs of peptides. J Mol Struct. 2007, 830: 106-115. 10.1016/j.molstruc.2006.07.004.
Examples
tScales(seq = "QWGRRCCGWGPGRRYCVRWC")# [[1]]# T1 T2 T3 T4 T5# -3.2700 -0.0035 -0.3855 -0.1475 0.7585

38 vhseScales
vhseScales Compute the VHSE-scales of a protein sequence
Description
VHSE-scales (principal components score Vectors of Hydrophobic, Steric, and Electronic proper-ties), is derived from principal components analysis (PCA) on independent families of 18 hydropho-bic properties, 17 steric properties, and 15 electronic properties, respectively, which are included intotal 50 physicochemical variables of 20 coded amino acids.
Usage
vhseScales(seq)
Arguments
seq An amino-acids sequence
Value
The computed average of VHSE-scales of all the amino acids in the corresponding peptide se-quence. Each VSHE-scale represent an amino-acid property as follows:
• VHSE1 and VHSE2: Hydrophobic properties
• VHSE3 and VHSE4: Steric properties
• VHSE5 to VHSE8: Electronic properties
References
Mei, H. U., Liao, Z. H., Zhou, Y., & Li, S. Z. (2005). A new set of amino acid descriptors and itsapplication in peptide QSARs. Peptide Science, 80(6), 775-786.
Examples
vhseScales(seq = "QWGRRCCGWGPGRRYCVRWC")# [[1]]# VHSE1 VHSE2 VHSE3 VHSE4 VHSE5 VHSE6 VHSE7 VHSE8#-0.1150 0.0630 -0.0055 0.7955 0.4355 0.2485 0.1740 -0.0960

zScales 39
zScales Compute the Z-scales of a protein sequence
Description
Z-scales are based on physicochemical properties of the AAs including NMR data and thin-layerchromatography (TLC) data.
Usage
zScales(seq)
Arguments
seq An amino-acids sequence
Value
The computed average of Z-scales of all the amino acids in the corresponding peptide sequence.Each Z scale represent an amino-acid property as follows:
• Z1: Lipophilicity
• Z2: Steric properties (Steric bulk/Polarizability)
• Z3: Electronic properties (Polarity / Charge)
• Z4 and Z5: They relate electronegativity, heat of formation, electrophilicity and hardness.
References
Sandberg M, Eriksson L, Jonsson J, Sjostrom M, Wold S: New chemical descriptors relevant forthe design of biologically active peptides. A multivariate characterization of 87 amino acids. J MedChem 1998, 41:2481-2491.
Examples
zScales(seq = "QWGRRCCGWGPGRRYCVRWC")# [[1]]# Z1 Z2 Z3 Z4 Z5# 0.6200 0.0865 0.0665 0.7280 -0.8740

Index
aaComp, 2AAdata, 4aaDescriptors, 9aIndex, 10autoCorrelation, 11autoCovariance, 12
blosumIndices, 13boman, 14
charge, 15crossCovariance, 17crucianiProperties, 18
fasgaiVectors, 19
hmoment, 20hydrophobicity, 21
instaIndex, 25
kideraFactors, 26
lengthpep, 27
membpos, 28mswhimScores, 29mw, 30
pepdata, 31pI, 32plotXVG, 33protFP, 34
readXVG, 35
stScales, 36
tScales, 37
vhseScales, 38
zScales, 39
40