Package ‘dynaTree’ - The Comprehensive R Archive Network · PDF filePackage...
34
Package ‘dynaTree’ March 15, 2017 Title Dynamic Trees for Learning and Design Version 1.2-10 Date 2017-03-13 Author Robert B. Gra- macy <[email protected]>, Matt A. Taddy <[email protected]> and Christo- foros Anagnostopoulos <[email protected]> Depends R (>= 2.14.0), methods Suggests akima, tgp, plgp, MASS Description Inference by sequential Monte Carlo for dynamic tree regression and classification models with hooks provided for sequential design and optimization, fully online learning with drift, variable selection, and sensitivity analysis of inputs. Illustrative examples from the original dynamic trees paper are facilitated by demos in the package; see demo(package=``dynaTree''). Maintainer Robert B. Gramacy <[email protected]> License LGPL URL http://bobby.gramacy.com/r_packages/dynaTree/ NeedsCompilation yes Repository CRAN Date/Publication 2017-03-15 14:54:54 R topics documented: dynaTree-package ...................................... 2 alcX.dynaTree ........................................ 3 dynaTree-class ....................................... 5 dynaTrees .......................................... 6 elec2 ............................................. 12 getBF ............................................ 14 plot.dynaTree ........................................ 15 1
Transcript of Package ‘dynaTree’ - The Comprehensive R Archive Network · PDF filePackage...

Package ‘dynaTree’March 15, 2017
Title Dynamic Trees for Learning and Design
Version 1.2-10
Date 2017-03-13
Author Robert B. Gra-macy <[email protected]>, Matt A. Taddy <[email protected]> and Christo-foros Anagnostopoulos <[email protected]>
Depends R (>= 2.14.0), methods
Suggests akima, tgp, plgp, MASS
Description Inference by sequential Monte Carlo fordynamic tree regression and classification modelswith hooks provided for sequential design and optimization,fully online learning with drift, variable selection, andsensitivity analysis of inputs. Illustrativeexamples from the original dynamic trees paper are facilitatedby demos in the package; see demo(package=``dynaTree'').
Maintainer Robert B. Gramacy <[email protected]>
License LGPL
URL http://bobby.gramacy.com/r_packages/dynaTree/
NeedsCompilation yes
Repository CRAN
Date/Publication 2017-03-15 14:54:54
R topics documented:dynaTree-package . . . . . . . . . . . . . . . . . . . . . . . . . . . . . . . . . . . . . . 2alcX.dynaTree . . . . . . . . . . . . . . . . . . . . . . . . . . . . . . . . . . . . . . . . 3dynaTree-class . . . . . . . . . . . . . . . . . . . . . . . . . . . . . . . . . . . . . . . 5dynaTrees . . . . . . . . . . . . . . . . . . . . . . . . . . . . . . . . . . . . . . . . . . 6elec2 . . . . . . . . . . . . . . . . . . . . . . . . . . . . . . . . . . . . . . . . . . . . . 12getBF . . . . . . . . . . . . . . . . . . . . . . . . . . . . . . . . . . . . . . . . . . . . 14plot.dynaTree . . . . . . . . . . . . . . . . . . . . . . . . . . . . . . . . . . . . . . . . 15
1

2 dynaTree-package
predict.dynaTree . . . . . . . . . . . . . . . . . . . . . . . . . . . . . . . . . . . . . . 17rejuvenate.dynaTree . . . . . . . . . . . . . . . . . . . . . . . . . . . . . . . . . . . . . 19relevance.dynaTree . . . . . . . . . . . . . . . . . . . . . . . . . . . . . . . . . . . . . 20retire.dynaTree . . . . . . . . . . . . . . . . . . . . . . . . . . . . . . . . . . . . . . . 22sens.dynaTree . . . . . . . . . . . . . . . . . . . . . . . . . . . . . . . . . . . . . . . . 24update.dynaTree . . . . . . . . . . . . . . . . . . . . . . . . . . . . . . . . . . . . . . . 28varpropuse . . . . . . . . . . . . . . . . . . . . . . . . . . . . . . . . . . . . . . . . . . 30
Index 33
dynaTree-package Dynamic trees for learning and design
Description
Inference by sequential Monte Carlo for dynamic tree regression and classification models withhooks provided for sequential design and optimization, fully online learning with drift, variableselection, and sensitivity analysis of inputs. Illustrative examples from the original dynamic treespaper are facilitated by demos in the package; see demo(package="dynaTree")
Details
For a fuller overview including a complete list of functions, and demos, please use help(package="dynaTree").
Author(s)
Robert B. Gramacy <[email protected]>,Matt Taddy <[email protected]>, andChristoforos Anagnostopoulos <[email protected]>
References
Taddy, M.A., Gramacy, R.B., and Polson, N. (2011). “Dynamic trees for learning and design”Journal of the American Statistical Association, 106(493), pp. 109-123; arXiv:0912.1586
http://bobby.gramacy.com/r_packages/dynaTree/
See Also
plgp, tgp

alcX.dynaTree 3
alcX.dynaTree Calculate the ALC or predictive entropy statistic at the X locations, orALC at new XX predictive locations
Description
Uses analytic integration (at the leaves) to calculate the (regression) ALC statistic, or calculates thepredictive (class) entropy at the input (X) locations; or calculate ALC at new predictive locationseither analytically or numerically
Usage
## S3 method for class 'dynaTree'alcX(object, rect = NULL, categ = NULL,
approx = FALSE, verb = 0)## S3 method for class 'dynaTree'entropyX(object, verb = 0)## S3 method for class 'dynaTree'alc(object, XX, rect = NULL, categ = NULL,
approx = FALSE, Xref = NULL, probs = NULL, verb = 0)
Arguments
object a "dynaTree"-class object built by dynaTree
rect for alcX, a matrix with two columns and ncol(object$X) rows describingthe bounding rectangle for the ALC integration; the default that is used whenrect = NULL is the bounding rectangle obtained by applying range to each col-umn of object$X (taking care to remove the first/intercept column of object$Xif icept = "augmented"; only applies to regression models (object$model != "class");for alc, rect must be a scalar logical: see Xref below
categ A vector of logicals of length ncol(object$X) indicating which, if any, dimen-sions of the input space should be treated as categorical; this input is used to helpwith the analytic integrals from a rect-based calculation, which means it shouldnot specified along with Xref; the default categ argument is NULL meaning thatthe categorical inputs are derived from object$X in a sensible way
approx a scalar logical that, when TRUE, causes the number of data points in a node/leafto be used as a proxy for its area in the analytic calculations
XX a design matrix of predictive locations (where ncol(XX) == ncol(X);only used by alc
Xref Xref input can be optionally used to specify a grid of reference locations forthe numerical ALC calculation - a matrix with ncol(X) columns. If NULL, thedefault, then the XX is taken as both candidate and reference locations.
probs weights for the reference locations to be used in a Monte Carlo approximation;usually these weights are class probabilities for response surfaces under con-straints

4 alcX.dynaTree
verb a positive scalar integer indicating how many predictive locations (iterations)after which a progress statement should be printed to the console; a (default)value of verb = 0 is quiet
Details
This function is most useful for selecting object$X locations to remove from the analysis, perhapsin an online inference setting. See retire.dynaTree for more details. The output is the same asusing predict.dynaTree using XX = object$X, alc = "rect", and Xref = rect
entropyX only apples to classification models (object$model != "class"), and alcX applies(only) to the other, regression, models
The alc function is more generic and allows ALC calculations at new, predictive, XX locations.This functionality used to be part of the predict.dynaTree function, but were separated out forcomputational reasons. The previous version was Monte Carlo-based (using Xref) whereas the newversion also allows analytic calculation (now the default, via rect)
Value
The entire object is returned with a new entry called alcX containing a vector of length nrow(X)with the ALC values, or entropyX containing the entropy values, or alc if general ALC calculationsat new XX locations
Author(s)
Robert B. Gramacy <rbg@vt>,Matt Taddy <[email protected]>, andChristoforos Anagnostopoulos <[email protected]>
References
Taddy, M.A., Gramacy, R.B., and Polson, N. (2011). “Dynamic trees for learning and design”Journal of the American Statistical Association, 106(493), pp. 109-123; arXiv:0912.1586
Anagnostopoulos, C., Gramacy. R.B. (2013) “Information-Theoretic Data Discarding for DynamicTrees on Data Streams.” Entropy, 15(12), 5510-5535; arXiv:1201.5568
http://bobby.gramacy.com/r_packages/dynaTree/
See Also
dynaTree, predict.dynaTree, and retire.dynaTree
Examples
## fit the model to the parabola datan <- 100Xp <- runif(n,-3,3)Yp <- Xp + Xp^2 + rnorm(n, 0, .2)rect <- c(-3,3)out <- dynaTree(Xp, Yp, model="linear", icept="augmented")

dynaTree-class 5
## calculate the alcXout <- alcX(out, rect=rect)
## to compare to analyticout <- alc(out, XX=out$X[,-1], rect=rect)
## plot comparison between alcX and predict-ALCplot(out$X[,-1], out$alcX)o <- order(out$X[,2])lines(out$X[o,-1], out$alc[o], col=2, lty=2)
## now compare to approximate analytic## (which writes over out$alc)out <- alc(out, XX=out$X[,-1], rect=rect, approx=TRUE)lines(out$X[o,-1], out$alc[o], col=3, lty=3)
## clean updeletecloud(out)
## similarly with entropyX for classification models
## see demo("design") for more iterations and## design under other active learning heuristics## like ALC, and EI for optimization; also see## demo("online") for an online learning example where## ALC is used for retirement
dynaTree-class Class "dynaTree"
Description
A stub for class dynaTree and its custom generic methods
Details
This is just a stub file. See sens.dynaTree and retire.dynaTree for more information on thegeneric methods used in this package
Objects from the Class
A virtual Class: No objects may be created from it.
Methods
retire signature(object = "dynaTree"): ...
sens signature(object = "dynaTree"): ...
copy signature(object = "dynaTree"): ...
alc signature(object = "dynaTree"): ...

6 dynaTrees
alcX signature(object = "dynaTree"): ...
entropyX signature(object = "dynaTree"): ...
ieci signature(object = "dynaTree"): ...
classprobs signature(object = "dynaTree"): ...
rejuvenate signature(object = "dynaTree"): ...
relevance signature(object = "dynaTree"): ...
varpropuse signature(object = "dynaTree"): ...
varproptotal signature(object = "dynaTree"): ...
treestats signature(object = "dynaTree"): ...
sameleaf signature(object = "dynaTree"): ...
Author(s)
Robert B. Gramacy <[email protected]>,Matt Taddy <[email protected]>, andChristoforos Anagnostopoulos <[email protected]>
References
Taddy, M.A., Gramacy, R.B., and Polson, N. (2011). “Dynamic trees for learning and design”Journal of the American Statistical Association, 106(493), pp. 109-123; arXiv:0912.1586
Gramacy, R.B., Taddy, M.A., and S. Wild (2011). “Variable Selection and Sensitivity Analysis viaDynamic Trees with an Application to Computer Code Performance Tuning” arXiv:1108.4739
http://bobby.gramacy.com/r_packages/dynaTree/
See Also
dynaTree, predict.dynaTree, update.dynaTree, retire.dynaTree, sens.dynaTree, alcX.dynaTree
Examples
showClass("dynaTree")
dynaTrees Fitting Dynamic Tree Models
Description
A function to initialize and fit dynamic tree models to regression and classification data by thesequential Monte Carlo (SMC) method of particle learning (PL)
dynaTrees 7
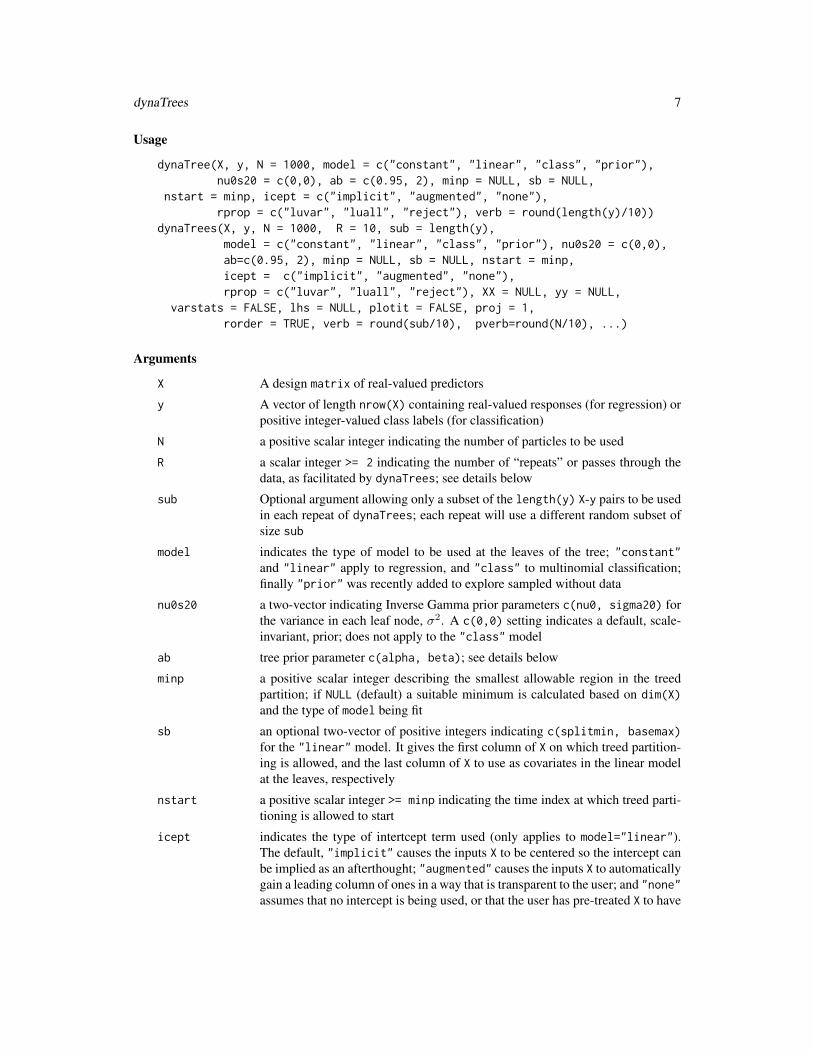
Usage
dynaTree(X, y, N = 1000, model = c("constant", "linear", "class", "prior"),nu0s20 = c(0,0), ab = c(0.95, 2), minp = NULL, sb = NULL,
nstart = minp, icept = c("implicit", "augmented", "none"),rprop = c("luvar", "luall", "reject"), verb = round(length(y)/10))
dynaTrees(X, y, N = 1000, R = 10, sub = length(y),model = c("constant", "linear", "class", "prior"), nu0s20 = c(0,0),ab=c(0.95, 2), minp = NULL, sb = NULL, nstart = minp,icept = c("implicit", "augmented", "none"),rprop = c("luvar", "luall", "reject"), XX = NULL, yy = NULL,
varstats = FALSE, lhs = NULL, plotit = FALSE, proj = 1,rorder = TRUE, verb = round(sub/10), pverb=round(N/10), ...)
Arguments
X A design matrix of real-valued predictors
y A vector of length nrow(X) containing real-valued responses (for regression) orpositive integer-valued class labels (for classification)
N a positive scalar integer indicating the number of particles to be used
R a scalar integer >= 2 indicating the number of “repeats” or passes through thedata, as facilitated by dynaTrees; see details below
sub Optional argument allowing only a subset of the length(y) X-y pairs to be usedin each repeat of dynaTrees; each repeat will use a different random subset ofsize sub
model indicates the type of model to be used at the leaves of the tree; "constant"and "linear" apply to regression, and "class" to multinomial classification;finally "prior" was recently added to explore sampled without data
nu0s20 a two-vector indicating Inverse Gamma prior parameters c(nu0, sigma20) forthe variance in each leaf node, σ2. A c(0,0) setting indicates a default, scale-invariant, prior; does not apply to the "class" model
ab tree prior parameter c(alpha, beta); see details below
minp a positive scalar integer describing the smallest allowable region in the treedpartition; if NULL (default) a suitable minimum is calculated based on dim(X)and the type of model being fit
sb an optional two-vector of positive integers indicating c(splitmin, basemax)for the "linear" model. It gives the first column of X on which treed partition-ing is allowed, and the last column of X to use as covariates in the linear modelat the leaves, respectively
nstart a positive scalar integer >= minp indicating the time index at which treed parti-tioning is allowed to start
icept indicates the type of intertcept term used (only applies to model="linear").The default, "implicit" causes the inputs X to be centered so the intercept canbe implied as an afterthought; "augmented" causes the inputs X to automaticallygain a leading column of ones in a way that is transparent to the user; and "none"assumes that no intercept is being used, or that the user has pre-treated X to have

8 dynaTrees
a column of ones. The main advantage of "implicit" over "augmented" isthat the former can default to a constant model fit if leaf design matrices becomerank deficient. The latter defaults to the zero-model in such cases
XX a design matrix of predictive locations (where ncol(XX) == ncol(X))for dynaTrees; also see predict.dynaTree and some explanation in the detailsbelow
yy an optional vector of “true” responses at the XX predictive locations at which thelog posterior probability are to be reported
varstats if TRUE causes the varpropuse, varproptotal, and relevance.dynaTree func-tions to be called on after each repetition to collect the usage proportions of eachinput variable (column of X); see those documentation files for more details
lhs an optional lhs argument to sens.dynaTree if a sensitivity analysis step isdesired after each restart (XX="sens")
plotit a scalar logical indicating if the fit should be plotted after each of the R repeats;only applies to 1-d data and dynaTrees
proj when ncol(x$X) > 1 and plotit = TRUE this argument is passed to plot.dynaTreeto make a 1-d projection using x$X[,proj]
rorder a scalar logical indicating if the rows of X (and corresponding components ofy) should be randomly re-ordered for repeats 2:R in order to assess the howthe time-ordering of the SMC effects the Monte Carlo error; only applies todynaTrees. Alternatively, one can specify an nrow(X)-by-(R-1) matrix of or-derings (permutations of 1:nrow(X))
rprop indicates the scheme used to construct a grow proposal. The best setting, "luall"uses the lower (L) and upper (U) rectangle method based on minp (above) as de-scribed in the seminal reference in which the growing location and dimension issampled uniformly. It can be computationally intensive for large input spaces.A thriftier option (the default) in this case is "luvar" which uniformly choosesthe splitting variable first and then uses the LU method marginally. Thriftier stillis "reject" which just proposes uniformly in the bounding leaf rectangle andrejects subsequent grows that lead to partitions with too few data points; (see theminp argument)
verb a positive scalar integer indicating how many time steps (iterations) should passbefore a progress statement is printed to the console; a value of verb = 0 isquiet
pverb a positive scalar integer indicating after many particles should be processedfor prediction before a progress statement is printed to the console; a value ofverb = 0 is quiet
... extra arguments to predict.dynaTree passed from dynaTrees
Details
The dynaTree function processes the X and y pairs serially via PL. It builds up a particle cloud whichis stored as an object in C. A “pointer” to that object is the primary return value. The dynaTreesfunction fits several (R) different dynamic tree models on different time-orderings of the data indicesand also obtains samples from the posterior predictive distribution at new XX locations. Thesepredictions can be averaged over each repeat, or used to assess the Monte Carlo predictive error.
dynaTrees 9
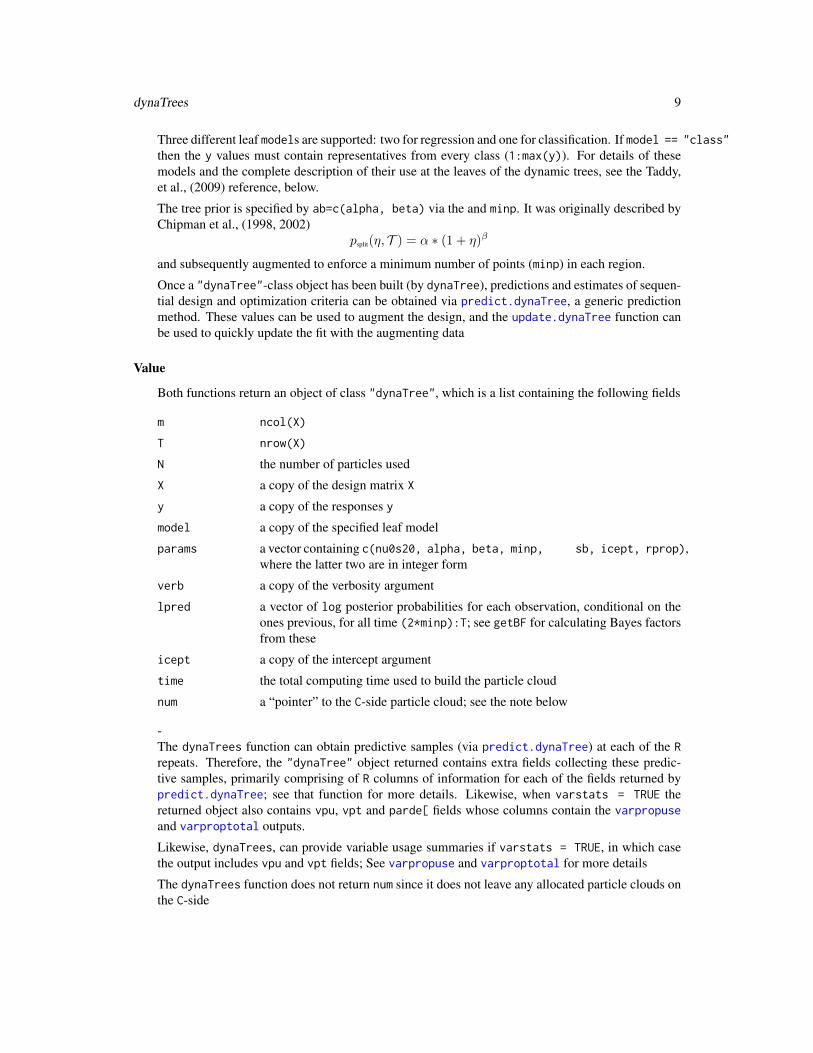
Three different leaf models are supported: two for regression and one for classification. If model == "class"then the y values must contain representatives from every class (1:max(y)). For details of thesemodels and the complete description of their use at the leaves of the dynamic trees, see the Taddy,et al., (2009) reference, below.
The tree prior is specified by ab=c(alpha, beta) via the and minp. It was originally described byChipman et al., (1998, 2002)
psplit(η, T ) = α ∗ (1 + η)β
and subsequently augmented to enforce a minimum number of points (minp) in each region.
Once a "dynaTree"-class object has been built (by dynaTree), predictions and estimates of sequen-tial design and optimization criteria can be obtained via predict.dynaTree, a generic predictionmethod. These values can be used to augment the design, and the update.dynaTree function canbe used to quickly update the fit with the augmenting data
Value
Both functions return an object of class "dynaTree", which is a list containing the following fields
m ncol(X)
T nrow(X)
N the number of particles used
X a copy of the design matrix X
y a copy of the responses y
model a copy of the specified leaf model
params a vector containing c(nu0s20, alpha, beta, minp, sb, icept, rprop),where the latter two are in integer form
verb a copy of the verbosity argument
lpred a vector of log posterior probabilities for each observation, conditional on theones previous, for all time (2*minp):T; see getBF for calculating Bayes factorsfrom these
icept a copy of the intercept argument
time the total computing time used to build the particle cloud
num a “pointer” to the C-side particle cloud; see the note below
-The dynaTrees function can obtain predictive samples (via predict.dynaTree) at each of the Rrepeats. Therefore, the "dynaTree" object returned contains extra fields collecting these predic-tive samples, primarily comprising of R columns of information for each of the fields returned bypredict.dynaTree; see that function for more details. Likewise, when varstats = TRUE thereturned object also contains vpu, vpt and parde[ fields whose columns contain the varpropuseand varproptotal outputs.
Likewise, dynaTrees, can provide variable usage summaries if varstats = TRUE, in which casethe output includes vpu and vpt fields; See varpropuse and varproptotal for more details
The dynaTrees function does not return num since it does not leave any allocated particle clouds onthe C-side
10 dynaTrees
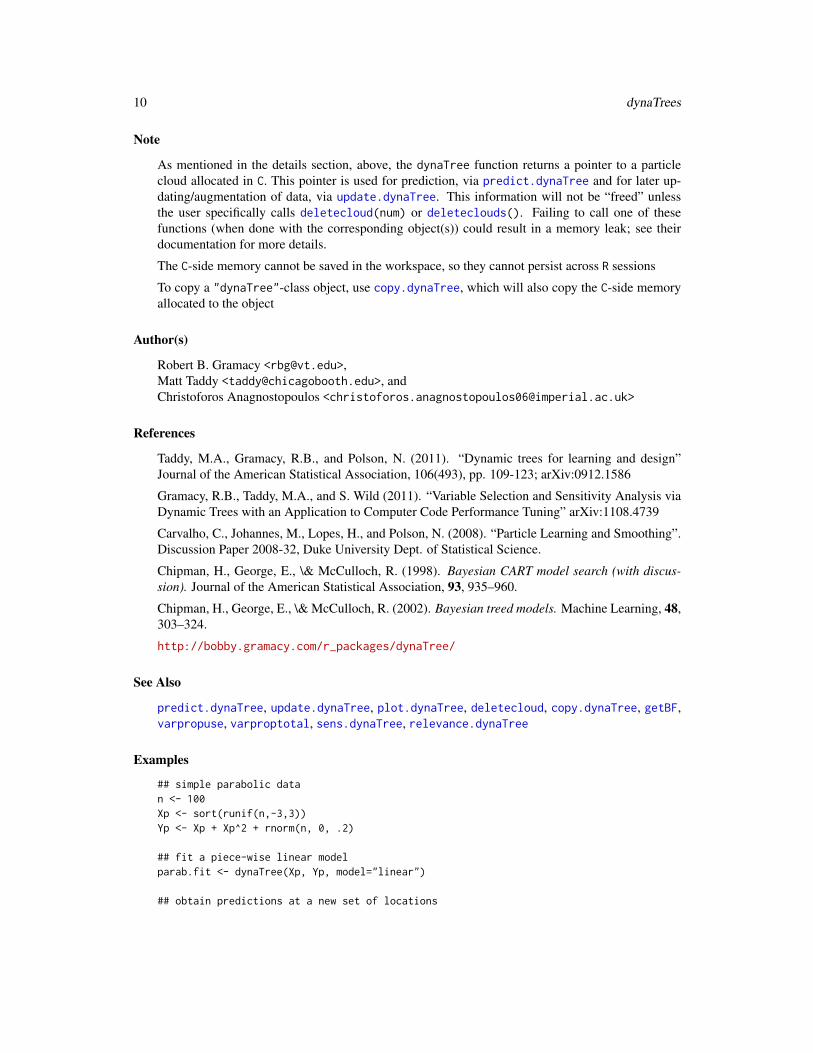
Note
As mentioned in the details section, above, the dynaTree function returns a pointer to a particlecloud allocated in C. This pointer is used for prediction, via predict.dynaTree and for later up-dating/augmentation of data, via update.dynaTree. This information will not be “freed” unlessthe user specifically calls deletecloud(num) or deleteclouds(). Failing to call one of thesefunctions (when done with the corresponding object(s)) could result in a memory leak; see theirdocumentation for more details.
The C-side memory cannot be saved in the workspace, so they cannot persist across R sessions
To copy a "dynaTree"-class object, use copy.dynaTree, which will also copy the C-side memoryallocated to the object
Author(s)
Robert B. Gramacy <[email protected]>,Matt Taddy <[email protected]>, andChristoforos Anagnostopoulos <[email protected]>
References
Taddy, M.A., Gramacy, R.B., and Polson, N. (2011). “Dynamic trees for learning and design”Journal of the American Statistical Association, 106(493), pp. 109-123; arXiv:0912.1586
Gramacy, R.B., Taddy, M.A., and S. Wild (2011). “Variable Selection and Sensitivity Analysis viaDynamic Trees with an Application to Computer Code Performance Tuning” arXiv:1108.4739
Carvalho, C., Johannes, M., Lopes, H., and Polson, N. (2008). “Particle Learning and Smoothing”.Discussion Paper 2008-32, Duke University Dept. of Statistical Science.
Chipman, H., George, E., \& McCulloch, R. (1998). Bayesian CART model search (with discus-sion). Journal of the American Statistical Association, 93, 935–960.
Chipman, H., George, E., \& McCulloch, R. (2002). Bayesian treed models. Machine Learning, 48,303–324.
http://bobby.gramacy.com/r_packages/dynaTree/
See Also
predict.dynaTree, update.dynaTree, plot.dynaTree, deletecloud, copy.dynaTree, getBF,varpropuse, varproptotal, sens.dynaTree, relevance.dynaTree
Examples
## simple parabolic datan <- 100Xp <- sort(runif(n,-3,3))Yp <- Xp + Xp^2 + rnorm(n, 0, .2)
## fit a piece-wise linear modelparab.fit <- dynaTree(Xp, Yp, model="linear")
## obtain predictions at a new set of locations

dynaTrees 11
## and plotparab.fit <- predict(parab.fit, XX=seq(-3, 3, length=100))plot(parab.fit)
## try duplicating the objectparab.fit.copy <- copy(parab.fit)
## must delete the cloud or memory may leakdeletecloud(parab.fit); parab.fit$num <- NULL## to delete all clouds, do:deleteclouds()
## for more examples of dynaTree see update.dynaTree
## Motorcycle accident datalibrary(MASS)data(mcycle)Xm <- mcycle[,1]Ym <- mcycle[,2]XXm <- seq(min(mcycle[,1]), max(mcycle[,1]), length=100)
R <- 2 ## use R >= 10 for better results## small R is for faster CRAN checks## fit constant model with R=2 repeats and predictionsmoto.fit <- dynaTrees(Xm, Ym, XX=XXm, R=R, plotit=TRUE)
## plot the averagesplot(moto.fit, ptype="mean")
## clouds automatically deleted by dynaTrees
## Not run:## 2-d/3-class classification datalibrary(plgp)library(tgp)xx <- seq(-2, 2, length=20)XX <- expand.grid(xx, xx)X <- dopt.gp(125, Xcand=XX)$XXC <- exp2d.C(X)
## fit a classification model with R=10 repeats,class.fit <- dynaTrees(X, C, XX=XX, model="class")
## for plot the output (no generic plotting available)cols <- c(gray(0.85), gray(0.625), gray(0.4))par(mfrow=c(1,2))library(akima)
## plot R-averaged predicted classmclass <- apply(class.fit$p, 1, which.max)image(interp(XX[,1], XX[,2], mclass), col=cols,
xlab="x1", ylab="x2", main="repeated class mean")points(X)

12 elec2
## plot R-averaged entropyment <- apply(class.fit$entropy, 1, mean)image(interp(XX[,1], XX[,2], ment),
xlab="x1", ylab="x2", main="repeated entropy mean")
## End(Not run)
elec2 The ELEC2 Data Set
Description
Electricity Pricing Data Set Exhibiting Concept Drift
Usage
data(elec2)
Format
A data frame with 27552 observations on the following 5 variables.
x1 a numeric vector
x2 a numeric vector
x3 a numeric vector
x4 a numeric vector
y class label
Details
This data has become a benchmark of sorts in streaming classification. It was first described byHarries (1999) and used thereafter for several performance comparisons [e.g., Baena-Garcia et al.(2006); Kuncheva and Plumpton, (2008)]. It holds information for the Australian New South Wales(NSW) Electricity Market, containing 27552 records dated from May 1996 to December 1998,each referring to a period of 30 minutes subsampled as the completely observed portion of 45312total records with missing values. These records have seven fields: a binary class label, two timestamp indicators (day of week, time), and four covariates capturing aspects of electricity demandand supply.
An appealing property of this dataset is that it is expected to contain drifting data distributionssince, during the recording period, the electricity market was expanded to include adjacent areas.This allowed for the production surplus of one region to be sold in the adjacent region, which inturn dampened price levels.
Source
M. Harries. “Splice-2 Comparative Evaluation: Electricity Pricing”. University of New SouthWales, School of Computer Science and Engineering technical report (1999)
elec2 13
References
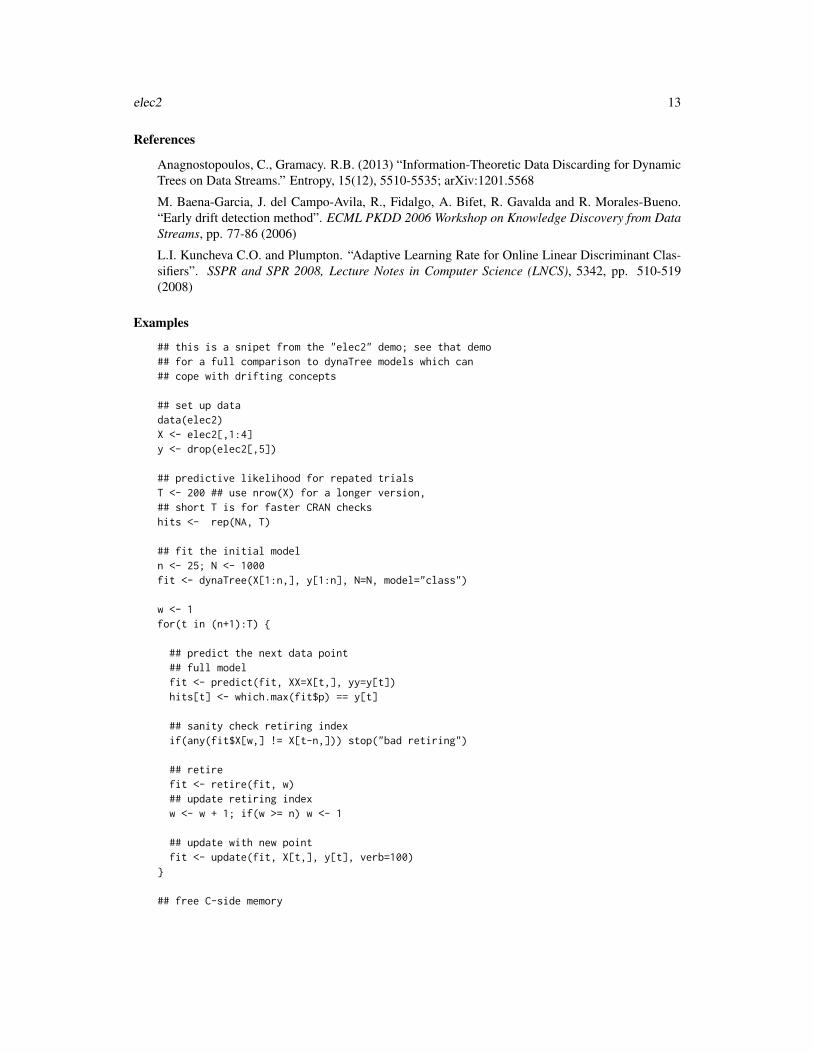
Anagnostopoulos, C., Gramacy. R.B. (2013) “Information-Theoretic Data Discarding for DynamicTrees on Data Streams.” Entropy, 15(12), 5510-5535; arXiv:1201.5568
M. Baena-Garcia, J. del Campo-Avila, R., Fidalgo, A. Bifet, R. Gavalda and R. Morales-Bueno.“Early drift detection method”. ECML PKDD 2006 Workshop on Knowledge Discovery from DataStreams, pp. 77-86 (2006)
L.I. Kuncheva C.O. and Plumpton. “Adaptive Learning Rate for Online Linear Discriminant Clas-sifiers”. SSPR and SPR 2008, Lecture Notes in Computer Science (LNCS), 5342, pp. 510-519(2008)
Examples
## this is a snipet from the "elec2" demo; see that demo## for a full comparison to dynaTree models which can## cope with drifting concepts
## set up datadata(elec2)X <- elec2[,1:4]y <- drop(elec2[,5])
## predictive likelihood for repated trialsT <- 200 ## use nrow(X) for a longer version,## short T is for faster CRAN checkshits <- rep(NA, T)
## fit the initial modeln <- 25; N <- 1000fit <- dynaTree(X[1:n,], y[1:n], N=N, model="class")
w <- 1for(t in (n+1):T) {
## predict the next data point## full modelfit <- predict(fit, XX=X[t,], yy=y[t])hits[t] <- which.max(fit$p) == y[t]
## sanity check retiring indexif(any(fit$X[w,] != X[t-n,])) stop("bad retiring")
## retirefit <- retire(fit, w)## update retiring indexw <- w + 1; if(w >= n) w <- 1
## update with new pointfit <- update(fit, X[t,], y[t], verb=100)
}
## free C-side memory

14 getBF
deleteclouds()
## plotting a moving window of hit rates over timerhits <- rep(0, length(hits))for(i in (n+1):length(hits)) {
rhits[i] <- 0.05*as.numeric(hits[i]) + 0.95*rhits[i-1]}
## plot moving window of hit ratesplot(rhits, type="l", main="moving window of hit rates",
ylab="hit rates", xlab="t")
getBF Extract a Path of (log) Bayes Factors
Description
Extract a path (log) Bayes factors (BFs) from the log marginal posterior probabilities of two "dynaTree"-class objects
Usage
getBF(obj1, obj2)
Arguments
obj1 a "dynaTree"-class object built by dynaTree
obj2 another "dynaTree"-class object built by dynaTree
Details
Simply calculates a difference in log marginal posterior probabilities, setting BFs to zero for initialelements of the path where one of the objects has more zero marginal probabilities than the other.The BF is for the model in obj1 over obj2. If the objects are the output of repeated fits as obtainedfrom dynaTrees, then multiple traces are returned
Value
Returns a vector or matrix of a trace(s) of Bayes factors that can be plotted; see examples below
Author(s)
Robert B. Gramacy <[email protected]>,Matt Taddy <[email protected]>, andChristoforos Anagnostopoulos <[email protected]>

plot.dynaTree 15
References
Taddy, M.A., Gramacy, R.B., and Polson, N. (2011). “Dynamic trees for learning and design”Journal of the American Statistical Association, 106(493), pp. 109-123; arXiv:0912.1586
Gramacy, R.B., Taddy, M.A., and S. Wild (2011). “Variable Selection and Sensitivity Analysis viaDynamic Trees with an Application to Computer Code Performance Tuning” arXiv:1108.4739
http://bobby.gramacy.com/r_packages/dynaTree/
See Also
dynaTree, update.dynaTree, link{logpost}
Examples
## parabola datan <- 100Xp <- sort(runif(n,-3,3))Yp <- Xp + Xp^2 + rnorm(n, 0, .2)XXp <- seq(-3,3,length=100)
## comparison by log Bayes FactorR <- 2 ## use R >= 10 for better results## small R is for faster CRAN checkso <- apply(matrix(runif(n*(R-1)), ncol=R-1), 2, order)lpc.p <- dynaTrees(Xp, Yp, R=R, rorder=o, verb=0)lpl.p <- dynaTrees(Xp, Yp, model="linear", R=R, rorder=o, verb=0)bf.p <- getBF(lpl.p, lpc.p)
## plot the log Bayes factorsmatplot(bf.p, type="l", lty=1, col="gray", main="parabola",
xlab="time", ylab="log Bayes factor")
## see demo("reg1d") for further examples
plot.dynaTree Plotting Predictive Distributions of Dynamic Tree models
Description
Plotting predictive distributions constructed from dynamic tree (regression) models for 1-d data –provided primarily for use in our 1-d examples and for illustrative purposes
Usage
## S3 method for class 'dynaTree'plot(x, proj = 1, add = FALSE, ylim = NULL,
col = 2, lwd = 1, ptype = c("each", "mean"), ...)

16 plot.dynaTree
Arguments
x a "dynaTree"-class object built by dynaTree
add a scalar logical indicating if the lines/points should be “added” to an existingplot
proj when ncol(x$X) > 1 this argument can be used to plot a 1-d projection byspecifying which column of x$X should be used to make the plot
ylim user-specified y-axis limits values; see plot
col user-specified color value; see plot
lwd user-specified line-width value; see plot
ptype type of plot used to visualize several predictive samples obtained from dynaTrees:"each" shows each surface with its own set of three lines, and "mean" showsthe three lines obtained by averaging
... other arguments to the generic plot method
Details
This plotting function only handles the predictive output from 1-dimensional regression dynaTreemodels as obtained by first calling dynaTree and then predict.dynaTree on the resulting outputat new XX locations. It is provided to help make the illustration of our 1-d examples easier and toserve as an aid in a user’s development of custom plotting functions in higher dimensions
Value
The only output of this function is a pretty plot
Author(s)
Robert B. Gramacy <[email protected]>,Matt Taddy <[email protected]>, andChristoforos Anagnostopoulos <[email protected]>
References
Taddy, M.A., Gramacy, R.B., and Polson, N. (2011). “Dynamic trees for learning and design”Journal of the American Statistical Association, 106(493), pp. 109-123; arXiv:0912.1586
http://bobby.gramacy.com/r_packages/dynaTree/
See Also
predict.dynaTree, dynaTree, update.dynaTree
Examples
## see dynaTree, dynaTrees and update.dynaTree for examples## which use this plot function

predict.dynaTree 17
predict.dynaTree Prediction for Dynamic Tree Models
Description
Predicting and calculating sequential design and optimization statistics at new design points (i.e.,active learning heuristics) for dynamic tree models
Usage
## S3 method for class 'dynaTree'predict(object, XX, yy = NULL, quants = TRUE,
ei = FALSE, verb = 0, ...)## S3 method for class 'dynaTree'coef(object, XX, verb = 0, ...)
Arguments
object a "dynaTree"-class object built by dynaTree
XX a design matrix of predictive locations (where ncol(XX) == ncol(X))
yy an optional vector of “true” responses at the XX predictive locations at which thelog posterior probability are to be reported
quants a scalar logical indicating if predictive quantiles are desired (useful for visu-alization, but less so for active learning); calculating predictive quantiles is ex-pensive and should be turned off if prediction is not being used for visualization,e.g., if used for active learning
ei a scalar logical indicating if the expected improvement statistic (for optimiza-tion) should be calculated and returned
verb a positive scalar integer indicating how many predictive locations (iterations)after which a progress statement should be printed to the console; a (default)value of verb = 0 is quiet
... to comply with the generic predict method – currently unused
Details
predict returns predictive summary statistics by averaging over the samples from the posteriorpredictive distribution obtained from each of the particles in the cloud pointed to by the object(object)
coef returns a matrix of regression coefficients used in linear model leaves (model = "linear")leaves, averaged over all particles, for each XX location. For other models it prints a warning anddefaults to predict.
The value(s) calculated are appended to object; the new fields are described below
Note that ALC calculations have been moved to the alc.dynaTree function(s)

18 predict.dynaTree
Value
The object returned is of class "dynaTree", which includes a copy of the list elements from theobject passed in, with the following (predictive) additions depending on whether object$modelis for regression ("constant" or "linear") or classification ("class").
For regression:
mean a vector containing an estimate of the predictive mean at the XX locations
vmean a vector containing an estimate of the variance of predictive mean at the XXlocations
var a vector containing an estimate of the predictive variance (average variance plusvariance of mean) at the XX locations
df a vector containing the average degrees of freedom at the XX locations
q1 a vector containing an estimate of the 5% quantile of the predictive distributionat the XX locations, unless quants = FALSE
q2 a vector containing an estimate of the 95% quantile of the predictive distributionat the XX locations, unless quants = FALSE
yypred if yy != NULL then this contains the predictive probability of the true yy valuesat the XX locations
ei a vector containing an estimate of the EI statistic, unless ei = FALSE
;
For classification:
p a nrow(XX)-by-max(object$y) matrix of mean class probabilities for each ofmax(object$y) classes at the predictive data locations
entropy a nrow(XX) vector of predictive entropys at the predictive data locations
;
For coef a new RXXc field is created so as not to trample on XXs that may have been used in aprevious predict, plus
coef a nrow(XX)-by-m+icept
matrix of particle- averaged regression coefficients.
Author(s)
Robert B. Gramacy <[email protected]>,Matt Taddy <[email protected]>, and Christoforos Anagnostopoulos <[email protected]>
References
Taddy, M.A., Gramacy, R.B., and Polson, N. (2011). “Dynamic trees for learning and design”Journal of the American Statistical Association, 106(493), pp. 109-123; arXiv:0912.1586
http://bobby.gramacy.com/r_packages/dynaTree/

rejuvenate.dynaTree 19
See Also
dynaTree, update.dynaTree, plot.dynaTree, alc.dynaTree, entropyX.dynaTree
Examples
## see the example(s) section(s) of dynaTree and## update.dynaTree and the demos (demo(package=dynaTree))
rejuvenate.dynaTree Rejuvenate particles from the dynaTree posterior
Description
Re-pass the X-y pairs in the object in a random (or specified) order to temporarily double the sizeof the particle set
Usage
## S3 method for class 'dynaTree'rejuvenate(object, odr = order(runif(length(object$y))),
verb = round(length(object$y)/10))
Arguments
object a "dynaTree"-class object built by dynaTree
odr an integer vector of length(object$y) specifying the order in which the object$X-object$y paris should be processed for the rejuvenated particles
verb a positive scalar integer indicating how many time steps (iterations) should passbefore a progress statement is printed to the console; a value of verb = 0 isquiet
Details
The rejuvenate function causes the particle set to temporarily double, to have size 2 * object$N.The new object$N particles represent a discrete approximation to the dynaTree posterior under theordering specified by odr, which may be random. Subsequent calls to update.dynaTree cause theparticle set to revert back to object$N particles as only that many are obtained from the particlelearning resample step.
This function can be particularly useful in online learning contexts, where retire.dynaTree isused to retain information on discarded data, especially when the data is discarded historicallyto deal with drifting concepts. Since the new, rejuvenated, particles are based only on the activedata, object$X-object$y pairs (and not the retired data via informative leaf priors), subsequentupdate.dynaTree steps allow the data to dictate if old (informative prior) or new (default prior)particles are best for the new concept

20 relevance.dynaTree
Value
The returned list is the same as dynaTree – i.e., a "dynaTree"-class object but with 2 * object$Nparticles. Note that object$N is not updated to reflect this fact, but the C-side object will indeedhave a double particle set. Repeated calls to rejuvenate will cause the particle set to double again.
Note
The object (object) must contain a pointer to a particle cloud (object$num) which has not beendeleted by deletecloud. In particular, it cannot be an object returned from dynaTrees
Author(s)
Robert B. Gramacy <[email protected]>,Matt Taddy <[email protected]>, andChristoforos Anagnostopoulos <[email protected]>
References
Taddy, M.A., Gramacy, R.B., and Polson, N. (2011). “Dynamic trees for learning and design”Journal of the American Statistical Association, 106(493), pp. 109-123; arXiv:0912.1586
Anagnostopoulos, C., Gramacy. R.B. (2013) “Information-Theoretic Data Discarding for DynamicTrees on Data Streams.” Entropy, 15(12), 5510-5535; arXiv:1201.5568
Carvalho, C., Johannes, M., Lopes, H., and Polson, N. (2008). “Particle Learning and Smoothing”.Discussion Paper 2008-32, Duke University Dept. of Statistical Science.
http://bobby.gramacy.com/r_packages/dynaTree/
See Also
dynaTree, alcX.dynaTree, entropyX.dynaTree, update.dynaTree, retire.dynaTree
Examples
## see retire.dynaTree for a combined example## illustrating rejuvenation
relevance.dynaTree Calculate relevance statistics for input coordinates
Description
Computes relevance statistics for each input coordinate by calculating their particle-averaged meanreduction in variance each time that coordinate is used as a splitting variable in (an internal nodeof) the tree(s)

relevance.dynaTree 21
Usage
relevance.dynaTree(object, rect = NULL, categ = NULL,approx = FALSE, verb = 0)
Arguments
object a "dynaTree"-class object built by dynaTree
rect an optional matrix with two columns and ncol(object$X) rows describingthe bounding rectangle for the ALC integration; the default that is used whenrect = NULL is the bounding rectangle obtained by applying range to each col-umn of object$X (taking care to remove the first/intercept column of object$Xif icept = "augmented"
categ A vector of logicals of length ncol(object$X) indicating which, if any, di-mensions of the input space should be treated as categorical; the default categargument is NULL meaning that the categorical inputs are derived from object$Xin a sensible way
approx a scalar logical indicating if the count of the number of data points in the leafshould be used in place of its area; this can help with numerical accuracy in highdimensional input spaces
verb a positive scalar integer indicating how many particles should be processed (iter-ations) before a progress statement should be printed to the console; a (default)value of verb = 0 is quiet
Details
Each binary split in the tree (in each particle) emits a reduction in variance (for regression models) ora reduction in entropy (for classification). This function calculates these reductions and attributesthem to the variable(s) involved in the split(s). Those with the largest relevances are the mostuseful for prediction. A sensible variable selection rule based on these relevances is to discardthose variables whose median relevance is not positive. See the Gramacy, Taddy, \& Wild (2011)reference below for more details.
The new set of particles is appended to the old set. However after a subsequent update.dynaTreecall the total number of particles reverts to the original amount.
Note that this does not work well with dynaTree objects which were built with model="linear".Rather, a full sensitivity analysis (sens.dynaTree) is needed. Usually it is best to first do model="constant"and then use relevance.dynaTree. Bayes factors (getBF) can be used to back up any variable se-lections implied by the relevance. Then, if desired, one can re-fit on the new (possibly reduced) setof predictors with model="linear".
There are no caveats with model="class"
Value
The entire object is returned with a new entry called relevance containing a matrix with ncol(X)columns. Each row contains the sample from the relevance of each input, and there is a row for eachparticle

22 retire.dynaTree
Author(s)
Robert B. Gramacy <[email protected]>,Matt Taddy <[email protected]>, andChristoforos Anagnostopoulos <[email protected]>
References
Gramacy, R.B., Taddy, M.A., and S. Wild (2011). “Variable Selection and Sensitivity Analysis viaDynamic Trees with an Application to Computer Code Performance Tuning” arXiv:1108.4739
http://bobby.gramacy.com/r_packages/dynaTree/
See Also
dynaTree, sens.dynaTree, predict.dynaTree varpropuse, varproptotal
Examples
## see the examples in sens.dynaTree for the relevances;## Also see varpropuse and the class2d demo via## demo("class2d")
retire.dynaTree Retire (i.e. remove) data from the a dynaTree model
Description
Allows the removal (or “retireing” of X-y pairs from a "dynaTree"-class object to facilitate onlinelearning; “retireed” pairs ar absorbed into the leaf prior(s)
Usage
## S3 method for class 'dynaTree'retire(object, indices, lambda = 1, verb = 0)
Arguments
object a "dynaTree"-class object built by dynaTree
indices a vector of positive integers in 1:nrow(object$X) indicating which X-y pairs to“retire”; must have length(indices) <= nrow(object$X)
lambda a scalar proportion (forgetting factor) used to downweight the previous priorsummary statistics
verb a nonzero scalar causes info about the “retireed” indices, i.e., their X-y values,to be printed to the screen as they are “retireed”

retire.dynaTree 23
Details
Primarily for use in online learning contexts. After “retireing” the predictive distribution remainsunchanged, because the sufficient statistics of the removed pairs enters the prior in the leaves ofthe tree of each particle. Further update.dynaTree calls (adding data) may cause changes to theposterior predictive as grow moves cannot keep the “retires”; see a forthcoming paper for moredetails. In many ways, retire.dynaTree is the opposite of update.dynaTree except that the lossof information upon “retireing” is not complete.
Drifting regression or classification relationships may be modeled with a forgetting factor lambda < 1
The alcX.dynaTree provides a good, and computationally efficient, heuristic for choosing whichpoints to “retire” for regression models, and likewise link{entropyX.dynaTree} for classificationmodels.
Note that classification models (model = "class") are not supported, and implicit intercepts(icept = "implicit") with linear models (model = "linear") are not supported at this time
Value
returns a "dynaTree"-class object with updated attributes
Note
In order to use model = "linear" with dynaTree and retirement one must also specify icept = "augmented"which automatically augments an extra column of ones onto the input X design matrix/matrices. Theretire function only supports this icept case
Author(s)
Robert B. Gramacy <[email protected]>,Matt Taddy <[email protected]>, andChristoforos Anagnostopoulos <[email protected]>
References
Anagnostopoulos, C., Gramacy. R.B. (2013) “Information-Theoretic Data Discarding for DynamicTrees on Data Streams.” Entropy, 15(12), 5510-5535; arXiv:1201.5568
http://bobby.gramacy.com/r_packages/dynaTree/
See Also
dynaTree, alcX.dynaTree, entropyX.dynaTree, update.dynaTree, rejuvenate.dynaTree
Examples
n <- 100Xp <- runif(n,-3,3)XX <- seq(-3,3, length=200)Yp <- Xp + Xp^2 + rnorm(n, 0, .2)rect <- c(-3,3)out <- dynaTree(Xp, Yp, model="linear", icept="augmented")
24 sens.dynaTree
## predict and plotout <- predict(out, XX)plot(out, main="parabola data", lwd=2)
## randomly remove half of the data pointsout <- retire(out, sample(1:n, n/2, replace=FALSE))
## predict and add to plot -- shouldn't change anythingout <- predict(out, XX)plot(out, add=TRUE, col=3)points(out$X[,-1], out$y, col=3)
## now illustrating rejuvenation, which should result## in a change to the predictive surfaceout <- rejuvenate(out)out <- predict(out, XX)plot(out, add=TRUE, col=4)legend("top", c("original", "retired", "rejuvenated"),
col=2:4, lty=1)
## clean updeletecloud(out)
## see demo("online") for an online learning example## where ALC is used for retirement
sens.dynaTree Monte Carlo Sensitivity Analysis for dynaTree Models
Description
A Monte Carlo sensitivity analysis using random Latin hypercube samples (LHSs) or bootstrapresamples for each particle to estimate main effects as well as 1st order and total sensitivity indices
Usage
## S3 method for class 'dynaTree'sens(object, class = NULL, nns = 1000, nME = 100,
span = 0.3, method = c("lhs", "boot"),lhs = NULL, categ = NULL, verb = 0)
Arguments
object a "dynaTree"-class object built by dynaTree
class only valid for object$model = "class", allows the user to specify the subset ofclass labels in unique(object$y) for which sensitivity indices are calculated.The implementation loops over the vector of labels provided. The default ofNULL results in class = unique(object$y)
sens.dynaTree 25
nns A positive integer scalar indicating the size of each LHS or bootstrap drawn foruse in the Monte Carlo integration scheme underlying the sensitivity analysis;the total number of locations is nn.lhs*(ncol(X)+2)
nME A positive integer scalar indicating number of grid points, in each input dimen-sion, upon which main effects will be estimated
span A positive real-valued scalar giving the smoothing parameter for main effectsintegration: the fraction of nns points that will be included in a moving averagewindow that is used to estimate main effects at the nME locations in each inputdimension
method indicates whether LHS or bootstrap should be used
lhs if method = "lhs" then this argument should be a list with entries rect,shape and mode describing the marginal distributions of the Latin Hypercube;specify NULL for a default specification for method = "boot". The fields shouldhave the following format(s):
• rect: Optional rectangle describing the domain of the uncertainty distribu-tion with respect to which the sensitivity is to be determined. This definesthe domain from which the LH sample is to be taken. The rectangle shouldbe a matrix or data.frame with ncol(rect) = 2, and number of rowsequal to the dimension of the domain. For 1-d data, a vector of length 2 isallowed. The default is the input data range of each column of (object$X).
• shape: Optional vector of shape parameters for Beta marginal distribu-tions having length ncol(object$X) and elements > 1, i.e., concave Betadistributions. If specified, the uncertainty distribution (i.e. the LHS) is pro-portional to a joint pdf formed by independent Beta distributions in each di-mension of the domain, scaled and shifted to have support defined by rect.If unspecified, the uncertainty distribution is uniform over rect. The spec-ification shape[i]=0 instructs sens to treat the i’th dimension as a binaryvariable. In this case, mode[i] is the probability parameter for a bernoulliuncertainty distribution, and we must also have rect[i,]=c(0,1).
• mode: Optional vector of mode values for the Beta uncertainty distribution.Vector of length equal to the dimension of the domain, with elements withinthe support defined by rect. If shape is specified, but this is not, then thescaled Beta distributions will be symmetric.
categ A vector of logicals of length ncol(object$X) indicating which, if any, dimen-sions of the input space should be treated as categorical; this input is used tohelp set the default lhs$shape argument if not specified; the default categ ar-gument is NULL meaning that the categorical inputs are derived from object$Xin a sensible way
verb a positive scalar integer indicating how many predictive locations (iterations)after which a progress statement should be printed to the console; a (default)value of verb = 0 is quiet
Details
Saltelli (2002) describes a Latin Hypercube sampling based method for estimation of the ’Sobol’sensitivity indices:

26 sens.dynaTree
1st Order for input i,S(i) = Var(E[f |xi])/Var(f),
where xi is the i-th input.
Total Effect for input i,T (i) = E[Var(f |x−i)]/Var(f),
where x−i is all inputs except for the i-th.
All moments are with respect to the appropriate marginals of the uncertainty distribution U – thatis, the probability distribution on the inputs with respect to which sensitivity is being investigated.Under this approach, the integrals involved are approximated through averages over properly chosensamples based on two LH samples proportional to U. If nns is the sample size for the Monte Carloestimate, this scheme requires nns*(ncol(X)+2) function evaluations.
The sens.dynaTree function implements the method for unknown functions f , through predictionvia one of the tgp regression models conditional on an observed set of X locations. For each particle,treated as sample from the dynaTree model posterior, the nns*(ncol(X)+2) locations are drawnrandomly from the LHS scheme and realizations of the sensitivity indices are calculated. Thuswe obtain a posterior sample of the indices, incorporating variability from both the Monte Carloestimation and uncertainty about the function output. Since a subset of the predictive locations areactually an LHS proportional to the uncertainty distribution, we can also estimate the main effectsthrough simple non-parametric regression (a moving average).
See the Gramacy, Taddy, \& Wild (2011) reference below for more details.
If method = "boot" is used then simply replace LHS above with a bootstrap resample of theobject$X locations.
As with prediction, the dynaTrees function enables repeated calls to sens.dynaTree
Value
The object returned is of class "dynaTree", which includes a copy of the list elements from theobject passed in, with the following (sensitivity-analysis specific) additions.
MEgrid An nME-by-ncol(object$X) matrix containing the main effects predictive gridat which the following MEmean, MEq1, and MEq2 quantities were obtained
MEmean A matrix with ncol(object$X) columns and nME rows containing the meanmain effects for each input dimension
MEq1 same as MEmean but containing the 5% quantiles
MEq2 same as MEmean but containing the 95% quantiles
S An object$N-row and ncol(object$X) matrix containing the posterior (sam-ples) of the 1st Order Sobol sensitivity indices
T same as S but containing the Total Effect indices
In the case of object$model = "class" the entries listed above will themselves be lists with anentry for each class specified on input, or all classes as is the default

sens.dynaTree 27
Note
The quality of sensitivity analysis is dependent on the size of the LHSs used for integral approx-imation; as with any Monte Carlo integration scheme, the sample size (nns) must increase withthe dimensionality of the problem. The total sensitivity indices T are forced non-negative, and ifnegative values occur it is necessary to increase nnd. Postprocessing replaces negative values withNA
Author(s)
Robert B. Gramacy <[email protected]>,Matt Taddy <[email protected]>, andChristoforos Anagnostopoulos <[email protected]>
References
Saltelli, A. (2002) Making best use of model evaluations to compute sensitivity indices. ComputerPhysics Communications, 145, 280-297.
Gramacy, R.B., Taddy, M.A., and S. Wild (2011). “Variable Selection and Sensitivity Analysis viaDynamic Trees with an Application to Computer Code Performance Tuning” arXiv:1108.4739
http://bobby.gramacy.com/r_packages/dynaTree/
See Also
dynaTree, predict.dynaTree, relevance.dynaTree, varpropuse, varproptotal
Examples
## friedman datalibrary(tgp)f <- friedman.1.data(1000)X <- f[,1:6]Z <- f$Y
## fit the model and do the sensitivity analysisN <- 100 ## use N >= 1000 for better results## small N is for fast CRAN checksout <- dynaTree(X=X, y=Z, N=N, ab=c(0.01,2))## also try with model="linear"
## gather relevance statisticsout <- relevance(out)boxplot(out$relevance)abline(h=0, col=2, lty=2)## relevance stats are not as useful when model="linear"## since it will appear that x4 and x5 not helpful; these## interact linearly with the response
## full simulation-based sensitivity analysis, the dynaTree::## part is only needed if the tgp package is loadedout <- dynaTree::sens(out, verb=100)

28 update.dynaTree
## plot the main effectsr <- range(rbind(c(out$MEmean, out$MEq1, out$MEq2)))par(mfrow=c(1,ncol(out$X)), mar=c(5,3,2,1))plot(out$MEgrid[,1], out$MEmean[,1], type="l", ylim=r, lwd=2,
ylab="", xlab=colnames(out$MEmean)[1])lines(out$MEgrid[,1], out$MEq1[,1], lty=2, lwd=2)lines(out$MEgrid[,1], out$MEq2[,1], lty=2, lwd=2)if(ncol(out$X) > 1) {
for(d in 2:ncol(out$X)) {plot(out$MEgrid[,d], out$MEmean[,d], col=d, type="l", ylim=r,
lwd=2, xlab=colnames(out$MEmean)[d], ylab="")lines(out$MEgrid[,d], out$MEq1[,d], col=d, lty=2)lines(out$MEgrid[,d], out$MEq2[,d], col=d, lty=2)
}}
## Sobol indicespar(mfrow=c(1,2), mar=c(5,4,4,2))boxplot(out$S, main="first order indices", xlab="inputs")boxplot(out$T, main="total indices", xlab="inputs")## these look better when model="linear"
## clean updeletecloud(out)
## for a classification example using the sensitivity hooks## in the dynaTrees function, see the class2d demo## i.e., demo("class2d")
update.dynaTree Updating a Dynamic Tree Model With New Data
Description
Updating an already-initialized dynamic tree model with new input/output pairs, primarily to facil-itate sequential design and optimization applications
Usage
## S3 method for class 'dynaTree'update(object, X, y, verb = round(length(y)/10), ...)
Arguments
object a "dynaTree"-class object built by dynaTree
X an augmenting design matrix of real-valued predictors with ncol(X) = object$m
y an augmenting vector of real-valued responses or integer categories with length(y) = nrow(X)

update.dynaTree 29
verb a positive scalar integer indicating how many time steps (iterations) after whicha progress statement should be printed to the console; a value of verb = 0 isquiet
... to comply with the generic predict method – currently unused
Details
This function updates the dynaTree fit with new (X,y) pairs by the Particle Learning (PL) algo-rithm. The updated fit will be for data combined as rbind(object$X, X) and c(object$y, y).
The primary use of this function is to facilitate sequential design by optimization and active learn-ing. Typically one would use predict.dynaTree to estimate active learning statistics at candidatelocation. These are used to pick new (X,y) locations to add to the design – the new fit beingfacilitated by this function; see the examples below
Value
The returned list is the same as dynaTree – i.e., a "dynaTree"-class object
Note
The object (object) must contain a pointer to a particle cloud (object$num) which has not beendeleted by deletecloud. In particular, it cannot be an object returned from dynaTrees
Author(s)
Robert B. Gramacy <[email protected]>,Matt Taddy <[email protected]>, andChristoforos Anagnostopoulos <[email protected]>
References
Taddy, M.A., Gramacy, R.B., and Polson, N. (2011). “Dynamic trees for learning and design”Journal of the American Statistical Association, 106(493), pp. 109-123; arXiv:0912.1586
Anagnostopoulos, C., Gramacy. R.B. (2013) “Information-Theoretic Data Discarding for DynamicTrees on Data Streams.” Entropy, 15(12), 5510-5535; arXiv:1201.5568
Carvalho, C., Johannes, M., Lopes, H., and Polson, N. (2008). “Particle Learning and Smoothing”.Discussion Paper 2008-32, Duke University Dept. of Statistical Science.
http://bobby.gramacy.com/r_packages/dynaTree/
See Also
predict.dynaTree, dynaTree, plot.dynaTree, deletecloud, getBF
30 varpropuse
Examples
## simple function describing (x,y) dataf1d <- function(x, sd=0.1){
return( sin(x) - dcauchy(x,1.6,0.15) + rnorm(1,0,sd))}
## initial (x,y) dataX <- seq(0, 7, length=30)y <- f1d(X)
## PL fit to initial dataobj <- dynaTree(X=X, y=y, N=1000, model="linear")
## a predictive gridXX <- seq(0,7, length=100)obj <- predict(obj, XX, quants=FALSE)
## follow the ALM algorithm and choose the next## point with the highest predictive variancem <- which.max(obj$var)xstar <- drop(obj$XX[m,])ystar <- f1d(xstar)
## plot the next chosen pointpar(mfrow=c(2,1))plot(obj, ylab="y", xlab="x", main="fitted surface")points(xstar, ystar, col=3, pch=20)plot(obj$XX, sqrt(obj$var), type="l", xlab="x",
ylab="predictive sd", main="active learning")
## update the fit with (xstar, ystar)obj <- update(obj, xstar, ystar)
## new predictive surfaceobj <- predict(obj, XX, quants=FALSE)
## plottedplot(obj, ylab="y", xlab="x", main="updated fitted surface")plot(obj$XX, sqrt(obj$var), type="l", xlab="x",
ylab="predictive sd", main="active learning")
## delete the cloud to prevent a memory leakdeletecloud(obj); obj$num <- NULL
## see demo("design") for more iterations and## design under other active learning heuristics## like ALC, and EI for optimization; also see## demo("online") for an online learning example
varpropuse 31
varpropuse Calculate the proportion of variables used in tree splits, and averagesummary stats of tree heights and leaf sizes
Description
Calculates the proportion of particles which use each input to make a tree split and the proportionof all splits in trees of each particle that correspond to each input variable; also provides tree heightand leaf size summary information
Usage
## S3 method for class 'dynaTree'varpropuse(object)## S3 method for class 'dynaTree'varproptotal(object)## S3 method for class 'dynaTree'treestats(object)
Arguments
object a "dynaTree"-class object built by dynaTree
Details
varpropuse gives the proportion of times a particle uses each input variable in a tree split; varproptotalgives the proportion of total uses by the tree in each particle (i.e., averaged over the total number ofsplits used in the tree).
Usually, varpropuse returns a vector of (nearly) all ones unless there are variables which are notuseful in predicting the response. Using model = "linear" is not recommended for this sort ofvariable selection.
treestats returns the average tree height, and the average leaf size, both active and retired
Value
For varprop*, a vector of proportions of length ncol(object$X)) is returned; for treestats a1-row, 4-column data.frame is returned
Author(s)
Robert B. Gramacy <[email protected]>,Matt Taddy <[email protected]>, andChristoforos Anagnostopoulos <[email protected]>
References
Gramacy, R.B., Taddy, M.A., and S. Wild (2011). “Variable Selection and Sensitivity Analysis viaDynamic Trees with an Application to Computer Code Performance Tuning” arXiv:1108.4739
http://bobby.gramacy.com/r_packages/dynaTree/

32 varpropuse
See Also
dynaTree, sens.dynaTree, relevance.dynaTree
Examples
## ffit a dynaTree model to the Ozone dataX <- airquality[,2:4]y <- airquality$Ozonena <- apply(is.na(X), 1, any) | is.na(y)out <- dynaTree(X=X[!na,], y=y[!na])
## obtain variable usage proportionsvarpropuse(out)varproptotal(out)
## gather relevance statistics which are more meaningfulout <- relevance(out)boxplot(out$relevance)abline(h=0, col=2, lty=2)
## obtain tree statisticstreestats(out)
## clean updeletecloud(out)

Index
∗Topic aplotplot.dynaTree, 15
∗Topic classesdynaTree-class, 5
∗Topic classifdynaTrees, 6
∗Topic datasetselec2, 12
∗Topic designupdate.dynaTree, 28
∗Topic hplotplot.dynaTree, 15
∗Topic htestgetBF, 14relevance.dynaTree, 20sens.dynaTree, 24
∗Topic methodsalcX.dynaTree, 3dynaTree-class, 5predict.dynaTree, 17rejuvenate.dynaTree, 19relevance.dynaTree, 20retire.dynaTree, 22sens.dynaTree, 24update.dynaTree, 28
∗Topic methodvarpropuse, 31
∗Topic nonlineardynaTrees, 6
∗Topic nonparametricdynaTrees, 6
∗Topic packagedynaTree-package, 2
∗Topic regressiondynaTrees, 6
∗Topic treedynaTrees, 6varpropuse, 31
alc (dynaTree-class), 5
alc,dynaTree-method (dynaTree-class), 5alc-methods (dynaTree-class), 5alc.dynaTree, 17, 19alc.dynaTree (alcX.dynaTree), 3alcX (dynaTree-class), 5alcX,dynaTree-method (dynaTree-class), 5alcX-methods (dynaTree-class), 5alcX.dynaTree, 3, 6, 20, 23
classprobs (dynaTree-class), 5classprobs,dynaTree-method
(dynaTree-class), 5classprobs-methods (dynaTree-class), 5coef.dynaTree (predict.dynaTree), 17copy (dynaTree-class), 5copy,dynaTree-method (dynaTree-class), 5copy-methods (dynaTree-class), 5copy.dynaTree, 10
data.frame, 31deletecloud, 10, 20, 29deleteclouds, 10dynaTree, 3, 4, 6, 14–17, 19–24, 26–29, 31, 32dynaTree (dynaTrees), 6dynaTree-class, 5dynaTree-package, 2dynaTrees, 6, 14, 16, 20, 26, 29
elec2, 12entropyX (dynaTree-class), 5entropyX,dynaTree-method
(dynaTree-class), 5entropyX-methods (dynaTree-class), 5entropyX.dynaTree, 19, 20, 23entropyX.dynaTree (alcX.dynaTree), 3
getBF, 10, 14, 21, 29
ieci (dynaTree-class), 5ieci,dynaTree-method (dynaTree-class), 5ieci-methods (dynaTree-class), 5
33

34 INDEX
intervals (dynaTree-class), 5intervals,dynaTree-method
(dynaTree-class), 5intervals-methods (dynaTree-class), 5
list, 25
matrix, 26
plot, 16plot.dynaTree, 8, 10, 15, 19, 29predict, 17, 29predict.dynaTree, 4, 6, 8–10, 16, 17, 22, 27,
29
qEI,dynaTree-method (dynaTree-class), 5qEntropy,dynaTree-method
(dynaTree-class), 5
range, 3, 21rejuvenate (dynaTree-class), 5rejuvenate,dynaTree-method
(dynaTree-class), 5rejuvenate-methods (dynaTree-class), 5rejuvenate.dynaTree, 19, 23relevance (dynaTree-class), 5relevance,dynaTree-method
(dynaTree-class), 5relevance-methods (dynaTree-class), 5relevance.dynaTree, 8, 10, 20, 21, 27, 32retire (dynaTree-class), 5retire,dynaTree-method
(dynaTree-class), 5retire-methods (dynaTree-class), 5retire.dynaTree, 4–6, 19, 20, 22, 23
sameleaf (dynaTree-class), 5sameleaf,dynaTree-method
(dynaTree-class), 5sameleaf-methods (dynaTree-class), 5sens (dynaTree-class), 5sens,dynaTree-method (dynaTree-class), 5sens-methods (dynaTree-class), 5sens.dynaTree, 5, 6, 8, 10, 21, 22, 24, 32
treestats (dynaTree-class), 5treestats,dynaTree-method
(dynaTree-class), 5treestats-methods (dynaTree-class), 5treestats.dynaTree (varpropuse), 31
update.dynaTree, 6, 9, 10, 15, 16, 19–21, 23,28
varproptotal, 8–10, 22, 27varproptotal (dynaTree-class), 5varproptotal,dynaTree-method
(dynaTree-class), 5varproptotal-methods (dynaTree-class), 5varproptotal.dynaTree (varpropuse), 31varpropuse, 8–10, 22, 27, 30varpropuse (dynaTree-class), 5varpropuse,dynaTree-method
(dynaTree-class), 5varpropuse-methods (dynaTree-class), 5varpropuse.dynaTree (varpropuse), 31