
Pacific Region - Science & Technology · Pacific Region | Regional Summary midwater trawl, Oregon...
24
Pacific Region • California • Oregon • Washington Catcher-processor vessel, Washington (photo credit: Leif Anderson)
Transcript of Pacific Region - Science & Technology · Pacific Region | Regional Summary midwater trawl, Oregon...
Pacific Region• California• Oregon• Washington
Catcher-processor vessel, Washington (photo credit: Leif Anderson)
30
Nat
iona
l Ove
rvie
w |
Nor
th P
acifi
c |
Paci
fic |
Wes
tern
Pac
ific
| N
ew E
ngla
nd |
Mid
-Atla
ntic
| S
outh
Atla
ntic
| G
ulf
of M
exic
oPacific Region | Regional Summary
MANAGEMENT CONTEXTThe Pacific Region includes California, Oregon and Wash-ington. Federal fisheries in this region are managed by the Pacific Fishery Management Council (PFMC) and NOAA Fisheries under four fishery management plans (FMPs).
Four of the stocks or stock complexes covered in these FMPs were listed as overfished in 2014: canary rockfish, Pacific ocean perch, yelloweye rockfish and Pacific blue-fin tuna. Two stock complexes were subject to overfish-ing in 2014: bigeye tuna and Pacific bluefin tuna.
Interesting management techniques are employed in the Pacific Region’s fisheries. For example, the Pacific ground-fish and salmon fisheries are subject to "weak stock management," where access to the harvestable surplus of healthier stocks is of 10 restricted to protect weaker stocks with which they co-mingle in the ocean. These weaker stocks include seven rebuilding groundfish stocks, salmon (listed under the Endangered Species Act), and other non-listed stocks that constrain the fishery.
Salmon management is further complicated by the need to ensure equitable allocation of harvest among diverse user groups and coordination with other entities that have jurisdiction over other aspects of salmon manage-ment. Decades of habitat modification, hatchery prac-tices, harvest, and growing competition for water have affected the viability of salmon stocks and made them more vulnerable to adverse environmental conditions. These conditions include the prolonged drought and ad-verse ocean conditions experienced in recent years. Low returns of salmon to the Klamath River in 2006, and to the Sacramento River in 2008 and 2009, resulted in unprecedented closures of ocean and in-river fisheries, leading to federal disaster relief for affected entities.
Coastal pelagic species (CPS) are highly variable, en-vironmentally sensitive stocks that provide forage for
marine mammals, birds and fish. These species include Pacific sardine, northern anchovy, Pacific and jack mackerel, and market squid. Of these, Pacific sardine is the most commonly targeted CPS finfish and is man-aged via an innovative harvest control rule: allowable harvest varies with sea surface temperature. Because the geographic range of sardine tends to expand with abundance, harvest allocation between the Califor-nia and Pacific Northwest fisheries is an ongoing and dynamic issue. The annual sardine harvest guideline is allocated coast-wide on a seasonal basis. Recent de-creases in harvest guideline limits have contributed to the development of an intense derby fishery.
Catch limits for Pacific halibut, a transboundary fish stock, are set in January by the International Pacific Halibut Commission (IPHC). This bilateral commission between the U.S. and Canada determines total allowable catch levels (TACs) for Pacific halibut that will be caught in the U.S. and Canadian exclusive economic zones (EEZs). After catch levels are determined, the PFMC develops a catch-sharing plan for tribal and non-tribal (commercial and recreational) fisheries conducted in the federal waters of California, Oregon and Washington.
The Highly Migratory Species (HMS) FMP includes tunas, billfish and pelagic sharks as managed species. The albacore surface hook-and-line fishery is by far the most economically important commercial HMS fishery, followed by the drift gillnet fishery for swordfish and thresher shark. HMS is also a very important compo-nent of the catch for the Pacific Region’s recreational commercial passenger fishing vessel fleet and the pri-vate recreational boat fleet.
CATCH SHARE PROGRAMSMarket-based management tools are used by fishery managers to reduce over-capitalization, increase the economic viability of fisheries, and promote individual accountability for harvest and harvesting practices. Lim-ited access privilege programs (LAPPs) and other catch share programs make up a category of such tools. Eco-labels are another market-based management tool that encourages fishermen to adopt harvest practices that are considered sustainable by an organization, such as the Marine Stewardship Council (MSC). The Pacific hake
Pacific Region FMPs
1. Coastal pelagic species2. Pacific coast salmon1. Pacific coast groundfish2. West Coast highly migratory species
31
National O
verview | N
orth Pacific | Pacific | Western Pacific | N
ew England | M
id-Atlantic | South Atlantic | G
ulf of Mexico
Pacific Region | Regional Summary
midwater trawl, Oregon pink shrimp, Oregon Dungeness crab, American Albacore Fishing Association albacore tuna, North Pacific halibut, and West Coast limited entry trawl groundfish fisheries have all received certifications from the MSC.
The Pacific Region has two catch share programs: 1) the Pacific Sablefish Permit Stacking Program; and 2) the Pacific Groundfish Trawl Rationalization Program. The landings revenues for these programs totaled more than $257 million in 2013. Following is a description of these catch share programs and their performance.
Pacific Sablefish Permit Stacking Program: This catch share prorgam was implemented in 2001 and al-lows vessels to stack multiple vessel permits on a single vessel. The goal of this approach is to improve econom-ic efficiency through rationalization of the fixed gear fleet, increase benefit for fishing communities, promote equity, mitigate reallocation effects of previous har-vest regulations, promote safety, and improve product quality and value. Results for this program show that in 2013, the number of active vessels, landings, and inflation-adjusted revenue decreased compared with the Baseline period (average of the 3-year period prior to start date). However, inflation-adjusted revenue per vessel increased during this period.
Pacific Trawl Rationalization Program: This catch share program was implemented by the PFMC in Jan-uary 2011. This Program involves individual fishing quotas (IFQs) for non-whiting groundfish and whit-ing trawlers, and cooperatives for whiting mothership and catcher processor sectors. The objectives of this program are to provide a mechanism for total catch accounting; provide a viable, profitable and efficient groundfish fishery; promote practices that reduce by-catch and discard mortality, and minimize ecological im-pacts; increase operational flexibility; minimize adverse effects from the IFQ program on fishing communities and other fisheries; promote measurable economic and employment benefits through the seafood catching, processing, distribution elements and support sectors of the industry; provide quality product for the consumer; and increase safety in the fishery.
The economic performance of the Program has been strong - net revenue per active catcher vessel increased 65 percent relative to the pre-catch share period (2009-2010) for the non-whiting groundfish fishery, and 400 percent for the whiting fishery. Meanwhile, motherships experienced a 62 percent increase and catcher-proces-sors experienced a 7 percent decrease in net revenue. Expanded observer coverage and dockside monitoring, which were implemented coincident to the catch share program, coupled with long-term adherence to catch targets and improved stock assessment models have also contributed, to varying degrees, to improved fish-ery performance. For example, in the first three years of catch shares, the total catch of rebuilding stocks (of which three-- canary rockfish, widow rockfish and petrale sole-- are now declared rebuilt) was 50 percent lower than the previous three years.
POLICY UPDATESIn April 2015, after reviewing the best available science and hearing from fishery participants and environmental groups, the PFMC closed the Pacific sardine fishery for the 2015-2016 season. The fishery was scheduled to start on July 1, 2015, but the biomass was estimated to be 97,000 metric tons after reaching a peak of approximately one million metric tons in 2006. Although commercial fishing is closed, the PFMC allowed up to 7,000 tons of sardine to account for small amounts taken as incidental catch in oth-er fisheries, live bait harvest, tribal harvest and research. However, if the allocated amount of incidental harvest is reached, those other fisheries will also be shut down.
In June 2015, the PFMC announced that two important West Coast groundfish stocks—canary rockfish and pe-trale sole—were rebuilt. These stocks had been subject to strict rebuilding plans that severely constrained West Coast fisheries for more than a decade. The canary rockfish was declared overfished in 2000, and a rebuild-ing plan was put in place in 2001. Under the rebuilding plan, catch quotas were dramatically reduced and large area closures put in place, and the stock was expected to rebuild by 2057. However, the new 2015 canary rockfish assessment showed that the coast-wide canary stock is already rebuilt. Petrale sole was declared overfished in 2010, and a rebuilding plan was put in place in 2011 to rebuild the stock by 2016. The petrale sole harvest
32
Nat
iona
l Ove
rvie
w |
Nor
th P
acifi
c |
Paci
fic |
Wes
tern
Pac
ific
| N
ew E
ngla
nd |
Mid
-Atla
ntic
| S
outh
Atla
ntic
| G
ulf
of M
exic
oPacific Region | Regional Summary
1 The NMFS Commercial Fishing Industry Input/Output Model was used to generate the impact estimates (see NMFS Commercial Fishing & Seafood Industry Input/Output Model, available at: www.st.nmfs.noaa.gov/documents/commercial_seafood_impacts_2007-2009.pdf).
limit was cut by half; fisheries in which petrale sole could be caught were reduced. Area closures were also implemented. The 2015 stock assessment showed that the rebuilding plan was successful, and the stock had increased over the target level.
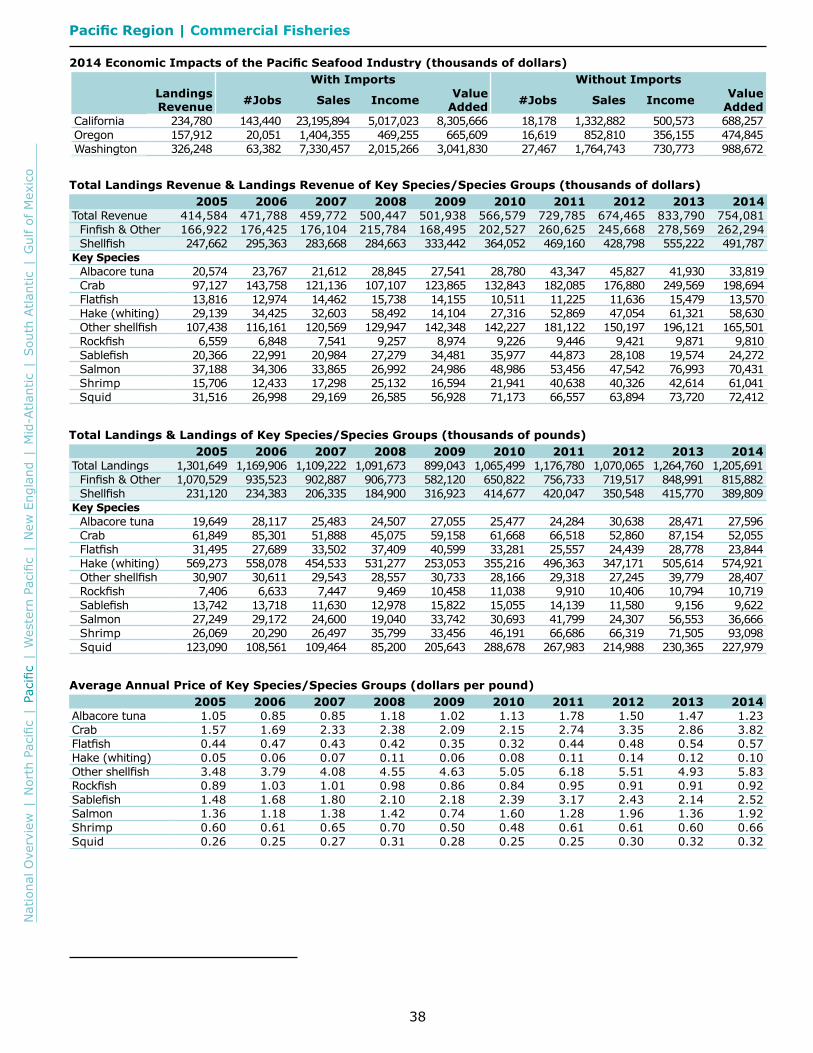
COMMERCIAL FISHERIESIn 2014, commercial fishermen in the Pacific Region landed 1.2 billion pounds of finfish and shellfish, earning $754 million in landings revenue. Crab ($199 million) and other shellfish ($166 million) dominated landings revenue (48%), but made up only 7 percent of Pacific Region land-ings. These species groups commanded ex-vessel prices of $3.82 and $5.83 per pound, respectively. Washington had the highest landings revenue in the region ($326 million) in 2014, followed by California ($235 million) and Oregon ($158 million). California had the highest landings (358 million pounds), followed by Oregon (292 million pounds) and Washington (191 million pounds).
Economic ImpactsIn this report, the U.S. seafood industry includes the commercial harvest sector, seafood processors and dealers, seafood wholesalers and distributors, import-ers, and seafood retailers.1 In 2014, the Pacific Re-gion’s seafood industry impacts were largest in Califor-nia, followed by Washington and Oregon. The seafood industry generated the following sales impacts: $23 billion in California, $7.3 billion in Washington and $1.4 billion in Oregon. Income impacts were $5 billion in Cal-ifornia, $2 billion in Washington and $0.5 billion in Ore-gon. Value added impacts were $8.3 billion in California, $3 billion in Washington and $0.7 billion in Oregon. Employment impacts were 143,000 jobs in California, 63,000 jobs in Washington and 20,000 jobs in Oregon.
The importers sector generated the greatest employ-ment impacts in California (63,000 jobs), followed by the retail sector with 58,000 jobs. In Washington, the
retail sector (23,000 jobs) generated the largest em-ployment impacts, followed by the seafood processors and dealers sector (16,000 jobs). In Oregon, the retail sector (10,000 jobs) generated the largest employ-ment impacts, followed by the commercial harvesters sector (5,600 jobs). The importers sector contributed more to the total value-added impacts than any other single sector in both California and Washington.
Landings RevenueLandings revenue in the Pacific Region totaled $754 million in 2014. This was an 82 percent increase (a 55% increase in real terms after adjusting for inflation) from 2005 levels and a 10 percent decrease from 2013. Total-ing $492 million in 2014, shellfish revenue experienced a 99 percent increase (a 69% increase in real terms) from 2005 to 2014, and experienced an 11 percent decrease from 2013 to 2014. Crab ($199 million) and other shell-fish ($166 million) had the highest landings revenue in the Pacific Region in 2014. Together, they accounted for 48 percent of total landings revenue but only 7 percent of total landings in the Pacific Region.
Between 2005 and 2014, the landings revenue for crab increased 105 percent (74% in real terms) and increased 54 percent (31% in real terms) for other shellfish. From 2005 to 2014, shrimp experienced the largest increase in landings revenue (289% nominal, 230% real). Oregon accounted for almost half (48%) of the region’s shrimp landings revenue in 2014, in-creasing 21 percent from 2013 levels and 325 percent from 2005 levels. The Oregon pink shrimp fishery was certified as a sustainable fishery by the MSC in 2007 and recertified in 2013 as sustainable. The Washington State pink shrimp fishery was certified as sustainable for the first time in 2013.
Landings revenue for squid also increased substantial-ly (130% nominal, 95% real) largely due to favorable ocean conditions and high demand in foreign markets. Only flatfish (-2%) experienced a decline in landings revenue from 2005 to 2014. Between 2013 and 2014, only shrimp (43%) and sablefish (24%) experienced an increase in revenue. Crab (-20%), albacore tuna (-19%) and other shellfish (-16%) experienced the largest decreases in landings revenue during this peri-
Key Pacific Region Commercial Species
• Albacore tuna• Crab• Flatfish• Hake• Other shellfish
• Rockfish• Sablefish• Salmon• Shrimp• Squid

33
National O
verview | N
orth Pacific | Pacific | Western Pacific | N
ew England | M
id-Atlantic | South Atlantic | G
ulf of Mexico
Pacific Region | Regional Summary
od. Washington had the highest finfish landings revenue ($88 million), followed by Oregon ($78 million) and California ($61 million). Shellfish landings revenue was also dominated by Washington ($238 million), followed by California ($174 million) and Oregon ($80 million).
LandingsFishermen in the Pacific Region landed 1.2 billion pounds of finfish and shellfish in 2014. This was a 7 percent decrease from 2005 and a 5 percent year-over-year decrease from 2013. Finfish landings contributed 68 per-cent of total landings in the Pacific Region (816 million pounds) in 2014. Finfish landed volume decreased 24 percent over the 10-year period (2005 to 2014), and de-creased 4 percent from 2013 to 2014. Shellfish landings increased 69 percent from 2005 to 2014, but declined 6 percent from 2013 to 2014 to 390 million pounds. Hake (Pacific whiting) at 575 million pounds, and squid at 228 million pounds were the species or species groups with the largest landings volume in the Pacific region in 2014.
Shrimp landings more than tripled (257%) and squid landings almost doubled (85%) from 2005 to 2014. Sablefish (-30%), flatfish (-24%), and crab (-16%) had the largest landings declines during this period. From 2013 to 2014, only hake, shrimp, and sablefish landings increased, up 14 percent, 30 percent, and 5 percent respectively. Salmon landings declined 35 percent from 2013 to 2014, largely due to the decline in pink salmon landings, which tend to have weak runs in even years. Landings of the high-valued chinook and coho salmon both increased in 2014 compared to 2013, reflect-ing projected increases in abundance. Crab landings (-40%) and other shellfish landings (-29%) also de-clined significantly during this period.
PricesThe ex-vessel prices for the Pacific Region’s key species and species groups in 2014 were higher than their 10-year average for nine of the 10 key species (in real terms, prices increased for eight of the 10 key species). Ex-ves-sel prices for crab (143%, 106% in real terms), followed by hake (100%, 67% in real terms) and sablefish (70%, 45% in real terms) experienced the biggest increases between 2005 and 2014. Compared with the ex-vessel prices in 2013, prices for the Pacific Region’s salmon (up
41%) and crab (up 34%) experienced the largest increas-es. Only prices for hake and albacore tuna (down 17% and 16%, respectively) declined from 2013 to 2014.
RECREATIONAL FISHERIESIn 2014, almost 1.5 million recreational anglers took 6.4 million fishing trips in the Pacific Region. About 69 percent of these anglers were residents of a regional coastal county. Of the total saltwater fishing trips taken, 53 percent were in the shore sector and another 30 percent were in the private boat sector. The most fre-quently caught species or species groups in the Pacific Region included rockfishes & scorpionfishes; surfperch-es; and barracuda, bass & bonito.
Economic Impacts and ExpendituresThe contribution of recreational fishing activities in the Pacific Region2 are reported in terms of economic impacts at the state level (employment, sales, income
Commercial Fisheries Facts
Landings revenue• On average between 2005 and 2014, the key
species or species groups accounted for 93 percent of total revenue, generating $548 million in the Pacific Region.
• On average, landings revenue in the Pacific region was split between shellfish (63%) and finfish (37%).
• Crab had the highest annual average land-ings revenue in the region from 2005 to 2014 at $153 million.
Landings• Key species or species groups contributed an
average of 80 percent annually to total land-ings between 2005 and 2014, or 903 million pounds.
• On average, landings volume in the Pacific region was split between shellfish (28%) and finfish (72%).
• Hake (whiting), contributed the most to landings in the region, averaging 465 million pounds from 2005 to 2014.
Prices• Other shellfish had the highest average
annual ex-vessel price per pound ($4.80) between 2005 to 2014, followed by crab ($2.50) and sablefish ($2.19).
• Hake (whiting) had the lowest average annu-al ex-vessel price per pound ($0.09) during the period, followed by squid ($0.28) and flatfish ($0.45).
34
Nat
iona
l Ove
rvie
w |
Nor
th P
acifi
c |
Paci
fic |
Wes
tern
Pac
ific
| N
ew E
ngla
nd |
Mid
-Atla
ntic
| S
outh
Atla
ntic
| G
ulf
of M
exic
oPacific Region | Regional Summary
2 Trip expenditure estimates were generated from the 2011 National Marine Recreational Fishing Expenditure Survey. Durable good expenditure impacts were generated from the 2014 National Marine Recreational Fishing Expenditure Survey (see http://www.st.nmfs.noaa.gov/economics/fish-eries/recreational/Marine-Angler-Durable-Expenditures/2014-durable-expenditures-survey). Economic impacts from recreational fishing activities were generated using the NMFS Recreational Economic Impact Model (see The Economic Contribution of Marine Angler Expenditures in the United States, 2011, available at http://www.st.nmfs.noaa.gov/economics/publications/marine-angler-expenditures/marine-angler-2011).
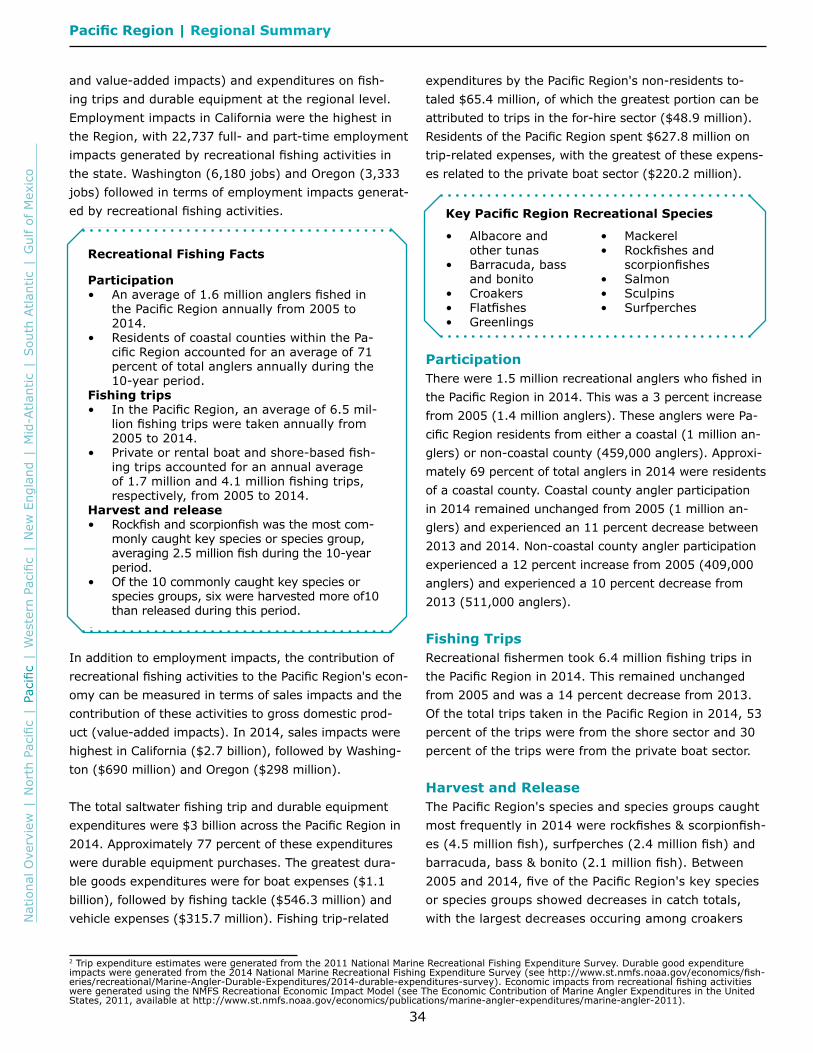
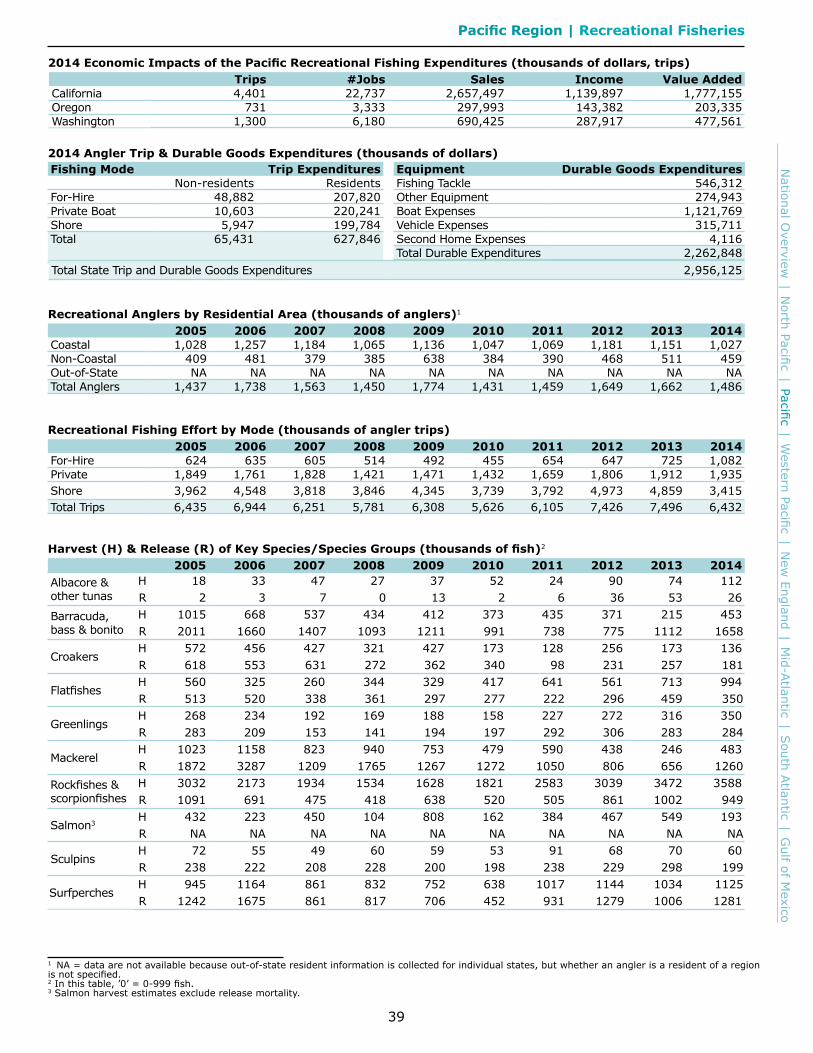
and value-added impacts) and expenditures on fish-ing trips and durable equipment at the regional level. Employment impacts in California were the highest in the Region, with 22,737 full- and part-time employment impacts generated by recreational fishing activities in the state. Washington (6,180 jobs) and Oregon (3,333 jobs) followed in terms of employment impacts generat-ed by recreational fishing activities.
In addition to employment impacts, the contribution of recreational fishing activities to the Pacific Region's econ-omy can be measured in terms of sales impacts and the contribution of these activities to gross domestic prod-uct (value-added impacts). In 2014, sales impacts were highest in California ($2.7 billion), followed by Washing-ton ($690 million) and Oregon ($298 million).
The total saltwater fishing trip and durable equipment expenditures were $3 billion across the Pacific Region in 2014. Approximately 77 percent of these expenditures were durable equipment purchases. The greatest dura-ble goods expenditures were for boat expenses ($1.1 billion), followed by fishing tackle ($546.3 million) and vehicle expenses ($315.7 million). Fishing trip-related
expenditures by the Pacific Region's non-residents to-taled $65.4 million, of which the greatest portion can be attributed to trips in the for-hire sector ($48.9 million). Residents of the Pacific Region spent $627.8 million on trip-related expenses, with the greatest of these expens-es related to the private boat sector ($220.2 million).
ParticipationThere were 1.5 million recreational anglers who fished in the Pacific Region in 2014. This was a 3 percent increase from 2005 (1.4 million anglers). These anglers were Pa-cific Region residents from either a coastal (1 million an-glers) or non-coastal county (459,000 anglers). Approxi-mately 69 percent of total anglers in 2014 were residents of a coastal county. Coastal county angler participation in 2014 remained unchanged from 2005 (1 million an-glers) and experienced an 11 percent decrease between 2013 and 2014. Non-coastal county angler participation experienced a 12 percent increase from 2005 (409,000 anglers) and experienced a 10 percent decrease from 2013 (511,000 anglers).
Fishing TripsRecreational fishermen took 6.4 million fishing trips in the Pacific Region in 2014. This remained unchanged from 2005 and was a 14 percent decrease from 2013. Of the total trips taken in the Pacific Region in 2014, 53 percent of the trips were from the shore sector and 30 percent of the trips were from the private boat sector.
Harvest and ReleaseThe Pacific Region's species and species groups caught most frequently in 2014 were rockfishes & scorpionfish-es (4.5 million fish), surfperches (2.4 million fish) and barracuda, bass & bonito (2.1 million fish). Between 2005 and 2014, five of the Pacific Region's key species or species groups showed decreases in catch totals, with the largest decreases occuring among croakers
Recreational Fishing Facts
Participation• An average of 1.6 million anglers fished in
the Pacific Region annually from 2005 to 2014.
• Residents of coastal counties within the Pa-cific Region accounted for an average of 71 percent of total anglers annually during the 10-year period.
Fishing trips• In the Pacific Region, an average of 6.5 mil-
lion fishing trips were taken annually from 2005 to 2014.
• Private or rental boat and shore-based fish-ing trips accounted for an annual average of 1.7 million and 4.1 million fishing trips, respectively, from 2005 to 2014.
Harvest and release• Rockfish and scorpionfish was the most com-
monly caught key species or species group, averaging 2.5 million fish during the 10-year period.
• Of the 10 commonly caught key species or species groups, six were harvested more of10 than released during this period.
•
Key Pacific Region Recreational Species
• Albacore and other tunas
• Barracuda, bass and bonito
• Croakers• Flatfishes• Greenlings
• Mackerel• Rockfishes and
scorpionfishes• Salmon• Sculpins• Surfperches
35
National O
verview | N
orth Pacific | Pacific | Western Pacific | N
ew England | M
id-Atlantic | South Atlantic | G
ulf of Mexico
Pacific Region | Regional Summary
3 Unless otherwise stated, data is from the U.S. Census Bureau, http://censtats.census.gov/ (accessed September 15, 2014).4 U.S. Bureau of Economic Analysis, “Table 1.1.5 Gross Domestic Product” and “Table SA6N Compensation of Employees by NAICS Industry,” http://www.bea.gov/iTable/index_nipa.cfm (accessed September 15, 2014).5 U.S. Bureau of Labor Statistics, “Location Quotient Calculator,” http://data.bls.gov/location_quotient/ (accessed September 15, 2014).
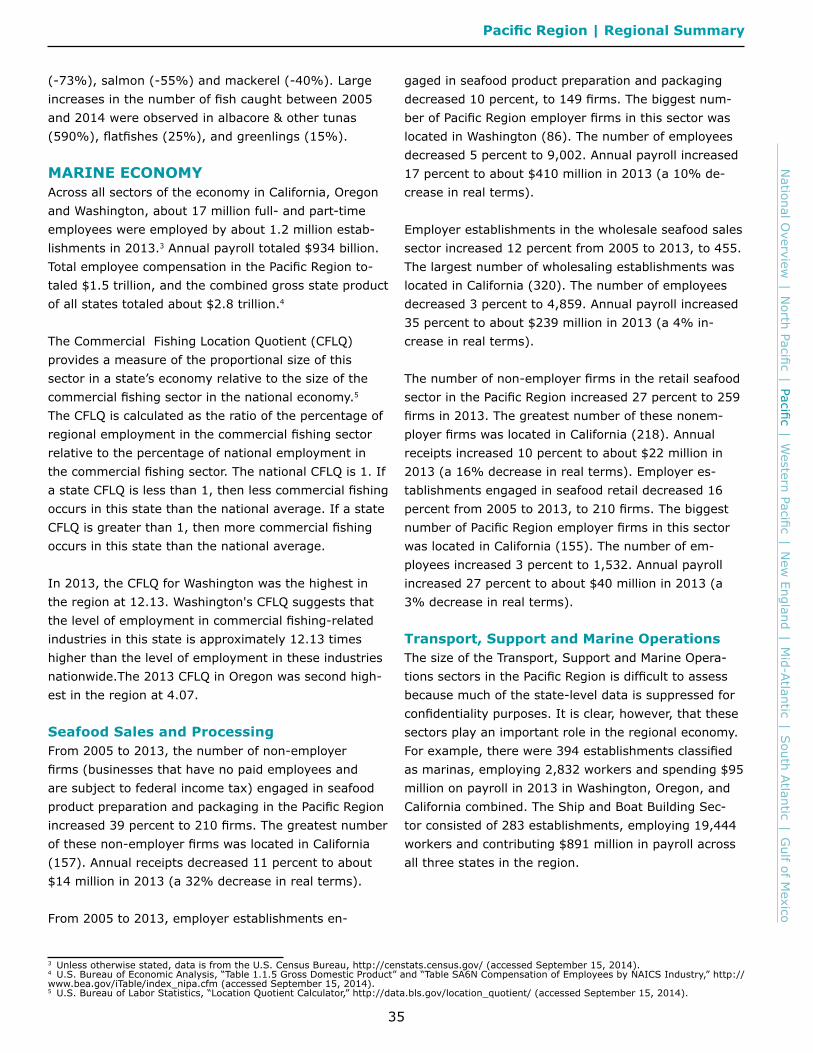
(-73%), salmon (-55%) and mackerel (-40%). Large increases in the number of fish caught between 2005 and 2014 were observed in albacore & other tunas (590%), flatfishes (25%), and greenlings (15%).
MARINE ECONOMYAcross all sectors of the economy in California, Oregon and Washington, about 17 million full- and part-time employees were employed by about 1.2 million estab-lishments in 2013.3 Annual payroll totaled $934 billion. Total employee compensation in the Pacific Region to-taled $1.5 trillion, and the combined gross state product of all states totaled about $2.8 trillion.4
The Commercial Fishing Location Quotient (CFLQ) provides a measure of the proportional size of this sector in a state’s economy relative to the size of the commercial fishing sector in the national economy.5 The CFLQ is calculated as the ratio of the percentage of regional employment in the commercial fishing sector relative to the percentage of national employment in the commercial fishing sector. The national CFLQ is 1. If a state CFLQ is less than 1, then less commercial fishing occurs in this state than the national average. If a state CFLQ is greater than 1, then more commercial fishing occurs in this state than the national average.
In 2013, the CFLQ for Washington was the highest in the region at 12.13. Washington's CFLQ suggests that the level of employment in commercial fishing-related industries in this state is approximately 12.13 times higher than the level of employment in these industries nationwide.The 2013 CFLQ in Oregon was second high-est in the region at 4.07.
Seafood Sales and ProcessingFrom 2005 to 2013, the number of non-employer firms (businesses that have no paid employees and are subject to federal income tax) engaged in seafood product preparation and packaging in the Pacific Region increased 39 percent to 210 firms. The greatest number of these non-employer firms was located in California (157). Annual receipts decreased 11 percent to about $14 million in 2013 (a 32% decrease in real terms).
From 2005 to 2013, employer establishments en-
gaged in seafood product preparation and packaging decreased 10 percent, to 149 firms. The biggest num-ber of Pacific Region employer firms in this sector was located in Washington (86). The number of employees decreased 5 percent to 9,002. Annual payroll increased 17 percent to about $410 million in 2013 (a 10% de-crease in real terms).
Employer establishments in the wholesale seafood sales sector increased 12 percent from 2005 to 2013, to 455. The largest number of wholesaling establishments was located in California (320). The number of employees decreased 3 percent to 4,859. Annual payroll increased 35 percent to about $239 million in 2013 (a 4% in-crease in real terms).
The number of non-employer firms in the retail seafood sector in the Pacific Region increased 27 percent to 259 firms in 2013. The greatest number of these nonem-ployer firms was located in California (218). Annual receipts increased 10 percent to about $22 million in 2013 (a 16% decrease in real terms). Employer es-tablishments engaged in seafood retail decreased 16 percent from 2005 to 2013, to 210 firms. The biggest number of Pacific Region employer firms in this sector was located in California (155). The number of em-ployees increased 3 percent to 1,532. Annual payroll increased 27 percent to about $40 million in 2013 (a 3% decrease in real terms).
Transport, Support and Marine OperationsThe size of the Transport, Support and Marine Opera-tions sectors in the Pacific Region is difficult to assess because much of the state-level data is suppressed for confidentiality purposes. It is clear, however, that these sectors play an important role in the regional economy. For example, there were 394 establishments classified as marinas, employing 2,832 workers and spending $95 million on payroll in 2013 in Washington, Oregon, and California combined. The Ship and Boat Building Sec-tor consisted of 283 establishments, employing 19,444 workers and contributing $891 million in payroll across all three states in the region.


Tables | Pacific Region
38
Nat
iona
l Ove
rvie
w |
Nor
th P
acifi
c |
Paci
fic |
Wes
tern
Pac
ific
| N
ew E
ngla
nd |
Mid
-Atla
ntic
| S
outh
Atla
ntic
| G
ulf
of M
exic
oPacific Region | Commercial Fisheries
Total Landings Revenue & Landings Revenue of Key Species/Species Groups (thousands of dollars)2005 2006 2007 2008 2009 2010 2011 2012 2013 2014
Total Revenue 414,584 471,788 459,772 500,447 501,938 566,579 729,785 674,465 833,790 754,081 Finfish & Other 166,922 176,425 176,104 215,784 168,495 202,527 260,625 245,668 278,569 262,294 Shellfish 247,662 295,363 283,668 284,663 333,442 364,052 469,160 428,798 555,222 491,787
Key SpeciesAlbacore tuna 20,574 23,767 21,612 28,845 27,541 28,780 43,347 45,827 41,930 33,819 Crab 97,127 143,758 121,136 107,107 123,865 132,843 182,085 176,880 249,569 198,694 Flatfish 13,816 12,974 14,462 15,738 14,155 10,511 11,225 11,636 15,479 13,570 Hake (whiting) 29,139 34,425 32,603 58,492 14,104 27,316 52,869 47,054 61,321 58,630 Other shellfish 107,438 116,161 120,569 129,947 142,348 142,227 181,122 150,197 196,121 165,501 Rockfish 6,559 6,848 7,541 9,257 8,974 9,226 9,446 9,421 9,871 9,810 Sablefish 20,366 22,991 20,984 27,279 34,481 35,977 44,873 28,108 19,574 24,272 Salmon 37,188 34,306 33,865 26,992 24,986 48,986 53,456 47,542 76,993 70,431 Shrimp 15,706 12,433 17,298 25,132 16,594 21,941 40,638 40,326 42,614 61,041 Squid 31,516 26,998 29,169 26,585 56,928 71,173 66,557 63,894 73,720 72,412
Total Landings & Landings of Key Species/Species Groups (thousands of pounds)2005 2006 2007 2008 2009 2010 2011 2012 2013 2014
Total Landings 1,301,649 1,169,906 1,109,222 1,091,673 899,043 1,065,499 1,176,780 1,070,065 1,264,760 1,205,691 Finfish & Other 1,070,529 935,523 902,887 906,773 582,120 650,822 756,733 719,517 848,991 815,882 Shellfish 231,120 234,383 206,335 184,900 316,923 414,677 420,047 350,548 415,770 389,809
Key SpeciesAlbacore tuna 19,649 28,117 25,483 24,507 27,055 25,477 24,284 30,638 28,471 27,596 Crab 61,849 85,301 51,888 45,075 59,158 61,668 66,518 52,860 87,154 52,055 Flatfish 31,495 27,689 33,502 37,409 40,599 33,281 25,557 24,439 28,778 23,844 Hake (whiting) 569,273 558,078 454,533 531,277 253,053 355,216 496,363 347,171 505,614 574,921 Other shellfish 30,907 30,611 29,543 28,557 30,733 28,166 29,318 27,245 39,779 28,407 Rockfish 7,406 6,633 7,447 9,469 10,458 11,038 9,910 10,406 10,794 10,719 Sablefish 13,742 13,718 11,630 12,978 15,822 15,055 14,139 11,580 9,156 9,622 Salmon 27,249 29,172 24,600 19,040 33,742 30,693 41,799 24,307 56,553 36,666 Shrimp 26,069 20,290 26,497 35,799 33,456 46,191 66,686 66,319 71,505 93,098 Squid 123,090 108,561 109,464 85,200 205,643 288,678 267,983 214,988 230,365 227,979
Average Annual Price of Key Species/Species Groups (dollars per pound)2005 2006 2007 2008 2009 2010 2011 2012 2013 2014
Albacore tuna 1.05 0.85 0.85 1.18 1.02 1.13 1.78 1.50 1.47 1.23Crab 1.57 1.69 2.33 2.38 2.09 2.15 2.74 3.35 2.86 3.82Flatfish 0.44 0.47 0.43 0.42 0.35 0.32 0.44 0.48 0.54 0.57Hake (whiting) 0.05 0.06 0.07 0.11 0.06 0.08 0.11 0.14 0.12 0.10Other shellfish 3.48 3.79 4.08 4.55 4.63 5.05 6.18 5.51 4.93 5.83Rockfish 0.89 1.03 1.01 0.98 0.86 0.84 0.95 0.91 0.91 0.92Sablefish 1.48 1.68 1.80 2.10 2.18 2.39 3.17 2.43 2.14 2.52Salmon 1.36 1.18 1.38 1.42 0.74 1.60 1.28 1.96 1.36 1.92Shrimp 0.60 0.61 0.65 0.70 0.50 0.48 0.61 0.61 0.60 0.66Squid 0.26 0.25 0.27 0.31 0.28 0.25 0.25 0.30 0.32 0.32
2014 Economic Impacts of the Pacific Seafood Industry (thousands of dollars)With Imports Without Imports
Landings Revenue #Jobs Sales Income Value
Added #Jobs Sales Income Value Added
California 234,780 143,440 23,195,894 5,017,023 8,305,666 18,178 1,332,882 500,573 688,257 Oregon 157,912 20,051 1,404,355 469,255 665,609 16,619 852,810 356,155 474,845 Washington 326,248 63,382 7,330,457 2,015,266 3,041,830 27,467 1,764,743 730,773 988,672
39
National O
verview | N
orth Pacific | Pacific | Western Pacific | N
ew England | M
id-Atlantic | South Atlantic | G
ulf of Mexico
1 NA = data are not available because out-of-state resident information is collected for individual states, but whether an angler is a resident of a region is not specified.2 In this table, ’0’ = 0-999 fish.3 Salmon harvest estimates exclude release mortality.
Pacific Region | Recreational Fisheries
Recreational Anglers by Residential Area (thousands of anglers)1
2005 2006 2007 2008 2009 2010 2011 2012 2013 2014Coastal 1,028 1,257 1,184 1,065 1,136 1,047 1,069 1,181 1,151 1,027Non-Coastal 409 481 379 385 638 384 390 468 511 459Out-of-State NA NA NA NA NA NA NA NA NA NATotal Anglers 1,437 1,738 1,563 1,450 1,774 1,431 1,459 1,649 1,662 1,486
Recreational Fishing Effort by Mode (thousands of angler trips)2005 2006 2007 2008 2009 2010 2011 2012 2013 2014
For-Hire 624 635 605 514 492 455 654 647 725 1,082Private 1,849 1,761 1,828 1,421 1,471 1,432 1,659 1,806 1,912 1,935Shore 3,962 4,548 3,818 3,846 4,345 3,739 3,792 4,973 4,859 3,415Total Trips 6,435 6,944 6,251 5,781 6,308 5,626 6,105 7,426 7,496 6,432
Harvest (H) & Release (R) of Key Species/Species Groups (thousands of fish)2
2005 2006 2007 2008 2009 2010 2011 2012 2013 2014Albacore & other tunas
H 18 33 47 27 37 52 24 90 74 112R 2 3 7 0 13 2 6 36 53 26
Barracuda, bass & bonito
H 1015 668 537 434 412 373 435 371 215 453R 2011 1660 1407 1093 1211 991 738 775 1112 1658
CroakersH 572 456 427 321 427 173 128 256 173 136R 618 553 631 272 362 340 98 231 257 181
FlatfishesH 560 325 260 344 329 417 641 561 713 994R 513 520 338 361 297 277 222 296 459 350
GreenlingsH 268 234 192 169 188 158 227 272 316 350R 283 209 153 141 194 197 292 306 283 284
MackerelH 1023 1158 823 940 753 479 590 438 246 483R 1872 3287 1209 1765 1267 1272 1050 806 656 1260
Rockfishes & scorpionfishes
H 3032 2173 1934 1534 1628 1821 2583 3039 3472 3588R 1091 691 475 418 638 520 505 861 1002 949
Salmon3H 432 223 450 104 808 162 384 467 549 193R NA NA NA NA NA NA NA NA NA NA
SculpinsH 72 55 49 60 59 53 91 68 70 60R 238 222 208 228 200 198 238 229 298 199
SurfperchesH 945 1164 861 832 752 638 1017 1144 1034 1125R 1242 1675 861 817 706 452 931 1279 1006 1281
2014 Angler Trip & Durable Goods Expenditures (thousands of dollars)Fishing Mode Trip Expenditures
Non-residents ResidentsFor-Hire 48,882 207,820Private Boat 10,603 220,241Shore 5,947 199,784Total 65,431 627,846
Equipment Durable Goods ExpendituresFishing Tackle 546,312Other Equipment 274,943Boat Expenses 1,121,769Vehicle Expenses 315,711Second Home Expenses 4,116Total Durable Expenditures 2,262,848
Total State Trip and Durable Goods Expenditures 2,956,125
2014 Economic Impacts of the Pacific Recreational Fishing Expenditures (thousands of dollars, trips)Trips #Jobs Sales Income Value Added
California 4,401 22,737 2,657,497 1,139,897 1,777,155Oregon 731 3,333 297,993 143,382 203,335Washington 1,300 6,180 690,425 287,917 477,561


Tables | California
42
Nat
iona
l Ove
rvie
w |
Nor
th P
acifi
c |
Paci
fic |
Wes
tern
Pac
ific
| N
ew E
ngla
nd |
Mid
-Atla
ntic
| S
outh
Atla
ntic
| G
ulf
of M
exic
o
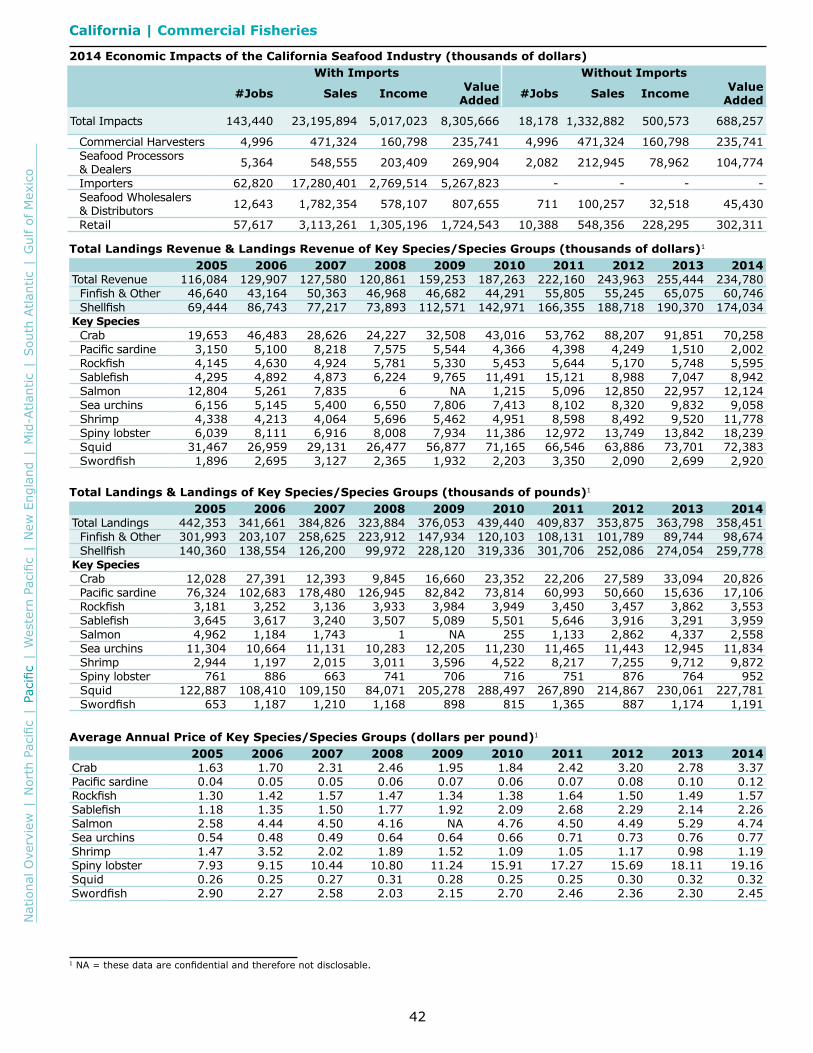
1 NA = these data are confidential and therefore not disclosable.
California | Commercial Fisheries
2014 Economic Impacts of the California Seafood Industry (thousands of dollars)With Imports Without Imports
#Jobs Sales Income Value Added #Jobs Sales Income Value
Added
Total Impacts 143,440 23,195,894 5,017,023 8,305,666 18,178 1,332,882 500,573 688,257
Commercial Harvesters 4,996 471,324 160,798 235,741 4,996 471,324 160,798 235,741 Seafood Processors & Dealers 5,364 548,555 203,409 269,904 2,082 212,945 78,962 104,774
Importers 62,820 17,280,401 2,769,514 5,267,823 - - - - Seafood Wholesalers & Distributors 12,643 1,782,354 578,107 807,655 711 100,257 32,518 45,430
Retail 57,617 3,113,261 1,305,196 1,724,543 10,388 548,356 228,295 302,311
Total Landings Revenue & Landings Revenue of Key Species/Species Groups (thousands of dollars)1
2005 2006 2007 2008 2009 2010 2011 2012 2013 2014Total Revenue 116,084 129,907 127,580 120,861 159,253 187,263 222,160 243,963 255,444 234,780
Finfish & Other 46,640 43,164 50,363 46,968 46,682 44,291 55,805 55,245 65,075 60,746 Shellfish 69,444 86,743 77,217 73,893 112,571 142,971 166,355 188,718 190,370 174,034
Key SpeciesCrab 19,653 46,483 28,626 24,227 32,508 43,016 53,762 88,207 91,851 70,258 Pacific sardine 3,150 5,100 8,218 7,575 5,544 4,366 4,398 4,249 1,510 2,002 Rockfish 4,145 4,630 4,924 5,781 5,330 5,453 5,644 5,170 5,748 5,595 Sablefish 4,295 4,892 4,873 6,224 9,765 11,491 15,121 8,988 7,047 8,942 Salmon 12,804 5,261 7,835 6 NA 1,215 5,096 12,850 22,957 12,124 Sea urchins 6,156 5,145 5,400 6,550 7,806 7,413 8,102 8,320 9,832 9,058 Shrimp 4,338 4,213 4,064 5,696 5,462 4,951 8,598 8,492 9,520 11,778 Spiny lobster 6,039 8,111 6,916 8,008 7,934 11,386 12,972 13,749 13,842 18,239 Squid 31,467 26,959 29,131 26,477 56,877 71,165 66,546 63,886 73,701 72,383 Swordfish 1,896 2,695 3,127 2,365 1,932 2,203 3,350 2,090 2,699 2,920
Total Landings & Landings of Key Species/Species Groups (thousands of pounds)1
2005 2006 2007 2008 2009 2010 2011 2012 2013 2014Total Landings 442,353 341,661 384,826 323,884 376,053 439,440 409,837 353,875 363,798 358,451
Finfish & Other 301,993 203,107 258,625 223,912 147,934 120,103 108,131 101,789 89,744 98,674 Shellfish 140,360 138,554 126,200 99,972 228,120 319,336 301,706 252,086 274,054 259,778
Key SpeciesCrab 12,028 27,391 12,393 9,845 16,660 23,352 22,206 27,589 33,094 20,826 Pacific sardine 76,324 102,683 178,480 126,945 82,842 73,814 60,993 50,660 15,636 17,106 Rockfish 3,181 3,252 3,136 3,933 3,984 3,949 3,450 3,457 3,862 3,553 Sablefish 3,645 3,617 3,240 3,507 5,089 5,501 5,646 3,916 3,291 3,959 Salmon 4,962 1,184 1,743 1 NA 255 1,133 2,862 4,337 2,558 Sea urchins 11,304 10,664 11,131 10,283 12,205 11,230 11,465 11,443 12,945 11,834 Shrimp 2,944 1,197 2,015 3,011 3,596 4,522 8,217 7,255 9,712 9,872 Spiny lobster 761 886 663 741 706 716 751 876 764 952 Squid 122,887 108,410 109,150 84,071 205,278 288,497 267,890 214,867 230,061 227,781 Swordfish 653 1,187 1,210 1,168 898 815 1,365 887 1,174 1,191
Average Annual Price of Key Species/Species Groups (dollars per pound)1
2005 2006 2007 2008 2009 2010 2011 2012 2013 2014Crab 1.63 1.70 2.31 2.46 1.95 1.84 2.42 3.20 2.78 3.37Pacific sardine 0.04 0.05 0.05 0.06 0.07 0.06 0.07 0.08 0.10 0.12Rockfish 1.30 1.42 1.57 1.47 1.34 1.38 1.64 1.50 1.49 1.57Sablefish 1.18 1.35 1.50 1.77 1.92 2.09 2.68 2.29 2.14 2.26Salmon 2.58 4.44 4.50 4.16 NA 4.76 4.50 4.49 5.29 4.74Sea urchins 0.54 0.48 0.49 0.64 0.64 0.66 0.71 0.73 0.76 0.77Shrimp 1.47 3.52 2.02 1.89 1.52 1.09 1.05 1.17 0.98 1.19Spiny lobster 7.93 9.15 10.44 10.80 11.24 15.91 17.27 15.69 18.11 19.16Squid 0.26 0.25 0.27 0.31 0.28 0.25 0.25 0.30 0.32 0.32Swordfish 2.90 2.27 2.58 2.03 2.15 2.70 2.46 2.36 2.30 2.45
43
National O
verview | N
orth Pacific | Pacific | Western Pacific | N
ew England | M
id-Atlantic | South Atlantic | G
ulf of Mexico
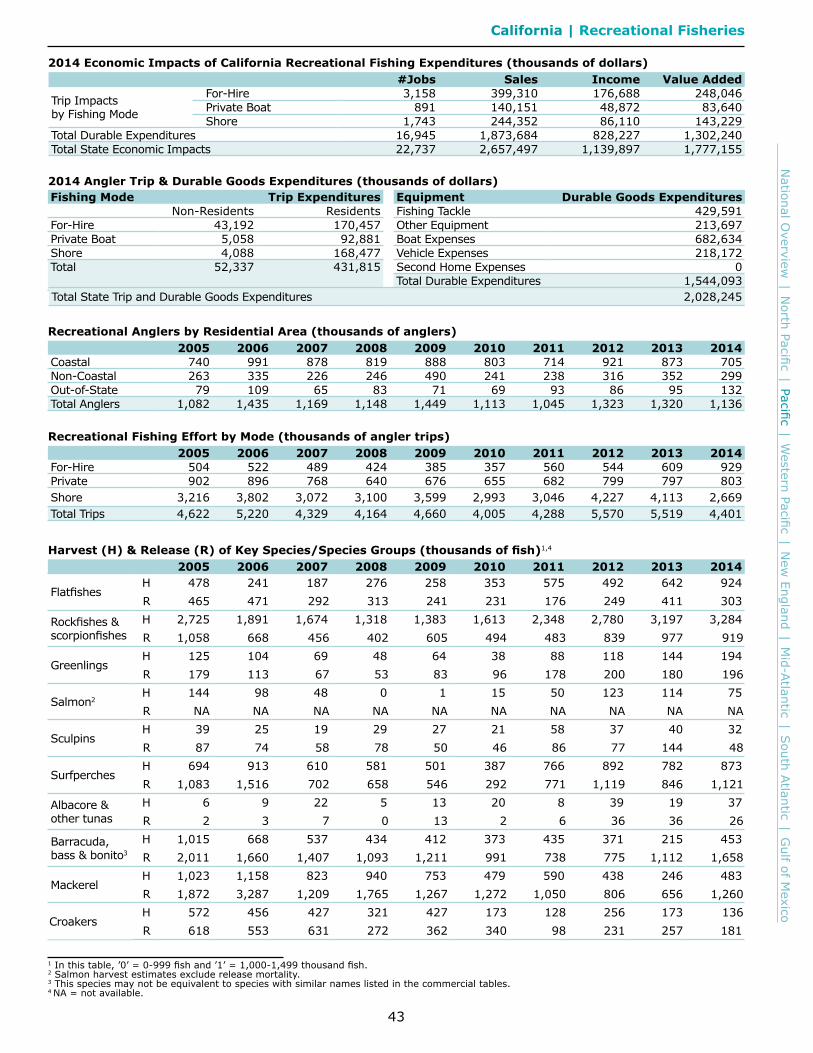
1 In this table, ’0’ = 0-999 fish and ’1’ = 1,000-1,499 thousand fish. 2 Salmon harvest estimates exclude release mortality.3 This species may not be equivalent to species with similar names listed in the commercial tables.4 NA = not available.
California | Recreational Fisheries
2014 Economic Impacts of California Recreational Fishing Expenditures (thousands of dollars)#Jobs Sales Income Value Added
Trip Impactsby Fishing Mode
For-Hire 3,158 399,310 176,688 248,046Private Boat 891 140,151 48,872 83,640Shore 1,743 244,352 86,110 143,229
Total Durable Expenditures 16,945 1,873,684 828,227 1,302,240Total State Economic Impacts 22,737 2,657,497 1,139,897 1,777,155
Recreational Anglers by Residential Area (thousands of anglers)2005 2006 2007 2008 2009 2010 2011 2012 2013 2014
Coastal 740 991 878 819 888 803 714 921 873 705Non-Coastal 263 335 226 246 490 241 238 316 352 299Out-of-State 79 109 65 83 71 69 93 86 95 132Total Anglers 1,082 1,435 1,169 1,148 1,449 1,113 1,045 1,323 1,320 1,136
Recreational Fishing Effort by Mode (thousands of angler trips)2005 2006 2007 2008 2009 2010 2011 2012 2013 2014
For-Hire 504 522 489 424 385 357 560 544 609 929Private 902 896 768 640 676 655 682 799 797 803Shore 3,216 3,802 3,072 3,100 3,599 2,993 3,046 4,227 4,113 2,669Total Trips 4,622 5,220 4,329 4,164 4,660 4,005 4,288 5,570 5,519 4,401
Harvest (H) & Release (R) of Key Species/Species Groups (thousands of fish)1,4
2005 2006 2007 2008 2009 2010 2011 2012 2013 2014
FlatfishesH 478 241 187 276 258 353 575 492 642 924R 465 471 292 313 241 231 176 249 411 303
Rockfishes &scorpionfishes
H 2,725 1,891 1,674 1,318 1,383 1,613 2,348 2,780 3,197 3,284R 1,058 668 456 402 605 494 483 839 977 919
GreenlingsH 125 104 69 48 64 38 88 118 144 194R 179 113 67 53 83 96 178 200 180 196
Salmon2H 144 98 48 0 1 15 50 123 114 75R NA NA NA NA NA NA NA NA NA NA
SculpinsH 39 25 19 29 27 21 58 37 40 32R 87 74 58 78 50 46 86 77 144 48
SurfperchesH 694 913 610 581 501 387 766 892 782 873R 1,083 1,516 702 658 546 292 771 1,119 846 1,121
Albacore &other tunas
H 6 9 22 5 13 20 8 39 19 37R 2 3 7 0 13 2 6 36 36 26
Barracuda,bass & bonito3
H 1,015 668 537 434 412 373 435 371 215 453R 2,011 1,660 1,407 1,093 1,211 991 738 775 1,112 1,658
MackerelH 1,023 1,158 823 940 753 479 590 438 246 483R 1,872 3,287 1,209 1,765 1,267 1,272 1,050 806 656 1,260
CroakersH 572 456 427 321 427 173 128 256 173 136R 618 553 631 272 362 340 98 231 257 181
2014 Angler Trip & Durable Goods Expenditures (thousands of dollars)Fishing Mode Trip Expenditures
Non-Residents ResidentsFor-Hire 43,192 170,457Private Boat 5,058 92,881Shore 4,088 168,477Total 52,337 431,815
Equipment Durable Goods ExpendituresFishing Tackle 429,591Other Equipment 213,697Boat Expenses 682,634Vehicle Expenses 218,172Second Home Expenses 0Total Durable Expenditures 1,544,093
Total State Trip and Durable Goods Expenditures 2,028,245

44
Nat
iona
l Ove
rvie
w |
Nor
th P
acifi
c |
Paci
fic |
Wes
tern
Pac
ific
| N
ew E
ngla
nd |
Mid
-Atla
ntic
| S
outh
Atla
ntic
| G
ulf
of M
exic
o
1 The U.S. Commercial Fishing Location Quotient (CFLQ) is 1. A CFLQ greater than 1 indicates that more commercial fishing occurs in this state than the national average. A CFLQ less than 1 indicates that les commercial fishing occurs in this state than the national average.2 ds = these data are suppressed.
California | Marine Economy
California’s State Economy (% of national total)
#Establishments #EmployeesAnnualPayroll
($ billions)
Employee Com-pensation
($ billions)
Gross StateProduct
($ billions)
CommercialFishing
LocationQuotient1
2005 860,866 (11.5%) 13,382,470 (11.5%) 588.45 (13.1%) 930.65 (13.1%) 1,760.51 (13.5%) 0.732013 874,243 (11.7%) 13,401,863 (11.3%) 742.52 (13.2%) 1,160.08 (13.1%) 2,212.99 (13.3%) 0.6%Change 1.5 0.1 20.7 19.8 20.4 -17.8
Seafood Sales & Processing - Non-Employer Firms (thousands of dollars)2005 2006 2007 2008 2009 2010 2011 2012 2013
Seafood product prep. & packaging
Firms 88 91 121 139 159 184 187 151 157Receipts 10,207 8,298 10,842 11,460 10,852 9,695 9,788 9,283 9,866
Seafood sales,retail
Firms 166 163 222 210 202 203 209 236 218Receipts 16,892 19,875 19,703 19,892 17,095 19,021 18,006 18,238 18,581
Seafood Sales & Processing - Employer Establishments (thousands of dollars)2005 2006 2007 2008 2009 2010 2011 2012 2013
Seafood product prep. & packaging
Establishments 48 47 49 45 47 48 48 41 44Employees 2,963 2,592 2,229 2,024 2,167 1,820 1,842 1,668 1,871
Payroll 92,642 78,065 75,886 65,215 69,529 62,480 60,411 52,977 57,603
Seafood sales,wholesale
Establishments 258 252 300 278 289 314 404 275 320Employees 3,925 4,063 4,429 3,321 3,183 3,223 3,505 3,441 3,671
Payroll 134,576 144,758 159,672 132,139 128,813 137,810 149,302 173,959 181,698
Seafood sales,retail
Establishments 180 184 182 161 153 158 157 149 155Employees 999 1,031 1,004 932 976 985 1,088 1,043 1,119
Payroll 18,832 19,900 21,224 20,585 21,785 22,718 25,168 24,221 26,702
Transport, Support & Marine Operations - Employer Establishments (thousands of dollars)2
2005 2006 2007 2008 2009 2010 2011 2012 2013Coastal & GreatLakes freighttransportation
Establishments 26 22 29 28 30 25 21 22 24Employees 1,346 ds ds ds ds 554 395 ds ds
Payroll 129,262 ds ds ds ds 30,431 24,708 ds ds
Deep sea freighttransportation
Establishments 54 54 51 43 41 54 51 45 34Employees ds 957 1,643 ds ds 2,562 2,464 2,431 2,073
Payroll ds 84,199 116,628 ds ds 236,235 256,962 236,423 218,054Deep seapassengertransportation
Establishments 15 16 13 5 5 3 2 2 4Employees ds 1,552 ds ds ds ds ds ds ds
Payroll ds 72,119 ds ds ds ds ds ds ds
MarinasEstablishments 263 268 276 277 276 270 269 251 250
Employees 2,426 2,457 2,680 2,652 2,514 2,390 2,401 2,237 2,199Payroll 71,318 74,778 80,216 85,315 78,890 80,631 82,958 71,777 72,737
Marine cargohandling
Establishments 54 52 56 61 62 63 71 38 64Employees 19,303 20,975 22,395 22,086 17,428 18,449 18,812 18,759 ds
Payroll 1,273,698 1,448,623 1,484,308 1,453,281 1,211,572 1,273,268 1,333,805 1,351,874 dsNavigationalservices toshipping
Establishments 37 36 39 40 39 41 45 35 36Employees ds 817 858 815 804 765 760 800 805
Payroll ds 63,893 63,610 65,225 61,720 58,899 62,065 61,166 67,665
Port & harboroperations
Establishments 20 20 18 17 19 21 19 59 31Employees ds 582 443 256 345 435 508 ds 651
Payroll ds 32,523 30,001 23,316 26,889 37,560 41,688 ds 52,401
Ship & boatbuilding
Establishments 141 132 136 136 123 117 108 120 113Employees 10,132 9,801 9,250 11,630 10,483 9,720 9,165 12,681 12,651
Payroll 410,446 453,255 433,846 477,300 460,239 448,338 434,449 544,819 537,438

Tables | Oregon

46
Nat
iona
l Ove
rvie
w |
Nor
th P
acifi
c |
Paci
fic |
Wes
tern
Pac
ific
| N
ew E
ngla
nd |
Mid
-Atla
ntic
| S
outh
Atla
ntic
| G
ulf
of M
exic
oOregon | Commercial Fisheries
2014 Economic Impacts of the Oregon Seafood Industry (thousands of dollars)With Imports Without Imports
#Jobs Sales Income Value Added #Jobs Sales Income Value
AddedTotal Impacts 20,051 1,404,355 469,255 665,609 16,619 852,810 356,155 474,845
Commercial Harvesters 5,616 295,216 125,258 173,485 5,616 295,216 125,258 173,485 Seafood Processors & Dealers 1,846 156,388 60,062 78,475 1,695 143,565 55,138 72,041
Importers 1,629 448,198 71,832 136,630 - - - - Seafood Wholesalers & Distributors 750 89,526 30,370 40,734 462 55,134 18,703 25,086
Retail 10,208 415,027 181,732 236,284 8,846 358,895 157,056 204,233
Total Landings Revenue & Landings Revenue of Key Species/Species Groups (thousands of dollars)2005 2006 2007 2008 2009 2010 2011 2012 2013 2014
Total Revenue 88,196 106,093 97,298 103,042 106,959 106,378 148,354 128,222 179,215 157,912 Finfish & Other 53,192 46,326 47,589 56,912 52,749 58,730 76,718 72,327 81,445 78,247 Shellfish 35,005 59,767 49,709 46,130 54,210 47,648 71,636 55,895 97,770 79,665
Key SpeciesAlbacore tuna 8,815 8,067 9,468 10,666 10,191 12,425 18,766 15,168 16,085 11,028 Crab 26,603 53,810 38,208 29,168 42,413 32,757 44,696 29,189 71,208 47,991 Flatfish 7,281 7,547 7,930 9,163 8,468 6,861 6,780 7,315 9,854 8,651 Hake (whiting) 7,107 7,974 6,501 6,830 3,783 5,414 16,518 14,611 20,405 18,274 Oysters 1,232 1,163 1,847 2,748 4,506 3,317 1,869 1,661 1,798 1,774 Pacific sardine 6,199 3,743 4,551 5,665 5,291 5,252 3,192 8,979 6,299 3,522 Rockfish 1,387 1,564 2,002 2,610 2,500 2,520 2,473 2,661 3,023 3,245 Sablefish 8,657 9,787 9,494 13,737 15,919 15,069 17,351 11,530 7,595 8,076 Salmon 10,437 4,940 4,647 4,166 3,546 7,698 6,737 6,950 12,422 20,131 Shrimp 6,901 4,494 9,365 13,937 6,813 11,006 24,607 24,685 24,153 29,326
Total Landings & Landings of Key Species/Species Groups (thousands of pounds)2005 2006 2007 2008 2009 2010 2011 2012 2013 2014
Total Landings 312,636 282,846 253,543 195,688 199,458 201,974 274,533 296,091 339,589 291,623 Finfish & Other 278,646 236,998 216,134 155,837 154,147 153,588 208,445 237,821 265,454 227,339 Shellfish 33,990 45,848 37,410 39,851 45,311 48,386 66,088 58,270 74,136 64,284
Key SpeciesAlbacore tuna 8,087 8,534 10,468 8,876 10,082 10,703 9,682 9,938 10,209 8,777 Crab 17,734 33,291 17,007 13,875 21,848 15,817 17,240 8,681 26,016 11,907 Flatfish 16,910 16,385 19,697 23,842 26,047 22,226 15,958 15,322 18,965 15,955 Hake (whiting) 135,503 122,804 81,481 55,511 53,466 57,017 142,092 102,651 160,098 161,589 Oysters 308 255 197 162 1,127 829 467 415 449 443 Pacific sardine 99,450 74,669 90,037 49,298 45,902 44,743 23,479 91,459 57,022 16,938 Rockfish 2,007 1,967 2,905 3,820 4,207 4,533 3,819 3,918 4,745 5,293 Sablefish 5,834 5,838 5,349 6,514 7,219 6,269 5,074 4,739 3,840 3,293 Salmon 4,666 1,810 1,370 1,860 2,311 2,765 2,386 1,918 3,505 6,383 Shrimp 15,784 12,128 19,990 25,400 22,019 31,429 48,198 49,009 47,472 51,728
Average Annual Price of Key Species/Species Groups (dollars per pound)2005 2006 2007 2008 2009 2010 2011 2012 2013 2014
Albacore tuna 1.09 0.95 0.90 1.20 1.01 1.16 1.94 1.53 1.58 1.26Crab 1.50 1.62 2.25 2.10 1.94 2.07 2.59 3.36 2.74 4.03Flatfish 0.43 0.46 0.40 0.38 0.33 0.31 0.42 0.48 0.52 0.54Hake (whiting) 0.05 0.06 0.08 0.12 0.07 0.09 0.12 0.14 0.13 0.11Oysters 4.00 4.56 9.40 16.96 4.00 4.00 4.00 4.00 4.00 4.00Pacific sardine 0.06 0.05 0.05 0.11 0.12 0.12 0.14 0.10 0.11 0.21Rockfish 0.69 0.80 0.69 0.68 0.59 0.56 0.65 0.68 0.64 0.61Sablefish 1.48 1.68 1.78 2.11 2.21 2.40 3.42 2.43 1.98 2.45Salmon 2.24 2.73 3.39 2.24 1.53 2.78 2.82 3.62 3.54 3.15Shrimp 0.44 0.37 0.47 0.55 0.31 0.35 0.51 0.50 0.51 0.57
47
National O
verview | N
orth Pacific | Pacific | Western Pacific | N
ew England | M
id-Atlantic | South Atlantic | G
ulf of Mexico
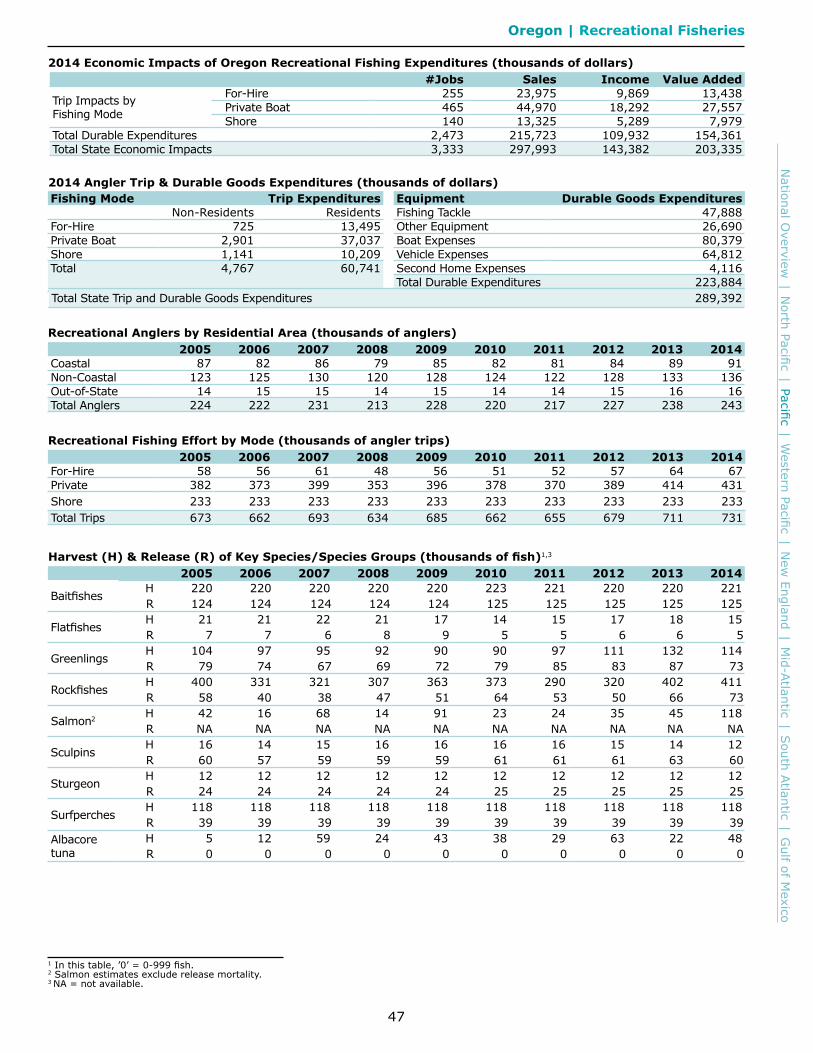
1 In this table, ’0’ = 0-999 fish.2 Salmon estimates exclude release mortality.3 NA = not available.
Oregon | Recreational Fisheries
2014 Economic Impacts of Oregon Recreational Fishing Expenditures (thousands of dollars)#Jobs Sales Income Value Added
Trip Impacts byFishing Mode
For-Hire 255 23,975 9,869 13,438Private Boat 465 44,970 18,292 27,557Shore 140 13,325 5,289 7,979
Total Durable Expenditures 2,473 215,723 109,932 154,361Total State Economic Impacts 3,333 297,993 143,382 203,335
Recreational Anglers by Residential Area (thousands of anglers)2005 2006 2007 2008 2009 2010 2011 2012 2013 2014
Coastal 87 82 86 79 85 82 81 84 89 91Non-Coastal 123 125 130 120 128 124 122 128 133 136Out-of-State 14 15 15 14 15 14 14 15 16 16Total Anglers 224 222 231 213 228 220 217 227 238 243
Recreational Fishing Effort by Mode (thousands of angler trips)2005 2006 2007 2008 2009 2010 2011 2012 2013 2014
For-Hire 58 56 61 48 56 51 52 57 64 67Private 382 373 399 353 396 378 370 389 414 431Shore 233 233 233 233 233 233 233 233 233 233Total Trips 673 662 693 634 685 662 655 679 711 731
Harvest (H) & Release (R) of Key Species/Species Groups (thousands of fish)1,3
2005 2006 2007 2008 2009 2010 2011 2012 2013 2014
BaitfishesH 220 220 220 220 220 223 221 220 220 221R 124 124 124 124 124 125 125 125 125 125
FlatfishesH 21 21 22 21 17 14 15 17 18 15R 7 7 6 8 9 5 5 6 6 5
GreenlingsH 104 97 95 92 90 90 97 111 132 114R 79 74 67 69 72 79 85 83 87 73
RockfishesH 400 331 321 307 363 373 290 320 402 411R 58 40 38 47 51 64 53 50 66 73
Salmon2 H 42 16 68 14 91 23 24 35 45 118R NA NA NA NA NA NA NA NA NA NA
SculpinsH 16 14 15 16 16 16 16 15 14 12R 60 57 59 59 59 61 61 61 63 60
SturgeonH 12 12 12 12 12 12 12 12 12 12R 24 24 24 24 24 25 25 25 25 25
SurfperchesH 118 118 118 118 118 118 118 118 118 118R 39 39 39 39 39 39 39 39 39 39
Albacore tuna
H 5 12 59 24 43 38 29 63 22 48R 0 0 0 0 0 0 0 0 0 0
2014 Angler Trip & Durable Goods Expenditures (thousands of dollars)Fishing Mode Trip Expenditures
Non-Residents ResidentsFor-Hire 725 13,495Private Boat 2,901 37,037Shore 1,141 10,209Total 4,767 60,741
Equipment Durable Goods ExpendituresFishing Tackle 47,888Other Equipment 26,690Boat Expenses 80,379Vehicle Expenses 64,812Second Home Expenses 4,116Total Durable Expenditures 223,884
Total State Trip and Durable Goods Expenditures 289,392

48
Nat
iona
l Ove
rvie
w |
Nor
th P
acifi
c |
Paci
fic |
Wes
tern
Pac
ific
| N
ew E
ngla
nd |
Mid
-Atla
ntic
| S
outh
Atla
ntic
| G
ulf
of M
exic
o
1 The U.S. Commercial Fishing Location Quotient (CFLQ) is 1. A CFLQ greater than 1 indicates that more commercial fishing occurs in this state than the national average. A CFLQ less than 1 indicates that les commercial fishing occurs in this state than the national average.2 ds = these data are suppressed.3 NA = not applicable.
Oregon | Marine Economy
Oregon’s State Economy (% of national total)
Establishments EmployeesAnnualPayroll
($ billions)
Employee Compensation
($ billions)
Gross StateProduct
($ billions)
CommercialFishing
LocationQuotient1
2005 108,571 (1.4%) 1,409,576 (1.2%) 50.02 (1.1%) 80.62 (1.1%) 147.58 (1.1%) 2.872013 108,527 (1.4%) 1,396,563 (1.2%) 61.06 (1.1%) 100.37 (1.1%) 204.87 (1.2%) 4.07%Change 0.0 -0.9 18.1 19.7 28.0 41.8
Seafood Sales & Processing - Non-Employer Firms (thousands of dollars)2
2005 2006 2007 2008 2009 2010 2011 2012 2013Seafood product prep. & packaging
Firms 9 7 ds 19 15 15 16 14 11Receipts 309 54 ds 957 466 510 467 346 319
Seafood sales,retail
Firms 7 11 11 16 12 15 16 11 dsReceipts 985 914 1,210 2,101 1,140 1,907 1,896 1,600 ds
Seafood Sales & Processing - Employer Establishments (thousands of dollars)2
2005 2006 2007 2008 2009 2010 2011 2012 2013
Seafood product prep. & packaging
Establishments 20 21 22 23 20 21 22 18 19Employees 762 896 819 850 812 806 805 934 907
Payroll 19,022 25,881 27,394 27,616 26,202 27,007 32,438 31,970 37,265
Seafood sales,wholesale
Establishments 23 16 18 18 19 22 27 21 19Employees 0 0 0 0 0 0 0 180 189
Payroll 0 0 0 0 0 0 0 7,602 8,065
Seafood sales,retail
Establishments 24 22 23 21 23 21 20 18 20Employees 204 306 171 178 151 162 163 126 147
Payroll 3,464 3,294 3,185 3,370 3,515 3,651 3,613 2,851 4,238
Transport, Support & Marine Operations - Employer Establishments (thousands of dollars)2,3
2005 2006 2007 2008 2009 2010 2011 2012 2013Coastal & GreatLakes freighttransportation
Establishments 9 9 13 8 9 8 8 8 7Employees ds ds 476 ds ds ds ds ds ds
Payroll ds ds 25,206 ds ds ds ds ds ds
Deep sea freighttransportation
Establishments 6 6 5 4 3 3 3 3 3Employees ds ds ds ds ds ds ds ds ds
Payroll ds ds ds ds ds ds ds ds dsDeep seapassengertransportation
Establishments 0 0 2 0 0 0 0 0 0Employees NA NA ds NA NA NA NA NA NA
Payroll NA NA ds NA NA NA NA NA NA
MarinasEstablishments 40 37 38 37 33 30 33 32 34
Employees 113 ds 138 106 109 102 102 119 104Payroll 3,550 ds 3,754 2,178 2,602 2,290 2,382 3,034 3,148
Marine cargohandling
Establishments 8 9 9 13 13 12 13 5 8Employees ds ds ds ds ds ds ds ds ds
Payroll ds ds ds ds ds ds ds ds dsNavigationalservices toshipping
Establishments 21 20 17 20 17 18 18 20 15Employees ds ds 183 200 189 144 152 176 81
Payroll ds ds 11,331 11,808 10,154 9,577 9,592 12,219 6,534
Port & harboroperations
Establishments 0 0 2 1 1 3 3 10 5Employees NA NA ds ds ds ds ds 90 ds
Payroll NA NA ds ds ds ds ds 6,512 ds
Ship & boatbuilding
Establishments 43 41 40 41 35 34 34 33 32Employees 1,298 1,230 1,441 1,692 1,886 980 1,179 1,504 1,406
Payroll 45,183 43,416 47,950 74,583 90,446 42,004 55,068 77,718 79,913

Tables | Washington
50
Nat
iona
l Ove
rvie
w |
Nor
th P
acifi
c |
Paci
fic |
Wes
tern
Pac
ific
| N
ew E
ngla
nd |
Mid
-Atla
ntic
| S
outh
Atla
ntic
| G
ulf
of M
exic
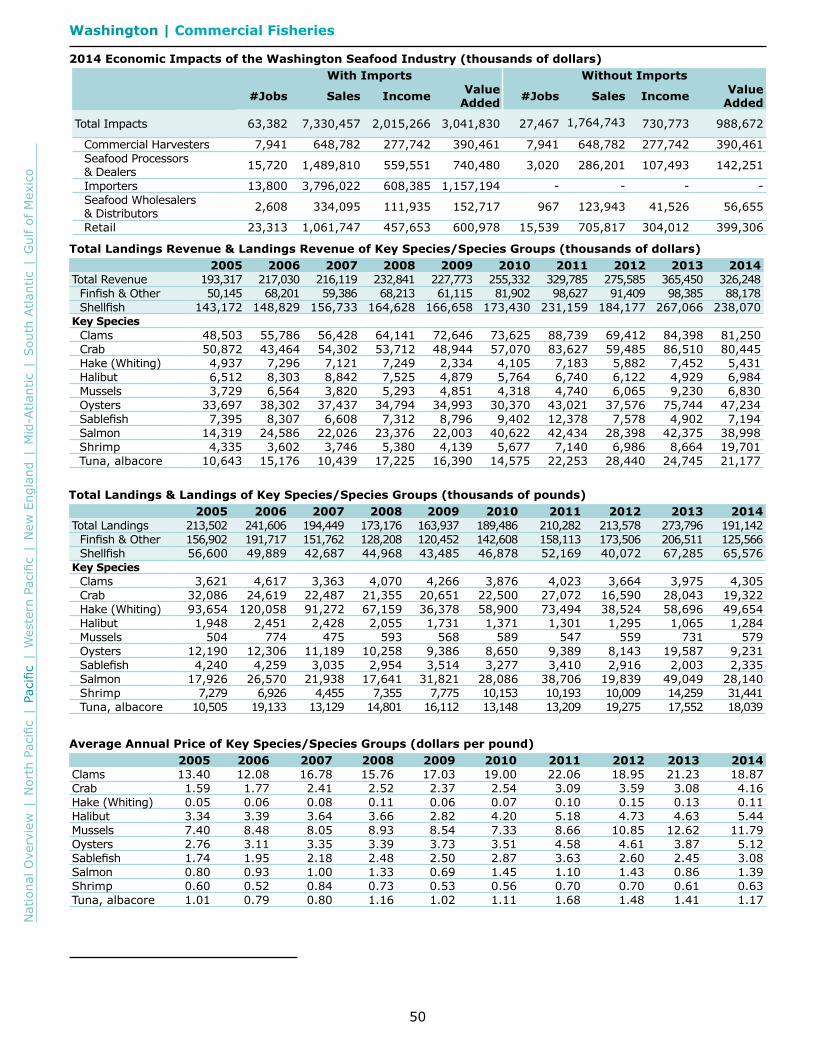
oWashington | Commercial Fisheries
2014 Economic Impacts of the Washington Seafood Industry (thousands of dollars)With Imports Without Imports
#Jobs Sales Income Value Added #Jobs Sales Income Value
Added
Total Impacts 63,382 7,330,457 2,015,266 3,041,830 27,467 1,764,743 730,773 988,672
Commercial Harvesters 7,941 648,782 277,742 390,461 7,941 648,782 277,742 390,461 Seafood Processors & Dealers 15,720 1,489,810 559,551 740,480 3,020 286,201 107,493 142,251
Importers 13,800 3,796,022 608,385 1,157,194 - - - - Seafood Wholesalers & Distributors 2,608 334,095 111,935 152,717 967 123,943 41,526 56,655
Retail 23,313 1,061,747 457,653 600,978 15,539 705,817 304,012 399,306
Total Landings Revenue & Landings Revenue of Key Species/Species Groups (thousands of dollars)2005 2006 2007 2008 2009 2010 2011 2012 2013 2014
Total Revenue 193,317 217,030 216,119 232,841 227,773 255,332 329,785 275,585 365,450 326,248 Finfish & Other 50,145 68,201 59,386 68,213 61,115 81,902 98,627 91,409 98,385 88,178 Shellfish 143,172 148,829 156,733 164,628 166,658 173,430 231,159 184,177 267,066 238,070
Key SpeciesClams 48,503 55,786 56,428 64,141 72,646 73,625 88,739 69,412 84,398 81,250 Crab 50,872 43,464 54,302 53,712 48,944 57,070 83,627 59,485 86,510 80,445 Hake (Whiting) 4,937 7,296 7,121 7,249 2,334 4,105 7,183 5,882 7,452 5,431 Halibut 6,512 8,303 8,842 7,525 4,879 5,764 6,740 6,122 4,929 6,984 Mussels 3,729 6,564 3,820 5,293 4,851 4,318 4,740 6,065 9,230 6,830 Oysters 33,697 38,302 37,437 34,794 34,993 30,370 43,021 37,576 75,744 47,234 Sablefish 7,395 8,307 6,608 7,312 8,796 9,402 12,378 7,578 4,902 7,194 Salmon 14,319 24,586 22,026 23,376 22,003 40,622 42,434 28,398 42,375 38,998 Shrimp 4,335 3,602 3,746 5,380 4,139 5,677 7,140 6,986 8,664 19,701 Tuna, albacore 10,643 15,176 10,439 17,225 16,390 14,575 22,253 28,440 24,745 21,177
Total Landings & Landings of Key Species/Species Groups (thousands of pounds)2005 2006 2007 2008 2009 2010 2011 2012 2013 2014
Total Landings 213,502 241,606 194,449 173,176 163,937 189,486 210,282 213,578 273,796 191,142 Finfish & Other 156,902 191,717 151,762 128,208 120,452 142,608 158,113 173,506 206,511 125,566 Shellfish 56,600 49,889 42,687 44,968 43,485 46,878 52,169 40,072 67,285 65,576
Key SpeciesClams 3,621 4,617 3,363 4,070 4,266 3,876 4,023 3,664 3,975 4,305 Crab 32,086 24,619 22,487 21,355 20,651 22,500 27,072 16,590 28,043 19,322 Hake (Whiting) 93,654 120,058 91,272 67,159 36,378 58,900 73,494 38,524 58,696 49,654 Halibut 1,948 2,451 2,428 2,055 1,731 1,371 1,301 1,295 1,065 1,284 Mussels 504 774 475 593 568 589 547 559 731 579 Oysters 12,190 12,306 11,189 10,258 9,386 8,650 9,389 8,143 19,587 9,231 Sablefish 4,240 4,259 3,035 2,954 3,514 3,277 3,410 2,916 2,003 2,335 Salmon 17,926 26,570 21,938 17,641 31,821 28,086 38,706 19,839 49,049 28,140 Shrimp 7,279 6,926 4,455 7,355 7,775 10,153 10,193 10,009 14,259 31,441 Tuna, albacore 10,505 19,133 13,129 14,801 16,112 13,148 13,209 19,275 17,552 18,039
Average Annual Price of Key Species/Species Groups (dollars per pound)2005 2006 2007 2008 2009 2010 2011 2012 2013 2014
Clams 13.40 12.08 16.78 15.76 17.03 19.00 22.06 18.95 21.23 18.87Crab 1.59 1.77 2.41 2.52 2.37 2.54 3.09 3.59 3.08 4.16Hake (Whiting) 0.05 0.06 0.08 0.11 0.06 0.07 0.10 0.15 0.13 0.11Halibut 3.34 3.39 3.64 3.66 2.82 4.20 5.18 4.73 4.63 5.44Mussels 7.40 8.48 8.05 8.93 8.54 7.33 8.66 10.85 12.62 11.79Oysters 2.76 3.11 3.35 3.39 3.73 3.51 4.58 4.61 3.87 5.12Sablefish 1.74 1.95 2.18 2.48 2.50 2.87 3.63 2.60 2.45 3.08Salmon 0.80 0.93 1.00 1.33 0.69 1.45 1.10 1.43 0.86 1.39Shrimp 0.60 0.52 0.84 0.73 0.53 0.56 0.70 0.70 0.61 0.63Tuna, albacore 1.01 0.79 0.80 1.16 1.02 1.11 1.68 1.48 1.41 1.17
51
National O
verview | N
orth Pacific | Pacific | Western Pacific | N
ew England | M
id-Atlantic | South Atlantic | G
ulf of Mexico
1 In this table, ’0’ = 0-999 thousand fish and ’1’ = 1,000-1,499 thousand fish.2 This species may not be equivalent to species with similar names listed in the commercial tables3 Data on sturgeon harvest not available for 2010-2013; Salmon harvest estimates exclude release mortality.4 NA = not available.
Washington | Recreational Fisheries
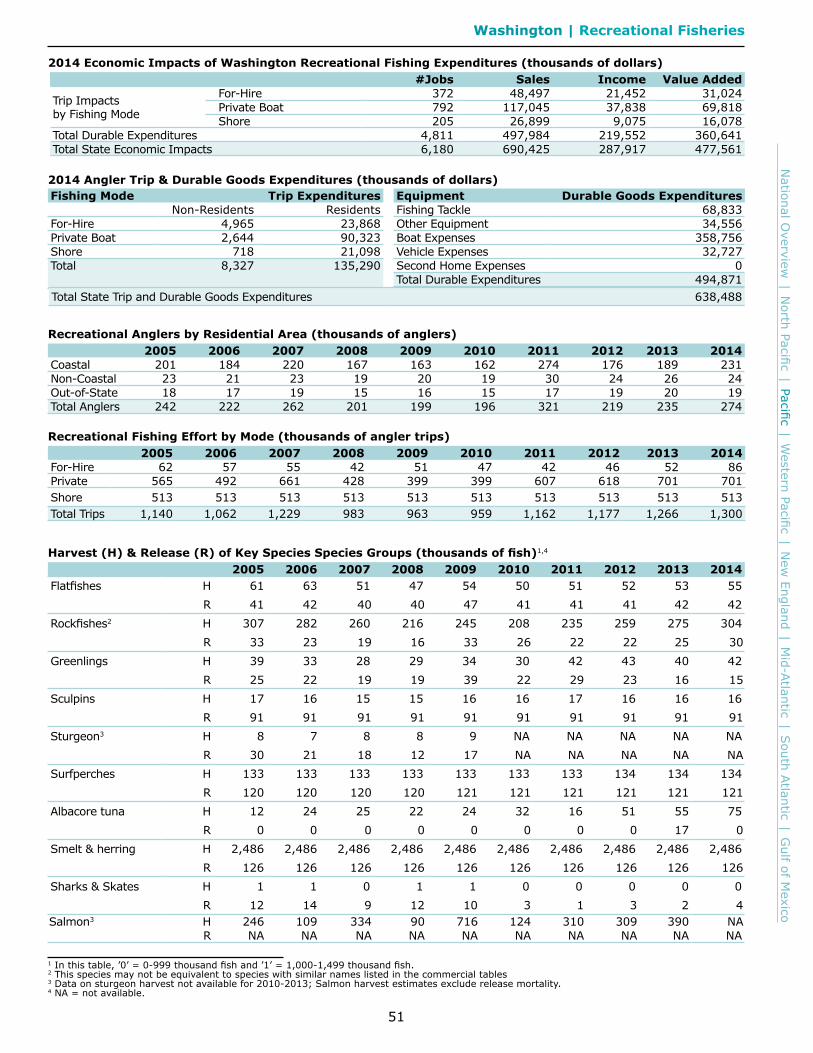
2014 Economic Impacts of Washington Recreational Fishing Expenditures (thousands of dollars)#Jobs Sales Income Value Added
Trip Impactsby Fishing Mode
For-Hire 372 48,497 21,452 31,024Private Boat 792 117,045 37,838 69,818Shore 205 26,899 9,075 16,078
Total Durable Expenditures 4,811 497,984 219,552 360,641Total State Economic Impacts 6,180 690,425 287,917 477,561
Recreational Anglers by Residential Area (thousands of anglers)2005 2006 2007 2008 2009 2010 2011 2012 2013 2014
Coastal 201 184 220 167 163 162 274 176 189 231Non-Coastal 23 21 23 19 20 19 30 24 26 24Out-of-State 18 17 19 15 16 15 17 19 20 19Total Anglers 242 222 262 201 199 196 321 219 235 274
Recreational Fishing Effort by Mode (thousands of angler trips)2005 2006 2007 2008 2009 2010 2011 2012 2013 2014
For-Hire 62 57 55 42 51 47 42 46 52 86Private 565 492 661 428 399 399 607 618 701 701Shore 513 513 513 513 513 513 513 513 513 513Total Trips 1,140 1,062 1,229 983 963 959 1,162 1,177 1,266 1,300
Harvest (H) & Release (R) of Key Species Species Groups (thousands of fish)1,4
2005 2006 2007 2008 2009 2010 2011 2012 2013 2014Flatfishes H 61 63 51 47 54 50 51 52 53 55
R 41 42 40 40 47 41 41 41 42 42Rockfishes2 H 307 282 260 216 245 208 235 259 275 304
R 33 23 19 16 33 26 22 22 25 30Greenlings H 39 33 28 29 34 30 42 43 40 42
R 25 22 19 19 39 22 29 23 16 15Sculpins H 17 16 15 15 16 16 17 16 16 16
R 91 91 91 91 91 91 91 91 91 91Sturgeon3 H 8 7 8 8 9 NA NA NA NA NA
R 30 21 18 12 17 NA NA NA NA NASurfperches H 133 133 133 133 133 133 133 134 134 134
R 120 120 120 120 121 121 121 121 121 121Albacore tuna H 12 24 25 22 24 32 16 51 55 75
R 0 0 0 0 0 0 0 0 17 0Smelt & herring H 2,486 2,486 2,486 2,486 2,486 2,486 2,486 2,486 2,486 2,486
R 126 126 126 126 126 126 126 126 126 126Sharks & Skates H 1 1 0 1 1 0 0 0 0 0
R 12 14 9 12 10 3 1 3 2 4Salmon3 H 246 109 334 90 716 124 310 309 390 NA
R NA NA NA NA NA NA NA NA NA NA
2014 Angler Trip & Durable Goods Expenditures (thousands of dollars)Fishing Mode Trip Expenditures
Non-Residents ResidentsFor-Hire 4,965 23,868Private Boat 2,644 90,323Shore 718 21,098Total 8,327 135,290
Equipment Durable Goods ExpendituresFishing Tackle 68,833Other Equipment 34,556Boat Expenses 358,756Vehicle Expenses 32,727Second Home Expenses 0Total Durable Expenditures 494,871
Total State Trip and Durable Goods Expenditures 638,488
52
Nat
iona
l Ove
rvie
w |
Nor
th P
acifi
c |
Paci
fic |
Wes
tern
Pac
ific
| N
ew E
ngla
nd |
Mid
-Atla
ntic
| S
outh
Atla
ntic
| G
ulf
of M
exic
o
1 The U.S. Commercial Fishing Location Quotient (CFLQ) is 1. A CFLQ greater than 1 indicates that more commercial fishing occurs in this state than the national average. A CFLQ less than 1 indicates that les commercial fishing occurs in this state than the national average.2 ds = these data are suppressed.
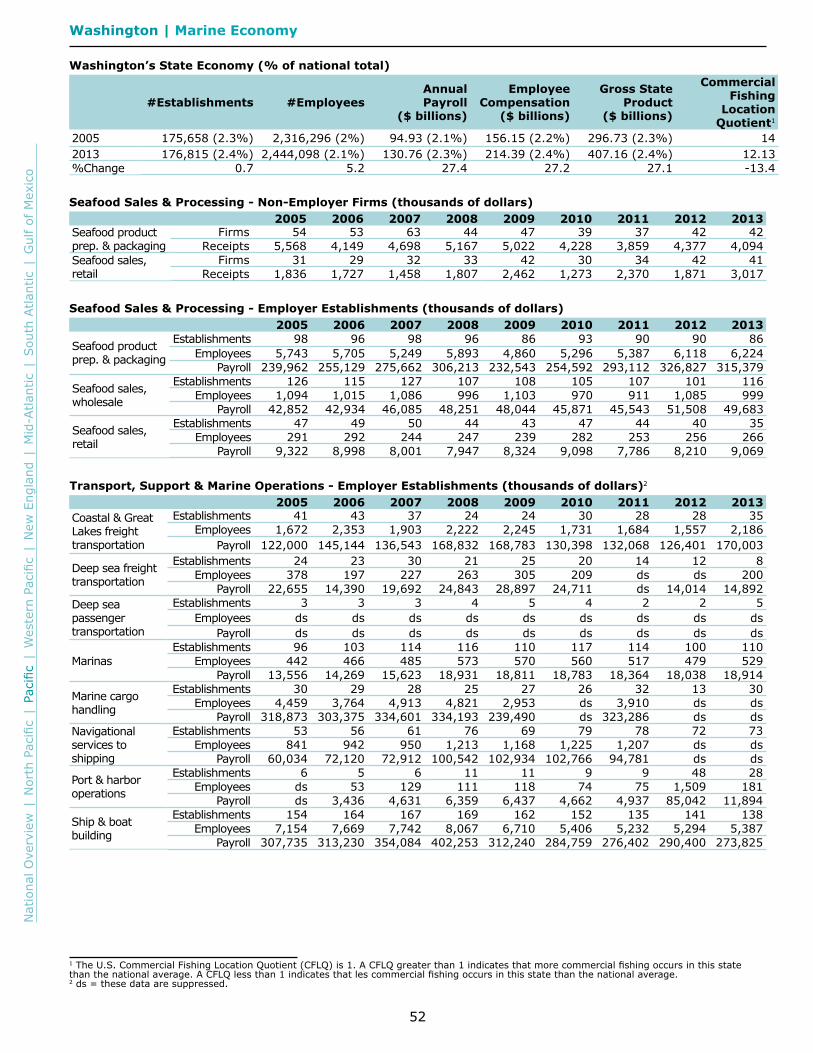
Washington | Marine Economy
Washington’s State Economy (% of national total)
#Establishments #EmployeesAnnualPayroll
($ billions)
Employee Compensation
($ billions)
Gross StateProduct
($ billions)
CommercialFishing
LocationQuotient1
2005 175,658 (2.3%) 2,316,296 (2%) 94.93 (2.1%) 156.15 (2.2%) 296.73 (2.3%) 142013 176,815 (2.4%) 2,444,098 (2.1%) 130.76 (2.3%) 214.39 (2.4%) 407.16 (2.4%) 12.13%Change 0.7 5.2 27.4 27.2 27.1 -13.4
Seafood Sales & Processing - Non-Employer Firms (thousands of dollars)2005 2006 2007 2008 2009 2010 2011 2012 2013
Seafood product prep. & packaging
Firms 54 53 63 44 47 39 37 42 42Receipts 5,568 4,149 4,698 5,167 5,022 4,228 3,859 4,377 4,094
Seafood sales,retail
Firms 31 29 32 33 42 30 34 42 41Receipts 1,836 1,727 1,458 1,807 2,462 1,273 2,370 1,871 3,017
Seafood Sales & Processing - Employer Establishments (thousands of dollars)2005 2006 2007 2008 2009 2010 2011 2012 2013
Seafood product prep. & packaging
Establishments 98 96 98 96 86 93 90 90 86Employees 5,743 5,705 5,249 5,893 4,860 5,296 5,387 6,118 6,224
Payroll 239,962 255,129 275,662 306,213 232,543 254,592 293,112 326,827 315,379
Seafood sales,wholesale
Establishments 126 115 127 107 108 105 107 101 116Employees 1,094 1,015 1,086 996 1,103 970 911 1,085 999
Payroll 42,852 42,934 46,085 48,251 48,044 45,871 45,543 51,508 49,683
Seafood sales,retail
Establishments 47 49 50 44 43 47 44 40 35Employees 291 292 244 247 239 282 253 256 266
Payroll 9,322 8,998 8,001 7,947 8,324 9,098 7,786 8,210 9,069
Transport, Support & Marine Operations - Employer Establishments (thousands of dollars)2
2005 2006 2007 2008 2009 2010 2011 2012 2013Coastal & GreatLakes freighttransportation
Establishments 41 43 37 24 24 30 28 28 35Employees 1,672 2,353 1,903 2,222 2,245 1,731 1,684 1,557 2,186
Payroll 122,000 145,144 136,543 168,832 168,783 130,398 132,068 126,401 170,003
Deep sea freighttransportation
Establishments 24 23 30 21 25 20 14 12 8Employees 378 197 227 263 305 209 ds ds 200
Payroll 22,655 14,390 19,692 24,843 28,897 24,711 ds 14,014 14,892Deep seapassengertransportation
Establishments 3 3 3 4 5 4 2 2 5Employees ds ds ds ds ds ds ds ds ds
Payroll ds ds ds ds ds ds ds ds ds
MarinasEstablishments 96 103 114 116 110 117 114 100 110
Employees 442 466 485 573 570 560 517 479 529Payroll 13,556 14,269 15,623 18,931 18,811 18,783 18,364 18,038 18,914
Marine cargohandling
Establishments 30 29 28 25 27 26 32 13 30Employees 4,459 3,764 4,913 4,821 2,953 ds 3,910 ds ds
Payroll 318,873 303,375 334,601 334,193 239,490 ds 323,286 ds dsNavigationalservices toshipping
Establishments 53 56 61 76 69 79 78 72 73Employees 841 942 950 1,213 1,168 1,225 1,207 ds ds
Payroll 60,034 72,120 72,912 100,542 102,934 102,766 94,781 ds ds
Port & harboroperations
Establishments 6 5 6 11 11 9 9 48 28Employees ds 53 129 111 118 74 75 1,509 181
Payroll ds 3,436 4,631 6,359 6,437 4,662 4,937 85,042 11,894
Ship & boatbuilding
Establishments 154 164 167 169 162 152 135 141 138Employees 7,154 7,669 7,742 8,067 6,710 5,406 5,232 5,294 5,387
Payroll 307,735 313,230 354,084 402,253 312,240 284,759 276,402 290,400 273,825


