
PaaSage!...machine. Just as LANCE,VISOR runs in the cloud domain and is responsible for collecting...
62
D5.1.2—Product Executionware Page 1 of 62 PaaSage Model Based Cloud Platform Upperware Deliverables D5.1.2 Product Executionware Version: 1.0
Transcript of PaaSage!...machine. Just as LANCE,VISOR runs in the cloud domain and is responsible for collecting...

D5.1.2—Product.Executionware. . Page.1.of.62.
....................... .
!!!!!!
PaaSage!..
Model!Based!Cloud!Platform!Upperware!....
Deliverables!D5.1.2!.
Product!Executionware....
Version:.1.0.
D5.1.2—Product.Executionware. . Page.2.of.62.
D5.1.2!Name,!title!and!organisation!of!the!scientific!representative!of!the!project's!coordinator:!!Mr!Philippe!Rohou!!!Tel:!+33!(0)4!97!15!53!06!!Fax:!+33!(0)4!92!387822!!!EUmail:[email protected]!Project!website!address:.http://www.paasage.eu.!Project
Grant Agreement number 317715
Project acronym: PaaSage
Project title: Model Based Cloud Platform Upperware
Funding Scheme: Integrated Project
Date of latest version of Annex I against which the assessment will be made:
03th July 2014
Document
Period covered:
Deliverable number: D5.1.2
Deliverable title Product Executionware/
Contractual Date of Delivery: 30th September 2015 (M36)
Actual Date of Delivery: 30st September 2015
Editor (s): Jörg Domaschka (UULM)
Author (s): Dennis Hoppe (USTUTT), Kyriakos Kritikos (FORTH), Craig Sheridan (FLEX), Edwin Yaqub (GWDG), Jörg Domaschka (UULM), Daniel Baur (UULM), Frank Griesinger (UULM), Daniel Seybold (UULM), Bartosz Balis (AGH), Dariusz Król (AGH), Maciej Malawski (AGH), Ahmed Zarioh (be.wan)
Reviewer (s): Kamil Figiela (AGH), Kyriakos Kritikos (FORTH)
Participant(s): Same as authors
Work package no.: 5
Work package title: Executionware
Work package leader: Jörg Domaschka (UULM)
Distribution: PU
Version/Revision: 1.0
Draft/Final: Final
Total number of pages (including cover): 62

D5.1.2—Product.Executionware. . Page.3.of.62.
DISCLAIMER!.
This.document.contains.description.of.the.PaaSage.project.work.and.findings..
The.authors.of.this.document.have.taken.any.available.measure.in.order.for.its.content.to.be.accurate,.consistent.and.lawful.. However,. neither. the. project. consortium. as. a. whole. nor. the. individual. partners. that. implicitly. or. explicitly.participated.in.the.creation.and.publication.of.this.document.hold.any.responsibility.for.actions.that.might.occur.as.a.result.of.using.its.content..
This.publication.has.been.produced.with.the.assistance.of.the.European.Union..The.content.of.this.publication. is.the.sole.responsibility.of.the.PaaSage.consortium.and.can.in.no.way.be.taken.to.reflect.the.views.of.the.European.Union..
.
The.European.Union. is.established. in.accordance.with. the.Treaty.on.European.Union.(Maastricht)..There.are.currently.28.Member.States.of.the.Union..It.is.based.on.the.European.Communities. and. the. member. states. cooperation. in. the.fields. of. Common. Foreign. and. Security. Policy. and. Justice.and. Home. Affairs.. The. five. main. institutions. of. the.European.Union.are. the.European.Parliament,. the.Council.of.Ministers,.the.European.Commission,.the.Court.of.Justice.and.the.Court.of.Auditors..(http://europa.eu).
!!
PaaSage!is!a!project!funded!in!part!by!the!European!Union.!

D5.1.2—Product Executionware Page 4 of 62
Executive SummaryThe Executionware constitutes a fundamental part of the entire PaaSage sys-tem and its architecture. The primary purposes of the Executionware are (i) toenact interacting with the cloud providers through their respective and largelyinhomogeneous APIs, in order to support the creation, configuration as well astear down of virtual machines and virtual networks; (ii) to enact the deploymentof application components such as load balancers, databases, and applicationservers across the created virtual machines; (iii) to support the monitoring ofboth virtual machines and application component instances by provisioning ofappropriate sensors/probes and by supporting a reporting interface for applica-tions; (iv) to support the aggregation of raw metrics coming from the probesto higher-level composite metrics, and the evaluation of any of these metricsaccording to conditions and thresholds; (v) to report back metric values to theUpperware and to store them in the Metadata-Database (MDDB).
Throughout the PaaSage project, the Executionware has been designed anddeveloped in order to fulfill these tasks. Following the concept of divide et im-pera this has led to a set of components that all support a sub set of the requestedfeatures, but whose interplay emerges to the desired functionality. Most compo-nents are collected in the CLOUDIATOR suite: COLOSSEUM runs in the domainof the PaaSage operator and represents the central access point for any clientsthrough a REST API as well as a Web UI. SWORD is a library that providesan abstraction layer for the various cloud providers. In particular, it encapsu-lates the differences between them with respect to terminology and technology.LANCE runs in the cloud domain. In particular, COLOSSEUM will deploy oneinstance of LANCE on each virtual machine it creates. LANCE is responsible forexecuting the life-cycle of the component instances to be installed on the virtualmachine. Just as LANCE, VISOR runs in the cloud domain and is responsiblefor collecting monitoring data from virtual machines and component instances.In particular, COLOSSEUM will install an instance of VISOR in any virtual ma-chine it creates. Whenever COLOSSEUM is requested to monitor certain aspectsof an application and/or virtual machine, it will connect to the VISOR instancerunning on that virtual machine and request the installation of a sensor togetherwith an interval.
AXE is a two-purpose component that runs partially in the home and par-tially in the cloud domain. Its first task is to post-process the monitoring datacollected by the visor component. In particular, AXE is capable of executingaggregation functions on the monitored data such as computing amongst otherstatistical functions like averages, medians, and quantiles. It may relay selectedmetrics to third party components including the Upperware.
D5.1.2—Product Executionware Page 5 of 62
The MetricsCollector component constitutes another multi-purposecomponent. The respective software runs as a daemon that can be operatedeither in local or global mode. In local mode, it operates in specific virtualmachines and replaces parts of the functionality of CLOUDIATOR’s AXE; hence,MetricsCollector instances running in local mode are optional and depen-dent on the configuration of the Executionware. In contrast, in global mode, theMetricsCollector component provides a publish/subscribe mechanism tointerested components of the Upperware and enables registering for metric dataas well as violations of metric conditions, i.e., events in the meta-data database(CDO server [3]).
D5.1.2—Product Executionware Page 6 of 62
Intended AudienceThis deliverable is a public document intended for readers with some experiencewith cloud computing and cloud middleware. It presumes that the reader is fa-miliar with the overall PaaSage architecture as described in deliverable D1.6.1 [2].
For the external reader, this deliverable provides an insight into the Execu-tionware sub-system of PaaSage, its architecture and its various entities.
For the research and industrial partners in PaaSage, this deliverable providesan understanding of the basic design and architecture of the Executionware, itscapabilities, but also its limitations.
D5.1.2—Product Executionware Page 7 of 62

Contents
1 Introduction and Overview 131.1 The Executionware in PaaSage . . . . . . . . . . . . . . . . . . 131.2 The Executionware Architecture . . . . . . . . . . . . . . . . . 15
1.2.1 CLOUDIATOR and its Tools . . . . . . . . . . . . . . . . 161.2.2 The MetricsCollector Component . . . . . . . . . 171.2.3 Third Party Components . . . . . . . . . . . . . . . . . 19
1.3 List of Changes from Initial Prototype . . . . . . . . . . . . . . 191.4 Structure of This Document . . . . . . . . . . . . . . . . . . . . 20
2 CLOUDIATOR 212.1 COLOSSEUM . . . . . . . . . . . . . . . . . . . . . . . . . . . 21
2.1.1 Registries . . . . . . . . . . . . . . . . . . . . . . . . . 222.1.2 Usage and APIs . . . . . . . . . . . . . . . . . . . . . . 222.1.3 Further Features . . . . . . . . . . . . . . . . . . . . . . 26
2.2 SWORD . . . . . . . . . . . . . . . . . . . . . . . . . . . . . . 272.3 LANCE . . . . . . . . . . . . . . . . . . . . . . . . . . . . . . 27
3 Monitoring and Auto-scaling 293.1 VISOR . . . . . . . . . . . . . . . . . . . . . . . . . . . . . . . 30
3.1.1 Available Sensors and Probes . . . . . . . . . . . . . . . 313.1.2 Application-specific Probes . . . . . . . . . . . . . . . . 333.1.3 Application specific probes for Scalarm and HyperFlow
engines . . . . . . . . . . . . . . . . . . . . . . . . . . 353.1.4 Client libraries for Visor . . . . . . . . . . . . . . . . . 36
3.2 TSDB Selection . . . . . . . . . . . . . . . . . . . . . . . . . . 363.2.1 Requirements . . . . . . . . . . . . . . . . . . . . . . . 363.2.2 KairosDB . . . . . . . . . . . . . . . . . . . . . . . . . 373.2.3 OpenTSDB . . . . . . . . . . . . . . . . . . . . . . . . 383.2.4 InfluxDB . . . . . . . . . . . . . . . . . . . . . . . . . 39
D5.1.2—Product Executionware Page 8 of 62
3.2.5 Selection of TSDB . . . . . . . . . . . . . . . . . . . . 403.2.6 Time-series Database Installation . . . . . . . . . . . . . 41
3.3 AXE . . . . . . . . . . . . . . . . . . . . . . . . . . . . . . . . 423.3.1 Aggregation . . . . . . . . . . . . . . . . . . . . . . . . 423.3.2 Scalability Rules Language . . . . . . . . . . . . . . . . 433.3.3 Auto-Scaling . . . . . . . . . . . . . . . . . . . . . . . 44
3.4 MetricsCollector . . . . . . . . . . . . . . . . . . . . . . 443.4.1 MetricsCollector Modes of Operation . . . . . . 453.4.2 Main Assumptions . . . . . . . . . . . . . . . . . . . . 463.4.3 Architecture . . . . . . . . . . . . . . . . . . . . . . . . 463.4.4 Modes of Interaction . . . . . . . . . . . . . . . . . . . 513.4.5 Integration with AXE . . . . . . . . . . . . . . . . . . . 51
4 Further Aspects 534.1 Testbeds . . . . . . . . . . . . . . . . . . . . . . . . . . . . . . 53
4.1.1 GWDG’s OpenStack Testbed . . . . . . . . . . . . . . . 534.1.2 Flexiant Testbed (FLEX) . . . . . . . . . . . . . . . . . 54
4.2 Deployment Controller . . . . . . . . . . . . . . . . . . . . . . 57
5 Conclusion and Future Work 59
Bibliography 61
D5.1.2—Product Executionware Page 9 of 62

TerminologyThroughout this document we use a set of terms with an overloaded meaning.Therefore, this section aims at defining these terms for this document in a briefand concise manner. Throughout this deliverable, all of the terms defined hereare exclusively used according to our definition and not in any other way.
Cloud Terminology
Cloud platform A cloud platform refers to a software stack and accordingly tothe API offered by that stack. As the platform is something completely passiveand not a concrete offer (cf. cloud) it does, however, not define contact endpoints(e.g. URIs). The OpenStack software suite and Flexiant Cloud Orchestrator(FCO) are examples of cloud platforms.
Cloud provider A cloud provider is an organizational entitiy or some otherkind of actor that runs a cloud platform under a dedicated endpoint/URL (e.g.RedStack). This means, it defines the access points (i.e. URIs) to access theservices offered. In addition to that, legal aspects are tied to the cloud provider.Amazon EC2 is an example of a cloud provider. Within the PaaSage consortiumexamples include GWDG running an OpenStack cloud platform and Flexiantrunning a FCO cloud platform.
Cloud A cloud refers to a cloud platform offered by a cloud provider as seenby a tenant. That is, besides the endpoint of the provider, a cloud (in contrast tothe Cloud) is also linked to log-in credentials such as username and password.
Application Terminology
(Cloud) application A (cloud) application is a possibly distributed applicationconsisting of one or multiple interlinked application components. As such, anapplication is solely a description and does not represent anything enacted.
(Application) component An (application) component for short is the small-est divisible element of an application. It is the unit of scale and the unit offailure. For illustration consider a blog application that may consist of thethree components load balancer, application server together with a servlet, and adatabase. A component is composed of multiple software artefacts.
D5.1.2—Product Executionware Page 10 of 62
(Software) artefact A software artefact is any entity that is required for theexecution of a component. This may be a binary, a shared library, an operatingsystem package installed through the package manager, a software container, ajar file or anything the like.
Lifecycle handler The lifecycle handlers of a component are software pro-grammes or scripts that define the basic life cycle actions of a component suchas install, configure, and run the application component, but also health check-ing.
Application instance The deployment of an application results in an applica-tion instance. An application instance for application A is linked to at least onecomponent instance for each component that belongs to A.
Component instance A component instance is an enacted component. Com-ponent instances are created through the lifecycle handlers associated with therespective component. Each component instance is run on a particular virtualmachine VMk and multiple component instances can be mapped to the samevirtual machine.
Channel Components may be connected with each other using directed chan-nels. Connecting two components with a channel imposes that at least onecomponent instance from the source component will interact with at least oneinstance from the target component in the context of the same application in-stance. The concrete wiring between the source and target instances is subject toboth the deployment and the scaling.
D5.1.2—Product Executionware Page 11 of 62


1
Introduction and Overview
The Executionware constitutes a fundamental part of the entire PaaSage sys-tem and its architecture. The primary purposes of the Executionware are (i) toenact interacting with the cloud providers through their respective and largelyinhomogeneous APIs, in order to support the creation, configuration as well astear down of virtual machines and virtual networks; (ii) to enact the deploymentof application components such as load balancers, databases, and applicationservers across the created virtual machines; (iii) to support the monitoring ofboth virtual machines and application component instances by provisioning ofappropriate sensors/probes and by supporting a reporting interface for applica-tions; (iv) to support the aggregation of raw metrics coming from the probesto higher-level composite metrics, and the evaluation of any of these metricsaccording to conditions and thresholds; (v) to report back metric values to theUpperware and to store them in the Metadata-Database (MDDB).
This document presents an overview and documentation for the product re-lease version of the PaaSage Executionware implementation. This chapter pro-vides an overview on the Executionware and particularly presents its purposesand tasks within PaaSage (cf. Section 1.1), its overall mechanisms and architec-ture (cf. Section 1.2), while also introducing the software components. After-wards, this chapter presents the changes that have been made compared to theinitial prototype [6] (cf. Section 1.3). Finally, we present the structure of theremainder of this document in Section 1.4.
1.1 The Executionware in PaaSageThe Executionware constitutes a fundamental part of the entire PaaSage sys-tem and its architecture. The PaaSage architecture as described in deliverableD1.6.1 [2] defines the role of the Executionware in the PaaSage application life-cycle. Together with the user requirements as defined in deliverable D6.1.1 [7]these define the overall functionality provided by the Executionware.
13

Provisioning) and)deploymentmodelling
Quality)of)service)
modelling
Provisioning) and)deployment)requirements
Service8level)objectives Scalability)rules
Organisation)modelling
Provider)modelling
Organisation)models Provider) models
CAMELCloud) provider8
independent) model Profiler Constraint) problem Reasoner
CAMELCloud) provider8specific)model
Adapter
Deployment)plansExecutionwareInfrastructures)/)Platforms
Historical) data
Modellingphase
Deploymentphase
Executionphase
Figure 1.1: Main PaaSage components and life-cycle direction including dataand model flow as deliverable D1.6.1 [2].
Summarising, the focus of the Executionware is three-fold: First, it is respon-sible for bringing applications to execution that have been modelled in CAMELand whose deployment has been configured by PaaSage’s Upperware compo-nent. Second, the Executionware is responsible for monitoring the execution ofeach individual component instance which leads to the monitoring of the overallapplication instance using defined aggregation methods. Third, the PaaSage ar-chitecture enables the Executionware to autonomously change the deployment ofan application within certain boundaries and according to the application model.These changes comprise e.g., adding new or removing existing component in-stances and virtual machines.
The initial PaaSage architecture has been specified in deliverable D1.6.1 to-gether with a sketch of the Executionware architecture. The latter has then berefined in deliverable D5.1.1 [6] that also presented the initial prototype of theExecutionware.
Figure 1.1 sketches the data flow and model flow between the individualPaaSage components at configuration, deployment, and execution phase. Itpoints out that the application model is created in CAMEL [3]. Then, the de-ployment workflow ripples through the Upperware [4] and finally reaches theExecutioware through the adapter. The adapter orchestrates the creation of vir-tual machines and the deployment of component instances over these virtualmachines which is then executed by the Executionware.
Figure 1.1 also shows that selected data flows back to the Upperware. This isachieved using the monitoring and aggregation infrastructure of the Execution-ware. In addition, selected data is also stored in the metadata database. Again, itis the Upperware’s adapter that defines the monitoring and aggregation to be usedby the Executionware. In addition to that, the adapter configures the low-level
D5.1.2—Product Executionware Page 14 of 62
domain of PaaSage operator
metadata database
executionware
colosseum(API andbusinesslogic)
upperware
sword deploy-ment library
domain of cloud operator (e.g. Flexiant)
ProviderAPI
virtual machine
componentinstance
Lance
sensors
CDO server
globalMetricsCollector Axe
Axe
Visor
TSDBTSDB
othervirtual machineTSDB
driverdriverdriverdriver
model/logic flow(monitoring) data flow
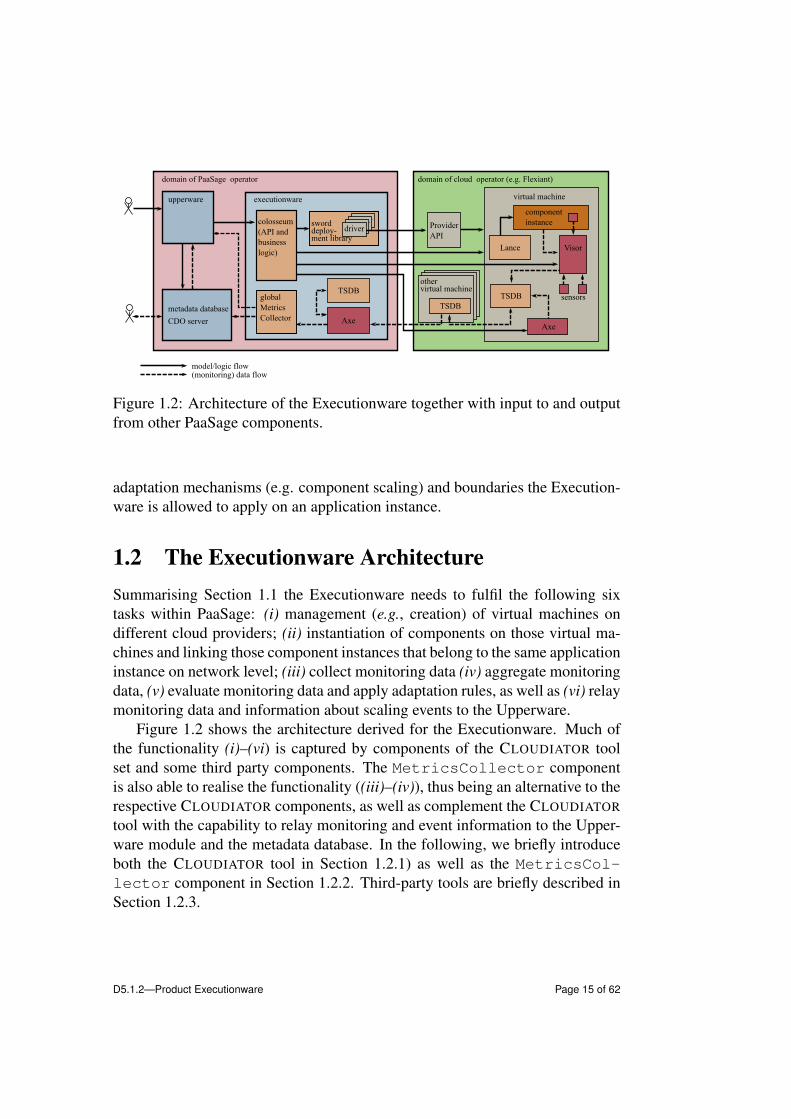
Figure 1.2: Architecture of the Executionware together with input to and outputfrom other PaaSage components.
adaptation mechanisms (e.g. component scaling) and boundaries the Execution-ware is allowed to apply on an application instance.
1.2 The Executionware ArchitectureSummarising Section 1.1 the Executionware needs to fulfil the following sixtasks within PaaSage: (i) management (e.g., creation) of virtual machines ondifferent cloud providers; (ii) instantiation of components on those virtual ma-chines and linking those component instances that belong to the same applicationinstance on network level; (iii) collect monitoring data (iv) aggregate monitoringdata, (v) evaluate monitoring data and apply adaptation rules, as well as (vi) relaymonitoring data and information about scaling events to the Upperware.
Figure 1.2 shows the architecture derived for the Executionware. Much ofthe functionality (i)–(vi) is captured by components of the CLOUDIATOR toolset and some third party components. The MetricsCollector componentis also able to realise the functionality ((iii)–(iv)), thus being an alternative to therespective CLOUDIATOR components, as well as complement the CLOUDIATORtool with the capability to relay monitoring and event information to the Upper-ware module and the metadata database. In the following, we briefly introduceboth the CLOUDIATOR tool in Section 1.2.1) as well as the MetricsCol-lector component in Section 1.2.2. Third-party tools are briefly described inSection 1.2.3.
D5.1.2—Product Executionware Page 15 of 62

1.2.1 CLOUDIATOR and its ToolsCLOUDIATOR1 is a cross-cloud, multi-tenant tool that has been developed withthe PaaSage project. In addition to cross-cloud deployment, it supports themodel@runtime paradigm [16] and also comes with redeployment capabili-ties to support automatic as well as manual adaptations. Regarding auto-scalingsupport, CLOUDIATOR goes beyond basic threshold-based approaches and sup-ports the full capabilities provided by the scalability rules language contained inPaaSage’s CAMEL.
As presented in Figure 1.2, the functionality of CLOUDIATOR is split acrossa so-called home domain and possible multiple cloud domains. The componentsof the home domain form the static part of the infrastructure that is hosted by thePaaSage operator and is not necessarily executed in a cloud environment. Thesecond group of CLOUDIATOR entities is brought out in the field together withapplication component instances. Their main purpose is the provisioning of arun-time environment for these component instances and to collect and storemonitoring data. The following paragraphs briefly summarise the respectivecomponents and explain their features. Also, they reference the sections wherethe individual components are discussed in more detail. Apart from the com-ponents shown in Figure 1.2, the Executionware (in particular COLOSSEUM)comes with an extension that allows the user to trigger a full PaaSage workflowfor a CAMEL model. This feature is sketched in Section 4.2.
Colosseum The COLOSSEUM component runs in the home domain and repre-sents the central access point for any clients through a REST as well as a WebUI-based interface (cf. Section 2.1.2). Clients may either be human operatorsor third party tools including the components of the Upperware. COLOSSEUMcontains a set of registries that store information about cloud providers, createdvirtual machines, components, and component instances. Colosseum and its APIis presented in detail in Section 2.1.
Sword SWORD is a library that provides an abstraction layer for the variouscloud providers. In particular, it encapsulates the differences between them withrespect to terminology and technology such as the provisioning of floating IPs,passwords, and access to virtual machines. Sword is introduced in more detailin Section 2.2.
Lance LANCE runs in the cloud domain. In particular, Colosseum will deployone instance of Lance on each virtual machine it creates. Lance is responsible
1https://github.com/cloudiator/
D5.1.2—Product Executionware Page 16 of 62

for executing the life-cycle of the component instances to be installed on thevirtual machine. Hence, Lance executes the scripts to download, install, config-ure, and start instances, as well as those for stoping the component and those forupdating the configuration when the set-up of the application instance changes,for instance, because a new downstream component has been added. Lance isdepicted in detail in Section 2.3.
Visor VISOR runs in the cloud domain and is responsible for collecting moni-toring data from virtual machines and component instances. In particular, Colos-seum will install an instance of Visor in any virtual machine it creates. WheneverColosseum is requested to monitor certain aspects of an application and/or vir-tual machine, it will connect to the Visor of that virtual machine and request theinstallation of a sensor at Visor together with a time interval. Visor will theninvoke the sensor at the requested interval and send the data to the configuredtime-series database (TSDB) (cf. Section 1.2.3). In addition to that, componentinstances can connect to Visor and report application-specific metrics. Visor, itsdefault set of sensors, as well as its API are discussed in Section 3.1.
Axe AXE is a two-purpose component that runs partially in the home and par-tially in the cloud domain. Its first task is to post-process the data collected by thevisor component. In particular, Axe is capable of executing aggregation func-tions on the monitored data such as computing amongst other averages, medians,and quantiles. It reports selected metrics to the Upperware via the Metrics-Collector (cf. Section 1.2.2). In addition to that, Axe is concerned withevaluating conditions on the measured and aggregated data. It will then reportviolations of these conditions to the Upperware via the MetricsCollectoror even trigger changes in the application instance, e.g., by adding new virtualmachines and component instances (scale out). Section 3.3 presents AXE indetail.
1.2.2 The MetricsCollector ComponentThe MetricsCollector component is a multi-purpose component. The re-spective software runs as a daemon that can be operated either in local or globalmode. In local mode it replaces parts of the functionality of CLOUDIATOR’sAXE; hence, MetricsCollector instances running in local mode are op-tional and dependent on the configuration of the Executionware. In contrast, inglobal mode, the MetricsCollector component provides a link to the Up-perware components and enables registering metric data as well as violations ofmetric conditions, i.e., events in the meta-data database (CDO server [3]). The
D5.1.2—Product Executionware Page 17 of 62
domain of PaaSage operator
metadata database
executionware
colosseum(API andbusinesslogic)
upperware
sword deploy-ment library
domain of cloud operator (e.g. Flexiant)
ProviderAPI
virtual machine
componentinstance
Lance
sensors
CDO server
globalMetricsCollector
Visor
TSDBTSDB
othervirtual machine
driverdriverdriverdriver
localMetricsCollector
model/logic flow(monitoring) data flow
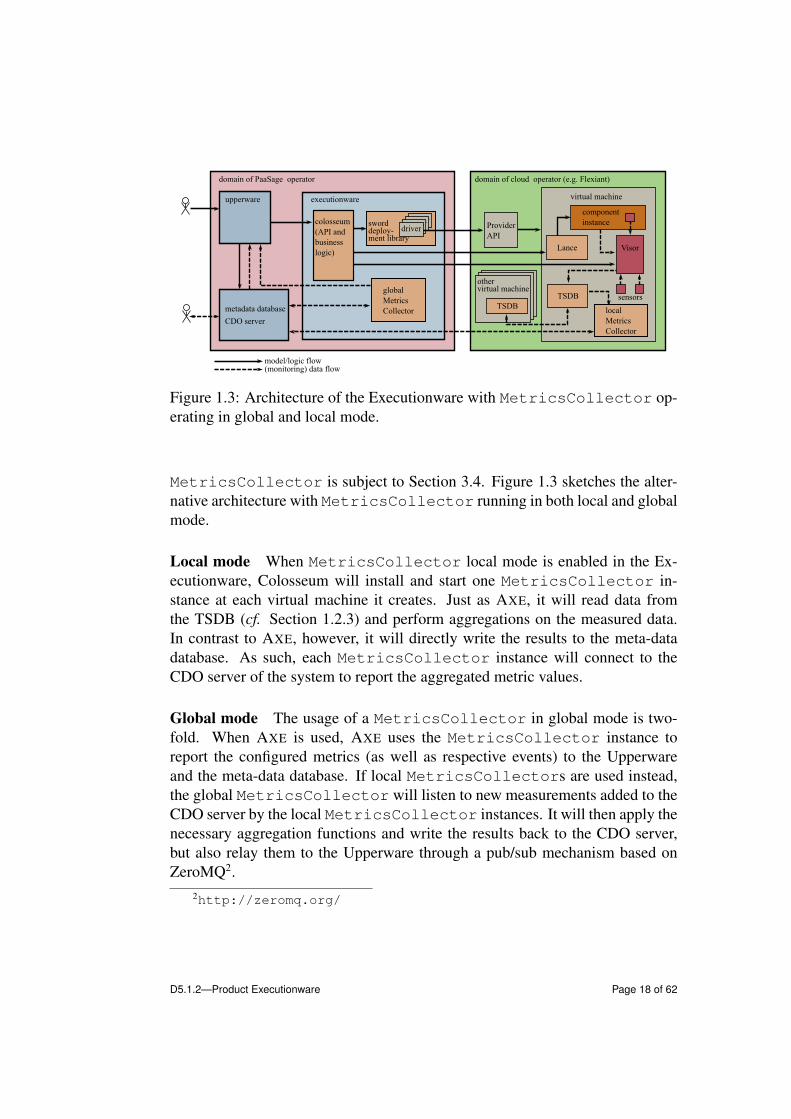
Figure 1.3: Architecture of the Executionware with MetricsCollector op-erating in global and local mode.
MetricsCollector is subject to Section 3.4. Figure 1.3 sketches the alter-native architecture with MetricsCollector running in both local and globalmode.
Local mode When MetricsCollector local mode is enabled in the Ex-ecutionware, Colosseum will install and start one MetricsCollector in-stance at each virtual machine it creates. Just as AXE, it will read data fromthe TSDB (cf. Section 1.2.3) and perform aggregations on the measured data.In contrast to AXE, however, it will directly write the results to the meta-datadatabase. As such, each MetricsCollector instance will connect to theCDO server of the system to report the aggregated metric values.
Global mode The usage of a MetricsCollector in global mode is two-fold. When AXE is used, AXE uses the MetricsCollector instance toreport the configured metrics (as well as respective events) to the Upperwareand the meta-data database. If local MetricsCollectors are used instead,the global MetricsCollector will listen to new measurements added to theCDO server by the local MetricsCollector instances. It will then apply thenecessary aggregation functions and write the results back to the CDO server,but also relay them to the Upperware through a pub/sub mechanism based onZeroMQ2.
2http://zeromq.org/
D5.1.2—Product Executionware Page 18 of 62
1.2.3 Third Party ComponentsBeside the components described above that have been developed in the scopeof the project, the Executionware relies on two components that are provided bythird parties: the TSDB as well as the registry service.
TSDB The time-series database is used by VISOR to buffer measured data andby AXE and MetricsCollector (in local mode) respectively to retrieve datanecessary for their aggregations. AXE also uses the TSDB for buffering interme-diate results. Currently, the Executionware supports KairosDB 3 as TSDB, butother implementations have been considered. The selection process is detailedin Section 3.2.
Registry service For being able to track the status of the installed and startedcomponent instances and their wiring, LANCE relies on a registry service whereit puts status information and network configurations. Currently, LANCE sup-ports two implementations for this service: a Colosseum-internal one with vola-tile state and a persistent one based on the external directory server etcd4. Theregistry’s usage is detailed with the description of Colosseum (cf. Section 2.1)and LANCE (cf. Section 2.3) respectively.
1.3 List of Changes from Initial PrototypeCompared to the initial prototype presented in M18 in D5.1.1 [6], several thingshave changed. The most noticeable is the fact that the Executionware has aban-doned the use of Cloudify v2.7 and replaced the deployment engine with a cus-tom implementation, CLOUDIATOR, that has been released as an open sourcesoftware library5. The reason for that move was two-fold: First, with the releaseof the M18 prototype, GigaSpaces—the maintainer of Cloudify—released ver-sion 3 of Cloudify and discontinued support for version 2.7 that the prototypehad been using. Second, the new release contained concepts that were incom-patible with the PaaSage architecture. Also multiple required features such asthe user interface were only available in the commercial version. We decidedto implement CLOUDIATOR from scratch in order to overcome limitations thatexisting tools have and to avoid their vendor lock-in as well as the instabilitiesof many open source tools such as Apache Stratos6 and Apache Brooklyn7.
3https://github.com/kairosdb/kairosdb4https://github.com/coreos/etcd5https://github.com/cloudiator6http://stratos.apache.org/7https://brooklyn.incubator.apache.org/
D5.1.2—Product Executionware Page 19 of 62
In addition to that, the feature completion has advanced beyond what waspresented in M18. While almost all desired features have been integrated andimplemented, some of them such as the Windows support are in a very earlystage and will have to be finalised and hardened in the upcoming Year 4 of theproject.
1.4 Structure of This DocumentThe structure of this document has been widely introduced while describing theindividual components. Hence, the following Chapter 2 introduces Colosseum,SWORD, LANCE, whereas Chapter 3 presents monitoring-related aspects suchas VISOR, the TSDB selection, AXE, as well as the MetricsCollector indetail. The remaining parts of the document address further aspects of the Exe-cutionware in Chapter 4 such as the operation of testbeds and the provisioning ofan access point for users such as the social network [5]. Finally, Chapter 5 con-cludes the document with an overview of the components, and their downloadlocation.
D5.1.2—Product Executionware Page 20 of 62
2
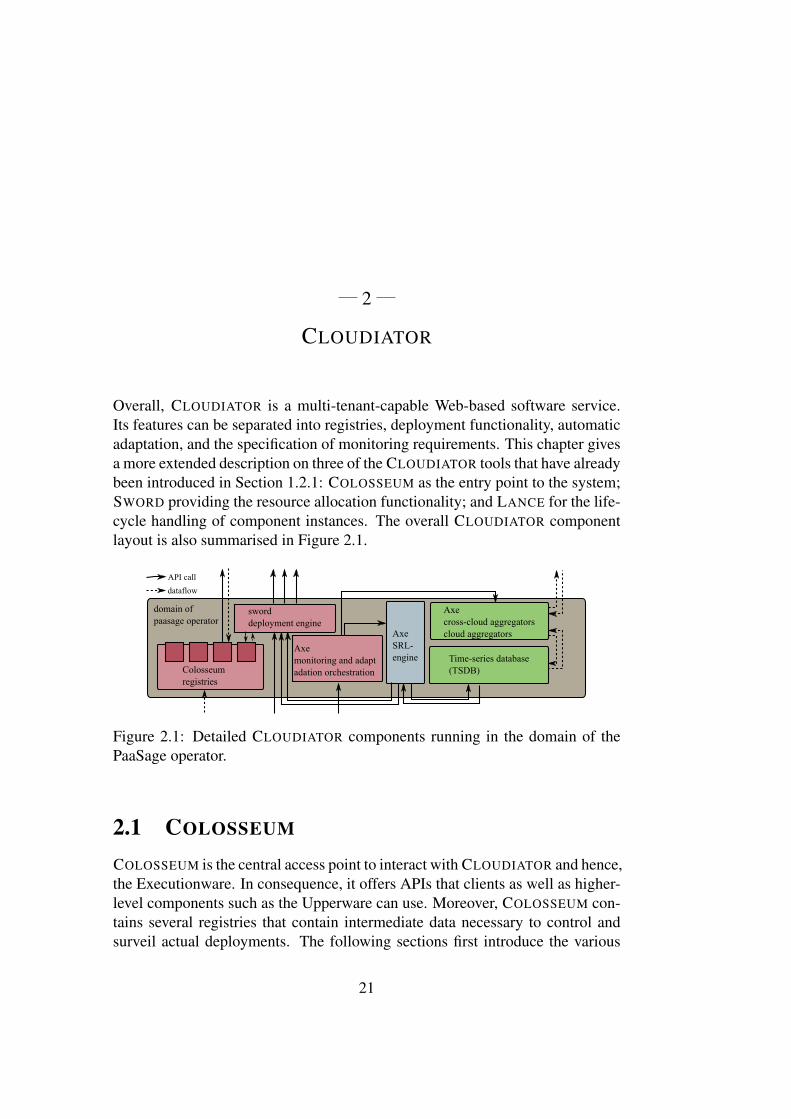
CLOUDIATOR
Overall, CLOUDIATOR is a multi-tenant-capable Web-based software service.Its features can be separated into registries, deployment functionality, automaticadaptation, and the specification of monitoring requirements. This chapter givesa more extended description on three of the CLOUDIATOR tools that have alreadybeen introduced in Section 1.2.1: COLOSSEUM as the entry point to the system;SWORD providing the resource allocation functionality; and LANCE for the life-cycle handling of component instances. The overall CLOUDIATOR componentlayout is also summarised in Figure 2.1.
Colosseumregistries
sworddeployment engine
Time-series database(TSDB)
Axecross-cloud aggregatorscloud aggregators
domain ofpaasage operator
AxeSRL-engine
Axemonitoring and adaptadation orchestration
dataflowAPI call
Figure 2.1: Detailed CLOUDIATOR components running in the domain of thePaaSage operator.
2.1 COLOSSEUM
COLOSSEUM is the central access point to interact with CLOUDIATOR and hence,the Executionware. In consequence, it offers APIs that clients as well as higher-level components such as the Upperware can use. Moreover, COLOSSEUM con-tains several registries that contain intermediate data necessary to control andsurveil actual deployments. The following sections first introduce the various
21
registries (cf. Section 2.1.1) and then present the REST-based as well as thebrowser-based API in Section 2.1.2.
2.1.1 RegistriesThe data stored in the registries lay the ground for the management, access to,and comparison of cloud providers. They are essential for the deployment (cf.Section 2.2) and monitoring features (cf. Chapter 3). So far, CLOUDIATOR andwith it COLOSSEUM contains four different registries: (i) The cloud registrystores offerings of cloud providers. This includes the type of cloud platform of-fered, the data centres and availability zones offered by that provider, the virtualmachine types (flavours) and operating system images available at each of thesesystem levels. Additional geographical location information can be attachedto each data centre. (ii) The specification registry stores abstract properties ofcloud providers. This includes generic virtual machine specifications consistingof number of cores and amount of RAM. This registry, also supports an operatingsystems hierarchy that for instance states that Ubuntu 14.04 belongs to theUbuntu family which in turn belongs to the class of Linux operating systems.The entries of the specification registry are linked to these of the cloud registrieswhere applicable. (iii) The credential registry holds cloud access credentials foreach user of CLOUDIATOR needed for SWORD to access the cloud providers.The kind of credentials stored vastly depend on the underlying cloud platform.(iv) The component registry contains components and their description (e.g. life-cycle management information) which can be assembled to applications. Theseapplications can then be instantiated (cf. Section 2.3). Each of the registries ismulti-tenant capable, meaning that any entry is bound to a CLOUDIATOR tenant.
2.1.2 Usage and APIsCLOUDIATOR can be used in two ways by the end users. First, abstract require-ments regarding the virtual machines can be specified in a cloud-independentway relying on CLOUDIATOR’s simple reasoning functionality.
The second approach is to specify in a fine-grained way which concrete vir-tual machine flavours shall be used on what cloud and with what image. In thiscase, it is necessary to combine CLOUDIATOR with a more powerful reason-ing mechanism and a modelling approach. Obviously, this is the approach theplatform is used within a PaaSage setting. Here, the modelling is done through aCAMEL model followed by a multi-step reasoning process that eventually yieldsa deployment plan including monitoring, aggregation and scalability rules.
The following sections briefly introduce the REST-ful API offered by COLOS-SEUM as well as the Web-based user interface.
D5.1.2—Product Executionware Page 22 of 62
GET /api/hardwareOffer/2{"numberOfCores":4,"mbOfRam":4096,"localDiskSpace":20000
}
(a) Sample REST response of a call to retrieve details about a cloud-operator independent hardware descriptionGET /api/hardware/2{
"cloud":1,"hardwareOffer":2,"remoteId":"939c4993-8562-42af-a80c-d8829863d433","locations": [1, 2 ],"cloudCredentials": [1 ]
}
(b) Sample REST response of a call to retrieve details about acloud-operator specific hardware description referencing the operator-independent descriptionPOST /api/virtualMachine{
"name":"scalarm_vm_1","cloud":1,"image":4,"hardware":2,"location":1
}
(c) Sample REST call to start a virtual machine with a dedicated image,at a dedicated cloud provider, and with a specific operating systemimage.
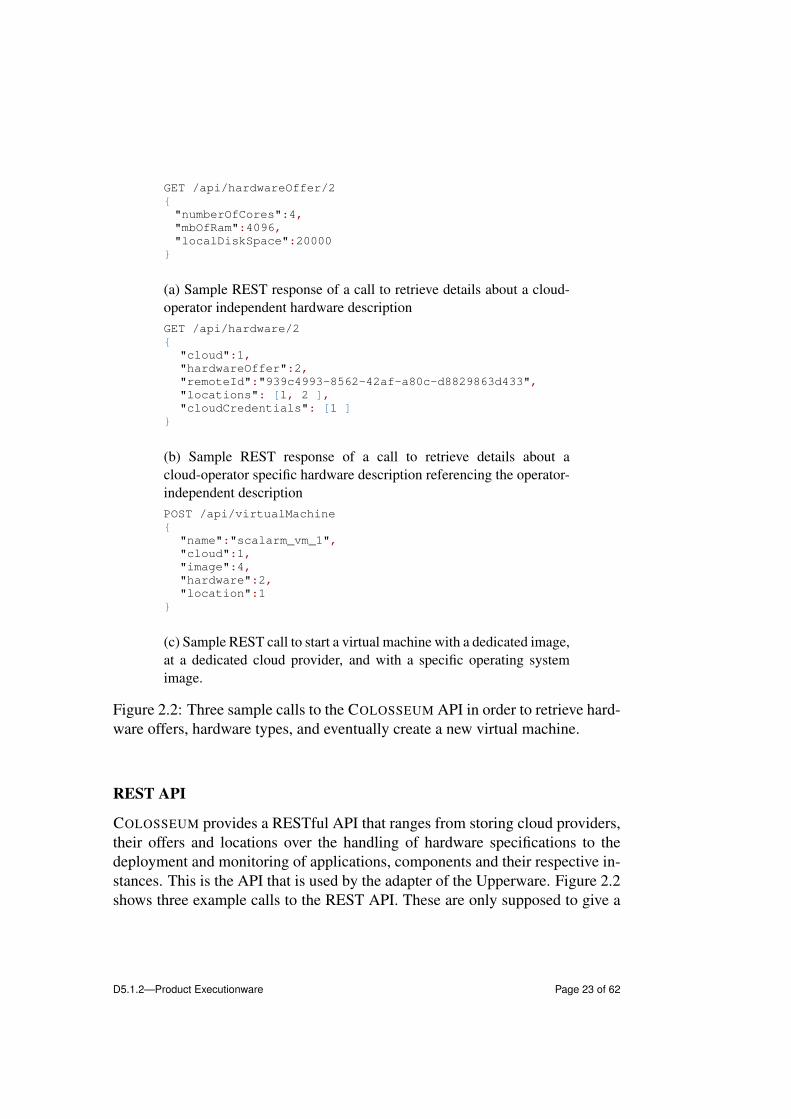
Figure 2.2: Three sample calls to the COLOSSEUM API in order to retrieve hard-ware offers, hardware types, and eventually create a new virtual machine.
REST API
COLOSSEUM provides a RESTful API that ranges from storing cloud providers,their offers and locations over the handling of hardware specifications to thedeployment and monitoring of applications, components and their respective in-stances. This is the API that is used by the adapter of the Upperware. Figure 2.2shows three example calls to the REST API. These are only supposed to give a
D5.1.2—Product Executionware Page 23 of 62
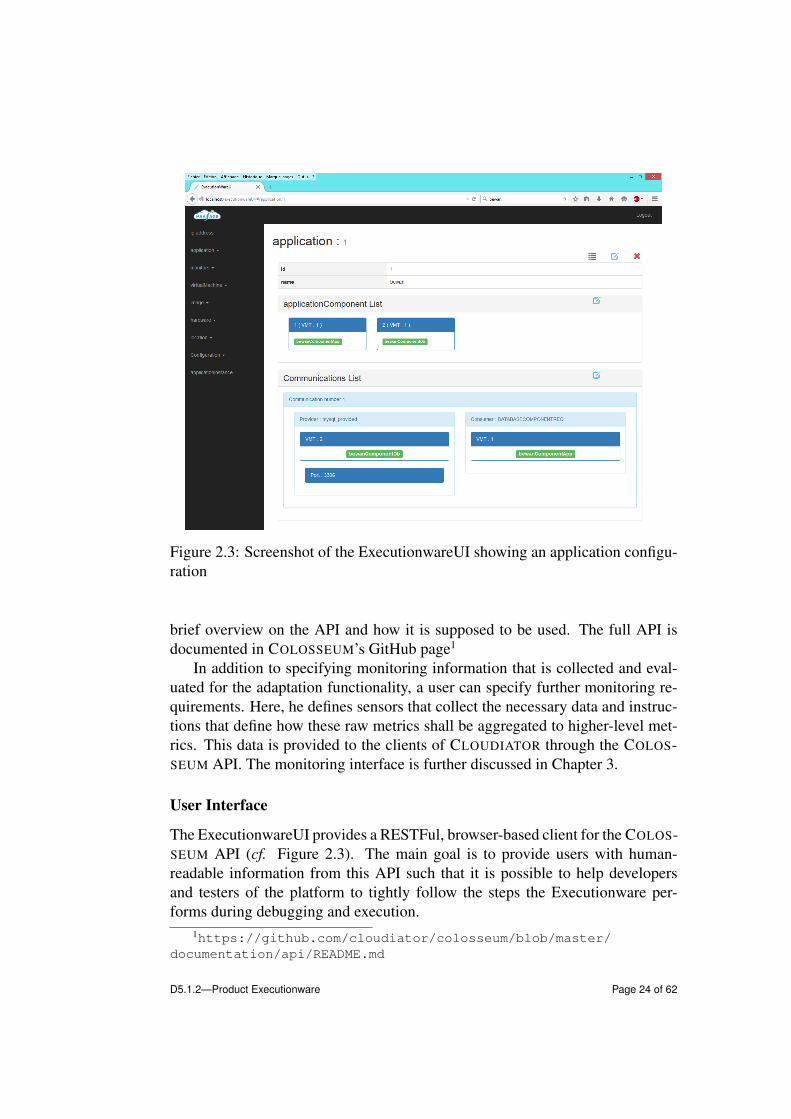
Figure 2.3: Screenshot of the ExecutionwareUI showing an application configu-ration
brief overview on the API and how it is supposed to be used. The full API isdocumented in COLOSSEUM’s GitHub page1
In addition to specifying monitoring information that is collected and eval-uated for the adaptation functionality, a user can specify further monitoring re-quirements. Here, he defines sensors that collect the necessary data and instruc-tions that define how these raw metrics shall be aggregated to higher-level met-rics. This data is provided to the clients of CLOUDIATOR through the COLOS-SEUM API. The monitoring interface is further discussed in Chapter 3.
User Interface
The ExecutionwareUI provides a RESTFul, browser-based client for the COLOS-SEUM API (cf. Figure 2.3). The main goal is to provide users with human-readable information from this API such that it is possible to help developersand testers of the platform to tightly follow the steps the Executionware per-forms during debugging and execution.
1https://github.com/cloudiator/colosseum/blob/master/documentation/api/README.md
D5.1.2—Product Executionware Page 24 of 62

Figure 2.4: Screenshot of the ExecutionwareUI showing monitoring data for adeployed virtual machine
While the ExecutionwareUI is in general capable of modifying the entriesof the system, this use case is currently not exploited within PaaSage, as man-ual intervention could lead to inconsistencies between the Executionware’s andthe Upperware’s state. This functionality is therefore mainly used for testingpurposes.
A particular feature of the ExecutionwareUI is that it provides access to mon-itoring that is shown as a graph (cf. Figure 2.4).
Technical background The ExecutionwareUI runs in a browser and is widelybased on angular.js2. The web site rendered by angular.js displays informationprovided through AJAX request. In order to display graphs, the client imple-mentation uses the Flot library3.
2https://angularjs.org/3http://www.flotcharts.org/
D5.1.2—Product Executionware Page 25 of 62
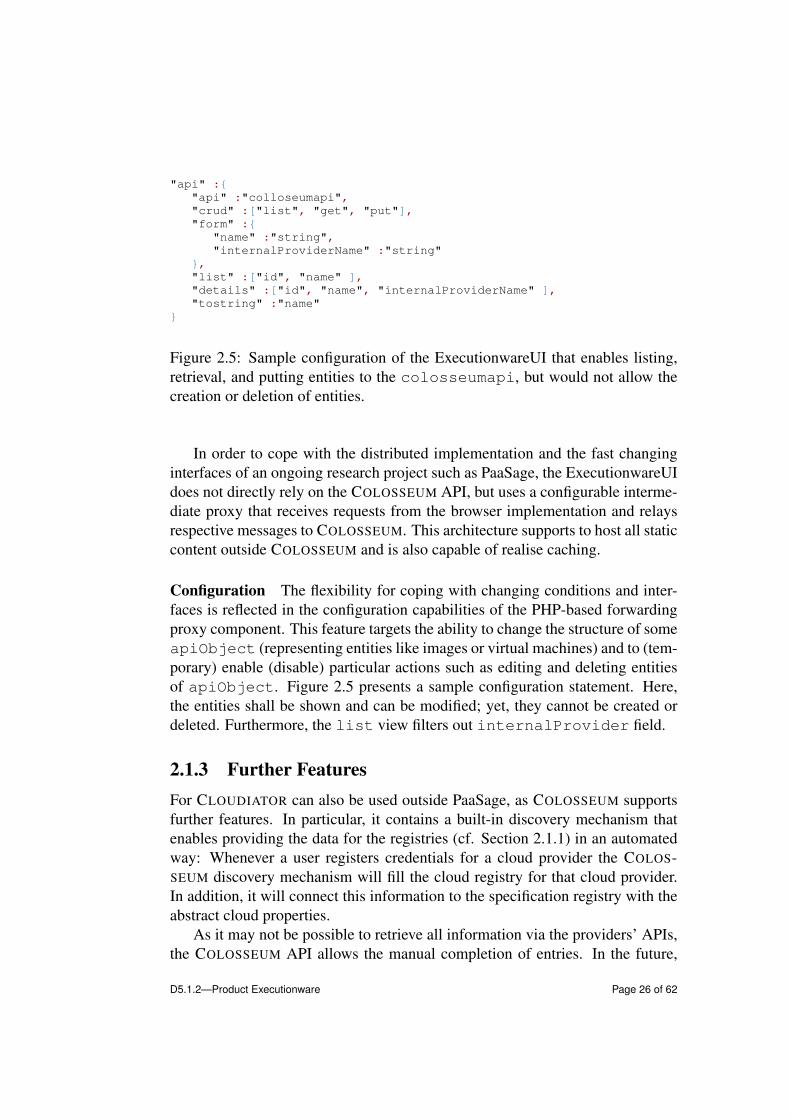
"api" :{"api" :"colloseumapi","crud" :["list", "get", "put"],"form" :{
"name" :"string","internalProviderName" :"string"
},"list" :["id", "name" ],"details" :["id", "name", "internalProviderName" ],"tostring" :"name"
}
Figure 2.5: Sample configuration of the ExecutionwareUI that enables listing,retrieval, and putting entities to the colosseumapi, but would not allow thecreation or deletion of entities.
In order to cope with the distributed implementation and the fast changinginterfaces of an ongoing research project such as PaaSage, the ExecutionwareUIdoes not directly rely on the COLOSSEUM API, but uses a configurable interme-diate proxy that receives requests from the browser implementation and relaysrespective messages to COLOSSEUM. This architecture supports to host all staticcontent outside COLOSSEUM and is also capable of realise caching.
Configuration The flexibility for coping with changing conditions and inter-faces is reflected in the configuration capabilities of the PHP-based forwardingproxy component. This feature targets the ability to change the structure of someapiObject (representing entities like images or virtual machines) and to (tem-porary) enable (disable) particular actions such as editing and deleting entitiesof apiObject. Figure 2.5 presents a sample configuration statement. Here,the entities shall be shown and can be modified; yet, they cannot be created ordeleted. Furthermore, the list view filters out internalProvider field.
2.1.3 Further FeaturesFor CLOUDIATOR can also be used outside PaaSage, as COLOSSEUM supportsfurther features. In particular, it contains a built-in discovery mechanism thatenables providing the data for the registries (cf. Section 2.1.1) in an automatedway: Whenever a user registers credentials for a cloud provider the COLOS-SEUM discovery mechanism will fill the cloud registry for that cloud provider.In addition, it will connect this information to the specification registry with theabstract cloud properties.
As it may not be possible to retrieve all information via the providers’ APIs,the COLOSSEUM API allows the manual completion of entries. In the future,
D5.1.2—Product Executionware Page 26 of 62

we plan to rely on using meta-information providers, such as CloudHarmony4.These provide additional information such as the actual geographical location ofthe cloud provider-specific location (either region or availability zone).
2.2 SWORD
SWORD comprises an abstraction layer over the APIs of the various cloud pro-viders. Its implementation is widely based on the OpenSource Apache jcloudslibrary. Yet, in addition, it comes with a custom implementation for the FlexiantFCO platform including the latest FCO v5 release.
Based on the information received at the virtual machine creation, SWORDselects the right cloud provider and contacts his API through jclouds to issuea start command. The necessary cloud-specific image and hardware flavouridentifiers are retrieved from COLOSSEUM’s registries. After a successful boot,SWORD will assign a public IP address to the virtual machine.
Once this has been done, SWORD logs in to the virtual machine using SSH(for Linux machines) and WinRM (for Windows machines) using the XebiaL-abs Overthere Library5. Afterwards, it starts installing system components. Atthe time being, these comprise VISOR, an instance of the TSDB, and LANCE.Furthermore, an aggregator of AXE or a MetricsCollector are installed onthe virtual machine. The installation of the application itself, and hence the ex-ecution of LANCE actions, is triggered by deployment requests to COLOSSEUMand is not the task of SWORD.
2.3 LANCE
LANCE is CLOUDIATOR’s life-cycle agent who is responsible for executingthe life-cycle actions of all component instances running on that virtual ma-chine. This task comprises the execution of installation and configuration scriptsprovided by the users through CAMEL and hence COLOSSEUM, but also thestart and surveillance of the component instances; again through user-specifiedscripts. When the application set-up changes, e.g., because a new applicationserver had been added to the system, then other components linked to that com-ponent instance (e.g., the load balancer) are notified and user-provided updatescripts will be executed.
It is important to note that LANCE does not execute any magic, but solelyperforms the tasks provided in the application model. Hence, a missing commu-nication link in the application model may lead to failures during deployment
4https://cloudharmony.com/5https://github.com/xebialabs/overthere
D5.1.2—Product Executionware Page 27 of 62
as the necessary network ports are not open. Also, determining the number ofcomponent instances and on which virtual machine to place them is not the re-sponsibility of LANCE or any other CLOUDIATOR component. Instead, thosedecisions have to be taken outside CLOUDIATOR. In PaaSage, this is the task ofthe Upperware.
Hence, LANCE has the primary task to read a component specification, re-serve a separate space for it on the virtual machine, and to start the component byrunning the lifecycle handlers. Currently, two different mechanisms are availablein order to isolate component instances running on the same virtual machine: thefirst approach solely relies on the file system and provides each instance an owndirectory on the file system. This is the approach used for virtual machines run-ning Windows. For Linux-based virtual machines, by default Docker6 containersare used in order to isolate component instances from each other.
6https://www.docker.com/
D5.1.2—Product Executionware Page 28 of 62

3
Monitoring and Auto-scaling
For supporting in-depth analysis of existing deployments, several requirementshave to be considered: (a) The fact that on the one hand, the monitoring oflarge-scale applications does generate huge amounts of data and on the otherhand cloud providers usually charge for network traffic that leaves their datacentre gives motivation that as much of data processing shall happen within thedomain of individual cloud providers. (b) In order to avoid single points of fail-ures, the architecture of a monitoring solution should not rely on a centralisedapproach, but rather favour distributed approaches with no central entity. (c) Forthe amount of monitoring data usually increases with the number of allocatedvirtual machines (VMs), the resources assigned to monitoring shall increase withthe size of the application. (d) The operators of a cloud application may discoverthat they have to monitor further high-level or even low-level metrics or needmonitoring to happen at a higher resolution. Hence, it is necessary that monitor-ing properties can be changed also after an application has been deployed. (e)The same considerations that hold for monitoring, have to hold for scaling rules.In addition, it is necessary that rules can be defined in a generic way withouthaving to know the exact number of instances per component in advance. (f)The monitoring platform has to be able to capture application-specific metrics.
With respect to PaaSage, these considerations hold as well, but in addition tothat, the monitoring data has to be relayed to the Upperware such that it can takedecisions and adapt the deployment as needed. In this chapter, we introduce theentities of the Executionware that are related to monitoring. These include theCLOUDIATOR components VISOR (cf. Section 3.1) and AXE (cf. Section 3.3),but also the MetricsCollector component (cf. Section 3.4). Furthermore,Section 3.2 discusses various TSDBs and presents the discussion we applied forthe Executionware at the time being.
29

3.1 VISOR
In order to be able to gather the raw monitoring data from the VMs and compo-nent instances, we introduce VISOR as a monitoring agent to the remote clouddomain. Just as LANCE, VISOR is deployed on every VM and provides a remoteinterface COLOSSEUM uses in order to configure a particular VISOR instance.This allows VISOR to be adopted to the application and to only collect the met-rics actually required, thus saving space and bandwidth. VISOR supports thecapturing of monitoring data on a per component instance basis as well as ona per-VM basis. The former is done by exploiting the fact that, at least forLinux applications, all component instances are run inside a Docker containerand the resource consumption can be retrieved on a per-container basis. The lat-ter is achieved by sensors monitoring basic system properties on virtual machinelevel, e.g. by accessing system properties such as CPU load.
VISOR produces raw monitoring data through a set of installed sensors. Auser or the Upperware can install sensors by defining monitoring requirements orscalability rules through the COLOSSEUM interface (cf. Section 2.1). COLOS-SEUM will then forward the installation request to the VISOR running on thespecific virtual machine or to all virtual machines in case multiple of them areaffected from a single interface access. VISOR contains a set of well-known sen-sors for measuring system parameters such as CPU and RAM utilisation as wellas I/O rate. The sensors available by default are subject to Section 3.1.1. Eachsensor can be configured to have a dedicated interval for which the data shall becollected as well as a measurement context that defines whether the monitoringshall capture the entire virtual machine or only a particular component instanceon that virtual machine. In order to support custom metrics, VISOR supportsthe implementation of custom sensors, by providing an easy-to-implement Javainterface. It exploits the dynamic class loading properties of Java in order to beable to add those implementations at runtime.
For supporting application-specific metrics that can only be retrieved fromwithin an application such as the length of queues or the degree to which buffershave been filled, VISOR offers a text-based interface over a network socket witha well defined port number. Applications can push their metrics data to an inter-face which is compatible with the carbon daemon of graphite1, thus allowing aneasy migration to VISOR. An example thereof is subject to Section 3.1.2.
Finally, VISOR forwards all measured monitoring data to the aggregation andrule processing sub-system. This version of the Executionware uses a TSDB tostore the data. The core part of VISOR, however, is not dependent on the data
1http://graphite.readthedocs.org/en/latest/carbon-daemons.html
D5.1.2—Product Executionware Page 30 of 62
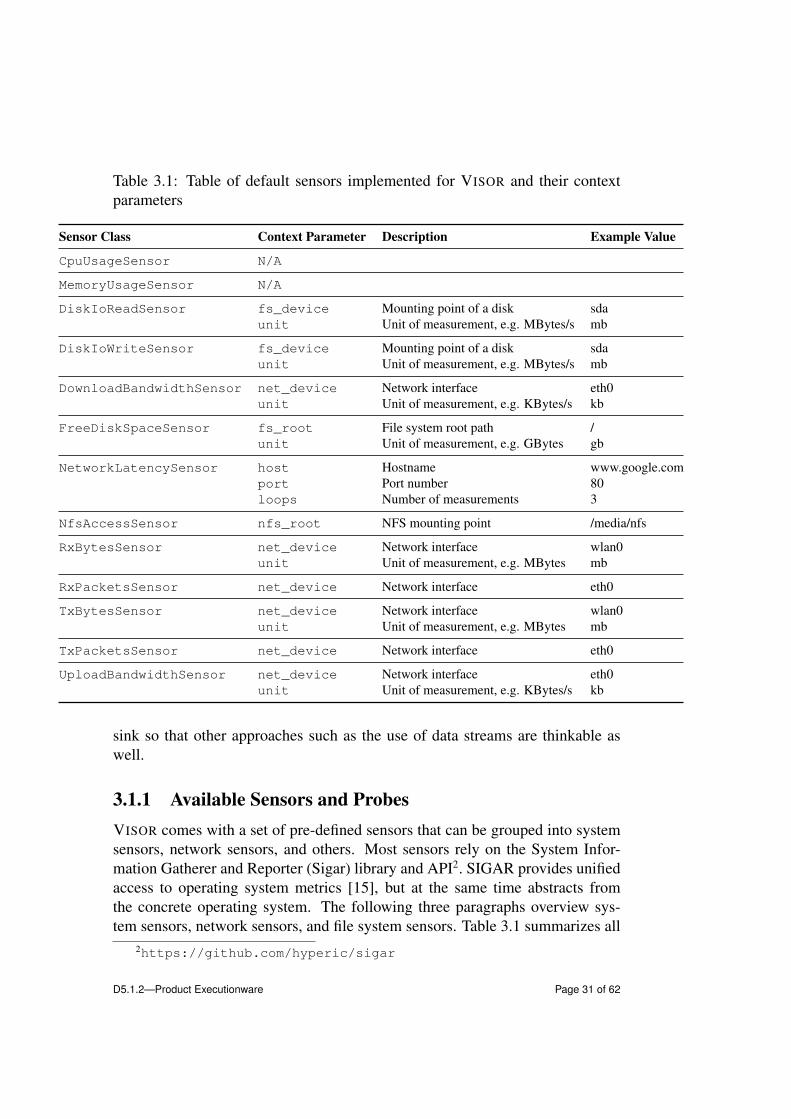
Table 3.1: Table of default sensors implemented for VISOR and their contextparameters
Sensor Class Context Parameter Description Example Value
CpuUsageSensor N/A
MemoryUsageSensor N/A
DiskIoReadSensor fs_device Mounting point of a disk sdaunit Unit of measurement, e.g. MBytes/s mb
DiskIoWriteSensor fs_device Mounting point of a disk sdaunit Unit of measurement, e.g. MBytes/s mb
DownloadBandwidthSensor net_device Network interface eth0unit Unit of measurement, e.g. KBytes/s kb
FreeDiskSpaceSensor fs_root File system root path /unit Unit of measurement, e.g. GBytes gb
NetworkLatencySensor host Hostname www.google.comport Port number 80loops Number of measurements 3
NfsAccessSensor nfs_root NFS mounting point /media/nfs
RxBytesSensor net_device Network interface wlan0unit Unit of measurement, e.g. MBytes mb
RxPacketsSensor net_device Network interface eth0
TxBytesSensor net_device Network interface wlan0unit Unit of measurement, e.g. MBytes mb
TxPacketsSensor net_device Network interface eth0
UploadBandwidthSensor net_device Network interface eth0unit Unit of measurement, e.g. KBytes/s kb
sink so that other approaches such as the use of data streams are thinkable aswell.
3.1.1 Available Sensors and ProbesVISOR comes with a set of pre-defined sensors that can be grouped into systemsensors, network sensors, and others. Most sensors rely on the System Infor-mation Gatherer and Reporter (Sigar) library and API2. SIGAR provides unifiedaccess to operating system metrics [15], but at the same time abstracts fromthe concrete operating system. The following three paragraphs overview sys-tem sensors, network sensors, and file system sensors. Table 3.1 summarizes all
2https://github.com/hyperic/sigar
D5.1.2—Product Executionware Page 31 of 62
implemented sensors and shows their configuration by documenting the contextparameters and depicting example values.
System Sensors
Memory (RAM) Usage The memory usage sensor measures the current mem-ory used by the system in percentage. For this task it uses the Java class Oper-atingSystemMXBean3, allowing the measurement on all operating systems sup-porting Java.
CPU Usage The CPU usage sensor measures the load of the CPU in percent-age, by calculating the average load across all cores installed in the system. Justas the memory usage sensor it therefore relies on the OperatingSystemMXBean,allowing its measurement on various operating systems.
Network Sensors
Average Network Latency Network latency can be measured two-fold: La-tency can be assessed either by the time a data packet requires to reach its des-tination (i.e., one-way), or by additionally taking into account the time it takesback from destination to source (i.e., round-trip). Intuitively, the ping utility isone of the immediate choices to measure a round-trip based latency 4 throughthe Internet Control Message Protocol (ICMP). Yet, the round-trip time mea-sured by ICMP is not representative, as it is barely affected by host load. Assuch, ping-based latency is not representative for real-world application latency.For this reason, the network sensor bases on the common Transport Control Pro-tocol (TCP) and relies on a simple socket connection established via native Javamethods to obtain the latency measurement. Users can set the following pa-rameters in the configuration file: destination address, port number, and numberof measurements (cf. Table 1). The sensor then computes an average over allmeasurements and reports this as a single measurement.
TxBytes and RxBytes This sensor implements logic to report on transmittedand received bytes of a given network interface. A proxy to the class Net-InterfaceStat of the Sigar API was implemented to monitor data. Therespective class provides accumulated data for transmitted (TxBytes) and re-ceived (RxBytes) bytes, respectively. For example, the command-line utilityifconfig is used on Linux platforms to monitor transferred bytes. Separatesensors for transmitted and received data are provided.
3https://docs.oracle.com/javase/8/docs/jre/api/management/extension/com/sun/management/OperatingSystemMXBean.html
4http://manpages.ubuntu.com/manpages/trusty/man8/ping.8.html
D5.1.2—Product Executionware Page 32 of 62
Bandwidth This sensor implements functionality to measure upload and down-load data rates of a given network interface. We reuse the implementations forthe TxBytes and RxBytes sensors to compute the bandwidth. Those values arethen used to compute the bandwidth per second. For each connection type, i.e.upload or download, an individual sensor is implemented.
TxPackets and RxPackets This sensor reports on transmitted and receivednetwork packages of a given network interface. This information is again re-trievable through the NetInterfaceStat class of the Sigar API. The sensorfollows the implementation of the TxBytes and RxBytes sensors, but instead ofmonitoring transferred bytes, it is monitoring transferred packets.
File System Sensors
Free Disk Space This sensor reports on the available disk space for a givenfile system. To achieve a unified monitoring solution, we rely again on the SigarAPI. The API implements the class FileSystemUsage, that offers a proxy tonative utilities such as df on Linux systems. The file system’s root path can beconfigured via the user-defined context at run-time.
Disk I/O This sensor reports on the I/O performance of a given disk. The classDiskUsage of the Sigar API is employed to assess relevant values for diskreads and writes per second. For example, the command-line utility iostatis used on Linux systems to obtain this data. The functionality is split into twoindividual sensors that measure disk reads and writes, respectively. Users areable to select the disk and unit of measurement (e.g., MBytes/s).
NFS Connection Status This sensor checks if a network file system (NFS) ismounted and accessible. A client connection is established to network sharesusing NFS clients provided by the Sigar API. Our implementation handles bothNFSv2 and NFSv3. Users have to set NFS mount point for checking via contextparameters.
3.1.2 Application-specific ProbesIn order to demonstrate the capabilities of the Executionware and VISOR in par-ticular to handle custom metrics, we briefly describe the custom monitoring in-frastructure as shipped together with the LSY application [8]. While this mon-itoring infrastructure duplicates some aspects of the Executionware monitoringsystem, as it contains legacy components, it is also a striking demonstration ofthe flexibility of the PaaSage monitoring infrastructure.
D5.1.2—Product Executionware Page 33 of 62

When implementing the LSY monitoring system, the goal was to implementa configurable and extensible solution, which will run in a java virtual machine(JVM). The requirements for such an approach include (i) an abstraction overmetrics sources—the implementation should allow the user to collect metricsfrom any kind of source with any kind of data format. (ii) an abstraction overmetrics target—the implementation should allow the user to pass the metric toany kind of database or external system. (iii) The implementation should allowthe user to process probes—push them through some logic e.g. filtering, aggre-gating etc. (iv) The implementation should allow the user to apply a differentprocessing algorithm over the same probe. (v) The implementation should allowthe user to mock metrics, i.e., to change probe values at runtime
Concept and Components
The main idea of the LSY monitoring system is to to describe the processingof the metric data flow with streams with a strong focus on the Reactive Mani-festo5. This lead to the selection of Akka Streams6 which provides the end usera solid API to implement the logic and internally relies on the Reactive Streamsinterfaces.
At run-time, data is collected from all instances of all LSY system compo-nents. All of them run with a JVM and metrics can be retrieved using JMX.These data tuples are tagged and then relayed to further downstream processingcomponents where the data is aggregated.
The computations and aggregations on the data flow are realised by splittingthe data flow into sub flow(s) and then applying dedicated business logic for eachof these flows.
All data that is eventually collected and processed is afterwards stored inInfluxDB (cf. Section 3.2). From there it is fetched and then shown using theGrafana Dashboard7.
Integration in Executionware
Obviously, an integration of this monitoring mechanism into the Executionwarecan happen on multiple levels. In an initial approach, we deploy the entire mon-itoring framework as part of the LSY application. Then, instead of writing thedata into InfluxDB it is relayed to the Executionware’s TSDB using VISOR.
5http://www.reactivemanifesto.org6http://doc.akka.io/docs/akka-stream-and-http-experimental/
1.0/scala/stream-introduction.html7http://grafana.org
D5.1.2—Product Executionware Page 34 of 62
3.1.3 Application specific probes for Scalarm andHyperFlow engines
Execution engines for eScience use case applications provide application spe-cific probes and metrics that are used by classes of applications supported bySCALARM and HyperFlow, i.e. data farming applications and large-scale sci-entific workflows.
Scalarm Platform Sensors
System Simulations Throughput This sensor reports on the current through-put - measured in completed simulations per second - of the currently runningdata farming experiment. First, Scalarm calculates the throughput of individualWorkers (worker throughput) by taking into account the number of finished andstill running simulations on the particular worker, this value is divided by thetime of Worker activity. The total System Simulations Throughput is the sum ofall worker throughputs.
Response Time Of Experiment Manager This sensor reports on the averageresponse time - measured in milliseconds - of the Experiment Manager service.The calculation of the average is performed by Scalarm and uses data measuredand stored internally by the Scalarm platform.
Information Service Response Time This sensor reports on the average re-sponse time - measured in milliseconds - of the Information Service service. Thecalculation of the average is performed by Scalarm and uses data measured andstored internally by the Scalarm platform.
HyperFlow sensors
stage Workflow stage, as reported by the workflow engine. This metric in-forms about the stage of the workflow that is currently processed. It can beused to trigger autoscaling actions when a certain stage of workflow is reachedand a required number of VMs is known from the scheduling plan provided byHyperFlow.
tasks, tasksProcessed and tasksLeft The number of tasks in the workflow:total, processed and left, respectively. These metrics can be used together tocompute the composite metrics related to the progress of workflow execution.
outputsLeft The number of remaining outputs (results) in the workflow. Onceall outputs are completed, the workflow is considered as finished.
D5.1.2—Product Executionware Page 35 of 62

nConsumers Number of active workers that are connected to the AMQP (Ad-vanced Message Queuing Protocol) queue. This allows to measure the actualworkers (executors) that have started and stressfully registered with the Rab-bitMQ8 queue. This number may be different from the number of worker VMs,since for some reasons not all worker processes on VMs may have started, orthere could be a failure during execution.
3.1.4 Client libraries for VisorTo facilitate development of application specific probes, we have developedgeneric clients for Visor in .NET, Java and JavaScript. These small librariescan be used to report metrics to Visor at configurable intervals.
All these libraries are available on GitHub repository9 and have been usedby the use cases of LSY and AGH.
3.2 TSDB SelectionA key element when computing higher-level metrics especially over larger time-windows is the need to buffer raw monitoring data. TSDBs have been designedto store timestamped data in an efficient way and also to provide quick accessto the stored data. Many TSDB implementations support applying functions onstored data right out of the box, making them a perfect match not only for buffer-ing, but also for aggregation (cf. Section 3.3). The following subsections firstintroduce the requirements towards a TSDB in Section 3.2.1. The requirementsare based on the outlined monitoring and buffering strategy in COLOSSEUM.Afterwards an overview on three popular TSDBs, KairosDB, OpenTSDB andInfluxDB is presented. In Section 3.2.5 we argue why the current version ofCLOUDIATOR makes use of KairosDB, whereas Section 3.2.6 presents the in-stallation process.
3.2.1 RequirementsWith respect to our requirements the buffering and therefore the TSDB approachneeds to be able to work with limited resources, have no single point of failureand increase available resources when more VMs are being used. In order tocope with these requirements, we use the following approach: from each VMacquired for an application, we reserve a configurable amount of memory and
8https://www.rabbitmq.com/9 https://github.com/dbaur/monitoring-agent-telnet-client-java,
https://github.com/dice-cyfronet/monitoring-agent-telnet-client-js
D5.1.2—Product Executionware Page 36 of 62

storage (e.g. 10%) that we further split between a local storage area and a sharedstorage area. Both storage areas are managed by a TSDB instance running onthe VM. The VISOR instance running on this VM will then feed all monitoringdata to the TSDB. The TSDB will store data from its local VISOR instance inthe local storage area and further relay the data to other TSDBs shared storagearea. This feature avoids that a TSDB becomes a single point of failure, butstill enables quick access to local data. In order to keep network traffic betweencloud providers low, any TSDB will only select other TSDBs running in thesame cloud to replicate its data. If not enough instances are available to reachthe desired replication degree, the maximum possible degree is used. Hence,this concludes to a ring-like topology that has been introduced in peer-to-peersystems [1] and is also used by distributed databases [14].
3.2.2 KairosDBKairosDB10 is a widely used TSDB that has continuous development. It is ef-ficient in the storage of huge amounts of timeseries (TS) data as well as theirrespective querying via aggregation functions. It currently supports the follow-ing aggregation functions: average, standard deviation, divisor (divides each TSvalue with a specific constant), histogram (actually calculates a percentile for aparticular set of TS data), least_squares (returns two TS data/points which bestfit the line that characterizes a set of TS points), max and min, rate (calculatesthe rate of change between two TS points), sum (calculates the sum of values fora TS set).
While histogram is stated to be supported, it was impossible to actually useit due to bugs in the client software.
The user needs to indicate the time interval in order to enable KairosDB togenerate the set of TS points that should be used for the aggregation. KairosDBfurther supports grouping based on tags, time ranges or values as well as thefiltering based on tags. Other advantages of KairosDB are: (a) it provides aREST interface for the publishing and querying of TS data; (b) it supports dis-tributed configurations with configurable replication factors through the use ofthe Cassandra store.
A basic graphical UI is also offered which enables the posing of queries andthe presentation of the results in a graph, while the query performed in a form-based manner is transformed and represented in a JSON format which can thenbe exploited for calling the respective method of the REST API offered. It is alsopossible to replace the default dashboard by external dashboards like Grafana.
10https://github.com/kairosdb/kairosdb
D5.1.2—Product Executionware Page 37 of 62

KairosDB architecture offers the possibility to use different datastores. Inparticular KairosDB supports three underlying stores: Cassandra, HBase andH2, where the latter is the default.
The main disadvantage of KairosDB is that it does not support the automatedbackground generation of aggregations. This means that it is up to the user toeither create the code which will calculate the aggregated value for the particularcomposite metric at hand and store it inside the KairosDB or that the user canexploit an aggregated query to just calculate this aggregated value and reportit. The second way is of course only convenient when there is one aggregationlevel. However, when more aggregation levels are involved, then only the firstway (or a mixture of first way for all aggregation levels apart from the top one tobe handled by the second way) is suitable as there is a need to at least store themeasurements produced for the intermediate aggregation levels.
3.2.3 OpenTSDBThe TSDB OpenTSDB11 was one of the first exponents of TSDBs. It still hasan ongoing development with the current version 2.1.0. The aforementionedTSDB KairosDB is a fork of OpenTSDB version 1.0.0; yet both TSDBs focuson different goals.
OpenTSDB provides a basic set of querying and aggregation features how-ever in a less sophisticated way as KairosDB does. OpenTSDB TS data can beaccessed via telnet, REST API or a command-line client.
According to the presentation of TS data OpenTSDB differs considerably toKairosDB. KairosDB aims to separate data and presentation while OpenTSDBfocuses on the presentation of server-side generated graphs. This approach im-proves the representation of graphs by using, e.g. interpolation but it limits theflexibility for processing the TS data. To display the TS data a built-in dashboardis provided which can also be replaced by various third party dashboards.
OpenTSDB uses the distributed filesystem Hadoop with the Hbase databaseon top as storage backend. This allows OpenTSDB to provide high performancein writing and reading the TS data. Moreover by using Hadoop with Hbase asstorage backend OpenTSDB can provide replication and is able to scale the stor-age backend. However it is not possible to change the storage backend becauseOpenTSDB’s architecture is tightly coupled with Hadoop and Hbase. There-fore the setup of an OpenTSDB instance is not a trivial task regarding the owncomplexity of the heavyweight Hadoop and Hbase components.
Like KairosDB OpenTSDB does not offer the possibility to create aggre-gations in an automated way. Moreover it is not possible to combine multipleaggregators.
11https://github.com/OpenTSDB/opentsdb
D5.1.2—Product Executionware Page 38 of 62

3.2.4 InfluxDBInfluxDB is an emerging TSDB which actually constitutes a TS, metrics andanalytics DB. It has been developed in Go with no other external dependencies.It exhibits some interesting features which also overlap with respect to the onesoffered by KairosDB.
Similarly to KairosDB, InfluxDB offers a SQL like query language whichis however more powerful. This query language enables the filtering via timeand any other columns which have been associated to a TS, the selection ofmultiple series either in a direct comma-based way or via a regular expression,the grouping via time buckets, the filling of missing values for specific timeintervals, and the merging as well as the joining of TS. Apart from basic SQL-like querying functionality, the offered language enables the listing of TS as wellas the deletion of some TS rows or whole TS. InfluxDB also offers an HTTP(s)API, and offers retention policies for TS data.
Moreover, InfluxDB supports pre-aggregation of data in the form of continu-ous queries. This is actually one of the most important features of InfluxDB as itallows the aggregation of information in the background in an automated man-ner without serious implications in the user code as in the case of KairosDB.Through this feature, all required aggregation levels can be supported as eachcomposite metric instance can be considered to be mapped in one continuousquery. In this sense, the values of this metric instance are computed automat-ically and the users just have to write queries based on the name of the metricinstance in order to retrieve the respective computations. The sole limitationhere is that aggregation is limited to two metrics (instances). This means thatif the aggregation over a greater number of metrics needs to be supported, thendepending on the aggregation formula, not only one but a set of intermediatecontinuous queries needs to be generated based on which the final continuousquery can be generated and exploited.
Furthermore, InfluxDB supports the merging of time series which are identi-fied via a pattern-based/regular expression, and can deal with distributed settingsthrough shard spaces. This enables the replication of TS data through the speci-fication of a particular replication factor.
A web-based UI is offered by InfluxDB for exploration of the TS data andthe production of respective graphs. However, the main difference here is thatthe InfluxDB UI offers in addition the execution of administration tasks. Also,two dashboards can be integrated with InfluxDB, namely Grafana and Influga.
Older versions of InfluxDB did support multiple underlying storage engineswhile the recently released, first production-ready version 0.9.0 only supportsthe key-value store BoltDB.
Concerning the aggregation functions supported, a significantly greater va-riety compared to OpenTSDB and even KairosDB is offered including: count
D5.1.2—Product Executionware Page 39 of 62
(counts the number of TS data indicated by the query), min and max, mean,mode (it calculates the most frequent value in a specific subset of TS identifiedby the query), median (it identifies the median value in a specific subset of TSidentified by the query), distinct (returns only the distinct value for a specificsubset of TS identified percentile), histogram (returns the histogram for a spe-cific subset of TS identified which is output in the form of two columns: (a)bucket start indicating the starting value in the bucket and (b) count indicatingthe number of values in the bucket), derivative ( calculates the derivative of a spe-cific subset of TS), sum, standard deviation, first/last (outputs the first/last pointfor a specific TS by interval), difference (outputs the difference between the lastand first value for a specific TS by interval) and top/bottom (the top/bottom Nresults by interval for a specific TS).
3.2.5 Selection of TSDB
Table 3.2: Details of considered times series databases
Name KairosDB OpenTSDB InfluxDB
Version 1.0.0 2.1.0 0.9.0Datastore H2/Cassandra HBase BoltDBDistributed no/yes yes yesInMemory yes/no no yes
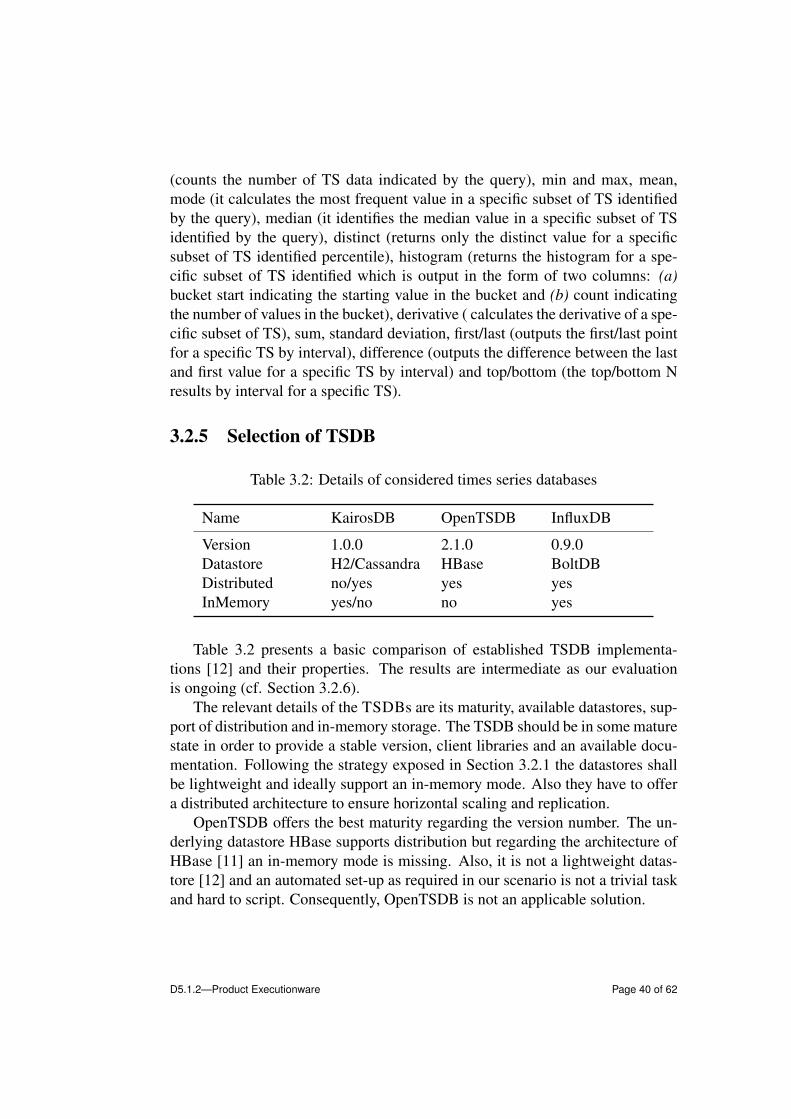
Table 3.2 presents a basic comparison of established TSDB implementa-tions [12] and their properties. The results are intermediate as our evaluationis ongoing (cf. Section 3.2.6).
The relevant details of the TSDBs are its maturity, available datastores, sup-port of distribution and in-memory storage. The TSDB should be in some maturestate in order to provide a stable version, client libraries and an available docu-mentation. Following the strategy exposed in Section 3.2.1 the datastores shallbe lightweight and ideally support an in-memory mode. Also they have to offera distributed architecture to ensure horizontal scaling and replication.
OpenTSDB offers the best maturity regarding the version number. The un-derlying datastore HBase supports distribution but regarding the architecture ofHBase [11] an in-memory mode is missing. Also, it is not a lightweight datas-tore [12] and an automated set-up as required in our scenario is not a trivial taskand hard to script. Consequently, OpenTSDB is not an applicable solution.
D5.1.2—Product Executionware Page 40 of 62

From its capabilities InfluxDB seems suited for the outlined approach. Yet,the recently released version 0.9.0 comes with extensive changes in the storagearchitecture and API design compared to 0.8.012.
KairosDB also provides a mature version 1.0.0. It supports the single-site,in-memory datastore H2 and the distributed Cassandra datastore supporting scal-ability to a hundreds of instances [14]. While Cassandra’s resource usage can belimited, in-memory storage is only supported in the commercial version13.
Following this comparison KairosDB is currently the most appropriate TSDBto use in CLOUDIATOR and hence, the Executionware. The decision has beenbased on maturity, distribution and the possibility to limit the resource consump-tion of Cassandra. Nevertheless, the architecture has been designed such that thedecision for a TSDB is not tightly coupled to the rest of the system so that theTSDB can be replaced without causing any further issues.
In overall, we state that InfluxDB seems more powerful than KairosDB withadditional functionality offered, a more expressive query languages and moreconfigurable ways to distribute and replicate the underlying stores. However,the young age of InfluxDB with frequently changing APIs and feature sets con-stitutes a too high risk for the success of the project.
3.2.6 Time-series Database InstallationThe current version of CLOUDIATOR installs an instance of KairosDB with aCassandra datastore on each started virtual machine. Cassandra is configured touse only a low portion of a VM’s resources to keep the impact on the componentsrunning on that VM small.
Whenever possible, we reserve a small fraction of each virtual machine (e.g.10%) for buffering monitoring data. This strategy assumes that the amount ofmonitoring data increases linearly with the number of virtual machines. At thesame time using a cluster avoids that the TSDB becomes a bottleneck whenscaling the application. The reserved area is split into a local storage area anda shared area for replicas of data items created on other virtual machines on thesame cloud.
In the long run, we envision that each data element added to KairosDB isstored in a local Couchbase14 instance using the in-memory memcached optionrepresenting the local area and in a distributed Cassandra datastore [14] repre-senting the shared area. Figure 3.1 shows the set-up of the underlying storagesystems. It is noteworthy that each cloud uses its own distributed storage. This
12https://influxdb.com/docs/v0.9/introduction/overview.html13http://www.datastax.com/14http://www.couchbase.com/
D5.1.2—Product Executionware Page 41 of 62

TSDBTSDB
TSDB
VM AWS_3
TSDB
VM AWS_2
TSDB
VM AWS_1
home domain
TSDBclustering
calls
OpenStack cloud Amazon Web Services
TSDB
VM OS_3
VM OS_1 VM OS_2
calls
Figure 3.1: TSDB-based architecture of CLOUDIATOR with the local areasmarked orange
set-up avoids that the storage suffers from large latencies and that additionalcosts incur for inter-cloud traffic.
3.3 AXE
From a CLOUDIATOR point of view, there are two scenarios where aggrega-tion on monitoring data is needed: (i) A user has requested that monitoring databe collected and aggregated such that it is available outside CLOUDIATOR. (ii)Scalability rules require that data to be aggregated to build higher level metricson which rule conditions can be checked against. In both cases, the AXE compo-nent uses the same chain of mechanisms to provision the requested information.The expressiveness of the Scalability Rules Language provides an upper boundon the complexity of queries, aggregation rules, and scaling actions that have tobe supported by AXE.
3.3.1 AggregationSection 3.1 clarified when and how monitoring data is collected by VISOR: (i)ensure that all data needed for aggregation is available, (ii) define where theaggregation is performed, and (iii) specify where to put the results. The basicconcept we use is that the monitor agent forwards the data to a TSDB instancerunning on the same virtual machine. The latter is responsible for making themonitoring data available to the aggregation functionality including relaying thedata to multiple locations if necessary. The aggregation functionality is imple-mented by aggregation processors.
We distinguish between three scopes that define where the aggregator shallbe run: The host scope considers aggregation tasks that take into account only
D5.1.2—Product Executionware Page 42 of 62

measurements from a single virtual machine. In that case, the collector willforward the data to a virtual machine-local aggregator to do the aggregation. Af-terwards, the aggregator will relay the resulting data to the collector again. Thecloud scope deals with data from multiple component instances or virtual ma-chines from within one cloud. Finally, the cross-cloud scope defines aggregationon data from different clouds. For that scope, aggregation happens in the homedomain. We use a dedicated collector for each of the scopes.
Aggregations with a cloud scope are triggered from the home domain (i.e.,they run within COLOSSEUM). Yet, as the aggregation takes place using the Cas-sandra store, only the results are sent to the home domain. The results of such aprocess are stored back to the cloud using any KairosDB instance and the sharedarea. In case this data has to be made available to the user, a further aggregatoris running that pulls this data from any of the cloud’s KairosDB instances andstores it in the KairosDB instance running in the home domain. Finally, aggre-gations in the cross-cloud scope are also run through an aggregator in the homedomain, but then stored in the KairosDB of the home domain. Higher-level met-rics working on this data will read from the home domains KairosDB and storeresults back there.
(Aggregated) monitoring data whose collection was requested by the user isalways stored in a TSDB in the home domain. It is accessible via the COLOS-SEUM API. Improvements on aggregator locations are subject to ongoing work.
3.3.2 Scalability Rules LanguageAdaptation describes the capability of the application to autonomously evolveunder changing conditions such as varying system load. This may be neededwhen more users access the application instance than anticipated by the appli-cation owner. In a cloud environment, the most frequent reaction to such eventswill be a scale out/in of individual components or groups of components or thescale up/down of individual virtual machines or groups of virtual machines. Forthat reason, AXE supports an auto-scaling functionality based on the ScalabilityRules Language (SRL) [10, 13]. In order to realise this functionality, AXE en-ables the specification of (hierarchical) metrics, conditions on these metrics, andactions to be executed when the metric conditions are fulfilled. It is important tonote that these rules do not have to be provided with the deployment description,but can be added and changed while an application instance is running.
The SRL [10] is a provider-agnostic description language. It provides ex-pressions to define the monitoring of raw metric values from VMs and compo-nent instances and also mechanisms to compose higher-level metrics from rawmetrics. Moreover, it comprises mechanisms to express events and event patternson metrics and metric values. Finally, SRL captures thresholds on the events and
D5.1.2—Product Executionware Page 43 of 62
actions to be executed when thresholds are violated. A simple SRL rule in prosemay be: add a new instance (scale-out) of this distributed database if (i) all in-stances have a 5 minute average CPU load > 60%, (ii) at least one instance hasa 1 minute average CPU load > 85%, and (iii) the total number of instances is< 6.
3.3.3 Auto-ScalingAXE’s auto-scaling capabilities for individual components of an application in-stance require the aggregation of metrics and the evaluation of conditions onthese metrics. The generation of monitoring data and their aggregation has beendiscussed earlier in this section.
In order to evaluate the conditions on the metrics, we apply the strategy toconsider conditions on metrics as binary metrics by themselves. These metricstake values in {0, 1} and their value is computed as a function that compares thevalues of the source metric against the threshold of the condition. Compositeconditions are computed from their source conditions.
The SRL-engine is an aggregator-like sub-component of AXE that runs inthe home domain. Its sole task is to check for all conditions that cause a SRL-related action whether the conditions are satisfied. In case it is, the SRL-enginetriggers the actual actions at the Deployment Engine. In addition, it stores thefact that this action has taken place as a separate metric value in the KairosDB in-stance in the home domain so that it can be queried by higher-level components.Whenever the application instance has changed either by manual intervention orby running a scaling action, the SRL-engine adapts the scalability-related con-figuration if necessary. This is for instance the case whenever the abstract ruledescription requires conditions to take into account all instances of a particularcomponent.
3.4 MetricsCollector
This section clarifies the functionality provided by the MetricsCollectorcomponent and how it can be exploited in order to realise a monitoring systemwithin PaaSage. It is organized into four main sub-sections which attempt tohighlight: (a) the two main modes of operation of the MetricsCollector;(b) the main assumptions imposed by MetricsCollector on the environ-ment in order to properly function as expected; (c) the main MetricsCol-lector architecture along with the most important components; (d) the mainmodes of interaction with the MetricsCollector.
D5.1.2—Product Executionware Page 44 of 62
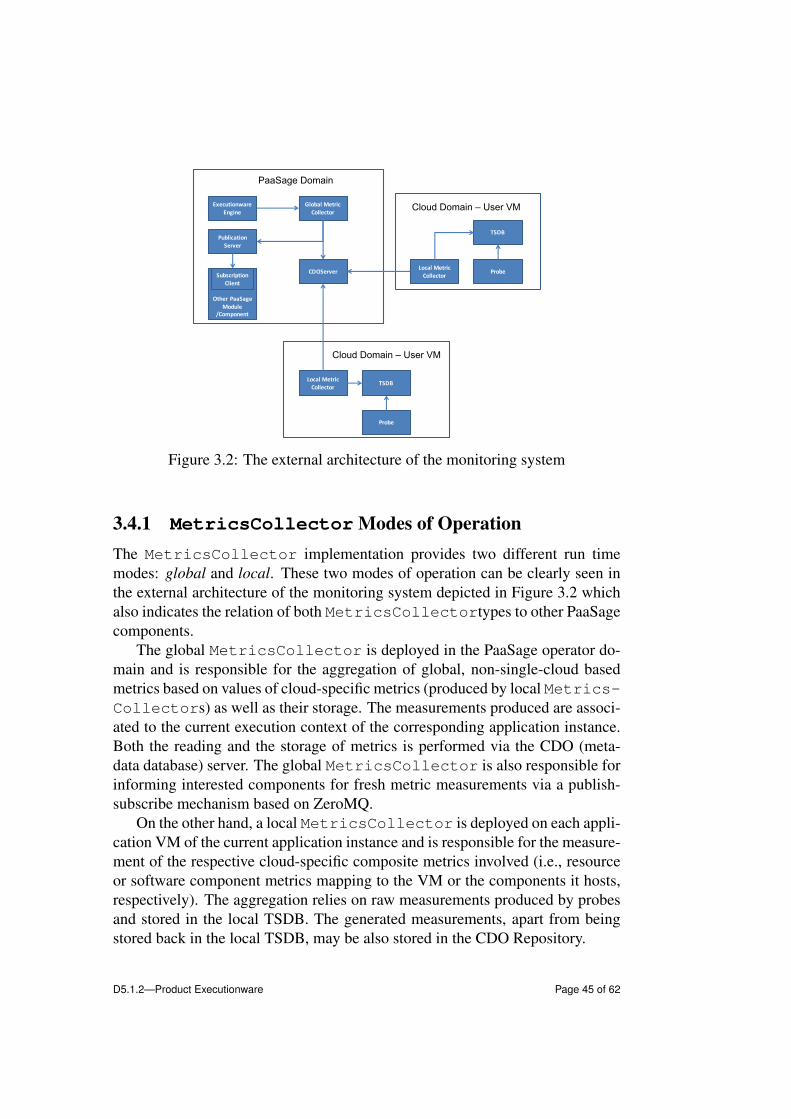
ExecutionwareEngine
Global1Metric1Collector
CDOServer
Publication1Server
Other1PaaSageModule1
/Component
Local1Metric1Collector TSDB
Probe
PaaSage Domain
Cloud/Domain/– User/VM
Local1Metric1Collector
TSDB
Probe
Cloud/Domain/– User/VM
Subscription1Client
Figure 3.2: The external architecture of the monitoring system
3.4.1 MetricsCollector Modes of OperationThe MetricsCollector implementation provides two different run timemodes: global and local. These two modes of operation can be clearly seen inthe external architecture of the monitoring system depicted in Figure 3.2 whichalso indicates the relation of both MetricsCollectortypes to other PaaSagecomponents.
The global MetricsCollector is deployed in the PaaSage operator do-main and is responsible for the aggregation of global, non-single-cloud basedmetrics based on values of cloud-specific metrics (produced by local Metrics-Collectors) as well as their storage. The measurements produced are associ-ated to the current execution context of the corresponding application instance.Both the reading and the storage of metrics is performed via the CDO (meta-data database) server. The global MetricsCollector is also responsible forinforming interested components for fresh metric measurements via a publish-subscribe mechanism based on ZeroMQ.
On the other hand, a local MetricsCollector is deployed on each appli-cation VM of the current application instance and is responsible for the measure-ment of the respective cloud-specific composite metrics involved (i.e., resourceor software component metrics mapping to the VM or the components it hosts,respectively). The aggregation relies on raw measurements produced by probesand stored in the local TSDB. The generated measurements, apart from beingstored back in the local TSDB, may be also stored in the CDO Repository.
D5.1.2—Product Executionware Page 45 of 62

The decision on the latter depends on the following two cases: (a) we have atop-level metric for which subscribers exist (including the Executionware whichhas to detect violations of SLOs as well as generate events which might triggerscalability rules) and (b) we have metrics which are children of a global metric,i.e., these metrics are used to compute the global metric—in this latter case weneed to store their measurements in CDO such that the global MetricsCol-lector can read them and perform the respective global metric aggregations.
3.4.2 Main AssumptionsThe main assumptions of this software component is that Upperware compo-nents have left a correct CAMEL (deployment, execution and metric) model inthe CDO server of the PaaSage platform. In particular, it assumes the existenceof an execution context, the specification of necessary metric instances to bemonitored, and the component instances to be measured. Furthermore, a Met-ricsCollector instance operated in local mode assumes that a KairosDB isrunning and that necessary location and log-in credentials have been providedto it. The global MetricsCollector instance provides a publish-subscribeinterface through which aggregated measurements are propagated to interestedcomponents (e.g., the Reasoner). Both types/modes of MetricsCollectoroperation require an appropriate connection to a CDO server (which should con-tain the CAMEL model of the application to be monitored) such that the nec-essary information concerning the metric computations are fetched and that theaggregated measurements produced are stored in this server.
3.4.3 ArchitectureBoth a local and a global MetricsCollector are instances of the same class,named MetricCollector. This means that both the local and global mea-surement functionality has been encapsulated in the same code in terms of thesame Java class. Figure 3.3 depicts the internal architectural of the Metrics-Collector.
The core functionality of any MetricsCollector comprises an interfacewith three main methods: (a) readMetrics – used for reading the specification ofthe metric instances that the MetricsCollector is in charge of handing andsetting up the aggregation code, (b) updateMetrics – used for reading the spec-ification of those metric instances that have been updated and then updating therespective aggregation code and (c) deleteMetrics – used to delete all aggrega-tion code for all metric instances pertaining to a specific execution context givenas input.
D5.1.2—Product Executionware Page 46 of 62

Metric'Collector
MetricStorage StatisticsUtils
FileWatcher
ExecutionContextHandler
MetricHandler
PublicationServer
CDOClient
TSDBClient
MetricHandler
CDOClient
TSDBClient
MetricHandler
CDOClient
TSDBClient
MetricHandler
CDOClient
TSDBClient
CDOListener
ExecutionContextHandler
CDOListener
MetricCollector Sub-System
Figure 3.3: The internal architecture of the monitoring system
A global MetricsCollector comprises two optional components: theCDOListener and the PublicationServer (currently realized based on the Ze-roMQ framework). Through these two components and the respective Met-ricsCollector aggregation code, the publication of top-level metric mea-surements is supported to interested subscribers (e.g., PaaSage components).The actual publication of a measurement is supported via calling the respec-tive submitValue method of the PublicationServer. The CDOListener is respon-sible for detecting measurements produced for particular (local/cloud-specific)top-level metric instances and publishing them via the PublicationServer. Thepublication responsibilities are completed through the MetricsCollectoraggregation code which generates measurements for global top-level metrics andpublishes them again via the PublicationServer. To receive values, an interestedcomponent has to just customize the run method of the SubscriptionClient classin order to be able to exploit the measurement retrieved for its own purposes.
Execution Context Handling
It must be highlighted here that metric instances to be handled are always asso-ciated to a specific execution context. This not only makes their handling easier(as they are grouped in a specific container) but also enables to create a separatefunctionality in terms of a thread which will be responsible for the setting upand management of the aggregation functionality for each metric in the group.This thread is actually an instance of the class ExecutionContextHandler and hassimilar functionality with respect to MetricsCollector but it is restrainedin the form of only a metric group. Apart from the metric group handed-over byMetricsCollector to the ExecutionContextHandler, the latter component
D5.1.2—Product Executionware Page 47 of 62
enhances this group by retrieving the specification of other composite metrics atlower levels which are needed for the computation of the metrics in the initialinput group. This is performed carefully such that when a component metric isused for the computation of two original metrics, then this component metricis included just once in the group. This enables to avoid having duplication ofmeasurement effort. In the end, after the final metric group is constructed, oneMetricHandler thread is created for each metric in the group.
Obviously, the careful updating of the initial group is addressed not onlyin the initial case but also in the case where metric instances in the group areupdated as this can raise the need of removing or adding metric instances in theExecutionContextHandler’s metric group.
Metric Handling
A MetricHandler constitutes the basic, elementary piece of functionality in termsof a thread devoted to the computation of measurements for a metric instance.The frequency and window of computation is calculated based on the informa-tion stored in the CDORepository for the metric instance handled. The Met-ricHandler thread interfaces with a TSDB client or a CDOClient, depending onwhether it is launched in the context of a local or a global MetricsCollec-tor, in order to perform the aggregations. In the former case, the TSDB client isused in order to perform aggregated queries to produce the respective measure-ments of the metric instance handled. In the latter case, the CDOClient is used toeither perform aggregated queries over measurements in the CDO Repository orto collect the appropriate measurements and then perform the aggregation overthem (in case a particular aggregation function is missing from those supportedby CDO/Hibernate Query Language). In both cases, the same client is used tostore back the respective measurements with the sole exception that a local Met-ricHandler might need to also store a measurement value in the CDO Reposi-tory (for a local metric instance required for computing a global one). In caseof top-level global metrics, a global MetricHandler will also exploit the Publi-cationServer in order to publish the respective measurements to the interestedsubscribers.
Aggregation and Database Access
Database Access When measurements or respective generated (scalability rule-based) single event instances need to be stored in the CDO Repository, thenthe MetricStorage class can be utilized which provides an interface withtwo respective methods: (a) storeMeasurement and (b) storeEvent. In the firstmethod, you need to provide the measurement value produced, the CDOIDs of
D5.1.2—Product Executionware Page 48 of 62

the corresponding metric instance, of the current execution context and of theobject measured (e.g., InternalComponentInstance or VMInstance) as well asthe MeasurementType mapping to the respective types of measurements that aresupported by PaaSage (application, component, resource and resource couplingmeasurement types). Once this input is provided, the respective code stores themeasurement in the appropriate execution model as well as associates it to theappropriate objects (also given as input – e.g., execution context).
For the second method, it is necessary to specify the event status, the CDOIDsof the measurement and of the single event to be instantiated as well as option-ally the layer on which the event/measurement applies. The respective code,once the input is provided, takes care of generating the event instance, associ-ating it to the respective objects as well as storing it in the appropriate model.Additionally, it checks whether SLOs have been defined for the respective met-ric condition. If this is the case, then it creates an SLOAssessment instance withthe appropriate assessment result which is stored in the current execution modelas well as associated to the current execution context.
Aggregation Concerning the aggregated measurement production, the Statis-ticsUtils class encompasses methods which cover the missing aggregation func-tionality of the selected TSDB or the CDO Repository. The aggregation methodsadditionally supported are: (a) mode calculating the most frequent value of a setof measurements, (b) median calculating the median value of a set of measure-ments and (c) percentile which calculates the value for which a specific percent-age of measurements from the given set is equal or less than it. Each method hasbeen realized to work for measurements produced both from TSDB queries orCDO queries.
There are also two specialized classes which can be regarded as those whichdrive the aggregation for a particular metric. The AggregationInfo class storesimportant information which is needed for the aggregation of measurements ofa specific metric instance, including the metric function involved, its arity andarguments as well as the main aggregation period to be considered. Such in-formation is then exploited by extensions of the AggregationNode class whichserve as drivers to specific types of TSDBs. Currently, both the KairosDB andthe InfluxDB TSDBs are supported and the respective implementations of theKairosAggregationNode and InfluxAggregationNode have been generated.
An AggregationNode comprises the aggregation info, the mode of aggre-gation, a CDOClient and a specific value. The latter value is actually used torepresent constant values and not actual metrics, so in this case the aggregationinfo is not given. Depending on the type of TSDB supported, the respective ex-tension of AggregationNode comprises also the reference to a client which canbe used to store measurements as well as perform aggregated or normal queries
D5.1.2—Product Executionware Page 49 of 62
over the respective TSDB. Through all this information and internal componentreferences, the aggregation can then proceed based on the TSDB-type-specific-logic encapsulated in the calculate method. This method, when called, returnsthe aggregated measurement value to be stored in the respective places (TSDB,CDO Repository) by the corresponding MetricHandler method.
Both an aggregation node as well as its encompassed aggregation informa-tion is produced for a particular metric instance through calling the setupAggre-gation method which again contains some TSDB-type-specific logic needed inorder to create specific parts of the required aggregated information. In the caseof KairosDB, this method creates the respective aggregator (instance of Aggre-gator class) which has to be employed in order to execute an aggregated queryon KairosDB. In the case of InfluxDB, this method creates continuous querieswhich map metric instance names to particular tables. In this way, the retrievalof aggregation information in this latter case is based on simple queries whichretrieve the latest value of the respective table. Thus, there is no need to performan aggregated query as the results are produced in the background based on thedefinition of the respective continuous query for the particular metric instance athand.
Other Utilities and Integration
The CDOUtils component provides assisting methods which can be exploitedto fulfill different types of functionality. In particular, the following methodshave been realized: (i) canPush: examines whether a particular metric in-stance is a top-level one such that it has to be published to subscribers via thePublicationServer; (ii) getTopMetrics: it is used to obtain all instances oftop-metric levels that have to be measured; (iii) getGlobalMetrics: froma list of top-level metric instances, get those which are global and have to bemeasured by a global MetricsCollector.
The last two methods could be used, for example, by AXE in order to del-egate the measurement of metric instances to local and global MetricsCol-lector. The global top-level metrics will be delegated to the global Met-ricsCollector while the local top-level metrics will be delegated to the lo-cal MetricsCollector on which they apply (e.g., based on the componentor VM instances for which they measure the respective particular property). Ob-viously, some additional logic is included in the latter case but it is quite easyto implement as each metric instance is associated to a specific object bindingwhich can be followed in order to discover the particular user VM for which themetric instance must be delegated to the corresponding local MetricsCol-lector.
D5.1.2—Product Executionware Page 50 of 62

3.4.4 Modes of InteractionA MetricsCollector can be exploited either by directly calling its mainmethods or indirectly by updating a particular file. In the second case, an in-stance of the FileWatcher class can be used for indirectly interacting with Met-ricsCollector in order to execute one of its methods. In particular, suchan instance monitors the content of a particular file and when updated, it reads itand invokes the respective MetricsCollector method reflected by the filecontent along with the respective input parameters also contained in this file.
3.4.5 Integration with AXE
AXE exploits the functionality of the MetricsCollector running in globalmode to relay its collected and aggregated metrics to the meta-data database(CDO) and to inform other interested components. For this purposes it enhancesthe metric collector by a remote interface (RMI) allowing remote access to itsfunctionality.
D5.1.2—Product Executionware Page 51 of 62


4
Further Aspects
This chapter captures aspects that so fare have not been presented. We start witha description of the testbeds in Section 4.1.
4.1 TestbedsFor the development and testing of the current prototype, two testbeds are beingprovided by the consortium. GWDG and FLEX run OpenStack and FlexiantCloud Orchestrator (FCO) respectively. The following paragraphs provide anoverview of the size and power of the respective testbeds.
4.1.1 GWDG’s OpenStack TestbedGWDG provides its in-house GWDG Compute Cloud with virtual machine im-ages including various Linux operating systems pre-configured for instant use.To accommodate diverse requirements of its users, in Y3, GWDG extended itsVM flavour offerings to 17 and operating system selection to 13, which are regu-larly updated to offer newer, safer and more stable releases. Using these images,users can create virtual machines and perform operations on them including sus-pending, pausing, rebooting, snapshotting, and deleting. The platform furtherallows assigning public IP addresses to virtual machines and to define firewallrules. The GWDG Cloud is based on the Grizzly release of OpenStack. Thiscan be accessed through the web interface of GWDG portal or directly using theOpenStack API.
In Y3, GWDG extended the infrastructure underlying its compute cloud. Thehardware underlying GWDG Compute Cloud now includes 38 nodes, having152 processors, 2432 cores, and 9728 GB of memory. The performance metricsinclude an overall Linpack value of 18.039 GFLOPS, an overall STREAM valueof 4.505 G/s and energy efficiency of 533 GFLOPS/KW.
53
The GWDG Compute Cloud is used for development, testing and deploy-ment purposes. In addition GWDG provides support for resolving any access ordeployment issues.
The LSY flight scheduling prototype features a Read-Write intensive, highthroughput and low latency application. The GWDG Compute Cloud satisfiesthese requirements. Similarly, the ASCS application requires sharing of NFSfile system for coordinating simulation load among a growing number of VMs.GWDG supports AGH, LSY, ASCS or other partners in meeting server siderequirements and resolving any network, storage or infrastructural issues faced.
So far, the Year-3 use of the GWDG cloud testbed by the consortium adds upto 30 VMs, 134 vCPUS, 162 GB memory and 29 public IPs, with approximately1420 GB disk space.
Further more, GWDG is aiming at providing a basic analytics component sothat future values of service level parameters may be foreseen to avoid potentialviolations.
All machines are operated in the data centre of GWDG which is provided inaccordance with European data protection and privacy regulations.
4.1.2 Flexiant Testbed (FLEX)Flexiant provides a constantly evolving cloud virtualisation environment for thePaaSage consortium based on the Flexiant Cloud Orchestrator (FCO). An FCOenvironment enables customers to deploy virtual machines (VMs).
This testbed has been extended since M18 [6] with respect to functionality,scale, and performance. Here, we describe recent changes for improving boththe testbed itself and integration with PaaSage.
Integration Mechanism
A RESTful interface was developed in FCO and released to v4.2 of FCO. Alsosupport was added for FCO to interface with the DASEIN Cloud API aggrega-tor1.
Triggers
A cost related FCO Trigger has been created for translating Flexiant Units toCPU Hours to gauge the rate various assets being charged on Flexiant providedPaaSage platform for both by usage or time. This is for use in PaaSage by theuse cases taking advantage of the Utility Function [4].
1https://github.com/greese/dasein-cloud-flexiant
D5.1.2—Product Executionware Page 54 of 62
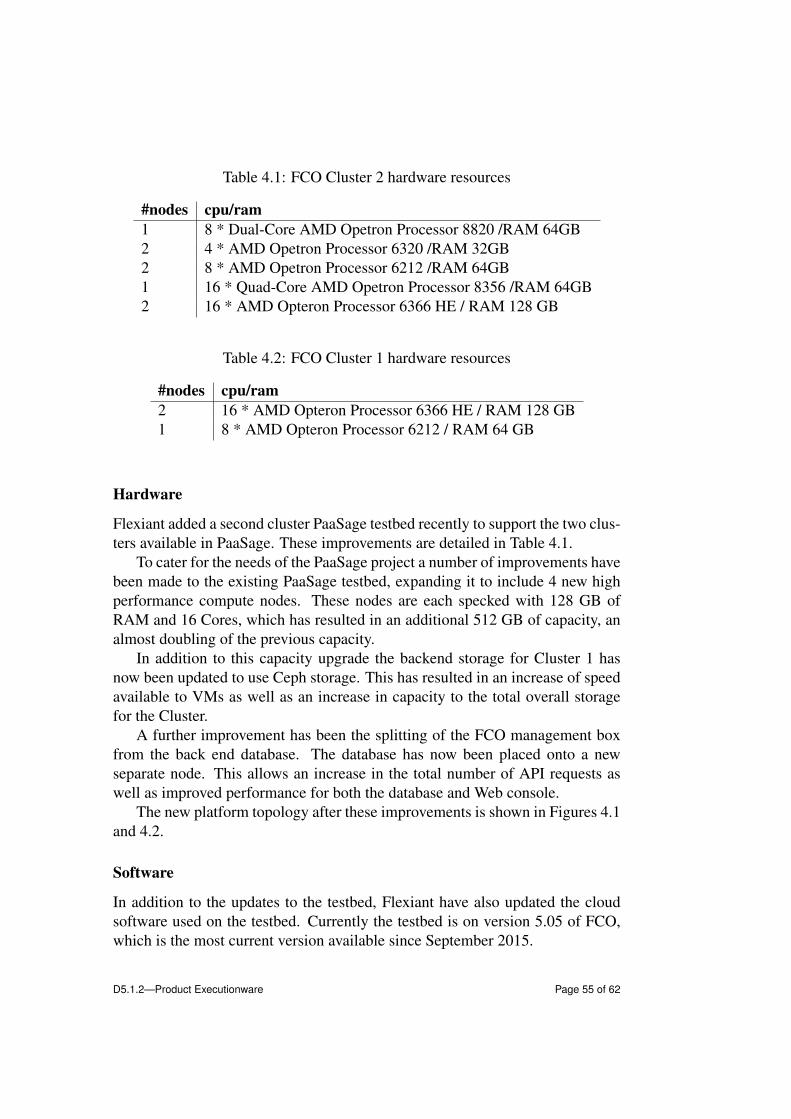
Table 4.1: FCO Cluster 2 hardware resources
#nodes cpu/ram1 8 * Dual-Core AMD Opetron Processor 8820 /RAM 64GB2 4 * AMD Opetron Processor 6320 /RAM 32GB2 8 * AMD Opetron Processor 6212 /RAM 64GB1 16 * Quad-Core AMD Opetron Processor 8356 /RAM 64GB2 16 * AMD Opteron Processor 6366 HE / RAM 128 GB
Table 4.2: FCO Cluster 1 hardware resources
#nodes cpu/ram2 16 * AMD Opteron Processor 6366 HE / RAM 128 GB1 8 * AMD Opteron Processor 6212 / RAM 64 GB
Hardware
Flexiant added a second cluster PaaSage testbed recently to support the two clus-ters available in PaaSage. These improvements are detailed in Table 4.1.
To cater for the needs of the PaaSage project a number of improvements havebeen made to the existing PaaSage testbed, expanding it to include 4 new highperformance compute nodes. These nodes are each specked with 128 GB ofRAM and 16 Cores, which has resulted in an additional 512 GB of capacity, analmost doubling of the previous capacity.
In addition to this capacity upgrade the backend storage for Cluster 1 hasnow been updated to use Ceph storage. This has resulted in an increase of speedavailable to VMs as well as an increase in capacity to the total overall storagefor the Cluster.
A further improvement has been the splitting of the FCO management boxfrom the back end database. The database has now been placed onto a newseparate node. This allows an increase in the total number of API requests aswell as improved performance for both the database and Web console.
The new platform topology after these improvements is shown in Figures 4.1and 4.2.
Software
In addition to the updates to the testbed, Flexiant have also updated the cloudsoftware used on the testbed. Currently the testbed is on version 5.05 of FCO,which is the most current version available since September 2015.
D5.1.2—Product Executionware Page 55 of 62

Figure 4.1: FCO Cluster 1 topology
Figure 4.2: FCO Cluster 2 topology
D5.1.2—Product Executionware Page 56 of 62
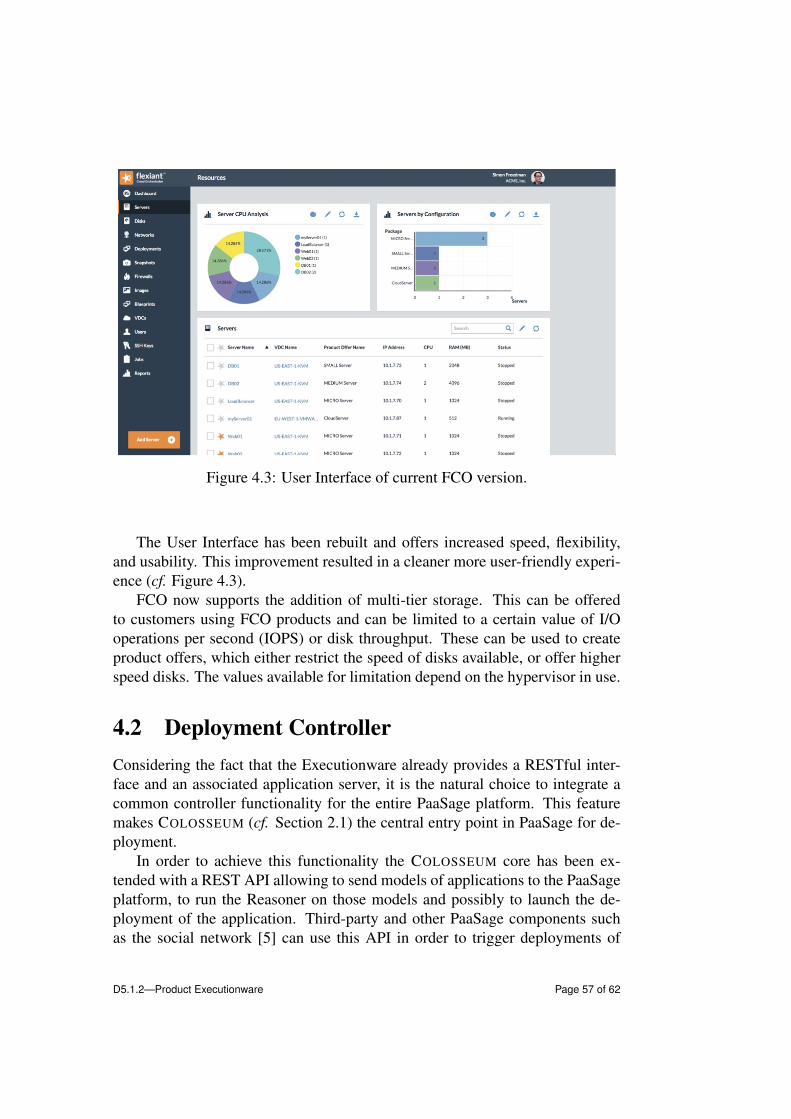
Figure 4.3: User Interface of current FCO version.
The User Interface has been rebuilt and offers increased speed, flexibility,and usability. This improvement resulted in a cleaner more user-friendly experi-ence (cf. Figure 4.3).
FCO now supports the addition of multi-tier storage. This can be offeredto customers using FCO products and can be limited to a certain value of I/Ooperations per second (IOPS) or disk throughput. These can be used to createproduct offers, which either restrict the speed of disks available, or offer higherspeed disks. The values available for limitation depend on the hypervisor in use.
4.2 Deployment ControllerConsidering the fact that the Executionware already provides a RESTful inter-face and an associated application server, it is the natural choice to integrate acommon controller functionality for the entire PaaSage platform. This featuremakes COLOSSEUM (cf. Section 2.1) the central entry point in PaaSage for de-ployment.
In order to achieve this functionality the COLOSSEUM core has been ex-tended with a REST API allowing to send models of applications to the PaaSageplatform, to run the Reasoner on those models and possibly to launch the de-ployment of the application. Third-party and other PaaSage components suchas the social network [5] can use this API in order to trigger deployments of
D5.1.2—Product Executionware Page 57 of 62

Figure 4.4: Environment for deployment testing
CAMEL applications. Indeed, an integration with the social network is foreseenfor the final version of PaaSage [9]. Also the testing environment provided tothe PaaSage consortium (cf. Figure 4.4) makes use of this API.
Requests to the deployment API can be processed by COLOSSEUM’s asyn-chronous queuing and execution system. The backend is responsible for launch-ing of components from the PaaSage Upperware and then invoking them. Inparticular, the API allows loading of CAMEL models into the CDO server aswell as triggering individual steps from the Upperware up to deploying the ap-plication through COLOSSEUM.
D5.1.2—Product Executionware Page 58 of 62
5
Conclusion and Future Work
The Executionware constitutes a fundamental part of the entire PaaSage sys-tem and its architecture. The primary purposes of the Executionware are (i) toenact interacting with the cloud providers through their respective and largelyinhomogeneous APIs, in order to support the creation, configuration as well astear down of virtual machines and virtual networks; (ii) to enact the deploymentof application components such as load balancers, databases, and applicationservers across the created virtual machines; (iii) to support the monitoring ofboth virtual machines and application component instances by provisioning ofappropriate sensors/probes and by supporting a reporting interface for applica-tions; (iv) to support the aggregation of raw metrics coming from the probesto higher-level composite metrics, and the evaluation of any of these metricsaccording to conditions and thresholds; (v) to report back metric values to theUpperware and to store them in the Metadata-Database (MDDB).
Throughout the PaaSage project, the Executionware has been designed anddeveloped in order to fulfill the aforementioned tasks. Following the concept ofdivide et impera this has led to a set of components that all support a sub set ofthe requested features, but whose interplay emerges to the desired functionality.In the following, we re-visit the individual components and by explicating theway to access them and further sketch an outlook on their possible future.
The CLOUDIATOR suite consists of several individual tools that are re-capturedin the following. Table 5.1 presents an overview on these components, their li-cense and whether they can be used independently. All of these components arereleased publicly through their main repository hosted on GitHub. Besides, reg-ular releases will also be available through the PaaSage OW2 repository1. Thedevelopment of COLOSSEUM will be continued in the scope of the CloudSocket2
project with a focus on fault tolerance and the aim to integrate PaaS-like of-1https://tuleap.ow2.org/projects/paasage2https://cloudsocket.eu/
59
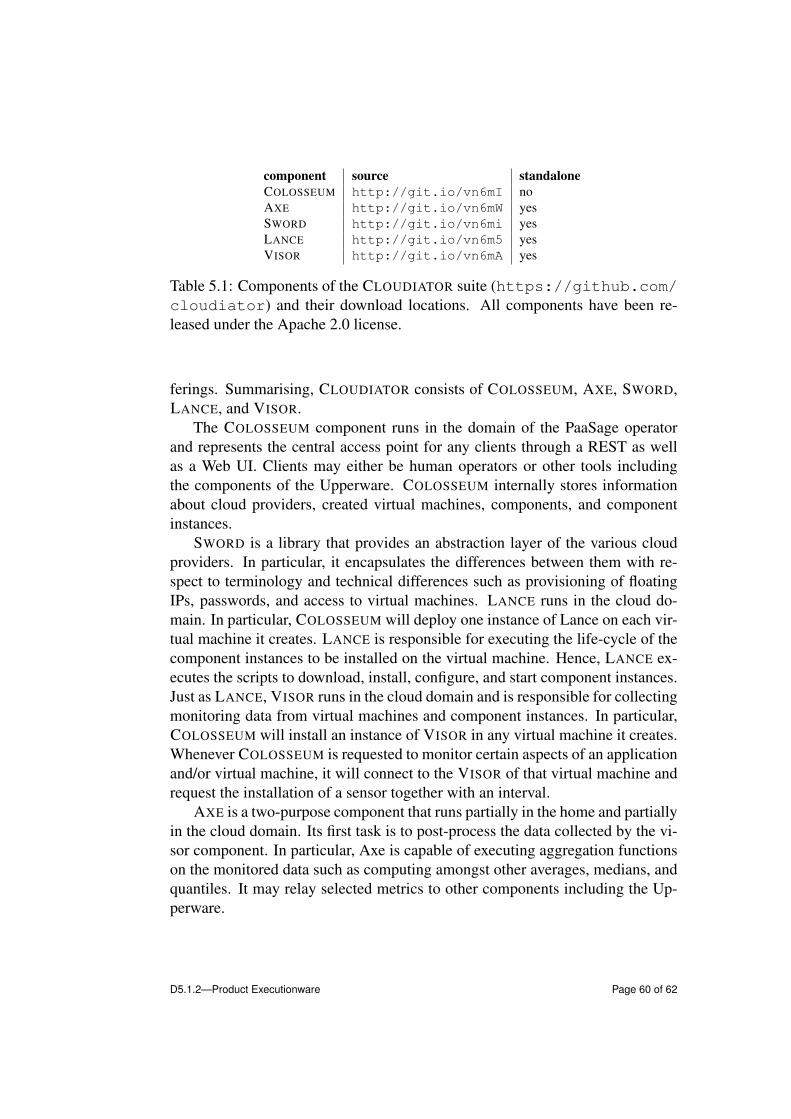
component source standaloneCOLOSSEUM http://git.io/vn6mI noAXE http://git.io/vn6mW yesSWORD http://git.io/vn6mi yesLANCE http://git.io/vn6m5 yesVISOR http://git.io/vn6mA yes
Table 5.1: Components of the CLOUDIATOR suite (https://github.com/cloudiator) and their download locations. All components have been re-leased under the Apache 2.0 license.
ferings. Summarising, CLOUDIATOR consists of COLOSSEUM, AXE, SWORD,LANCE, and VISOR.
The COLOSSEUM component runs in the domain of the PaaSage operatorand represents the central access point for any clients through a REST as wellas a Web UI. Clients may either be human operators or other tools includingthe components of the Upperware. COLOSSEUM internally stores informationabout cloud providers, created virtual machines, components, and componentinstances.
SWORD is a library that provides an abstraction layer of the various cloudproviders. In particular, it encapsulates the differences between them with re-spect to terminology and technical differences such as provisioning of floatingIPs, passwords, and access to virtual machines. LANCE runs in the cloud do-main. In particular, COLOSSEUM will deploy one instance of Lance on each vir-tual machine it creates. LANCE is responsible for executing the life-cycle of thecomponent instances to be installed on the virtual machine. Hence, LANCE ex-ecutes the scripts to download, install, configure, and start component instances.Just as LANCE, VISOR runs in the cloud domain and is responsible for collectingmonitoring data from virtual machines and component instances. In particular,COLOSSEUM will install an instance of VISOR in any virtual machine it creates.Whenever COLOSSEUM is requested to monitor certain aspects of an applicationand/or virtual machine, it will connect to the VISOR of that virtual machine andrequest the installation of a sensor together with an interval.
AXE is a two-purpose component that runs partially in the home and partiallyin the cloud domain. Its first task is to post-process the data collected by the vi-sor component. In particular, Axe is capable of executing aggregation functionson the monitored data such as computing amongst other averages, medians, andquantiles. It may relay selected metrics to other components including the Up-perware.
D5.1.2—Product Executionware Page 60 of 62

Bibliography
[1] Ian Clarke, Oskar Sandberg, Brandon Wiley and TheodoreW. Hong. ‘Freenet:A Distributed Anonymous Information Storage and Retrieval System’.English. In: Designing Privacy Enhancing Technologies. Ed. by HannesFederrath. Vol. 2009. Lecture Notes in Computer Science. Springer BerlinHeidelberg, 2001, pp. 46–66. ISBN: 978-3-540-41724-8. DOI: 10.1007/3-540-44702-4_4.
[2] The PaaSage Consortium. D1.6.1—Initial Architecture Design. PaaSageproject deliverable. Oct. 2013.
[3] The PaaSage Consortium. D2.1.3—CLOUDML Implementation Documen-tation Final version. PaaSage project deliverable. Sept. 2015.
[4] The PaaSage Consortium. D3.1.2—Product Upperware. PaaSage projectdeliverable. Sept. 2015.
[5] The PaaSage Consortium. D4.1.2—Product Database and Social NetworkSystem. PaaSage project deliverable. Sept. 2015.
[6] The PaaSage Consortium. D5.1.1—Prototype Executionware. PaaSage projectdeliverable. Mar. 2014.
[7] The PaaSage Consortium. D6.1.1—Initial Requirements. PaaSage projectdeliverable. Mar. 2013.
[8] The PaaSage Consortium. D6.1.2—Final Requirements. PaaSage projectdeliverable. Sept. 2014.
[9] The PaaSage Consortium. D6.2.3—Modified System. PaaSage project de-liverable. June 2016.
[10] Jörg Domaschka, Kyriakos Kritikos and Alessandro Rossini. ‘Towards aGeneric Language for Scalability Rules’. In: Proceedings of CSB 2014:2nd International Workshop on Cloud Service Brokerage. 2014 (To Ap-pear).
61

[11] Lars George. HBase: The Definitive Guide. 1st ed. O’Reilly Media, 2011.ISBN: 1449396100.
[12] Thomas Goldschmidt, Anton Jansen, Heiko Koziolek, Jens Doppelhamerand Hongyu Pei Breivold. ‘Scalability and Robustness of Time-SeriesDatabases for Cloud-Native Monitoring of Industrial Processes’. In: 2014IEEE 7th International Conference on Cloud Computing, Anchorage, AK,USA, June 27 - July 2, 2014. 2014, pp. 602–609.
[13] Kyriakos Kritikos, Jorg Domaschka and Alessandro Rossini. ‘SRL: AScalability Rule Language for Multi-cloud Environments’. In: CloudCom,2014 IEEE 6th International Conference on. Dec. 2014, pp. 1–9. DOI:10.1109/CloudCom.2014.170.
[14] Avinash Lakshman and Prashant Malik. ‘Cassandra: A Decentralized Struc-tured Storage System’. In: SIGOPS Oper. Syst. Rev. 44.2 (Apr. 2010),pp. 35–40. ISSN: 0163-5980. DOI: 10.1145/1773912.1773922.URL: http://doi.acm.org/10.1145/1773912.1773922.
[15] D. MacEachern and R. Morgan. SIGAR — System Information GathererAnd Reporter. 2010.
[16] B. Morin, O. Barais, J. -M Jezequel, F. Fleurey and A. Solberg. ‘[email protected] to Support Dynamic Adaptation’. In: Computer, IEEE 42.10(2009), pp. 44–51. ISSN: 0018-9162. DOI: 10.1109/MC.2009.327.
D5.1.2—Product Executionware Page 62 of 62