PA DEP BAQ - Air Monitoring - Processes Controlling … and distant sources of pollutants have been...
71
Final Report for Commonwealth of Pennsylvania Department of Environmental Protection Processes Controlling Urban Air Pollution in the Northeast: Summer 2002 Investigations Conducted by a Consortium of University Researchers C. Russell Philbrick Department of Electrical Engineering, Penn State University William Ryan Department of Meteorology, Penn State University Richard Clark Department of Earth Sciences, Millersville University Phillip Hopke Department of Chemistry, Clarkson University Stephen McDow Department of Chemistry, Drexel University Work Performed for Pennsylvania Department of Environmental Protection Contract ME#359494, Task 036 April 2002 through July 2003 Principal Investigator: C. Russell Philbrick Penn State University 315 Electrical Engineering East University Park PA 16802 814-865-2975 [email protected] 25 July 2003
Transcript of PA DEP BAQ - Air Monitoring - Processes Controlling … and distant sources of pollutants have been...

Final Reportfor
Commonwealth of PennsylvaniaDepartment of Environmental Protection
Processes Controlling Urban Air Pollution in the Northeast: Summer 2002
Investigations Conducted by a Consortium of University Researchers
C. Russell PhilbrickDepartment of Electrical Engineering, Penn State University
William RyanDepartment of Meteorology, Penn State University
Richard ClarkDepartment of Earth Sciences, Millersville University
Phillip HopkeDepartment of Chemistry, Clarkson University
Stephen McDowDepartment of Chemistry, Drexel University
Work Performed for Pennsylvania Department of Environmental Protection
Contract ME#359494, Task 036April 2002 through July 2003
Principal Investigator:C. Russell Philbrick
Penn State University315 Electrical Engineering East
University Park PA [email protected]
25 July 2003
-2-
TABLE OF CONTENTS
LIST OF ACRONYMS AND ABBREVIATIONS ............................................. 3
SUMMARY ......................................................................................................... 4
PART 1: BACKGROUND OF THIS INVESTIGATION .................................. 5
PART 2: CONTRIBUTIONS FROM PENN STATE UNIVERSITY ................. 12ELECTRICAL ENGINEERING DEPARTMENT1. Project Goals2. Measurement Examples3. Key Findings
PART 3: CONTRIBUTIONS FROM PENN STATE UNIVERSITY ................. 21DEPARTMENT OF METEOROLOGY1. Data Collected2. Hypothesis R1
PART 4: CONTRIBUTIONS FROM MILLERSVILLE UNIVERSITY ............. 281. Project Objectives2. Summary of Key Measurements3. Key Activities of Millersville University4. Key Findings and Conclusions5. Papers and Presentations Related to NEOPS-DEP
PART 5: CONTRIBUTIONS FROM CLARKSON UNIVERSITY .................... 371. Continuous and Semi-Continuous PM2.5 Measurements and Analysis2. Variations of Carbonaceous Compound Concentrations3. Comparison of PM2.5 Mass and Chemical Species4. Influence of Canadian Forest Fire5. Comparison of Daily Filter-Based Samples
PART 6: CONTRIBUTIONS FROM DREXEL UNIVERSITY .......................... 51
PART 7: PROJECT SUMMARY ......................................................................... 611. Questions and Hypotheses Examined2. Meteorological Analysis3. Summary of the 2002 Conditions4. Archiving of the NEOPS-DEP2002 Data5. Publications and Presentations6. Summary of Key Findings7. Acknowledgments

-3-
LIST OF ACRONYMS AND ABBREVIATIONS
AMS Air Management Services (Philadelphia Laboratory)API Advanced Pollution InstrumentationDEP Department of Environmental ProtectionDIAL DIfferential Absorption LidarCAMMS Continuous Ambient Mass Monitoring SystemGCMS Gas Chromatograph & Mass Spectrometer (combined instruments)GRIB GRid In Binary - Standard for data grid fieldsHYSPLIT HYbrid Single-Particle Lagrangian Integrated TrajectoryIC Ion ChromatographyLAPS Lidar Atmospheric Profile SensorLLJ Low Level JetMANE-VU Mid-Atlantic/Northeast Visibility UnionMARAMA Mid-Atlantic Regional Air Management AssociationMeos-eta Mesoscale model that uses the coordinate “eta” as a normalized pressure baseMU Millersville UniversityMM5 Mesoscale Model (version) 5NWS National Weather ServiceNCEP National Centers for Environmental PredictionNESCAUM NorthEast States for Coordinated Air Use ManagementNE-OPS NorthEast Oxidant and Particle StudyNd:YAG Neodymium doped into Yttrium Aluminum Garnet material used for laser rodNARSTO North American Research Strategy for Tropospheric OzoneOC/EC/BC Organic Carbon - Elemental Carbon - Black CarbonOTC Ozone Transport CommissionPAH Polycyclic Aromatic HydrocarbonsPBL Planetary Boundary LayerPEM’s Personal Environmental MonitorsPM Particulate MatterPM2.5 Particulate Matter with aerodynamic size less than 2.5 micronsPM10 Particulate Matter with aerodynamic size less than 10 micronsPSU Penn State UniversityRASS Radar-Acoustic Sounding SyayemRAMS Real-time total Ambient Mass SamplerRUC Rapid Update CycleSCC Sharp Cut CycloneSES Sample Equilibration System (dryer for PM)SIP’s State Implementation PlansSOA Secondary Organic AerosolSVOCs Semi-Volatile Organic CompoundsTASS Tethered Atmospheric Sounding SystemTEOM Tapered Element Oscillating MicrobalanceTSI TSI Incorporated - instrument companyUSEPA United States Environmental Protection AgencyUTC Universal Time CoordinatedVSCC Very Sharp Cut Cyclone

-4-
SUMMARY
This research continues the activities of the NEOPS university consortium to investigate airquality issues in the northeast as a follow on to the USEPA sponsored project entitled Investigationsof Factors Determining the Occurrence of Ozone and Fine Particles in Northeastern USA. Thisproject has been designated as NEOPS-DEP2002 to associate with but distinguish it from themeasurement program referred to as the NARSTO-NE-OPS project, which was carried out during1998, 1999 and 2001 under EPA STAR Grant R826373. Both of these research projects have beenassociated with the NARSTO (North American Research Strategy for Tropospheric Ozone) Programfor data archiving purposes.
The NEOPS-DEP2002 project included a six-week summer field measurement intensiveprogram and was carried out during the period from the last week of June through the first week ofAugust 2002. The measurements overlapped the activity of the three PM (Particulate Matter)Supersites in the northeast region, Baltimore, Pittsburgh and New York. Our plan was to optimizethe value of all of the northeast measurements during the 2002 summer by fully overlapping theperiod of other measurement programs in the region. The NEOPS-DEP2002 measurements includedkey meteorological properties, gas chemistry, and particulate physical/chemical properties. Themajor instruments included remote sensing radar and lidar for vertical profiling of the meteorologicaland air quality properties, insitu measurements of meteorological profiles, aerosols and ozone fromsurface to 300 m using an instrumented tethered balloon, and a suite of surface based instrumentsfor measuring the concentrations of key chemical species and particulate physical/chemicalproperties. Also, minor/toxic species were measured using filter samples which were analyzed withhigh resolution GC/MS laboratory techniques. Measurements were also obtained by the Universityof Maryland instrumented aircraft during flybys on two days during July. The instruments used andmeasurements obtained are described in more detail in the following sections. The primary resultsprovide an important data base to test developing models and extend our understanding ofphysical/chemical processes which control air pollution episodes. The results are being shared withother researchers through technical workshops and web based data links. The results are in the finalstage of preparation and testing to make them available to the scientific community through thenational NARSTO data archive. We have placed a special emphasis on coordination with thenortheast Supersites in an effort to help create a regional picture of air pollution episodes. Theanalysis and coordination activity will continue beyond the defined dates of this project activity.
There are three primary factors which make this activity particularly valuable. First, the NE-OPS project site and team strengths have been extended to investigate air quality and develop ameteorological context for regional collaboration with the Northeast Supersites in Baltimore, NewYork and Pittsburgh. Second, the NE-OPS emphasis on the measurements of particulate matter andvertical profiling of airborne PM provides the key data for understanding the regional haze questionsand will support the MANE-VU (Mid-Atlantic/Northeast Visibility Union) investigations ofnortheast regional haze. Third, the major intensives of the prior NE-OPS projects have beenconducted during summers which represented the 90th percentile warm and 10th percentile dry(1999), and the 80th percentile cool and 20th percentile dry (2001) conditions for the region, thereforethese investigations should extended the range of meteorological conditions. The effort here alsopermits an opportunity for setting new results into context with the prior NE-OPS investigations.

-5-
PART 1: BACKGROUND OF THIS INVESTIGATION
The latest developments in remote sensing techniques and insitu measuring instruments werebrought together as part of the NARSTO-NE-OPS program to examine the problems of the urbanpolluted atmosphere in two intensive eight week periods during the summers of 1999 and 2001 andduring a three week pilot study in 1998. The NEOPS-DEP2002 investigation extends the activitiesof the prior campaigns to investigate air quality issues and to provide coordination with the northeastSupersites and the MANE-VU Program during the summer season of 2002. Intensive measurementshave been made during periods of summer exceedences of the ozone and fine particle concentrationsin Philadelphia PA. Local and distant sources of pollutants have been investigated using an urbansite with point sensors and remote sensing instruments, making aircraft measurements to determinethe upwind and downwind distribution, and using the network data from other ground sites in theNortheast region. The extended summer measurement periods have provided a critical data base thatdescribes the vertical and horizontal distribution of the ozone and fine particle concentrations, thelocal concentrations of chemical species and particulate matter, and the meteorological conditions.These measurements permitted investigations to interpret the contributions from local and distantsources to the urban pollution exceedences of ozone and PM10 as well as the new PM2.5 standards.Important factors of entrainment and transport to and from reservoirs in the boundary layer and thelower free troposphere have been investigated.
The EPA STAR Grant R826373 NE-OPS project was initiated on 15 April 1998 and a fieldsite was established in northeast Philadelphia, where the initial field measurements were conductedfrom 1 to 22 August 1998, and the major investigations were conducted in 1999 and 2001. The fieldmeasurements were given the name NE-OPS (Northeast - Oxidant and Particle Study) and associatedwith the NARSTO program in order to adopt the NARSTO data archiving plan, which has also beenadopted for the NEOPS-DEP program. The primary objective of the measurement program duringsummer 1998 was to develop the facilities for operation of the field site and to compare severalinstruments planned for use during the measurements program. However, a major air pollutionepisode occurred at the end of the field program, 21-22 August 1998, that provided an excellent setof results for investigations of air pollution episode properties. The 1999 field program resulted ina rich data set that included eight periods for intensive studies associated with air pollution events,and one of these was the largest event that occurred during the past decade. The 1999 project wasextremely successful and a decision was taken to delay the planned 2000 field measurements to2001, while using the opportunity to upgrade our field site, prepare additional sensors formeasurements, and prepare the data base for analysis and modeling activity. The delay to 2001 alsopermitted coordinated measurements with the northeast EPA Supersite activity. The fact that nomeasurements were made during the summer 2000 was not a loss since that summer activity wasgenerally uninteresting. During the 2001 field measurement program, three interesting periods wereidentified for special studies.
The USEPA funded three Supersites in the northeast US to conduct a set of special studiesthat extend beyond the national regulatory networks for PM to elucidate source-receptorrelationships and atmospheric processes in support of State Implementation Plans (SIPs). Theguiding principles for this research are based on the insights provided in the PM MeasurementsWorkshop Report, Atmospheric Observations: Helping Build the Scientific Basis for Decisions

-6-
Related to Airborne Particulate Matter (EPA/NARSTO, October 1998). The “SupersitesConceptual Plan” outlines objectives of the Supersites Program that emphasize the need foratmospheric measurements essential for understanding atmospheric transport and meteorology onregional as well as local scales. The Supersites do not contain a major emphasis on the processesof meteorology and transport, thus the NEOPS-DEP is organized to provide additional understandingof these processes. The NE-OPS activity has provided important insights into the factors andprocesses controlling the evolution of air pollution episodes and is a most valuable resource forcontinued air pollution monitoring and investigations in the Northeast Region. Three of theSupersites (Pittsburgh, Baltimore, and New York) are located in the mid-Atlantic/northeast region.Figure 1-1 shows the northeast regional area investigated by the NE-OPS project, and it indicatesits proximity to the locations of the Supersites in New York and Baltimore. It is recognized thattransport, mixing, and atmospheric stability play key roles in understanding source-receptorrelationships, however measurements are usually limited to surface based sensors and standardmeteorological variables which do not provide the required data. Some factors which the NEOPS-DEP2002 contributes to regional studies with the Supersites include understanding of themeteorological processes such as, the thermodynamic structure, atmospheric stability, transitionsbetween daytime and nighttime mixing, and measurement of mixing depth for the distribution ofPM2.5 and chemical species. The central location of the Philadelphia site and the special capabilitiesof the NE-OPS instruments and investigators have been used to advantage to characterize theregional scale.
Significant variations occur within the PBL on spatial scales of the order of tens of meters,and time scales of the order of minutes. Synoptic scale analyses are not capable of resolvingstructure that plays a major role in the vertical exchange between the lower troposphere and PBL.Mesoscale models continue to be plagued by large divergences in solutions for the height of the PBLwhen initialized with surface data without knowledge of the aloft field variables. The relationshipsbetween transport on the synoptic and regional scales as determined from NCEP analyses and mixingprocesses on the local (sub-grid) scale have not been resolved. Uncertainties can lead to significantdifferences between the model solutions of the height of the stable (nocturnal) PBL and the daytimemixed layer, as well as the determination of the daytime PBL height. Knowledge of the temporalevolution of the PBL is a critical input into models of the pollutant concentrations because itestablishes the mixing volume. The Baltimore and New York Supersites are separated by over 300km. Over this distance PM and trace gas modification can be so influenced by the northeast corridorurban plumes that attempts to characterize them will fail. Philadelphia’s site location, approximatelymidway between the Supersites (182 km from Baltimore; 118 km from New York), provides anarray of surface measurement platforms that are similar to the PM Supersites and it providessignificant capability for investigations of the controlling meteorological processes by adding thealoft measurement component. The location of these three sites should allow an interesting studyof the air mass along the northeast corridor.

-7-
Figure 1-1. The map of the northeast region shows the regional emphasis of the NE-OPSinvestigation as the square centered on Philadelphia. It includes the Supersites in New York andBaltimore at its corners and the Supersite in Pittsburgh is in an important upwind location forcoordinated studies.

-8-
The creation of PM Supersites in Baltimore and New York has presented a valuableopportunity to integrate aloft and surface measurements in Philadelphia, PA with those at the PMSupersites during combined field intensives. Since 1998, Philadelphia has been the site of intensivemulti-institution/agency field campaigns which have focused on the processes associated withoccurrence of ozone and fine particle events along the northeast corridor. Raman LIDAR, RASS(Radar-Acoustic Sounding System), tethered and free balloons, aircraft and a plethora of surface-based PM and trace gas analyzers have provided surface and aloft measurements during the NEOPScampaigns. These results are being combined with emissions inventories and numerical models toprovide a detailed characterization of the local and regional conditions accompanying high ozoneand fine particle events. An extensive infrastructure has been developed during these projects whichinvolves many scientists at several universities, and close coordination with Federal and Stateagencies, national laboratories, regional planning organizations in the Northeast (MARAMA, OTC,NESCAUM), and the City of Philadelphia. The instruments and measurements deployed during the1998 NEOPS pilot study (6-21 August 1998), the 9-week NEOPS field intensive (28 June – 18August 1999), and the 2001 NEOPS (July 2001) are summarized in a recent overview (Philbrick,et. al 2002).
Table 1-1 provides a summary of the measurements conducted during the NEOPS-DEP 2002project. This activity during the summer 2002 field intensive has led to a significant improvementin our ability to characterize the northeast corridor airshed. The NE-OPS group added a significanteffort which focuses on aloft measurements during the PM Supersite summer. The opportunity toincorporate aloft measurements in Philadelphia and integrate those measurements with PMmeasurements in Baltimore and New York adds an important dimension to the intensives that wouldotherwise be lost. Moreover, the NE-OPS results from the 1998, 1999 and 2001 databases permitsmulti-year comparisons. The database from prior years included twelve significant air pollutionepisodes where either PM, ozone, or both exceeded NAAQS under a range of atmosphericconditions. The central location of Philadelphia with respect to the two PM Supersites along thenortheast corridor, its influence as an up/downwind source/receptor, proximity to the coastal regions,yet more inland than either Baltimore or New York, should help elucidate important similarities anddifferences in the regional temporal and spatial distribution of the PM2.5/co-pollutant complex. Theresults could benefit the development of SIPs, the setting of NAAQSs. The measurement programduring summer 2002 was coordinated with the three northeast Supersites and with the MANE-VUproject:(a) Baltimore - John Ondov (PI) - Baltimore intensive during the month of July(b) New York - Ken Demerjian (PI) - New York Supersite intensive measurements during July 2002(c) Pittsburgh - Spyros Pandis (PI) - Pittsburgh Supersite intensives of several days duration throughthe year when pollution events occur. (d) Regional Haze MANE-VU Project - Regional haze studies during July 2002.
The periods of special emphasis based upon the ozone and PM episodes during the summerof 2002 are shown in Figure 1-2 and are summarized in Table 1-2. The results presented in Figure1-2 combine the Clarkson University measurements of particulate matter with the MillersvilleUniversity measurements of ozone. Figure 1-3 depicts several of the instruments used to gather themeasurements at the Philadelphia site during the NEOPS-DEP2002 campaign.

-9-
Table 1-1. Summary of key measurements obtained during NEOPS-DEP2002.Trace Gases:
1. Vertical profiles of ozone and water vapor using PSU Raman Lidar2. Suite of API analyzers and on-site calibrators to measure CO, O3, SO2, and NO/NO2/NOXby Millersville University3. Aloft ozone concentration profiles using Millersville University’s tethered atmosphericsounding system (TASS) between surface and 300 m4. Air toxics and minor species composition of particulate matter using GC/MS laboratoryanalysis of filters gathered at the site and measured at laboratories of Drexel University
Particulates:1. PSU Raman Lidar vertical profiles of optical extinction at visible and ultravioletwavelengths2. Millersville University tethered balloon profiles of the PM using laser diode particlenephelometers and impaction sampling on Personal Environmental Monitors (PEMs, SKCInc.)3. Clarkson University particulate properties using CAMMS, RAMS, Sunset Labs OC/EC,HSPH SO4
�, aethalometer, and nephalometer4. Millersville University nephelometer (TSI model 3563) total scatter and backscatter atthree wavelengths5. Particle filter samples analyzed at Drexel University using laboratory techniques for toxicsand minor constituents
Meteorological Variables:1. PSU Radar/RASS vertical profiles of wind velocity (surface to 4.5 km) and virtualtemperature (surface to 2.5 km)2. PSU Raman Lidar vertical profiles of water vapor and temperature3. Meteorological variables (T, p, mixing ratio, wind speed and direction) as a function ofheight between the surface and 300 m using Millersville University’s tethered sonde4. Continuous measurements of meteorological variables recored from 10-meter tower
Real-time Regional and Synoptic Data Archive:U.S. upper air data; U.S. surface data; Meso-eta and RUC model data; Visible and IRsatellite imagery; Base reflectivity and velocity radar imagery.
Table 1-2. Special interest periods during NEOPS-DEP 2002 (29 June - 7 August 2002)1 30Jun-4 July 1 July ozone 105 ppb, and 2 July 110 ppb 2 6-7 July Smoke Event from fires in Canada profiled optical
scatterometer on tethered balloon.3 8-9 July High ozone (140 ppb range) with an abrupt rise to
about 145 ppb late on 8 July (8PM local), 130 ppb on 9 July4 17-19 July 18 July ozone exceeded 100 ppb for more than
10 hours, 130 ppb on 19 July with excursions to 140 ppb5 20 July Sea breeze event.6 23 July Frontal passage and rain-out effects7 28-29 July Weak ozone and PM event8 1-2 Aug Ozone (>120 ppb) and PM Event ending with significant frontal passage
4 Aug 130 ppb ozone

-10-
Figu
re 1
-2.
Mea
sure
men
ts o
f PM
2.5
(Cla
rkso
n U
nive
rsity
) and
ozo
ne (M
iller
svill
e U
nive
rsity
) at t
he N
EOPS
fiel
d si
te in
Phi
lade
lphi
adu
ring
the
sum
mer
of 2
002
show
the
perio
ds o
f air
pollu
tion
epis
odes
.

-11-
The results in Figure 1-2 provide a useful overview of the summer 2002 conditions. The plotshows the large daily variation in the ozone concentration and identifies those periods of poor airquality. The first major episode of the 2002 summer occurred between 30 June and 4 July. Otherperiods of peak ozone concentration are seen to occur in 8, 10 and 19 July. Major PM events areseen to occur on 6-8 July, 18-19 July and during the period 28 July into early August. It isinteresting to compare these periods because they represent the two major processes causing PMevents. The first event, 30 June - 4 July, is typical of a summer ozone and PM event that can beclosely tied with the transport of pollution from the westward boundary that brings the material intothe regionto cause the high ozone and PM values. The second period, 6-8 July, occurs as a high PMevent because of major forest fire smoke from southeastern Canada and contains a large carboncomponent. The PM event is followed on 8-9 July with some of the highest ozone values recordedand appears to be due the photochemical processing at elevated levels of species brought into theregion from the Canadian forest fires. The third event on 18-19 July is more typical of the PMcomponent generated by smog air chemistry and contains a large contribution from sulfate aerosol.
Figure 1-3. Instruments used during the NEOPS-DEP measurement campaign shown here include theRadar/RASS antenna, particle sensors, tetheredballoon sensors, meteorological tower and lidarbeam.

-12-
PART 2: CONTRIBUTIONS FROM PENN STATE UNIVERSITY
Remote Sensing Applications to Understanding Air Pollution ProcessesC. Russell Philbrick
Department of Electrical Engineering, The Pennsylvania State University
1. Project GoalsLidar and Radar remote sensing techniques provide a special capability to measure the
development and dissipation of air pollution events and provide results that contribute to ourunderstanding of the important processes. The recent measurements have demonstrated that manyof the most important processes cannot be observed from the ground based sensors, and these remotesensing techniques provide a unique view of the processes. Remote sensing techniques providenearly continuous profiles of the key parameters that monitor the meteorological and air qualityproperties. A Raman Lidar, Doppler Radar and Acoustic Sounder have been used to profile theproperties of the lower atmosphere. The unique Raman lidar techniques which have been developedat Penn State University (PSU) provided simultaneous profiles of the temperature, water vapor,optical extinction, and ozone. These parameters provide the key chemistry, particulate andmeteorological properties needed to study air pollution episodes. Profiles of water vapor and opticalextinction also define the thickness of the planetary boundary layer (PBL) and describe the verticaldistribution of fine airborne particulate matter. Doppler radar is used to profile the velocitycomponents of the wind field and describe horizontal transport and dynamics. The acousticalmeasurements of the speed of sound provide profiles the virtual temperature which describe thethermodynamic stability of the atmosphere. Table 2-1 summarizes the remote sensing profiles whichwere obtained using the LAPS Raman Lidar and the LAP-3000 Radar/RASS instruments.
Table 2-1. Remote Sensing Measurements of the LAPS lidar and the Radar-RASS instruments.Property Measurement Altitude Time (Resolution)
Water Vapor
660/607 Raman294/285 Raman
Surface to 5 kmSurface to 3 km
Night (1 min.)Day & Night (1 min.)
Temperature 528/530 Rot. Raman Surface to 5 km Night (10 to 30 min.)
Ozone 276/285 Raman/DIAL Surface to 2 - 3 km Day and Night (30 min.)
Optical Extinction at 530 nm 530 nm Rot. Raman Surface to 5 km Night (10 to 30 min.)
Optical Extinction at 607 nm 607 N2 - 1st Stokes Surface to 5 km Night (10 to 30 min.)
Optical Extinction at 285 nm 285 N2 - 1st Stokes Surface to 3 km Day and Night (30 min.)
Wind Speed and Direction Doppler Velocity Surface to 5 km Day and Night (10 min)
Virtual Temperature Speed of Sound Surface to 2 km Day and Night (1 hour)
Raman lidar techniques have proven to provide the most valuable descriptions of theevolution of air pollution events. The vibrational and rotational Raman lidar signals providesimultaneous profiles of meteorological data, ozone profiles and profiles of airborne particulatematter. The LAPS (Lidar Atmospheric Profile Sensor) is an operational prototype Raman lidar

-13-
instrument, which was developed and demonstrated for the US Navy and is now used for scientificinvestigations. The LAPS instrument makes use of 2nd and 4th harmonic generated laser beams ofa Nd:YAG laser and provides both daytime and nighttime measurements. The Raman scatter signalsof vibrational states of water vapor and nitrogen provide robust profiles of the specific humidity inthe lower atmosphere. The temperature profiles are measured using the ratio of rotational Ramansignals at 530 and 528 nm from the 532 nm (2nd harmonic) beam of the Nd:YAG laser. In addition,the optical extinction profiles are determined from the measured gradients in each of the molecularprofiles compared to the molecular scale height. We currently use the wavelengths at 284 nm(nitrogen vibrational Raman), 530 nm (rotational Raman) and 607 nm (nitrogen vibrational Raman)to determine profiles of optical extinction. The ozone profiles in the lower troposphere are measuredusing a DIAL (Differential Absorption Lidar) analysis of the ratio of the vibrational Raman signalsfor nitrogen (284 nm) and oxygen (278 nm) scattered from the 4th harmonic of the Nd:YAG. Themeasurements can be made both during daytime and nighttime because of the capability of theinstrument to use the “solar blind” portion of the ultraviolet spectrum from the 4th harmonic of theNd:YAG laser. The results are used to investigate the physical and chemical processes which controlthe evolution of air pollution episodes, and for development and testing of models of air pollutionevents.
The second major remote sensing activity included measurements of the wind field and thethermal structure of the lower atmosphere using a Doppler radar combined with a radio acousticsounder (Radar/RASS). The Radar/RASS instrument is a LAP3000 manufactured by RadianInternational (now a part of Vaisala Corporation) which has been operated at the Philadelphia sitesince July 1999 by Penn State University. The instrument was obtained from EPRI with a grantfrom PECO and the installation was supported by MARAMA. It has the ability to measurecontinuously to obtain wind profiles to 4 km and virtual temperature profiles to 1.5 km. During thesummer of 2002, it was operated in a mode to attempt to obtain higher time resolution results.During the first 10 minutes of each hour, it was used to measure the speed of sound to obtain virtualtemperature profiles. The remaining 50 minutes in each hour was devoted to alternating 3 minuteperiods of 75 meter spatial resolution (0 to 2 km) and 150 meter resolution profiling (0 to 4 km).
2. Measurement ExamplesThe LAPS lidar instrument was transported to Philadelphia and setup at the NEOPS site in
mid-June. Instrument testing was begun on 23 June and the operational phase of the activity tookplace between 28 June and 7 August 2002. Table 2-2 gives a summary of the periods of operationof the Raman lidar. We experienced some major hardware problems with the laser transmitter thatmade it impossible to collect data with the instrument between 6 and 20 July. Two service trips byengineers from the laser manufacturer were needed to finally repair the instrument. The instrumenthas seen much use during the past years and the laser should be serviced before a future campaign.The operating periods listed in Table 2-2 provide measurements during several very interesting anduseful studies. Figure 2-1 shows lidar measurements during the early stages of the ozone/PM eventon 1 July 2002. The vertical distributions of these parameters show the aloft concentrations of ozoneand aerosols and the change as night approaches. Figure 2-1 shows the last six hours of the UTCday, approximately 2 PM to 8 PM local time. The transition periods between day and night areparticularly interesting because these periods show the ozone stored aloft in the nighttime reservoirof the residual boundary layer.

-14-
Table 2-2. Summary of LAPS Lidar run times - 23 June – 7 August 2002 (UTC)Hours Minutes
23 June 04-06 9124 June 01-02 5026 June 02-03 3027 June 01-02 4428 June 16-18, 22-23 15529 June 00, 04-06 10330 June 00-04, 22-23 3251 July 00-23 12962 July 00-23 13633 July 00-23 14074 July 00-23 14125 July 00-02 13321 July 04-06 6522 July 01-23 128123 July 00-23 1436
Hours Minutes24 July 00-07 38025 July 09-13 21426 July 07-12 30627 July 00-02 7128 July 08-12, 20-23 42829 July 00-23 130730 July 00-14, 18-23 115031 July 00-23 12781 August 00-23 13992 August 00-23 13283 August 00-12 7494 August 20-22 615 August 01-19 10486 August 00-23 12097 August 00-09 512
Figure 2-1. Time sequences ofozone and optical extinction(describes the distribution ofPM2.5) during the afternoon andearly evening of 1 July 2002show the transition to nighttimeconditions while in the firststages of an ozone episode.

-15-
The episode began on 1 July andcontinued for several days. The resultsshown in Figure 2-2 are a continuationfollowing after those shown in Figure 2-1.These nighttime measurements show thevertical distribution of aerosols (basedupon the optical extinction at visible andultraviolet wavelengths) and the verticalprofiles of ozone. The nighttime transportof ozone and PM into the region is clearlyevident in these results.
The UV extinction shows theexpected response to ozone absorption inthe layer at 500 meters. The visibleextinction is more sensitive to the largerparticles that are present between 1.0 and1.5 km. Figure 2-2 compares the opticalextinction at both visible and ultravioletwavelengths with the ozone distributionduring the first 6 hours of 2 July (8PM on1 July to 2AM on 2 July), immediatelyfollowing the measurements shown inFigure 2-1. The extinction at visiblewavelengths is maximum between 1 and1.5 km because this region corresponds tohigh relative humidity which leads togrowth of the aerosol particle size andincreases the scattering. The ultravioletextinction has much more contributionfrom the process of molecular scattering,as well as from ozone absorption. Theozone results depict the nighttimereservoir of ozone above the nocturnalinversion. During this night a low leveljet formed which transported ozone intothe region from upstream sources.
Figure 2-2. The optical extinction atvisible and ultraviolet wavelengths areshown with the ozone measurementsduring the same night period on 2 July.

-16-
Figure 2-3 shows a longer 18-hour sequence of the ozone measurements on 2 July thatextends from near sunset on 1 July through the night to 2 PM local time the following afternoon.This example shows the contribution of the nighttime residual layer as a significant storage reservoirfor ozone, where it can be transported over large distances at altitudes above the nocturnal boundarylayer. The reservoir contributes to the daytime ozone layer when mixing brings the material that hasbeen transported and stored in this region to the surface.
Figure 2-3. The time sequence of ozone measurements between sunset on 1 July through 2PM localtime on 2 July shows the storage/transport of ozone through the night.
Most of the significant ozone episodes that have been observed in Philadelphia are associatedwith transport of primary and secondary sources of pollution in the region near the top of thenocturnal boundary layer. The kinematics of the transport in this region can be seen in the Dopplerradar measurements of the wind field shown in Figure 2-4. The wind direction is shown with anarrow pointing the azimuth from north (vertical) through east (horizontal to right) and the magnitudeis proportional to the length of the arrow and is also enhanced with a changing color scale. The earlymorning of 1 July shows the development of a low level jet (LLJ) which has proven to be stronglycoupled with pollution episodes and is suspected to be an important contributor of the air pollutionand precursor materials. At altitudes between 400 and 700 meters, the LLJ is seen to be presentthrough this night with a maximum near 4 AM local time, and this characteristic signature is foundon most nights preceding major ozone exceedences.

-17-
Figure 2-4. The horizontal wind field for the date of 1 July shows the development of a LLJ thatcontributed to the transport of pollutant materials from the south and west of Philadelphia during thenight (the time scale is UTC hours).
The acoustic portion of the Radar/RASS instrument also provides an additional data setwhich is valuable for determining the stability of the lower atmosphere. Figure 2-5 shows the virtualtemperature calculated from the speed of sound that is measured by using the Doppler radar to tracethe phase progression of a sound wave through the atmosphere. The virtual temperature differs fromthe true temperature because of the presence of water vapor which changes the specific heat of theatmospheric gas, however this parameter is more valuable for examining the dynamic stability of theatmosphere. The gas kinetic temperature can be easily calculated using the lidar measurements ofwater vapor. The set hourly profiles in Figure 2-5 clearly show the development and recovery fromthe nocturnal temperature inversion. The development of the nighttime inversion is a key factor inthe development of a stable boundary layer (positive temperature gradient) which decouples thesurface friction that is normally transferred through the lower atmosphere by the action of convectiveturbulence. The acoustic velocity measurements are made during the first 10 minutes of each hourand the wind field is measured during the remainder of each hour. As a complement to theRadar/RASS instrument, we also maintain a 10 meter meteorological tower which provides the basicparameters, an example from those measurements for the first week of July 2002 is shown in Figure2-6.

-18-
Figure 2-5. The virtual temperature measurements calculated form the measurements of thespeed of sound using the Radar/RASS instrument.
3. Key FindingsThe measurements and analysis performed during the Penn State University investigations
have primarily focused upon the remote sensing techniques using Raman lidar, Multi-staticLidar andRadar/RASS. A major contribution of the PSU efforts is to provide a useful data set that can be usedin a flexible way to test and develop atmospheric models. During 2002, the NEOPS-DEP data baseincluded eight significant events of particular interest for investigations of air pollution episodes.The unique contributions to the program include measurements of the vertical distribution of airpollutants, ozone and particulate matter, and the vertical profiles of the meteorological properties.The Raman lidar water vapor measurements provide an excellent tracer of the short term dynamicalprocesses and its gradients at the top of the PBL provide the best marker to study variations in thethickness of the planetary boundary layer. The growth of the daytime boundary layer, the thicknessvariations of the mixing region and the variation in the nighttime residual layer are best describedby these profiles. The Raman lidar time sequences can be used to study the extent of the dilutionvolume for the pollutants injected into the surface layer, and the downward mixing of aloft layers.The variations of the PBL thickness have been found to provide one of the most critical tests forevaluation of meteorological models. The results show that high levels of ozone are frequentlytransported in layers above the surface and go undetected by the ground-based sensors normally usedto measure ozone. The nighttime transport processes, such as the LLJ, frequently result in the layerdistributions of ozone, PM and precursor materials overhead that are mixed to the ground andprovide important contributions to the photochemical production of air pollution during the day.

-19-
The conclusion from these investigations is that most of the major air pollution episodesobserved in the Philadelphia area are meteorologically controlled and are associated with thetransport of pollutants and/or precursors from the Midwest region. During the summer 2002, as wellas for previous intensives, meteorology appears to be the principal driver that ultimately determineswhether or not a pollution event will occur. If the synoptic forcing is too strong, enhanced pressuregradients will inhibit the build up of trace gas concentrations by generating high winds, which serveto erode the interface between the boundary layer and the free atmosphere, and fumigate the localenvironment. On the other hand, if the synoptic forcing is weak, near-surface gradients createlocalized and regional circulations that remained largely confined to the boundary layer. Weaksynoptic systems respond to this boundary layer forcing to create deep daytime convective mixedlayers, shallow nocturnal boundary layers with embedded boundary layer jets, sea breeze fronts, andother convergence zones (e.g., leeside Appalachian trough) that have been observed, especiallyduring summer 1999 and 2002, to significantly modify the trace gas concentrations at the site.

-20-
Figure 2-6. Meteorological data that was measured in the first week of July 2002, NEOPS-DEP.

-21-
PART 3: CONTRIBUTIONS FROM PENN STATE UNIVERSITY
Examination of the Regional Scale Meteorology and Development of Forecasting Tools for Air Quality
William F. RyanDepartment of Meteorology, The Pennsylvania State University
Data Collected:1. Daily archive of critical observations and forecast information. This archive includes:
a. NCEP surface and upper air weather chartsb. 1200 UTC radiosonde observations and images.c. Hourly surface data from first order NWS stations in the regiond. Weather discussions and forecasts from local NWS forecast officese. Air quality forecasts and discussionsf. A set of forecast images from the Eta and the PSU MM5g. Three times daily satellite and regional radar images.This archive has been posted to the NEOPS web site
2. Summary of meteorological conditions during the NEOPS-2002 IOPs. This summary is providedin the form of a web page with embedded links. This archive has been posted to the NEOPS website. 3. Hourly analysis fields (GRIB format) from the NCEP RUC2 model for the major pollutionepisodes of 2002. This data is stored on CD but is available upon request.
Hypothesis R1: During the summer season, periods of high O3 are coincident with high PM2.5
events and this coincidence allows accurate forecasts of high PM2.5 events.
Discussion: PM2.5 concentrations, in the summer season in the Philadelphia area, are generally wellcorrelated with O3 concentrations (Figure 3-1). PM2.5 concentrations at or just above the CodeOrange threshold (40 :gm-3) may occur in the absence of high O3 concentrations but the highestPM2.5 cases (with the exception of July 4th which introduce an artifact due to fireworks displays, andin the cases of smoke from forest fires such as the 6-7 July 2002 period) are always associated withan extended high O3 period (Figure 3-2). While high PM2.5 and high O3 episodes occur in concert,the timing of the onset/termination of peak concentrations for each pollutant is often notsimultaneous. From the set of cases during the 1999, 2001 and 2002 NEOPS campaigns, it appearsthat the onset of the most significant PM2.5 events are accompanied by a transition to westerlytransport in the boundary layer (Figure 3-3). Weather conducive to photo-chemistry, coupled withlocal stagnation/re-circulation can cause rapid increases in O3 with peak concentrations reaching theCode Red range in the absence of a significant westerly transport component (e.g., August 1-4,2002). In these conditions, PM2.5 concentrations rise as well but are typically limited to the 30-40:gm-3 range. Once the transport pattern shifts to westerly, however, PM2.5 concentration risesrapidly. Cases exhibiting this rapid transition include July 19, 1999, July 2 and July 18, 2002. Onat least one occasion (July 1-3, 1999) sustained westerly transport in a well-mixed boundary layerwith strong wind leads to PM2.5 concentrations well into the Code Orange range with little or no O3signal (see Tables 3.2 and 3.3 for the adopted color code assignments). For forecast concerns, itappears that our understanding of the formation of O3 episodes will assist in forecasting PM2.5 inassociation with knowledge of the wind and transport fields.

-22-
Hypothesis R2. The nocturnal low level jet acts as a conveyor of pollutants into the Philadelphiaarea during high PM2.5 and O3 events.
Discussion: The nocturnal low level jet frequently occurs in concert with O3 pollution episodes.From mid-June to mid-August, 2002, peak 1-hour O3 in the PHL area exceeded 100 ppbv on 19 of21 cases where LLJs were observed. This represents two-thirds of all cases exceeding 100 ppbvduring that period. As shown in Table 3-1 (from MS thesis of Verghese), the LLJ’s were found tobe simultaneously present at the three sites in the region where such measurements are available.The four most significant PM2.5 events during 2002 also occurred during LLJ conditions. Theassociation of the LLJ with pollution events does not necessarily imply causation. The weatherpatterns that are conducive to the formation of the coastal plain LLJ (weak synoptic scale winds,surface high pressure stationary over the region, warm temperatures) are also conducive to pollutionevents (Figure 3-4). However, lidar observations during 2002 showed that O3 concentrations can beenhanced within the layer affected by the low level jet (Figures 3-5 and 3-6). Continuing researchon the results from 2002 will seek to quantify this effect by determining the concentrations of O3and other parameters within the LLJ. (Provisional title: The Eastern Coastal Plain Low Level Jet:Identification, frequency of occurrence and influence on local and regional air quality, Ryan, W. F.,R. D. Clark, S. Verghese and R. Philbrick).
Table 3-1. Table of occurrence of nocturnal low level jets during NEOPS-DEP 2002.

-23-
A more restrictive criteria for LLJ’s has been proposed which appears to better define thelocation and character of the jet is the thesis of Verghese (2003). Because the LLJ core is typicallyonly a couple of hundred of meters thick and residing in the residual layer at the top of the nocturnalinversion, models have difficulty simulating detailed its characteristics. Many model sensitivityexperiments have been run that reasonably simulate the general features of the LLJ, such as thecharacteristic inertial oscillation, the timing of the LLJ, and its height AGL. However the maximumspeed and timing of the speed maximum are only approximately modeled. Unfortunately, thesedetails are too often a manifestation of the choice of the boundary layer parameters and the choiceof the vertical and horizontal grid resolution. The model treatment of the diffusion of energy andmomentum in both the vertical and horizontal planes depends greatly on the parameterization. Theresult depends on how it handles the second and third order terms in the momentum or TKEequations. In the shallow shear zones above and below the layer of maximum winds, second orderterms can dominate the transfer of momentum away from the jet core. These inherently non-lineareffects have not been adequately captured by numerical mesoscale models. As a consequence, theLLJ is simulated with too broad a layer for the maximum winds, or with speeds that do not agreewith those observed. If the BL parameterization results in lesser wind speeds, then the Coriolis forceaffecting the inertial oscillation and the ageostrophic wind components are weaker. The reverseoccurs with stronger wind speeds. This condition will affect the assumptions made about LLJtransport, as well as the timing and concentration of the mixing process on the morning followinga LLJ episode, and ultimately the prediction of trace gas concentration the following day. Moreover,the horizontal extent of the simulated LLJ has not been verified by observation.
The coastal low level jet (LLJ) has not been systematically studied to date. It is only withthe onset of the radar profilers that we can routinely observe the jet at discrete locations. Along theI-95 Corridor, the LLJ is observed as a nocturnal phenomenon, persisting for 6-8 hours, limited tothe 200-800 m vertical layer with peak winds on the order of 10-15 ms-1. The profiler network,however, is inadequate to determine the full regional extent of the jet. Dynamical considerationssuggest that this feature is limited to the coastal plain but the westward extension of the jet is stillunknown. Previous observations from Arendtsville in southeastern PA during the NARSTOcampaigns in 1995 and 1996 observed the LLJ at least as far west as that location. Based on limitedresults from the 2003 season, the higher resolution numerical weather prediction models from NCEP(at 12 km resolution) appear to capture some of the LLJ features.
The key findings of the NEOPS study are that the LLJ is frequently associated with periodsof high O3 and PM2.5 and, most importantly, that the air mass transported by the jet is laden with O3,precursors and fine particles. Because the full horizontal extent of the area affected by the LLJ isunknown, the source of chemical species within the jet is not exactly known. However, the primarywind direction within the jet is southwestward, with a slow turning to the west during the earlymorning hours. For PHL, this suggests that the source of the air within the jet is intra-regional innature and likely from locations south of PHL and west of the I-95 Corridor.
It is important to note that the LLJ is an intermittent phenomenon that is embedded withina larger synoptic scale flow pattern. As has been known for several years, the characteristic synopticscale transport pattern (on the scale of days, from the surface through the depth of the well mixedlayer) during high O3 events in the mid-Atlantic is west to east. This synoptic scale flow accountsfor the increase in regional scale O3 that accompanies Code Red episodes in the PHL area. The LLJis embedded within the synoptic scale flow along the coastal plain at levels from 200-800 m and for

-24-
a portion of the overnight hours. As a result, while the synoptic scale flow from west to east sets theregional load, the LLJ appears to be a mechanism for transporting “dirty” air within the region.
Aircraft studies and longer term observations from the elevated O3 monitors at ShenandoahNP have shown that, during multi-day O3 episodes in the mid-Atlantic, the regional scale O3concentrations are on the order of 80-100 ppbv or more. These results are corroborated by theNEOPS study with the additional of high resolution observations of the elevated plume of pollutedair actually entering the PHL area. In addition, the NEOPS results show that enhanced summerseason PM2.5 concentrations are also associated with a similar transport pattern. The results fromthe 1999-2002 campaigns show that while local emissions in a relatively stagnant air mass can causePM2.5 concentrations to reach the 40 :gm-3 range (Code Orange for PM2.5), excursions into higherconcentrations require the additional regional component. Meteorological analysis during theNEOPS campaigns show that the increased PM2.5 concentrations during these event follow thetransition to westerly transport sources.
Meteorological Analysis:The details of the meteorological analysis of the events is maintained on the project web site and byWilliam F. Ryan, The Pennsylvania State University Department of Meteorology, [email protected] http://www.atmos.umd.edu/~forecaster/summary_2002.htm
Table 3-2. Explanation of Ozone Color Code Assignment
Color Code Ozone Concentration (ppbv)
green 0 - 60
light yellow 61 - 79
dark yellow 80 - 99
light orange 100-110
dark orange 111-124
red 125+
Table 3-3. Explanation of PM Color Code Assignment
Color Code PM Concentration (:g/m3)
Green 0 - 15.4
Yellow 15.5 - 40.4
Orange 40.5 - 65.4
Red 65.5 - 150.4
Purple >150.5

-25-
Figure 3-1. Peak 8-hour O3 for the Philadelphia non-attainment area and peak 24-hour PM2.5concentrations for the Washington DC – Philadelphia Corridor. PM2.5 concentrations are from thestate operated FRM monitors.
Figure 3-2. Ozone concentrations and 24-hour running mean PM2.5 for the NEOPS-DEP2002campaign at the Baxter Water Treatment Center in North Philadelphia (Phillip Hopke, ClarksonUniversity and Richard Clark, Millersville University).

-26-
Figure 3-3. HYSPLIT backtrajectories from NOAA(http://www.arl.noaa.gov/ready/hysplit4.html) during thehighest PM2.5 cases observedduring the 1999 NEOPScampaign. Back trajectoriesinitiate at the NEOPS site inPhiladelphia at 1000 m agland are run for 24 hours.Meteorological data isprovided by the Eta DataAssimilation System (EDAS).
Figure 3-4. NCEP surface weather analysis for 1200 UTC on July 2, 2002.

-27-
Figure 3-5. Wind profiler time series from the NEOPS Baxter site, July 2, 2002. The low level jetis seen during the hours from ~ 0000-1300 UTC with a maximum near 0700 UTC.
Figure 3-6. Lidarmeasurements ofozone on 2 July 2002show the variation ofozone aloft during thenight when it is carriedinto the region bytransport that isaugmented by the LLJ.
-28-
PART 4: CONTRIBUTIONS FROM MILLERSVILLE UNIVERSITY
Boundary Layer Meteorology Influences on Air QualityRichard D. Clark
Department of Earth Sciences, Millersville University
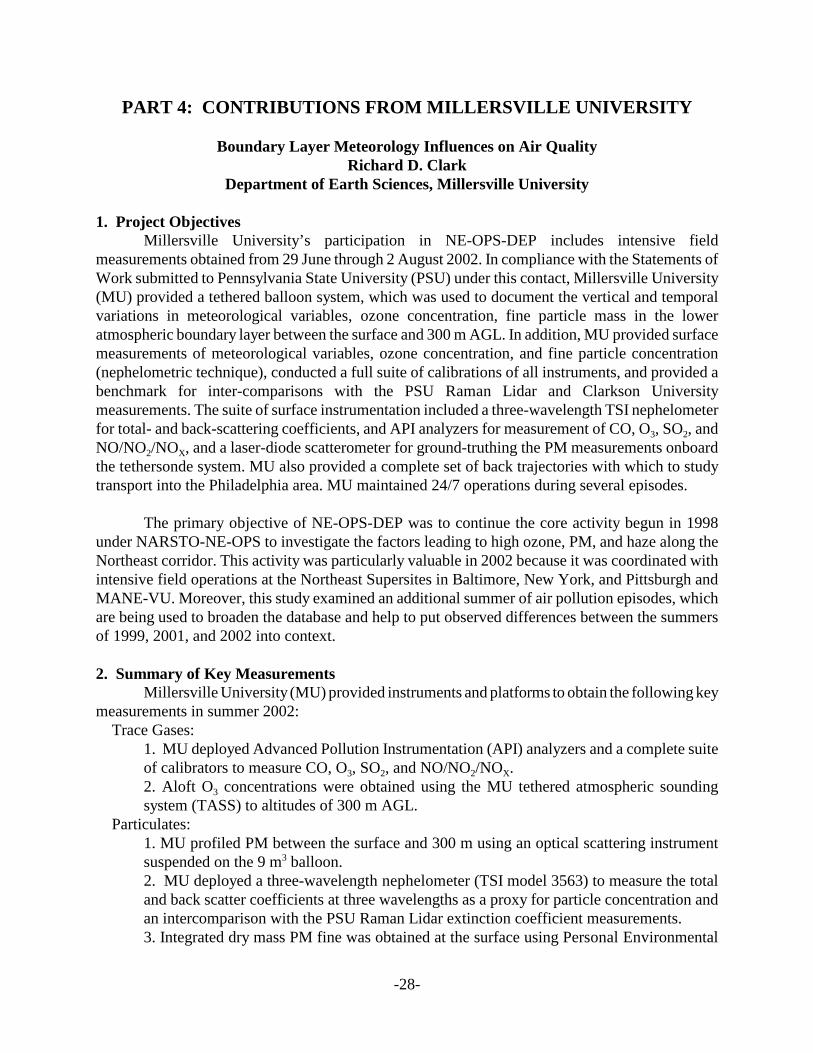
1. Project ObjectivesMillersville University’s participation in NE-OPS-DEP includes intensive field
measurements obtained from 29 June through 2 August 2002. In compliance with the Statements ofWork submitted to Pennsylvania State University (PSU) under this contact, Millersville University(MU) provided a tethered balloon system, which was used to document the vertical and temporalvariations in meteorological variables, ozone concentration, fine particle mass in the loweratmospheric boundary layer between the surface and 300 m AGL. In addition, MU provided surfacemeasurements of meteorological variables, ozone concentration, and fine particle concentration(nephelometric technique), conducted a full suite of calibrations of all instruments, and provided abenchmark for inter-comparisons with the PSU Raman Lidar and Clarkson Universitymeasurements. The suite of surface instrumentation included a three-wavelength TSI nephelometerfor total- and back-scattering coefficients, and API analyzers for measurement of CO, O3, SO2, andNO/NO2/NOX, and a laser-diode scatterometer for ground-truthing the PM measurements onboardthe tethersonde system. MU also provided a complete set of back trajectories with which to studytransport into the Philadelphia area. MU maintained 24/7 operations during several episodes.
The primary objective of NE-OPS-DEP was to continue the core activity begun in 1998under NARSTO-NE-OPS to investigate the factors leading to high ozone, PM, and haze along theNortheast corridor. This activity was particularly valuable in 2002 because it was coordinated withintensive field operations at the Northeast Supersites in Baltimore, New York, and Pittsburgh andMANE-VU. Moreover, this study examined an additional summer of air pollution episodes, whichare being used to broaden the database and help to put observed differences between the summersof 1999, 2001, and 2002 into context.
2. Summary of Key MeasurementsMillersville University (MU) provided instruments and platforms to obtain the following key
measurements in summer 2002: Trace Gases:
1. MU deployed Advanced Pollution Instrumentation (API) analyzers and a complete suiteof calibrators to measure CO, O3, SO2, and NO/NO2/NOX.2. Aloft O3 concentrations were obtained using the MU tethered atmospheric soundingsystem (TASS) to altitudes of 300 m AGL.
Particulates:1. MU profiled PM between the surface and 300 m using an optical scattering instrumentsuspended on the 9 m3 balloon.2. MU deployed a three-wavelength nephelometer (TSI model 3563) to measure the totaland back scatter coefficients at three wavelengths as a proxy for particle concentration andan intercomparison with the PSU Raman Lidar extinction coefficient measurements.3. Integrated dry mass PM fine was obtained at the surface using Personal Environmental

-29-
Monitors (PEMs, SKC Inc.) This was part of an internal effort to try to speciate PM fineusing dual-polarized microscopy.
Meteorological Variables:Meteorological variables (ambient temperature, pressure, water vapor mixing ratio, windspeed and wind direction) were obtained as a function of height (300 m AGL) and time usingthe TASS.
Real-Time Regional and Synoptic Data Archive:1. MU provided the real-time and archived data for the project, which included U.S. upperair data at 00 and 12 UTC; U.S. hourly surface station data; Initialization and forecast fieldsfor both the Meso-Eta and RUC model data; Base reflectivity and velocity data from the FortDix WSR-88D radar; Visible and IR satellite imagery.2. Derived back-trajectories at 500, 2000, and 5000m using the HYSPLIT processor.
3. Key Activities of Millersville UniversityMU provided a research team (PI-Clark plus four student research assistants), a mobile
atmospheric/environmental lab, a tethered balloon sounding system, which included a full suite ofinstruments and sensors for aloft measurements, surface-based instruments to measuremeteorological variables, trace gas concentrations, PM concentrations by proxy, and total and backscatter coefficients for the period from 29 June through 2 August at the Northeast PhiladelphiaBaxter Site (N 40o 03’, W 75o 00’). The period was selected to run concurrently with the PMSupersite intensives in Baltimore, New York, and Pittsburgh, and MANE-VU in the Northeast.
Over the five-week period, MU obtained a total of 562 vertical profiles of the loweratmospheric boundary layer between the surface and 300 m using the TASS. Figure 4-1 shows thedaily distribution of these profiles. Each profile consists of a record of temperature, pressure, derivedaltitude, relative humidity, derived specific humidity, wind speed, wind direction, ozoneconcentration, and PM concentration derived from measurements of scattering. The profiles wereobtained with a temporal resolution of about 30 minutes, and a vertical (spatial) resolution of about3 meters in altitude; an example of a typical vertical profile in shown in Figure 4-2. During episodesthe TASS was operated continuously, daytime and nighttime, to capture the full evolution of thelower boundary layer. While the field project was underway, MU was archiving 00 UTC and 12UTC upper air data, hourly surface station observations, Meso-Eta and RUC model initializationsand forecasts fields, radar and satellite imagery, and back trajectories for the project duration. Thesedata were used to put the Philadelphia measurements into a regional and synoptic context for a betterunderstanding of the contributions from extended transport and source-receptor relationships. Inaddition, Meso-Eta model initial fields were downloaded on site and used with an application(Bufkit) to nowcasting and project forecasts. These archives are available to all investigators.
In addition to the aloft measurements, MU provided a suite of surface instruments to recordone-minute averages of trace gases (CO, O3, SO2, and NO/NO2/NOX), and total and back scattercoefficients at three wavelengths (Figures 4-3 and 4-4) from 29 June through 6 August 2002. Thesemeasurements were used to provide a record of daily trace gas concentrations at the Baxter site, aswell as to compare regional concentrations with DEP monitoring sites and to support the operationsof the PSU and Clarkson groups.

-30-
Figure 4-1. The number of vertical profiles performed per day using the MU-TASS
4. Key Findings and ConclusionsTable 4-1 summarizes the episodes documented during the summer NEOPS-DEP2002 field
project. For each of these episodes, aloft and surface measurements obtained by MU were used tocharacterize the lower boundary layer. The event codes have been explained previously in Tables3-2 and 3-3.
The typical mid-Atlantic daytime condition in summer in the absence of strong synopticforcing is one of near-surface pressure gradients being established by differential heating generatedby the land-water discontinuities, and enhanced by the slopes along the piedmont in the lee of theAppalachian Mountains. This boundary layer forcing produces significant baroclinicity in the lowertroposphere that diminishes with height. The resulting pressure field is oriented parallel to andbetween the mountains and the coastline with a pressure gradient force vector directed toward thenorthwest, and a resulting southerly to southwesterly geostrophic wind decreasing with height (i.e.the thermal wind reverses and diminishes with height). Under these weak synoptic conditions,mixed layers can develop to thicknesses as much as 2 km (more typically around 1.5 km), sea breezeconvergence zones strengthen and encroach inland, low level wind maxima establish around sunsetand evolve overnight, and the Appalachian leeside trough intensifies by day and subsides at night.Under weak synoptic conditions the entire mid-Atlantic region, including the I-95 corridor, isstrongly influenced by undulating local and regional (mesoscale) circulations.

-31-
Figu
re 4
-2. E
xam
ple
of m
easu
rem
ents
take
n w
ith se
nsor
s onb
oard
the
MU
-TA
SS

-32-
Figu
re 4
-3.
Exam
ples
of o
ne-m
inut
e av
erag
es o
f tra
ce g
ases
mea
sure
d by
MU
API
Ana
lyze
rs.

-33-
Figu
re 4
-4.
Exam
ple
of o
ne-m
inut
e av
erag
es o
f sca
tter c
oeff
icie
nts o
btai
ned
with
the
MU
TSI
Nep
helo
met
er.

-34-
Table 4-1. Summary of the 2002 Episodes
The influence of the sea breeze convergence zone on the air chemistry at the Philadelphia sitewas documented on three occasions in 2002. During the passage of a sea breeze front, ozoneconcentrations will generally decrease rapidly, often by a factor of two, while PM “wet”concentrations increase due to the activation of sub-micron aerosols to sizes that can be detected bylaser-diode scatterometers in the moist air mass. Sea breezes are typically fumigation events, andtheir timing and subgrid-scale characteristics are still poorly modeled. Millersville Universitycaptured several strong sea breeze frontal passages in 1999 and 2002. Each was distinct from theother, and the consequences, were very difficult to predict even a short time before passage. Whilemost sea breezes are considered beneficial to air quality in that they reduce the trace gasconcentrations by replacing polluted urban air with cleaner maritime air, on one occasion (see Figs.4-2 to 4-4 and note arrow at 2000 EDT), the sea breeze resulted in an increase in trace gasconcentrations at the site. Analysis showed this event to be caused by a slight change in winddirection from ENE to ESE, but this was enough to modify the transport of air from a fetch alongnorth-central NJ where the air was cleaner, to air being brought in from the Atlantic coastal region,where on this hot Saturday in July, the traffic due to weekend visits to the NJ and DE shores appearsto be responsible for the deterioration in the quality of this air mass. The total change in winddirection was only about 20o, which resulted in a 2-fold increase in SO2, 3-fold increase in NOX, anda 50% increase in O3 concentrations. More typical of the sea breeze front would be a decrease inthese trace gas concentrations by similar amounts, accompanying 90o shifts in wind direction fromsoutherly to easterly.

-35-
Another recurring feature of the summertime mesoscale environment along the northeastcorridor is the nocturnal LLJ. Nocturnal low-level jets (LLJ) are known to transport significantquantities of precursors, pollutants, and particulates great distances, and contribute to increases intrace gas and particulate concentrations in areas where the local production may not have otherwiseyielded exceedances. The tethersonde systems in conjunction with the lidar and wind profilermeasurements provided a detailed characterization of the transport and subsequent mixing processesthat were associated with LLJs. While there remain many uncertainties regarding the horizontalextent of the LLJ, delineation of the vertical structure based on the NE-OPS field experiment showsthat the LLJ forms under clear sky conditions in the presence of a quasi-stationary anticyclone, whichallows for a maximal amount of differential heating between the coast regions and the Appalachianleeside. LLJs forming over the mid-Atlantic are generally confined to a layer between 400-800meters AGL, where they reside on top of the nocturnal inversion within the remnants of the previousday’s convective mixed layer (residual layer). Within this “residual” layer, winds have been observedby the Philadelphia profiler to reach speeds approaching 15 m/s. Northeast LLJs, like their better-known Great Plains counterparts, are boundary-layer-forced low-level wind maxima, and as such,exhibit the distinctive inertial oscillation cause by the action of Coriolis force on the ageostrophicwind component. This characteristic rotation of the wind field is important to air chemistry becauseof its ability to change the trajectories of air parcels reaching the site from upstream locations. Thisis a persistent feature of the LLJ that is easily resolved in the EPA HYSPLIT back trajectories as wellas in the wind profiler data obtained at the site. Both data sets are included as part of the NEOPS-DEP2002 database.
Under typical summertime conditions where the mid-Atlantic region is under the influenceof the subtropical Bermuda High and the upper level dynamics are weak, i.e., nearly barotropic, asoutherly to southwesterly LLJ will develop around sunset concurrent with the development of thesurface nocturnal inversion and the cessation of turbulence. Over the nighttime period, the LLJ cantransport a significant quantity of polluted air from Baltimore-Washington DC urban plumes northto northeastward along the I-95 corridor. By 0100-0400 local time, the wind field has undergone aninertial rotation to become more westerly such that upstream trajectories indicate the transport ofozone and precursors that are more characteristic of the western boundary. Measurements of watervapor content using the PSU lidar shows that this air is much drier than air originating from thesouth, partly because it is continental air, and partly because westerly flow will result in downslopingon the leeside of the Appalachians, where air can dry out during adiabatic descent (compression).Other findings associated with LLJ phenomena are the “bursting” events that occur in the earlymorning hours that result from mechanical (dynamical) instabilities in the shear zones below thelayer of maximum winds. These bursting events vertically mix ozone to the surface even in thepresence of thermal stability causing increases in ozone concentrations on the order of 20-30 ppbvin the absence of local production and solar insolation.
The rapid onset of mixing and the concurrent rapid rise in ozone was observed in a numberof cases in both 1999 and 2002. Transport appears as a significant contributor to the high surfacelevel ozone concentrations. The PSU lidar indicates as much as 80 ppbv ozone can be confined tothe residual layer during nighttime periods, wind profiler measurements at the NEOPS site place theLLJ within the residual layer, and tethered balloon measurements document a very rapid mixingbetween the surface and the residual layer in the morning hours just after sunrise. Based on these

-36-
episodic measurement periods, the conceptual model that follows suggests that as much as 30-50%of the surface level ozone could have been transported over the site by the LLJ and mixed down tothe surface the following morning. The observed increase in ozone concentrations is too large to beaccounted for on the basis of NOX reactions alone (Kleinman). Moreover, in every case where > 100ppbv ozone concentrations were observed, a LLJ was embedded in the nocturnal BL. The staticstability of the nocturnal inversion prevents ozone from mixing to the surface at night, except duringperiodic “bursting events” that can occur when vertical wind shear brings creates short-lived pocketsof mechanical instability and turbulence. Observations of surface ozone and its precursors reveal asudden increase in ozone at times when production should be nonexistent (0200 – 0400 EDT), andan attendant increase in the ambient temperature as warmer air mixes down. These bursts signal therelease of mechanical instability in the shear zone below the layer of maximum winds.
Combined measurements from the PSU lidar, wind profiler/RASS, and tethered balloonsystem provide a robust characterization of the effects of local and regional circulations on the tracegas and particulate matter concentrations at the Philadelphia site. These observations provide criticalinput for model validations attempting to simulate boundary layer growth and decay and the all-important transition periods, especially during the rapid development of the daytime mixed layerbecause of its relationship to the forecasts of ozone and PM2.5. Numerous model validationexperiments have been carried out using an initialization that leads to the development of a nocturnaljet. In fact, because of its conceptually straightforward dynamics relative to more complexmeteorological phenomena, including the fact that the phase change of the aerosol can be ignored,observations of LLJs have been used to validate models such as the Penn State/NCAR MM5 and itspredecessors since the early 1970s. MM5 has been a useful tool in predicting and diagnosingimportant features of LLJ, but still fail to resolve the details of momentum transport via turbulentfluxes and fall short of capturing the timing and intensity of the maximum winds. Moreover, betweenthe paucity of aloft observations of the nocturnal wind field over the northeast, partly due to thesparseness of a suitable 915 MHz profiler network for these types of studies, and also becausemodels can only approximately simulate the complex flows that are influenced by the convolutedterrain in the Appalachian leeside, the horizontal extent of the LLJ remains an area for study. Thenext generation mesoscale model, the Weather Research and Forecasting (WRF) modeling system,will soon replace the MM5 with improved physics and better parameterization schemes. WRF iscurrently undergoing testing by at a number of institutions, including Millersville University, andmay be our best vehicle to predict features of the LLJ that are important to air quality.
Regardless of the modeling system, our understanding of the LLJ and other subgrid scalephenomena such as the sea breeze front, which can have a dramatic affect air quality in the northeast,will always be subject to the model resolution and the appropriateness of the BL parameterizationto the problem at hand. Most important is the ability of the numerical system to handle the diffusionof momentum in stratified layers where shear is the dominant turbulence production mechanism, andto capture the timing and extent of the daytime mixed layer development. Recognizing that these areproblems endemic to any modeling system, it would be advisable to begin to develop ensemblemodeling of the LLJ and other local and regional circulations as is done in operational forecasting,allowing for an estimation of the quantitative uncertainty based on the ensemble. With modelscapable of being run on high-end and relatively low cost PCs, it would be prudent to considerestablishing a WRF forecast for the region with partners from institutions running WRF.

-37-
PART 5: CONTRIBUTIONS FROM CLARKSON UNIVERSITY
Measurements of Real-Time PM 2.5 Mass, Sulfate, and Carbonaceous AerosolsPhilip Hopke
Department of Chemistry, Clarkson University
Chemical species in PM 2.5 were measured in Philadelphia, Pennsylvania during July 2 toAugust 2, 2002. Continuous or semi-continuous concentrations of PM 2.5, organic carbon (OC),elemental carbon(EC), black carbon(BC), and sulfate were measured. Quartz filter samples wereanalyzed for filter-based OC/EC and sulfate. Sulfate concentrations were determined using a high-time resolution sulfate analyzer and ion chromatography (IC). BC concentrations were analyzedusing a two-wavelength Aethalometer. Continuous PM 2.5 mass concentrations were obtained everyten minutes by using a 30oC Tapered Element Oscillating Microbalance (TEOM) ( Rupprecht andPatashnick, Albany, New York) with a sample equilibration system (SES) dryer. The 1400a TEOMwas configured with a PM10 head, a PM 2.5 sharp cut cyclone (SCC), a sample equilibration system(SES) dryer, and a tapered element oscillating microbalance, which directly measures particle masscollected on a filter by drawing ambient air through a filter at a constant flow rate, whilecontinuously weighing the filter and calculating rolling ten-minute smoothed mass concentrations.The SES is designed to reduce the possibility of PM mass concentrations being overestimated dueto the moisture affinity of some types of particles. Also, the SES allows the mass collected on thefilter to equilibrate more rapidly than when in the presence of high humidity levels. Thus, the TEOMmonitor operating at 30°C reduces the loss of semi-volatile organic compounds (SVOCs) in PM 2.5.
Carbonaceous materials in PM2.5 were measured by using three analyzers, a semi-continuousOC/EC field instrument (Sunset Laboratory, Forest Grove, Oregon, USA), a thermal-optical OC/EClaboratory instrument (Sunset Laboratory, Forest Grove, Oregon, USA), and a two-wave-lengthAethalometer (Magee Scientific, Berkeley, California, USA). The semi-continuous OC/EC fieldinstrument is based on the National Institute for Occupational Safety and Health (NIOSH) Method5040. The light transmittance monitored by the laser beam through filters was used for determininga split point that elemental carbon formed by pyrolysis from the elemental carbon that was originallyin the sample. To reduce uncertainties due to low concentration of elemental carbon, samples forthe field OC/EC instrument were collected for 105 minutes and were analyzed for 15 minutes everytwo hours. The FID response of the Sunset lab OCEC instrument was calibrated with micropipettedeposits on sample filters of sucrose solution after every third analysis to reduce the variability.
High time resolution black carbon (BC) concentrations were measured by using a two-wavelength Aethalometer (AE-20, Magee Scientific, Berkeley, California, USA) during themeasurement periods. Aerosol BC was measured using the Aethalometer with the opticalattenuation method since BC can strongly absorb light over a broad region of the near infrared ( =λ880 nm), and BC mass was obtained by determining the attenuation of light transmitted through asample filter. The specific attenuation coefficient ( ) is a critical parameter to convert attenuationσmeasurements to BC mass concentrations and manufacturer’s value is 16.6 m2 g-1. The two-wavelength Aethalometer has another wavelength beam (8 = 370 nm) to identify the presence ofcertain organic compounds such as polycyclic aromatic hydrocarbons (PAH) which strongly absorbUV wavelengths.

-38-
Five-minute averaged continuous sulfate concentrations were measured using a continuoussulfate analyzer originally designed by Harvard School of Public Health (HSPH) and built atClarkson University. The continuous sulfate analyzer consists of three main parts, a samplepretreatment system to segregate PM 2.5 using a VSCC, and then a sodium carbonate coated denuderis used to remove positive and negative interferences such as SO2, and the NOx is removed usinga carbon monolith. A heated stainless steel tube which reduces the particulate sulfate to SO2 wasoperated at around 700 °C. The converted SO2 gas was introduced into an SO2 analyzer (43C-TLS,Thermo Environmental Instruments Inc, Franklin, Massachusetts, USA). To quantify backgroundconcentrations, a zero purge system periodically supplied particle free air to the furnace and thereadings were used to determine the background concentration at that time.
1. Continuous and semi-continuous PM2.5 measurement and analysisThe variations of PM2.5, semi-continuous OC/EC, and continuous sulfate concentrations
measured in Philadelphia are shown in Figure 5-1. Note that the periods corresponding to amalfunction of the continuous sulfate analyzer from July 2-5 and the unusual Canadian forest fireepisode observed in Philadelphia during July 6-9, 2002 were excluded from Figure 5-1. InPhiladelphia, the highest PM2.5 was observed around 3 PM on July 19 with a mean of 93 µg m-3, seeFigure 5-1. Several high peaks, which were strongly correlated with higher sulfate concentrations,have been associated with severe summer haze, when the maximum sulfate concentration (52 µgm-3) and the highest PM2.5 concentrations were observed. The haze episodes corresponded to periodswhen the PM2.5 aerosol in Philadelphia contains an increased average mass fraction of sulfate. Incontrast to the sulfate results, there was no significant correlation between OC and haze episodes.The higher OC levels with a mean of 10 µg m-3 were observed on July 17 and 18 while the highestEC occurred at 7 a.m. July 17 with a mean of 2.3 µg m-3. However, the residuals between the totalPM2.5 and the sum of three chemical species increased during the haze associated with high PM2.5mass concentrations at the site. The differences probably indicate that the organic mass (OM),obtained by multiplying the measured OC concentrations by the typical value of 1.4, significantlyincreased during the haze episode. These results are consistent with the presence of increasedconcentrations of secondary organic aerosols (SOA).
The daily average measurements mass concentrations and standard errors of PM2.5, semi-continuous carbonaceous species, BC, and continuous sulfate concentrations measured inPhiladelphia are presented in Table 5-1. OC accounted for 21% of the mass concentration of PM2.5while sulfate accounted for 37 %, which is primarily due to the frequent haze episodes inPhiladelphia. During the most severe haze period July 17 to July 19, 2002, sulfate concentrationsranged from 5 to 32 µg m-3 with a mean of 20 µg m-3. By comparison, the mean sulfateconcentration during the study period, excepting this large haze episode, ranged from 2 to 16 µg m-3
with a mean of 7 µg m-3, which is only 35% of the mean concentration during the haze episode. InPhiladelphia, sulfate was most dominant chemical component, among the four measured species,in the PM2.5.
The average EC concentrations were relatively very low and only accounted for less than 2%of the PM2.5 mass concentration. The concentrations of Aethalometer BC using manufacturerabsorption efficient, 16.6 m2 g-1 ranged from 0.1 to 3.1 µg m-3. The highest peak of BC wasobserved at 3 AM July 17 when PM2.5 was only 14 µg m-3. During the haze episodes BC valueswere only weakly correlated with PM2.5 or sulfate values.

-39-
Figure 5-1. Two-hourly variations of the chemical compositions of PM2.5 measured inPhiladelphia, PA during the summer of 2002.
Table 5-1. Statistical values of total PM2.5, semi-continuous carbonaceous PM2.5, continuoussulfate concentrations in Philadelphia, PA.
Measurement period 7/10 - 8/2/2002
PM2.5 (µg m -3 ) 22.1 ± 1.0
OC (µg m-3) 4.7 ± 0.1
EC (µg m-3) 0.3 ± 0.02
BC ( µg m-3) 0.6 ± 0.03
Sulfate (µg m-3) 8.1 ± 0.6
Valid sample number 238

-40-
2. Variations of carbonaceous compound concentrations.Diurnal variations of OC and EC are shown in Figure 5-2. Although EC concentrations were
relatively lower than OC, the observed pattern clearly supports the conclusion that ECconcentrations were strongly correlated with morning rush-hour period between 7 AM and 9 AMlocal time. The morning peak is due to motor vehicle emissions accumulated within the thinmorning boundary layer (typically 300-500 m), which results in a smaller mixing volume, andduring generally calm conditions, which limit horizontal transport and diffusion. The evening rush-hour peaks between 5 PM and 7 PM local time were relatively weak. It is likely that particulatematter is more highly dispersed during that time of day since mixing layer height in summer istypically maximum (2-3 km) from 3 PM to 5 PM local time. In contrast to EC, there was no clearpattern of OC concentrations as a function of time of day. It is expected that sources of OC are lessrelated to traffic sources, and are linked with a variety of stationary sources and with processes offormation of secondary organic aerosol(SOA) during the afternoon.
Diurnal variations of BC obtained during weekdays and weekends are shown in Figure 5-3.The peak values were observed during the morning rush-hour with the highest concentration near6 AM local time on weekdays. There was no significant diurnal variation of BC during weekends.The variations of BC are strongly correlated with motor vehicles and the mixing volume of themorning boundary layer, similar to the EC concentration variations. The mean BC during weekdaysranged from 0.1 to 2.4 µg m-3 and the mean was a factor of about 3 times higher than the mean BCduring weekends.
3. Comparison of PM2.5 mass and chemical species Correlations between PM2.5 mass concentrations measured using a 30°C TEOM with SES,
filter-based sulfate, semi-continuous carbonaceous compounds, and an Aethalometer for BC aresummarized in Table 5-2. Each two hour integrated carbonaceous aerosol concentration and onehour average Aethalometer BC were compared with PM2.5 during the same period. Also, the sulfateconcentrations were compared with the PM2.5 as twenty four-hour integrated averages during thestudy period (thus many fewer pairs in Table 5-2). Results of a major Canadian forest fire aerosolepisode from July 6 to 9 were excluded because unusual values were observed. Table 5-2 showsthat TC and OC concentrations were better correlated with PM2.5 mass concentrations (r2 = 0.62,slope = 0.1) than were the EC concentrations. Aethalometer BC concentrations were only poorlycorrelated with the PM2.5 mass concentrations. The best correlation was found between PM2.5 massand filter-based sulfate concentrations (r2 = 0.96). The correlations between real-time PM2.5 massconcentrations and continuous sulfate concentrations are shown in Figure 5-4 (r2 = 0.88). Theseresults further demonstrate that the formation of sulfate from photochemical reactions of SO2 causethe dramatic increases of PM 2.5 mass in the region.

-41-
Figure 5-2. Temporal variations of semi-continuous OC and EC measured in Philadelphia, PAduring the summer of 2002.
Table 5-2. Statistical summary of correlation between PM2.5 mass and semi-continuous OC, EC,Aethalometer BC, and filter-based sulfate measurements in Philadelphia, PA.
Slope (±SE) + intercept(± SE) Correlation (r2) Number of Pairs
PM2.5
TC 0.11(±0.01)+ 2.63(±0.15) 0.62 238
OC 0.10(±0.01)+ 2.43(±0.14) 0.63 238
EC 0.01(±0.00)+ 0.20(± 0.03) 0.13 238
BC 0.02(±0.00)+ 0.27(±0.02) 0.36 519
2-4SO 0.51(±0.03)- 2.49(±0.69) 0.96 24

-42-
Figure 5-4. Correlation between real-time PM2.5 concentrations and sulfate concentrationsmeasured using a continuous sulfate analyzer.
Figure 5-3. Diurnal variations of black carbon (BC) measured using a two-wavelengthAethalometer in Philadelphia, PA during the measurement period July 10 to August 2,2002.
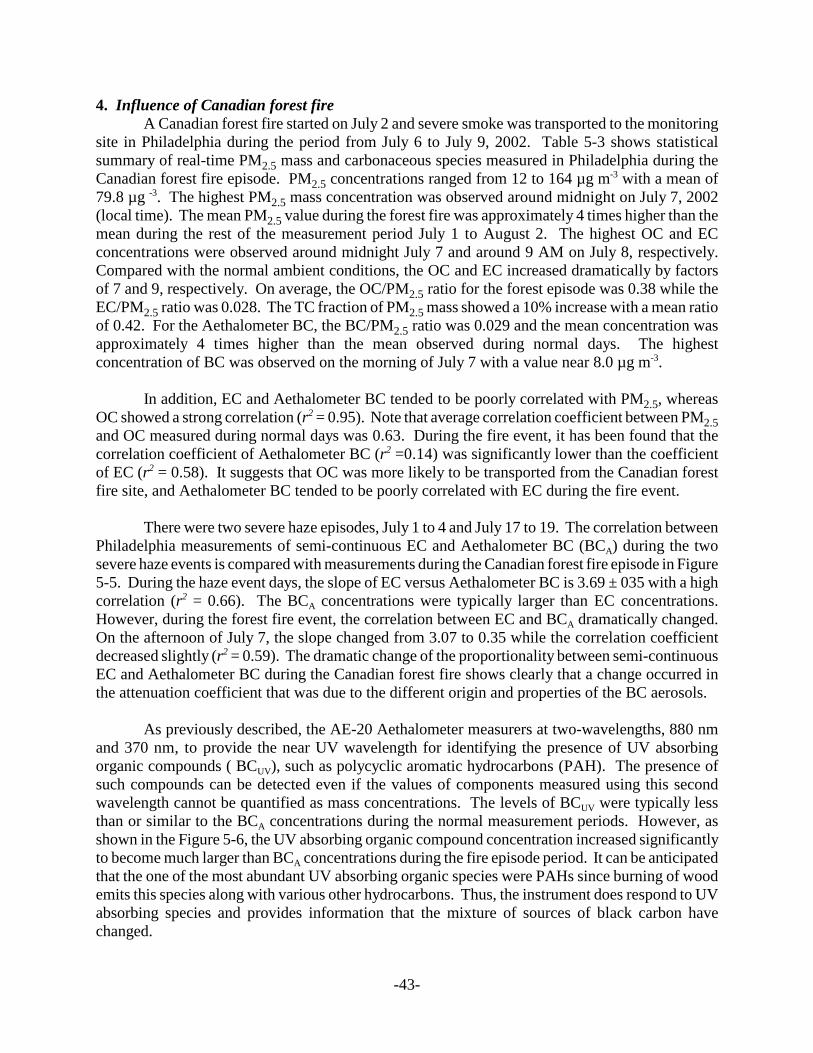
-43-
4. Influence of Canadian forest fireA Canadian forest fire started on July 2 and severe smoke was transported to the monitoring
site in Philadelphia during the period from July 6 to July 9, 2002. Table 5-3 shows statisticalsummary of real-time PM2.5 mass and carbonaceous species measured in Philadelphia during theCanadian forest fire episode. PM2.5 concentrations ranged from 12 to 164 µg m-3 with a mean of79.8 µg -3. The highest PM2.5 mass concentration was observed around midnight on July 7, 2002(local time). The mean PM2.5 value during the forest fire was approximately 4 times higher than themean during the rest of the measurement period July 1 to August 2. The highest OC and ECconcentrations were observed around midnight July 7 and around 9 AM on July 8, respectively.Compared with the normal ambient conditions, the OC and EC increased dramatically by factorsof 7 and 9, respectively. On average, the OC/PM2.5 ratio for the forest episode was 0.38 while theEC/PM2.5 ratio was 0.028. The TC fraction of PM2.5 mass showed a 10% increase with a mean ratioof 0.42. For the Aethalometer BC, the BC/PM2.5 ratio was 0.029 and the mean concentration wasapproximately 4 times higher than the mean observed during normal days. The highestconcentration of BC was observed on the morning of July 7 with a value near 8.0 µg m-3.
In addition, EC and Aethalometer BC tended to be poorly correlated with PM2.5, whereasOC showed a strong correlation (r2 = 0.95). Note that average correlation coefficient between PM2.5and OC measured during normal days was 0.63. During the fire event, it has been found that thecorrelation coefficient of Aethalometer BC (r2 =0.14) was significantly lower than the coefficientof EC (r2 = 0.58). It suggests that OC was more likely to be transported from the Canadian forestfire site, and Aethalometer BC tended to be poorly correlated with EC during the fire event.
There were two severe haze episodes, July 1 to 4 and July 17 to 19. The correlation betweenPhiladelphia measurements of semi-continuous EC and Aethalometer BC (BCA) during the twosevere haze events is compared with measurements during the Canadian forest fire episode in Figure5-5. During the haze event days, the slope of EC versus Aethalometer BC is 3.69 ± 035 with a highcorrelation (r2 = 0.66). The BCA concentrations were typically larger than EC concentrations.However, during the forest fire event, the correlation between EC and BCA dramatically changed.On the afternoon of July 7, the slope changed from 3.07 to 0.35 while the correlation coefficientdecreased slightly (r2 = 0.59). The dramatic change of the proportionality between semi-continuousEC and Aethalometer BC during the Canadian forest fire shows clearly that a change occurred inthe attenuation coefficient that was due to the different origin and properties of the BC aerosols.
As previously described, the AE-20 Aethalometer measurers at two-wavelengths, 880 nmand 370 nm, to provide the near UV wavelength for identifying the presence of UV absorbingorganic compounds ( BCUV), such as polycyclic aromatic hydrocarbons (PAH). The presence ofsuch compounds can be detected even if the values of components measured using this secondwavelength cannot be quantified as mass concentrations. The levels of BCUV were typically lessthan or similar to the BCA concentrations during the normal measurement periods. However, asshown in the Figure 5-6, the UV absorbing organic compound concentration increased significantlyto become much larger than BCA concentrations during the fire episode period. It can be anticipatedthat the one of the most abundant UV absorbing organic species were PAHs since burning of woodemits this species along with various other hydrocarbons. Thus, the instrument does respond to UVabsorbing species and provides information that the mixture of sources of black carbon havechanged.

-44-
Figure 5-5. Correlation between black carbon measured using the Aethalometer andelemental carbon measured the Sunset lab OC/EC analyzer during the severe hazeepisodes and the Canadian forest fire episode in Philadelphia, PA.
Table 5-3. Statistical summary of real-time PM2.5, semi-continuous OC and EC, continuousAethalometer BC in Philadelphia during the Canadian forest fire, July 6 to July 9, 2002.
PM2.5 (µg m-3)
Organic Carbon (µg m-3)
ElementalCarbon (µg m-3)
Black Carbon (µg m-3)
Mean 79.8 30.6 2.9 2.3
Standard Deviation 36.2 16.2 1.6 1.5
Standard Error 4.0 2.5 0.2 0.2
Minimum 12.0 3.1 0.1 0.3
Maximum 164.0 67.1 6.2 8.0
Valid number 82 41 41 82

-45-
Figure 5-6. Black carbon measured at 880 nm compared with measurement at 370 nm shows theadditional signal due to ultraviolet absorbing organic matter during the Canadian forest fires.
5. Comparison of daily filter-based samplesDaily variations of quartz filter-based concentrations of OC, EC, and sulfate and the twenty
four-hour average PM2.5 mass concentrations measured using the 30 °C TEOM with SES are shownin Figure 5-7. In contrast to the semi-continuous measurement result, the filter-based sulfateconcentrations collected during July 2 to 5 and the filter-based OC and EC obtained in Philadelphiaduring the Canadian forest fire period, July 6 to July 9, 2002 were included in the result.
OC, EC and sulfate in Philadelphia accounted for 55 %, 8 %, and 25 % of the PM2.5concentration. As shown in the bottom of Figure 5-7, the highest 24-hour average PM2.5 wasobserved on July 7 with a mean of 107.3 µg m-3 and the average PM2.5 during the two days, July 7and 8 exceeded the twenty-four hour average PM2.5 standard, 65 µg m-3. In addition, during thesevere haze episode on July 19, the sulfate concentrations dramatically increased from 22% to 51%of PM2.5 mass. Furthermore, OC concentrations dramatically increased during the Canadian forestfire, and the high mass fraction of OC in Philadelphia was influenced by the forest fire episode. The ratio of sums of three species, OC, EC, and sulfate to PM2.5 mass concentrations ranged from0.65 to 1.70 with a mean of 0.99. The sum tends to exceed to the PM2.5 when PM2.5 concentrationwas relatively low. The excess mass above PM2.5 concentrations measured using the 30oC TEOMwith SES was probably influenced by the positive interference of SVOCs. The particulate organicmass should be included to obtain actual species contribution to PM2.5 mass concentration, and itcan be estimated by multiplying the mass of OC by a factor of 1.2 ~ 2.1. The remainder of thePM2.5 mass, when compared with the sum of three measured components, is likely to be nitrate andcrustal material.

-46-
Figure 5-7. Temporal variations of filter-based measurements of organic carbon (OC), elementalcarbon (EC), sulfate and daily averaged PM2.5 mass concentrations in Philadelphia, PA.
6. Potential Source Contribution Function AnalysisPotential Source Contribution Function (PSCF) analysis combines particle data with air
parcel back trajectories to identify potential source areas and the preferred pathways that give riseto the observed high particle concentrations [Zeng, Y, and Hopke, P.K., Atmospheric Environment,1989, 23, 1499-1509; Cheng, M.D., Hopke, P.K., Zeng, Y., J. Geophys. Res.-Atmosphere 1993, 98,16839-16849]. Five day back trajectories arriving twelve times in a day at 500 m above the groundlevel were calculated using the NOAA HYSPLIT model [Draxler, R.R. and G.D. Hess, 1998, AnOverview of the Hysplit_4 Modeling System for Trajectories, Dispersion, and Deposition, Aust.Met. Mag., 47, 295-308 ]. The vertically mixed model starting at 500 m above the ground level wasused to calculate the five-day backward trajectories arriving at the mid-point of the two-hourintegration period..
Using the particle data consisting of PM2.5, bscat, OC, EC, and sulfate described in the priorsection, PSCF analyses were performed based on the average values as a criterion for the measuredparticle parameters. This procedure has been described in a number of prior publications [e.g.,Cheng, M.-D., Hopke, P.K., Barrie, L.; Rippe, A., Olson, M., Landsberger, S., Environ. Sci. Technol.1993, 27, 2063-2071; Hopke, P.K., Barrie, L.A., Li, S.-M., Cheng, M.-D., Li, C., Xie, Y., J.Geophys. Res., 1995, 100, 16595-16603] and the details of the calculation are omitted here, for moreinformation see Polissar et al. [Environ. Sci. Technol. 2001, 35, 4214-4226]. Air parcel backtrajectories are related to the composition of collected material by matching the time of arrival ofeach trajectory at the receptor site to the sampling time interval. The PSCF value for a single gridcell is calculated by counting the trajectory segment endpoints that terminate within that grid cell.The movement of an air parcel is described as segment end points of coordinates in terms of latitudeand longitude.

-47-
Five-day backward trajectories starting at the height of 500 m above the ground level werecomputed every hour producing 120 endpoints per sample. The geophysical region covered by thetrajectories was divided into 2664 grid cells of 1° × 1° latitude and longitude so that there areapproximately 42051 end points / 2664 cells or 16 trajectory end points per cell in average. In PSCFanalysis, it is likely that the small values of nij produce high PSCF values with high uncertainties.In order to minimize this artifact, an weight function W(nij) was applied when the number of the endpoints per a particular cell was less than about three times the average values of the end points percell [Polissar et al., 2001].
1.0 48
0.7 5 48
0.4 2 5
0.2 2
ij
ijij
ij
ij
nn
W(n )=nn
<⎧⎪ < ≤⎪⎨ < ≤⎪⎪ ≤⎩
ResultsThe PSCF results are displayed in the form of maps of the area of interest on which the PSCF
values are displayed in terms of a color scale, see Figures 5-8 through 5-12. The PSCF map forsulfate (Figure 5-8) shows influence of Midwestern coal-fired power plants in Ohio River Valley.Areas of peak influence are located in the western end of the river valley in southern Indiana andIllinois and northern Kentucky. This area of peak influence is about the same distance fromPhiladelphia as the upper Ohio River Valley, areas are from Underhill, VT where they were foundto have high influence [Polissar, A.V., Hopke, P.K., Poirot, R.L., Environ. Sci. Technol. 2001, 35,4604-4621]. Such behavior suggests that there are competitive processes between the chemicalconversion of SO2 6SO4 resulting in particle formation and dispersion and deposition of sulfur intransit. The area of potential influence includes the area around southern Lake Michigan and acrossnorthern Illinois.
Figure 5-9 shows that PM2.5 has a similar pattern with more trailing of the area of influenceinto the Gulf of Mexico. This additional area may represent the increased influence of humidity onPM2.5 mass. In the summer, it is unlikely that the nafion drier is fully drying the particles [Stanier,C., Khlystov, A.Y., Chan, W.R., Mandiro, M., Pandis, S.N., Aerosol Sci. Technol. 2003, in press].The conversion of SO2 6SO4 results in the formation of NH4HSO4 that is difficult to dewater. Thereis also a small area of high potential to the east of the southern end of Hudson’s Bay. This area willbe discussed subsequently along with the OC and EC maps.
The PSCF map for Bscat in Figure 5-10 shows an even greater influence of the Gulf of Mexicopotentially indicating an even greater effect of humidity on the measurements. There is no area inthe vicinity of Hudson’s Bay corresponding to the area in that appears in the PM2.5 map. OC andEC (see Figures 5-11 and 5-12) have the largest areas in the region to the east of Hudson’s Bay.Beginning on July 2, there was a large boreal forest fire in this area. A cold front brought thismaterial down into the mid-Atlantic region beginning on July 6. Its influence lasted from July 6 to10 and the PSCF analysis clearly identified the fire’s location. The lack of data during this intervalmay be responsible for the lack of an apparent area in the bscat map.


-51-
PART 6: CONTRIBUTIONS FROM DREXEL UNIVERSITY
Investigation of PM Sources Based Upon Laboratory Analysis of Particulate Matter Composition
Steve McDow*Department of Chemistry, Drexel University
Measurements of specific organic compounds by gas chromatography-mass spectrometry(GCMS) were used to compare the relative contributions of primary (directly emitted) andsecondary (photochemically generated) sources of particulate organic matter. Organiccomposition during air pollution events was compared to organic composition on other days, andchemical composition was also compared between different air pollution events. Chemicalcomposition was also used to assess the relative contribution of anthropogenic and biogenicallygenerated organic matter.
It is not possible to account for more than a small percentage of the particulate organicmatter using GCMS because the bulk of the organic mass cannot be resolvedchromatographically. However, much of the unresolved mass is often chemically similar toresolved compounds, so it is possible to get a sense of the chemical characteristics of the organicfraction by analyzing for selected compounds. Two classes of compounds were analyzed in thisstudy. Dicarboxylic acids are formed photochemically through a variety of atmosphericreactions. Although they can also be emitted by automobile exhaust, our results suggest that theyare present at extremely high concentrations during ozone events when other automobile exhaustindicators remain at more typical concentrations. This suggests that automobile exhaustcontributions due to primary particulate emissions are of minor importance during air pollutionepisodes. However, this does not rule out a significant contribution from secondary formation ofparticulate matter during transport after emission of volatile organic precursors in automobileexhaust. Alkanes are heavy hydrocarbons that originate primarily from automobile exhaust orepicuticular wax from plants. The biogenic alkanes have formulas that contain an odd number ofcarbon atoms, while motor vehicle exhaust contains roughly equal amounts of odd and evennumbers of carbon atoms. In addition the specific pattern of alkane concentrations (i.e., the ratioof odd to even-numbered alkanes) provides information about the relative importance of biogenicand anthropogenic primary sources. The relative amount of dicarboxylic acids and alkanes canprovide a rough estimate of the relative importance of primary and secondary sources of organicparticulate matter.
Figure 6-1 shows the concentration of total dicarboxylic acids through the course of thestudy. Dicarboxylic acid concentrations are generally below 1 µg/m3 except during the threewell-defined ozone episodes of July 1-3, July 7-9, and July 17-19. Dicarboxylic acidconcentrations clearly follow the same pattern as ozone concentration, as indicated by Figure 6-2.Figure 6-2 shows that ozone peaks on the same day as dicarboxylic acids during the July 1-3 andJuly 17-19 episodes, and one day later during the July 7 to 9 episode._____________* Presently with the U.S. EPA, Mail Drop E 205-03, Research Triangle Park, NC 27711

-52-
Figure 6-1. Totaldicarboxylic acidconcentrations
Figure 6-2. Comparison ofrelative changes indiacid and ozoneconcentrations
Figure 6-3 shows the concentrations of total alkanes through the course of the study.Concentrations are reasonably constant for most of the study, but are elevated during the periodfrom July 3 to July 6, and reach a dramatic maximum in the forest fire plume on July 7. Figure6-4 compares relative concentrations of alkanes and dicarboxylic acids through the study period.

-53-
If alkanes are considered representative of primary emissions and dicarboxylic acids areconsidered an indicator of secondary formation, the results indicate a relatively constant level ofprimary emissions throughout the study period, with concentrations rarely changing by more thana factor of two from day to day except during the forest fire plume. In contrast, dicarboxylic acidconcentrations exhibit much more variability, increasing by up to a factor of five or more duringthe ozone episodes of July 1-3 and July 17-19. The same trend is exhibited in Figure 6-5, whichshows the ratio of total dicarboxylic acid concentration to total alkane concentration. The dataindicate that a greater proportion of particulate organic matter is secondary in nature during theJuly 1-3 and July 17-19 episodes, but that in spite of the extremely high dicarboxylic acidconcentrations observed in the forest fire plume, there is little difference in the ratio during thisepisode. From the total dicarboxylic acid data, it is not clear whether this is because thedicarboxylic acids arise from primary sources or whether elevated levels of secondary organicaerosol are roughly equally matched by primary organic pollutants associated with the plume. Itis also evident that there is considerable variation in the ratio between episodes, suggesting thatsecondary organic material may fluctuate more than primary emissions from day to day.
Figure 6-3. Total alkaneconcentrations
Figures 6(a) and 6(b) describe the relationship between representative dicarboxylic acids,succinic acid and phthalic acid, with ozone concentration. A moderate trend is observed withsubstantial scatter.

-54-
Figure 6-4. Comparison ofrelative changesin dicarboxylicacid and alkaneconcentrations
Figure 6-5. Ratio of totaldicarboxylic acidconcentration tot o t a l a l k a n econcentration.
Figure 6-7 shows the differences in distribution of individual dicarboxylic acids betweenthe three events. The highest concentrations of all species were generally observed during theforest fire episode on July 7. However, there are some striking differences in the patterns ofdifferent dicarboxylic acids. Malonic, succinic, glutaric and phthalic acids are only slightlyhigher on July 7 than during the other two episodes, and malic acid is even lower on July 7 thanon July 2. In contrast, adipic, suberic, and azelaic acids are several times higher on July 7 thanduring the other episodes. Azelaic acid is a photochemical product of biogenic emissions,produced when naturally occurring oleic acid reacts. It is noteworthy that it is much higherrelative to the other dicarboxylic acids on July 7 than during the other episodes, and the resultssuggest it may be possible to distinguish between biogenic and anthropogenic precursors ofsecondary organic aerosols. However, oleic acid is also used in cooking and a forest fire plumemay not be representative of general biogenic emissions.

-55-
(a)
Figure 6-6. Variationswith ozone for(a) succinic acid, and (b) phthalic acid
(b)
Dicarboxylic acid concentrations were compared to wind direction to consider thequestion of whether secondary organic aerosol or its precursors could be transported from outsidethe region. For example, air from the southwest follows the urban northeast corridor, while airfrom the northwest is likely to encounter significant biogenic precursors as it passes overextensive forests. Wind direction is based on afternoon wind trajectories from 1800 UTC (2 PMlocal). There were very few days with wind from the northeast or southeast, so these arecombined. On most days wind was from the northwest quadrant, and this has been divided intonorth-northwest and west-northwest. As shown in Figure 6-8, the lowest concentrations ofsuccinic and phthalic acid are observed for wind from the east, which generally indicates amarine origin. The highest concentrations are observed for wind from the north-northwest.Since this includes days when the sampling site was in the forest fire plume, Figure 6-9 isprovided with the forest fire plume excluded. The maximum for this wind direction is preservedfor phthalic acid, but succinic acid varies little with wind direction except for air of marineorigin, when the forest fire plume is excluded. It is clear that a southwesterly wind direction isno more favorable for secondary organic aerosol formation than other winds originating overland.

-56-
(a)
Figure 6-7. Variation ofd i c a r b o x y l i c a c i dconcentrations in differentevents
Figure 6-8. Variation of concentration with wind direction including forest fire episode for(a) succinic acid and (b) phthalic acid.
Figure 6-10 shows how the ratio of alkanes with an odd number of carbon atoms to thosewith an even number of carbon atoms varied during the study. Anthropogenic sources aregenerally automotive and the odd and even alkanes are emitted in roughly equal amounts.Biogenic sources emit exclusively alkanes with an odd number of carbons and they make up asubstantial portion of leaf and other plant waxes. These are continually sloughed off and canmake up a significant portion of the particulate hydrocarbons in rural and remote areas. Anodd/even ratio of 1 to 2 indicates primarily anthropogenic emissions. A ratio above 2 indicates asubstantial biogenic contribution. As indicated in Figure 6-10, the ratio fluctuated considerablyduring the study. It was often below 2 but also frequently as high as 3 or more, indicating thatboth plant wax and anthropogenic sources impacted the sampling site. Of particular interest arethe high ratios observed in the forest fire plume July 7-9, which is consistent with the presence of
(b)

-57-
(a) (b)
biogenic plant-derived aerosol. Also the high value of July 2 is coincident with a high ozonelevel, suggesting a possible biogenic contribution to ozone precursors. The ratio is relatively lowduring the July 17-19 episode.
Figure 6-9. Variation of concentration with wind direction excluding forest fire episode for (a) succinic acid and (b) phthalic acid
Figure 6-10.Odd carbon /even carbonalkane ratio
Total alkane concentration appeared to be more strongly dependent on wind directionthan total dicarboxylic acid concentration, indicating a potentially stronger influence of winddirection on primary than secondary organics. Figure 6-11 shows considerably higher alkaneconcentrations when the wind is from the northwest than from the southwest, even after theforest fire plume is excluded. This is likely due to transport of primary biogenic aerosol fromleaf wax and other materials. Figure 6-12 illustrates this by showing that the odd to even alkaneratio is also higher when the wind is from the northwest. When the forest fire plume is excludedan odd/even alkane ratio of greater than 2 is only observed for wind from the west-northwest.

-58-
(a) (b)
(a) (b)
Wind from this direction is likely to have maximum exposure to forested areas. Figure 6-13shows that even alkane concentrations are also greater for wind from the northwest, especiallythe north-northwest. The even alkanes are most likely from automobile emissions, and couldresult from greater exposure to I-95 traffic, but if this is the case, it is not clear why lowerconcentrations are observed for winds from the southwest. In any case, primary organic aerosolemissions appear to be both biogenic and anthropogenic, and in both cases, their highestconcentrations are associated with a northwest wind.
Figure 6-11. Total alkane concentration versus wind direction with (a) forest fire included, (b)forest fire excluded.
Figure 6-12. Odd/Even alkane ratio versus wind direction with (a) forest fire included, (b) forestfire excluded.
To test whether the dicarboxylic acids could also be due to automobile exhaust, tworepresentative dicarboxylic acids were plotted against even alkane concentrations. The resultsare shown in Figure 6-14. The trends are similar in strength to the trends exhibited by each of

-59-
(a) (b)
these compounds with ozone. Phthalic acid is somewhat more strongly associated with ozone,while succinic acid is somewhat more strongly associated with even alkanes, but the differencesare very small. This suggests that between air pollution episodes a substantial amount of thedicarboxylic acids could be from automobile exhaust, limiting their use as a tracer of secondaryorganic aerosols on more typical days.
Figure 6-13. Even alkanes versuswind direction
Figure 6-14. Variations in the even alkanes are compared with variations in the acids, (a)succinic acid, and (b) phthalic acid.

-60-
The following conclusions can be drawn from the analysis of these results:
1. Summer organic aerosol in Philadelphia consists of a relatively constant level ofprimary organic particulate matter, punctuated by extreme episodes of high levels ofsecondary organic aerosol during ozone events.
2. A significant fraction of particulate organic matter during ozone episodes is accountedfor by dicarboxylic acids, which exceeded 1 µg/m3 in all three episodes.
3. Primary organic particulate matter is both biogenic and anthropogenic in nature, withthe relative importance fluctuating from day to day.
4. Primary organic matter is possibly associated more strongly with northwest winds,with little difference observed for secondary organic particulate matter, except bothexhibit lower concentrations in air of marine origin.
5. While secondary aerosol formation events may be responsible for dramatic increasesin particulate organic carbon, the relatively constant contribution of primary sourcescould make a greater contribution to annual average particulate levels, and moreresearch is needed to sort out the relative contributions of anthropogenic and biogenicsources.

-61-
PART 7: PROJECT SUMMARY
The measurements of the NEOPS-DEP2002 campaign were completed less than one year agoand thus the efforts on the interpretation of the results are expected to continue for some time.During the period since the campaign was completed, several publications and presentations havemade use of the results, and those are listed at the end of this part of the report. The prior sectionsof this report have indicated the types of measurements conducted and presented examples of results.Rather than trying to make a complete summary of the activities here, several of the papers listedbelow are appended to provide a better perspective of how the results are being used, and indicatethe expected directions for the further studies. Several of the papers are available as .PDF files onthe NEOPS-DEP directory under the PSU web site http://lidar1.ee.psu.edu/. A primary near termgoal is to complete the data archiving so that it will be available for future use for analysis, and foruse in development and testing of models. The process of archiving all of the data on the NARSTOnational archive is underway.
1. Questions and Hypotheses ExaminedA Data Workshop on the NEOPS-DEP2002 project was conducted at Penn State University
on 2-3 December 2002 and a Science Workshop was conducted 12-13 May 2003. During theseworkshops, the results were studied and hypotheses examined to learn from the measurements anddecide how best to analyze the data. The following list of questions and hypotheses were considered:
1. Are all of the major northeast air pollution events coupled with transport from themidwest?
2. Are the increases of the PAH's associated with the fire aerosols principally responsiblefor the changes of absorptivity (optical density)?
3. Are high ozone pollution episodes consistent with high PM events? What forecastingparameters work well? Can you deduce high ozone levels from high PM events?
4. Do all sulfate events have associated PM events? When are the PM2.5 peaks, do theycorrespond to higher ozone levels? How often does high ozone occur without a PMincrease? Why?
5. Can we separate regional sulfates from local sulfates? What are the sources?6. What is the climatology of the nocturnal Low Level Jet with respect to the chemistry and
meteorology? Is the LLJ a source of material or just an indicator of themeteorological pattern?
7. How is the ambient aerosol size, number and optical density related to PM (also use thedata from 2001, 1999)?
8. What is the extent to which boundary layer depth parameters define pollutant mixingvolume characteristics?
9. What are the relative contributions of active chemistry compared to dynamical changesduring an air pollution episode?
10. Can the ETA model be verified using the tethersonde, lidar, radar and RASS data?11. How does the uniqueness of the Philadelphia region affect air pollution (specifically
ozone)? (Sea breeze, Low Level Jets, Factories, Power Generation, Traffic Patterns,Appalachian Mountains)

-62-
Several of these questions are described and answered, at least partially, in prior sections ofthis report, and others are being addressed in work that is underway. The researchers will continueto analyze and interpret the results, and report their investigations relative to these and other relatedquestions. One of the major outcomes from the NEOPS investigations is the demonstration of thefact that the critical processes can only be understood when the vertical profiles are examined. Themeteorological properties are the most important factors in controlling the degree to which theemissions from power generation, industrial processes, and transportation are concentrated withina region. The regional transport of pollutants, the storage and transport aloft, and the vertical mixingof the boundary layer are key factors, and these are only properly characterized with observationsby continuous remote sensing techniques. The combination of the lidar, tethered sonde, radar, andRASS during the NEOPS-DEP2002 program have provided valuable insights into the transportprocesses that control the evolution of air pollution episodes.
2. Meteorological AnalysisThe meteorological conditions over the northeast region which have controlled the air
pollution episodes during the NEOPS-DEP 2002 project are summarized by Bill Ryan and availableon the web sites:
http://www.atmos.umd.edu/~forecaster/summary_2002.htm
http://lidar1.ee.psu.edu/
The episodes that have been analyzed which correspond with NEOPS-DEP2002 intensivemeasurement periods are:
July 1-3July 7-9: Canadian WildfiresJuly 17-19NEOPS IOP July 22-23NEOPS IOP July 28-29July 31-August 5
3. Summary of the 2002 ConditionsA few selected results are summarized here to provide an overview of information which
helps to characterize the 2002 summer, and that is valuable for understanding the relationships toother years. Figure 7-1 shows a summary of the ozone and particulate matter during the month ofJuly 2002. These measurements were made with instruments at the NEOPS site in northeastPhiladelphia, the ozone measurements by Millersville University (Richard Clark) and the particlemeasurements by Clarkson University (Philip Hopke). Figure 7-1 shows the comparison of ozoneand particulate concentrations. The time sequence of the variations in PM2.5, EC, OC, BC, totalcarbon and sulfate are compared with the ozone during the month of July 2002 in this figure. Betterresolution plots of the comparisons of PM2.5, sulfate and OC with ozone are shown in Figures 7-2through 7-4. These figures indicate the range of events and conditions observed during the 2002summer campaign.

-63-
Figure 7-1. Measurements of particulate properties by Clarkson University and ozonemeasurements from Millersville University are combined to show the variations that occurred duringthe NEOPS-DEP 2002 campaign at the Philadelphia site.
Figures 7-1 through 7-4 provide a general overview of the conditions that existed during thesummer of 2002. The goal of the NEOPS program has been to bring together the best and most up-to-date techniques to measure the detailed chemistry, aerosol properties, profiles of ozone, profilesof aerosols, and meteorological conditions to archive an improved understanding of the physical andchemical processes that govern air pollution. Our purpose is to understand the meteorologicalinfluences upon the evolution and distribution of ozone and fine particle concentrations during air

-64-
pollution episodes and to find the proper context of regional scale factors. The measurements ofvertical profiles of the important properties obtained using lidar, radar, tethersondes and aircraftspirals clearly shows the incursion of processed precursor materials from an aloft layer, which aretransported into the region, and then mixed downward to the surface by the daytime convectiveboundary layer. The transported material appears to be important in the initiation of an ozone andparticulate matter pollution events during several investigations. Vertical profiles of the ozone,aerosol extinction, water vapor and other meteorological parameters provide the important resultsto understand the evolution of air pollution episodes. Time sequence profiles clearly show theadvection of aloft layers of polluted air into the region followed by entrainment into the daytimeconvective mixed layer and subsequent transport to the surface. Time sequences of ozone andaerosol (PM) profiles obtained during the NE-OPS project studies between the surface and 3 kmaltitude show the importance of the surface layer (first 100 meters) and PBL dynamics indetermining the actual pollution hazard for the regional population. Hazardous levels of ozone arefrequently observed existing above the surface layer. The intensity of vertical transport, andpresence of surface layer gases that can destroy ozone, can make significant differences in the levelof human exposure. Examination of several episodes demonstrates that the local surface exposuredepends upon the development of convective activity, wind-shear driven transport, and presence ofsurface gaseous species. The results show the importance of measuring the vertical structure tounderstand the processes governing air pollution. The results from these measurement programs arebeing submitted to the national archive (NARSTO archive) so that the larger community of modelersand researchers will have access to this valuable data set.
Figure 7-2. The time sequences of PM2.5 particulate matter (Clarkson University) are compare withthe ozone (Millersville University) in Philadelphia during July 2002.

-65-
Figure 7-3. The sulfate concentrations (Clarkson University) are compared with the ozone(Millersville University) during the NEOPS-DEP 2002 campaign in Philadelphia during July 2002.
Figure 7-4. Comparison of the OC measurement (Clarkson University) with the ozone timesequence (Millersville University) shows the period of high OC when the smoke from Canadianforest fire reached the site, and the following ozone enhancement.

-66-
4. Archiving of the NEOPS-DEP2002 DataThe efforts to complete the data archive of the summer 2002 data with the NARSTO national
archive are well underway and should be completed within the next few months. The data is alsobeing made available to other researchers on request at the project web site:
http://www.lidar1.ee.psu.edu
5. Publications and PresentationsMost of the work for preparation of interpretation and publication of the results is still ahead
because this report is being drafted only nine months after the measurement campaign. Thefollowing list highlights the reports on the results that have occurred to date, several other papers andreports are in preparation.
PublicationsClark, R. D., “Using GEMPAK/GARP in undergraduate research,” Bull. Amer. Meteor. Soc. 83,178-180, 2002.
Philbrick, C. Russell, “Application of Raman Lidar Advancements in Meteorology and Air QualityMonitoring,” in Remote Sensing of the Atmosphere, Environment, and Space, SPIE , 4893-11, 2003.
Li, Guankun, and C. Russell Philbrick, “Lidar Measurements of Airborne Particulate Matter,” inRemote Sensing of the Atmosphere, Environment, and Space, SPIE , 4893-15, 2003.
Philbrick, C. R., W.F. Ryan, R.D. Clark and B.G. Doddridge, “Advances in Understanding UrbanAir Pollution from the NARSTO-NE-OPS Program,” Proceedings of the American MeteorologicalSociety 5th Conference on Atmospheric Chemistry, 6.1, 2003.
Ryan, W.F., C.R. Philbrick and R.D. Clark, “Summary of the Meteorological Conditions During theNEOPS July 2002 Intensive Observing Period,” Proceedings of the American MeteorologicalSociety 5th Conference on Atmospheric Chemistry, 6.2, 2003.
Collier, Jason P., S. Unni, S.J. Verghese, A. Willitsford, C.R. Philbrick, R.D. Clark, and B.G.Doddridge, “Raman Lidar Measurements of Tropospheric Ozone,” Proceedings of the AmericanMeteorological Society 5th Conference on Atmospheric Chemistry, 6.3, 2003.
Clark, Richard D., C.-H. Jeong and C.R. Philbrick, “The Influence of Canadian Wildfires on AirQuality in Philadelphia during NE-OPS DEP,” Proceedings of the American Meteorological Society5th Conference on Atmospheric Chemistry, 6.4, 2003.
Clark, Richard D., W.F. Ryan and C.R. Philbrick, “Modification of Surface and Boundary LayerMeteorology and Chemistry by Seabreeze Incursions during NE-OPS,” Proceedings of the AmericanMeteorological Society 5th Conference on Atmospheric Chemistry, 6.6, 2003.
Unni, Sameer, C.R. Philbrick and R.D. Clark, “Examination of the Influence of a Frontal Passageon Air Pollution Episodes,” Proceedings of the American Meteorological Society 5th Conference onAtmospheric Chemistry, 6.8, 2003.

-67-
Willitsford, Adam, J.P. Collier, S. Unni, S.J. Verghese, C.R. Philbrick, D. O’Donnell, E. Hohman,D. Unruh, R. Walker, Jr., and R.D. Clark, “Development of an Air Pollution Episode During theNEOPS-DEP 2002 Investigation,” Proceedings of the American Meteorological Society 5th
Conference on Atmospheric Chemistry, 6.9, 2003.
Verghese, Sachin J., S.N. Kizhakkemadam,, A. Willitsford, J.P. Collier, S. Unni, and C.R. Philbrick,“Characterization of Nocturnal Jets over Philadelphia During Air Pollution Episodes UsingRadar/RASS and Raman Lidar,” Proceedings of the American Meteorological Society 5th Conferenceon Atmospheric Chemistry, 6.10, 2003.
Philbrick, C. Russell, “Remote Sensing of Atmospheric Properties Using Lidar,” Proceedings of theInternational Symposium on Spectral Sensing Research (ISSSR), 34 (16 pages) 2003.
Jeong, Cheol-Heon, Doh-Won Lee, Eugene Kim, and Philip K Hopke, “Measurement of Real-timePM2.5 Mass, Sulfate, and Carbonaceous Aerosols at the Multiple Monitoring Sites,” (submitted toAtmos Envir, 2003).
Jeong, Cheol-Heon, Philip K Hopke, Eugene Kim, and Doh-Won Lee,“The Comparison BetweenThermal Optical Transmittance Elemental Carbon and Aethalometer Black Carbon Measured atMultiple Monitoring Sites,” (submitted to Atmos Envir, 2003).
Begum, Bilkis Ara, Eugene Kim, Cheol-Heon Jeong, Doh-Won Lee, and Philip K Hopke,“Identification of Source Regions for Atmospheric Particles Measured in Philadelphia,Pennsylvania,” (submitted to Envir, Sci. and Tech. 2003).
ThesesKizhakkemadam, Sriram: Estimation of Boundary Layer Depth From Raman Lidar Using 2-DSpatial Filters, Master of Science Thesis in Department of Electrical Engineering at Penn StateUniversity, December 2002.
Verghese, Sachin J.: Characterization of Low-Level Jets and Their Influence on Air Pollution UsingRaman Lidar and Wind Profiling Radar/RASS, Master of Science Thesis in Department of ElectricalEngineering at Penn State University, August 2003.
Unni, Sameer: Measurement and Analysis of Optical Extinction Properties, Master of Science Thesisin the Department of Electrical Engineering at Penn State University, December 2003.
PresentationsPhilbrick, C. Russell: “Application of Raman Lidar Advancements in Meteorology and Air Quality
Monitoring,” Invited Presentation for the Third Asia-Pacific Symposium on Remote Sensingof the Atmosphere, Environment, and Space, Hangzhou, China (November 2002)
Li, Guankun, and C. Russell Philbrick: “Lidar Measurements of Airborne Particulate Matter,” ThirdAsia-Pacific Symposium on Remote Sensing of the Atmosphere, Environment, and Space,Hangzhou, China (November 2002)
Philbrick, C.R.: “Advances in Understanding Air Quality Issues Using Raman Lidar,” Graduate

-68-
Colloquium in Physics at University of Maryland, Baltimore Campus (2002)Philbrick, C. R., W.F. Ryan, R.D. Clark and B.G. Doddridge: “Advances in Understanding Urban
Air Pollution from the NARSTO-NE-OPS Program,” Invited Presentation for the AmericanMeteorological Society 5th Conference on Atmospheric Chemistry, Long Beach CA (2003)
Ryan, W.F., C.R. Philbrick and R.D. Clark: “Summary of the Meteorological Conditions During theNEOPS July 2002 Intensive Observing Period,” American Meteorological Society 5th
Conference on Atmospheric Chemistry, Long Beach CA (2003)Collier, Jason P., S. Unni, S.J. Verghese, A. Willitsford, C.R. Philbrick, R.D. Clark, and B.G.
Doddridge: “Raman Lidar Measurements of Tropospheric Ozone,” American MeteorologicalSociety 5th Conference on Atmospheric Chemistry, Long Beach CA (2003)
Clark, Richard D., C.-H. Jeong and C.R. Philbrick: “The Influence of Canadian Wildfires on AirQuality in Philadelphia during NE-OPS DEP, American Meteorological Society 5th
Conference on Atmospheric Chemistry, Long Beach CA (2003)Clark, Richard D., W.F. Ryan and C.R. Philbrick: “Modification of Surface and Boundary Layer
Meteorology and Chemistry by Seabreeze Incursions during NE-OPS,” AmericanMeteorological Society 5th Conference on Atmospheric Chemistry, Long Beach CA (2003)
Unni, Sameer, C.R. Philbrick and R.D. Clark: “Examination of the Influence of a Frontal Passageon Air Pollution Episodes,” American Meteorological Society 5th Conference onAtmospheric Chemistry, Long Beach CA (2003)
Willitsford, Adam, J.P. Collier, S. Unni, S.J. Verghese, C.R. Philbrick, D. O’Donnell, E. Hohman,D. Unruh, R. Walker, Jr., and R.D. Clark: “Development of an Air Pollution Episode Duringthe NEOPS-DEP 2002 Investigation,” American Meteorological Society 5th Conference onAtmospheric Chemistry, Long Beach CA (2003)
Verghese, Sachin J., S.N. Kizhakkemadam,, A. Willitsford, J.P. Collier, S. Unni, and C.R. Philbrick:“Characterization of Nocturnal Jets over Philadelphia During Air Pollution Episodes UsingRadar/RASS and Raman Lidar,” American Meteorological Society 5th Conference onAtmospheric Chemistry, Long Beach CA (2003)
Clark, R. D., R. Walker Jr., D. O’Donnell, E. Hohman, and D. Unruh, 2003: “Low level jets overthe mid-Atlantic region during NE-OPS 1999-2002,” American Meteorological Society 5th
Conference on Atmospheric Chemistry, Long Beach CA (2003)Clark, R. D., “The influence of local and regional circulations on the particle and trace gas
concentrations in the Northeast during NARSTO-NE-OPS,” University of Alabama-Huntsville (March 2003)
Jeong, Cheol-Heon, Doh-Won Lee, Eugene Kim, Philip K Hopke: “Measurement of Real-TimePM2.5 Mass and Fine Chemical Compositions at Northeast Philadelphia,” 2003 AAARParticulate Matter: Atmospheric Sciences, Exposure and the Fourth Colloquium on PM andHuman Health, Pittsburgh, PA (April 2003)
Jeong, Cheol-Heon, Doh-Won Lee, Eugene Kim, Philip K Hopke: “ Influence of a Canadian ForestFire on Measurements of Carbonaceous Compounds in Fine Particulate Matter in July 2002in Philadelphia,” 2003 AAAR Particulate Matter: Atmospheric Sciences, Exposure and theFourth Colloquium on PM and Human Health, Pittsburgh, PA (April 2003)
Jeong, Cheol-Heon, Doh-Won Lee, Eugene Kim, Philip K Hopke, Robert Gelein: “The ComparisonBetween Thermal Optical Transmittance Elemental Carbon and Aethalometer Black CarbonMeasured at Multiple Monitoring Sites,” 2003 AAAR Particulate Matter: AtmosphericSciences, Exposure and the Fourth Colloquium on PM, Pittsburgh, PA (April 2003)

-69-
Philbrick, C. Russell, “Applications of Lidar Techniques to Describe Atmospheric OpticalProperties,” Invited Presentation for the SPIE AeroSense Photonics for Defense and Security,Orlando FL (April 2003)
Philbrick, C. Russell: “Remote Sensing of Atmospheric Properties,” Invited Presentation for theInternational Symposium on Spectral Sensing Research, Santa Barbara CA (June 2003)
Philbrick, C. Russell, William F. Ryan, Richard D. Clark, Philip K. Hopke and Stephen R. McDow:“Processes Controlling Urban Air Pollution in the Northeast: Summer 2002,” InvitedPresentation for the MARAMA MANE-VU Workshop, Windsor-Locks CT (June 2003)
Philbrick, C. Russell: “Results from the Northeast Oxidant and Particle Studies (NE-OPS)”MARAMA Regional Air Quality, Asheville NC (August 2003)
6. Summary of Key FindingsThe measurements obtained during the summer of 2002 in the NEOPS-DEP program have
added significantly to our understanding of the air pollution episodes. When considered togetherwith our results from the prior NARSTO-NEOPS investigations in 1999 and 2001, we can begin todraw several conclusions about the summer air pollution episodes in the Philadelphia and inferconditions in the regional area. The statements which can be made to generally describe our currentknowledge are:
(1) All of the major summer air pollution episodes that we have observed in the Philadelphia areaincluded a major contribution transported from distant sources. From the set of cases during the1999, 2001 and 2002 NEOPS campaigns, it appears that the onset of the most significant PM2.5
events are accompanied by a transition to westerly transport in the boundary layer.
(2) The major factor that controls the magnitude and timing, the development and dissipation, ofthe air pollution episodes is the regional scale meteorology. The major episodes would not developwithout the factors which accumulate the chemical pollutants and allow photochemical processingto generate the ozone and PM components. Weather conducive to photo-chemistry, coupled withlocal stagnation/re-circulation can cause rapid increases in O3 with peak concentrations reaching theCode Red range in the absence of a significant westerly transport component (e.g., August 1-4,2002). In these conditions, PM2.5 concentrations rise as well but are typically limited to the 30-40:gm-3 range.
(3) NEOPS-DEP2002 contributes to regional studies, coordinated with the Supersites, to includean emphasis on understanding of the meteorological processes such as, the thermodynamic structure,atmospheric stability, transitions between daytime and nighttime mixing, and measurement ofmixing depth for the distribution of PM2.5 and chemical species. Knowledge of the temporalevolution of the PBL is a critical input into models of the pollutant concentrations because itestablishes the mixing volume.
(4) Remote sensing and vertical profiling techniques are critical for understanding the processesgoverning air pollution episodes. The Raman lidar water vapor measurements provide an excellenttracer of the short term dynamical processes, and the specific humidity gradients at the top of thePBL provide the best marker to study variations in the thickness of the planetary boundary layer.

-70-
The variations of the PBL thickness have been found to provide one of the most critical tests forevaluation of meteorological models.
(5) High levels of ozone are found to be frequently trapped and transported in layers above thesurface, undetected by the ground-based sensors that are normally used for measurements.Horizontal and vertical nighttime transport processes, such as the LLJ’s and dynamical burstingevents, are frequent contributors of chemical species, particulate matter and precursors forphotochemical formation during the major episodes. The nocturnal low level jet frequently occursin concert with O3 pollution episodes. From mid-June to mid-August, 2002, peak 1-hour O3 in thePHL area exceeded 100 ppbv on 19 of 21 cases where LLJs were observed. This represents two-thirds of all cases exceeding 100 ppbv during that period. Intra-regional transport of air parcels overdistances of 200 to 400 km occur in a LLJ during a night, however these air pollution episodes occurduring periods of large scale stagnation in the region, thus the effective transport of materials byLLJ’s becomes even more important on these days.
(6) Specific meteorological conditions are important in catalyzing the region for development ofmajor air pollution episodes. If the synoptic forcing is too strong, enhanced pressure gradients willinhibit the build up of trace gas concentrations by generating high winds, which serve to erode theinterface between the boundary layer and the free atmosphere, and fumigate the local environment.On the other hand, if the synoptic forcing is weak, near-surface gradients create localized andregional circulations that remained largely confined to the boundary layer. Weak synoptic systemsrespond to this boundary layer forcing to create deep daytime convective mixed layers, shallownocturnal boundary layers with embedded boundary layer jets, sea breeze fronts, and otherconvergence zones (e.g., leeside Appalachian trough) that have been observed, especially duringsummer 1999 and 2002, to significantly modify the trace gas concentrations at the site.
(7) Tethered balloon and lidar measurements suggest a very rapid down mixing of species from theresidual boundary layer during the early morning hours. The rapid increase observed in ozoneconcentrations is too large to be accounted for on the basis of NOx reactions (Kleinman) alone.Moreover, in every case where > 100 ppbv ozone concentrations were observed, a LLJ was presentduring the evening and early morning hours. The nocturnal inversion prevents ozone trapped in theresidual layer from being lost at the surface, and makes it available for horizontal transport by theLLJ, followed by vertical transport to the surface by bursting events and daytime convection.
(8) The data set that has been gathered in the NEOPS-DEP provides the type of results needed to testthe next generation models, for example the Weather Research and Forecast System (WRF model),which is currently undergoing significant testing. Millersville University is using the WRF in anoperational mode, and testing it in a research mode. The NEOPS data are expected to play animportant role in activities to develop and validate air quality models.
(9) Dicarboxylic acids are formed photochemically through a variety of atmospheric reactions andcan also be emitted by automobile exhaust. Our results show that they are present at extremely highconcentrations during ozone events when other automobile exhaust indicators remain at more typicalconcentrations, suggesting that contributions from secondary formation process are important.Alkanes are heavy hydrocarbons originating primarily from automobile exhaust or epicuticular wax

-71-
from plants. Since biogenic alkanes have formulas that contain an odd number of carbon atoms,while motor vehicle exhaust contains roughly equal amounts of odd and even numbers of carbonatoms, the results show the relative contributions of biogenic and anthropogenic primary sources.
10. Summer organic aerosols in Philadelphia consists of a relatively constant level of primaryorganic particulate matter, punctuated by extreme episodes with high levels of secondary organicaerosol during ozone events. Primary organic particulate matter is both biogenic and anthropogenicin nature, with the relative importance fluctuating from day to day, and possibly associated morestrongly with northwest winds. Secondary aerosol formation events may be responsible for dramaticincreases in particulate organic carbon, while the relatively constant contribution of primary sourcescould make a greater contribution to annual average particulate levels. More research is needed tosort out the relative contributions of anthropogenic and biogenic sources.
7. AcknowledgmentsThe NEOPS-DEP2002 project would not have been possible without the dedicated efforts
of many individuals. This project was supported by the Pennsylvania Department of EnvironmentalProtection through the Penn State Institutes of the Environment and the manager for DEP has beenJane Mahinske, Bureau of Air Quality. The NEOPS field site used for the measurements programwas prepared during a prior measurement program sponsored by USEPA STAR Grant #R826373with efforts from the Philadelphia Air Management Services (AMS) Laboratory. Specialappreciation goes to Fred Hauptman of the Philadelphia AMS Laboratory for his efforts in thepreparation of the site at the Baxter Water Treatment Facility, Kate Guest, Manager. The closecooperation of the several research university groups resulted in a successful program. Specialacknowledgment is due to the graduate students and undergraduate students from the severaluniversities who worked together to obtain the measurements and reduce the data. Appreciationgoes to Jason Collier, Sachin Verghese, Sameer Unni, Adam Willitsford and Mike Wyland of PennState University; Richard Walker, Dennis O’Donnell, Dale Unruh and Eric Hohman of MillersvilleUniversity; Doh-Won Lee and Cheol-Heon Jeong of Clarkson University; and Jennifer Benvenuto,Josha Ray and Amanda Northcross of Drexel University for all of their work in obtaining the resultsreported. Individuals who have provided valuable support for this activity include Susan Wierman,MARAMA, Bruce Doddridge, University of Maryland, Ted Erdman, EPA Region 3, Jeffrey West,NARSTO Coordinator, Linda Becker, PSU Electrical Engineering, and Mary McCarthy, PSUInstitutes of the Environment. The data archive for the results from this program is in the final stagesof acceptance for the NARSTO National Archive with assistance from Sig Christensen and LesHook.