P6 analytics producing meaningful results in P6 analytics - Oracle Primavera P6 Collaborate 14
Upload
ronan-nilandCategory
view
287download
4description

PP66 PPrrooffeessssiioonnaall UUsseerr''ss GGuuiiddee
RReelleeaassee 88..33
JJuullyy 22001133
2
Oracle Primavera P6 Professional User's Guide
Copyright © 1999, 2013, Oracle and/or its affiliates. All rights reserved.
Oracle and Java are registered trademarks of Oracle and/or its affiliates. Other names
may be trademarks of their respective owners.
This software and related documentation are provided under a license agreement
containing restrictions on use and disclosure and are protected by intellectual property
laws. Except as expressly permitted in your license agreement or allowed by law, you
may not use, copy, reproduce, translate, broadcast, modify, license, transmit, distribute,
exhibit, perform, publish or display any part, in any form, or by any means. Reverse
engineering, disassembly, or decompilation of this software, unless required by law for
interoperability, is prohibited.
The information contained herein is subject to change without notice and is not
warranted to be error-free. If you find any errors, please report them to us in writing.
If this is software or related documentation that is delivered to the U.S. Government or
anyone licensing it on behalf of the U.S. Government, the following notice is applicable:
U.S. GOVERNMENT END USERS: Oracle programs, including any operating system,
integrated software, any programs installed on the hardware, and/or documentation,
delivered to U.S. Government end users are “commercial computer software" pursuant
to the applicable Federal Acquisition Regulation and agency-specific supplemental
regulations. As such, use, duplication, disclosure, modification, and adaptation of the
programs, including any operating system, integrated software, any programs installed
on the hardware, and/or documentation, shall be subject to license terms and license
restrictions applicable to the programs. No other rights are granted to the U.S.
Government.
This software or hardware is developed for general use in a variety of information
management applications. It is not developed or intended for use in any inherently
dangerous applications, including applications that may create a risk of personal injury. If
you use this software or hardware in dangerous applications, then you shall be
responsible to take all appropriate failsafe, backup, redundancy, and other measures to
ensure its safe use. Oracle Corporation and its affiliates disclaim any liability for any
damages caused by use of this software or hardware in dangerous applications.
This software or hardware and documentation may provide access to or information on
content, products and services from third-parties. Oracle Corporation and its affiliates
are not responsible for and expressly disclaim all warranties of any kind with respect to
third-party content, products, and services. Oracle Corporation and its affiliates will not
be responsible for any loss, costs, or damages incurred due to your access to or use of
third-party content, products, or services.
Legal Notices

Legal Notices
3

5
Contents
Legal Notices ........................................................................................................................ 2
Welcome ............................................................................................................................. 21
Using the P6 Professional User's Guide .......................................................................... 21
Introducing P6 Professional ............................................................................................. 22
P6 Professional Industry Types (P6 EPPM Only) ............................................................. 23
Where to Get Documentation ........................................................................................... 24
Where to Get Training ...................................................................................................... 26
Where to Get Support ...................................................................................................... 26
Understanding Project Management ................................................................................ 29
Why Use P6 Professional? .............................................................................................. 29
Why Use P6 Professional in an P6 EPPM environment? ............................................ 29
Your Role in the Organization .......................................................................................... 30
P6 Professional Process Overview .................................................................................. 33
Planning, Controlling, and Managing Projects .................................................................. 33
Getting Started ................................................................................................................... 37
Workspace Basics ........................................................................................................... 37
Symbols ...................................................................................................................... 37 Using main windows .................................................................................................... 41 Using Hint Help ........................................................................................................... 43 Using the Status Bar and Layout Options bar .............................................................. 43 Display window details ................................................................................................ 44 Tile windows horizontally or vertically .......................................................................... 44 Wizards ....................................................................................................................... 45 Navigate wizards ......................................................................................................... 46 Select and assign information ..................................................................................... 46 Global data vs. project-specific data ............................................................................ 46 Use shortcut menus .................................................................................................... 47 Select multiple items ................................................................................................... 47 Set the language for displaying data ........................................................................... 47 Quickly enter the same text in multiple table rows ....................................................... 47 Using the HTML editor ................................................................................................ 48 Using Hot Keys ........................................................................................................... 50 Using Shortcut Keys .................................................................................................... 54
Setting User Preferences ................................................................................................. 56
Define user preferences .............................................................................................. 56 Define how to display time information ........................................................................ 57 Specify a format for dates............................................................................................ 58 Select a view currency ................................................................................................ 58 Specify a format for currency ....................................................................................... 58 Enter e-mail settings .................................................................................................... 58
P6 Professional User's Guide
6
Set wizard options ....................................................................................................... 59 Change my password .................................................................................................. 59 Set startup options ...................................................................................................... 60 Create a log of tasks ................................................................................................... 60 Define the range of financial periods to display in columns .......................................... 60 Set resource analysis options ...................................................................................... 61 Select Startup Filters ................................................................................................... 62 Load resource summary data at startup ...................................................................... 63 Select calculation options for resource and role assignments ...................................... 63 Set the Online Help location (P6 Professional Only) .................................................... 64
Structuring Projects ........................................................................................................... 65
Setting up and starting to work with the EPS ................................................................... 65
Enterprise Project Structure overview ......................................................................... 65 Defining the Enterprise Project Structure (P6 Professional Only) ................................ 66 Set up the EPS structure ............................................................................................. 66 Add a project to the EPS hierarchy .............................................................................. 67 Show or hide details in the EPS hierarchy ................................................................... 67 Use status for filtering projects in the EPS ................................................................... 68 Delete an EPS node or project (P6 Professional Only) ................................................ 68 Copy an EPS node or project ...................................................................................... 68
Working with and defining the OBS .................................................................................. 69
Organizational breakdown structure (OBS) overview .................................................. 69 Setting up the OBS...................................................................................................... 69 View the OBS (P6 Professional Only).......................................................................... 70 Add an OBS element (P6 Professional Only) .............................................................. 70 Assign an OBS element to a WBS element ................................................................. 71 Edit an OBS element (P6 Professional Only) ............................................................... 71 Delete an OBS element (P6 Professional Only) .......................................................... 71 View the OBS chart display (P6 Professional Only) ..................................................... 71 Change the OBS chart display (P6 Professional Only) ................................................ 72
Defining Resources and Roles ......................................................................................... 72
Resources ................................................................................................................... 72 Resources ................................................................................................................72 Add a resource ........................................................................................................73 Adding resources using a wizard .............................................................................74 View resources ........................................................................................................74 Define resource shifts ..............................................................................................75 Display resource details...........................................................................................75 Calculating cost when using multiple resource rates ..............................................75 Having a discussion with team members ................................................................76
Roles ........................................................................................................................... 77 Roles ........................................................................................................................77 Add a role ................................................................................................................77 Define price/unit rates for roles ................................................................................78 Define role limits over time ......................................................................................78 Assign roles to activities ..........................................................................................79 Assign roles to resources from the Resources window ...........................................79 Assign roles to resources from the Roles dialog box ..............................................80 View roles ................................................................................................................80
Contents
7
Edit resource information .........................................................................................80
Defining Resource Curves ............................................................................................... 81
Resource curves ......................................................................................................... 81 Add a resource curve .................................................................................................. 82 Delete a resource curve .............................................................................................. 82
Defining the WBS ............................................................................................................ 83
Work Breakdown Structure .......................................................................................... 83 Using a WBS for top-down planning ............................................................................ 83 Using weighted milestones in the work breakdown structure ....................................... 84 WBS status types ........................................................................................................ 84 View the WBS ............................................................................................................. 84 Display work breakdown structure details .................................................................... 85 Add a WBS element .................................................................................................... 85 Edit a work breakdown structure element .................................................................... 85 Assign WBS weighted milestones ............................................................................... 86 Assign WBS Category values (P6 Professional Only) ................................................. 86 Create WBS category values (P6 Professional Only) .................................................. 87 Change the work breakdown structure chart display ................................................... 87 Change the work breakdown structure table display.................................................... 87 Copy and paste a work breakdown structure element ................................................. 87 Define earned value settings for a specific work breakdown structure element ........... 88 Delete a work breakdown structure element ................................................................ 88
Defining Project, Resource, and Activity Codes ............................................................... 89
Project Codes .............................................................................................................. 89 Project codes and values.........................................................................................89 Create project codes (P6 Professional Only) ..........................................................90 Create project code values (P6 Professional Only) .................................................90 Assign project codes and values .............................................................................90
Resource Codes ......................................................................................................... 91 Resource codes .......................................................................................................91 Create resource codes ............................................................................................91 Create resource code values ...................................................................................92 Assign resource codes and values ..........................................................................92
Activity Codes ............................................................................................................. 92 Activity codes and values ........................................................................................92 Defining Global Activity Codes and Values and Values Colors ..............................93 Create global activity codes .....................................................................................93
Create global activity code values ...........................................................................93
Defining Project Activity Codes and Values and Values Colors ..............................94 Create project-level activity codes ...........................................................................94
Create project-level activity code values .................................................................94
Promote project-level activity codes and values......................................................95
Defining EPS-level Activity Codes and Values and Values Colors .........................95 Create EPS-level activity codes ..............................................................................95
Create EPS-level activity code values .....................................................................95
Promote EPS-level activity codes and values .........................................................96
P6 Professional User's Guide
8
Defining Custom Fields .................................................................................................... 96
User-defined fields ...................................................................................................... 96 Define custom user fields ............................................................................................ 97 Choosing data types for user-defined fields ................................................................. 98 Indicator user-defined fields ........................................................................................ 98
Defining Calendars .......................................................................................................... 99
Calendars .................................................................................................................... 99 Defining default hours per time period in calendars ................................................... 101 Project Calendars ...................................................................................................... 102
Create a project calendar ......................................................................................102 Edit a project calendar ...........................................................................................102 Delete a project calendar .......................................................................................104 View project calendar assignments .......................................................................104
Global Calendars ...................................................................................................... 104 Create a global calendar........................................................................................104 Edit a global calendar ............................................................................................105 Delete a global calendar ........................................................................................106 Specify a default global calendar ...........................................................................106 View global calendar assignments ........................................................................106
Resource Calendars .................................................................................................. 107 Create a shared resource calendar .......................................................................107 Create a personal resource calendar ....................................................................107 Edit a resource calendar ........................................................................................108 Edit your personal resource calendar ....................................................................109 Delete a resource calendar ...................................................................................110 View resource calendar assignments ....................................................................111
Working with the EPS ...................................................................................................... 113
Managing projects using the EPS .................................................................................. 113
Defining project details ................................................................................................... 113
Enter project dates ......................................................................................................... 113
Specify a fiscal start month ............................................................................................ 114
Set project resource options .......................................................................................... 114
Change a project name .................................................................................................. 114
Change a project ID ....................................................................................................... 114
Change the project leveling priority ................................................................................ 114
Change a project's status ............................................................................................... 115
Developing Projects ......................................................................................................... 117
Adding Activities to a Project .......................................................................................... 117
Activities .................................................................................................................... 117 Activity types ............................................................................................................. 118 Activity dates ............................................................................................................. 118 Synchronizing activity duration, units, and resource units/time .................................. 122 Define general activity information ............................................................................. 123 Add activities in the Activity Table ............................................................................. 124 Add activities in the Activity Network ......................................................................... 124 Define activity types .................................................................................................. 124 Define activity duration types ..................................................................................... 125
Contents
9
Define activity percent complete types ...................................................................... 126 Assign a calendar to an activity ................................................................................. 127 Enter activity durations .............................................................................................. 127 Enter activity start and finish dates ............................................................................ 128 Enter a physical percent complete for activities ......................................................... 129 Enter unit information for resource assignments ........................................................ 129 Enter cost information for resource assignments ....................................................... 130 Dissolve an activity .................................................................................................... 131 Define milestones ...................................................................................................... 132 View activity float values ........................................................................................... 132 View activity summaries ............................................................................................ 132 Copy and paste activities in the Activity Table ........................................................... 132 Copy and paste activities in the Activity Network ....................................................... 133 Renumber activity IDs in the Activity Table ................................................................ 134
Linking Activities with Relationships ............................................................................... 135
Relationships ............................................................................................................. 135 Adding relationships between activities ..................................................................... 136 Add predecessor relationships .................................................................................. 136 Add successor relationships ...................................................................................... 137 Create relationships in the Gantt Chart ...................................................................... 137 Create relationships in the Activity Network ............................................................... 138 Viewing activity relationships ..................................................................................... 139
View activity relationships in Activity Details .........................................................139 View activity relationships in the Gantt Chart ........................................................139 View activity relationships in the Activity Network .................................................140 View activity relationships in Trace logic ...............................................................140
Assigning Resources and Roles to Activities ................................................................. 141
Assign resources to activities .................................................................................... 141 Assign resources to activities by role ......................................................................... 141 Assign a rate type to a resource assignment ............................................................. 142 Choose the rate source for an assignment ................................................................ 143 Change the resource's role assignments for an activity ............................................. 143 Recalculate resource and role assignment costs ....................................................... 144 Assign roles to activities ............................................................................................ 144
Assigning Resource Curves ........................................................................................... 145
Assign a curve to a resource or role assignment ....................................................... 145 Remove a curve from a resource or role assignment ................................................ 146
Budgeting ...................................................................................................................... 146
Defining Budgeting .................................................................................................... 146 Establishing budgets ................................................................................................. 146 Tracking and analyzing budgets ................................................................................ 147 Establish budgets ...................................................................................................... 147 Enter budget changes ............................................................................................... 147 Define funding sources .............................................................................................. 148 Assign funding sources ............................................................................................. 148 Enter monthly spending amounts .............................................................................. 149 View budget and spending plan totals ....................................................................... 149 Compare budgets and variances ............................................................................... 150

P6 Professional User's Guide
10
Manually Planning Future Period Assignments .............................................................. 150
Future period bucket planning ................................................................................... 150 Create a future period bucket planning layout ........................................................... 152 Manually enter future period assignment values ........................................................ 153
Adding Expenses and Entering Cost Information for Activities ....................................... 156
Expenses .................................................................................................................. 156 Expenses ...............................................................................................................156 Add expenses ........................................................................................................157 Add expenses from the Activities window .............................................................157 Assign an expense category .................................................................................158 Assign expense categories from the Activities window .........................................158 Specify an accrual type for an expense .................................................................158 Enter cost information for expenses ......................................................................158 Change an expense's activity assignment ............................................................159
Cost Accounts ........................................................................................................... 159 Cost accounts ........................................................................................................159 Create a cost account hierarchy (P6 Professional Only) .......................................159 Edit a cost account (P6 Professional Only) ...........................................................160 Delete a cost account (P6 Professional Only) .......................................................160 Copy and paste cost accounts (P6 Professional Only) .........................................160 Cut and paste cost accounts (P6 Professional Only) ............................................161 Set the project default cost account ......................................................................161
Performing Top-down Estimation (P6 Professional Only) ............................................... 161
Performing top-down estimations using prior experience (P6 Professional Only) ...... 162 Performing top-down estimations using function points (P6 Professional Only) ......... 162 Applying Saved Top-Down Estimations To a Project (P6 Professional Only) ............. 163
Adding Activity Steps ..................................................................................................... 164
Activity steps ............................................................................................................. 164 Add steps to activities ................................................................................................ 165 Update activity steps ................................................................................................. 165 Add weights to steps ................................................................................................. 166 Creating and Assigning Activity Step Templates ....................................................... 167
Activity step templates ...........................................................................................167 Create activity step templates manually (P6 Professional Only) ...........................167 Convert steps into an activity step template (P6 Professional Only) .....................168 Assign activity step templates to activities .............................................................168
Assigning Notebooks to Activities .................................................................................. 169
Assign notebooks to activities ................................................................................... 169
Global Change ............................................................................................................... 169
Global change ........................................................................................................... 169 Global change conditions .......................................................................................... 170 Change data globally ................................................................................................. 171 Add an If statement ................................................................................................... 172 Add Then and Else statements ................................................................................. 173 Edit a statement ........................................................................................................ 173 Rearrange Global change statements ....................................................................... 174 Cut, copy, or paste a statement ................................................................................. 174 Combine text fields .................................................................................................... 174 Use arithmetic with Global change ............................................................................ 174
Contents
11
Managing Projects ........................................................................................................... 177
Creating Baselines ......................................................................................................... 177
Baselines .................................................................................................................. 177 Create a baseline ...................................................................................................... 178 Assign baselines to projects ...................................................................................... 179
Assign the baseline to use for summarization or earned value .............................179 Assign the baselines to use for the current project ...............................................180 Assign baselines for comparison ...........................................................................180
Comparing Current and Baseline Schedules ............................................................. 180 Setting preferences for baseline values ................................................................181
Copy a baseline ........................................................................................................ 181 Update a baseline ..................................................................................................... 182 Modify a baseline manually ....................................................................................... 185 Delete a baseline ...................................................................................................... 185
Comparing Projects and Baselines ................................................................................ 186
Comparison Reporting Overview ............................................................................... 186 Select and Compare Projects/Baselines .................................................................... 186
Updating Projects .......................................................................................................... 187
The Update Process .................................................................................................. 187 Updating the schedule ............................................................................................... 189 Update progress for all activities................................................................................ 190 Update progress for individual activities .................................................................... 190 Progress Spotlight ..................................................................................................... 192 Update progress for spotlighted activities .................................................................. 192 Estimate progress automatically ................................................................................ 193 Highlight activities for updating .................................................................................. 194 Update progress for the project ................................................................................. 194 Remove progress from an activity ............................................................................. 195 Suspend or resume an activity's progress ................................................................. 196 Apply actuals ............................................................................................................. 196 Earned Value ............................................................................................................ 198
Analyze costs .........................................................................................................198 Calculating earned value using resource curves or manual future period buckets ..... 198 Updating progress ..................................................................................................... 199
Store Period Performance ............................................................................................. 199
Store Period Performance ......................................................................................... 199 Link actual to date and actual this period units and costs .......................................... 200 Post actual amounts for a period ............................................................................... 200 Edit past period actual data ....................................................................................... 201 View past period actual data in spreadsheets ............................................................ 202
Creating and Using Reflections ...................................................................................... 203
What is a reflection .................................................................................................... 203 Creating and using reflections ................................................................................... 204 Create a Reflection.................................................................................................... 204 Merging a Reflection with the Source project ............................................................. 205
Working with remote projects ......................................................................................... 207
Managing remote projects ......................................................................................... 207
P6 Professional User's Guide
12
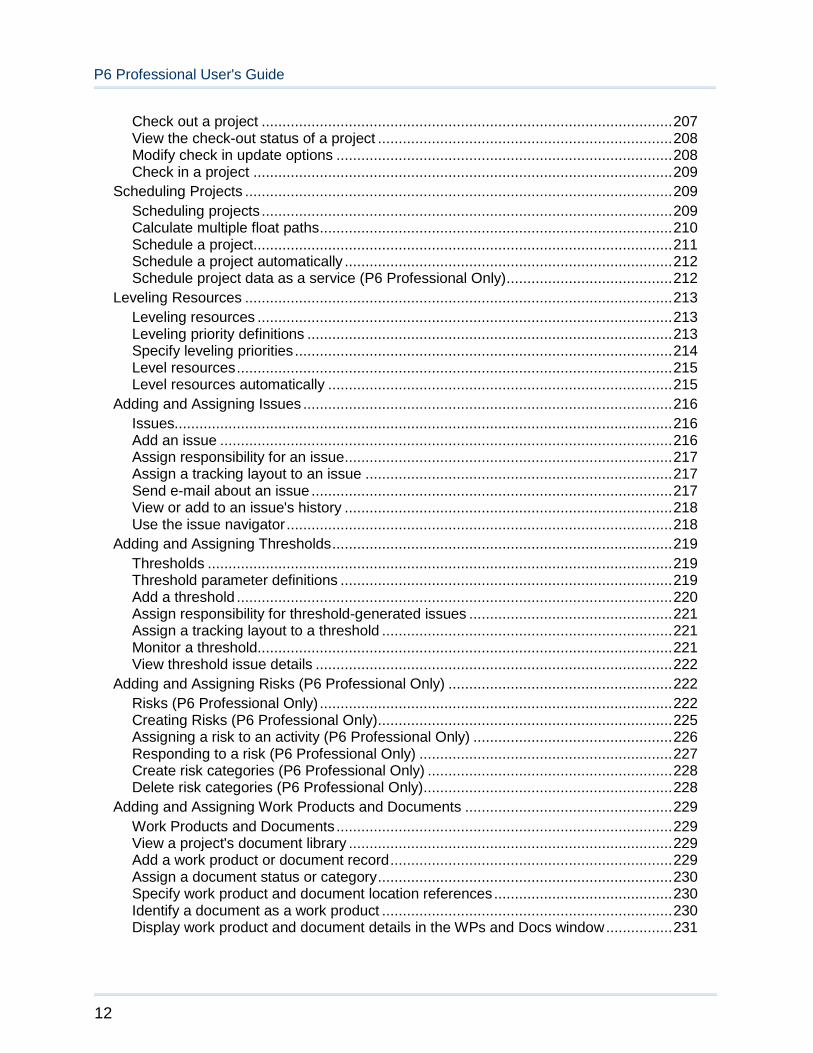
Check out a project ................................................................................................... 207 View the check-out status of a project ....................................................................... 208 Modify check in update options ................................................................................. 208 Check in a project ..................................................................................................... 209
Scheduling Projects ....................................................................................................... 209
Scheduling projects ................................................................................................... 209 Calculate multiple float paths ..................................................................................... 210 Schedule a project..................................................................................................... 211 Schedule a project automatically ............................................................................... 212 Schedule project data as a service (P6 Professional Only) ........................................ 212
Leveling Resources ....................................................................................................... 213
Leveling resources .................................................................................................... 213 Leveling priority definitions ........................................................................................ 213 Specify leveling priorities ........................................................................................... 214 Level resources ......................................................................................................... 215 Level resources automatically ................................................................................... 215
Adding and Assigning Issues ......................................................................................... 216
Issues........................................................................................................................ 216 Add an issue ............................................................................................................. 216 Assign responsibility for an issue ............................................................................... 217 Assign a tracking layout to an issue .......................................................................... 217 Send e-mail about an issue ....................................................................................... 217 View or add to an issue's history ............................................................................... 218 Use the issue navigator ............................................................................................. 218
Adding and Assigning Thresholds .................................................................................. 219
Thresholds ................................................................................................................ 219 Threshold parameter definitions ................................................................................ 219 Add a threshold ......................................................................................................... 220 Assign responsibility for threshold-generated issues ................................................. 221 Assign a tracking layout to a threshold ...................................................................... 221 Monitor a threshold.................................................................................................... 221 View threshold issue details ...................................................................................... 222
Adding and Assigning Risks (P6 Professional Only) ...................................................... 222
Risks (P6 Professional Only) ..................................................................................... 222 Creating Risks (P6 Professional Only)....................................................................... 225 Assigning a risk to an activity (P6 Professional Only) ................................................ 226 Responding to a risk (P6 Professional Only) ............................................................. 227 Create risk categories (P6 Professional Only) ........................................................... 228 Delete risk categories (P6 Professional Only) ............................................................ 228
Adding and Assigning Work Products and Documents .................................................. 229
Work Products and Documents ................................................................................. 229 View a project's document library .............................................................................. 229 Add a work product or document record .................................................................... 229 Assign a document status or category ....................................................................... 230 Specify work product and document location references ........................................... 230 Identify a document as a work product ...................................................................... 230 Display work product and document details in the WPs and Docs window ................ 231
Contents
13
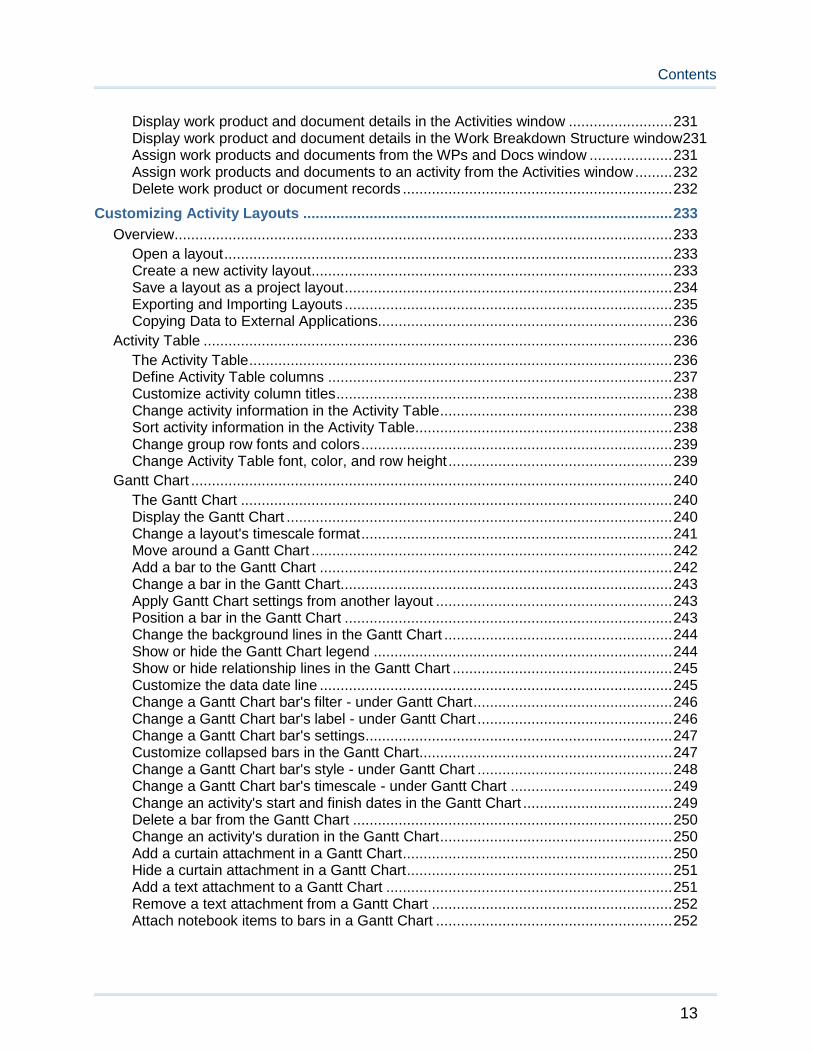
Display work product and document details in the Activities window ......................... 231 Display work product and document details in the Work Breakdown Structure window231 Assign work products and documents from the WPs and Docs window .................... 231 Assign work products and documents to an activity from the Activities window ......... 232 Delete work product or document records ................................................................. 232
Customizing Activity Layouts ......................................................................................... 233
Overview ........................................................................................................................ 233
Open a layout ............................................................................................................ 233 Create a new activity layout ....................................................................................... 233 Save a layout as a project layout ............................................................................... 234 Exporting and Importing Layouts ............................................................................... 235 Copying Data to External Applications....................................................................... 236
Activity Table ................................................................................................................. 236
The Activity Table ...................................................................................................... 236 Define Activity Table columns ................................................................................... 237 Customize activity column titles ................................................................................. 238 Change activity information in the Activity Table ........................................................ 238 Sort activity information in the Activity Table.............................................................. 238 Change group row fonts and colors ........................................................................... 239 Change Activity Table font, color, and row height ...................................................... 239
Gantt Chart .................................................................................................................... 240
The Gantt Chart ........................................................................................................ 240 Display the Gantt Chart ............................................................................................. 240 Change a layout's timescale format ........................................................................... 241 Move around a Gantt Chart ....................................................................................... 242 Add a bar to the Gantt Chart ..................................................................................... 242 Change a bar in the Gantt Chart................................................................................ 243 Apply Gantt Chart settings from another layout ......................................................... 243 Position a bar in the Gantt Chart ............................................................................... 243 Change the background lines in the Gantt Chart ....................................................... 244 Show or hide the Gantt Chart legend ........................................................................ 244 Show or hide relationship lines in the Gantt Chart ..................................................... 245 Customize the data date line ..................................................................................... 245 Change a Gantt Chart bar's filter - under Gantt Chart ................................................ 246 Change a Gantt Chart bar's label - under Gantt Chart ............................................... 246 Change a Gantt Chart bar's settings .......................................................................... 247 Customize collapsed bars in the Gantt Chart............................................................. 247 Change a Gantt Chart bar's style - under Gantt Chart ............................................... 248 Change a Gantt Chart bar's timescale - under Gantt Chart ....................................... 249 Change an activity's start and finish dates in the Gantt Chart .................................... 249 Delete a bar from the Gantt Chart ............................................................................. 250 Change an activity's duration in the Gantt Chart ........................................................ 250 Add a curtain attachment in a Gantt Chart ................................................................. 250 Hide a curtain attachment in a Gantt Chart ................................................................ 251 Add a text attachment to a Gantt Chart ..................................................................... 251 Remove a text attachment from a Gantt Chart .......................................................... 252 Attach notebook items to bars in a Gantt Chart ......................................................... 252
P6 Professional User's Guide
14
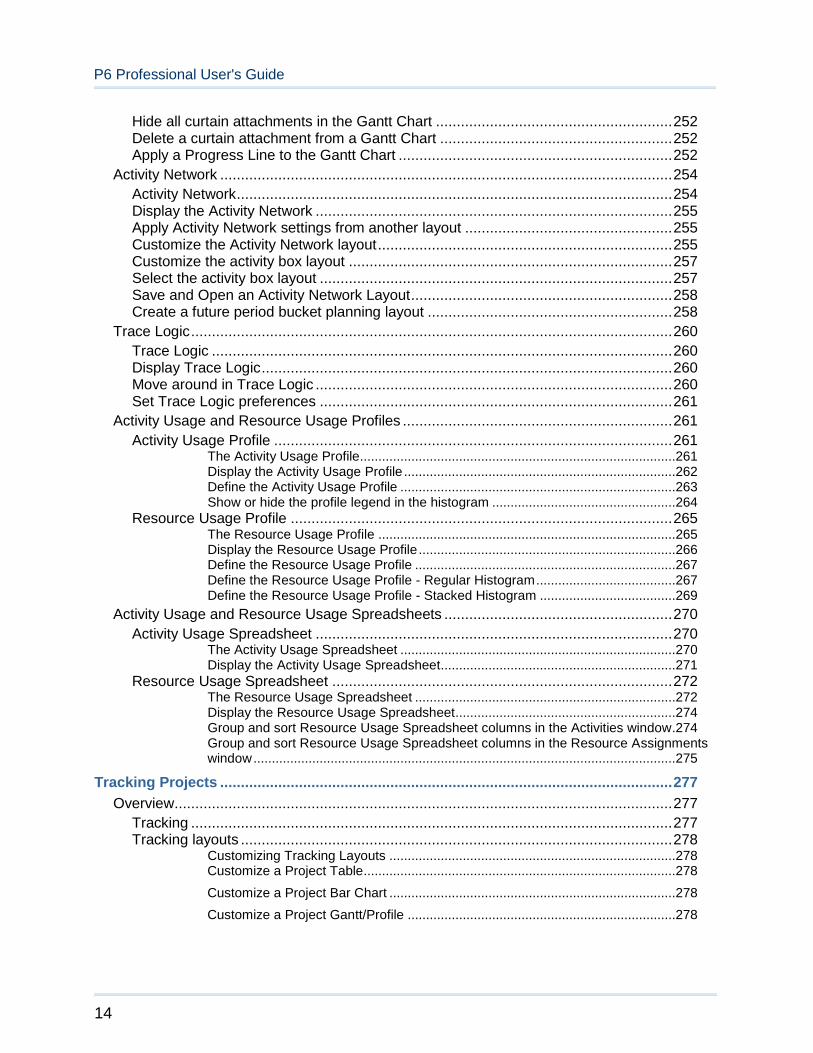
Hide all curtain attachments in the Gantt Chart ......................................................... 252 Delete a curtain attachment from a Gantt Chart ........................................................ 252 Apply a Progress Line to the Gantt Chart .................................................................. 252
Activity Network ............................................................................................................. 254
Activity Network ......................................................................................................... 254 Display the Activity Network ...................................................................................... 255 Apply Activity Network settings from another layout .................................................. 255 Customize the Activity Network layout ....................................................................... 255 Customize the activity box layout .............................................................................. 257 Select the activity box layout ..................................................................................... 257 Save and Open an Activity Network Layout ............................................................... 258 Create a future period bucket planning layout ........................................................... 258
Trace Logic .................................................................................................................... 260
Trace Logic ............................................................................................................... 260 Display Trace Logic ................................................................................................... 260 Move around in Trace Logic ...................................................................................... 260 Set Trace Logic preferences ..................................................................................... 261
Activity Usage and Resource Usage Profiles ................................................................. 261
Activity Usage Profile ................................................................................................ 261 The Activity Usage Profile......................................................................................261 Display the Activity Usage Profile ..........................................................................262 Define the Activity Usage Profile ...........................................................................263 Show or hide the profile legend in the histogram ..................................................264
Resource Usage Profile ............................................................................................ 265 The Resource Usage Profile .................................................................................265 Display the Resource Usage Profile ......................................................................266 Define the Resource Usage Profile .......................................................................267 Define the Resource Usage Profile - Regular Histogram ......................................267 Define the Resource Usage Profile - Stacked Histogram .....................................269
Activity Usage and Resource Usage Spreadsheets ....................................................... 270
Activity Usage Spreadsheet ...................................................................................... 270 The Activity Usage Spreadsheet ...........................................................................270 Display the Activity Usage Spreadsheet................................................................271
Resource Usage Spreadsheet .................................................................................. 272 The Resource Usage Spreadsheet .......................................................................272 Display the Resource Usage Spreadsheet............................................................274 Group and sort Resource Usage Spreadsheet columns in the Activities window.274 Group and sort Resource Usage Spreadsheet columns in the Resource Assignments window ...................................................................................................................275
Tracking Projects ............................................................................................................. 277
Overview ........................................................................................................................ 277
Tracking .................................................................................................................... 277 Tracking layouts ........................................................................................................ 278
Customizing Tracking Layouts ..............................................................................278 Customize a Project Table .....................................................................................278
Customize a Project Bar Chart ..............................................................................278
Customize a Project Gantt/Profile .........................................................................278

Contents
15
Customize a Resource Analysis layout .................................................................279
Grouping, Sorting, and Filtering Tracking Layouts ................................................279 Group and sort data in tracking layouts .................................................................279
Filter data in tracking layouts .................................................................................279
Create a tracking layout ............................................................................................ 279 Open a tracking layout .............................................................................................. 280 Types of tracking layouts ........................................................................................... 280 Share a layout with other users ................................................................................. 280 Save a tracking layout ............................................................................................... 281 Export a tracking layout ............................................................................................. 281 Import a tracking layout ............................................................................................. 281 Delete a tracking layout ............................................................................................. 281 Filter a tracking layout ............................................................................................... 282 Group and sort a tracking layout using standard settings .......................................... 282 Group and sort a tracking layout using custom settings ............................................. 283
Project Table ................................................................................................................. 284
Customize a Project Table ........................................................................................ 284
Project Bar Chart ........................................................................................................... 284
Customize a Project Bar Chart .................................................................................. 284
Project Gantt/Profile and Resource Analysis .................................................................. 284
Customize a Project Gantt/Profile .............................................................................. 284 Group and sort resources in the Resource Explorer window ..................................... 285 Filter resources in the Resource Explorer window ..................................................... 285 Working with the Gantt Chart .................................................................................... 286
Change a Gantt Chart bar's timescale ..................................................................286 Change a Gantt Chart bar's label ..........................................................................287 Change a Gantt Chart bar's style ..........................................................................287 Change a Gantt Chart's background lines .............................................................288 Customize the data date line .................................................................................288
Working with the Profile and Spreadsheet ................................................................. 288 Change a profile's background lines .....................................................................288
Grouping, Filtering, and Summarizing Data ................................................................... 291
Grouping and Sorting ..................................................................................................... 291
Grouping activities by field ......................................................................................... 291 Grouping by hierarchy ............................................................................................... 291 Grouping activities by WBS path ............................................................................... 291 Sorting ....................................................................................................................... 292 Group activities by field ............................................................................................. 293 Group activities by hierarchy ..................................................................................... 293 Group activities by WBS path .................................................................................... 294 Sort activities ............................................................................................................. 294 Format grouping bands ............................................................................................. 294 Set Page Breaks by Group Band............................................................................... 295 Show or hide empty title bands ................................................................................. 295 Show field titles in grouping bands ............................................................................ 296 Group and sort resource assignments ....................................................................... 296 Set as a user preference ........................................................................................... 296
P6 Professional User's Guide
16
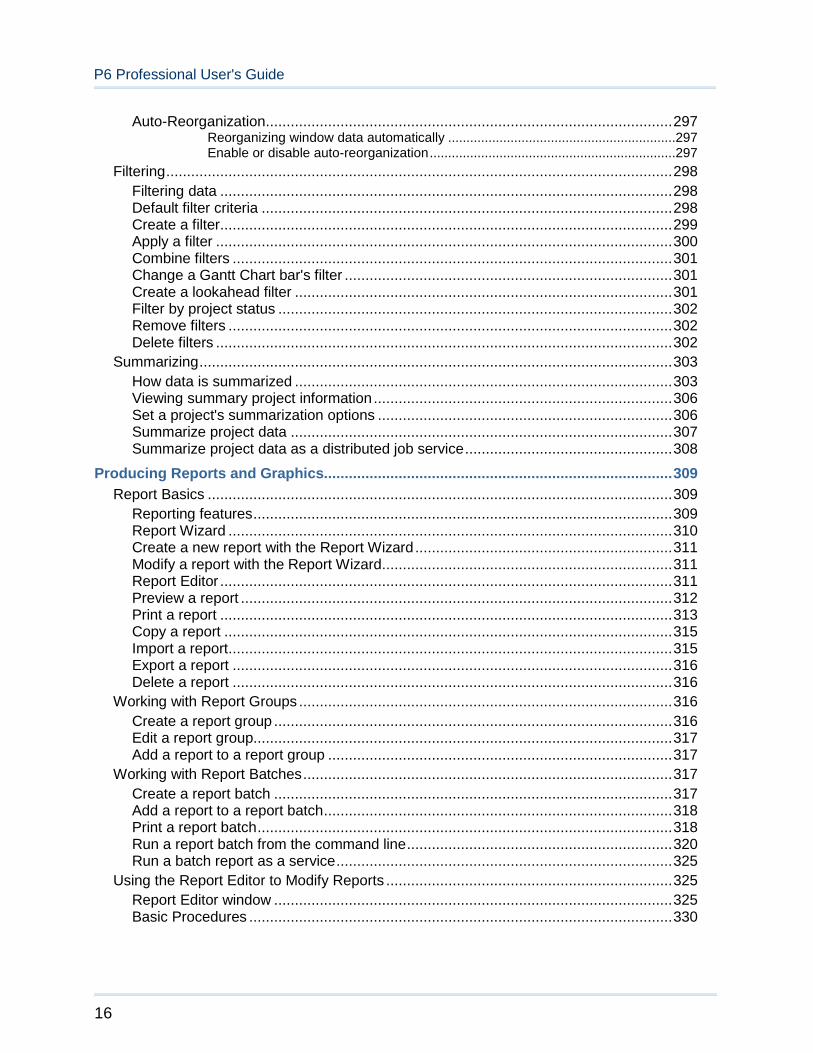
Auto-Reorganization .................................................................................................. 297 Reorganizing window data automatically ..............................................................297 Enable or disable auto-reorganization ...................................................................297
Filtering .......................................................................................................................... 298
Filtering data ............................................................................................................. 298 Default filter criteria ................................................................................................... 298 Create a filter ............................................................................................................. 299 Apply a filter .............................................................................................................. 300 Combine filters .......................................................................................................... 301 Change a Gantt Chart bar's filter ............................................................................... 301 Create a lookahead filter ........................................................................................... 301 Filter by project status ............................................................................................... 302 Remove filters ........................................................................................................... 302 Delete filters .............................................................................................................. 302
Summarizing .................................................................................................................. 303
How data is summarized ........................................................................................... 303 Viewing summary project information ........................................................................ 306 Set a project's summarization options ....................................................................... 306 Summarize project data ............................................................................................ 307 Summarize project data as a distributed job service .................................................. 308
Producing Reports and Graphics.................................................................................... 309
Report Basics ................................................................................................................ 309
Reporting features ..................................................................................................... 309 Report Wizard ........................................................................................................... 310 Create a new report with the Report Wizard .............................................................. 311 Modify a report with the Report Wizard ...................................................................... 311 Report Editor ............................................................................................................. 311 Preview a report ........................................................................................................ 312 Print a report ............................................................................................................. 313 Copy a report ............................................................................................................ 315 Import a report ........................................................................................................... 315 Export a report .......................................................................................................... 316 Delete a report .......................................................................................................... 316
Working with Report Groups .......................................................................................... 316
Create a report group ................................................................................................ 316 Edit a report group..................................................................................................... 317 Add a report to a report group ................................................................................... 317
Working with Report Batches ......................................................................................... 317
Create a report batch ................................................................................................ 317 Add a report to a report batch .................................................................................... 318 Print a report batch .................................................................................................... 318 Run a report batch from the command line ................................................................ 320 Run a batch report as a service ................................................................................. 325
Using the Report Editor to Modify Reports ..................................................................... 325
Report Editor window ................................................................................................ 325 Basic Procedures ...................................................................................................... 330
Contents
17
Copy and paste cells .............................................................................................330 Cut and paste cells ................................................................................................330 Add a report title ....................................................................................................330 Define default text styles for reports ......................................................................331 Define a report header and footer .........................................................................331 Define page setup options for a report ..................................................................333 Change report margins ..........................................................................................333 Add a background image to a report .....................................................................333 Remove a background image from a report ..........................................................334 Add comments to reports.......................................................................................334 Add comments when running a report ...................................................................334 Indicate hierarchy levels in reports ........................................................................335 Specify a timeperiod for a report ...........................................................................335
Advanced Procedures ............................................................................................... 337 Working with Data Sources ...................................................................................337 Data sources in reports ..........................................................................................337
Add a data source to a report ................................................................................337
Add an embedded data source to a report ............................................................338
Copy a data source ................................................................................................338
Cut and paste a data source..................................................................................338
Define layout options for a data source .................................................................339
Sort report records .................................................................................................339
Change the sort order of report records ................................................................339
Filter a data source ................................................................................................340
Delete a data source filter ......................................................................................340
Delete a data source from a report ........................................................................340
Delete a data source that contains embedded data sources ................................340
Working with Rows ................................................................................................341 Add a row to a report .............................................................................................341
Copy a row .............................................................................................................342
Cut and paste a row ...............................................................................................342
Filter a report row ...................................................................................................342
Delete a row filter ...................................................................................................342
Delete a row from a report .....................................................................................343
Working with Text Cells .........................................................................................343 Text cell types ........................................................................................................343
Add a field data or field title cell to a report ...........................................................343
Show time distributions in a report ........................................................................344
Add a variable cell to a report ................................................................................344
Add a custom text cell to a report ..........................................................................344
Format text in a text cell .........................................................................................344
Specify text cell width and alignment in a row .......................................................345
Change text cell color ............................................................................................345
P6 Professional User's Guide
18
Add a border to a text cell ......................................................................................345
Remove borders from a text cell ............................................................................346
Add HTML links to a text cell .................................................................................346
Disable HTML links in a text cell ............................................................................347
Filter a text cell .......................................................................................................347
Delete a text cell filter ............................................................................................347
Delete a text cell from a report...............................................................................347
Working with Line Cells .........................................................................................347 Add a line cell to a report .......................................................................................347
Specify line cell width and position in a row ..........................................................347
Delete a line cell from a report ...............................................................................348
Working with Image Cells ......................................................................................348 Add an image cell to a report .................................................................................348
Specify image cell width and position in a row ......................................................349
Add HTML links to an image cell ...........................................................................349
Disable HTML links in image cells .........................................................................350
Define HTML print settings for an image cell .........................................................350
Delete an image cell from a report ........................................................................350
Producing Graphics ....................................................................................................... 351
Print features ............................................................................................................. 351 Print a layout or window data .................................................................................... 351 Change page setup options ....................................................................................... 351 Select a specific printer to print a layout .................................................................... 353
Publishing Layouts and Reports in HTML Format .......................................................... 353
Publishing Project Web sites .......................................................................................... 355
Project Web Site Publisher ............................................................................................ 355
Project Web sites ........................................................................................................... 355
Publishing activity and tracking layouts .......................................................................... 356
Publish projects as Web sites ........................................................................................ 356
Publish activity and tracking layouts on a Project Website ............................................. 357
Publish reports on a Project Website ............................................................................. 358
Customize a Project Website ......................................................................................... 358
Publish Activity layouts .................................................................................................. 359
Publish tracking layouts ................................................................................................. 359
Importing and Exporting Data ......................................................................................... 361
Linking Contract Management (Expedition) data ............................................................ 361
Linking Contract Management data ........................................................................... 361 Link P6 Professional to Contract Management .......................................................... 362 Link your project to a Contract Management project .................................................. 362 Import Contract Management data ............................................................................ 363 Import considerations ................................................................................................ 364

Contents
19
How data is imported from Contract Management ..................................................... 364 Viewing Contract Management documents ............................................................... 366 View Contract Management documents .................................................................... 367
Import/Export Overview ................................................................................................. 367
Importing and exporting projects ............................................................................... 367 Importing and exporting resources and roles ............................................................. 368 Import/Export file formats .......................................................................................... 368 Importing information using a wizard ......................................................................... 371 Exporting information using a wizard ......................................................................... 372
XER ............................................................................................................................... 374
Export projects to an XER file .................................................................................... 374 Import projects in XER format ................................................................................... 375 Export resources to an XER file................................................................................. 377 Import resources from an XER file ............................................................................. 377 Export roles to an XER file ........................................................................................ 378 Import roles from an XER file .................................................................................... 378 Export projects from the command line ..................................................................... 379 Import projects from the command line ...................................................................... 382 Export projects as a service ...................................................................................... 385
Primavera P6 XML ......................................................................................................... 385
Export a project to an XML file .................................................................................. 385 Import a project in XML format .................................................................................. 386
P3 .................................................................................................................................. 389
Export a project for use with P3 ................................................................................. 389 Considerations when exporting projects to P3 ........................................................... 389 P6 Professional data not converted to P3 .................................................................. 392 Import a P3 project .................................................................................................... 393 Considerations when importing P3 projects ............................................................... 395 P3 data not converted to P6 Professional .................................................................. 402
Microsoft Excel/XLS ....................................................................................................... 403
Delete data in the XLS file ......................................................................................... 403 Modify Unique Fields in the XLS file .......................................................................... 403 Modifying and importing data from an XLS file .......................................................... 404 Export project data and resources to an XLS file ....................................................... 406 Import project information and resources in XLS format ............................................ 407 Update Unit, Cost, Duration, and Percent Complete fields in Excel ........................... 408 Export activity data to Excel ...................................................................................... 408
Microsoft Project ............................................................................................................ 409
Export projects to a Microsoft Project file ................................................................... 409 Import a Microsoft Project file .................................................................................... 410 Export resources to Microsoft Project (supported for MPP or MPX formats) .............. 412 Import resources from a Microsoft Project file (supported for MPP and MPX formats)412
Modify template options .........................................................................................412
Oracle Primavera Contractor ......................................................................................... 413
Export a project for use with Oracle Primavera Contractor ........................................ 413 Export resources for use with Oracle Primavera Contractor ...................................... 414 Data not exported to Oracle Primavera Contractor .................................................... 415
P6 Professional User's Guide
20
UN/CEFACT IMS (XML) ................................................................................................ 415
Export projects to a UN/CEFACT IMS (XML) file ....................................................... 415
Linking Primavera Unifier data (P6 EPPM Only) ............................................................ 417
Link a project with a Primavera Unifier Project (P6 EPPM Only)................................ 417
P6 Visualizer ..................................................................................................................... 417
P6 Visualizer overview ................................................................................................... 417
Launching P6 Visualizer from P6 Professional ............................................................... 418
21
In This Section
Using the P6 Professional User's Guide ................................................................... 21
Introducing P6 Professional ...................................................................................... 22
P6 Professional Industry Types (P6 EPPM Only) ...................................................... 23
Where to Get Documentation ................................................................................ 24
Where to Get Training .............................................................................................. 26
Where to Get Support .............................................................................................. 26
Using the P6 Professional User's Guide
P6 Professional can connect to two databases, a P6 Professional database and a P6
EPPM database. Depending on which database you are connected to, some topics
within the user's guide and some information within certain topics will be relevant while
others will not.
Topics that are only relevant to one database will be qualified in the title of the topic.
When a topic title is followed by (P6 Professional Only), this topic will only be relevant
when P6 Professional is connected to a P6 Professional database. When a topic is
followed by (P6 EPPM Only), this topic will only be relevant when P6 Professional is
connected to a P6 EPPM database. For example, the topic, "Defining Administration
Preferences (P6 Professional Only)," contains information only relevant when P6
Professional is connected to a P6 Professional database.
Other topics will include information that is relevant when connected to either database.
These topics will not be qualified. For example, the information in the topic, "Create a
project," applies when P6 Professional is connected to a P6 Professional database and
when P6 Professional is connected to a P6 EPPM database.
Other topics will include some information that is only relevant when connected to a P6
Professional and some that is only relevant when connected to a P6 EPPM database.
These topics will include conditional phrases such as:
"When connected to a P6 Professional database,"
"When P6 Professional is connected to a P6 EPPM database,"
"(P6 EPPM Only),"
"This icon only appears when P6 Professional is connected to a P6 Professional
database."
Welcome
P6 Professional User's Guide
22
Introducing P6 Professional
When P6 Professional is connected a P6 EPPM database:
P6 Professional is a separate component of P6 EPPM that integrates traditional project
management with streamlined resource and cost management.
It provides a set of robust features aimed primarily to address the needs of project
planners and schedulers. (P6 Professional connected to a P6 EPPM database is not used
to perform administrative or most enterprise-level tasks.)
P6 Professional features include the following:
Support of work breakdown structures (WBS), user-defined fields and codes,
critical-path-method (CPM) scheduling, and resource leveling.
Multiple users can access the same projects concurrently.
Issue tracking
Management by threshold
A tracking feature that enables you to perform dynamic cross-project rollups of cost,
schedule, and earned value
Work products and documents that can be assigned to activities and managed
centrally
Visualizer, which allows you to create time-based Gantt and Timescaled Logic
Diagram reports
Resource and role administration
A Report wizard that helps you create customized reports to extract any data from
the P6 EPPM database
When P6 Professional is connected a P6 Professional database:
P6 Professional is a comprehensive, multiproject planning and control software, built on
Oracle and Microsoft SQL Server relational databases for enterprise-wide project
management scalability. P6 Professional can stand alone for project and resource
management, and it enables your organization to store and manage its projects in a
central location. The module supports work breakdown structures (WBS), organizational
breakdown structures (OBS), user-defined fields and codes, critical-path-method (CPM)
scheduling, and resource leveling.
P6 Professional enables you to budget, prioritize, plan, administer, and manage multiple
projects; optimize limited, shared resources; control changes; and consistently move
projects to on-time and on-budget completion. It provides customizable interfaces,
scalable and flexible tools, and easy integration with project management software
outside of the P6 suite, including Oracle Primavera’s Contract Management module,
Oracle Project Planner (P3), Oracle Contractor, Microsoft Project, and Microsoft Excel.
P6 Professional provides

Welcome
23
An enterprise project structure (EPS), which enables project managers to manage
multiple projects, from the highest levels of the organization to the individuals that
perform specific project tasks. Multiple users can access the same projects
concurrently.
Integrated risk management
Issue tracking
Management by threshold
A tracking feature that enables you to perform dynamic cross-project rollups of cost,
schedule, and earned value
Work products and documents that can be assigned to activities and managed
centrally
Visualizer, which allows you to create time-based Gantt and Timescaled Logic
Diagram reports
Resource and role administration
A Report wizard that helps you create customized reports to extract any data from
the P6 Professional database
P6 Professional Industry Types (P6 EPPM Only)
P6 Professional requires you to choose an industry type. The industry type determines the
terminology and default calculation settings that display in P6 Professional. You choose
an industry type from P6, Application Settings, General link.
The following table lists each industry type and its corresponding terminology and default
settings. Choose the option that best matches your industry.
Industry Types
Industry Type Industry Terminology Examples
Default project comparison tool
Default startup window in P6 Professional
Engineering and
Construction
Budgeted Units
Budgeted Cost
Original Duration
Claim Digger Activities window
Government,
Aerospace, and
Defense
Planned Units
Planned Cost
Planned Duration
Schedule
Comparison
Projects window
High-Technology,
Manufacturing
Planned Units
Planned Cost
Planned Duration
Schedule
Comparison
Projects window
Utilities, Oil, and Gas Budgeted Units
Budgeted Cost
Original Duration
Claim Digger Projects window
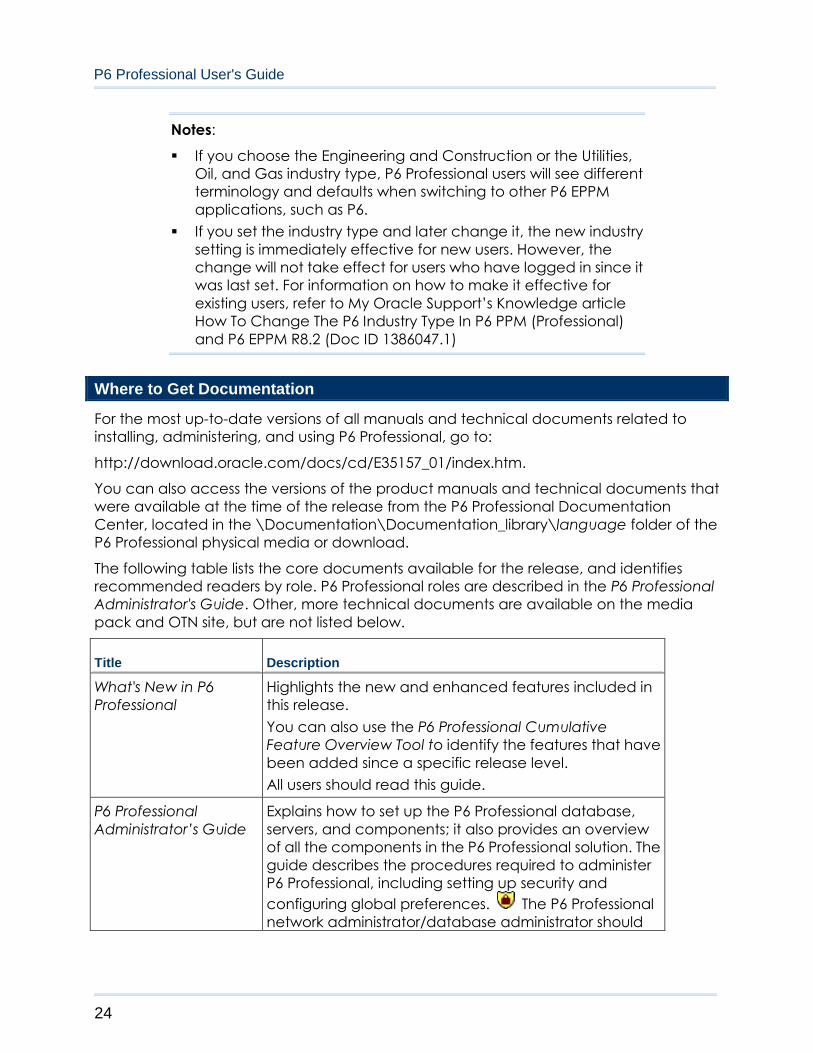
P6 Professional User's Guide
24
Notes:
If you choose the Engineering and Construction or the Utilities,
Oil, and Gas industry type, P6 Professional users will see different
terminology and defaults when switching to other P6 EPPM
applications, such as P6.
If you set the industry type and later change it, the new industry
setting is immediately effective for new users. However, the
change will not take effect for users who have logged in since it
was last set. For information on how to make it effective for
existing users, refer to My Oracle Support’s Knowledge article
How To Change The P6 Industry Type In P6 PPM (Professional)
and P6 EPPM R8.2 (Doc ID 1386047.1)
Where to Get Documentation
For the most up-to-date versions of all manuals and technical documents related to
installing, administering, and using P6 Professional, go to:
http://download.oracle.com/docs/cd/E35157_01/index.htm.
You can also access the versions of the product manuals and technical documents that
were available at the time of the release from the P6 Professional Documentation
Center, located in the \Documentation\Documentation_library\language folder of the
P6 Professional physical media or download.
The following table lists the core documents available for the release, and identifies
recommended readers by role. P6 Professional roles are described in the P6 Professional
Administrator's Guide. Other, more technical documents are available on the media
pack and OTN site, but are not listed below.
Title Description
What's New in P6
Professional
Highlights the new and enhanced features included in
this release.
You can also use the P6 Professional Cumulative
Feature Overview Tool to identify the features that have
been added since a specific release level.
All users should read this guide.
P6 Professional
Administrator’s Guide
Explains how to set up the P6 Professional database,
servers, and components; it also provides an overview
of all the components in the P6 Professional solution. The
guide describes the procedures required to administer
P6 Professional, including setting up security and
configuring global preferences. The P6 Professional
network administrator/database administrator should
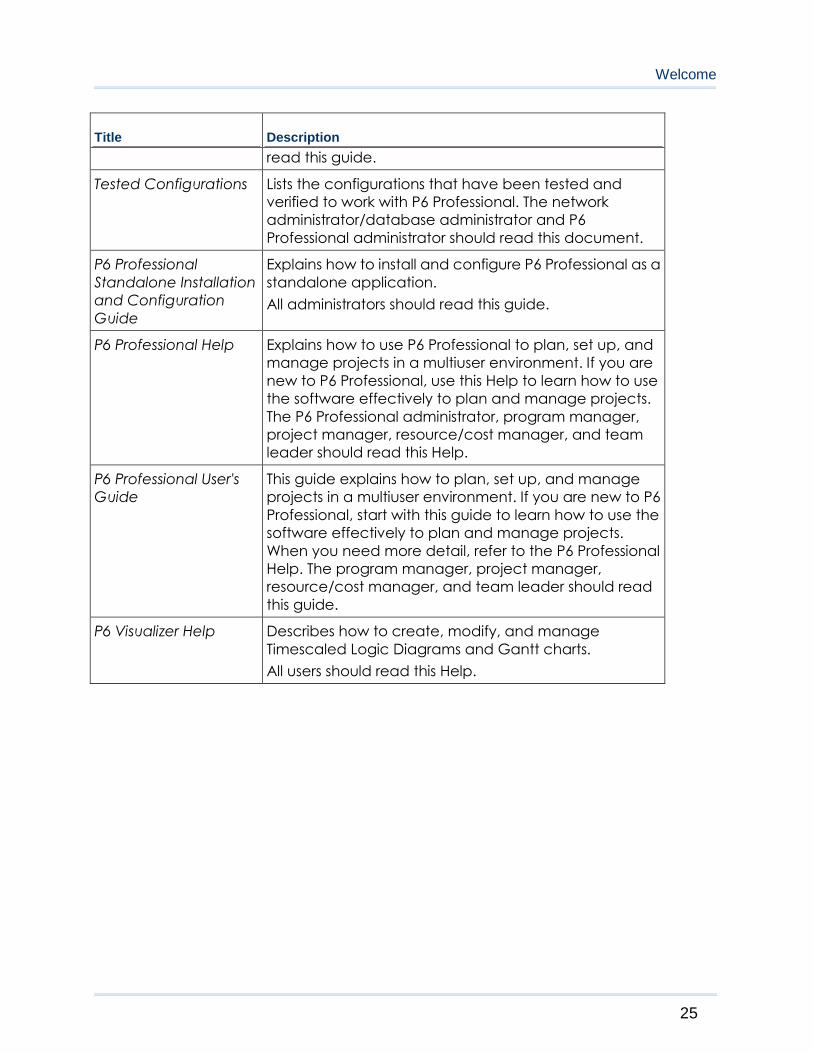
Welcome
25
Title Description
read this guide.
Tested Configurations Lists the configurations that have been tested and
verified to work with P6 Professional. The network
administrator/database administrator and P6
Professional administrator should read this document.
P6 Professional
Standalone Installation
and Configuration
Guide
Explains how to install and configure P6 Professional as a
standalone application.
All administrators should read this guide.
P6 Professional Help Explains how to use P6 Professional to plan, set up, and
manage projects in a multiuser environment. If you are
new to P6 Professional, use this Help to learn how to use
the software effectively to plan and manage projects.
The P6 Professional administrator, program manager,
project manager, resource/cost manager, and team
leader should read this Help.
P6 Professional User's
Guide
This guide explains how to plan, set up, and manage
projects in a multiuser environment. If you are new to P6
Professional, start with this guide to learn how to use the
software effectively to plan and manage projects.
When you need more detail, refer to the P6 Professional
Help. The program manager, project manager,
resource/cost manager, and team leader should read
this guide.
P6 Visualizer Help Describes how to create, modify, and manage
Timescaled Logic Diagrams and Gantt charts.
All users should read this Help.

P6 Professional User's Guide
26
Title Description
P6 Professional SDK
Help
Describes how to use the P6 Professional SDK to connect
to the P6 Professional database. Describes the tables,
fields, and stored procedures that you can access
through the P6 Professional SDK. Provides examples
that show how you can use the P6 Professional SDK to
perform several basic tasks, such as creating a new
project or assigning a resource to a project activity. The
P6 Professional network administrator/database
administrator should read this documentation, which is
available in local drive\Program
Files\Oracle\Primavera P6 Professional\PMSDK\Doc\
by default.
Double-click the p6_pro_sdk.chm file to open the help
file.
P3 to P6 Professional
Migration Guide
This guide provides best practices for migrating your P3
data to P6 Professional, and details how P3 functionality
maps to P6 Professional functionality.
All administrators should read this guide.
Distributing Information to the Team
You can copy the online documentation to a network drive for access by project
participants. Each team member can then view or print those portions that specifically
relate to his or her role in the organization.
Throughout this documentation, the Security Guidance icon helps you to quickly
identify security-related content to consider during the installation and configuration
process.
Where to Get Training
To access comprehensive training for all Primavera products, go to:
http://education.oracle.com
Where to Get Support
Access to Oracle Support
Oracle customers have access to electronic support through My Oracle Support. For
information, visit http://www.oracle.com/us/support/contact-068555.html or visit
http://www.oracle.com/us/corporate/accessibility/support/index.html if you are hearing
impaired.

Welcome
27
Using Primavera's Support Resource Centers
Primavera’s Support Resource Center provides links to important support and product
information. Primavera's Product Information Centers (PICs) organize documents found
on My Oracle Support (MOS), providing quick access to product and version specific
information such as important knowledge documents, Release Value Propositions, and
Oracle University training. PICs also offer documentation on Lifetime Management, from
planning to installs, upgrades, and maintenance.
Visit https://support.oracle.com/epmos/faces/DocumentDisplay?id=1486951.1 to
access links to all of the current PICs.
PICs also provide access to:
Communities are moderated by Oracle providing a place for collaboration among
industry peers to share best practices.
News from our development and strategy groups.
Education contains a list of available Primavera product trainings through Oracle
University. The Oracle Advisor Webcast program brings interactive expertise straight
to the desktop using Oracle Web Conferencing technology. This capability brings you
and Oracle experts together to access information about support services, products,
technologies, best practices, and more.
For more information about working with Support, visit
https://support.oracle.com/epmos/faces/DocumentDisplay?id=888813.2.

29
In This Section
Why Use P6 Professional? ......................................................................................... 29
Your Role in the Organization ................................................................................. 30
P6 Professional Process Overview ........................................................................... 33
Planning, Controlling, and Managing Projects ..................................................... 33
Why Use P6 Professional?
Large businesses typically have hundreds or even thousands of projects underway at
one time to create the new products and services that build their future. These projects
cross normal business hierarchies and chains of command, making project management
an organization-wide challenge. The pressure to complete projects on time, within
budget, and maintain a competitive edge, is driving corporations to develop and
implement and project management process. They are moving away from a
traditional functional structure to a multi-project organization that must achieve clear,
often urgent goals, using limited, shared resources. They need the fastest business
payback from those projects to realize potential revenue and increase shareholder
equity.
P6 Professional provides comprehensive information on all projects in an organization,
from executive-level summaries to detailed plans by project. Individuals across all levels
of the company can analyze, record, and communicate reliable information and make
timely informed decisions that support their corporate mission. By putting the right tools in
the right hands, P6 Professional enables an organization to:
Make strategic business decisions;
Control the minute detail that is necessary to finish projects;
Understand current resource demands, set priorities, and evaluate long-term staffing
requirements;
Use skilled resources effectively and productively;
Reorganize projects to fit shifting priorities without sacrificing quality.
Why Use P6 Professional in an P6 EPPM environment?
This topic highlights some functions that are available in in P6 Professional.
Understanding Project Management
P6 Professional User's Guide
30
Reflections Projects
What is a reflection (on page 203)
Creating and using reflections (on page 204)
Create a Reflection (on page 204)
Merging a Reflection with the Source project (on page 205)
Future Period Bucket Planning
Manually Planning Future Period Assignments (on page 150)
Create a future period bucket planning layout (on page 152)
Manually enter future period assignment values (on page 153)
Editing Past Period Actual Spreads
Edit past period actual data (on page 201)
Project Check Out and Check In
Managing remote projects (on page 207)
Check out a project (on page 207)
View the check-out status of a project (on page 208)
Modify check in update options (on page 208)
Check in a project (on page 209)
Import from Contract Management
Linking Contract Management data (on page 361)
Link P6 Professional to Contract Management (on page 362)
Link your project to a Contract Management project (on page 362)
Import Contract Management data (on page 363)
How data is imported from Contract Management (on page 364)
Viewing Contract Management documents (on page 366)
View Contract Management documents (on page 367)
Your Role in the Organization
P6 Professional meets the needs of several types of users. The following section describes
the P6 Professional application audience by roles. Roles may vary or overlap depending
on the organization.
Understanding Project Management
31
Network administrators
Network administrators configure an organization's network environment (local- and
wide-area networks) for optimal performance with P6 applications. They install and
maintain the server and client components of the applications. In addition, they
manage user access to data and develop and maintain a comprehensive security
policy to ensure that data are protected from unauthorized access, theft, or damage.
Network administrators ensure that the hardware and software supporting P6
applications function reliably by
Setting up and maintaining the network to ensure reliable connections and the
fastest possible data transfer
Creating and maintaining accurate lists of network resources and users so that each
has a unique network identity
Database administrators
Database administrators (DBAs) are responsible for setting up, managing, and assigning
access rights for the P6 Professional databases. They set and oversee rules governing the
use of corporate databases, maintain data integrity, and set interoperability standards.
Database administrators ensure reliable access to the P6 Professional database by
Installing, configuring, and upgrading database server software and related products
as required
Creating and implementing the database
Implementing and maintaining database security, including creating and
maintaining users, roles, and privileges for the database
Monitoring database performance and tuning as needed
Planning for growth and changes and establishing and maintaining backup and
recovery policies and procedures
Operations executives
Operations executives are responsible for strategic planning and ongoing performance
analysis. They use P6 Professional to analyze schedule, resource, and cost data across
projects.
Senior executives may be responsible for
Prioritizing projects
The profit/loss for a specific business entity
Funding and go/no-go decisions about projects
Strategic planning over the future of the business or division
Project controls coordinators
Project controls coordinators are responsible for ensuring that Primavera applications are
implemented properly and operate smoothly. They play a key role during
implementation by:

P6 Professional User's Guide
32
Working with operations executives and program/project managers to structure
project, organization breakdown structure (OBS), and resource hierarchies, set up
basic calendars, and define organization-wide custom fields and codes in the P6
Professional.
Assigning security rights to users in P6 Professional
Program managers
Program managers oversee several high-level project managers; they are responsible
for multiple projects and use P6 Professional, along with P6 to:
Perform cross-project analysis
Manage projects to on-time and on-budget completion
Prioritize resources across projects
Plan projects before they are funded
Project managers
Project managers manage multiple small, repetitive projects or a single, complex
project. They are responsible for on-time/on-budget completion of the projects and use
P6 Professional and P6 to:
Allocate specific named resources to a project in conjunction with the functional
manager of those resources
Communicate project information both up and down the chain of command
Manage resources related to the project
Resource/Cost managers
Resource managers allocate resources across projects and distribute their workloads.
They are responsible for resource planning, including recruiting, hiring, and training
resources, and they may be responsible for loading resource information in P6
Professional and the Resource section of P6. Cost managers perform detailed financial
analysis of projects, handle project billing, and integrate financial information within the
company.
Team leaders
Team leaders manage the work for a portion of a larger project. They are managers who
produce work and manage a team, and they often use P6 Professional, and P6, to
prioritize short-term tasks or objectives, typically when the duration is less than the
planning period of the project.
Team members (P6 EPPM Only)
Team members are trained in a specific skill required on a project. They work with their
manager to develop activities and durations for incorporation into the schedule. Once
activities are added to the schedule, team members update them using the Progress
Reporter module to indicate the work they performed during designated accounting
periods. Team members may also use personalized dashboards in P6 to quickly access
their projects, activities, documents, and more.
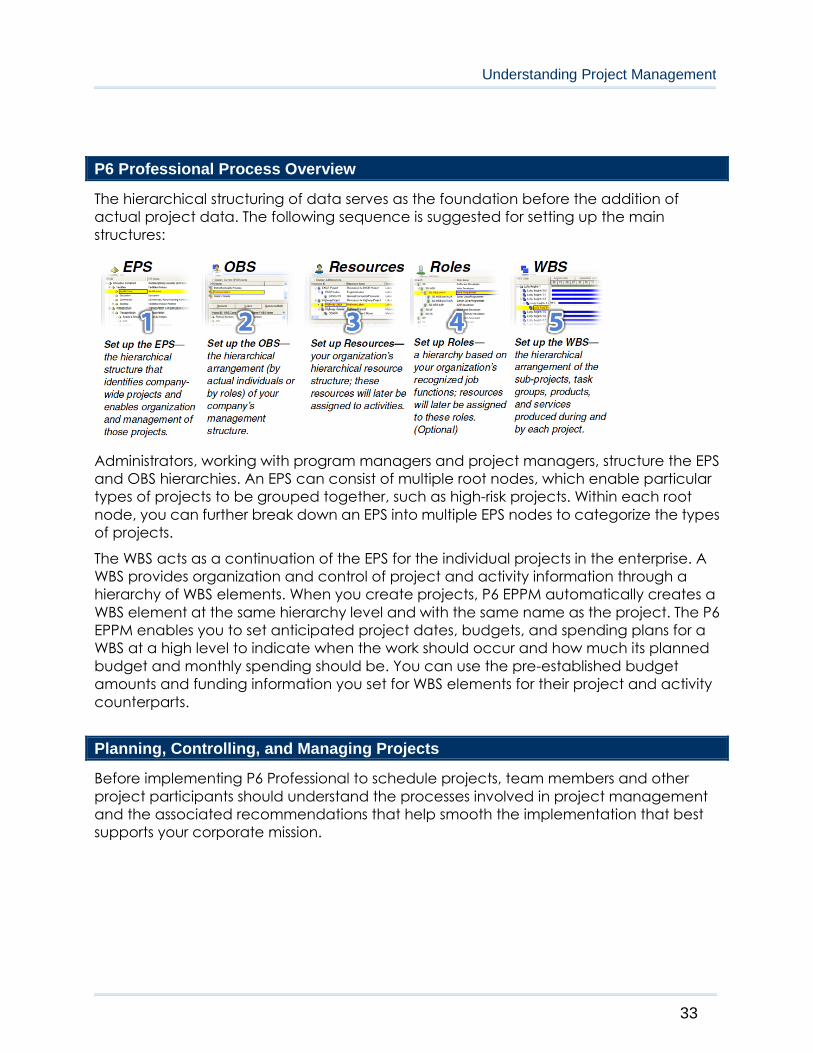
Understanding Project Management
33
P6 Professional Process Overview
The hierarchical structuring of data serves as the foundation before the addition of
actual project data. The following sequence is suggested for setting up the main
structures:
Administrators, working with program managers and project managers, structure the EPS
and OBS hierarchies. An EPS can consist of multiple root nodes, which enable particular
types of projects to be grouped together, such as high-risk projects. Within each root
node, you can further break down an EPS into multiple EPS nodes to categorize the types
of projects.
The WBS acts as a continuation of the EPS for the individual projects in the enterprise. A
WBS provides organization and control of project and activity information through a
hierarchy of WBS elements. When you create projects, P6 EPPM automatically creates a
WBS element at the same hierarchy level and with the same name as the project. The P6
EPPM enables you to set anticipated project dates, budgets, and spending plans for a
WBS at a high level to indicate when the work should occur and how much its planned
budget and monthly spending should be. You can use the pre-established budget
amounts and funding information you set for WBS elements for their project and activity
counterparts.
Planning, Controlling, and Managing Projects
Before implementing P6 Professional to schedule projects, team members and other
project participants should understand the processes involved in project management
and the associated recommendations that help smooth the implementation that best
supports your corporate mission.
P6 Professional User's Guide
34
If you were driving to a place you had never seen, would you get in the car without
directions or a map? Probably not. More than likely you'd take the time to plan your trip,
consider alternate routes, and estimate your time of arrival. Planning the drive before you
even left would help your trip to be more successful. And, along the way, should you
encounter road blocks or traffic delays, you would have already identified alternate
ways to reach your destination.
Project management follows the same methodology and purpose; to achieve each
project's goals, you need to plan them in advance. Good project management is no
longer an option in today's corporate world. It is a critical tool to help your company stay
on target and accomplish its goals.
Simply stated, project management is the process of achieving set goals within the
constraints of time, budget, and staffing restrictions. It allows you to get the most out of
your available resources. Resources include
People
Materials
Money
Equipment
Information
Facilities
Roles
Project portfolio management factors in all of these variables across multiple projects,
enabling project managers and company executives to see an accurate picture of how
each project's resource use affects other projects.
The process of project management is guided by three key principles:
Planning
Controlling
Managing
Planning a project
The first step in project management is to define your project.
1) What is the scope of the work? What activities will make up the project and what is
their relationship to each other? You'll want to identify the major milestones that will
help you monitor the project's progress.
2) What is the project duration? What are the dates when the project will begin and
end?
3) What resources are available to the project? Beyond labor, think about all the types
of resources you will require.
4) Who will perform what tasks? Determining your labor resources and their available
workhours is a key part of building a successful project. You'll need to plan for
downtime and holidays and determine the regular workweek for various staffing
types.
Understanding Project Management
35
5) How much will the project cost? What are the costs per resource? Are there any
hidden project costs?
6) What is the estimate budget? Establishing a project budget estimate in advance
helps you monitor possible cost overruns.
The answers to these questions form the framework of your project.
Controlling a project
Once you have built your project and estimated your budgeting needs, you save this
original plan as a baseline, or target schedule, to help you control the project. A baseline
provides a solid point of reference as your schedule changes over time. It allows you to
compare the original schedule to the current one and identify significant changes and
develop contingency plans.
You control a project to keep it heading in the right direction. You'll want to track work
progress and costs, compare them to your baseline, and then recommend what actions
should be taken.
Effective project control reaps many benefits. It allows you to keep a close eye on
possible problems before they become critical. It lets the project team and senior
management view cost and scheduling timeframes based on the reality of the
schedule.
Managing a project
The process of guiding a project from start to finish is the responsibility of a project
manager. A good project manager wears many hats, acting at various times as a
motivator, communicator, coordinator, and advisor. As you control the project's
progress, it is your job to keep your team aware of changes to the schedule and possible
consequences. In many ways, you are the project's ambassador, ensuring that your
project organization is carrying out its responsibilities for the best possible outcome.
To be an effective project manager also requires consistency when you update your
projects. Select a day each week, or biweekly, when you will regularly update projects.
This regular update will include progress on values such as
Dates on which activities started or finished
Dates when resources are consumed
Changes to resource rates
Determine a standard policy for the update and scheduling procedure, and for
reporting progress.
The Project Management module provides many tools to assist you in reporting progress
to both team members and senior management. Use the Project Web Site option to
create a central location where team members can view project progress. Consider the
many system reports as a means for communicating change. In addition, senior
management can use the Portfolios section of P6 to summarize project data and easily
capture a snapshot of how a project or group of projects is progressing.

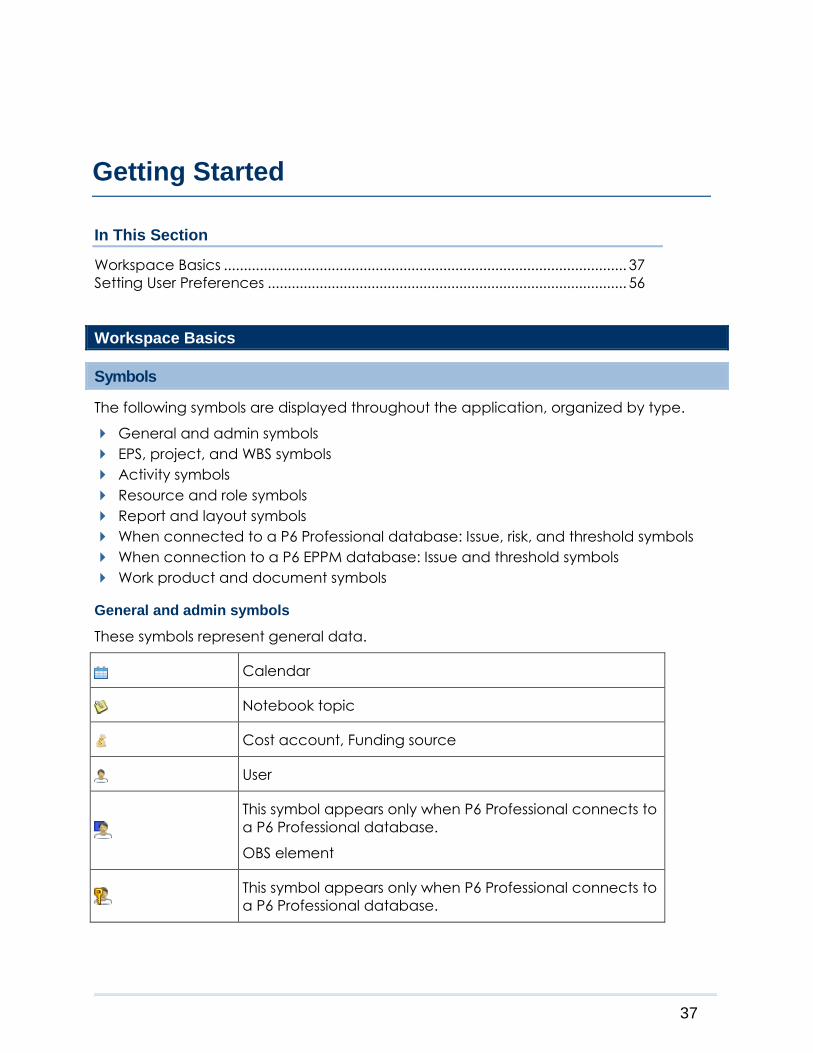
37
In This Section
Workspace Basics ..................................................................................................... 37
Setting User Preferences .......................................................................................... 56
Workspace Basics
Symbols
The following symbols are displayed throughout the application, organized by type.
General and admin symbols
EPS, project, and WBS symbols
Activity symbols
Resource and role symbols
Report and layout symbols
When connected to a P6 Professional database: Issue, risk, and threshold symbols
When connection to a P6 EPPM database: Issue and threshold symbols
Work product and document symbols
General and admin symbols
These symbols represent general data.
Calendar
Notebook topic
Cost account, Funding source
User
This symbol appears only when P6 Professional connects to
a P6 Professional database.
OBS element
This symbol appears only when P6 Professional connects to
a P6 Professional database.
Getting Started
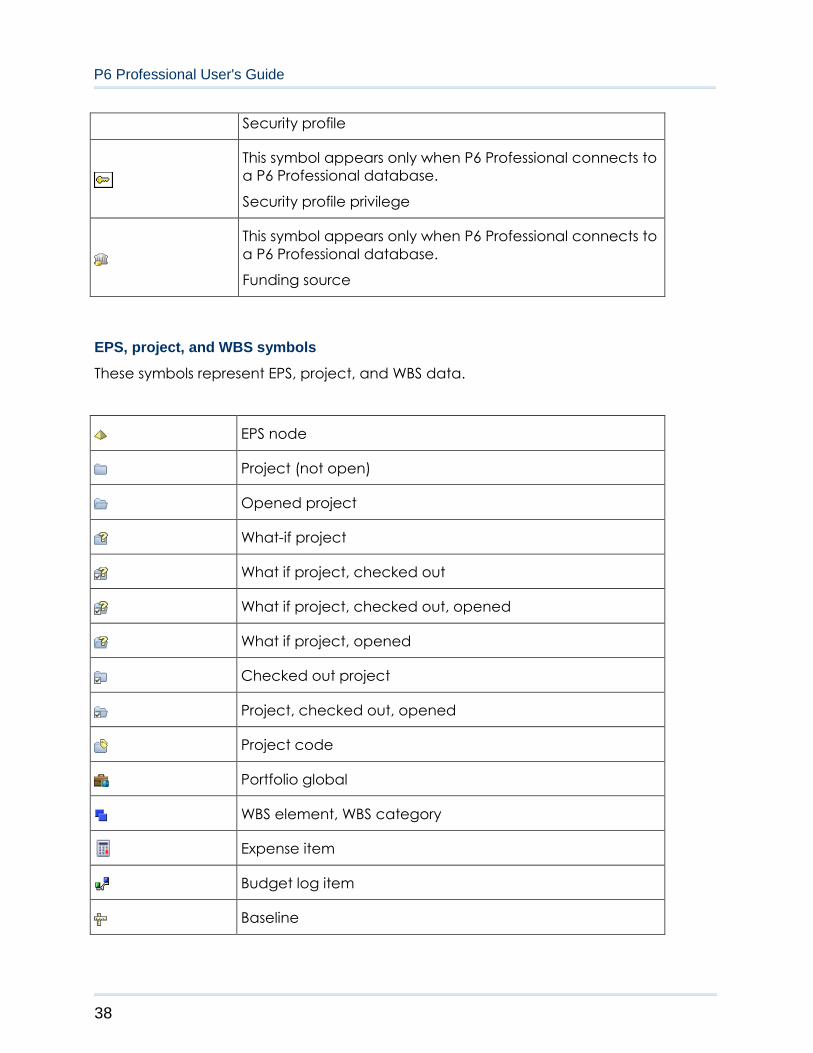
P6 Professional User's Guide
38
Security profile
This symbol appears only when P6 Professional connects to
a P6 Professional database.
Security profile privilege
This symbol appears only when P6 Professional connects to
a P6 Professional database.
Funding source
EPS, project, and WBS symbols
These symbols represent EPS, project, and WBS data.
EPS node
Project (not open)
Opened project
What-if project
What if project, checked out
What if project, checked out, opened
What if project, opened
Checked out project
Project, checked out, opened
Project code
Portfolio global
WBS element, WBS category
Expense item
Budget log item
Baseline

Getting Started
39
WBS milestone
Activity symbols
These symbols represent activity data.
Activity (Not started)
Activity has been marked as Started
Activity has been marked as Finished
Activity codes
Activity successor
Activity predecessor
Activity resource assignment
Activity step
Activity role assignment
This symbol appears only when P6 Professional connects to
a P6 Professional database.
Activity steps template
Resource and role symbols
These symbols represent resource and role data.
Resource, Labor
Resource, Non Labor
Resource assigned to current project
Resource code
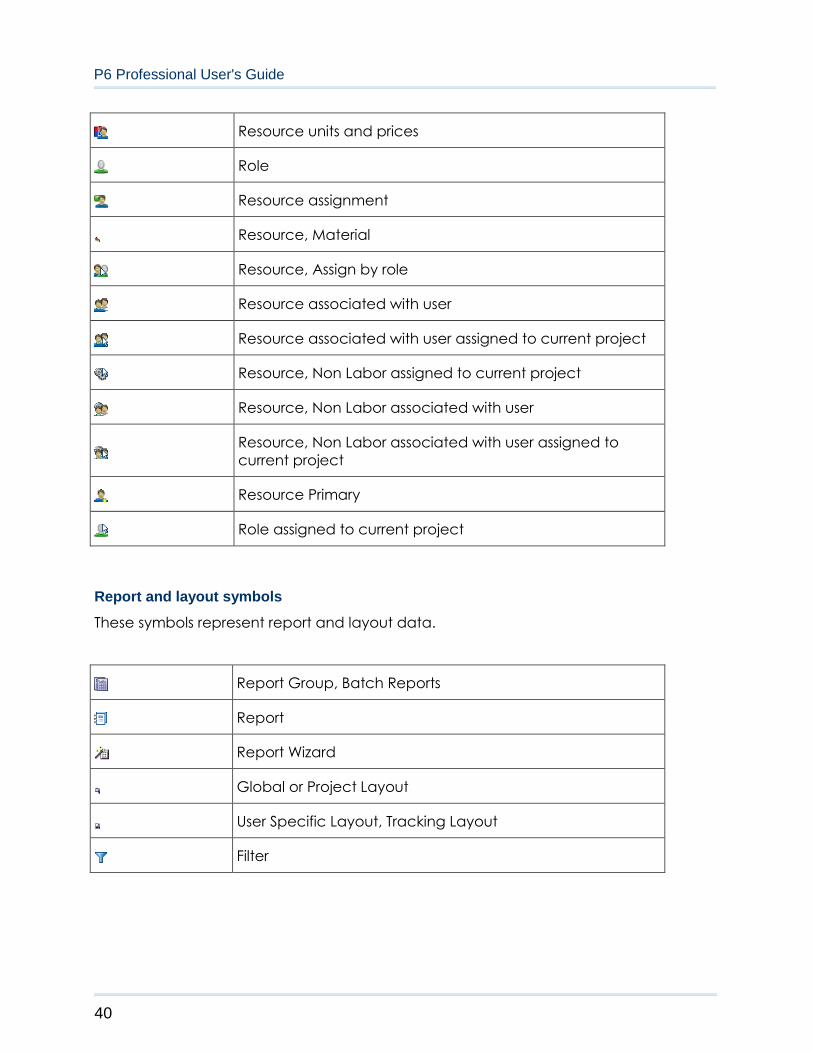
P6 Professional User's Guide
40
Resource units and prices
Role
Resource assignment
Resource, Material
Resource, Assign by role
Resource associated with user
Resource associated with user assigned to current project
Resource, Non Labor assigned to current project
Resource, Non Labor associated with user
Resource, Non Labor associated with user assigned to
current project
Resource Primary
Role assigned to current project
Report and layout symbols
These symbols represent report and layout data.
Report Group, Batch Reports
Report
Report Wizard
Global or Project Layout
User Specific Layout, Tracking Layout
Filter
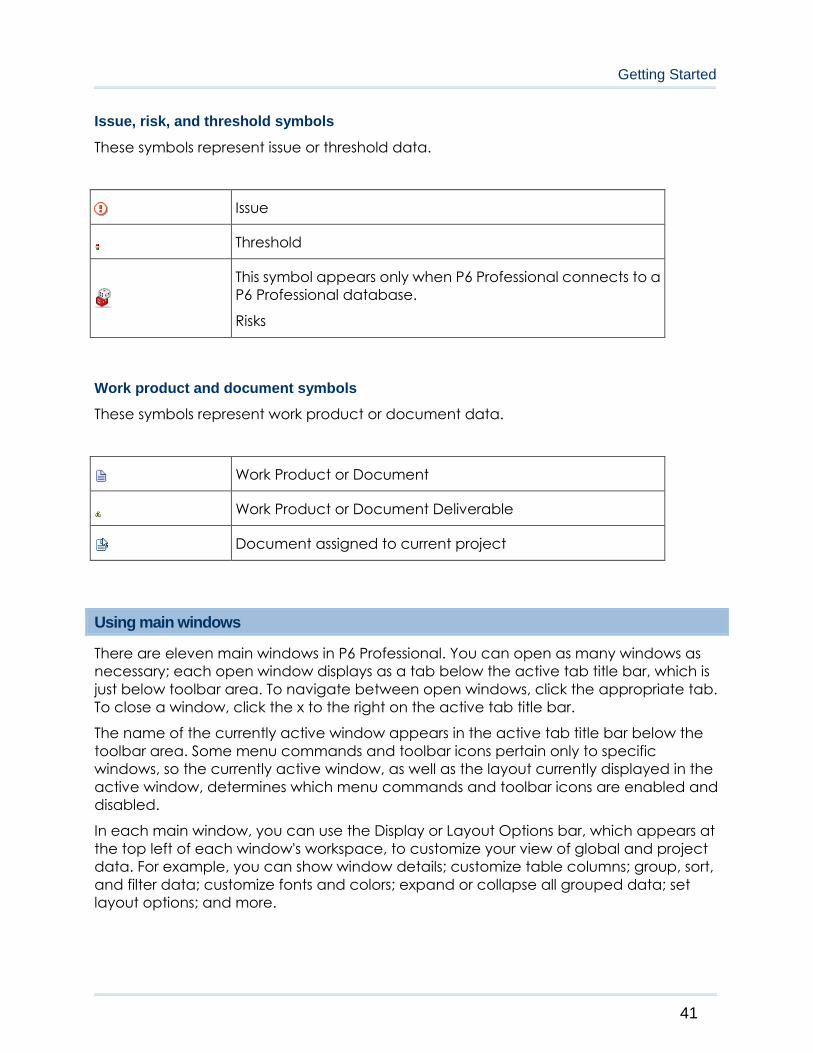
Getting Started
41
Issue, risk, and threshold symbols
These symbols represent issue or threshold data.
Issue
Threshold
This symbol appears only when P6 Professional connects to a
P6 Professional database.
Risks
Work product and document symbols
These symbols represent work product or document data.
Work Product or Document
Work Product or Document Deliverable
Document assigned to current project
Using main windows
There are eleven main windows in P6 Professional. You can open as many windows as
necessary; each open window displays as a tab below the active tab title bar, which is
just below toolbar area. To navigate between open windows, click the appropriate tab.
To close a window, click the x to the right on the active tab title bar.
The name of the currently active window appears in the active tab title bar below the
toolbar area. Some menu commands and toolbar icons pertain only to specific
windows, so the currently active window, as well as the layout currently displayed in the
active window, determines which menu commands and toolbar icons are enabled and
disabled.
In each main window, you can use the Display or Layout Options bar, which appears at
the top left of each window's workspace, to customize your view of global and project
data. For example, you can show window details; customize table columns; group, sort,
and filter data; customize fonts and colors; expand or collapse all grouped data; set
layout options; and more.
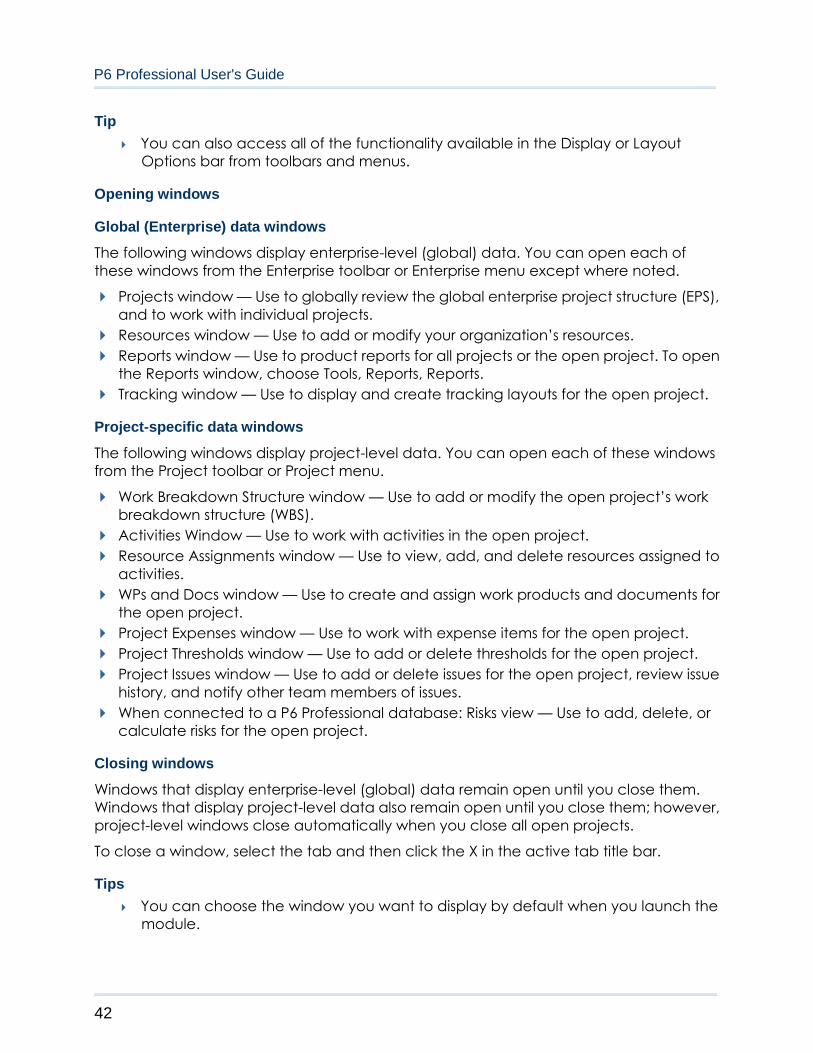
P6 Professional User's Guide
42
Tip
You can also access all of the functionality available in the Display or Layout
Options bar from toolbars and menus.
Opening windows
Global (Enterprise) data windows
The following windows display enterprise-level (global) data. You can open each of
these windows from the Enterprise toolbar or Enterprise menu except where noted.
Projects window — Use to globally review the global enterprise project structure (EPS),
and to work with individual projects.
Resources window — Use to add or modify your organization’s resources.
Reports window — Use to product reports for all projects or the open project. To open
the Reports window, choose Tools, Reports, Reports.
Tracking window — Use to display and create tracking layouts for the open project.
Project-specific data windows
The following windows display project-level data. You can open each of these windows
from the Project toolbar or Project menu.
Work Breakdown Structure window — Use to add or modify the open project’s work
breakdown structure (WBS).
Activities Window — Use to work with activities in the open project.
Resource Assignments window — Use to view, add, and delete resources assigned to
activities.
WPs and Docs window — Use to create and assign work products and documents for
the open project.
Project Expenses window — Use to work with expense items for the open project.
Project Thresholds window — Use to add or delete thresholds for the open project.
Project Issues window — Use to add or delete issues for the open project, review issue
history, and notify other team members of issues.
When connected to a P6 Professional database: Risks view — Use to add, delete, or
calculate risks for the open project.
Closing windows
Windows that display enterprise-level (global) data remain open until you close them.
Windows that display project-level data also remain open until you close them; however,
project-level windows close automatically when you close all open projects.
To close a window, select the tab and then click the X in the active tab title bar.
Tips
You can choose the window you want to display by default when you launch the
module.

Getting Started
43
Window tabs are displayed in the order in which you opened them. To change
the display order of window tabs, select a tab, then drag it to the appropriate
location.
Using Hint Help
Field descriptions, called Hint Help, are provided for column values in various windows.
To access Hint Help
Choose View, Hint Help. Move the mouse pointer over any column.
Choose the Hint Help command again to turn off Hint Help.
Tip
When P6 Professional is connected to a P6 Professional database, you can also
press Alt +F1 to access Hint Help.
Using the Status Bar and Layout Options bar
Windows and dialog boxes contain a number of special and unique features.
Status bar
The Status bar is a message bar at the bottom of the window that displays information
that can include the name of the current portfolio, the access mode, the data date, the
current baseline, the job status of the last job request, the current user name, and the
name of the database alias chosen at login as well as database type, where database
type when connected to a P6 Professional database would display as (Professional) or
where database type when connected to a P6 EPPM database would display as (EPPM).

P6 Professional User's Guide
44
Layout Options bar
Most windows and dialog boxes include an Options bar at the top of the screen that
displays the name of the current layout and filter, and that you can click to display a
number of commands that enable you to customize the current display. Click the
Options bar to display a menu of the commands available for that window or dialog
box.
You can also view hierarchical information, such as the work breakdown structure, in
table (list) or chart view (hierarchy) format.
Note
When you view data in chart view format, you can display up to 2,000 boxes.
Display window details
You can display detail information for many elements, such as projects, resources, and
activities.
To display details for a window, such as Projects or Activities, choose View, Show
on Bottom, Details, or click on the Bottom Layout toolbar. See Bottom Layout
Toolbar.
To display details in a dialog box, such as Roles or OBS, click the Display Options
bar in the dialog box, then choose the Details option.
Tile windows horizontally or vertically
You can tile windows horizontally or vertically by opening multiple tab groups. Tiling is
useful when you are working in multiple windows and do not want to toggle back and
forth between window tabs. For example, you could tile the WBS and Activities windows
to simultaneously work with the open project's WBS and activity list.
When you tile horizontally, the workspace is split into top and bottom tab groups. When
you tile vertically, the workspace is split into left and right tab groups. You can display as
many window tabs as necessary in each tab group, but you can not display the same
window tab in more than one tab group. You can create a maximum of one tab group
for each main window.

Getting Started
45
Notes:
For a tab group, only the active tab title bar appears, not a tab, when only one
tab is open.
The name of the currently active tab appears in the active tab title bar.
To tile windows:
1) Open each window you want to work with.
2) To create a new tab group at the bottom of the screen, ensure the tab you want to
move is the currently active tab. Then choose View, Tab Groups, New Horizontal Tab
Group. If multiple views are tiled horizontally, the new view appears as the last group
on the bottom.
You can also create a new tab group by dragging the tab or active tab title bar to
the bottom of the screen and releasing (dropping) it when you see the formation of a
rectangular outline. Repeat if necessary.
3) To create a new tab group at the side of the screen, ensure the tab you want to
move is the currently active tab. Then choose View, Tab Groups, New Vertical Tab
Group. If multiple views are tiled vertically, the new view appears as the last group on
the outer-most side.
You can also create a new tab group by dragging the tab or active tab title bar to
the side of the screen and releasing (dropping) it when you see the formation of a
rectangular outline. Repeat if necessary.
4) To move additional tabs into an existing tab group, drag the tab or active tab title bar
to the targeted tab group; release (drop) it when you see the formation of an outline
with a tab under the active tab title bar of the targeted tab group. Repeat if
necessary.
5) To remove all tab groupings and display all open tabs in one tab group, choose View,
Tab Groups, Merge all Tab Groups.
Tip
Drag the horizontal splitter bar to increase or decrease the size of the top and
bottom tab groups; drag the vertical splitter bar to increase or decrease the size
of the left and right tab groups.
Wizards
Wizards are a great way to speed up your work. They quickly guide you through
repetitive tasks, doing most of the work for you.
The wizards help you
Create projects
P6 Professional User's Guide
46
Add activities
Add resources
Create reports
Import projects
Export projects
Check in projects
Check out projects
You can choose to launch the New Activity and New Resource wizards automatically
when you add a resource or activity. Other wizards are available when you select the
applicable menu option, for example, project check in/check out, or when you select a
dialog box option.
Navigate wizards
To move between wizard windows, click Prev or Next. To save changes and close a
wizard, click Finish. To exit a wizard without saving your changes, click Cancel.
Select and assign information
Many of the fields provide a Select dialog box that lists the available entries.
1) Click in the field or in the open tab or dialog box.
2) Select the item you want to use, then click .
- Or -
To replace a value, click .
To remove a value, click .
3) If necessary, click .
Note
In some tabs and dialog boxes, you can remove an item by selecting it and
clicking .
Global data vs. project-specific data
You can store project data at an enterprise level and a project level. Whether the data
you store are global or project-specific depends on the data type.
Global data are defined at the enterprise level and are available to all projects
across the enterprise. Examples of global data include the EPS and OBS, and resource
and role information. You can access most enterprise-level data from the Enterprise
menu or the Enterprise toolbar.

Getting Started
47
Project-specific data are defined at the project level and are available only to that
project. Examples of project data include activities, WBS, and work products and
documents. You can access most project-specific data from the Project menu or the
Project toolbar.
Some data can be defined at either a global or project level. For example, you can
create global calendars to define available workhours that apply to all projects, and
project calendars to define available workhours unique to a specific project.
Use shortcut menus
Instead of using standard menus and buttons, you can also use the right mouse button to
access frequently used commands.
To use shortcut menus, right-click an element or the white space in any window, then
choose the appropriate command.
Select multiple items
To select a group of items that are next to each other in the display, press the Shift
key, click the first item in the group, then click the last item in the group.
To select multiple items that are not next to each other in the display, press the Ctrl
key, then click each item you want to select.
Set the language for displaying data
1) Choose Tools, Set Language.
2) Select the language in which to display data in menus, dialog boxes, and messages.
3) Click OK.
4) Restart P6 Professional for the language change to work properly.
Note
Your selection does not affect the data you enter; this information appears
exactly as you type it.
Quickly enter the same text in multiple table rows
In some table format display columns, you can use the Fill Down feature to quickly enter
the same text in successive rows.
To copy text from one row to successive rows within a column, select the row
containing the text you want to copy and the rows you want to copy the text to, then
choose Edit, Fill Down.
The following provides an example:
Using the Fill Down function, you can quickly copy the activity name Design external
interfaces from activity A1350 to activities A1840, A1850, and A1860.

P6 Professional User's Guide
48
Tip
The rows you select to copy to can be next to each other as shown in the
preceding graphic, or not directly adjacent, as shown in the following graphic.
Using the HTML editor
The HTML editor enables you to add, edit, and format notes and descriptions for the
selected data item. Using the editor, you can insert images, links, tables, bulleted lists,
and numbered lists into notebook and description fields. You can also copy content from
another source and paste it into the editor.
Accessing the HTML Editor
To display the HTML editor, go to one of the following locations in the module, then click
Modify to open the editor.
Activity Details > Notebook tab
Activity Details > Steps tab
When connected to a P6 Professional database: Activity Step Templates dialog box
(choose Enterprise, Activity Step Templates)
When connected to a P6 Professional database: Cost Accounts dialog box (choose
Enterprise, Cost Accounts)
Expense Details > Description tab
When connected to a P6 Professional database: Funding Sources dialog box (choose
Enterprise, Funding Sources)
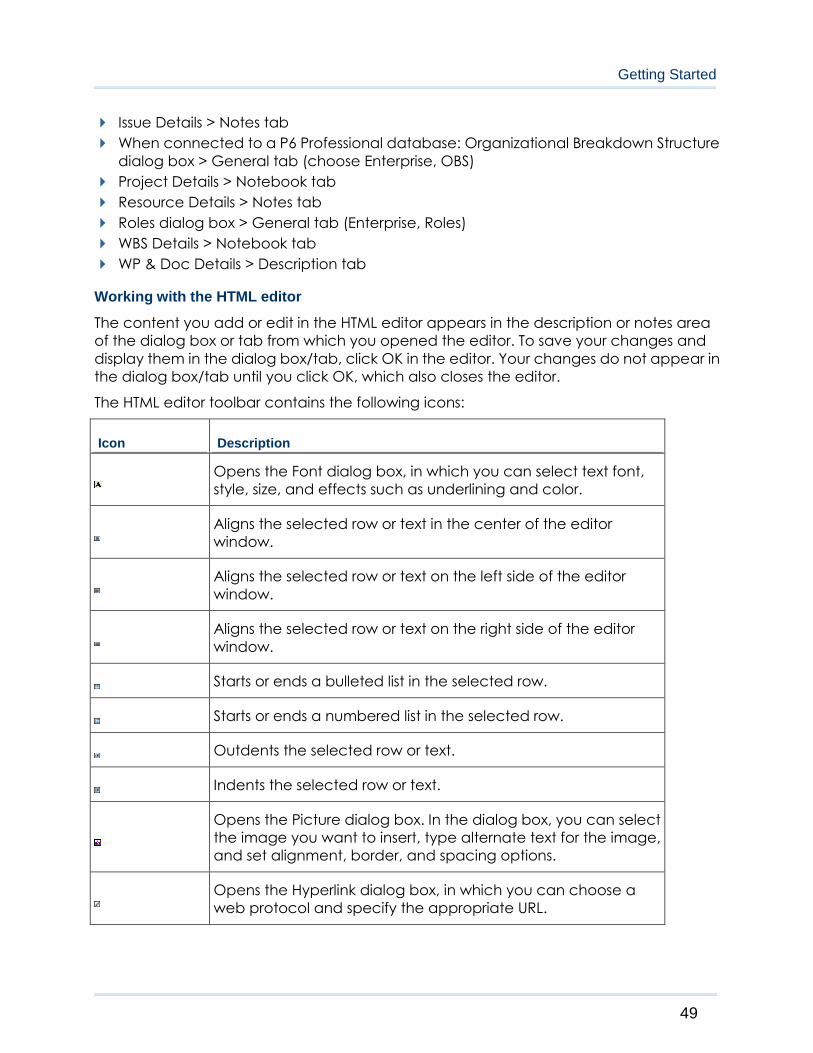
Getting Started
49
Issue Details > Notes tab
When connected to a P6 Professional database: Organizational Breakdown Structure
dialog box > General tab (choose Enterprise, OBS)
Project Details > Notebook tab
Resource Details > Notes tab
Roles dialog box > General tab (Enterprise, Roles)
WBS Details > Notebook tab
WP & Doc Details > Description tab
Working with the HTML editor
The content you add or edit in the HTML editor appears in the description or notes area
of the dialog box or tab from which you opened the editor. To save your changes and
display them in the dialog box/tab, click OK in the editor. Your changes do not appear in
the dialog box/tab until you click OK, which also closes the editor.
The HTML editor toolbar contains the following icons:
Icon Description
Opens the Font dialog box, in which you can select text font,
style, size, and effects such as underlining and color.
Aligns the selected row or text in the center of the editor
window.
Aligns the selected row or text on the left side of the editor
window.
Aligns the selected row or text on the right side of the editor
window.
Starts or ends a bulleted list in the selected row.
Starts or ends a numbered list in the selected row.
Outdents the selected row or text.
Indents the selected row or text.
Opens the Picture dialog box. In the dialog box, you can select
the image you want to insert, type alternate text for the image,
and set alignment, border, and spacing options.
Opens the Hyperlink dialog box, in which you can choose a
web protocol and specify the appropriate URL.
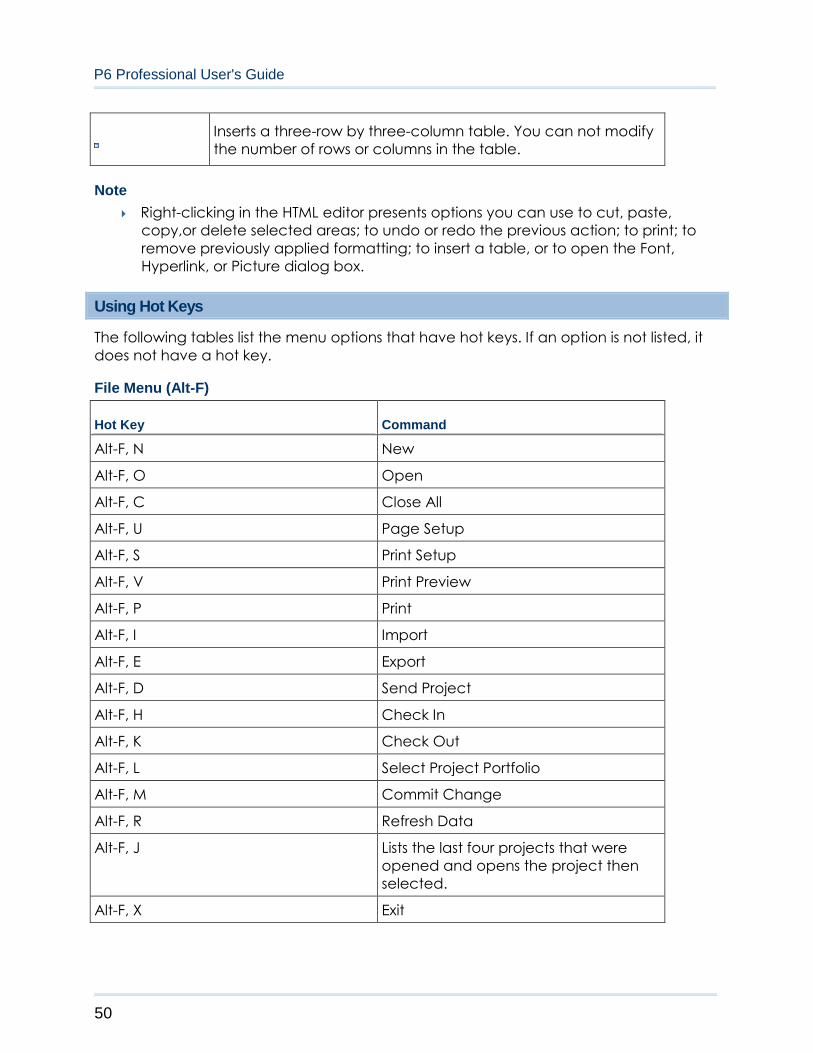
P6 Professional User's Guide
50
Inserts a three-row by three-column table. You can not modify
the number of rows or columns in the table.
Note
Right-clicking in the HTML editor presents options you can use to cut, paste,
copy,or delete selected areas; to undo or redo the previous action; to print; to
remove previously applied formatting; to insert a table, or to open the Font,
Hyperlink, or Picture dialog box.
Using Hot Keys
The following tables list the menu options that have hot keys. If an option is not listed, it
does not have a hot key.
File Menu (Alt-F)
Hot Key Command
Alt-F, N New
Alt-F, O Open
Alt-F, C Close All
Alt-F, U Page Setup
Alt-F, S Print Setup
Alt-F, V Print Preview
Alt-F, P Print
Alt-F, I Import
Alt-F, E Export
Alt-F, D Send Project
Alt-F, H Check In
Alt-F, K Check Out
Alt-F, L Select Project Portfolio
Alt-F, M Commit Change
Alt-F, R Refresh Data
Alt-F, J Lists the last four projects that were
opened and opens the project then
selected.
Alt-F, X Exit
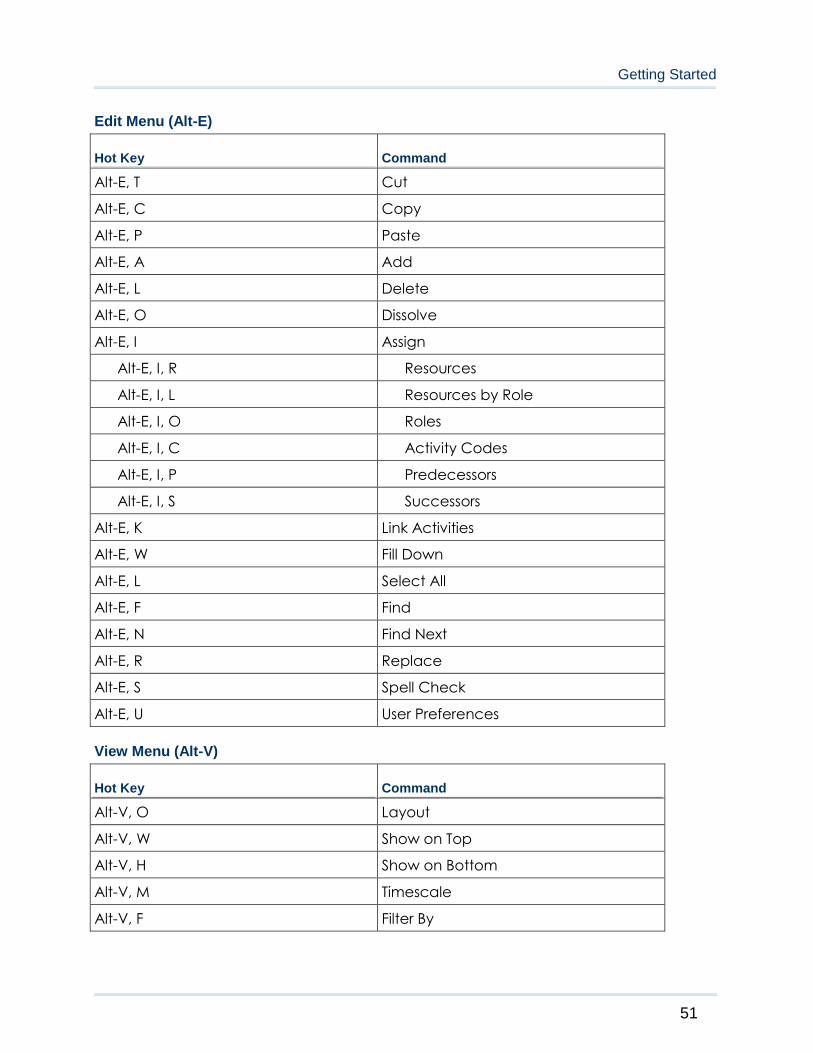
Getting Started
51
Edit Menu (Alt-E)
Hot Key Command
Alt-E, T Cut
Alt-E, C Copy
Alt-E, P Paste
Alt-E, A Add
Alt-E, L Delete
Alt-E, O Dissolve
Alt-E, I Assign
Alt-E, I, R Resources
Alt-E, I, L Resources by Role
Alt-E, I, O Roles
Alt-E, I, C Activity Codes
Alt-E, I, P Predecessors
Alt-E, I, S Successors
Alt-E, K Link Activities
Alt-E, W Fill Down
Alt-E, L Select All
Alt-E, F Find
Alt-E, N Find Next
Alt-E, R Replace
Alt-E, S Spell Check
Alt-E, U User Preferences
View Menu (Alt-V)
Hot Key Command
Alt-V, O Layout
Alt-V, W Show on Top
Alt-V, H Show on Bottom
Alt-V, M Timescale
Alt-V, F Filter By
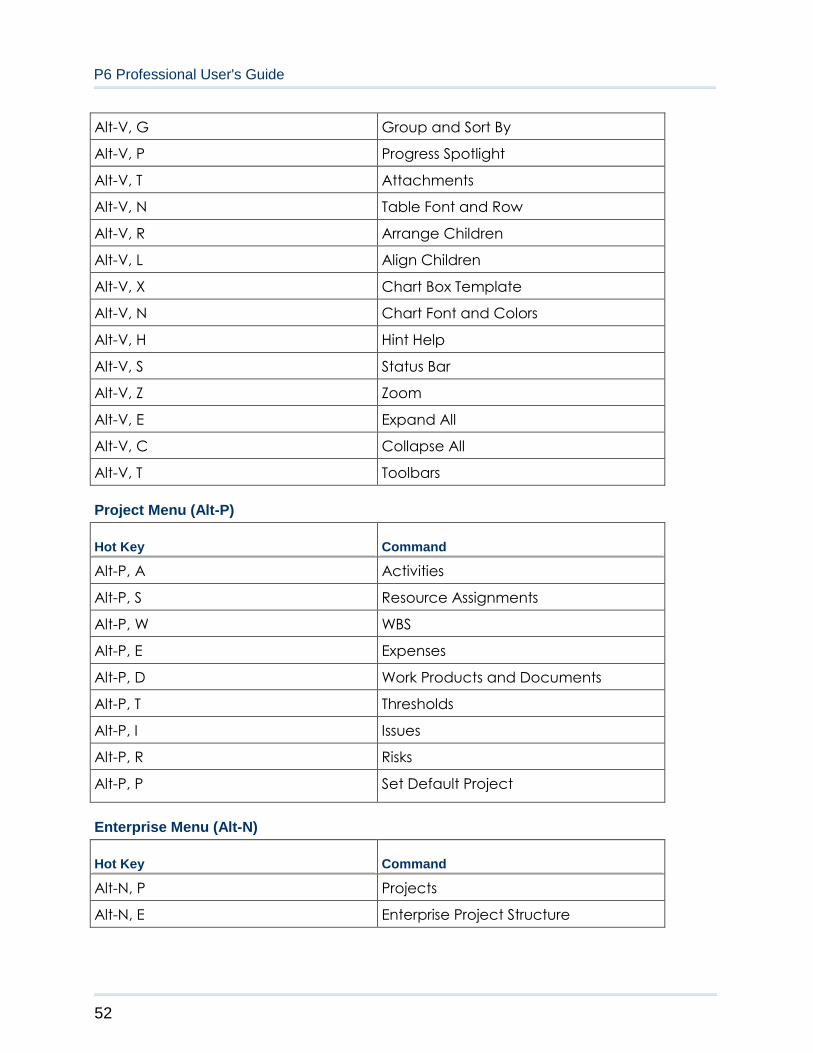
P6 Professional User's Guide
52
Alt-V, G Group and Sort By
Alt-V, P Progress Spotlight
Alt-V, T Attachments
Alt-V, N Table Font and Row
Alt-V, R Arrange Children
Alt-V, L Align Children
Alt-V, X Chart Box Template
Alt-V, N Chart Font and Colors
Alt-V, H Hint Help
Alt-V, S Status Bar
Alt-V, Z Zoom
Alt-V, E Expand All
Alt-V, C Collapse All
Alt-V, T Toolbars
Project Menu (Alt-P)
Hot Key Command
Alt-P, A Activities
Alt-P, S Resource Assignments
Alt-P, W WBS
Alt-P, E Expenses
Alt-P, D Work Products and Documents
Alt-P, T Thresholds
Alt-P, I Issues
Alt-P, R Risks
Alt-P, P Set Default Project
Enterprise Menu (Alt-N)
Hot Key Command
Alt-N, P Projects
Alt-N, E Enterprise Project Structure
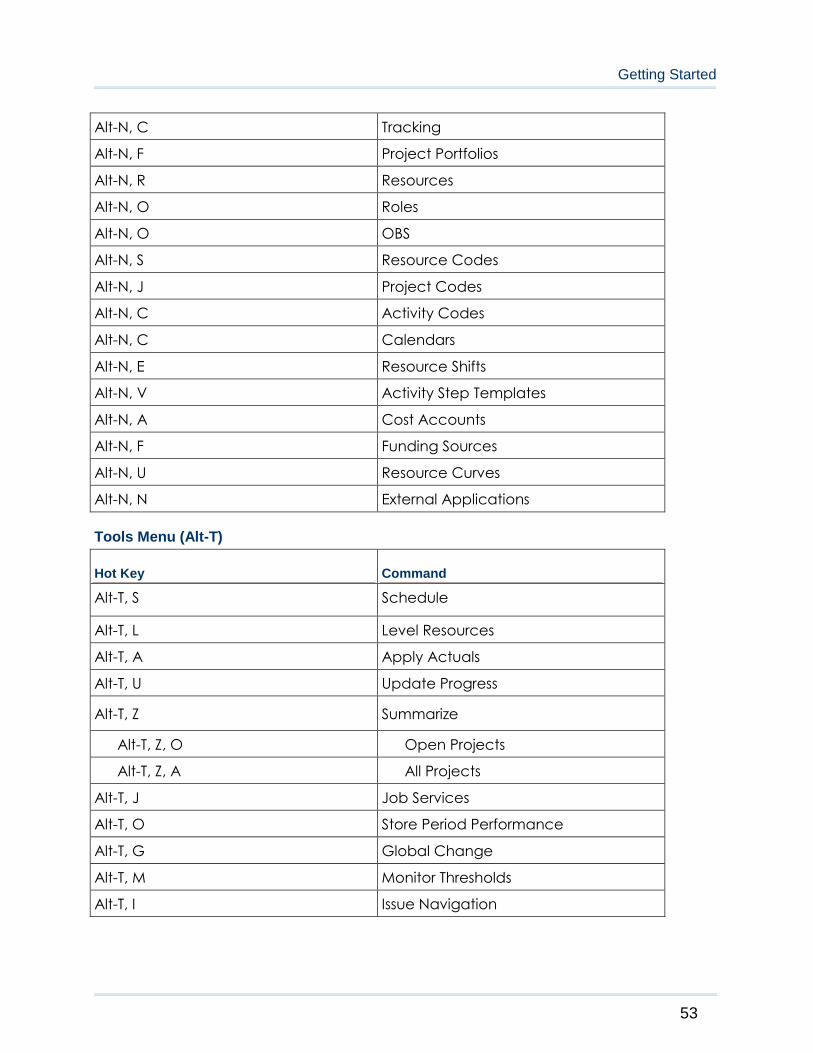
Getting Started
53
Alt-N, C Tracking
Alt-N, F Project Portfolios
Alt-N, R Resources
Alt-N, O Roles
Alt-N, O OBS
Alt-N, S Resource Codes
Alt-N, J Project Codes
Alt-N, C Activity Codes
Alt-N, C Calendars
Alt-N, E Resource Shifts
Alt-N, V Activity Step Templates
Alt-N, A Cost Accounts
Alt-N, F Funding Sources
Alt-N, U Resource Curves
Alt-N, N External Applications
Tools Menu (Alt-T)
Hot Key Command
Alt-T, S Schedule
Alt-T, L Level Resources
Alt-T, A Apply Actuals
Alt-T, U Update Progress
Alt-T, Z Summarize
Alt-T, Z, O Open Projects
Alt-T, Z, A All Projects
Alt-T, J Job Services
Alt-T, O Store Period Performance
Alt-T, G Global Change
Alt-T, M Monitor Thresholds
Alt-T, I Issue Navigation
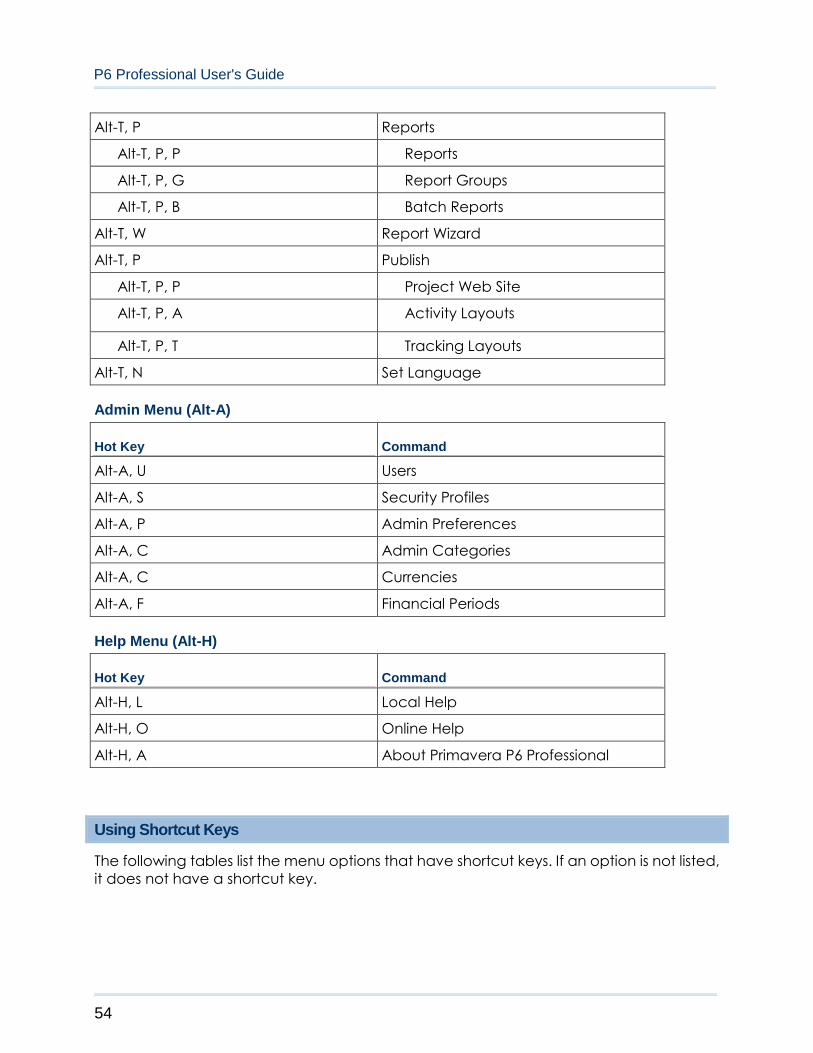
P6 Professional User's Guide
54
Alt-T, P Reports
Alt-T, P, P Reports
Alt-T, P, G Report Groups
Alt-T, P, B Batch Reports
Alt-T, W Report Wizard
Alt-T, P Publish
Alt-T, P, P Project Web Site
Alt-T, P, A Activity Layouts
Alt-T, P, T Tracking Layouts
Alt-T, N Set Language
Admin Menu (Alt-A)
Hot Key Command
Alt-A, U Users
Alt-A, S Security Profiles
Alt-A, P Admin Preferences
Alt-A, C Admin Categories
Alt-A, C Currencies
Alt-A, F Financial Periods
Help Menu (Alt-H)
Hot Key Command
Alt-H, L Local Help
Alt-H, O Online Help
Alt-H, A About Primavera P6 Professional
Using Shortcut Keys
The following tables list the menu options that have shortcut keys. If an option is not listed,
it does not have a shortcut key.
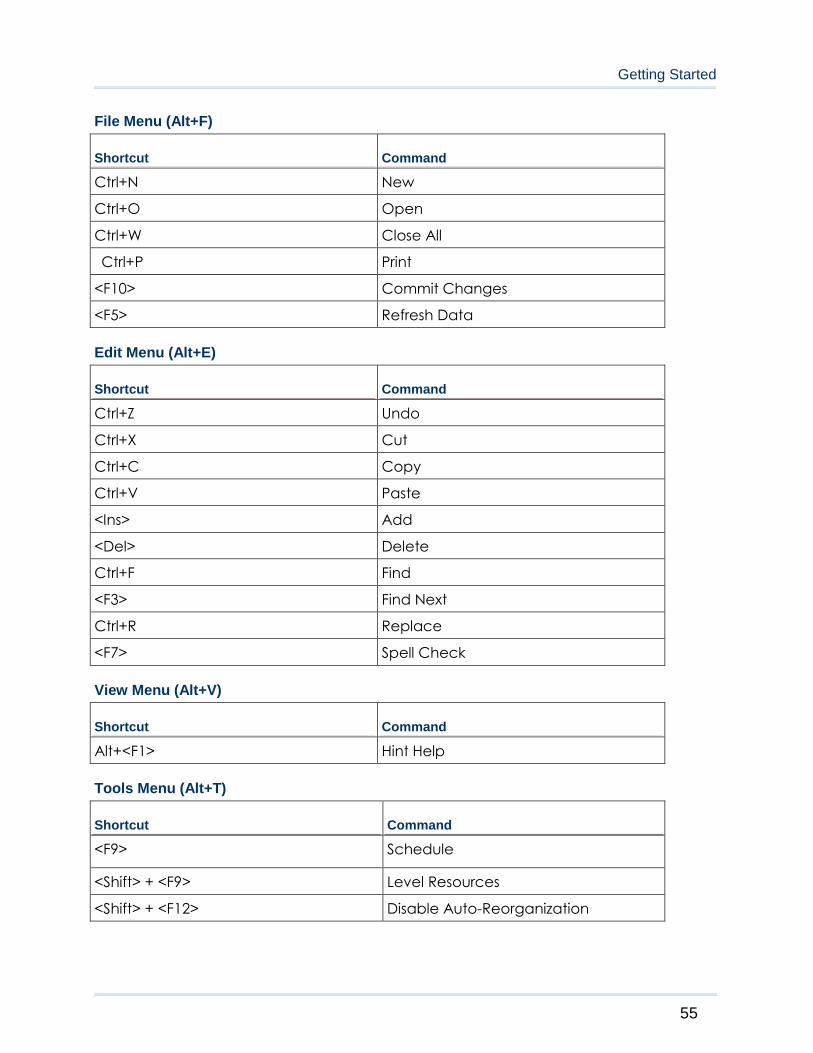
Getting Started
55
File Menu (Alt+F)
Shortcut Command
Ctrl+N New
Ctrl+O Open
Ctrl+W Close All
Ctrl+P Print
<F10> Commit Changes
<F5> Refresh Data
Edit Menu (Alt+E)
Shortcut Command
Ctrl+Z Undo
Ctrl+X Cut
Ctrl+C Copy
Ctrl+V Paste
<Ins> Add
<Del> Delete
Ctrl+F Find
<F3> Find Next
Ctrl+R Replace
<F7> Spell Check
View Menu (Alt+V)
Shortcut Command
Alt+<F1> Hint Help
Tools Menu (Alt+T)
Shortcut Command
<F9> Schedule
<Shift> + <F9> Level Resources
<Shift> + <F12> Disable Auto-Reorganization
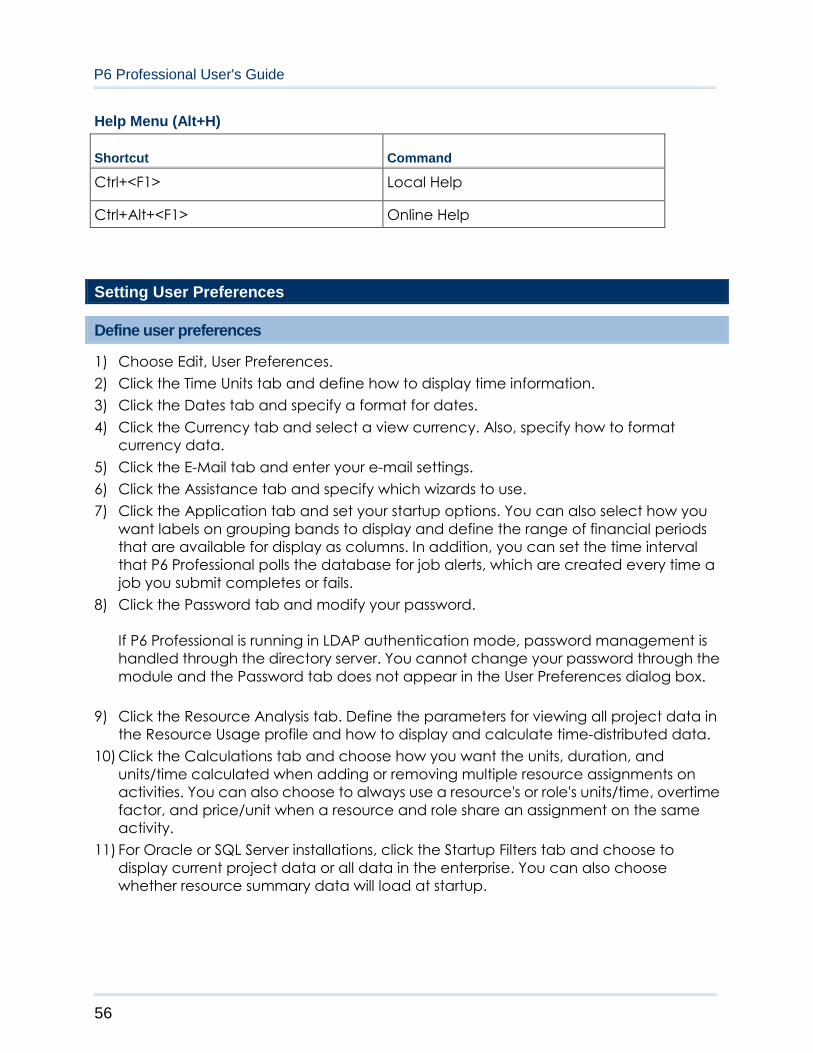
P6 Professional User's Guide
56
Help Menu (Alt+H)
Shortcut Command
Ctrl+<F1> Local Help
Ctrl+Alt+<F1> Online Help
Setting User Preferences
Define user preferences
1) Choose Edit, User Preferences.
2) Click the Time Units tab and define how to display time information.
3) Click the Dates tab and specify a format for dates.
4) Click the Currency tab and select a view currency. Also, specify how to format
currency data.
5) Click the E-Mail tab and enter your e-mail settings.
6) Click the Assistance tab and specify which wizards to use.
7) Click the Application tab and set your startup options. You can also select how you
want labels on grouping bands to display and define the range of financial periods
that are available for display as columns. In addition, you can set the time interval
that P6 Professional polls the database for job alerts, which are created every time a
job you submit completes or fails.
8) Click the Password tab and modify your password.
If P6 Professional is running in LDAP authentication mode, password management is
handled through the directory server. You cannot change your password through the
module and the Password tab does not appear in the User Preferences dialog box.
9) Click the Resource Analysis tab. Define the parameters for viewing all project data in
the Resource Usage profile and how to display and calculate time-distributed data.
10) Click the Calculations tab and choose how you want the units, duration, and
units/time calculated when adding or removing multiple resource assignments on
activities. You can also choose to always use a resource's or role's units/time, overtime
factor, and price/unit when a resource and role share an assignment on the same
activity.
11) For Oracle or SQL Server installations, click the Startup Filters tab and choose to
display current project data or all data in the enterprise. You can also choose
whether resource summary data will load at startup.
Getting Started
57
Tip:
See Future period bucket planning FAQ for information on how user preference
settings affect your planning if you manually plan future period resource
allocation in the Resource Usage Spreadsheet.
Define how to display time information
You can specify how to display time information, such as time units, activity durations,
resource rates, and resource availability.
1) Choose Edit, User Preferences.
2) Click the Time Units tab.
3) In the Units Format section, select the unit of time you want to display for work efforts,
and resource prices and availability.
Mark the Sub-unit checkbox to display sub-units in the next smaller time increment.
Select the number of decimal places to display for time unit values.
Mark the Show Unit Label checkbox to display the time unit abbreviation with the
time value.
Type an example of the time unit.
4) In the Durations Format section, select the unit of time you want to display for activity
duration values.
Mark the Sub-unit checkbox to display sub-units in the next smaller time increment.
Select the number of decimal places to display for activity duration values.
Mark the Show Duration Label checkbox to display the time unit abbreviation with
the duration value.
Type an example of the duration value.
5) Choose how to display resource units per time, either as a percentage or as units per
duration.
P6 Professional User's Guide
58
Tip
If you manually plan future period resource/role allocation in the Resource Usage
Spreadsheet, you should set the Units Format and Durations Format according to
the timeperiods in which you plan your work. For example, if you plan future work
in daily timeperiods, you should set the Units Format to Hour and the Durations
Format to Day. Similarly, if you plan future work in weekly timeperiods, you should
set the Units Format to Hour or Day, and the Durations Format to Week.
Specify a format for dates
1) Choose Edit, User Preferences.
2) Click the Dates tab.
3) In the Date Format section, select the order in which you want all dates to appear.
4) In the Time section, specify how or whether you want to display time.
5) In the Options section, select the date formatting options you want to apply.
Select a view currency
1) Choose Edit, User Preferences.
2) Click the Currency tab.
3) Select the currency in which to view cost data.
4) Indicate whether to show the currency symbol and decimal digits for the selected
currency.
Specify a format for currency
1) Choose Edit, User Preferences.
2) Click the Currency tab.
3) Mark the Show Currency Symbol checkbox to display the currency symbol before
currency values.
4) Mark the Show Decimal Digits checkbox to display decimals for currency values.
Enter e-mail settings
You can access your e-mail account to send e-mail messages.
1) Choose Edit, User Preferences.
2) Click the E-Mail tab.
3) Select the mail protocol for your e-mail system.
4) Type the profile name, login, or username you use to access your e-mail server.
5) Click Password, then type your password for the e-mail server.
6) Type the SMTP server name or address to use to send outgoing e-mail.

Getting Started
59
7) Type the e-mail address to which you want your return e-mail sent.
If you do not enter a return e-mail address, all e-mail is returned to the address you
used to send the e-mail.
Set wizard options
You can specify whether you want wizards to help you add activities and resources.
1) Choose Edit, User Preferences.
2) Click the Assistance tab.
3) To use the New Resource wizard, mark the Use New Resource Wizard checkbox.
4) To use the New Activity wizard, mark the Use New Activity Wizard checkbox.
Change my password
1) Choose Edit, User Preferences.
2) Click the Password tab.
3) Click Password.
4) Type a new password.
5) Type the password again to verify it.
6) Click OK.
Notes
When connected to a P6 Professional database:
If the Enable password policy setting is selected in the Password Policy field of the
Admin Preferences dialog box, you must enter a password that is between 8 and
20 characters and contains at least one number and one letter.
If the Enable password policy setting is not selected, enter a password between 1
and 20 characters long.
When connected to a P6 EPPM database:
When the Password Policy is disabled in Application Settings in P6, the password
must be between 1 and 20 characters. P6 does not allow blank passwords.
When the Password Policy is enabled in Application Settings in P6, the password
must be between 8 and 20 characters and contain at least one number and one
letter.
If P6 Professional is running in LDAP authentication mode, password management
is handled through the directory server. You cannot change your password
through the module and the Password tab does not appear in the User
Preferences dialog box.
Passwords are case-sensitive.
P6 Professional User's Guide
60
Passwords that were set before the new password policy was enabled are valid
and usable.
Passwords are required.
Set startup options
You can specify the window you want to display each time you start the application.
1) Choose Edit, User Preferences.
2) Click the Application tab.
3) In the Startup Window section, select the window to display each time you start the
module.
4) Mark the Show the Issue Navigator Dialog at Startup checkbox to view the Issue
Navigator each time you open the module.
5) Mark the Show the Welcome Dialog at Startup checkbox to view the Welcome
dialog box each time you open the module.
Create a log of tasks
You can record internal function calls, or the actions you perform, in an ERRORS.LOG file.
This file is created in the user's My Documents folder.
1) Choose Edit, User Preferences.
2) Click the Application tab.
3) In the Application Log File section, mark the Write Trace of Internal Functions to Log
File checkbox.
Note
You should use this option only when investigating an application error with the
assistance of Oracle Customer Support staff.
Define the range of financial periods to display in columns
If your organization stores past period actuals in financial periods, you must define the
range of financial periods you want to display when you choose to display financial
period columns (for example, in the Activity Table). For example, if your organization
stores past period actuals in weekly financial periods and financial periods have been
defined for the previous year and the next year, you can choose to display a subset of
these weekly financial periods as columns to facilitate easier viewing of past period
actual data.
To define the range of financial periods:
1) Choose Edit, User Preferences.
2) Select the Application tab.

Getting Started
61
3) In the Columns section, click to select the financial periods that represent the first
and last financial period in the range of financial periods you want to display as
columns.
4) Click Close.
Note:
If you do not select a range of financial periods to display, no financial period
columns will be available for display.
Set resource analysis options
1) Choose Edit, User Preferences.
2) Click the Resource Analysis tab.
3) In the All Projects section, specify the extent of information you want to gather from
closed projects when calculating remaining units and costs for spreadsheet, profiles,
and tracking layouts. (Closed projects are any projects in the enterprise project
structure (EPS) that are not currently open.)
To include live data from all open projects and stored summary data from all closed
projects (excluding those with a what-if status), choose All Closed Projects (Except
What-If Projects).
To include live data from all open projects and stored summary data from all closed
projects with a specific leveling priority, choose Closed All Projects with Leveling
Priority Equal/Higher Than, then specify the leveling priority you want to use. (Specify
the leveling priority per project in the General tab of the Projects window.) This value is
used to consider applicable external projects’ (those not included in the current
layout) when deducting from resource availability immediately during leveling.
Choose Open Projects Only to exclude resource data from external (closed) projects
in the remaining units and cost values for resource profiles/spreadsheets and tracking
layouts.
P6 Professional User's Guide
62
4) In the Time-Distributed Data section, choose a starting point for calculating remaining
units and costs for resource profiles and spreadsheet displays and in tracking layouts.
To focus on the current remaining estimate, choose Remaining Early Dates.
To focus on values calculated from a forecast date, choose Forecast Dates.
Select the interval at which live resource and cost calculations are performed for
resource profiles and spreadsheets and in tracking layouts—hour, day, week, or
month. Profiles, spreadsheets, and layouts are affected only if their timescale interval
is set lower than the interval set in the Interval for Time-Distributed Resource
Calculations field.
Choose to display role limits based on custom role limits defined in the Roles
dictionary or the calculated limit of each role's primary resource. You can view role
limits in spreadsheets, charts, and histograms that display role data in P6 Professional.
Tip
If you manually plan future period resource/role allocation in the Resource Usage
Spreadsheet, your selections in the Time-Distributed Data section may affect your
planning.
How? If you choose to display time-distributed Remaining Early units and costs
according to forecast dates rather than remaining early dates, you can not enter
or edit values in the Remaining Units field in the Resource Usage Spreadsheet.
Additionally, if the displayed timescale intervals in the Resource Usage
Spreadsheet are smaller than the minimum timescale interval used for
time-distributed resource calculations, you can not enter or edit future period
values in the Resource Usage Spreadsheet. For example, if this option is set to
Week, you can only enter or edit data in weekly, monthly, quarterly, yearly, or
financial period future period buckets.
Select Startup Filters
1) Choose Edit, User Preferences.
2) Click the Startup Filters tab.
3) Select the appropriate option for each data element listed. You can choose to view
data for your current projects only or all data in the enterprise.
Note:
Startup filters are available for Oracle and SQL Server installations. Startup filters are
disabled for stand-alone installations.
Getting Started
63
Load resource summary data at startup
1) Choose Edit, User Preferences.
2) Click the Startup Filters tab.
3) Select the Resource Summary data option to load resource summary data at startup.
Notes:
If you choose to load the data at startup, P6 Professional may take
longer to start and some views may take longer to load.
When connected to a P6 Professional database, in addition to the
resource summary data that may be affected in P6 Professional
and P6 EPPM databases, resource and role data may be affected
during project summarization.
Select calculation options for resource and role assignments
1) Choose Edit, User Preferences.
2) Click the Calculations tab.
3) In the Resource Assignments section, specify how to calculate remaining values
when new resource assignments are added to or removed from activities.
Choose Preserve the Units, Duration, and Units/Time for existing assignments if you
want units, durations, and units/time to remain constant when additional resources
are assigned to an activity.
Choose Recalculate the Units, Duration, and Units/Time for existing assignments based
on the activity Duration Type if you want to calculate a resource assignment's
remaining values based on the activity's duration type specified in the Activity Details
General tab.
4) In the Assignment Staffing section, specify how you want the module to calculate
costs for an assignment when you replace a resource on an existing activity
assignment or when you assign both a resource and a role to the same activity
assignment.
When replacing a resource on an existing activity assignment, choose to always use
the units/time and overtime factor of the current assignment or of the new resource
replacing the existing assignment; or, choose to be prompted to select which
units/time and overtime factor you want to use each time you replace a resource on
an existing activity assignment.
When assigning a resource to an existing role assignment or when assigning a role to
an existing resource assignment, choose to always use the price/unit of the resource
or role; or, choose to be prompted to select which price/unit you want to use each
time you assign a resource and a role to an activity assignment.

P6 Professional User's Guide
64
Tip
If you manually plan future period resource allocation in the Resource Usage
Spreadsheet, your selections on the Calculations tab can affect the values you
manually enter in future periods for an assignment.
Notes
For Fixed Duration and Units activities P6 Professional will not recalculate the actual
units for existing resource assignments if they have negative units/time, units, or
cost values.
If you choose to always use the role's price/unit, the Rate Source is set to Role in
the Activity Details, Resources tab. If you choose to always use the resource's
price/unit, the Rate Source is set to Resource. The price/unit value used to
calculate costs for the assignment is determined by the rate type you select in the
Rate Type field (rate types are resource- and role-specific).
Set the Online Help location (P6 Professional Only)
1) Choose Admin, Admin Preferences.
2) Click the Options tab.
3) In the P6 Professional Online Help URL field:
Leave the default URL to launch the Oracle Technology Network (OTN) site when
Online Help is selected from the Help menu.
Remove the URL to disable the Online Help option from the Help menu for all users.
Users will only be able to access the local version of the help.
Specify a new URL location to launch when Online Help is selected from the Help
menu.
4) The Always launch Online Help for the F1 shortcut key and context-sensitive help
option is not selected by default. To always launch online help for F1 key and help
shortcuts, select this option.
Notes:
Using OTN ensures that you always have the most current help content.
Clicking on Online Help will launch the URL specified in Admin Preferences.
If the P6 Professional Online Help URL field is blank, the Always launch Online Help
for the F1 shortcut key and context-sensitive help option is disabled.
When connected to a P6 EPPM database: Use P6 to set the online help location.
65
In This Section
Setting up and starting to work with the EPS ......................................................... 65
Working with and defining the OBS ........................................................................ 69
Defining Resources and Roles ................................................................................. 72
Defining Resource Curves........................................................................................ 81
Defining the WBS ....................................................................................................... 83
Defining Project, Resource, and Activity Codes .................................................. 89
Defining Custom Fields ............................................................................................. 96
Defining Calendars ................................................................................................... 99
Setting up and starting to work with the EPS
Enterprise Project Structure overview
The Enterprise Project Structure (EPS) forms the hierarchical structure of your database of
projects. Each EPS node (or folder) can be subdivided into multiple levels to represent
the work that needs to be done in your organization. The number of levels and their
structure depend on the scope of your projects and how you want to summarize data.
You can use the EPS to
Perform top-down budgeting and resource and cost analysis
Organize work breakdown and organizational breakdown structures into one
common structure
Manage multiple projects from the highest levels of the organization to the
individuals that perform specific project tasks
Implement coding standards for flexible reporting
Maintain appropriate security throughout the enterprise
When P6 Professional is connected a P6 Professional database:
All projects in the enterprise exist within the EPS hierarchy, a graphical representation of
your project structure.
When P6 Professional is connected a P6 EPPM database:
You define the EPS using P6. You can subsequently display and modify some EPS-related
data in P6 Professional (Projects window), but you can only modify its structure using P6.
Structuring Projects
P6 Professional User's Guide
66
The levels and structure of your company’s EPS depends on the scope of your projects
and how you want to summarize data. You can define one or multiple root nodes, up to
50 combined WBS/EPS levels and as many projects as necessary to complete the
required work set forth by the operations executive and project managers in your
organization.
Before you begin defining your company’s EPS, you should become familiar with the
structures and procedures established for your enterprise, such as codes, calendars, and
other company-wide standards. Once the EPS hierarchy is defined, you can begin to
develop projects by adding information, activities, and resources.
Defining the Enterprise Project Structure (P6 Professional Only)
All projects in the enterprise exist within the EPS hierarchy, a graphical representation of
your project structure. A root node is automatically created for the hierarchy during
installation.
The levels and structure of your company’s EPS depends on the scope of your projects
and how you want to summarize data. You can use the Admin Preferences, Data Limits
tab to define one or multiple root nodes, up to 50 combined WBS/EPS levels and as many
projects as necessary to complete the required work set forth by the operations
executive and project managers in your organization.
Before you begin defining your company’s EPS, you should become familiar with the
structures and procedures established for your enterprise, such as codes, calendars, and
other company-wide standards. Once the EPS hierarchy is defined, you can begin to
develop projects by adding information, activities, and resources.
Set up the EPS structure
When P6 Professional is connected a P6 EPPM database:
When you create the enterprise project structure, you must identify an OBS element, or
person responsible for each node and project within the EPS. You create the enterprise
project structure and OBS using P6.
Once that is done, you can use P6 Professional or P6 to specify project details. If you use
P6 Professional, choose Enterprise, Projects to specify project details such as dates,
resource and budget information, and so on.
When P6 Professional is connected a P6 Professional database:
When you create the enterprise project structure, you must identify an OBS element, or
person responsible for each node and project within the EPS. For steps on defining the
OBS.
1) Choose Enterprise, Enterprise Project Structure.
2) Click the EPS Name column where you want to add a new element.

Structuring Projects
67
3) Click Add.
4) Type an ID and name for the EPS node. In the Responsible Manager field, select an
OBS element for the new element.
5) If necessary, you can change the hierarchical position of the new element by clicking
the arrow keys.
6) Click Close.
7) Choose Enterprise, Projects then specify project details such as dates, resource and
budget information, and so on.
Note
A default root node displays in the top left position in the hierarchy. All projects
listed below it are part of the same structure. You can also define multiple root
nodes to separate various components of your enterprise. For example, you might
want to exclude inactive or what-if projects from the main enterprise. To define a
root node, click the left arrow key to move an EPS element to the top left position
in the hierarchy, then add the hierarchy of projects below this node.
Add a project to the EPS hierarchy
Once you set up the EPS structure, you can add an unlimited number of projects as
follows:
1) Choose Enterprise, Projects, then select the EPS node or root element to which you
want to add a project.
2) Click on the Edit Toolbar or choose Edit, Add.
3) Follow the instructions in the Create a New Project Wizard.
To quickly add a new project using the default settings, click Finish on the Create a
New Project Wizard.
4) Use the detail tabs across the bottom of the Project window to add details specific to
this project.
Show or hide details in the EPS hierarchy
To expand or collapse individual elements of the EPS hierarchy, click the plus sign (+)
or minus sign (-).
To expand or collapse all elements of the EPS hierarchy, choose View, Expand All or
Collapse All. You can also right-click in the EPS hierarchy and choose Expand All or
Collapse All.

P6 Professional User's Guide
68
Use status for filtering projects in the EPS
You can change an active (Open) project to inactive (Closed) when it is completed.
You can also assign a What-If status to a copied project that you want to use for analysis.
Project status can be used to organize and summarize information, and to filter projects.
1) Choose File, Open.
2) Select the EPS node or project whose status you want to change and click Open.
3) Choose Enterprise, Projects.
4) To view only those projects with a specific status, choose View, Filter By, Status, then
choose the status you want to use.
You can also choose View, Filter By, Customize.
5) In the Filters dialog box, mark the applicable checkboxes.
Tip
Another way to distinguish projects with statuses other than Active is to place them under
separate root nodes in the EPS. The projects remain part of the hierarchy, but they are
not considered when you budget, schedule, and level your active projects. Choose
Enterprise, Enterprise Project Structure, to set up root nodes as placeholders within the EPS
(for example, What-If, Planned, or Closed). You can then drag and drop projects to
these root nodes when their status changes.
Delete an EPS node or project (P6 Professional Only)
1) Choose Enterprise, Projects, then select the EPS node or project that you want to
delete. Choose Edit, Delete.
2) Click Yes to confirm.
Tip
When you delete an EPS node, all projects in that branch of the hierarchy are also
removed. To save projects in a branch before deleting it, first copy and paste
those projects to another area of the hierarchy.
Copy an EPS node or project
1) Choose Enterprise, Projects, then select the EPS node or project you want to copy.
2) Choose Edit, Copy.
3) Click the location in the EPS where you want to paste the new EPS node/project.
4) Choose Edit, Paste.
5) Mark the checkboxes beside any optional information you want to include in the
copied EPS node or project in the Copy Project Options, Copy WBS Options, and
Copy Activity Options dialog boxes.
Structuring Projects
69
Notes:
When connected to a P6 EPPM database: When you copy an EPS node, any
template projects in that EPS are copied even though you cannot see them in P6
Professional.
The administrator should not assign any of the following privileges to users who should
not have access to view cost information while copying and pasting project/EPS or
assigning WBS and Fill Down on the WBS column in the Activities view: View Project
Costs/Financials, Edit WBS Costs/Financials, and Edit EPS Costs/Financials.
You must group the projects (to copy) by EPS in order to copy Summary Data.
Tip
When you select an EPS node to copy, all of the selected EPS node’s subordinate
EPS nodes/projects are also copied, even if you do not select them.
Working with and defining the OBS
Organizational breakdown structure (OBS) overview
The organizational breakdown structure (OBS) is a global hierarchy that represents the
managers responsible for the projects in your enterprise. The OBS usually reflects the
management structure of your organization, from top-level personnel down through the
various levels constituting your business. You can associate the responsible managers
with their areas of the EPS (Enterprise Project Structure) — either nodes or individual
projects. When you associate a responsible manager with an EPS node, any projects you
add to that branch of the EPS are assigned that manager element by default.
The OBS hierarchy is also used to grant users specific access privileges to projects and the
WBS (work breakdown structure) levels within projects.
Setting up the OBS
Because the OBS is maintained as a separate, global hierarchy, you have flexibility in
making your OBS assignments as responsibilities change throughout a project life cycle.
You may want to create your OBS to match each EPS node and project set up in the EPS.
You could initially match OBS names to the EPS node and project names. You could then
assign users, by their login names, to the OBS elements to grant access to the
corresponding EPS nodes or projects.
The type of access granted to a user is determined by the project security profile
assigned to the user.
When P6 Professional is connected to a P6 EPPM database:
You do those tasks using P6.
Security profiles are set up using P6.
When P6 Professional is connected to a P6 Professional database:

P6 Professional User's Guide
70
Security profiles are set up in the Security Profiles dialog box (choose Admin, Security
Profiles) and then assigned to users in the Users dialog box (choose Admin, Users).
View the OBS (P6 Professional Only)
You can view an organizational breakdown structure (OBS) in two ways. You can use the
OBS chart to view a graphical display of information, and you can use the OBS table to
view information in a column format.
1) Choose Enterprise, OBS.
2) If the Organizational Breakdown Structure dialog box currently displays the Chart
View, click the Display Options bar and choose Table View.
To view the OBS hierarchy, click the OBS Name column label.
To list and sort OBS elements, click the OBS Name column label again.
Add an OBS element (P6 Professional Only)
1) Choose Enterprise, OBS.
A root OBS element is automatically assigned to the root EPS node so that a default
OBS element can be assigned to each project you add to the EPS root.
2) Click the OBS Name column label to display the OBS hierarchy.
The outline symbol in the OBS Name column label indicates a hierarchy display.
3) Select the OBS element immediately above and at the same hierarchy level as the
element you want to add, then click Add.
4) Click the General tab, type the OBS Name, then click Modify to type a description of
the OBS element in an HTML editor.
In the editor, you can format text, insert pictures and tables, copy and paste
information from other document files (while retaining formatting), and add
hyperlinks.
5) Click the Users tab to view the users and corresponding security profiles associated
with an OBS element. You can also assign users from this tab, if you have appropriate
access rights.
6) Click the Responsibility tab to quickly see where responsible managers (OBS
elements) are assigned across the enterprise. Select the OBS name for whom you
want to see assignments.
Structuring Projects
71
Tip
To change the element's position in the OBS hierarchy, click the appropriate arrow
buttons.
Assign an OBS element to a WBS element
1) Choose Project, WBS.
2) Select the WBS element to which you want to assign an OBS element.
3) Click the General tab, then click in the Responsible Manager field.
4) Select the OBS element you want to assign, then click the Select button.
Edit an OBS element (P6 Professional Only)
1) Choose Enterprise, OBS.
2) Click the OBS Name column label to display the OBS hierarchy.
The outline symbol in the OBS Name column label indicates a hierarchy display.
3) Select the OBS element you want to edit.
4) To change the element's information, click the General tab and enter new
information.
5) To change the element's position in the OBS, click the appropriate arrow buttons.
Delete an OBS element (P6 Professional Only)
1) Choose Enterprise, OBS.
2) Click the OBS Name column label to display the OBS hierarchy.
3) Select the OBS element you want to delete, then click Del/Merge.
If the OBS element you want to delete has work breakdown structure (WBS), issue or
threshold assignments, you are prompted to merge the element with its parent OBS.
4) Click Yes.
Note
If you delete a parent OBS element, all of the elements contained in the parent
element are deleted.
View the OBS chart display (P6 Professional Only)
Use the OBS chart to view a graphical display of OBS information.
Choose Enterprise, OBS, then click the Display Options bar and choose Chart View.
P6 Professional User's Guide
72
Tip
To view the OBS table display again, click the Display Options bar, then choose
Table View.
Change the OBS chart display (P6 Professional Only)
1) Choose Enterprise, OBS, then click the Display Options bar and choose Chart Font
and Colors.
2) To change the appearance of the display's text, click Font, then select a new font.
3) To change the display's background color, click Back Color, then select a new color.
4) To change the display's OBS box color, click Box Color, then select a new color.
Tip
To change the displayed information, click the Display Options bar, choose Chart
Box Template, then select Customize.
Defining Resources and Roles
Resources
Resources
Resources include the personnel and equipment that perform work on activities across
all projects. Resources are generally reused between activities and/or projects. In P6
Professional you can create a resource pool that reflects your organization's resource
structure and supports the assignment of resources to activities. P6 Professional also
enables you to distinguish between labor, material, and nonlabor resources. Labor and
nonlabor resources are always time-based, and material resources, such as consumable
items, use a unit of measure you can specify. You can create and assign resource
calendars and define a resource's roles, contact information, and time-varying prices.
Define a master list of resources consisting of the resources necessary to complete the
projects in your organization. Then, group resources to create an easily accessible pool
from which you can draw when assigning resources to a project. For each resource, set
availability limits, unit prices, and a calendar to define its standard worktime and
nonworktime, then allocate resources to the activities that require them. To enable
grouping and rollups of your resources across the organization, set up resource codes
and assign code values.
Resources are different than expenses. While resources can be time-based and
generally extend across multiple activities and/or projects, expenses are one-time
expenditures for nonreusable items required by activities. P6 Professional does not
include expenses when leveling resources.

Structuring Projects
73
Primary Resources
P6 Professional allows you to assign primary resources to activities. An activity's primary
resource is typically the resource who is responsible for coordinating an activity's work.
Resource Security
Resource security allows the administrator to restrict your resource access by assigning
you to a node in the resource hierarchy. That node is your root node. Once assigned to
a resource node, you have access only to your root node and all of its children. In the
Resource Assignments window you still have access to current project resources even if
they are outside your root node.
Add a resource
1) Choose Enterprise, Resources.
2) If necessary, click the Display options bar, then choose Filter By, All Resources, to
display the resource hierarchy.
If resource security is enabled, you can only view resources you have access to.
Therefore, you can add a new resource only to the hierarchy you have access to.
See Introduction to Resource Security.
3) Select the resource to which you want to add a new child resource.
You can use the arrow icons on the Move toolbar to position the new resource after
you add it. See Move Toolbar. You can also display the resource hierarchy as a list
rather than a hierarchy; when you display a resource list, the new resource is added
at the root level of the hierarchy. To switch between list and hierarchy views in the
Resources window, click the column label furthest to the left in the Resources window.
4) Click on the Edit toolbar or choose Edit, Add. See Edit Toolbar.
Depending on your user preferences, the New Resource wizard may start. Follow the
prompts on each dialog box to create the resource.
5) Click each tab in Resource Details and enter the resource's information.
Tips
If resource security is enabled you can add a resource only under your root node.
Under your root node, you can select any resource node and click the Add
button. The new resource is added as a child to the selected node.
You can indent or outdent any resources you have access to, except your root
node. See Root Node. Since your root node is the highest level of resource you
have access to, you cannot outdent any other resources to the same level. By
changing the position of a resource in the resource hierarchy, you change the
resource's accessibility for all users that are assigned to that resource.
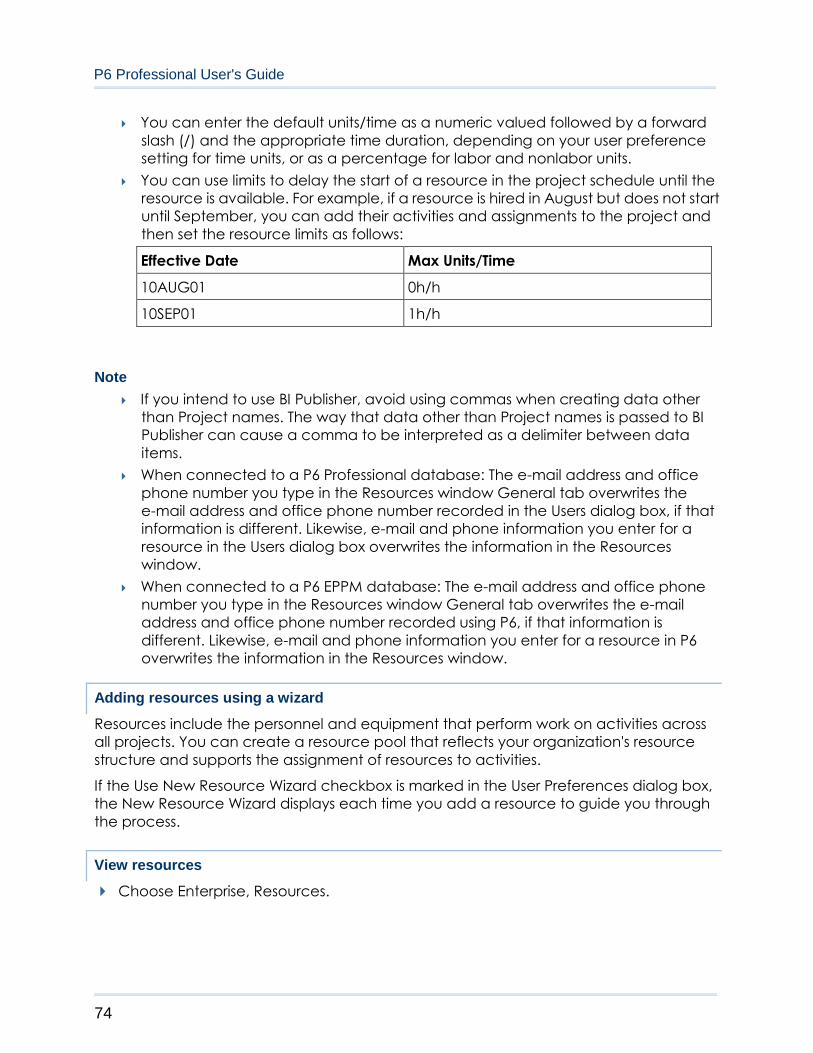
P6 Professional User's Guide
74
You can enter the default units/time as a numeric valued followed by a forward
slash (/) and the appropriate time duration, depending on your user preference
setting for time units, or as a percentage for labor and nonlabor units.
You can use limits to delay the start of a resource in the project schedule until the
resource is available. For example, if a resource is hired in August but does not start
until September, you can add their activities and assignments to the project and
then set the resource limits as follows:
Effective Date Max Units/Time
10AUG01 0h/h
10SEP01 1h/h
Note
If you intend to use BI Publisher, avoid using commas when creating data other
than Project names. The way that data other than Project names is passed to BI
Publisher can cause a comma to be interpreted as a delimiter between data
items.
When connected to a P6 Professional database: The e-mail address and office
phone number you type in the Resources window General tab overwrites the
e-mail address and office phone number recorded in the Users dialog box, if that
information is different. Likewise, e-mail and phone information you enter for a
resource in the Users dialog box overwrites the information in the Resources
window.
When connected to a P6 EPPM database: The e-mail address and office phone
number you type in the Resources window General tab overwrites the e-mail
address and office phone number recorded using P6, if that information is
different. Likewise, e-mail and phone information you enter for a resource in P6
overwrites the information in the Resources window.
Adding resources using a wizard
Resources include the personnel and equipment that perform work on activities across
all projects. You can create a resource pool that reflects your organization's resource
structure and supports the assignment of resources to activities.
If the Use New Resource Wizard checkbox is marked in the User Preferences dialog box,
the New Resource Wizard displays each time you add a resource to guide you through
the process.
View resources
Choose Enterprise, Resources.

Structuring Projects
75
Note
If you cannot see all resources, resource security may be enabled. In that case,
you can only see resources you have access to. See Introduction to Resource
Security.
Define resource shifts
You can globally define shifts that span specific workhours over a period of time. You can
also apply one or more shifts directly to specific resources.
1) Choose Enterprise, Resource Shifts.
2) Click Add, then type the new shift’s name.
3) Click Modify to define the workhours for the new shift.
4) Click Add, then enter the start hour for each shift segment.
The total shift hours must add up to 24 hours and each shift segment must have a
duration of at least one hour. The start hour must begin and end on the hour, for
example, 8:00, rather than 8:30 A.M.
Note
This note applies only when P6 Professional is connected to a P6 Professional
database because leveling in P6 does not consider shifts.
Shift hours are considered when calculating units and prices during leveling. The
resource calendar is used to determine when the resource can work; the limits
for that period are determined from the shift definition for that resource. The
minimum resource availability for every shift must satisfy the minimum demand
for the resource so that the resource can be leveled properly. Limits defined
outside the boundaries of the shift definition are ignored. Since shifts are
defined at the resource level, all projects are leveled using that resource
according to the shift definition.
Display resource details
Choose Enterprise, Resources, then choose View, Show on Bottom, Details.
Note
If resource security is enabled, you can only see resources you have access to.
See Introduction to Resource Security.
Calculating cost when using multiple resource rates
The total cost for a resource assignment takes into consideration any changes in the
price/unit over the course of the activity.
When connected to a P6 Professional database: Enter a price/unit for each rate type
(defined in Admin Preferences, Rate Types) in the Units & Prices tab in the Resources
window.
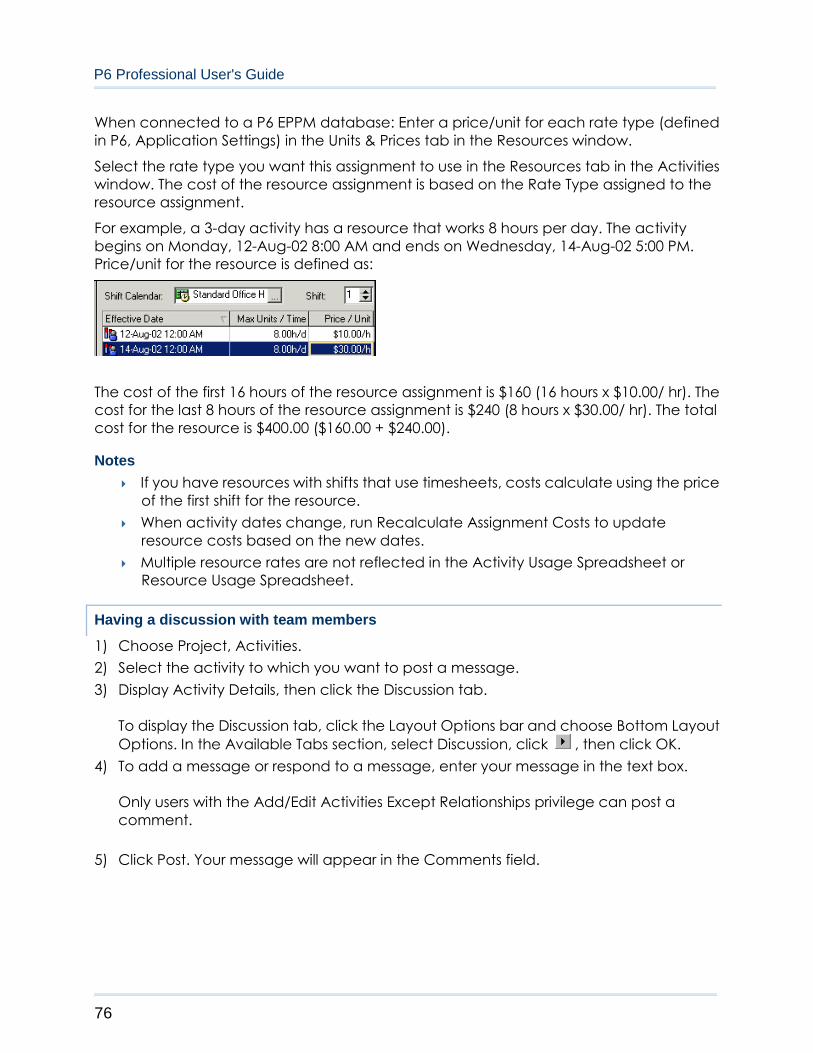
P6 Professional User's Guide
76
When connected to a P6 EPPM database: Enter a price/unit for each rate type (defined
in P6, Application Settings) in the Units & Prices tab in the Resources window.
Select the rate type you want this assignment to use in the Resources tab in the Activities
window. The cost of the resource assignment is based on the Rate Type assigned to the
resource assignment.
For example, a 3-day activity has a resource that works 8 hours per day. The activity
begins on Monday, 12-Aug-02 8:00 AM and ends on Wednesday, 14-Aug-02 5:00 PM.
Price/unit for the resource is defined as:
The cost of the first 16 hours of the resource assignment is $160 (16 hours x $10.00/ hr). The
cost for the last 8 hours of the resource assignment is $240 (8 hours x $30.00/ hr). The total
cost for the resource is $400.00 ($160.00 + $240.00).
Notes
If you have resources with shifts that use timesheets, costs calculate using the price
of the first shift for the resource.
When activity dates change, run Recalculate Assignment Costs to update
resource costs based on the new dates.
Multiple resource rates are not reflected in the Activity Usage Spreadsheet or
Resource Usage Spreadsheet.
Having a discussion with team members
1) Choose Project, Activities.
2) Select the activity to which you want to post a message.
3) Display Activity Details, then click the Discussion tab.
To display the Discussion tab, click the Layout Options bar and choose Bottom Layout
Options. In the Available Tabs section, select Discussion, click , then click OK.
4) To add a message or respond to a message, enter your message in the text box.
Only users with the Add/Edit Activities Except Relationships privilege can post a
comment.
5) Click Post. Your message will appear in the Comments field.
Structuring Projects
77
Tips
Use the Unread Comments column to view the number of unread comments on an
activity. You can sort and filter on Unread Comments. This column serves as a
notification for new comments. Project Managers use this column to see how many
unread comments are in a given project.
To display this column, click Columns on the Layout toolbar. In the Columns dialog
box, select Unread Comments from the General group.
You can choose to show all messages, only received messages, or only sent
messages.
You can sort how messages are displayed by newest to oldest or oldest to newest.
Roles
Roles
Roles are project personnel job titles or skills, such as mechanical engineer, inspector, or
carpenter. They represent a type of resource with a certain level of proficiency rather
than a specific individual. Roles can also be assigned to specific resources to further
identify that resource's skills. For example, a resource may have a role of a engineer and
manager.
You can create a set of roles to assign to resources and activities in all projects in the
enterprise. You can establish an unlimited number of roles and organize them in a
hierarchy for easier management and assignment. The set of roles you assign to an
activity defines the activity's skill requirements. You can also define unique price per unit
rates for each role for accurate cost planning.
You can temporarily assign roles during the planning stages of the project to see how
certain resources affect the schedule. Once you finalize your plans, you can replace the
roles with resources that fulfill the role skill levels. Five proficiency levels can be assigned to
roles: Master, Expert, Skilled, Proficient and Inexperienced.
Roles can be assigned in the Resource Details window or from the Roles dialog box.
Add a role
1) Choose Enterprise, Roles.
2) Click on the Edit toolbar or choose Edit, Add.
3) Click the General tab, then type a unique ID for the role.
4) Type the role's name.
5) Click Modify to type a description of the role's responsibilities in an HTML editor.
In the editor, you can format text, insert pictures and tables, copy and paste
information from other document files (while retaining formatting), and add
hyperlinks.

P6 Professional User's Guide
78
Define price/unit rates for roles
You can add up to five price per unit rates for each role in the roles dictionary. When you
assign a role to an activity during project planning, you can choose which rate you want
to use to calculate cost. Defining rates for specific roles yields more accurate project
cost planning results.
1) Choose Enterprise, Roles.
2) Select the role you want to assign rates to, then click the Prices tab. If tabs are not
displayed in the Roles dialog box, click the Display Options bar and choose Roles
Details.
3) Enter up to five Price/Unit rates for the selected role.
For example, if the price per unit is $25 per hour, enter 25h; if the price per unit is
$50000 per year, enter 50000y. You can only enter unit values in minutes, hours, days,
weeks, months, and years. Your system administrator defines the abbreviations for
these units in the Admin Preferences, Time Periods tab when P6 Professional is
connected to a P6 Professional database in P6, Application Settings when
connected to a P6 EPPM database.
Notes
The Calculate Costs from Units checkbox is marked by default when you add a
new role. When this option is selected, any new assignments for the role will have
its costs recalculated whenever any quantity changes occur.
The default unit value is hours. If you type a price but no unit, the module defaults
the unit to hours.
Define role limits over time
Use the Limits tab to specify available quantities (limits) for a role. Setting limits helps you
quickly identify areas of role overload in Resource/Role Usage Profiles, using different
colors to represent limits and overallocated units in charts and histograms. You can
define an unlimited number of role limits for each role; however, the effective date must
be unique. To define role limits:
1) Choose Enterprise, Roles.
2) Select the role you want to define limits for, then click the Limits tab. If tabs are not
displayed in the Roles dialog box, click the Display Options bar and choose Roles
Details.
3) Click Add at the bottom of the Roles dialog box.
4) Double-click in the Effective Date column, then click the Browse button to select the
date the limit takes effect.

Structuring Projects
79
5) In the Max Units/Time column, enter the allocation limit for the role as a unit value or
as a percentage, depending on your user preference settings for resource units/time
(User Preferences, Time Units tab).
You can enter values in any time and duration unit; however, the module
automatically converts the value to the default units/duration format specified in the
User Preferences, Time Units tab.
Tip
By default, role limits are calculated based on the limit defined for each role’s
primary resource, which may not accurately reflect a role’s planned allocation. In
P6 Professional on the User Preferences, Resource Analysis tab, you can choose to
display role limits based on the custom role limits you define.
Assign roles to activities
1) Choose Project, Activities.
2) Select the activity to which you want to assign a role.
3) Display Activity Details, then click the Resources tab.
4) Click Add Role.
5) Select the role you want to assign.
You can assign multiple roles to an activity. To select more than one item, hold down
the Ctrl key, then click each role you want to assign.
6) Click Assign, then click Close.
Tip
If price/unit rates are defined for a role you assign to an activity, you can choose
the price/unit rate you want the module to use to calculate cost. Choosing a
defined price/unit rate yields more accurate cost planning results. If you do not
specify a rate, the module uses the default rate defined in the Project Details,
Calculations tab.
Assign roles to resources from the Resources window
1) Choose Enterprise, Resources, then select the resource to which you want to assign a
role.
2) Click the Roles tab, then click Assign.
3) Select the role you want to assign.
4) Click the Assign button, then click the Close button.
5) In the Roles tab, double-click the Proficiency column and select a skill level.
6) If this is the resource’s primary role, mark the Primary Role checkbox.
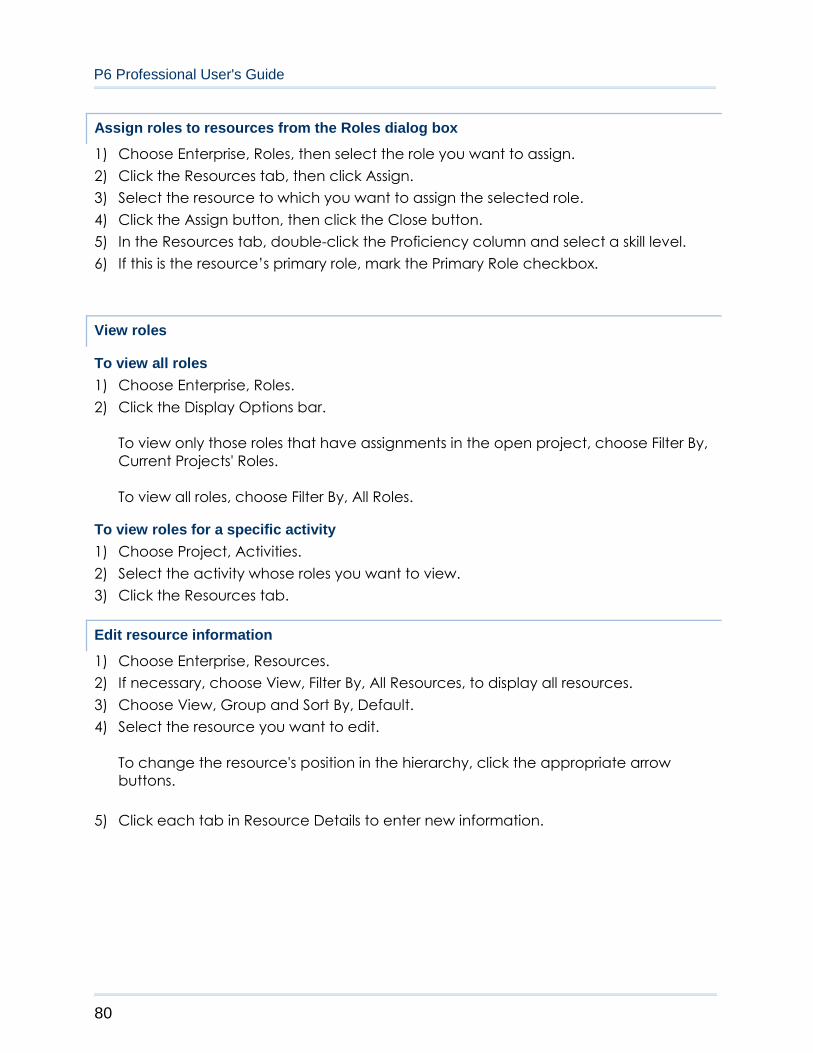
P6 Professional User's Guide
80
Assign roles to resources from the Roles dialog box
1) Choose Enterprise, Roles, then select the role you want to assign.
2) Click the Resources tab, then click Assign.
3) Select the resource to which you want to assign the selected role.
4) Click the Assign button, then click the Close button.
5) In the Resources tab, double-click the Proficiency column and select a skill level.
6) If this is the resource’s primary role, mark the Primary Role checkbox.
View roles
To view all roles
1) Choose Enterprise, Roles.
2) Click the Display Options bar.
To view only those roles that have assignments in the open project, choose Filter By,
Current Projects' Roles.
To view all roles, choose Filter By, All Roles.
To view roles for a specific activity
1) Choose Project, Activities.
2) Select the activity whose roles you want to view.
3) Click the Resources tab.
Edit resource information
1) Choose Enterprise, Resources.
2) If necessary, choose View, Filter By, All Resources, to display all resources.
3) Choose View, Group and Sort By, Default.
4) Select the resource you want to edit.
To change the resource's position in the hierarchy, click the appropriate arrow
buttons.
5) Click each tab in Resource Details to enter new information.
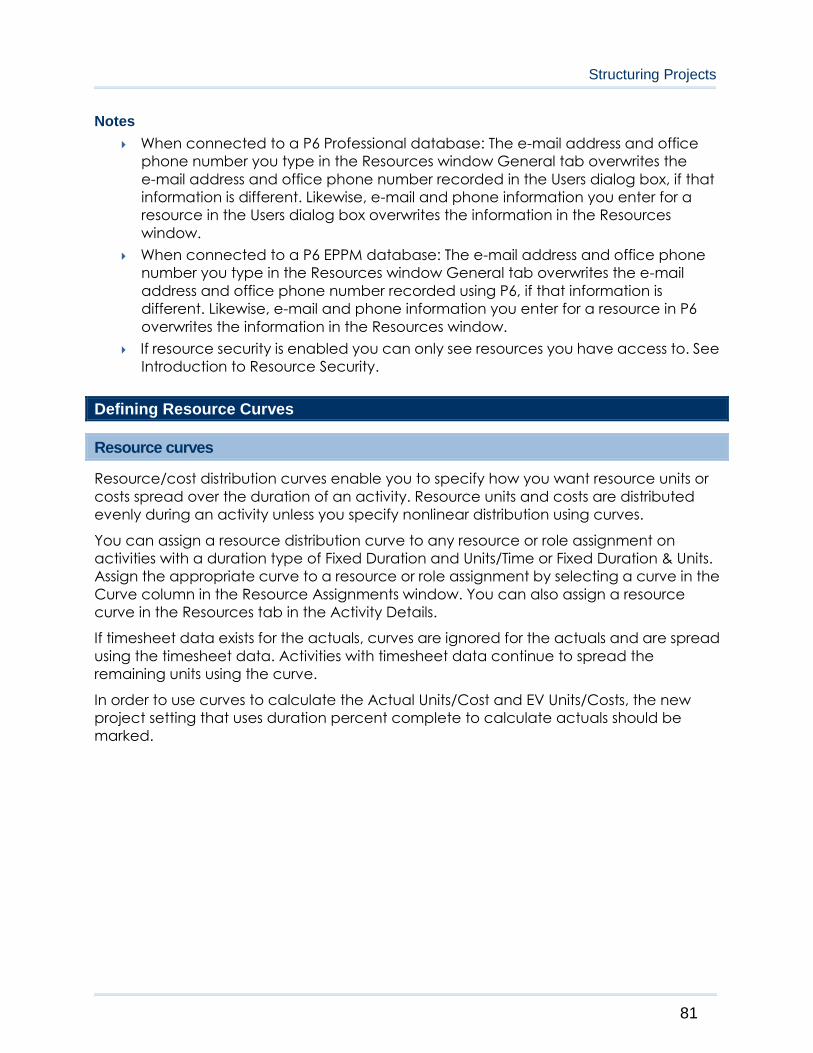
Structuring Projects
81
Notes
When connected to a P6 Professional database: The e-mail address and office
phone number you type in the Resources window General tab overwrites the
e-mail address and office phone number recorded in the Users dialog box, if that
information is different. Likewise, e-mail and phone information you enter for a
resource in the Users dialog box overwrites the information in the Resources
window.
When connected to a P6 EPPM database: The e-mail address and office phone
number you type in the Resources window General tab overwrites the e-mail
address and office phone number recorded using P6, if that information is
different. Likewise, e-mail and phone information you enter for a resource in P6
overwrites the information in the Resources window.
If resource security is enabled you can only see resources you have access to. See
Introduction to Resource Security.
Defining Resource Curves
Resource curves
Resource/cost distribution curves enable you to specify how you want resource units or
costs spread over the duration of an activity. Resource units and costs are distributed
evenly during an activity unless you specify nonlinear distribution using curves.
You can assign a resource distribution curve to any resource or role assignment on
activities with a duration type of Fixed Duration and Units/Time or Fixed Duration & Units.
Assign the appropriate curve to a resource or role assignment by selecting a curve in the
Curve column in the Resource Assignments window. You can also assign a resource
curve in the Resources tab in the Activity Details.
If timesheet data exists for the actuals, curves are ignored for the actuals and are spread
using the timesheet data. Activities with timesheet data continue to spread the
remaining units using the curve.
In order to use curves to calculate the Actual Units/Cost and EV Units/Costs, the new
project setting that uses duration percent complete to calculate actuals should be
marked.
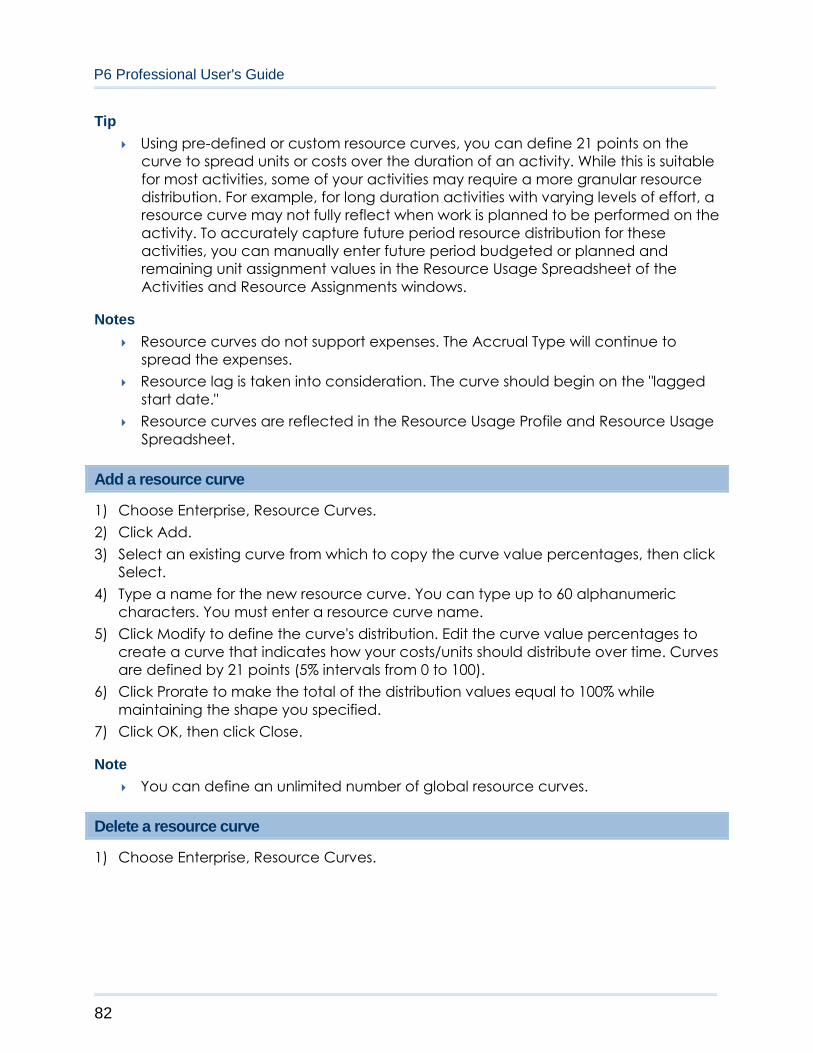
P6 Professional User's Guide
82
Tip
Using pre-defined or custom resource curves, you can define 21 points on the
curve to spread units or costs over the duration of an activity. While this is suitable
for most activities, some of your activities may require a more granular resource
distribution. For example, for long duration activities with varying levels of effort, a
resource curve may not fully reflect when work is planned to be performed on the
activity. To accurately capture future period resource distribution for these
activities, you can manually enter future period budgeted or planned and
remaining unit assignment values in the Resource Usage Spreadsheet of the
Activities and Resource Assignments windows.
Notes
Resource curves do not support expenses. The Accrual Type will continue to
spread the expenses.
Resource lag is taken into consideration. The curve should begin on the "lagged
start date."
Resource curves are reflected in the Resource Usage Profile and Resource Usage
Spreadsheet.
Add a resource curve
1) Choose Enterprise, Resource Curves.
2) Click Add.
3) Select an existing curve from which to copy the curve value percentages, then click
Select.
4) Type a name for the new resource curve. You can type up to 60 alphanumeric
characters. You must enter a resource curve name.
5) Click Modify to define the curve's distribution. Edit the curve value percentages to
create a curve that indicates how your costs/units should distribute over time. Curves
are defined by 21 points (5% intervals from 0 to 100).
6) Click Prorate to make the total of the distribution values equal to 100% while
maintaining the shape you specified.
7) Click OK, then click Close.
Note
You can define an unlimited number of global resource curves.
Delete a resource curve
1) Choose Enterprise, Resource Curves.
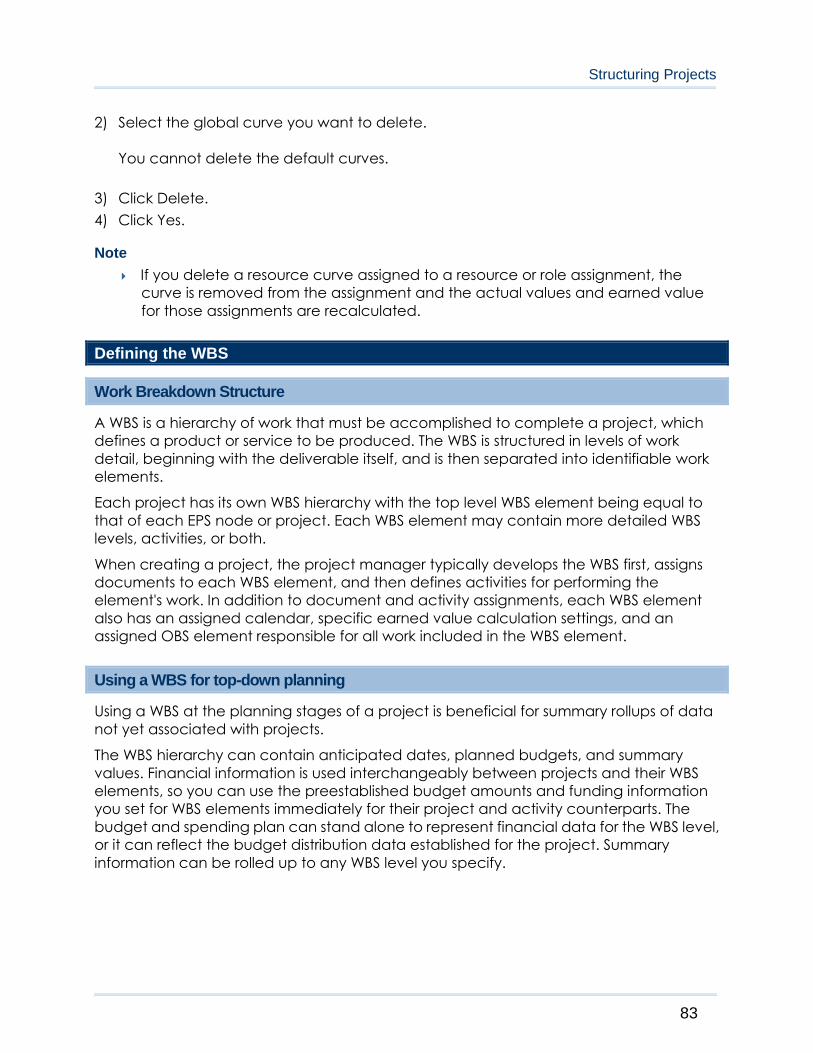
Structuring Projects
83
2) Select the global curve you want to delete.
You cannot delete the default curves.
3) Click Delete.
4) Click Yes.
Note
If you delete a resource curve assigned to a resource or role assignment, the
curve is removed from the assignment and the actual values and earned value
for those assignments are recalculated.
Defining the WBS
Work Breakdown Structure
A WBS is a hierarchy of work that must be accomplished to complete a project, which
defines a product or service to be produced. The WBS is structured in levels of work
detail, beginning with the deliverable itself, and is then separated into identifiable work
elements.
Each project has its own WBS hierarchy with the top level WBS element being equal to
that of each EPS node or project. Each WBS element may contain more detailed WBS
levels, activities, or both.
When creating a project, the project manager typically develops the WBS first, assigns
documents to each WBS element, and then defines activities for performing the
element's work. In addition to document and activity assignments, each WBS element
also has an assigned calendar, specific earned value calculation settings, and an
assigned OBS element responsible for all work included in the WBS element.
Using a WBS for top-down planning
Using a WBS at the planning stages of a project is beneficial for summary rollups of data
not yet associated with projects.
The WBS hierarchy can contain anticipated dates, planned budgets, and summary
values. Financial information is used interchangeably between projects and their WBS
elements, so you can use the preestablished budget amounts and funding information
you set for WBS elements immediately for their project and activity counterparts. The
budget and spending plan can stand alone to represent financial data for the WBS level,
or it can reflect the budget distribution data established for the project. Summary
information can be rolled up to any WBS level you specify.
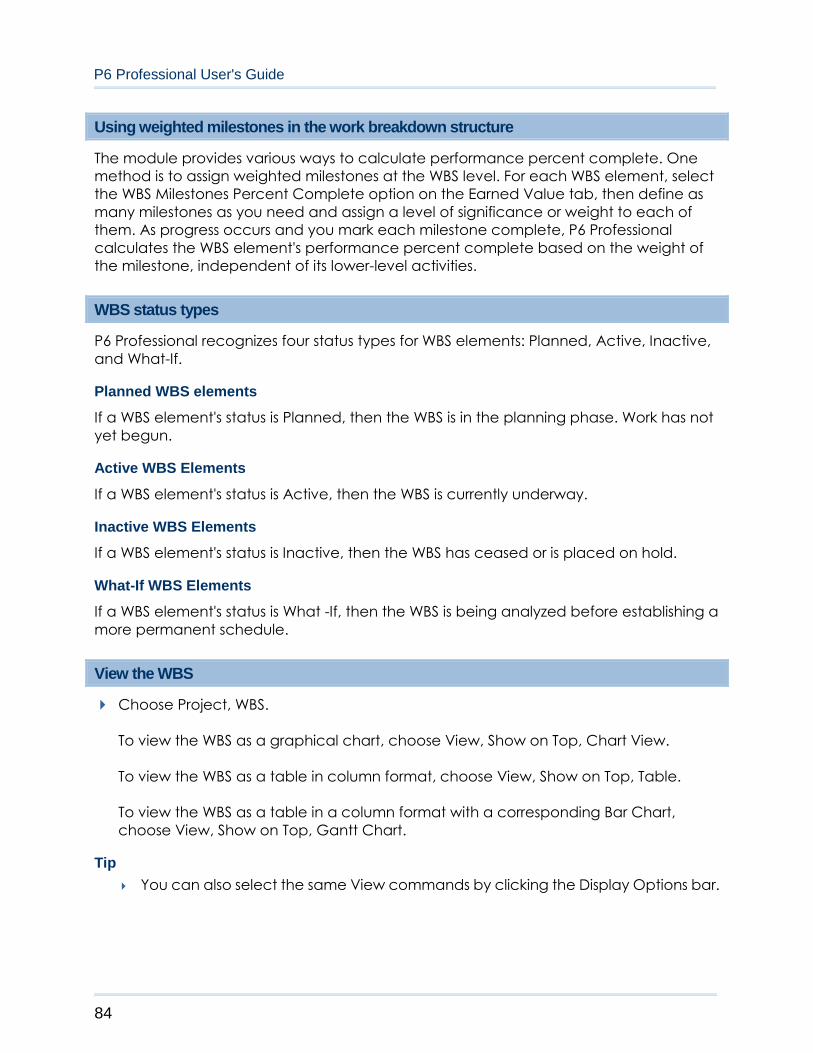
P6 Professional User's Guide
84
Using weighted milestones in the work breakdown structure
The module provides various ways to calculate performance percent complete. One
method is to assign weighted milestones at the WBS level. For each WBS element, select
the WBS Milestones Percent Complete option on the Earned Value tab, then define as
many milestones as you need and assign a level of significance or weight to each of
them. As progress occurs and you mark each milestone complete, P6 Professional
calculates the WBS element's performance percent complete based on the weight of
the milestone, independent of its lower-level activities.
WBS status types
P6 Professional recognizes four status types for WBS elements: Planned, Active, Inactive,
and What-If.
Planned WBS elements
If a WBS element's status is Planned, then the WBS is in the planning phase. Work has not
yet begun.
Active WBS Elements
If a WBS element's status is Active, then the WBS is currently underway.
Inactive WBS Elements
If a WBS element's status is Inactive, then the WBS has ceased or is placed on hold.
What-If WBS Elements
If a WBS element's status is What -If, then the WBS is being analyzed before establishing a
more permanent schedule.
View the WBS
Choose Project, WBS.
To view the WBS as a graphical chart, choose View, Show on Top, Chart View.
To view the WBS as a table in column format, choose View, Show on Top, Table.
To view the WBS as a table in a column format with a corresponding Bar Chart,
choose View, Show on Top, Gantt Chart.
Tip
You can also select the same View commands by clicking the Display Options bar.
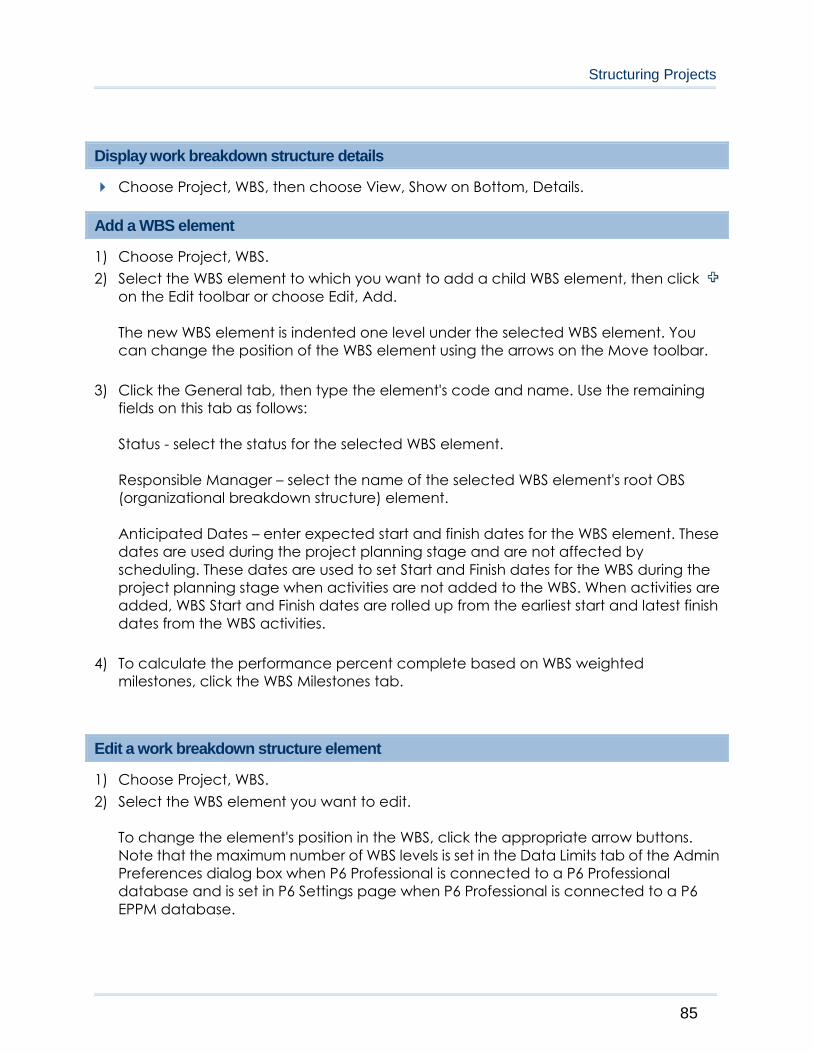
Structuring Projects
85
Display work breakdown structure details
Choose Project, WBS, then choose View, Show on Bottom, Details.
Add a WBS element
1) Choose Project, WBS.
2) Select the WBS element to which you want to add a child WBS element, then click
on the Edit toolbar or choose Edit, Add.
The new WBS element is indented one level under the selected WBS element. You
can change the position of the WBS element using the arrows on the Move toolbar.
3) Click the General tab, then type the element's code and name. Use the remaining
fields on this tab as follows:
Status - select the status for the selected WBS element.
Responsible Manager – select the name of the selected WBS element's root OBS
(organizational breakdown structure) element.
Anticipated Dates – enter expected start and finish dates for the WBS element. These
dates are used during the project planning stage and are not affected by
scheduling. These dates are used to set Start and Finish dates for the WBS during the
project planning stage when activities are not added to the WBS. When activities are
added, WBS Start and Finish dates are rolled up from the earliest start and latest finish
dates from the WBS activities.
4) To calculate the performance percent complete based on WBS weighted
milestones, click the WBS Milestones tab.
Edit a work breakdown structure element
1) Choose Project, WBS.
2) Select the WBS element you want to edit.
To change the element's position in the WBS, click the appropriate arrow buttons.
Note that the maximum number of WBS levels is set in the Data Limits tab of the Admin
Preferences dialog box when P6 Professional is connected to a P6 Professional
database and is set in P6 Settings page when P6 Professional is connected to a P6
EPPM database.

P6 Professional User's Guide
86
3) Click the Display Options bar and choose Show on Bottom, WBS Details to view or
modify information in the General and WBS Milestones tabs.
Tip
You can also directly edit some WBS information in the WBS table by
double-clicking the information you want to change.
Assign WBS weighted milestones
1) Choose Project, WBS.
2) Select the WBS element to which you want to assign weighted milestones, then click
the Earned Value tab.
3) In the Technique for Computing Performance Percent Complete area, choose WBS
Milestones Percent Complete.
4) Click the WBS Milestones tab.
5) Click Add, then type a name of the task or portion of work signifying a milestone for
the selected WBS element in the WBS Milestone column.
6) Click the corresponding field in the Weight column, then type a number indicating
the significance of this milestone relative to the others listed.
7) Mark the checkbox in the Completed column when each milestone is complete.
The WBS element's percent complete is calculated based on the weight of the
completed milestone in relation to the remaining milestones.
Note
If all weighted milestones for a WBS element have a value of 1.0 and you have a total
of four milestones, marking one as Completed would indicated that the WBS element
is 25% complete. If this same milestone had a weight of 9.0, and the other three had
1.0 weights, marking it Completed would indicate that the WBS element is 75%
complete. The module uses the following formula to calculate percent complete
from weighted milestones: Actual Weight of Completed Milestones/ Total Possible
Weight of All Milestones.
Applying this formula to the previous example, the completed milestone has a weight
of 9.0, and is divided by the total weight of all milestones (12.0), to equal 75%
complete.
Assign WBS Category values (P6 Professional Only)
You can assign a WBS category value from the Work Breakdown Structure window.
1) Display a column for the WBS category, if it is not already displayed.
Click the Display Options bar, choose Columns, and then choose Customize. In the
Available Options section, under the General subsection, choose the WBS category.
Click , then click OK.
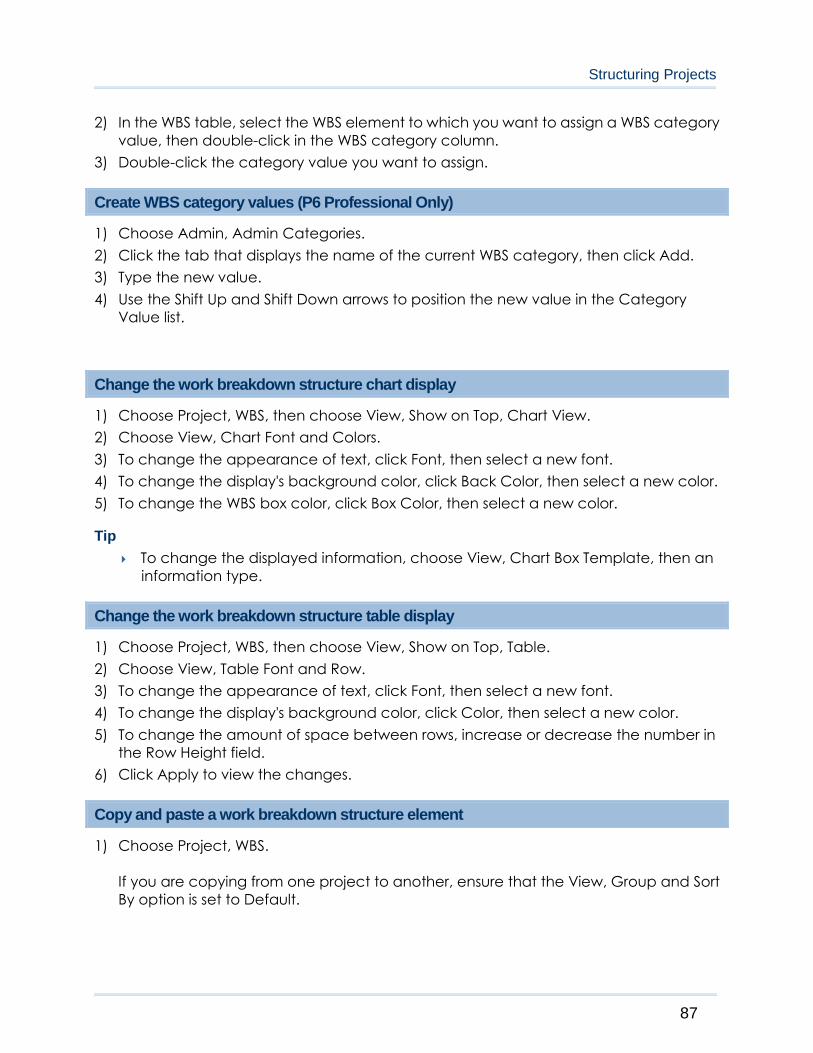
Structuring Projects
87
2) In the WBS table, select the WBS element to which you want to assign a WBS category
value, then double-click in the WBS category column.
3) Double-click the category value you want to assign.
Create WBS category values (P6 Professional Only)
1) Choose Admin, Admin Categories.
2) Click the tab that displays the name of the current WBS category, then click Add.
3) Type the new value.
4) Use the Shift Up and Shift Down arrows to position the new value in the Category
Value list.
Change the work breakdown structure chart display
1) Choose Project, WBS, then choose View, Show on Top, Chart View.
2) Choose View, Chart Font and Colors.
3) To change the appearance of text, click Font, then select a new font.
4) To change the display's background color, click Back Color, then select a new color.
5) To change the WBS box color, click Box Color, then select a new color.
Tip
To change the displayed information, choose View, Chart Box Template, then an
information type.
Change the work breakdown structure table display
1) Choose Project, WBS, then choose View, Show on Top, Table.
2) Choose View, Table Font and Row.
3) To change the appearance of text, click Font, then select a new font.
4) To change the display's background color, click Color, then select a new color.
5) To change the amount of space between rows, increase or decrease the number in
the Row Height field.
6) Click Apply to view the changes.
Copy and paste a work breakdown structure element
1) Choose Project, WBS.
If you are copying from one project to another, ensure that the View, Group and Sort
By option is set to Default.
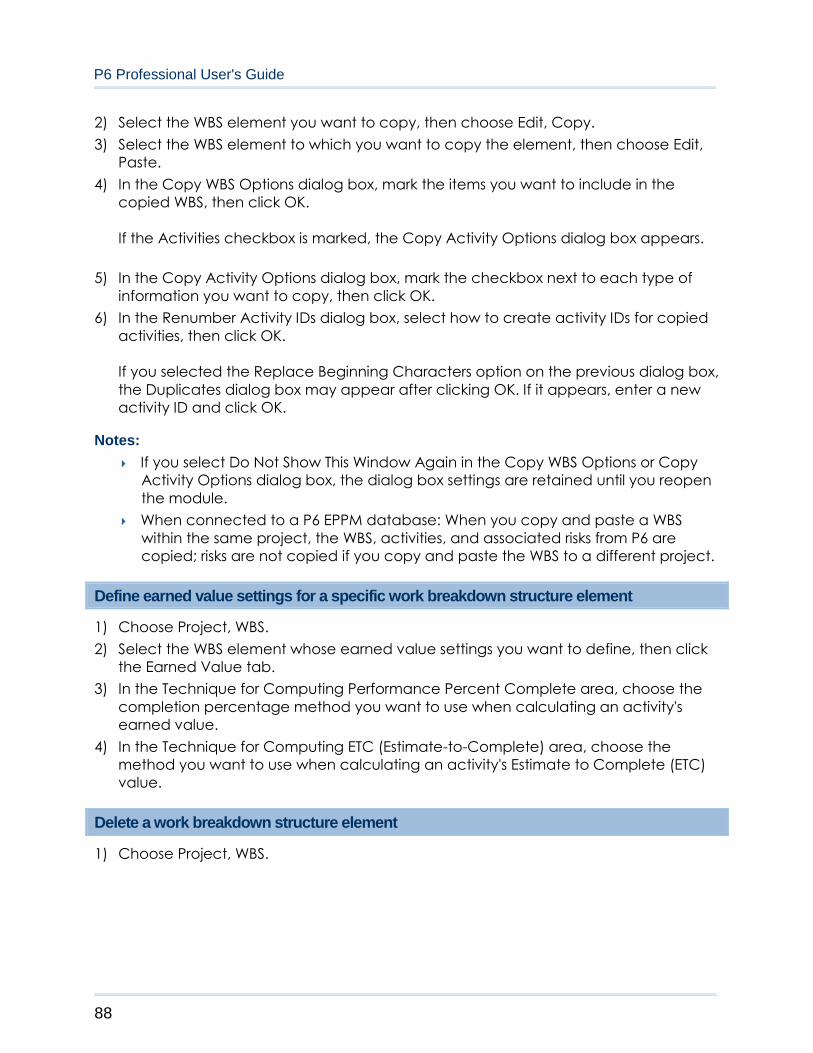
P6 Professional User's Guide
88
2) Select the WBS element you want to copy, then choose Edit, Copy.
3) Select the WBS element to which you want to copy the element, then choose Edit,
Paste.
4) In the Copy WBS Options dialog box, mark the items you want to include in the
copied WBS, then click OK.
If the Activities checkbox is marked, the Copy Activity Options dialog box appears.
5) In the Copy Activity Options dialog box, mark the checkbox next to each type of
information you want to copy, then click OK.
6) In the Renumber Activity IDs dialog box, select how to create activity IDs for copied
activities, then click OK.
If you selected the Replace Beginning Characters option on the previous dialog box,
the Duplicates dialog box may appear after clicking OK. If it appears, enter a new
activity ID and click OK.
Notes:
If you select Do Not Show This Window Again in the Copy WBS Options or Copy
Activity Options dialog box, the dialog box settings are retained until you reopen
the module.
When connected to a P6 EPPM database: When you copy and paste a WBS
within the same project, the WBS, activities, and associated risks from P6 are
copied; risks are not copied if you copy and paste the WBS to a different project.
Define earned value settings for a specific work breakdown structure element
1) Choose Project, WBS.
2) Select the WBS element whose earned value settings you want to define, then click
the Earned Value tab.
3) In the Technique for Computing Performance Percent Complete area, choose the
completion percentage method you want to use when calculating an activity's
earned value.
4) In the Technique for Computing ETC (Estimate-to-Complete) area, choose the
method you want to use when calculating an activity's Estimate to Complete (ETC)
value.
Delete a work breakdown structure element
1) Choose Project, WBS.
Structuring Projects
89
2) Select the WBS element you want to delete, then choose Edit, Delete.
If the WBS element you want to delete is assigned to activities, you are prompted to
delete the WBS element and all activities assigned to it or reassign all of its activity
assignments to the element's parent WBS element.
3) Click OK, then click Yes.
Note
If you delete a parent WBS element, all elements contained in the parent element
are also deleted.
Defining Project, Resource, and Activity Codes
Project Codes
Project codes and values
You can organize the projects in your EPS (Enterprise Project Structure) in groups
according to specific categories, such as location and manager, using project codes.
When P6 Professional is connected to a P6 Professional database:
You can define unlimited hierarchical project codes to fulfill the filtering, sorting, and
reporting requirements for your projects, and arrange them hierarchically for easier
management and assignment.
The Project Codes dictionary is global to the entire enterprise.
You can assign a project code value to projects for each project code you create.
When P6 Professional is connected to a P6 EPPM database:
You use P6 to define unlimited hierarchical project codes to fulfill the filtering, sorting, and
reporting requirements for your projects, and arrange them hierarchically for easier
management and assignment.
You can use P6 or P6 Professional to assign a project code value to projects for each
project code you create.
Use project codes to group projects, consolidate large amounts of information, and to
distinguish one project from another. All projects assigned a value for a code are
grouped by their corresponding values when you group and sort by project code. Any
projects not assigned a value for the project codes are placed at the bottom of the view
under a No Code grouping band.
P6 Professional User's Guide
90
Tips
You can group by project code in the Open Project dialog box and in the Projects
window by right-clicking anywhere in the dialog box or view, choosing Group and
Sort By, then selecting the project code name. All predefined project codes are
available in the Group and Sort By menu.
View Project Codes as columns in the Activities and WBS column views. The
project code value associated with the currently open projects appears in the
row for each activity.
Create project codes (P6 Professional Only)
1) Choose Enterprise, Project Codes.
2) Click Modify.
3) Click Add, then type the name of the project code.
4) In the Max Length field, specify the maximum number of characters for the project
code's values.
5) Click Close.
Note
If you intend to use BI Publisher, avoid using commas when creating data other
than Project names. The way that data other than Project names is passed to BI
Publisher can cause a comma to be interpreted as a delimiter between data
items.
Tip
To change the order in which project codes are listed, select the project code you
want to move in the Project Code Definitions dialog box, then click Shift Up or Shift
Down.
Create project code values (P6 Professional Only)
1) Choose Enterprise, Project Codes.
2) Select the project code for which you want to create a value.
3) Click Add.
4) Type the value's name.
5) Type the value's description.
Assign project codes and values
1) Choose Enterprise, Projects, then select the project to which you want to assign a
code and value.
Structuring Projects
91
2) Click the Codes tab.
3) Click Assign.
4) Select the project code value you want to assign.
You can only assign one value per code.
5) Click the Assign button, then click the Close button.
Tips
To change a code value assignment, double-click the code value you want to
change and select a new code value.
To remove a project code, select the code and value you want to remove in the
Codes tab, then click Remove.
You can view the assigned project codes in a column in the Activities and Work
Breakdown Structure windows.
Resource Codes
Resource codes
You can categorize resources using codes. With potentially hundreds of resources being
used across an enterprise of projects, codes provide another method for filtering the
resources you need to access quickly, or for grouping resources for analysis and
summarization in layouts. You can also use resource codes to group, sort, and filter
resources in profiles and spreadsheets.
Create resource codes
1) Choose Enterprise, Resource Codes.
2) Click Modify.
3) Click Add, then type the name of the resource code.
4) In the Max Length field, specify the maximum number of characters for the resource
code's values.
5) Click Close.
Note
If you intend to use BI Publisher, avoid using commas when creating data other
than Project names. The way that data other than Project names is passed to BI
Publisher can cause a comma to be interpreted as a delimiter between data
items.
P6 Professional User's Guide
92
Tip
To change the order in which resource codes are listed, select the resource code
you want to move in the Resource Code Definitions dialog box, then click Shift Up
or Shift Down.
Create resource code values
1) Choose Enterprise, Resource Codes.
2) Select the resource code for which you want to create a value.
3) Click Add.
4) Type the value's name and description.
Assign resource codes and values
1) Choose Enterprise, Resources, then select the resource to which you want to assign a
code and value.
2) Click the Codes tab.
3) Click Assign.
4) Select the resource code value you want to assign.
You can only assign one value per code.
5) Click Assign, then click Close.
Tips
To change a code value assignment, double-click the code value you want to
change and select a new code value.
To remove a resource code, select the code and value you want to remove in the
Codes tab, then click Remove.
Activity Codes
Activity codes and values
Activity codes and values enable you to filter, group, sort, and report activity information
according to your organization's unique requirements. For example, if your organization
has more than one location, you can create a Location code with values such as New
York, Los Angeles, and Chicago. You can then associate activities with a specific
location, such as New York.

Structuring Projects
93
You can define three types of activity codes, global activity codes, EPS-level activity
codes, and project-level activity codes. You can assign global activity codes and values
to activities in all projects. You can assign EPS-level activity codes and values to the
EPS.EPS-level activity codes are useful when you don't want certain codes to be
accessible to all users, or project-specific. You can assign project-level activity codes
and values to activities only in the project for which the codes were created. Each
activity code can have an unlimited number of values.
You can also assign a color to an activity code value for use in Visualizer. Assign colors to
activity code values when you want the option from within the Visualizer application to
color bars using the colors assigned in P6 Professional. You can also update colors
directly in Visualizer. These updates will be saved to the database.
Tip
If possible, you should create EPS-level activity codes at the highest level of the EPS
so all projects that belong to a lower level EPS will have access to these codes.
Defining Global Activity Codes and Values and Values Colors
Create global activity codes
1) Choose Enterprise, Activity Codes.
2) Choose Global.
3) In the Select Activity Code section, click Modify.
4) Click Add, then type the name of the global activity code.
5) In the Max Length field, specify the maximum number of characters for the activity
code's values.
6) Click Close.
Tip
To change the order in which global activity codes are listed, select the activity
code you want to move in the Activity Code Definitions dialog box, then click Shift
Up or Shift Down.
Create global activity code values
1) Choose Enterprise, Activity Codes.
2) Choose Global.
3) Select the activity code for which you want to create a value, then click Add.
4) Type the value's name.
5) Type the value's description.
Tips
You can arrange activity code values hierarchically using the arrow buttons on
the Activity Codes dialog box.
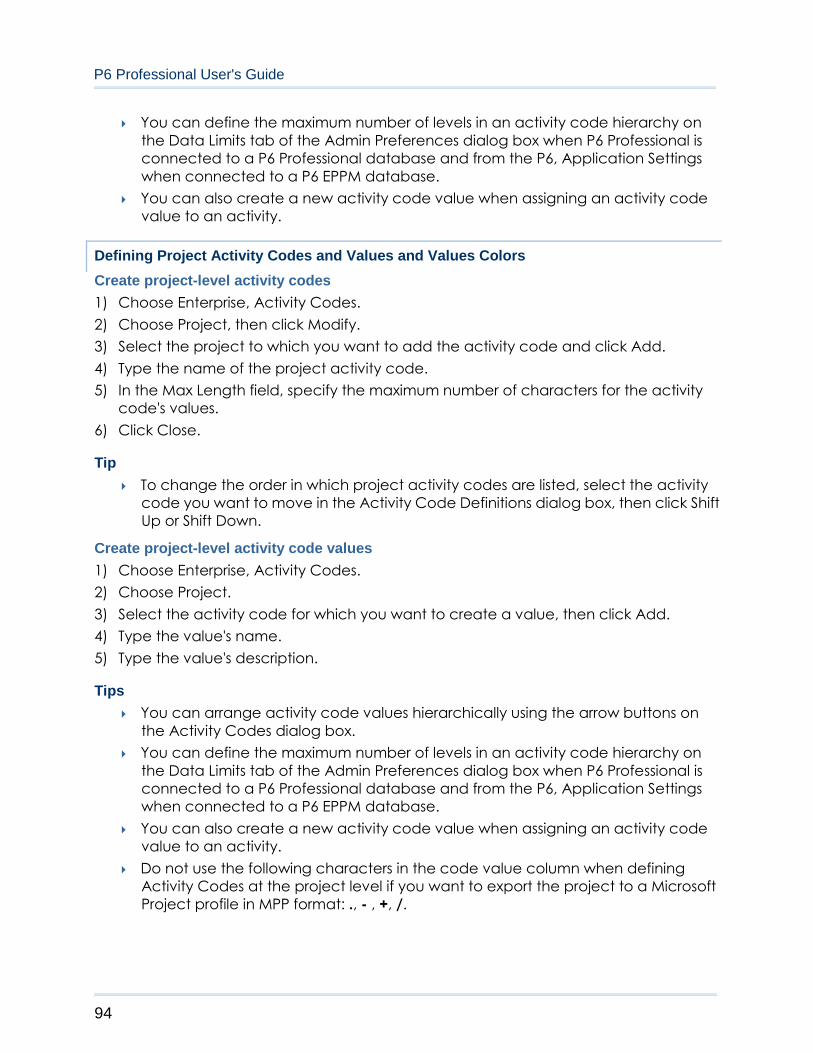
P6 Professional User's Guide
94
You can define the maximum number of levels in an activity code hierarchy on
the Data Limits tab of the Admin Preferences dialog box when P6 Professional is
connected to a P6 Professional database and from the P6, Application Settings
when connected to a P6 EPPM database.
You can also create a new activity code value when assigning an activity code
value to an activity.
Defining Project Activity Codes and Values and Values Colors
Create project-level activity codes
1) Choose Enterprise, Activity Codes.
2) Choose Project, then click Modify.
3) Select the project to which you want to add the activity code and click Add.
4) Type the name of the project activity code.
5) In the Max Length field, specify the maximum number of characters for the activity
code's values.
6) Click Close.
Tip
To change the order in which project activity codes are listed, select the activity
code you want to move in the Activity Code Definitions dialog box, then click Shift
Up or Shift Down.
Create project-level activity code values
1) Choose Enterprise, Activity Codes.
2) Choose Project.
3) Select the activity code for which you want to create a value, then click Add.
4) Type the value's name.
5) Type the value's description.
Tips
You can arrange activity code values hierarchically using the arrow buttons on
the Activity Codes dialog box.
You can define the maximum number of levels in an activity code hierarchy on
the Data Limits tab of the Admin Preferences dialog box when P6 Professional is
connected to a P6 Professional database and from the P6, Application Settings
when connected to a P6 EPPM database.
You can also create a new activity code value when assigning an activity code
value to an activity.
Do not use the following characters in the code value column when defining
Activity Codes at the project level if you want to export the project to a Microsoft
Project profile in MPP format: ., - , +, /.
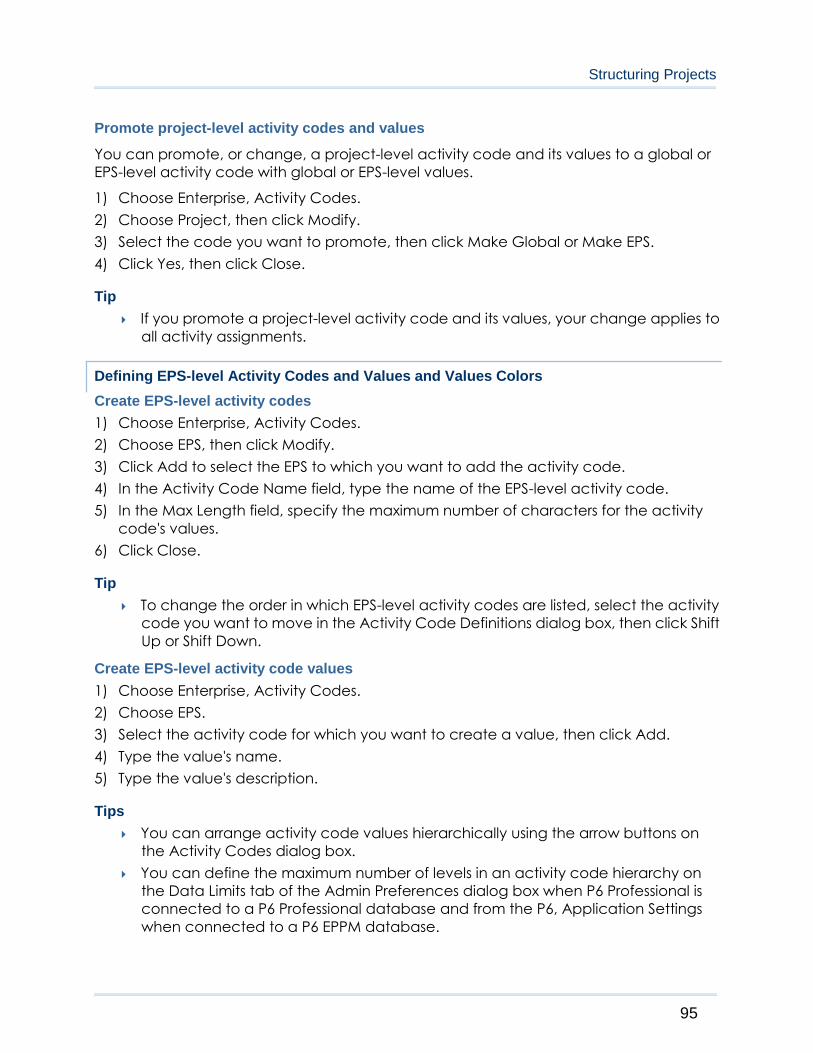
Structuring Projects
95
Promote project-level activity codes and values
You can promote, or change, a project-level activity code and its values to a global or
EPS-level activity code with global or EPS-level values.
1) Choose Enterprise, Activity Codes.
2) Choose Project, then click Modify.
3) Select the code you want to promote, then click Make Global or Make EPS.
4) Click Yes, then click Close.
Tip
If you promote a project-level activity code and its values, your change applies to
all activity assignments.
Defining EPS-level Activity Codes and Values and Values Colors
Create EPS-level activity codes
1) Choose Enterprise, Activity Codes.
2) Choose EPS, then click Modify.
3) Click Add to select the EPS to which you want to add the activity code.
4) In the Activity Code Name field, type the name of the EPS-level activity code.
5) In the Max Length field, specify the maximum number of characters for the activity
code's values.
6) Click Close.
Tip
To change the order in which EPS-level activity codes are listed, select the activity
code you want to move in the Activity Code Definitions dialog box, then click Shift
Up or Shift Down.
Create EPS-level activity code values
1) Choose Enterprise, Activity Codes.
2) Choose EPS.
3) Select the activity code for which you want to create a value, then click Add.
4) Type the value's name.
5) Type the value's description.
Tips
You can arrange activity code values hierarchically using the arrow buttons on
the Activity Codes dialog box.
You can define the maximum number of levels in an activity code hierarchy on
the Data Limits tab of the Admin Preferences dialog box when P6 Professional is
connected to a P6 Professional database and from the P6, Application Settings
when connected to a P6 EPPM database.
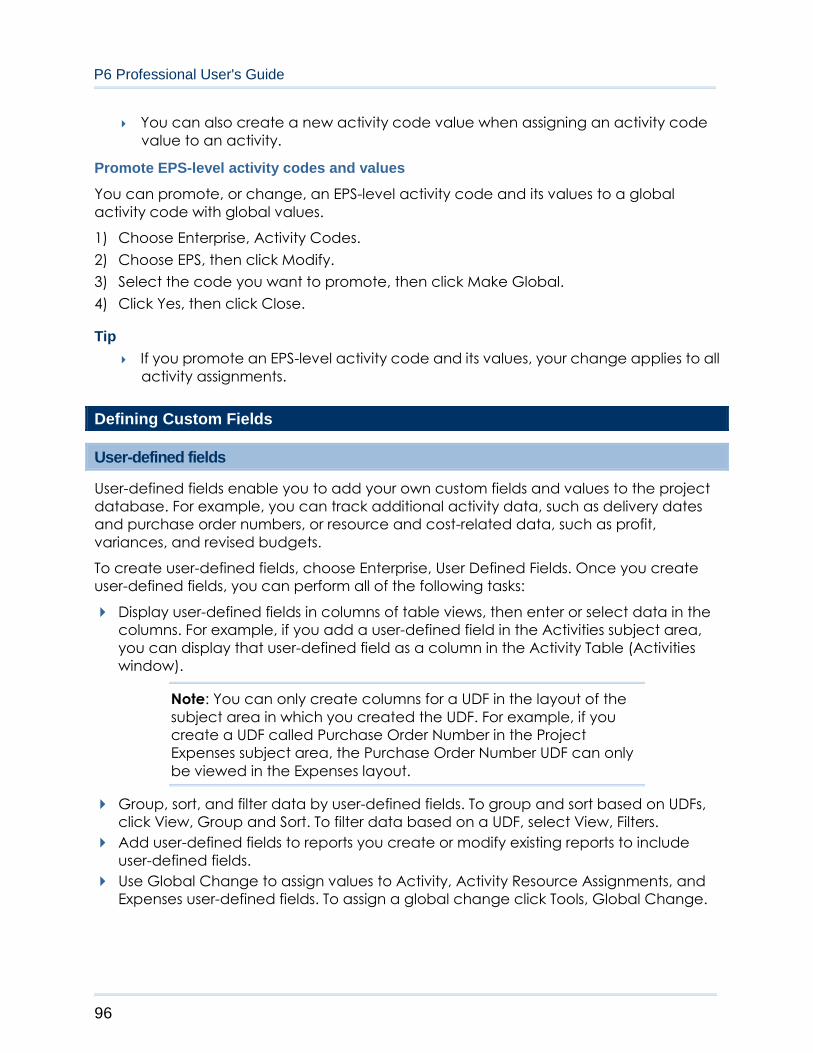
P6 Professional User's Guide
96
You can also create a new activity code value when assigning an activity code
value to an activity.
Promote EPS-level activity codes and values
You can promote, or change, an EPS-level activity code and its values to a global
activity code with global values.
1) Choose Enterprise, Activity Codes.
2) Choose EPS, then click Modify.
3) Select the code you want to promote, then click Make Global.
4) Click Yes, then click Close.
Tip
If you promote an EPS-level activity code and its values, your change applies to all
activity assignments.
Defining Custom Fields
User-defined fields
User-defined fields enable you to add your own custom fields and values to the project
database. For example, you can track additional activity data, such as delivery dates
and purchase order numbers, or resource and cost-related data, such as profit,
variances, and revised budgets.
To create user-defined fields, choose Enterprise, User Defined Fields. Once you create
user-defined fields, you can perform all of the following tasks:
Display user-defined fields in columns of table views, then enter or select data in the
columns. For example, if you add a user-defined field in the Activities subject area,
you can display that user-defined field as a column in the Activity Table (Activities
window).
Note: You can only create columns for a UDF in the layout of the
subject area in which you created the UDF. For example, if you
create a UDF called Purchase Order Number in the Project
Expenses subject area, the Purchase Order Number UDF can only
be viewed in the Expenses layout.
Group, sort, and filter data by user-defined fields. To group and sort based on UDFs,
click View, Group and Sort. To filter data based on a UDF, select View, Filters.
Add user-defined fields to reports you create or modify existing reports to include
user-defined fields.
Use Global Change to assign values to Activity, Activity Resource Assignments, and
Expenses user-defined fields. To assign a global change click Tools, Global Change.

Structuring Projects
97
Note: You must create UDFs in the User Defined Fields dialog before
you can assign and populate UDFs using Global Change. There are
no pre-existing UDFs available in the database.
Create bars for user-defined date fields and view them in the Gantt chart. Click View,
Bars. In the Bars dialog, click Add. Enter a name in the Name field. In the Timescale
field, select User Dates (the User Start Date and User Finish Date fields will become
enabled. Select the user-defined start and finish date values in the User Start Date
and User Finish Date fields.
Notes:
You must create user-defined start date and finish date fields in the
User Defined Fields dialog before you can create bars for these
fields in the Gantt chart. Also, the User Finish Date and User Start
Date columns are only editable when you select User Dates in the
Timescale column.
If you select a User Finish Date that is earlier than the User Start
Date, or if there is no value associated with those fields, the bar will
not be displayed.
Define custom user fields
1) Choose Enterprise, User Defined Fields.
2) Select the subject area of the product where you would like to add the new field,
such as Activities, Activity Steps, Activity Resource Assignments, Projects, Resources,
WBS, Expenses, Issues, and Work Products & Documents.
3) Click Add.
4) Enter a user-defined title for the new field and select a data type.
For example, you could enter Purchase Order Number as the title and select Integer
as the data type.
To assign values to custom user fields
1) In the appropriate window, add a column for the custom user field code.
For example, if you created a UDF in the Activities subject area named Work Order
Number, you can display a Work Order Number column in the Activity Table of the
Activities window.
2) In the custom field column you added, type a value.
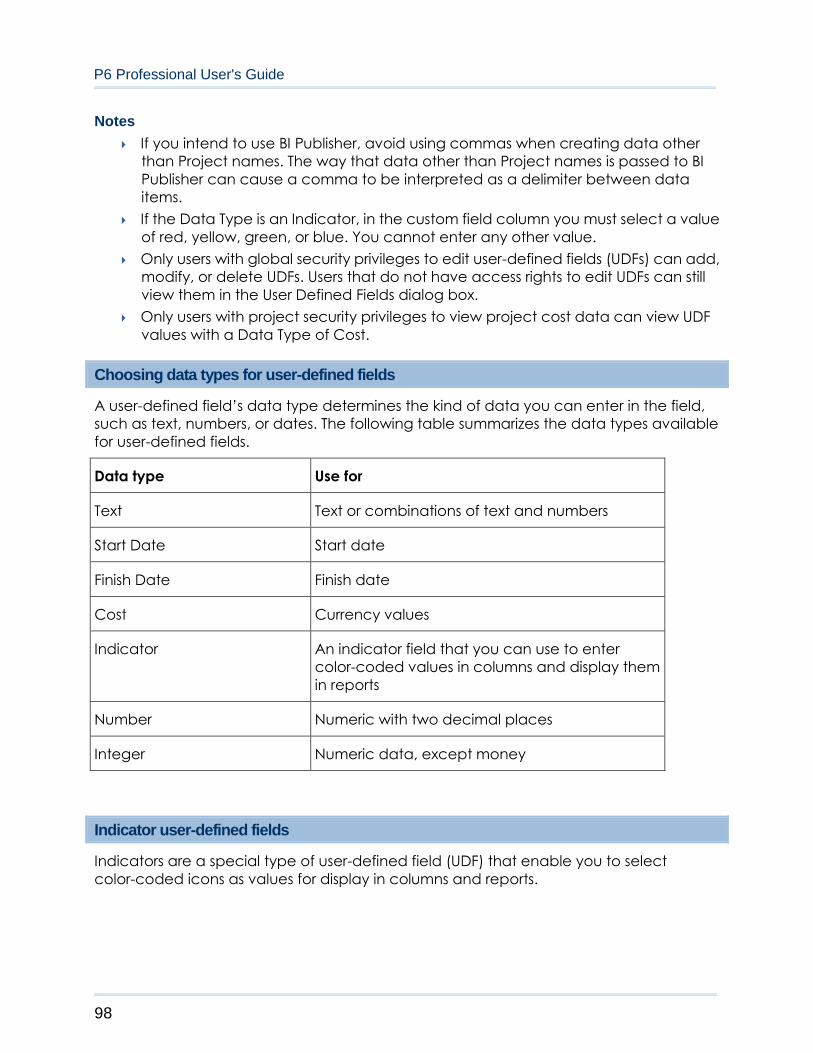
P6 Professional User's Guide
98
Notes
If you intend to use BI Publisher, avoid using commas when creating data other
than Project names. The way that data other than Project names is passed to BI
Publisher can cause a comma to be interpreted as a delimiter between data
items.
If the Data Type is an Indicator, in the custom field column you must select a value
of red, yellow, green, or blue. You cannot enter any other value.
Only users with global security privileges to edit user-defined fields (UDFs) can add,
modify, or delete UDFs. Users that do not have access rights to edit UDFs can still
view them in the User Defined Fields dialog box.
Only users with project security privileges to view project cost data can view UDF
values with a Data Type of Cost.
Choosing data types for user-defined fields
A user-defined field’s data type determines the kind of data you can enter in the field,
such as text, numbers, or dates. The following table summarizes the data types available
for user-defined fields.
Data type Use for
Text Text or combinations of text and numbers
Start Date Start date
Finish Date Finish date
Cost Currency values
Indicator An indicator field that you can use to enter
color-coded values in columns and display them
in reports
Number Numeric with two decimal places
Integer Numeric data, except money
Indicator user-defined fields
Indicators are a special type of user-defined field (UDF) that enable you to select
color-coded icons as values for display in columns and reports.

Structuring Projects
99
Indicator UDFs can be used to highlight Activities, Activity Steps, Activity Resource
Assignments, Projects, Resources, WBS, Expenses, Issues and Work Products & Documents.
For example, you could group activities based on priority or status using Indicator UDFs.
Like all other UDFs, you can perform the following functions using Indicator UDFs:
Display in columns
Group and sort data based on indicators
Filter data based on indicators
Perform global changes
Display timescale bars
View indicator data in reports using columns, group and sort, and filters.
To assign values to indicator fields:
You are required to create a column for the UDF, click in the field, and select an icon
from the list. An indicator UDF can have one of four values: red, yellow, green, or blue.
You must select one of these values whenever you enter a value for an Indicator UDF,
whether in columns, group and sort, filters, reports, global change or bars.
Note:
In columns, filters, global change, and group and sort, indicator UDF values
appear as icons. In reports, indicator UDF columns show the text value of the icon
(i.e., rather than displaying the icon, the value is red, yellow, green, or blue).
Defining Calendars
Calendars
You can create and assign calendars to each resource, each project, and each activity.
For each calendar, you can define the following:
available workhours in each calendar day
default hours per time period settings that are used as conversion factors when
entering or displaying units in time increments other than hours
national holidays
your organization's holidays
project-specific work/ nonworkdays
resource vacation days.
Calendar assignments are used for activity scheduling, tracking, and resource leveling.
Whether an activity uses its assigned calendar or the calendar of an assigned resource
depends on the activity type you specify (task-dependent versus resource-dependent).
P6 Professional User's Guide
100
Three calendar pools are defined: global, resource, and project. The global calendar
pool contains calendars that apply to all projects. The project calendar pool is a
separate pool of calendars for each project. The resource calendar pool can be a
separate pool of calendars for each resource. You can assign either resource or global
calendars to resources, and you can assign either global or project calendars to
activities.
You can link resource and project calendars to global calendars. Then, if you make
changes to a global calendar, your changes apply to all resource and project calendars
that are linked to the modified global calendar.
Shared and Personal Resource Calendars
Resource calendars consist of two types:
Shared Resource Calendar
When connected to a P6 EPPM database: Shared resource calendars can be
assigned to multiple resources, and only users with Add/Edit/Delete Resource
Calendars privilege (as defined using P6) can edit a shared resource calendar.
When connected to a P6 Professional database: Shared resource calendars can be
assigned to multiple resources, and only users with Add/Edit/Delete Resource
Calendars privilege can edit a shared resource calendar.
Personal Resource Calendar
Personal resource calendars are similar to shared resource calendars except a
personal resource calendar is assigned to only one user, and that user can can edit
their standard workweek, their default work hours per time period, and exceptions in
their personal resource calendar without needing any privileges. A user assigned a
personal resource calendar can edit it by choosing Enterprise, Calendars, and then
selecting their calendar.
When connected to a P6 EPPM database: To edit a personal resource calendar, the
user must be defined (using P6), a resource representing the user must be defined
(using P6 or P6 Professional), the user must be associated with the corresponding
resource (using P6), and a personal resource calendar must be created for that user
(using P6 or P6 Professional).
When connected to a P6 Professional database: To edit a personal resource
calendar, the user must be defined, a resource representing the user must be
defined, the user must be associated with the corresponding resource, and a
personal resource calendar must be created for that user.
You can convert shared resource calendars to personal resource calendars only if zero
or one resource is assigned to the shared calendar, and you can convert a personal
resource calendar to a shared resource calendar. Also, to convert calendars between
shared and personal you must have the Add/Edit/Delete Resource Calendars privilege.
When P6 Professional is connected to a P6 EPPM database, this is defined in P6 .
Notes:
Structuring Projects
101
You can create a personal resource calendar using the Calendars dictionary, the
Resource Details, Details tab, or the New Resource Wizard.
To create a personal resource calendar, you must have the Add/Edit/Delete
Resource Calendars privilege.
Defining default hours per time period in calendars
P6 Professional calculates and stores time unit values in hourly increments, but you can
set preferences to display time units in other increments, such as days or weeks. The
values specified for Hours per Time Period are used to convert hours to other time
increments for display, and to convert all non-hourly time increments to hours for storage
in the database.
When P6 Professional is connected to a P6 Professional database:
Administrators can define Hours per Time Period settings globally on the Admin
Preferences, Time Periods tab, or they can specify that the Hours per Time Period settings
should be defined per calendar.
When Hours per Time Period settings are defined per calendar, units and durations are
displayed more accurately. When Hours per Time Period settings are defined globally
and you set your user preferences to display units and durations in time increments other
than hours, units and durations will display unexpected values when the Admin settings
for Hours per Time Period do not match the work hours specified in calendars assigned to
activities and resources. This occurs because the display reflects the conversion factor of
the Admin Preference Hours per Time Period settings, not the hours per day defined by
the activity’s or resource's assigned calendar.
For example,
User Preferences, Time Units = day
Admin Preferences, Hours per Time Period = 8h/d
Activity calendar, Work hours per day = 10h/d
User-entered activity duration = 30h
Actual duration display = 3d6h (30h duration/8h per day, based on the conversion
factor set in Admin Preferences)
Expected duration display = 3d (30h duration/10h per day, based on the conversion
factor set in the activity calendar)
To avoid unexpected display results, an administrator should mark the 'Use assigned
calendar to specify the number of work hours for each time period' checkbox on the
Admin Preferences, Time Periods tab. Then, you can specify the Hours per Time Period
settings for each defined calendar, and assign these calendars to the appropriate
activities and resources.
When P6 Professional is connected to a P6 EPPM database:
P6 Professional User's Guide
102
Administrators can define Hours per Time Period settings globally from the P6, Application
Settings, or they can specify that the Hours per Time Period settings should be defined per
calendar.
When Hours per Time Period settings are defined per calendar, units and durations are
displayed more accurately. When Hours per Time Period settings are defined globally
and you set your user preferences to display units and durations in time increments other
than hours, units and durations will display unexpected values when the P6 Application
Settings settings for Hours per Time Period do not match the work hours specified in
calendars assigned to activities and resources. This occurs because the display reflects
the conversion factor of the Application Settings Hours per Time Period settings, not the
hours per day defined by the activity’s or resource's assigned calendar.
For example,
User Preferences, Time Units = day
P6, Application Settings, Hours per Time Period = 8h/d
Activity calendar, Work hours per day = 10h/d
User-entered activity duration = 30h
Actual duration display = 3d6h (30h duration/8h per day, based on the conversion
factor set in P6, Application Settings)
Expected duration display = 3d (30h duration/10h per day, based on the conversion
factor set in the activity calendar)
To avoid unexpected display results, an administrator should mark the 'Use assigned
calendar to specify the number of work hours for each time period' checkbox from the
Application Settings in P6. Then, you can specify the Hours per Time Period settings for
each defined calendar, and assign these calendars to the appropriate activities and
resources.
Project Calendars
Create a project calendar
1) Choose Enterprise, Calendars, then choose Project.
2) If more than one project is open, select the projects to which you want to add a
calendar, then click Add.
3) Select the calendar you want to copy for the new project calendar, then click the
Select button.
4) Type the new calendar's name.
5) Click Modify and edit the new calendar.
Edit a project calendar
1) Choose Enterprise, Calendars, then choose Project.
2) Select the calendar you want to edit and click Modify.
Structuring Projects
103
3) To base the calendar on another calendar, select a new global calendar in the
Inherit Holidays and Exceptions from Global Calendar field.
4) Choose the month you want to modify by clicking the appropriate arrow button next
to the month-year title.
5) To add a nonworkday, click the date you want to make a nonworkday, then click
Nonwork.
6) To change the number of hours in a specific workday, click the date you want to
change.
Choose Total work hours/day to define the total working hours in each day. In the
Work hours/day section, set the amount of hours available to work for a specific day.
Choose Detailed work hours/day to define which hours of the day are work or
nonwork hours. In the Work hours section, select the hours you want to change and
click Work or Nonwork.
If the date's display color changes to white, the number of hours you entered does
not equal the default number of working hours for that weekday.
7) To make an exception into a workday and apply the default number of working hours
to that day, click the exception you want to change, then click Standard.
8) To define the calendar's default hours per timeperiod, click Time Periods. For each
timeperiod, enter the default number of hours.
For activities to which the calendar is assigned, these values are used as conversion
factors when users enter or display units and durations in time increments other than
hours.
Tips
To apply the same change to all instances of a specific weekday in the displayed
month, click the weekday's column label.
To view a calendar's assignments, in the Calendars Dialog Box, select the
calendar, then click Used By.
When an assignment to an activity has manual future period values, editing the
project calendar for the associated activity may cause the manual values to
change.
The program calculates and stores time unit values in hourly increments, but users
can set preferences to display time units in other increments, such as days or
weeks. When you define the Hours per Time Period for a calendar, these values
are used to accurately convert units and durations to the selected display format
for activities to which the calendar is assigned.
P6 Professional User's Guide
104
When connected to a P6 Professional database: Fields in this dialog box are
disabled if the "Use assigned calendar to specify the number of work hours for
each time period" checkbox on the Admin Preferences, Time Periods tab, is not
marked. If this checkbox is not marked, default hours per time period settings are
defined on the Admin Preferences, Time Periods tab.
When connected to a P6 EPPM database: Fields in this dialog box are disabled if
the "Use assigned calendar to specify the number of work hours for each time
period" checkbox, accessed from the P6 Application Settings, is not marked. If this
checkbox is not marked, default hours per time period settings are defined from
the P6 Application Settings.
Note
Working hours defined with decimal values other than .0 or .5 will round up or
down to .0 or .5.
Delete a project calendar
1) Choose Enterprise, Calendars.
2) Choose Project.
3) Select the calendar you want to delete, then click Delete.
4) If the calendar has assignments, the Calendars in Use dialog box is displayed.
To delete the calendar and move its assignments to a calendar you select, choose
Select Replacement Calendar, click OK, then select a replacement calendar.
To delete the calendar and move its assignments to the default global calendar,
choose Link to Default Global Calendar, then click OK.
View project calendar assignments
1) Choose Enterprise, Calendars.
2) Choose Project.
3) Select the calendar whose assignments you want to view, then click Used By.
Global Calendars
Create a global calendar
1) Choose Enterprise, Calendars.
2) Choose Global, then click Add.
3) Select the calendar you want to copy for the new global calendar, then click the
Select button.
4) Type the new calendar's name.

Structuring Projects
105
5) Mark the Default checkbox to make the new calendar the default global calendar
for activities and resources.
6) Click Modify and edit the new calendar.
Edit a global calendar
1) Choose Enterprise, Calendars, then choose Global.
2) Select the calendar you want to edit and click Modify.
3) Choose the month you want to modify by clicking the appropriate arrow button next
to the month-year title.
4) To add a nonworkday, click the date you want to make a nonworkday, then click
Nonwork.
5) To change the number of hours in a specific workday, click the date you want to
change.
Choose Total work hours/day to define the total working hours in each day. In the
Work hours/day section, set the amount of hours available to work for a specific day.
Choose Detailed work hours/day to define which hours of the day are work or
nonwork hours. In the Work hours section, select the hours you want to change and
click Work or Nonwork.
If the date's display color changes to white, the number of hours you entered does
not equal the default number of working hours for that weekday.
6) To make an exception into a workday and apply the default number of working hours
to that day, click the exception you want to change, then click Standard.
7) To define the calendar's default hours per timeperiod, click Time Periods. For each
timeperiod, enter the default number of hours.
For activities and resources to which the calendar is assigned, these values are used
as conversion factors when users enter or display units and durations in time
increments other than hours.
Tips
To apply the same change to all instances of a specific weekday in the displayed
month, click the weekday's column label.
To view a calendar's assignments, in the Calendars Dialog Box, select the
calendar, then click Used By.
When an activity's resource assignment has manual future period values, editing
the global calendar for the associated activity or resource may cause the manual
values to change.
P6 Professional User's Guide
106
The program calculates and stores time unit values in hourly increments, but users
can set preferences to display time units in other increments, such as days or
weeks. When you define the Hours per Time Period for a calendar, these values
are used to accurately convert units and durations to the selected display format
for activities and resources to which the calendar is assigned.
When connected to a P6 Professional database: Fields in this dialog box are
disabled if the "Use assigned calendar to specify the number of work hours for
each time period" checkbox on the Admin Preferences, Time Periods tab, is not
marked. If this checkbox is not marked, default hours per time period settings are
defined on the Admin Preferences, Time Periods tab.
When connected to a P6 EPPM database: Fields in this dialog box are disabled if
the "Use assigned calendar to specify the number of work hours for each time
period" checkbox, accessed from the P6 Application Settings, is not marked. If this
checkbox is not marked, default hours per time period settings are defined from
the P6 Application Settings.
Note
Working hours defined with decimal values other than .0 or .5 will round up or
down to .0 or .5.
Delete a global calendar
1) Choose Enterprise, Calendars.
2) Choose Global.
3) Select the calendar you want to delete, then click Delete.
4) If the calendar has assignments, the Calendars in Use dialog box is displayed.
To delete the calendar and move its assignments to a calendar you select, choose
Select Replacement Calendar, click OK, then select a replacement calendar.
To delete the calendar and move its assignments to the default global calendar,
choose Link to Default Global Calendar, then click OK.
Specify a default global calendar
1) Choose Enterprise, Calendars.
2) Choose Global.
3) Mark the Default checkbox next to the calendar you want to designate as the
default global calendar.
View global calendar assignments
1) Choose Enterprise, Calendars.
2) Choose Global.
3) Select the calendar whose assignments you want to view, then click Used By.
Structuring Projects
107
Resource Calendars
Create a shared resource calendar
Use this task to create a shared resource calendar.
1) Choose Enterprise, Calendars.
2) Choose Resource, then click Add.
3) Select the calendar you want to copy for the new resource calendar, then click the
Select icon.
4) Type the new calendar's name.
5) Click Modify and edit the new calendar.
Create a personal resource calendar
Use this task to create and assign a personal resource calendar.
Notes:
When P6 Professional is connected to a P6 EPPM database:
You must have the Add/Edit/Delete Resource Calendars
privilege, as defined in P6, to create personal resource
calendars.
Before you create a personal resource calendar for a user, the
user must be defined (using P6), a resource representing the
user must be defined (using P6 or P6 Professional), and the user
must be associated with the corresponding resource (using P6).
When P6 Professional is connected to a P6 Professional database:
You must have the Add/Edit/Delete Resource Calendars
privilege to create personal resource calendars.
Before you create a personal resource calendar for a user, the
user must be defined, a resource representing the user must be
defined, and the user must be associated with the
corresponding resource.
1) Choose Enterprise, Calendars.
2) Choose Resource.
3) Select any row in the Personal Resource Calendars group, or click the Display Options
bar, then click Filter By, Personal Resource Calendars and select any row.
4) Click Add.
5) In the Select Resources dialog box, select the resource for which you want to create
a personal resource calendar.

P6 Professional User's Guide
108
Note: The list of resources does not include resources already
assigned to a personal resource calendar unless you filter the list of
resources by All Resources.
6) Click the Select icon.
7) In the Calendars dialog box, click Modify and edit the new calendar.
Edit a resource calendar
This topic is intended for the administrator who defines resource calendars.
1) Choose Enterprise, Calendars, then choose Resource.
2) Select the calendar you want to edit and click Modify.
3) To base the calendar on another calendar, select a new global calendar in the
Inherit Holidays and Exceptions from Global Calendar field.
4) Choose the month you want to modify by clicking the appropriate arrow button next
to the month-year title.
5) To add a nonworkday, click the date you want to make a nonworkday, then click
Nonwork.
6) To change the number of hours in a specific workday, click the date you want to
change.
Choose Total work hours/day to define the total working hours in each day. In the
Work hours/day section, set the amount of hours available to work for a specific day.
Choose Detailed work hours/day to define which hours of the day are work or
nonwork hours. In the Work hours section, select the hours you want to change and
click Work or Nonwork.
If the date's display color changes to white, the number of hours you entered does
not equal the default number of working hours for that weekday.
7) To make an exception into a workday and apply the default number of working hours
to that day, click the exception you want to change, then click Standard.
8) To define the calendar's default hours per timeperiod, click Time Periods.or each
timeperiod, enter the default number of hours.
For activities and resources to which the calendar is assigned, these values are used
as conversion factors when users enter or display units and durations in time
increments other than hours.
Tips
To apply the same change to all insta
nces of a specific weekday in the displayed month, click the weekday's column
label.
Structuring Projects
109
To view a calendar's assignments, in the Calendars dialog box, select the
calendar, then click Used By.
When a resource assignment has manual future period values, editing the
resource's associated resource calendar may cause the manual values to
change.
When connected to a P6 EPPM database: P6 and P6 Professional calculates and
stores time unit values in hourly increments, but users can set preferences to
display time units in other increments, such as days or weeks.
When connected to a P6 Professional database: P6 Professional calculates and
stores time unit values in hourly increments, but users can set preferences to
display time units in other increments, such as days or weeks.
When you define the Hours per Time Period for a calendar, these values are used
to accurately convert units and durations to the selected display format for
activities to which the calendar is assigned.
When connected to a P6 EPPM database: The Time Periods button is always
enabled, but if the Application Settings in P6 is not marked, the fields in the Hours
per Time Period dialog are disabled.
When connected to a P6 Professional database: The Time Periods button is
enabled when the 'Use assigned calendar to specify the number of work hours for
each time period' checkbox on the Admin Preferences, Time Periods tab is
marked.
Note
Working hours defined with decimal values other than .0 or .5 will round up or
down to .0 or .5.
Edit your personal resource calendar
Use this task to edit your standard workweek and exception time in your personal
resource calendar.
This task is intended for users who have been assigned a personal resource calendar; it
assumes you do not have the Add/Edit/Delete Resource Calendars privilege.
1) Choose Enterprise, Calendars, then choose Resource.
2) Select your personal resource calendar and click Modify.
3) Choose the month you want to modify by clicking the appropriate arrow button next
to the month-year title.
4) To add a nonworkday, click the date you want to make a nonworkday, then click
Nonwork.
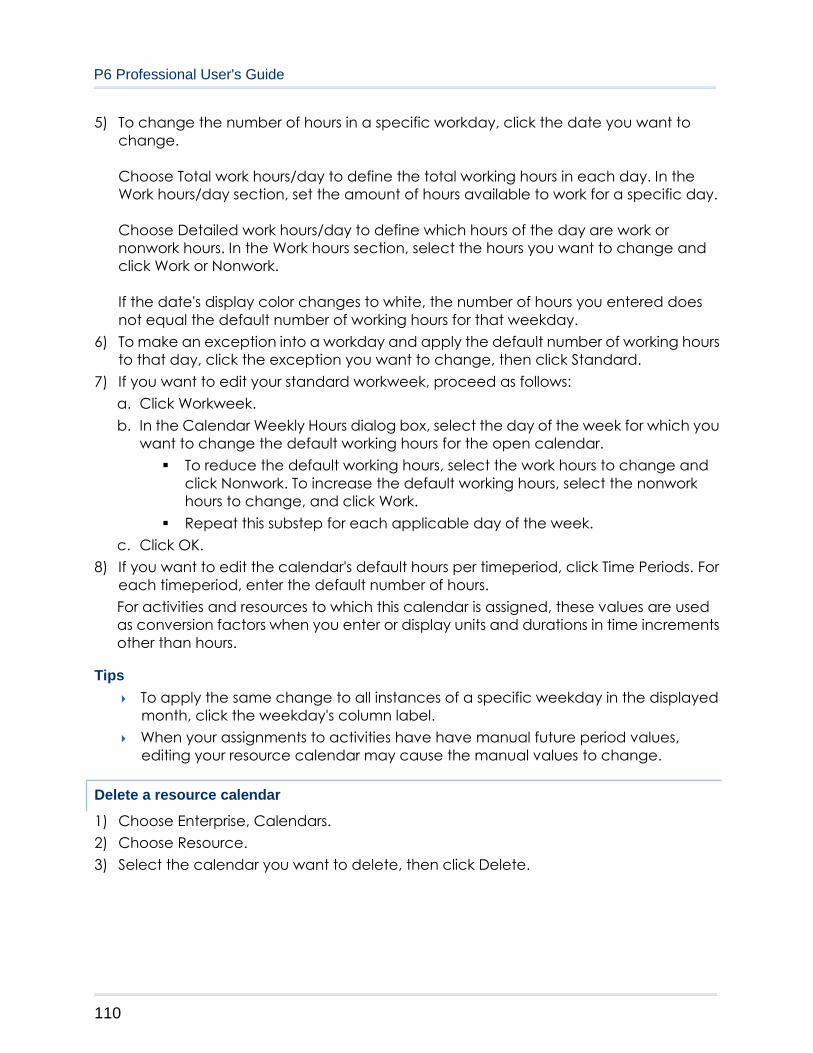
P6 Professional User's Guide
110
5) To change the number of hours in a specific workday, click the date you want to
change.
Choose Total work hours/day to define the total working hours in each day. In the
Work hours/day section, set the amount of hours available to work for a specific day.
Choose Detailed work hours/day to define which hours of the day are work or
nonwork hours. In the Work hours section, select the hours you want to change and
click Work or Nonwork.
If the date's display color changes to white, the number of hours you entered does
not equal the default number of working hours for that weekday.
6) To make an exception into a workday and apply the default number of working hours
to that day, click the exception you want to change, then click Standard.
7) If you want to edit your standard workweek, proceed as follows:
a. Click Workweek.
b. In the Calendar Weekly Hours dialog box, select the day of the week for which you
want to change the default working hours for the open calendar.
To reduce the default working hours, select the work hours to change and
click Nonwork. To increase the default working hours, select the nonwork
hours to change, and click Work.
Repeat this substep for each applicable day of the week.
c. Click OK.
8) If you want to edit the calendar's default hours per timeperiod, click Time Periods. For
each timeperiod, enter the default number of hours.
For activities and resources to which this calendar is assigned, these values are used
as conversion factors when you enter or display units and durations in time increments
other than hours.
Tips
To apply the same change to all instances of a specific weekday in the displayed
month, click the weekday's column label.
When your assignments to activities have have manual future period values,
editing your resource calendar may cause the manual values to change.
Delete a resource calendar
1) Choose Enterprise, Calendars.
2) Choose Resource.
3) Select the calendar you want to delete, then click Delete.

Structuring Projects
111
4) If the calendar has resource assignments, the Calendars in Use dialog box appears.
To delete the calendar and move its assignments to a calendar you select, choose
Select Replacement Calendar, click OK, then select a replacement calendar.
To delete the calendar and move its assignments to the default global calendar,
choose Link to Default Global Calendar, then click OK.
View resource calendar assignments
1) Choose Enterprise, Calendars.
2) Choose Resource.
3) Select the calendar whose assignments you want to view, then click Used By.

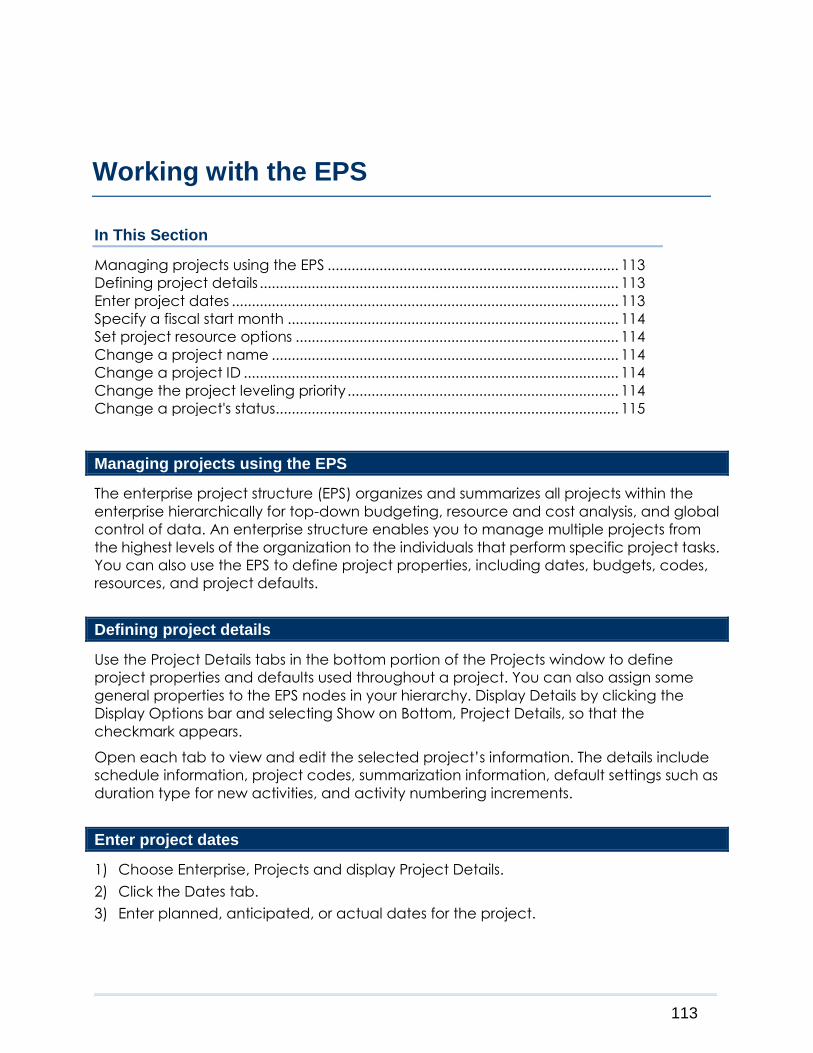
113
In This Section
Managing projects using the EPS ......................................................................... 113
Defining project details .......................................................................................... 113
Enter project dates ................................................................................................. 113
Specify a fiscal start month ................................................................................... 114
Set project resource options ................................................................................. 114
Change a project name ....................................................................................... 114
Change a project ID .............................................................................................. 114
Change the project leveling priority .................................................................... 114
Change a project's status ...................................................................................... 115
Managing projects using the EPS
The enterprise project structure (EPS) organizes and summarizes all projects within the
enterprise hierarchically for top-down budgeting, resource and cost analysis, and global
control of data. An enterprise structure enables you to manage multiple projects from
the highest levels of the organization to the individuals that perform specific project tasks.
You can also use the EPS to define project properties, including dates, budgets, codes,
resources, and project defaults.
Defining project details
Use the Project Details tabs in the bottom portion of the Projects window to define
project properties and defaults used throughout a project. You can also assign some
general properties to the EPS nodes in your hierarchy. Display Details by clicking the
Display Options bar and selecting Show on Bottom, Project Details, so that the
checkmark appears.
Open each tab to view and edit the selected project’s information. The details include
schedule information, project codes, summarization information, default settings such as
duration type for new activities, and activity numbering increments.
Enter project dates
1) Choose Enterprise, Projects and display Project Details.
2) Click the Dates tab.
3) Enter planned, anticipated, or actual dates for the project.
Working with the EPS

P6 Professional User's Guide
114
Specify a fiscal start month
1) Choose Enterprise, Projects and display Project Details.
2) Click the Settings tab.
3) Select the month on which the first day of the fiscal year begins.
Set project resource options
Choose Enterprise, Projects and display Project Details, then click the Resources tab.
Change a project name
1) Choose Enterprise, Projects and display Project Details.
2) Select the project whose name you want to change.
3) Click the General tab, then type a new project name.
Change a project ID
1) Choose Enterprise, Projects and display Project Details.
2) Select the project whose ID you want to change.
3) Click the General tab, then type a new project ID.
Change the project leveling priority
1) Choose Enterprise, Projects and display Project Details.
2) Click the General tab, then select a leveling priority from 1 (highest priority) to 100
(lowest priority).
During leveling, this number determines which assignments from other projects to
consider within the leveling run. For example, if you specify 5 in the Consider
Assignments in Other Projects With Priority Equal/Higher Than field of the Level
Resources dialog box, all projects with a project leveling priority of 1, 2, 3, 4, and 5 are
considered.
Note
If you are selecting a priority level for an EPS node or project, your selection may
affect the order in which the project's activities are leveled. If you level a project
according to project priority, all activities in the higher priority project are leveled,
and then activities in the lower priority project are leveled.
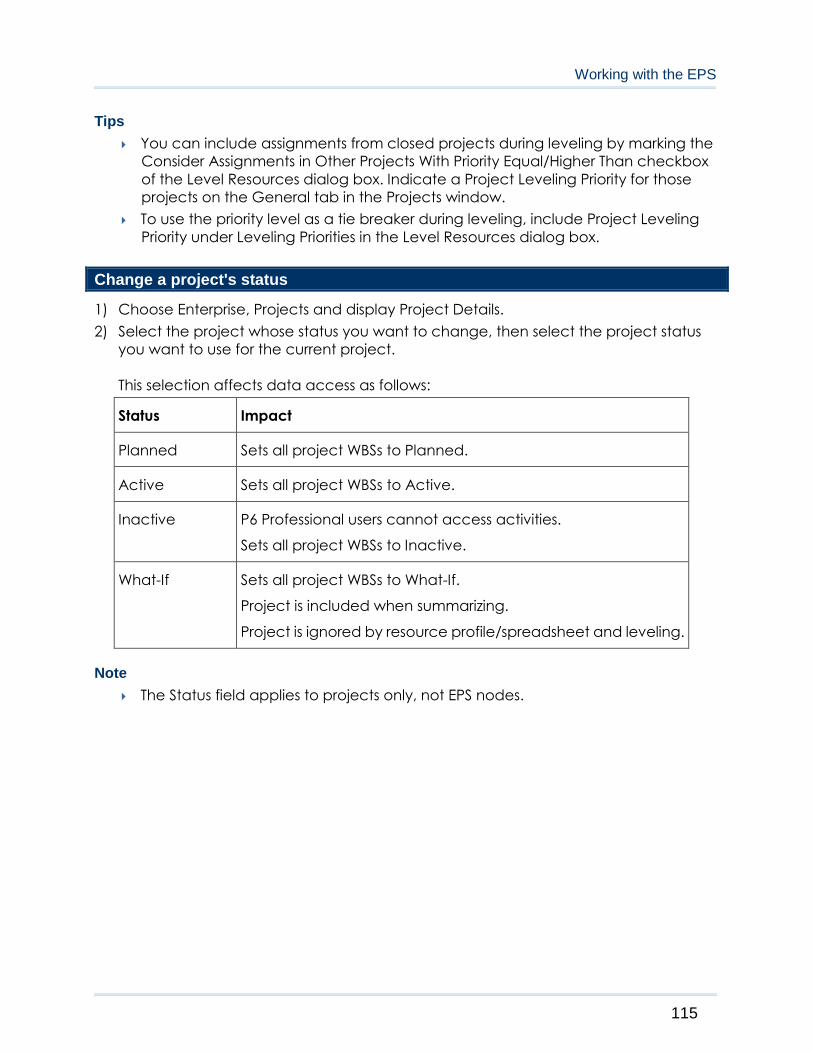
Working with the EPS
115
Tips
You can include assignments from closed projects during leveling by marking the
Consider Assignments in Other Projects With Priority Equal/Higher Than checkbox
of the Level Resources dialog box. Indicate a Project Leveling Priority for those
projects on the General tab in the Projects window.
To use the priority level as a tie breaker during leveling, include Project Leveling
Priority under Leveling Priorities in the Level Resources dialog box.
Change a project's status
1) Choose Enterprise, Projects and display Project Details.
2) Select the project whose status you want to change, then select the project status
you want to use for the current project.
This selection affects data access as follows:
Status Impact
Planned Sets all project WBSs to Planned.
Active Sets all project WBSs to Active.
Inactive P6 Professional users cannot access activities.
Sets all project WBSs to Inactive.
What-If Sets all project WBSs to What-If.
Project is included when summarizing.
Project is ignored by resource profile/spreadsheet and leveling.
Note
The Status field applies to projects only, not EPS nodes.


117
In This Section
Adding Activities to a Project ............................................................................... 117
Linking Activities with Relationships ...................................................................... 135
Assigning Resources and Roles to Activities ........................................................ 141
Assigning Resource Curves .................................................................................... 145
Budgeting................................................................................................................. 146
Manually Planning Future Period Assignments ................................................... 150
Adding Expenses and Entering Cost Information for Activities ........................ 156
Performing Top-down Estimation (P6 Professional Only) ................................... 161
Adding Activity Steps ............................................................................................. 164
Assigning Notebooks to Activities ......................................................................... 169
Global Change ....................................................................................................... 169
Adding Activities to a Project
Activities
Activities are the fundamental work elements of a project. They are the lowest level of a
work breakdown structure (WBS) and, as such, are the smallest subdivision of a project
that directly concerns the project manager. Although you can divide activities into steps,
an activity's primary resource is typically responsible for managing and tracking the
progress of an activity's steps, while the project manager is typically responsible for
managing and tracking the progress of the overall activity.
You can define the following information for an activity:
Activity ID and name, which enables you to uniquely identify and describe the
activity
Activity start and finish dates
Activity calendar
Activity type, duration type, and percent complete type, which are used to
specify which calendar applies to an activity; whether an activity is a milestone;
how to keep an activity's unit values, duration values, and resource units/time
values synchronized; and how to calculate an activity's percent complete
Activity codes and values, which enable you to classify and categorize activities
Constraints on the activity's scheduled start and finish dates
Expenses
Developing Projects
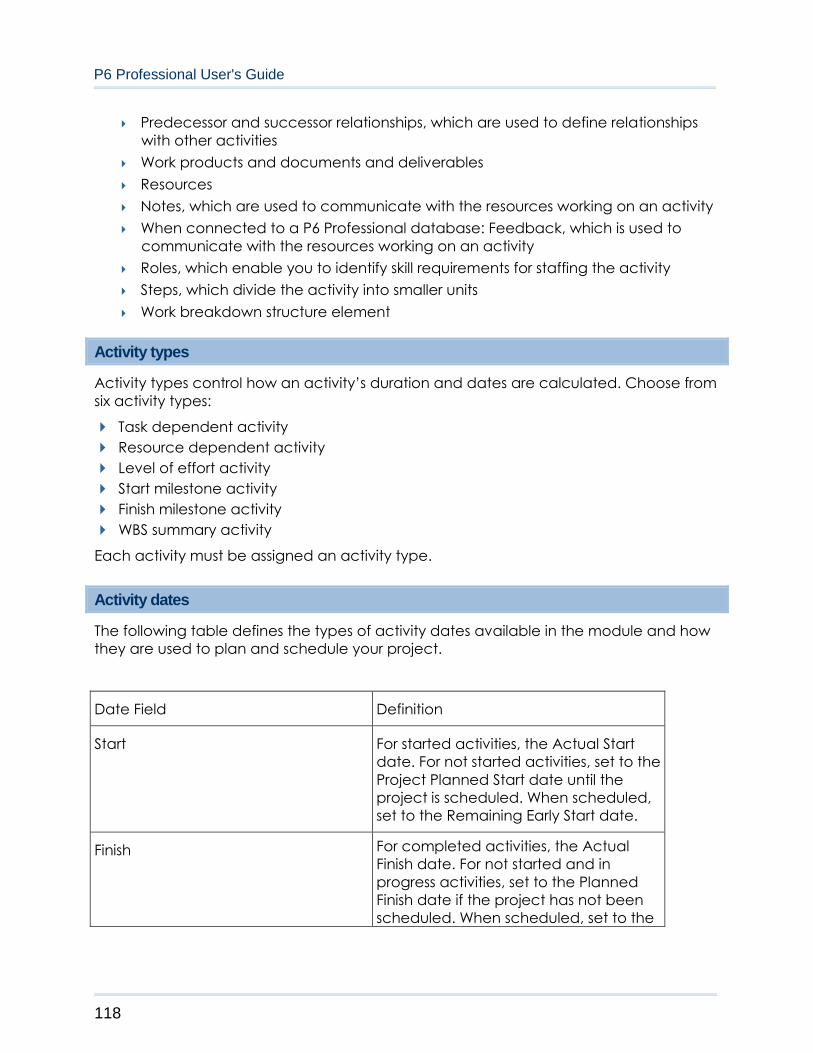
P6 Professional User's Guide
118
Predecessor and successor relationships, which are used to define relationships
with other activities
Work products and documents and deliverables
Resources
Notes, which are used to communicate with the resources working on an activity
When connected to a P6 Professional database: Feedback, which is used to
communicate with the resources working on an activity
Roles, which enable you to identify skill requirements for staffing the activity
Steps, which divide the activity into smaller units
Work breakdown structure element
Activity types
Activity types control how an activity’s duration and dates are calculated. Choose from
six activity types:
Task dependent activity
Resource dependent activity
Level of effort activity
Start milestone activity
Finish milestone activity
WBS summary activity
Each activity must be assigned an activity type.
Activity dates
The following table defines the types of activity dates available in the module and how
they are used to plan and schedule your project.
Date Field Definition
Start For started activities, the Actual Start
date. For not started activities, set to the
Project Planned Start date until the
project is scheduled. When scheduled,
set to the Remaining Early Start date.
Finish For completed activities, the Actual
Finish date. For not started and in
progress activities, set to the Planned
Finish date if the project has not been
scheduled. When scheduled, set to the
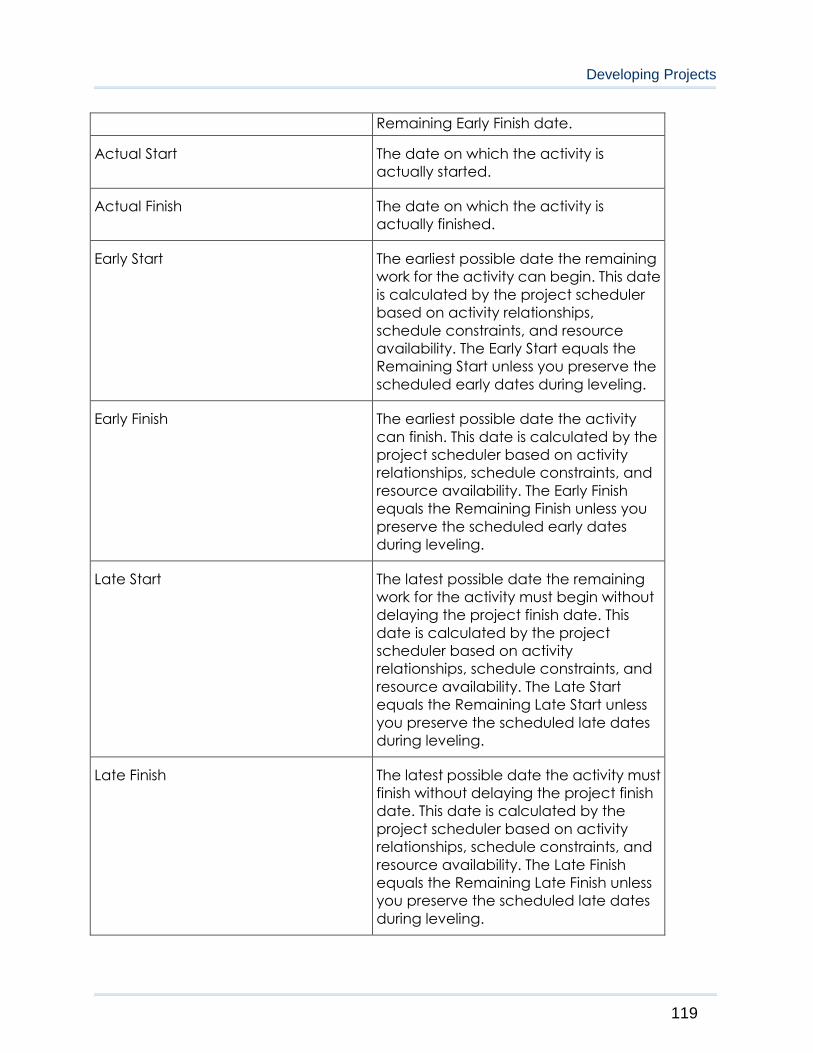
Developing Projects
119
Remaining Early Finish date.
Actual Start The date on which the activity is
actually started.
Actual Finish The date on which the activity is
actually finished.
Early Start The earliest possible date the remaining
work for the activity can begin. This date
is calculated by the project scheduler
based on activity relationships,
schedule constraints, and resource
availability. The Early Start equals the
Remaining Start unless you preserve the
scheduled early dates during leveling.
Early Finish The earliest possible date the activity
can finish. This date is calculated by the
project scheduler based on activity
relationships, schedule constraints, and
resource availability. The Early Finish
equals the Remaining Finish unless you
preserve the scheduled early dates
during leveling.
Late Start The latest possible date the remaining
work for the activity must begin without
delaying the project finish date. This
date is calculated by the project
scheduler based on activity
relationships, schedule constraints, and
resource availability. The Late Start
equals the Remaining Late Start unless
you preserve the scheduled late dates
during leveling.
Late Finish The latest possible date the activity must
finish without delaying the project finish
date. This date is calculated by the
project scheduler based on activity
relationships, schedule constraints, and
resource availability. The Late Finish
equals the Remaining Late Finish unless
you preserve the scheduled late dates
during leveling.
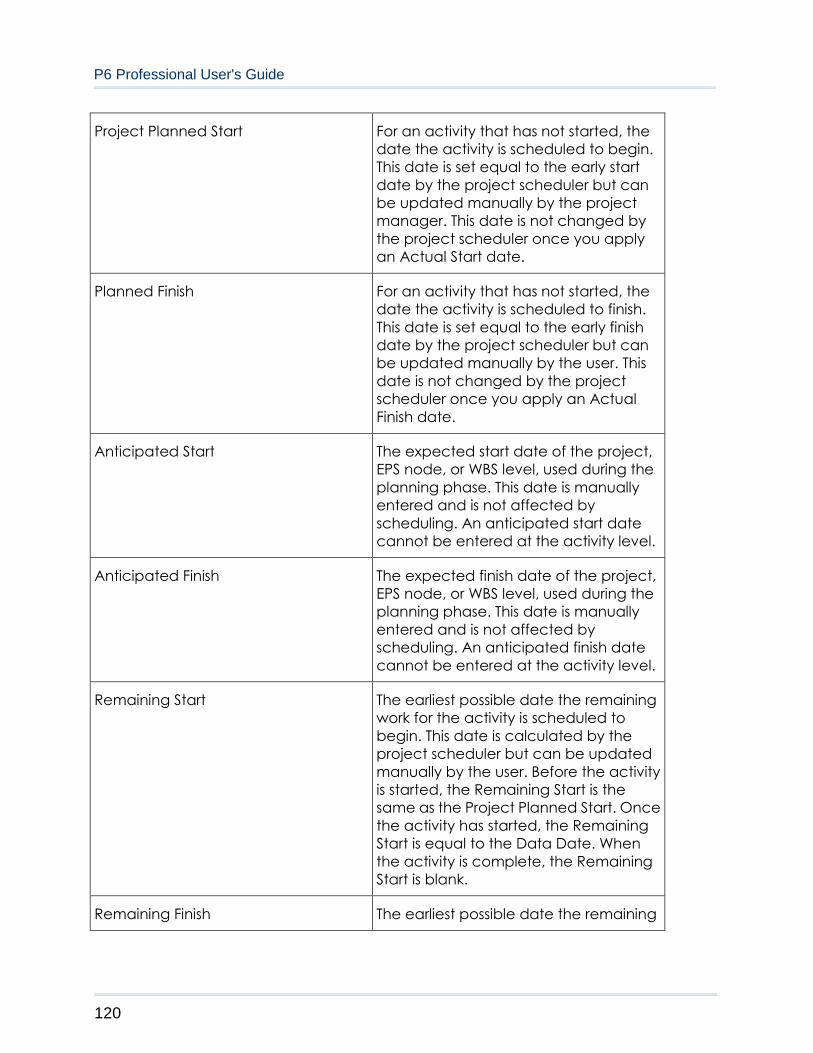
P6 Professional User's Guide
120
Project Planned Start For an activity that has not started, the
date the activity is scheduled to begin.
This date is set equal to the early start
date by the project scheduler but can
be updated manually by the project
manager. This date is not changed by
the project scheduler once you apply
an Actual Start date.
Planned Finish For an activity that has not started, the
date the activity is scheduled to finish.
This date is set equal to the early finish
date by the project scheduler but can
be updated manually by the user. This
date is not changed by the project
scheduler once you apply an Actual
Finish date.
Anticipated Start The expected start date of the project,
EPS node, or WBS level, used during the
planning phase. This date is manually
entered and is not affected by
scheduling. An anticipated start date
cannot be entered at the activity level.
Anticipated Finish The expected finish date of the project,
EPS node, or WBS level, used during the
planning phase. This date is manually
entered and is not affected by
scheduling. An anticipated finish date
cannot be entered at the activity level.
Remaining Start The earliest possible date the remaining
work for the activity is scheduled to
begin. This date is calculated by the
project scheduler but can be updated
manually by the user. Before the activity
is started, the Remaining Start is the
same as the Project Planned Start. Once
the activity has started, the Remaining
Start is equal to the Data Date. When
the activity is complete, the Remaining
Start is blank.
Remaining Finish The earliest possible date the remaining
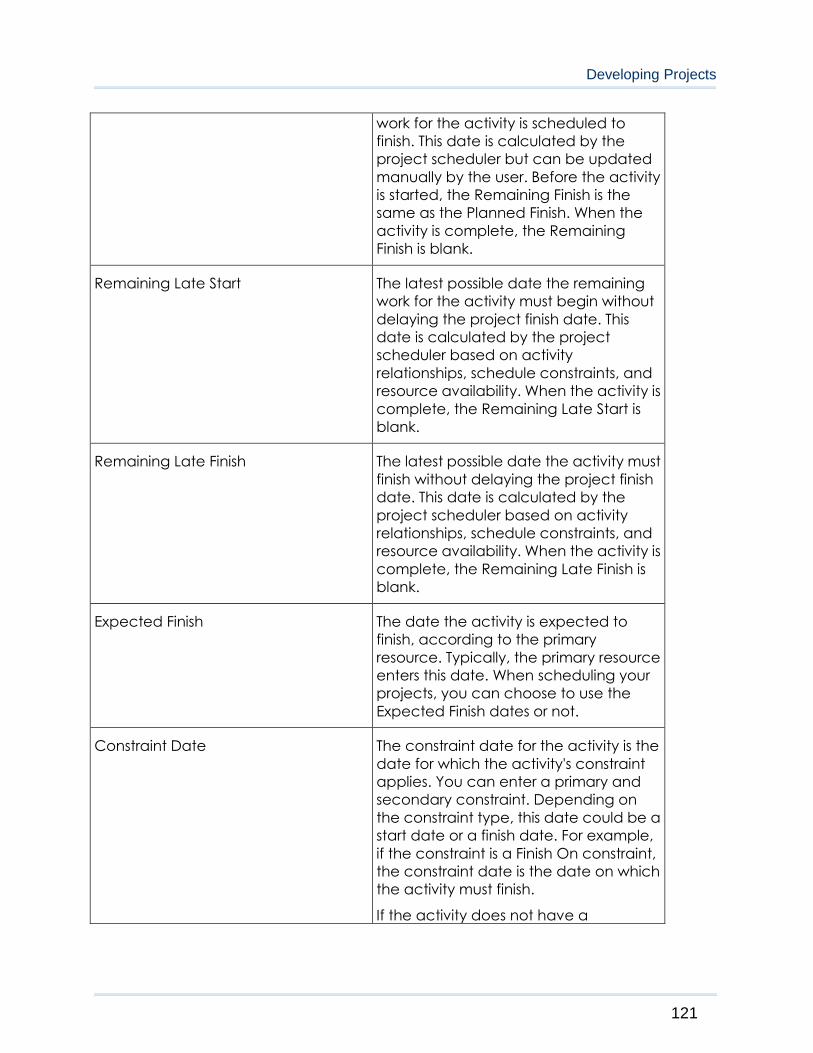
Developing Projects
121
work for the activity is scheduled to
finish. This date is calculated by the
project scheduler but can be updated
manually by the user. Before the activity
is started, the Remaining Finish is the
same as the Planned Finish. When the
activity is complete, the Remaining
Finish is blank.
Remaining Late Start The latest possible date the remaining
work for the activity must begin without
delaying the project finish date. This
date is calculated by the project
scheduler based on activity
relationships, schedule constraints, and
resource availability. When the activity is
complete, the Remaining Late Start is
blank.
Remaining Late Finish The latest possible date the activity must
finish without delaying the project finish
date. This date is calculated by the
project scheduler based on activity
relationships, schedule constraints, and
resource availability. When the activity is
complete, the Remaining Late Finish is
blank.
Expected Finish The date the activity is expected to
finish, according to the primary
resource. Typically, the primary resource
enters this date. When scheduling your
projects, you can choose to use the
Expected Finish dates or not.
Constraint Date The constraint date for the activity is the
date for which the activity's constraint
applies. You can enter a primary and
secondary constraint. Depending on
the constraint type, this date could be a
start date or a finish date. For example,
if the constraint is a Finish On constraint,
the constraint date is the date on which
the activity must finish.
If the activity does not have a
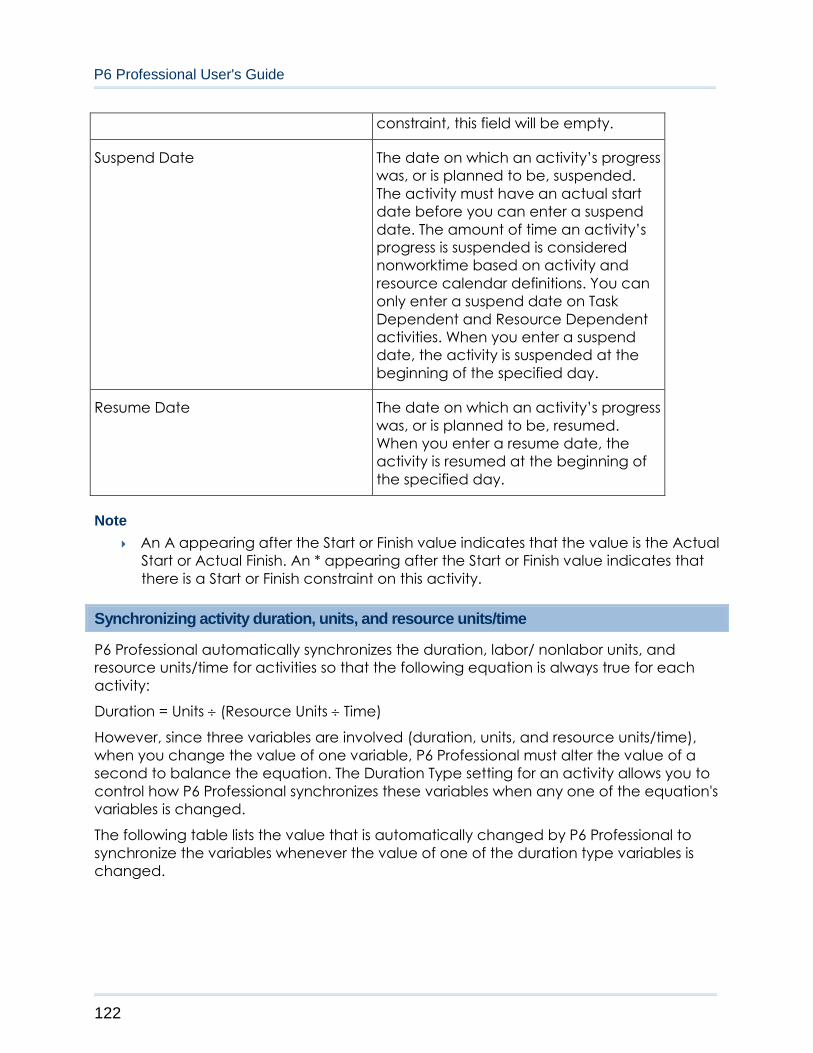
P6 Professional User's Guide
122
constraint, this field will be empty.
Suspend Date The date on which an activity’s progress
was, or is planned to be, suspended.
The activity must have an actual start
date before you can enter a suspend
date. The amount of time an activity’s
progress is suspended is considered
nonworktime based on activity and
resource calendar definitions. You can
only enter a suspend date on Task
Dependent and Resource Dependent
activities. When you enter a suspend
date, the activity is suspended at the
beginning of the specified day.
Resume Date The date on which an activity’s progress
was, or is planned to be, resumed.
When you enter a resume date, the
activity is resumed at the beginning of
the specified day.
Note
An A appearing after the Start or Finish value indicates that the value is the Actual
Start or Actual Finish. An * appearing after the Start or Finish value indicates that
there is a Start or Finish constraint on this activity.
Synchronizing activity duration, units, and resource units/time
P6 Professional automatically synchronizes the duration, labor/ nonlabor units, and
resource units/time for activities so that the following equation is always true for each
activity:
Duration = Units (Resource Units Time)
However, since three variables are involved (duration, units, and resource units/time),
when you change the value of one variable, P6 Professional must alter the value of a
second to balance the equation. The Duration Type setting for an activity allows you to
control how P6 Professional synchronizes these variables when any one of the equation's
variables is changed.
The following table lists the value that is automatically changed by P6 Professional to
synchronize the variables whenever the value of one of the duration type variables is
changed.
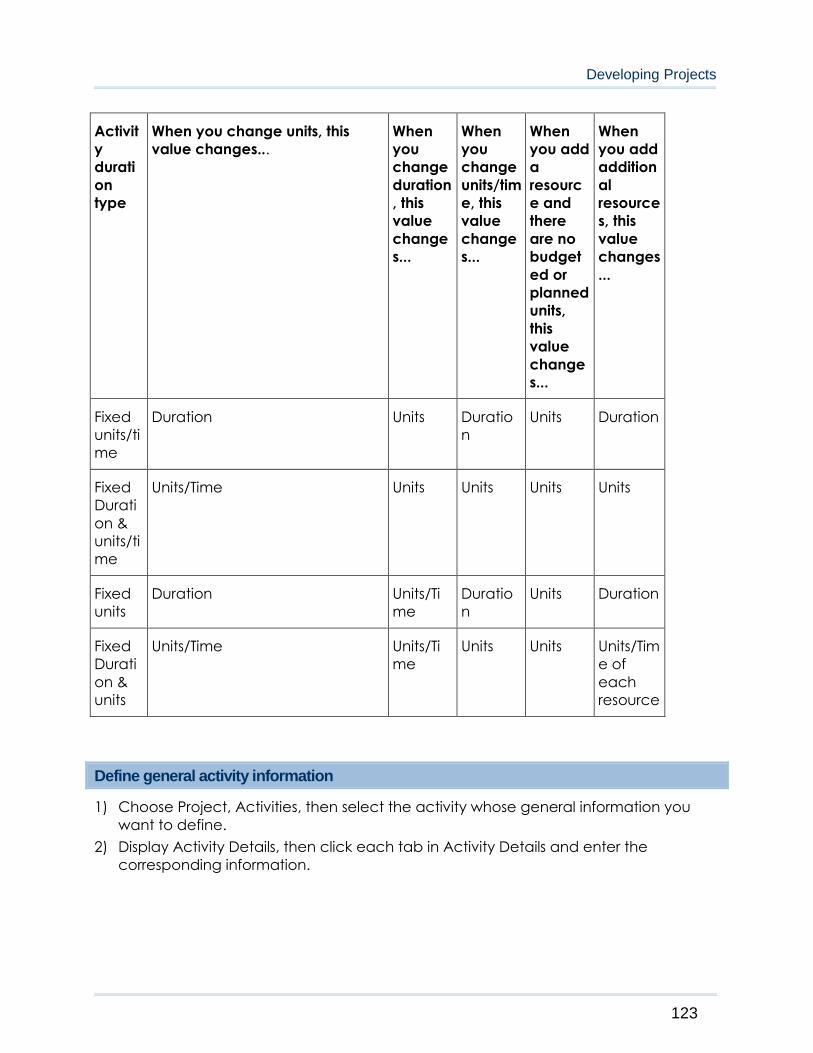
Developing Projects
123
Activit
y
durati
on
type
When you change units, this
value changes...
When
you
change
duration
, this
value
change
s...
When
you
change
units/tim
e, this
value
change
s...
When
you add
a
resourc
e and
there
are no
budget
ed or
planned
units,
this
value
change
s...
When
you add
addition
al
resource
s, this
value
changes
...
Fixed
units/ti
me
Duration Units Duratio
n
Units Duration
Fixed
Durati
on &
units/ti
me
Units/Time Units Units Units Units
Fixed
units
Duration Units/Ti
me
Duratio
n
Units Duration
Fixed
Durati
on &
units
Units/Time Units/Ti
me
Units Units Units/Tim
e of
each
resource
Define general activity information
1) Choose Project, Activities, then select the activity whose general information you
want to define.
2) Display Activity Details, then click each tab in Activity Details and enter the
corresponding information.
P6 Professional User's Guide
124
Tip
To specify which Activity Details you want to display and their order, click the
Layout Options bar, then choose Bottom Layout Options.
Add activities in the Activity Table
Select an activity within the group to which you want to add a new activity. Click
on the Edit toolbar or choose Edit. The new activity is placed according to the sorting
options selected for the layout.
Depending on your user preferences, the New Activity wizard might start and help
you add an activity.
Add activities in the Activity Network
In the Activity Network, select the group band or another activity box within the
group band into which you want to add the new activity, then click on the Edit
toolbar or choose Edit, Add.
Depending on your user preferences, the New Activity wizard might start and help
you add an activity.
Note
If activities are not grouped in the Activity Network, the activity is added to the
bottom of the Activity Network.
Define activity types
1) Choose Project, Activities.
2) Select the activity whose activity type you want to define.
3) Display Activity Details, then click the General tab.
Developing Projects
125
4) Select an activity type:
To indicate that the activity's resources are scheduled according to the activity
calendar, select Task Dependent.
To indicate that each of the activity's resources are scheduled according to his/her
own calendar, select Resource Dependent.
To indicate that the activity's duration is dependent on its predecessor and/or
successor activities, select Level of Effort.
To indicate that the activity marks the beginning of a major stage in the project,
select Start Milestone.
To indicate that the activity marks the end of a major stage in the project, select Finish
Milestone.
To indicate that the activity's duration is dependent on the activities assigned to the
same WBS level, select WBS Summary.
Notes
You cannot apply constraints to Level of Effort and WBS Summary activities.
Start and Finish Milestones do not have time-based costs, resource assignments, or
durations.
You cannot assign resources that drive activity dates to WBS summary activities.
Define activity duration types
1) Choose Project, Activities.
2) Select the activity whose duration type you want to define.
3) Display Activity Details, then click the General tab.

P6 Professional User's Guide
126
4) Select the duration type:
Choose Fixed Units/Time if you want the resource units per time to remain constant
when the activity duration or units change. This type is used when an activity has fixed
resources with fixed productivity output per time period. You most often choose this
duration type when you are using resource dependent activities.
Choose Fixed Duration & Units/Time if you want the activity duration to remain
constant and the remaining units to change. This type is used when the activity is to
be completed within a fixed time period regardless of the resources assigned. You
most often choose this duration type when you are using task dependent activities.
Choose Fixed Units if you want the activity units to remain constant when the duration
or resource units per time change. This type is used when the total amount of work is
fixed, and increasing the resources can decrease the activity duration. You most
often choose this duration type when you are using resource dependent activities.
Choose Fixed Duration & Units if you want the activity duration to remain constant
and the units/time to change. This type is used when the activity is to be completed
within a fixed time period and the total amount of work is fixed. You most often
choose this duration type when you are using task dependent activities.
Note
The Duration Type field is disabled if the Activity Type is Start Milestone or Finish
Milestone.
Define activity percent complete types
You can calculate percent complete according to activity duration, activity units, or
according to a physical percent complete that you enter manually for each activity.
1) Choose Project, Activities.
2) Select the activity whose percent complete type you want to define.
3) Display Activity Details, then click the General tab.

Developing Projects
127
4) Select the percent complete type:
To indicate that the activity's percent complete will be entered by the user for this
activity, select Physical. In this case, Activity % Complete = Physical % Complete.
To specify that the activity's percent complete be calculated from the original or
planned and remaining durations, select Duration. In this case, Activity % Complete =
Duration % Complete = (Original or Planned Duration – Remaining Duration) ¸ Original
or Planned Duration.
To specify that the activity's percent complete be calculated from the actual and
remaining units, select Units. In this case, Activity % Complete = Units % Complete =
(Actual Labor Units + Actual Nonlabor Units) ¸ (Actual Labor Units + Actual Nonlabor
Units +Remaining Labor Units + Remaining Nonlabor Units).
Assign a calendar to an activity
1) Choose Project, Activities.
2) Select the activity whose calendar you want to define.
3) Display Activity Details, then click the General tab.
4) In the Activity Calendar field, click .
5) Choose the calendar that you want to assign to the selected activity, then click the
Select button.
Tip
To choose whether to display global or project calendars in the Select Activity
Calendar dialog box, click the Display Options bar.
Enter activity durations
1) Choose Project, Activities.
2) Select the activity whose duration you want to enter.
P6 Professional User's Guide
128
3) Display Activity Details, then click the Status tab.
To enter original or planned duration for the activity, in the original or planned field,
type the amount of time followed by the time period.
To enter the actual duration for the activity, in the Actual field, type the amount of
time followed by the time period. You can only enter actual duration for activities
that are completed.
To enter the remaining duration for the activity, in the Remaining field, type the
amount of time followed by the time period. You can only enter remaining duration
for activities that are in progress.
To enter at completion duration for the activity, in the At Complete field, type the
amount of time followed by the time period. You can only enter at completion
duration for activities that are not started or in progress.
Note
A time period does not display if the Show Duration Label checkbox is not marked
in the User Preferences, Time Units tab.
The following limitation applies to dates: Do not enter a date equal to or later
than December 31, 2049 or a duration that causes the date to be equal to or later
than December 31, 2049.
Tips
P6 Professional automatically recalculates the time value and period you enter
according to the project's calendar and the standard time period defined by your
system administrator.
To view the available time period abbreviations, choose Admin, Admin
Preferences, then click the Time Periods tab when P6 Professional is connected to
a P6 Professional database and choose the Application Settings in P6 when
connected to a P6 EPPM database.
Enter activity start and finish dates
1) Choose Project, Activities.
2) Select the activity whose start and finish dates you want to enter.
Developing Projects
129
3) Display Activity Details, then click the Status tab.
To enter the activity's start date, in the Started field, click , then select a date.
To enter the activity's actual start date, mark the Started checkbox, then type the
actual start date in the Started field or click to select a date.
To enter the activity's finish date, in the Finished field, click , then select a date.
To enter the activity's actual finish date, mark the Finished checkbox, then type the
actual finish date in the Finished field or click to select a date.
Note
When you enter a start or finish date, depending on your application settings, a
dialog box may prompt you to enter a constraint. To accept the constraint, click
Yes in the Confirmation dialog box. If you specify start and/or finish dates without
applying Must Start On or Must Finish On constraints, the dates you enter may be
changed when the project is scheduled.
Enter a physical percent complete for activities
A percent complete that is entered manually by the user instead of being calculated by
the module is known as a "physical" percent complete.
The default method is to calculate percent complete according to activity duration.
1) Choose Project, Activities.
2) Select the activity whose physical percent complete you want to enter.
3) Display Activity Details, then click the General tab.
4) Select Physical as the percent complete type.
5) Click the Status tab.
6) In the Physical % field, type a physical percent complete.
Note
You may enter a percent complete value for in progress activities only. If the
activity has not started yet or has already finished, you will not be able to specify a
percent complete value.
Enter unit information for resource assignments
1) Choose Project, Activities.
2) Select the activity whose unit values you want to record.
3) Display Activity Details, then click the Resources tab.
P6 Professional User's Guide
130
4) To enter the budgeted or planned units for the activity, type the value in the
budgeted or planned Units column.
To enter the actual units for the activity, type the value in the Actual Units column.
You can only enter actual units for activities that are in progress or completed.
To enter the remaining units for the activity, type the value in the Remaining Units
column. You can only enter remaining units for activities that are in progress.
Note
A time period does not display if the Show Unit Label checkbox is not marked in
the User Preferences, Time Units tab.
Tips
P6 Professional automatically recalculates the time value and period you enter
according to the standard time period defined by your system administrator.
To view the available time period abbreviations, choose Admin, Admin
Preferences, then click the Time Periods tab when P6 Professional is connected to
a P6 Professional database and choose the Application Settings in P6 when
connected to a P6 EPPM database.
Enter cost information for resource assignments
1) Choose Project, Activities.
2) Select the activity whose costs you want to enter.
3) Display Activity Details, then click the Resources tab.
4) To enter the budgeted or planned cost for the activity, type the value in the
Budgeted or Planned Cost column.
To enter the actual cost for the activity, type the value in the Actual Cost column.
To enter the remaining cost for the activity, type the value in the Remaining Cost
column. You can only enter remaining cost for activities that are in progress.
Notes
When you enter an actual cost on an activity that is not in progress, and the Cost
Units Linked checkbox is not marked on the assignment, the budgeted or planned
cost and remaining cost will not be linked.
The budgeted or planned cost will remain untouched and the remaining cost will
change. To maintain the same value for the at completion cost, set the When
Updating Actual Units or Cost option (found on the Calculations tab in the Project
details) to Subtract Actual from At Completion.
Developing Projects
131
Dissolve an activity
To dissolve an activity, you select the activity and then choose Edit, Dissolve.
Dissolving an activity removes the dissolved activity and joins the dissolved activity’s
predecessor and successor activities as well as possible to maintain the project’s network
logic, as explained here. You cannot dissolve an activity unless it has a predecessor and
successor.
When an activity is dissolved, relationships are made as follows:
The first half of the relationship between the immediate predecessor of the dissolved
activity and the dissolved activity is used as the first half of the relationship between
the predecessor (of the dissolved activity) and all successors that had a relationship
with the dissolved activity.
For example, say that Activity A is the immediate predecessor of Activity B, that
Activity A has a Start to Finish relationship with Activity B, and that Activity B is to be
dissolved. When Activity B is dissolved, all of A’s relationships with B’s successors (with
which B had a relationship) must begin with Start.
The second half of the relationship between the predecessor (of the dissolved
activity) and each successor that had a relationship with the dissolved activity
remains the same for each successor as when each was linked to the dissolved
activity.
To continue the previous example, say that Activity C is the immediate successor of
Activity B, and that Activity C has a Finish to Finish relationship with Activity B. As
Activity B is dissolved, the second half of its relationship to C (C’s end of it) is used and
combined with A’s first half of its relationship with B, giving a Start (from A’s side of the
A to B relationship) to Finish (from C’s side of the B to C relationship) relationship.
The same principle applies to any other successor activities to B.
So, for example, the following activities have the following relationships:
Activity A is linked to Activity B using SF
Activity B is linked to Activity C using FF
Activity B is linked to Activity D using a FS
Activity B is linked to Activity E using SF
Activity B is linked to Activity F using SS
When you dissolve Activity B, the following occurs:
Activity A is linked to Activity C using SF
Activity A is linked to Activity D using SS
Activity A is linked to Activity E using SF
Activity A is linked to Activity F using SS
P6 Professional User's Guide
132
Define milestones
1) Choose Project, Activities.
2) Select the activity you want to define as a start or finish milestone.
3) Display Activity Details, then click the General tab.
4) In the Activity Type field, select Start Milestone or Finish Milestone.
Note
Milestones cannot have durations, time-based costs, or resource assignments.
View activity float values
1) Choose Project, Activities.
2) Select the activity whose float values you want to view.
3) Display Activity Details, then click the Status tab.
The Free Float field displays the amount of time the selected activity can be delayed
without delaying the activities that immediately follow (successor activities).
The Total Float field displays the amount of time the selected activity can be delayed
without delaying the project's finish date.
Tip
You can also display Total Float and Free Float columns in the Activity Table.
Note
An activity's free and total float is automatically calculated each time you
schedule the project. You cannot edit an activity's float values directly.
View activity summaries
1) Choose Project, Activities.
2) Select the activity whose summary information you want to view.
3) Display Activity Details, then click the Summary tab.
To view summary information about the activity's units, choose Display Units.
To view summary information about the activity's costs, choose Display Cost.
To view all of the activity's start and finish dates, choose Display Dates.
Copy and paste activities in the Activity Table
1) Select the activity you want to copy. To select multiple activities, use Ctrl+click.
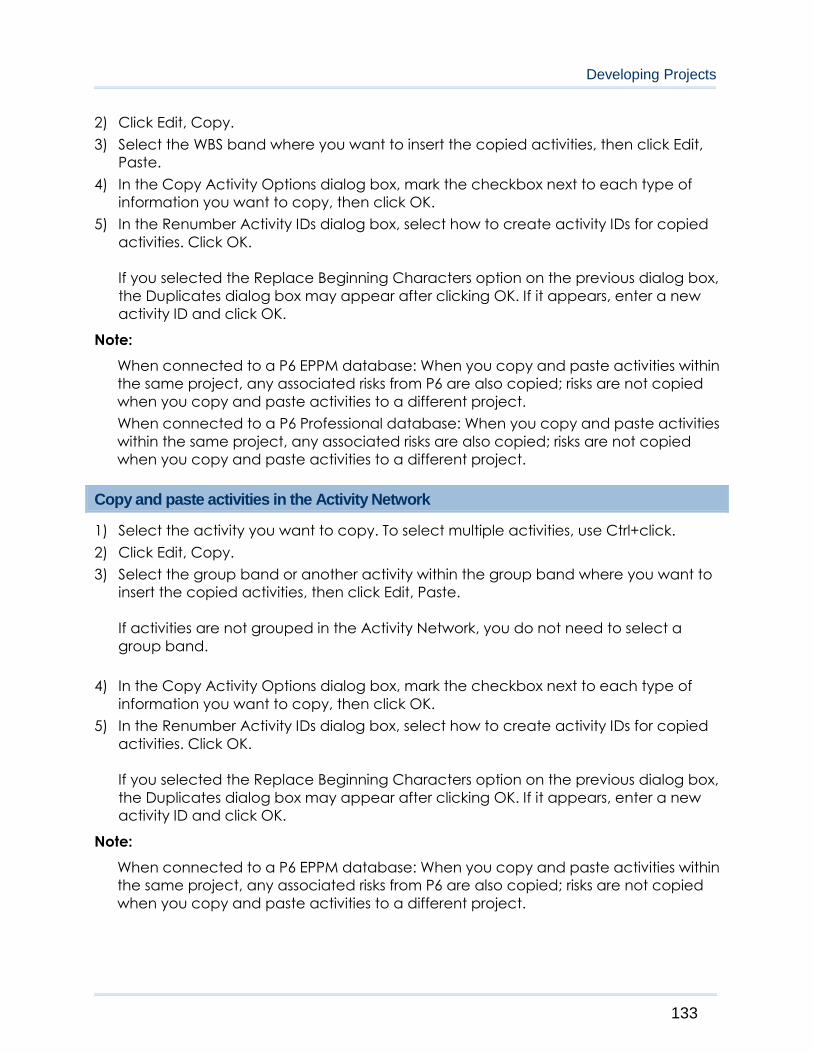
Developing Projects
133
2) Click Edit, Copy.
3) Select the WBS band where you want to insert the copied activities, then click Edit,
Paste.
4) In the Copy Activity Options dialog box, mark the checkbox next to each type of
information you want to copy, then click OK.
5) In the Renumber Activity IDs dialog box, select how to create activity IDs for copied
activities. Click OK.
If you selected the Replace Beginning Characters option on the previous dialog box,
the Duplicates dialog box may appear after clicking OK. If it appears, enter a new
activity ID and click OK.
Note:
When connected to a P6 EPPM database: When you copy and paste activities within
the same project, any associated risks from P6 are also copied; risks are not copied
when you copy and paste activities to a different project.
When connected to a P6 Professional database: When you copy and paste activities
within the same project, any associated risks are also copied; risks are not copied
when you copy and paste activities to a different project.
Copy and paste activities in the Activity Network
1) Select the activity you want to copy. To select multiple activities, use Ctrl+click.
2) Click Edit, Copy.
3) Select the group band or another activity within the group band where you want to
insert the copied activities, then click Edit, Paste.
If activities are not grouped in the Activity Network, you do not need to select a
group band.
4) In the Copy Activity Options dialog box, mark the checkbox next to each type of
information you want to copy, then click OK.
5) In the Renumber Activity IDs dialog box, select how to create activity IDs for copied
activities. Click OK.
If you selected the Replace Beginning Characters option on the previous dialog box,
the Duplicates dialog box may appear after clicking OK. If it appears, enter a new
activity ID and click OK.
Note:
When connected to a P6 EPPM database: When you copy and paste activities within
the same project, any associated risks from P6 are also copied; risks are not copied
when you copy and paste activities to a different project.

P6 Professional User's Guide
134
When connected to a P6 Professional database: When you copy and paste activities
within the same project, any associated risks are also copied; risks are not copied
when you copy and paste activities to a different project.
Renumber activity IDs in the Activity Table
This task renumbers activity IDs for the current project and, if applicable, renumbers the
same activity IDs in baselines for this project.
1) Select the activity you want to renumber. To select multiple activities, use Ctrl+click or
Shift+click.
2) Choose Edit, Renumber Activity IDs.
3) Proceed as follows from the Renumber Activity IDs dialog box:
Specify how you want to renumber the activity IDs.
The Renumber Selected Activities in Baselines checkbox is marked by default if
baselines exist for the project. Be aware that if you clear this checkbox, all
renumbered activities are disconnected from the baselines and are treated as new
activities.
Click OK.
4) The Duplicates dialog box may appear after clicking OK. If it appears, type new
activity IDs, as applicable, and click OK.
Note:
If you click Cancel in the Duplicates dialog box, no activity IDs are renumbered,
including activity IDs that are not duplicates.
5) If you marked the Renumber Selected Activities in Baselines checkbox on the
Renumber Activity IDs dialog box, P6 Professional searches for baselines where
duplicate activity IDs would be created. If it finds none, then the current project and
its associated baselines are renumbered, and the baseline renumbering is committed
to the database with no chance for you to undo the renumbering. If P6 Professional
finds any baselines where duplicate activity IDs would be created, the Baseline
Duplicates dialog box appears and lists the names of those baselines; P6 Professional
does not renumber activity IDs in a baseline if it detects that doing so would create
duplicate activity IDs.
From the Baseline Duplicates dialog box, click one of the following:
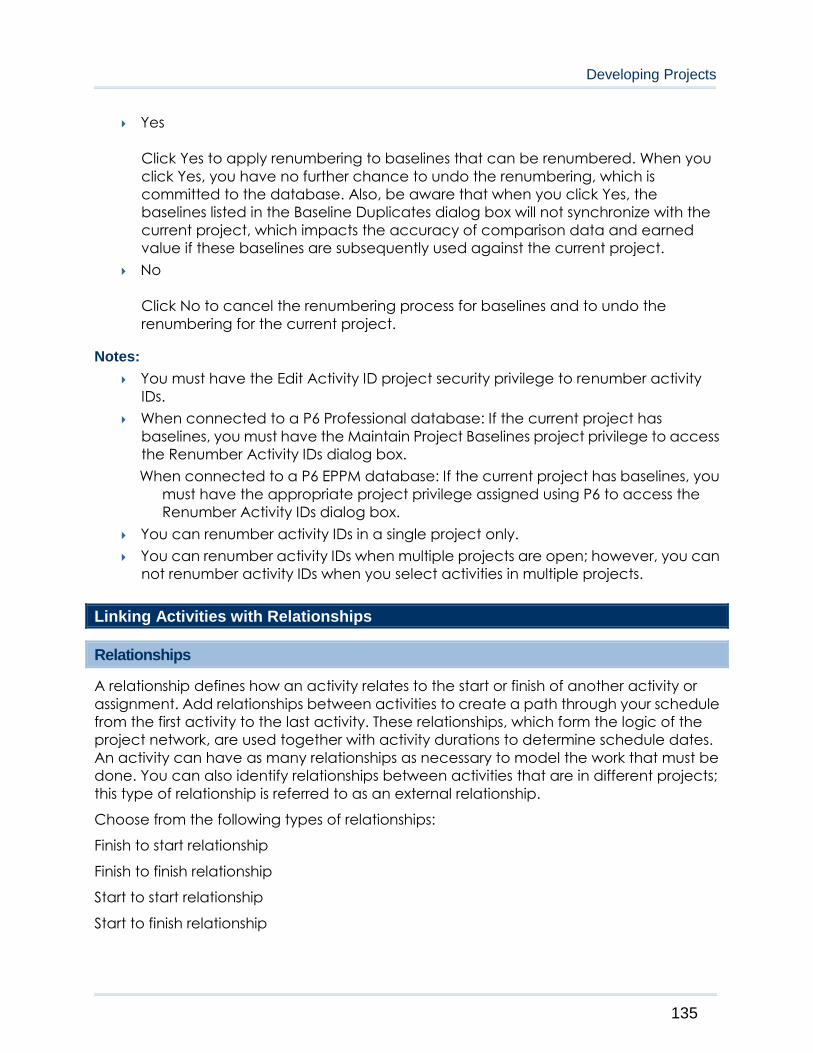
Developing Projects
135
Yes
Click Yes to apply renumbering to baselines that can be renumbered. When you
click Yes, you have no further chance to undo the renumbering, which is
committed to the database. Also, be aware that when you click Yes, the
baselines listed in the Baseline Duplicates dialog box will not synchronize with the
current project, which impacts the accuracy of comparison data and earned
value if these baselines are subsequently used against the current project.
No
Click No to cancel the renumbering process for baselines and to undo the
renumbering for the current project.
Notes:
You must have the Edit Activity ID project security privilege to renumber activity
IDs.
When connected to a P6 Professional database: If the current project has
baselines, you must have the Maintain Project Baselines project privilege to access
the Renumber Activity IDs dialog box.
When connected to a P6 EPPM database: If the current project has baselines, you
must have the appropriate project privilege assigned using P6 to access the
Renumber Activity IDs dialog box.
You can renumber activity IDs in a single project only.
You can renumber activity IDs when multiple projects are open; however, you can
not renumber activity IDs when you select activities in multiple projects.
Linking Activities with Relationships
Relationships
A relationship defines how an activity relates to the start or finish of another activity or
assignment. Add relationships between activities to create a path through your schedule
from the first activity to the last activity. These relationships, which form the logic of the
project network, are used together with activity durations to determine schedule dates.
An activity can have as many relationships as necessary to model the work that must be
done. You can also identify relationships between activities that are in different projects;
this type of relationship is referred to as an external relationship.
Choose from the following types of relationships:
Finish to start relationship
Finish to finish relationship
Start to start relationship
Start to finish relationship

P6 Professional User's Guide
136
Adding relationships between activities
Add relationships between activities to create a path through your schedule from the first
activity (or activities) to the last. If you display relationship lines you can add relationships
by drawing the relationship on the Gantt Chart from predecessor to successor. You can
also add relationships using the Predecessors, Successors, and Relationships tabs in
Activity Details, or using the Assign Toolbar.
Relationship lines
Relationship lines graphically illustrate the links between activities in the bars area. You
can display relationships lines in both the Gantt Chart and the Activity Network.
Add predecessor relationships
1) Choose Project, Activities.
2) Select the activity to which you want to add a predecessor relationship.
3) Display Activity Details, then click the Predecessors or Relationships tab.
4) Click Assign in the Predecessors tab or in the Predecessors area of the Relationships
tab.
5) Assign relationships to activities within the same project and/or assign relationships to
activities outside of the current project (external relationships):
To assign relationships within the same project, in the Assign Predecessors dialog box
select the predecessor activity you want to assign. Click the Assign button, then click
the Close button.
To assign a relationship to an activity outside of the current project, in the Assign
Predecessors dialog box click the Display Options bar and choose Select Project.
Select the external project, then select the predecessor activity you want to assign.
Click the Assign button then click the Close button.
6) To specify a predecessor activity's relationship type, double-click the Relationship
Type field, then select a type.
7) To specify a predecessor activity's lag time, double-click the Lag field, then type the
lag time value.
Note
To display the Relationships tab in Activity Details, click the Layout Options bar,
then choose Bottom Layout Options and add the Relationships tab to the Display
Tabs column list.

Developing Projects
137
Add successor relationships
1) Choose Project, Activities.
2) Select the activity to which you want to add a successor relationship.
3) Display Activity Details, then click the Successors or Relationships tab.
4) Click Assign in the Successors tab or in the Successors area of the Relationships tab.
5) Assign relationships to activities within the same project and/or assign relationships to
activities outside of the current project (external relationships):
To assign relationships within the same project, in the Assign Successors dialog box
select the successor activity you want to assign, click the Assign button, then click the
Close button.
To assign a relationship to an activity outside of the current project, in the Assign
Successors dialog box click the Display Options bar and choose Select Project. Select
the external project, then select the successor activity you want to assign. Click the
Assign button, then click the Close button.
6) To specify a successor activity's relationship type, double-click the Relationship Type
field, then select a type.
7) To specify a successor activity's lag time, double-click the Lag field, then type the lag
time value.
Note
To display the Relationships tab in Activity Details, click the Layout Options bar,
then choose Bottom Layout Options and add the Relationships tab to the Display
Tabs column list.
Create relationships in the Gantt Chart
1) Move the mouse pointer to the edge of the predecessor activity bar until it turns into
a relationship pointer (a vertical single-ended arrow).
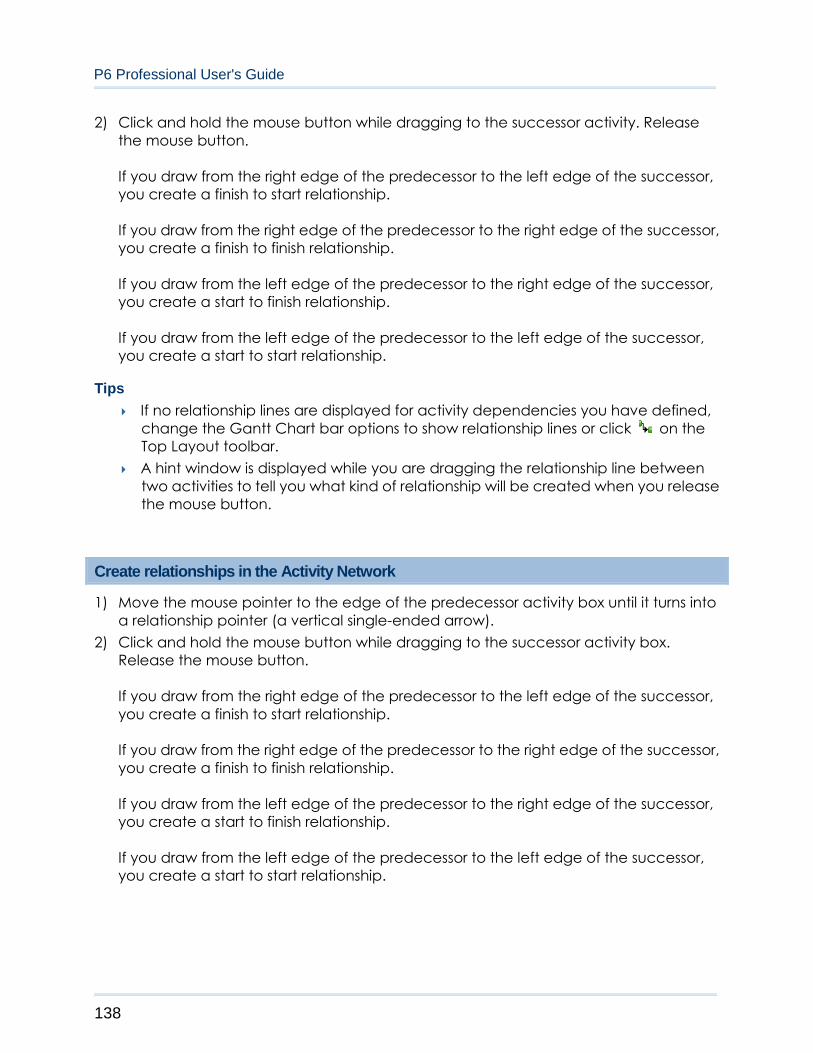
P6 Professional User's Guide
138
2) Click and hold the mouse button while dragging to the successor activity. Release
the mouse button.
If you draw from the right edge of the predecessor to the left edge of the successor,
you create a finish to start relationship.
If you draw from the right edge of the predecessor to the right edge of the successor,
you create a finish to finish relationship.
If you draw from the left edge of the predecessor to the right edge of the successor,
you create a start to finish relationship.
If you draw from the left edge of the predecessor to the left edge of the successor,
you create a start to start relationship.
Tips
If no relationship lines are displayed for activity dependencies you have defined,
change the Gantt Chart bar options to show relationship lines or click on the
Top Layout toolbar.
A hint window is displayed while you are dragging the relationship line between
two activities to tell you what kind of relationship will be created when you release
the mouse button.
Create relationships in the Activity Network
1) Move the mouse pointer to the edge of the predecessor activity box until it turns into
a relationship pointer (a vertical single-ended arrow).
2) Click and hold the mouse button while dragging to the successor activity box.
Release the mouse button.
If you draw from the right edge of the predecessor to the left edge of the successor,
you create a finish to start relationship.
If you draw from the right edge of the predecessor to the right edge of the successor,
you create a finish to finish relationship.
If you draw from the left edge of the predecessor to the right edge of the successor,
you create a start to finish relationship.
If you draw from the left edge of the predecessor to the left edge of the successor,
you create a start to start relationship.
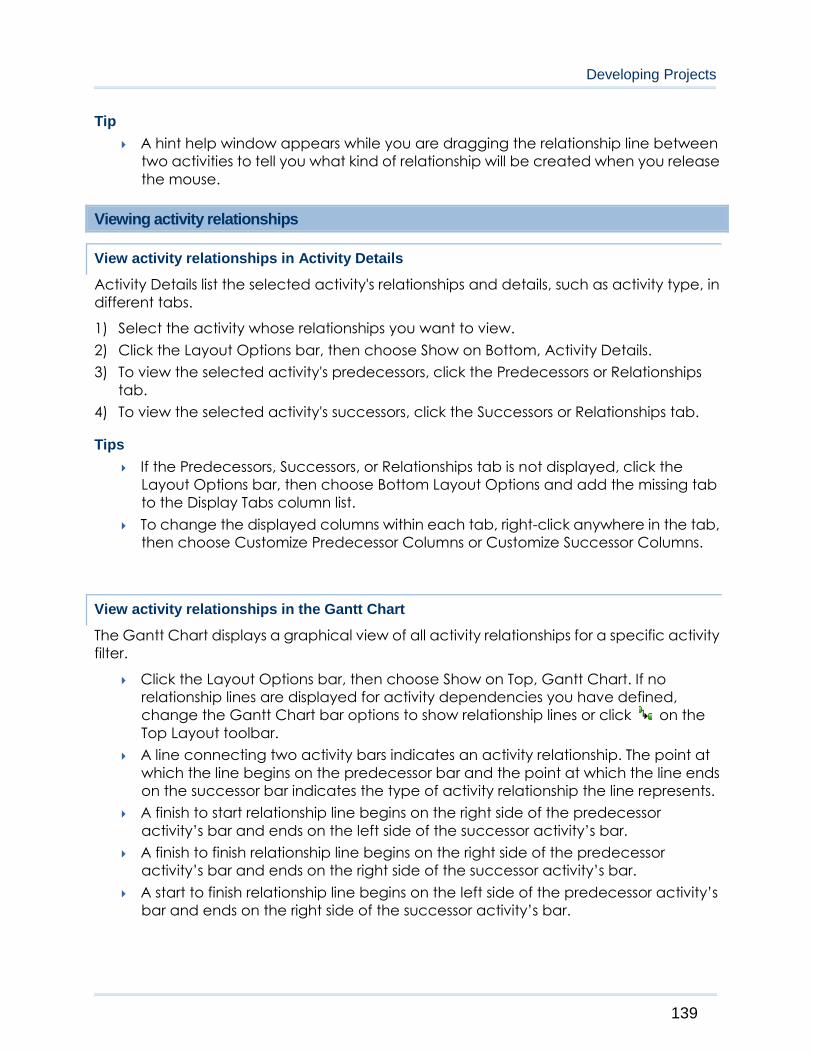
Developing Projects
139
Tip
A hint help window appears while you are dragging the relationship line between
two activities to tell you what kind of relationship will be created when you release
the mouse.
Viewing activity relationships
View activity relationships in Activity Details
Activity Details list the selected activity's relationships and details, such as activity type, in
different tabs.
1) Select the activity whose relationships you want to view.
2) Click the Layout Options bar, then choose Show on Bottom, Activity Details.
3) To view the selected activity's predecessors, click the Predecessors or Relationships
tab.
4) To view the selected activity's successors, click the Successors or Relationships tab.
Tips
If the Predecessors, Successors, or Relationships tab is not displayed, click the
Layout Options bar, then choose Bottom Layout Options and add the missing tab
to the Display Tabs column list.
To change the displayed columns within each tab, right-click anywhere in the tab,
then choose Customize Predecessor Columns or Customize Successor Columns.
View activity relationships in the Gantt Chart
The Gantt Chart displays a graphical view of all activity relationships for a specific activity
filter.
Click the Layout Options bar, then choose Show on Top, Gantt Chart. If no
relationship lines are displayed for activity dependencies you have defined,
change the Gantt Chart bar options to show relationship lines or click on the
Top Layout toolbar.
A line connecting two activity bars indicates an activity relationship. The point at
which the line begins on the predecessor bar and the point at which the line ends
on the successor bar indicates the type of activity relationship the line represents.
A finish to start relationship line begins on the right side of the predecessor
activity’s bar and ends on the left side of the successor activity’s bar.
A finish to finish relationship line begins on the right side of the predecessor
activity’s bar and ends on the right side of the successor activity’s bar.
A start to finish relationship line begins on the left side of the predecessor activity’s
bar and ends on the right side of the successor activity’s bar.
P6 Professional User's Guide
140
A start to start relationship line begins on the left side of the predecessor activity’s
bar and ends on the left side of the successor activity’s bar.
View activity relationships in the Activity Network
The Activity Network displays a graphical view of all activity relationships for a specific
activity filter.
In the hierarchy table on the left side of the Activity Network, select the hierarchy
element whose activity relationships you want to view. The Activity Network table
displays the selected hierarchy element's activities. A line connecting two activity
boxes indicates an activity relationship. The point at which the line begins on the
predecessor box and the point at which the line ends on the successor box indicates
the type of the activity relationship.
A finish to start relationship line begins on the right side of the predecessor's box and
ends on the left side of the successor's box.
A finish to finish relationship line begins on the right side of the predecessor’s box and
ends on the right side of the successor’s box.
A start to finish relationship line begins on the left side of the predecessor’s box and
ends on the right side of the successor’s box.
A start to start relationship line begins on the left side of the predecessor’s box and
ends on the left side of the successor’s box.
View activity relationships in Trace logic
Trace Logic displays a graphical view of only the selected activity's relationships.
1) Select the activity whose relationships you want to view.
2) Click the Layout Options bar, then choose Show on Bottom, Trace Logic.
The selected activity appears with a blue border. Activity boxes to the left of the
selected activity are predecessors. Activity boxes to the right of the selected activity
are successors.
Developing Projects
141
Assigning Resources and Roles to Activities
Assign resources to activities
1) Choose Project, Activities.
2) Select the activity to which you want to assign a resource.
3) Display Activity Details, then click the Resources tab.
4) Click Add Resource.
5) Select the resource you want to assign.
If resource security is enabled you can only select resources you have access to.
6) Click the Assign button, then click the Close button.
Assign resources to activities by role
Assigning resources to activities by role facilitates resource staffing for activities because
you can use roles with specific skill sets as resource assignments until specific resources
can be assigned.
1) Choose Project, Activities.
2) Select the activity for which you want to assign a resource.
3) Display Activity Details, then click the Resources tab.
4) Click Assign by Role.
The Assign Resources by Role dialog box lists the roles assigned to the selected
activities. Under each role is a list of resources who can fulfill the role.
5) Select the resource you want to assign.
To assign multiple resources, hold down the Ctrl key, then click each resource you
want to assign.
Click the Assign button, then click the Close button.
Tip
When a resource and role share an activity assignment (e.g., when assigning a
resource to an activity by role), you can choose to use the rate of the resource or
role to calculate costs on the activity.

P6 Professional User's Guide
142
Assign a rate type to a resource assignment
You can choose the price/unit rate you want to use to calculate costs for a resource or
role assignment on an activity.
1) Choose Project, Activities.
2) Select the activity that contains the assignment to which you want to assign a rate
type.
3) Display Activity Details, then click the Resources tab.
4) Click in the Rate Type column and select the rate type you want to use for the
assignment.
The rate type determines the price/unit used to calculate costs for the assignment.
The names for each rate type are defined by your system administrator in the Rate
Types tab of Admin Preferences when P6 Professional is connected to a P6
Professional database and in P6 when connected to a P6 EPPM database. When you
select a rate type, the monetary value is updated automatically in the Price/Unit
column (if displayed).
Tip
A ^ value in the Price/Unit column indicates that the module is using the default
value defined in the 'Default Price/Unit for activities without resource/role
Price/Units' on the Project Details, Calculations tab. An asterisk symbol (*) beside
the value indicates that multiple, time-varying, resource rates or shift calendars will
be applied during the duration of the activity. An asterisk and caret symbol (*^)
beside the price/unit value indicate that the project default price/unit is in effect
at the start of the activity and a time-varying rate is also in effect within the activity
assignment duration.
Notes
If there is no defined rate for the selected price/unit in the Rate Type column, the
module calculates cost using the default rate specified in the Default Price/Unit for
activities without resource or role Price/Units field in the Project Details,
Calculations tab.
When the rate type is changed, the new price/unit is used to recalculate the costs
for the assignment (assuming the units and costs are linked).
The Recalculate Assignment Costs utility ignores any assignment with a Rate
Source set to Override. The customized, manually entered price is not overwritten
when you recalculate assignment prices.
If the activity's duration type is Fixed Units or Fixed Units/Time, and a rate type is
selected for the assignment, units are not updated when costs change.
In the General tab of the Schedule Options dialog box (Tools, Schedule, Options),
mark the Recalculate assignment costs after scheduling option to recalculate
assignment costs whenever the rate type is changed.
Developing Projects
143
In the Level Resources dialog box (Tools, Level Resources), mark the Recalculate
assignment costs after leveling option to recalculate assignment costs after
leveling.
Choose the rate source for an assignment
When a resource and role share an assignment on the same activity (e.g., when you
assign a resource that has an assigned role to an activity), you can choose to use the
rate of the resource or role to calculate costs, or enter a custom rate.
1) Choose Project, Activities.
2) Select the activity that contains the assignment.
3) Display Activity Details, then click the Resources tab.
4) In the Resources tab, double-click the Rate Source column and choose Resource,
Role, or Override.
Choose Resource to calculate cost based on the resource's price/unit value selected
in the Rate Type column. Choose Role to calculate cost based on the role's price/unit
value selected in the Rate Type column. Choose Override if you want to enter a
custom rate in the Price/Unit column.
Tip
If you seldom combine different rate sources in the same project (e.g., you almost
always use Resource as the Rate Source), you can choose to always use the rate
of the resource or role when a resource and role share an assignment on the same
activity. Choose Edit, User Preferences. In the Calculations tab, Assignment
Staffing section, choose to always use the resource's price/unit or the role's
price/unit; or, choose to be asked which price/unit you want to use each time a
resource is assigned to an activity that already has a role assignment (and vice
versa).
Note
If only a resource is assigned to an activity, the rate source must be Resource or
Override. If only a role is assigned to an activity, the rate source must be Role or
Override.
Change the resource's role assignments for an activity
1) Choose Project, Activities.
2) Select the activity for which you want to change a resource's role.
3) Display Activity Details, then click the Resources tab.
4) For the appropriate resource listing, double-click in the Role column.
5) Select the role you want to assign, then click the Select button.
P6 Professional User's Guide
144
Tip
If the Role column is not displayed in the Resources tab, right-click anywhere in the
tab, then choose Customize Resource Columns. In the Available Options area,
click Role, click the right arrow button, then click OK.
Recalculate resource and role assignment costs
1) Choose Tools, Recalculate Assignment Costs to recalculate prices for all resources
and roles on the project.
2) Mark the Synchronize Overtime Factor while recalculating cost checkbox to
synchronize the overtime factor defined for each resource when recalculating costs.
3) Click Recalculate.
Notes
Choosing this command recalculates activity costs in all open projects.
When connected to a P6 Professional database: Recalculate Assignment Costs is
disabled if you do not have the View Resource and Role Costs/Financials global
privilege.
When connected to a P6 EPPM database: Recalculate Assignment Costs is
disabled if you do not have the appropriate global privilege as defined in P6.
The recalculate utility ignores any assignment with a Rate Source set to Override.
The customized, manually entered price is not overwritten when you synchronize
resource prices. To view the Rate Source for an assignment, display the Rate
Source column in the Activity Details, Resources tab.
You must mark the setting to Link actual to date and actual this period units and
costs in the Project Details, Calculations tab to recalculate assignment costs.
Assign roles to activities
1) Choose Project, Activities.
2) Select the activity to which you want to assign a role.
3) Display Activity Details, then click the Resources tab.
4) Click Add Role.
5) Select the role you want to assign.
You can assign multiple roles to an activity. To select more than one item, hold down
the Ctrl key, then click each role you want to assign.
6) Click Assign, then click Close.
Developing Projects
145
Tip
If price/unit rates are defined for a role you assign to an activity, you can choose
the price/unit rate you want the module to use to calculate cost. Choosing a
defined price/unit rate yields more accurate cost planning results. If you do not
specify a rate, the module uses the default rate defined in the Project Details,
Calculations tab.
Assigning Resource Curves
Assign a curve to a resource or role assignment
You can assign a resource distribution curve to any resource or role assignment on
activities with a duration type of Fixed Duration and Units/Time or Fixed Duration & Units.
Resource usage and costs are distributed evenly during an activity unless you specify
nonlinear distribution using curves.
1) Choose Project, Resource Assignments.
2) Select the resource/role assignment to which you want to assign a resource curve.
3) Double-click in the Curve column and select the curve you want to assign to the
resource/role assignment, then click Select.
To display the Curve column, click the Display Options bar, then choose Columns,
Customize. Select Curve from the General group and click to add the column to
the Selected Options.
Tips
Using pre-defined or custom resource curves, you can define 21 points on the
curve to spread units or costs over the duration of an activity. While this is suitable
for most activities, some of your activities might require a more granular resource
distribution. For example, for long duration activities with varying levels of effort, a
resource curve might not fully reflect when work is planned to be performed on
the activity. To accurately capture future period resource distribution for these
activities, you can manually enter future period budgeted or planned and
remaining unit assignment values in the Resource Usage Spreadsheet of the
Activities and Resource Assignments windows.
For activities whose assignments you want to manually plan, you can assign a
resource curve to a resource or role assignment, then manually modify the future
period values to more accurately capture the planned resource or role
distribution. When you assign a resource curve and manually modify future period
values, the assigned resource curve is removed from the resource or role
assignment.
Notes
Curves are defined by 21 points (5% intervals from 0 to 100).
You can also assign resource curves in the Resources tab of Activity Details.

P6 Professional User's Guide
146
Curves cannot be assigned to an activity with a duration type of Fixed Units or
Fixed Units/Time.
Remove a curve from a resource or role assignment
1) Choose Project, Resource Assignments.
2) Select the resource/role assignment from which you want to remove the resource
curve.
3) Click in the Curve column, then click Clear in the Select Curve dialog box.
To display the Curve column, click the Display Options bar, then choose Columns,
Customize. Select Curve from the General group and click to add the column to
the Selected Options.
Note
You can also remove curves from the Resources tab in the Activity Details.
Budgeting
Defining Budgeting
Budget consists of the total estimation effort (or quantities) necessary, and the cash flow
required, to complete a project. Before a project start, the resource/cost manager,
along with the operations executive, program manager, and project manager
determine scope and budget requirements, and set these estimates. As requirements
change, resource and financial support are adjusted to compensate for these changes.
The individuals involved in project funding and financial support can log changes to the
budget in the project planning stage, or after the project is underway. P6 Professional
tracks these changes, while retaining the original amounts.
Establishing budgets
You can create budget estimates for each EPS node, project, or WBS level, and then
refine them as needed.
Use the Budget Log tab on the Projects window to enter the original budget—the total
amount you require for the EPS node or project.
The Budget Change Log helps you keep track of budget changes as they occur. The
Current Budget (original budget plus approved budget changes) and Proposed Budget
fields (original budget plus approved and pending budget amounts) incorporate these
changes so you have up-to-date and accurate budget information for each project or
EPS node.

Developing Projects
147
You can record monthly spending of budgeted funds, track the current and
undistributed variance amounts, and roll up the monthly spending plan of each project
to any level of the EPS.
When P6 Professional is connected to a P6 EPPM database: If your projects use funding to
support budgets, you can also use P6 to set up a dictionary containing any nonprofit,
government-allocated, or other funding sources for easy assignment to projects or EPS
nodes.
When P6 Professional is connected to a P6 Professional database: If your projects use
funding to support budgets, you can also set up a dictionary containing any nonprofit,
government-allocated, or other funding sources for easy assignment to projects or EPS
nodes.
Tracking and analyzing budgets
The resource spreadsheet enables you to see an overall picture of unit and cost budget
distributions, and the variance amounts resulting from current use versus original
estimates at the activity level.
For high-level budgeting information, display the Projects Window (choose Enterprise,
Projects) and then select Original Budget and Current Variance as columns.
You can also use the preformatted reports to track budget amounts at the project and
activity level.
Establish budgets
1) Choose Enterprise, Projects, then select the EPS node/project for which you want to
enter budgets.
2) Display Project Details, then click the Budget Log tab.
3) In the Original Budget field, type an estimate of the total amount you require for this
project, including all funding contributions.
Enter budget changes
1) Choose Enterprise, Projects, then select the EPS node/project for which you want to
enter budget changes.
2) Display Project Details, then click the Budget Log tab.
3) Click Add.
P6 Professional User's Guide
148
4) In the Budget Change Log section, specify the date, amount, person responsible for
the change, status (pending, approved, or not approved), and reason for the
change.
The Current Budget field is the sum of the original budget plus approved budget
changes; the Proposed Budget contains the original budget plus approved and
pending budget amounts.
Define funding sources
When P6 Professional is connected to a P6 EPPM database, you use P6 to set up a
Funding Sources Dictionary containing any nonprofit, government-allocated, or other
funding sources.
When P6 Professional is connected to a P6 Professional database, follow these steps to
set up a Funding Sources Dictionary containing any nonprofit, government-allocated, or
other funding sources. You can assign funding sources to budgets as you develop
projects.
1) Choose Enterprise, Funding Sources.
2) Select the funding source immediately above and at the same hierarchy level as the
fund you want to add, then click Add.
Use the hierarchical structure of the Funding Sources Dictionary to categorize and
group similar funds, such as those affiliated with a particular agency.
3) Click Modify to type any additional information about the fund in an HTML editor.
In the editor, you can format text, insert pictures and tables, copy and paste
information from other document files (while retaining formatting), and add
hyperlinks.
4) Click Close.
Tips
You can apply unlimited Funding assignments to each EPS and project level.
To see a graphical display of your funding hierarchy, click the Display Options bar
in the Funding Sources dialog box and choose Chart View.
Assign funding sources
Once you define funding sources, you can assign them to EPS nodes or projects as
follows:
Developing Projects
149
1) Choose Enterprise, Projects, then select the EPS node/project to which you want to
assign a funding source.
2) Display Project Details, then click the Funding tab.
3) Click Add.
4) Select a funding source from the Funding Sources Dictionary.
5) Click , then click .
6) Type the amount of funding to be allocated to this project.
7) Type a percentage or share of the total fund to be allocated to the selected
element.
You can assign the same funding source multiple times with varying amount and
share contributions for different levels of the EPS. Both the amount and share values
for the fund are user-defined. Funds do not roll up; you edit them per EPS level to
allow for top-down planning.
Tip
In the Projects window you can include a column called Total Funding, which
contains the sum of the funding for each project and EPS node.
Enter monthly spending amounts
1) Choose Enterprise, Projects, then select the EPS node/project for which you want to
enter monthly spending amounts.
2) Display Project Details, then click the Spending Plan tab.
3) Type total expenditures for each month in the Spending Plan column.
The Spending Plan Tally column shows any amounts previously recorded for
lower-level project spending plans.
The current variance is the difference between the monthly spending of the EPS node
and its projects' tallies.
You can type the benefit amount or profit portion of the monthly amounts; the
benefit plan is also tallied.
View budget and spending plan totals
1) Choose Enterprise, Projects, then select the EPS node/project for which you want to
view budget information.
2) Display Project Details, then click the Budget Summary tab to view calculated
budget data from the Budget Log and Spending Plan tabs.
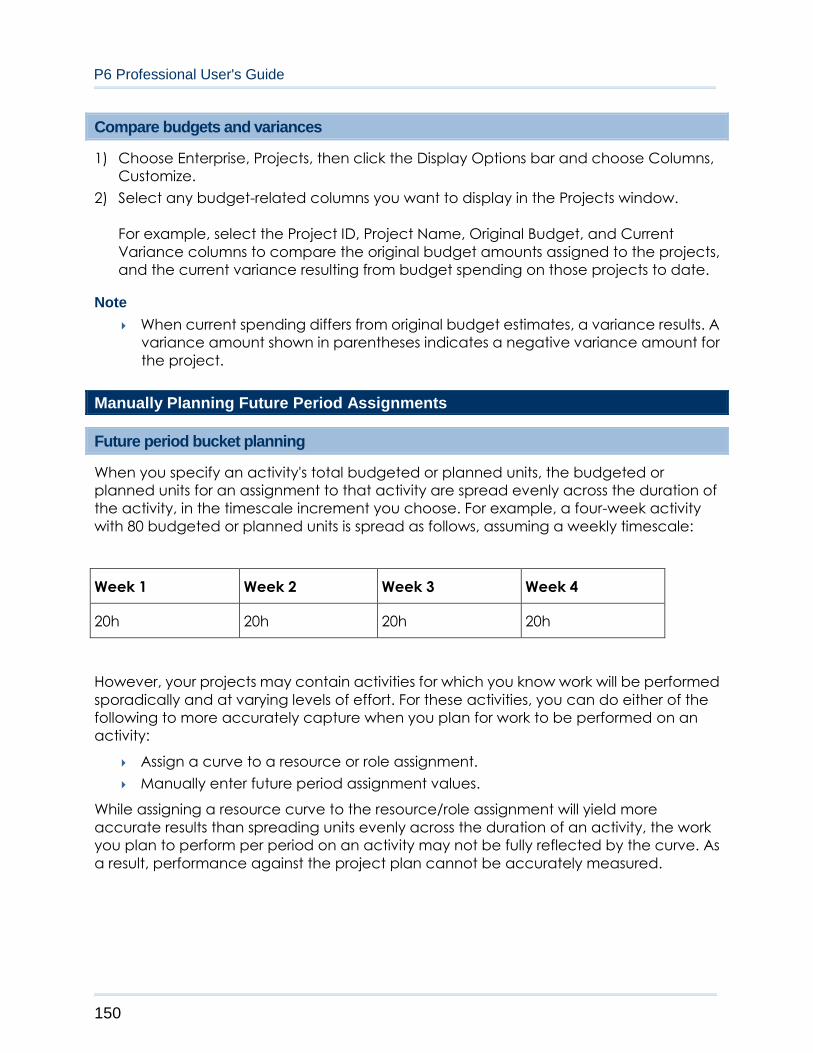
P6 Professional User's Guide
150
Compare budgets and variances
1) Choose Enterprise, Projects, then click the Display Options bar and choose Columns,
Customize.
2) Select any budget-related columns you want to display in the Projects window.
For example, select the Project ID, Project Name, Original Budget, and Current
Variance columns to compare the original budget amounts assigned to the projects,
and the current variance resulting from budget spending on those projects to date.
Note
When current spending differs from original budget estimates, a variance results. A
variance amount shown in parentheses indicates a negative variance amount for
the project.
Manually Planning Future Period Assignments
Future period bucket planning
When you specify an activity's total budgeted or planned units, the budgeted or
planned units for an assignment to that activity are spread evenly across the duration of
the activity, in the timescale increment you choose. For example, a four-week activity
with 80 budgeted or planned units is spread as follows, assuming a weekly timescale:
Week 1 Week 2 Week 3 Week 4
20h 20h 20h 20h
However, your projects may contain activities for which you know work will be performed
sporadically and at varying levels of effort. For these activities, you can do either of the
following to more accurately capture when you plan for work to be performed on an
activity:
Assign a curve to a resource or role assignment.
Manually enter future period assignment values.
While assigning a resource curve to the resource/role assignment will yield more
accurate results than spreading units evenly across the duration of an activity, the work
you plan to perform per period on an activity may not be fully reflected by the curve. As
a result, performance against the project plan cannot be accurately measured.
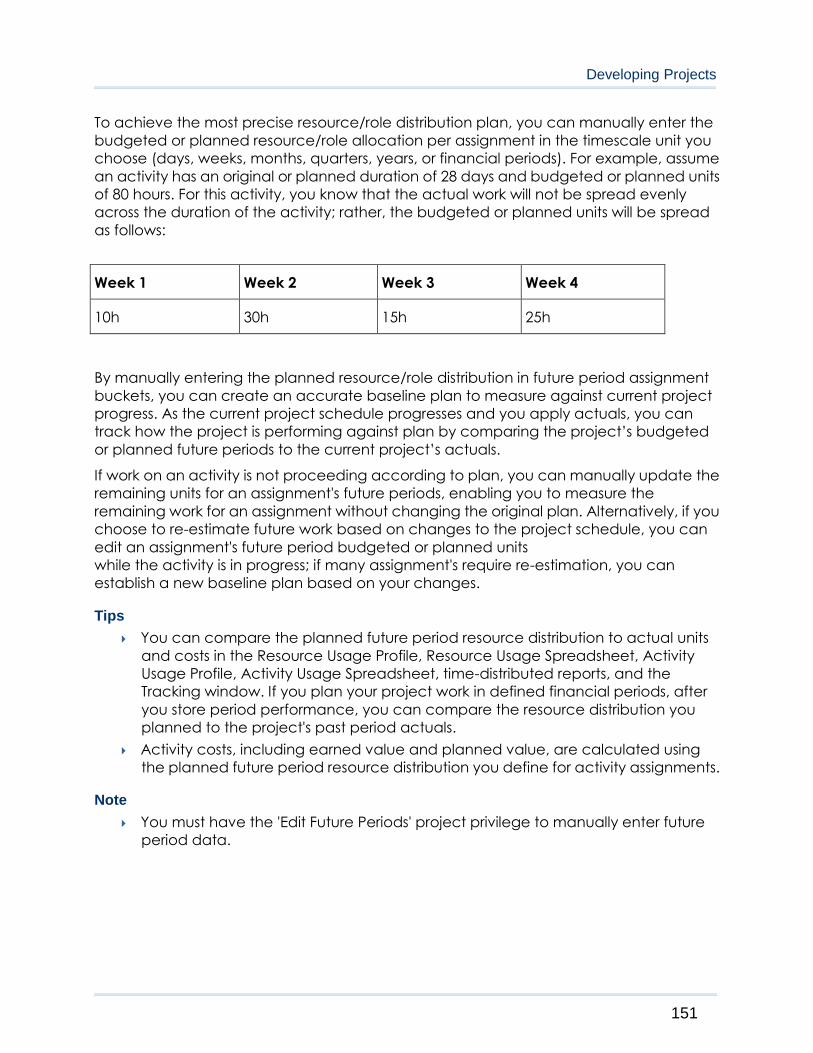
Developing Projects
151
To achieve the most precise resource/role distribution plan, you can manually enter the
budgeted or planned resource/role allocation per assignment in the timescale unit you
choose (days, weeks, months, quarters, years, or financial periods). For example, assume
an activity has an original or planned duration of 28 days and budgeted or planned units
of 80 hours. For this activity, you know that the actual work will not be spread evenly
across the duration of the activity; rather, the budgeted or planned units will be spread
as follows:
Week 1 Week 2 Week 3 Week 4
10h 30h 15h 25h
By manually entering the planned resource/role distribution in future period assignment
buckets, you can create an accurate baseline plan to measure against current project
progress. As the current project schedule progresses and you apply actuals, you can
track how the project is performing against plan by comparing the project’s budgeted
or planned future periods to the current project’s actuals.
If work on an activity is not proceeding according to plan, you can manually update the
remaining units for an assignment's future periods, enabling you to measure the
remaining work for an assignment without changing the original plan. Alternatively, if you
choose to re-estimate future work based on changes to the project schedule, you can
edit an assignment's future period budgeted or planned units
while the activity is in progress; if many assignment's require re-estimation, you can
establish a new baseline plan based on your changes.
Tips
You can compare the planned future period resource distribution to actual units
and costs in the Resource Usage Profile, Resource Usage Spreadsheet, Activity
Usage Profile, Activity Usage Spreadsheet, time-distributed reports, and the
Tracking window. If you plan your project work in defined financial periods, after
you store period performance, you can compare the resource distribution you
planned to the project's past period actuals.
Activity costs, including earned value and planned value, are calculated using
the planned future period resource distribution you define for activity assignments.
Note
You must have the 'Edit Future Periods' project privilege to manually enter future
period data.

P6 Professional User's Guide
152
Create a future period bucket planning layout
You can budget or plan future period resource/role assignments in any type of layout in
the Resource Assignments and Activities windows. This topic contains some steps you
may want to follow when you create a layout to use for future period bucket planning.
When you create a future period bucket planning layout, you should save the layout for
future use.
1. Display editable future period bucket planning fields
You can enter future period budgeted or planned and remaining values in the Budgeted
or Planned Units and Remaining (Early) Units fields in the Resource Usage Spreadsheet. To
display these fields, click the Display Options bar and choose Spreadsheet Fields,
Customize. Move the Budgeted or Planned Units and Remaining Early Units fields to the
Selected Options list; you can also remove all other fields from the Selected Options list.
Click Apply, OK.
Tips
You can display the Actual Units field as well to compare the work that was
planned to be performed (Budgeted or Planned Units) for an assignment versus
the work that has actually occurred (Actual Units). Once an assignment is in
progress, if work is not being performed according to plan, you can adjust the
Remaining (Early) Units as necessary; or, if you choose to re-estimate an
assignment's remaining work, you can adjust the assignment's Budgeted or
Planned Units instead.
To see costs related to the assignments you are manually planning, display the
Budgeted or Planned Cost and Actual Cost fields.
2. Display the Curve, Budgeted or Planned Units, and Remaining (Early) Units columns
When you manually enter a value in a future period bucket for an assignment, the
module automatically enters a value of Manual in the assignment’s associated Curve
column. By displaying the Curve column, you can determine which assignments already
have an assigned resource curve, or a defined manual curve.
For assignments that do not have a defined total Budgeted or Planned Units or
Remaining (Early) Units value, it is useful to display the Budgeted or Planned Units and
Remaining (Early) Units columns. When you display these columns, you can enter or edit
an assignment's total Budgeted or Planned or remaining units to spread the units evenly
over the original or planned duration of the assignment, then manually modify the future
period distribution as necessary.
To display these columns, click the Layout Options bar and choose Columns, Customize.
Move the Curve, Budgeted or Planned Units, and Remaining (Early) Units columns to the
Selected Options list, then modify the remaining columns. Click Apply, OK.
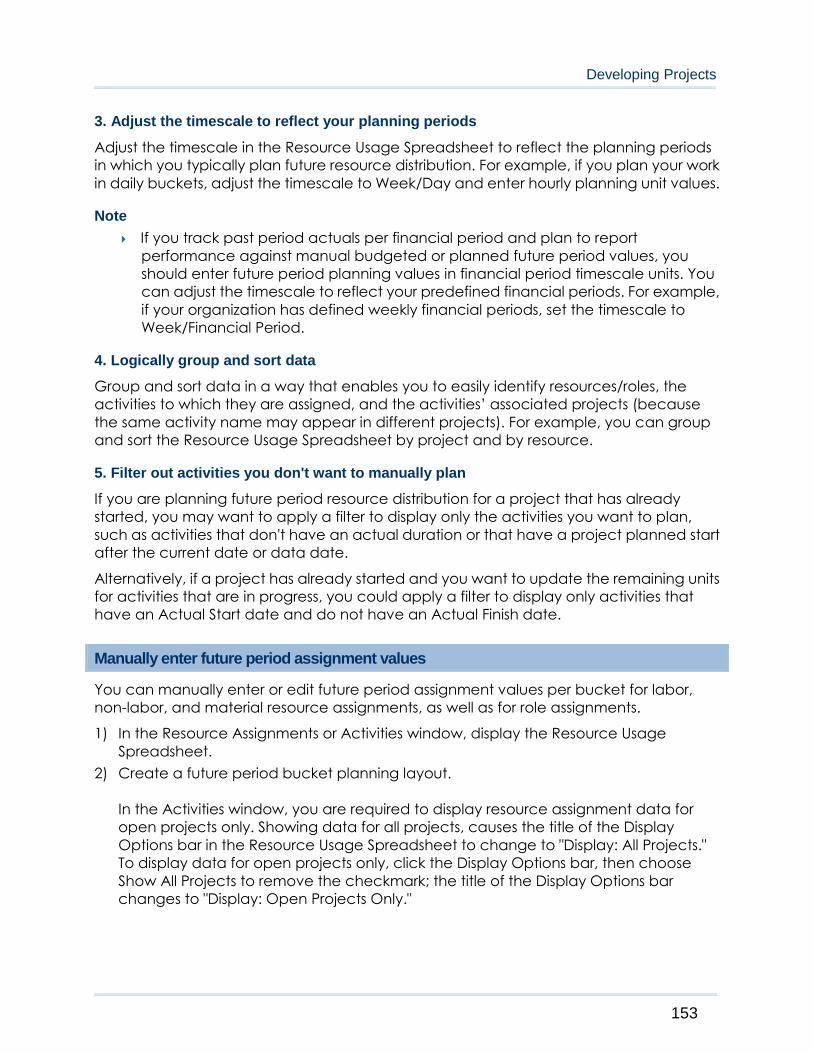
Developing Projects
153
3. Adjust the timescale to reflect your planning periods
Adjust the timescale in the Resource Usage Spreadsheet to reflect the planning periods
in which you typically plan future resource distribution. For example, if you plan your work
in daily buckets, adjust the timescale to Week/Day and enter hourly planning unit values.
Note
If you track past period actuals per financial period and plan to report
performance against manual budgeted or planned future period values, you
should enter future period planning values in financial period timescale units. You
can adjust the timescale to reflect your predefined financial periods. For example,
if your organization has defined weekly financial periods, set the timescale to
Week/Financial Period.
4. Logically group and sort data
Group and sort data in a way that enables you to easily identify resources/roles, the
activities to which they are assigned, and the activities’ associated projects (because
the same activity name may appear in different projects). For example, you can group
and sort the Resource Usage Spreadsheet by project and by resource.
5. Filter out activities you don't want to manually plan
If you are planning future period resource distribution for a project that has already
started, you may want to apply a filter to display only the activities you want to plan,
such as activities that don't have an actual duration or that have a project planned start
after the current date or data date.
Alternatively, if a project has already started and you want to update the remaining units
for activities that are in progress, you could apply a filter to display only activities that
have an Actual Start date and do not have an Actual Finish date.
Manually enter future period assignment values
You can manually enter or edit future period assignment values per bucket for labor,
non-labor, and material resource assignments, as well as for role assignments.
1) In the Resource Assignments or Activities window, display the Resource Usage
Spreadsheet.
2) Create a future period bucket planning layout.
In the Activities window, you are required to display resource assignment data for
open projects only. Showing data for all projects, causes the title of the Display
Options bar in the Resource Usage Spreadsheet to change to "Display: All Projects."
To display data for open projects only, click the Display Options bar, then choose
Show All Projects to remove the checkmark; the title of the Display Options bar
changes to "Display: Open Projects Only."
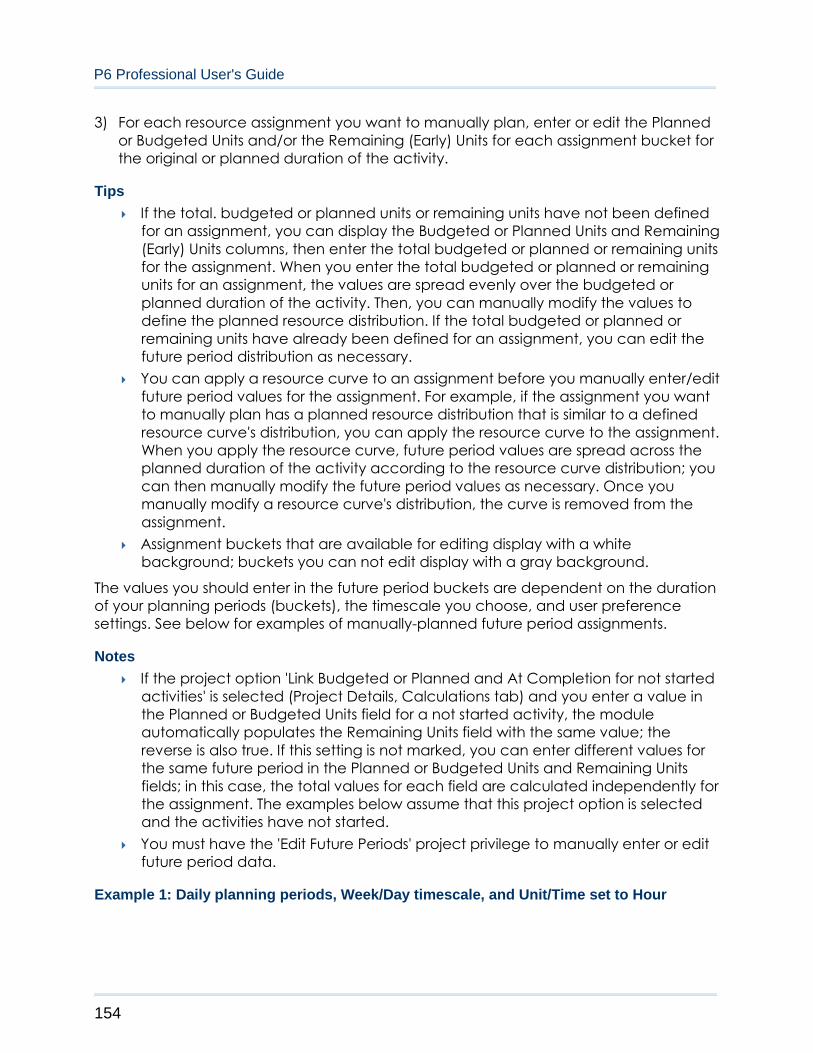
P6 Professional User's Guide
154
3) For each resource assignment you want to manually plan, enter or edit the Planned
or Budgeted Units and/or the Remaining (Early) Units for each assignment bucket for
the original or planned duration of the activity.
Tips
If the total. budgeted or planned units or remaining units have not been defined
for an assignment, you can display the Budgeted or Planned Units and Remaining
(Early) Units columns, then enter the total budgeted or planned or remaining units
for the assignment. When you enter the total budgeted or planned or remaining
units for an assignment, the values are spread evenly over the budgeted or
planned duration of the activity. Then, you can manually modify the values to
define the planned resource distribution. If the total budgeted or planned or
remaining units have already been defined for an assignment, you can edit the
future period distribution as necessary.
You can apply a resource curve to an assignment before you manually enter/edit
future period values for the assignment. For example, if the assignment you want
to manually plan has a planned resource distribution that is similar to a defined
resource curve's distribution, you can apply the resource curve to the assignment.
When you apply the resource curve, future period values are spread across the
planned duration of the activity according to the resource curve distribution; you
can then manually modify the future period values as necessary. Once you
manually modify a resource curve's distribution, the curve is removed from the
assignment.
Assignment buckets that are available for editing display with a white
background; buckets you can not edit display with a gray background.
The values you should enter in the future period buckets are dependent on the duration
of your planning periods (buckets), the timescale you choose, and user preference
settings. See below for examples of manually-planned future period assignments.
Notes
If the project option 'Link Budgeted or Planned and At Completion for not started
activities' is selected (Project Details, Calculations tab) and you enter a value in
the Planned or Budgeted Units field for a not started activity, the module
automatically populates the Remaining Units field with the same value; the
reverse is also true. If this setting is not marked, you can enter different values for
the same future period in the Planned or Budgeted Units and Remaining Units
fields; in this case, the total values for each field are calculated independently for
the assignment. The examples below assume that this project option is selected
and the activities have not started.
You must have the 'Edit Future Periods' project privilege to manually enter or edit
future period data.
Example 1: Daily planning periods, Week/Day timescale, and Unit/Time set to Hour
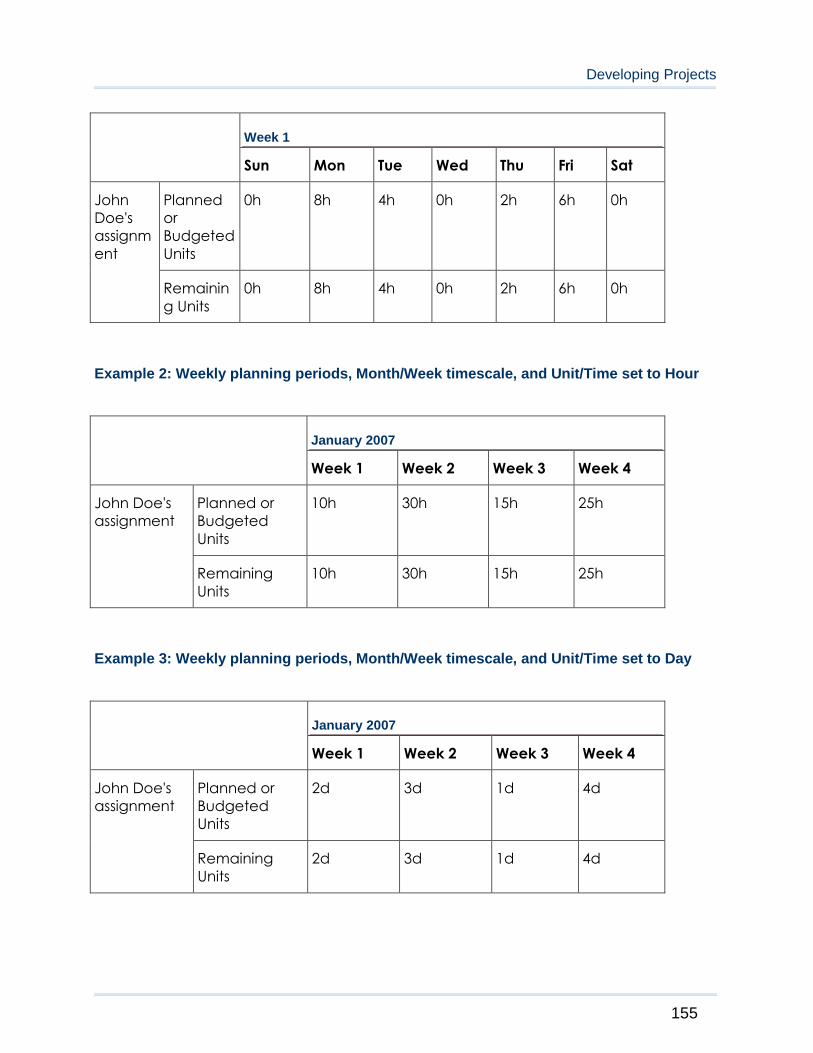
Developing Projects
155
Week 1
Sun Mon Tue Wed Thu Fri Sat
John
Doe's
assignm
ent
Planned
or
Budgeted
Units
0h 8h 4h 0h 2h 6h 0h
Remainin
g Units
0h 8h 4h 0h 2h 6h 0h
Example 2: Weekly planning periods, Month/Week timescale, and Unit/Time set to Hour
January 2007
Week 1 Week 2 Week 3 Week 4
John Doe's
assignment
Planned or
Budgeted
Units
10h 30h 15h 25h
Remaining
Units
10h 30h 15h 25h
Example 3: Weekly planning periods, Month/Week timescale, and Unit/Time set to Day
January 2007
Week 1 Week 2 Week 3 Week 4
John Doe's
assignment
Planned or
Budgeted
Units
2d 3d 1d 4d
Remaining
Units
2d 3d 1d 4d

P6 Professional User's Guide
156
Example 4: Monthly planning periods, Quarter/Month timescale, and Unit/Time set to Day
Q1 2007
Jan Feb Mar
John Doe's
assignment
Planned or
Budgeted Units
15d 20d 10d
Remaining Units 15d 20d 10d
Example 5: Monthly planning periods, Quarter/Month timescale, and Unit/Time set to Week
Q1 2007
Jan Feb Mar
John Doe's
assignment
Planned or
Budgeted Units
2w 3w 1w
Remaining Units 2w 3w 1w
Adding Expenses and Entering Cost Information for Activities
Expenses
Expenses
Expenses are nonresource costs associated with a project and assigned to a project's
activities. They are typically one-time expenditures for nonreusable items. Examples of
expenses include materials, facilities, travel, overhead, and training.
You can categorize expenses, indicate a unit of measure for expenses, and specify
whether an expense accrues at the start or end of an activity or uniformly over its
duration. Each expense has a budgeted or planned cost, actual cost, and estimated
remaining cost.
Expenses are not the same as resources. Resources generally extend across multiple
activities and/or multiple projects. Examples of resources are personnel and equipment.
Unlike resources, expenses are project-specific. P6 Professional does not include
expenses when leveling resources. Resource curves are not supported for expenses.
Developing Projects
157
Add expenses
1) Choose Project, Expenses.
2) Click on the Edit toolbar or choose Edit, Add.
3) Select the activity to which you want to assign the expense, then click the Select
button.
4) Click the General, Activity, Costs, and Description tabs, and enter details for the
expense.
Add expenses from the Activities window
1) Choose Project, Activities.
2) Select the activity that incurs the expense.
3) Display Activity Details, then click the Expenses tab.
To display the Expenses tab, click the Layout Options bar and choose Bottom Layout
Options. In the Available Tabs section, select Expenses, click , then click OK.
4) Click Add, then type a name for the expense item.
5) Double-click in the Cost Account column, then click . Select the cost account you
want to assign, then click the Select button.
6) Double-click in the Expense Category column, then click . Select the category you
want to assign, then click the Select button.
7) Double-click the Accrual Type column, then select the expense’s accrual type.
8) Type the number of budgeted or planned units you expect the selected activity to
use.
9) Type the price of each unit.
The module calculates and displays the expense's budgeted or planned cost
(budgeted or planned units * price/unit) in the Budgeted or Planned Cost field.
10) To enter actual expense costs already incurred by the activity, type the cost in the
Actual Cost field.
To automatically calculate an expense's actual cost based on the activity's planned
completion percentage, mark the Auto Compute Actuals checkbox.
11) Type the name of the vendor business or organization to which the expense is
payable.

P6 Professional User's Guide
158
Tip
To change the columns displayed on the Expenses tab, right-click anywhere in the
Expenses tab, then choose Customize Expense Columns.
Assign an expense category
1) Choose Project, Expenses.
2) Select the Expense Item, then click the General tab.
3) In the Expense Category field, click .
4) Select the category to which you want to assign the expense, then click the Select
button.
Assign expense categories from the Activities window
1) Choose Project, Activities.
2) Select the activity associated with the expense.
3) Display Activity Details, then click the Expenses tab.
To display the Expenses tab, click the Layout Options bar and choose Bottom Layout
Options. In the Available Tabs section, select Expenses, click , then click OK.
4) Select the expense to which you want to assign a category. Double-click in the
Expense Category column, then click .
5) Select the category you want to assign, then click the Select button.
Specify an accrual type for an expense
1) Choose Project, Expenses.
2) Select the expense, then click the Activity tab.
3) In the Accrual Type field, select one of the following:
Start of Activity, to accrue the entire expense on the date the activity begins
End of Activity, to accrue the entire expense on the date the activity ends
Uniform Over Activity, to evenly distribute the expense over the course of the activity's
duration
Enter cost information for expenses
1) Choose Project, Expenses.
2) Select the expense, then click the Costs tab.
3) In the Budgeted or Planned Units field, type the number of units you expect the
expense's assigned activity to use.
Developing Projects
159
4) In the Price/Unit field, type the price for each unit.
The module calculates and displays the budgeted or planned cost of the selected
expense (budgeted or planned units * price ¸ unit) in the Budgeted or Planned Cost
field.
5) To enter actual expense costs already incurred by the activity, type the cost in the
Actual Cost field.
To automatically calculate an expense's actual cost based on the activity's planned
completion percentage, mark the Auto Compute Actuals checkbox.
Change an expense's activity assignment
1) Choose Project, Expenses.
2) Select the expense item you want to reassign, then click the Activity tab.
3) In the Activity Name field, click .
4) Select the activity to which you want to reassign the expense, then click the Select
button.
Cost Accounts
Cost accounts
When P6 Professional is connected to a P6 EPPM database, you can create cost
accounts using P6 and associate them with activity resource assignments or expenses in
a project.
When P6 Professional is connected to a P6 Professional database, you can create cost
accounts and associate them with activity resource assignments or expenses in a
project.
Cost accounts are hierarchical, and they enable you to track activity costs and earned
value according to your organization's specific cost account codes.
You can specify a project's default cost account. This cost account is used for resource
assignments to activities and project expenses in the open project.
Create a cost account hierarchy (P6 Professional Only)
1) Choose Enterprise, Cost Accounts.
Click the Cost Account ID column label to display the cost accounts hierarchy. An
outline symbol in the Cost Account ID column label indicates a hierarchy display.
2) In the Cost Accounts list, select a cost account immediately above and of the same
hierarchy level as the cost account you want to add, then click Add.
P6 Professional User's Guide
160
3) Type the cost account's ID.
4) Type the cost account's name.
5) Click Modify to type a description of the cost account in an HTML editor.
In the editor, you can format text, insert pictures and tables, copy and paste
information from other document files (while retaining formatting), and add
hyperlinks.
Edit a cost account (P6 Professional Only)
1) Choose Enterprise, Cost Accounts.
Click the Cost Account ID column label to display the cost accounts hierarchy. An
outline symbol in the Cost Account ID column label indicates a hierarchy display.
2) Select the cost account you want to edit.
3) To change the cost account's position in the hierarchy, click the appropriate arrow
buttons.
4) Type a new cost account ID.
5) Type a new cost account name.
Note
If you change a cost account's ID or name, your change applies to all activity
assignments.
Delete a cost account (P6 Professional Only)
1) Choose Enterprise, Cost Accounts.
2) Select the cost account you want to delete, then click Del./Merge.
If activities or projects are assigned to the cost account, the Cost Account in Use
dialog box is displayed. To delete the cost account and specify a replacement cost
account, choose Select Replacement Account, click OK, then select a replacement
account. To delete the cost account without specifying a replacement cost
account, choose Delete Account(s), then click OK.
Copy and paste cost accounts (P6 Professional Only)
1) Choose Enterprise, Cost Accounts.
Click the Cost Account ID column label to display the cost accounts hierarchy. An
outline symbol in the Cost Account ID column label indicates a hierarchy display.
2) Select the cost account you want to copy, then click Copy.
3) Select the cost account to which you want to add the copy, then click Paste.

Developing Projects
161
Note
When you copy and paste a cost account, the cost account's activity and project
assignments are not copied.
Cut and paste cost accounts (P6 Professional Only)
1) Choose Enterprise, Cost Accounts.
Click the Cost Account ID column label to display the cost accounts hierarchy. An
outline symbol in the Cost Account ID column label indicates a hierarchy display.
2) Select the cost account you want to cut and paste, then click Cut.
3) Select the cost account to which you want to add the cut account, then click Paste.
Note
When you cut and paste a cost account, the account's activity and project
assignments are also pasted.
Set the project default cost account
You can specify a project's default cost account. This cost account will be used for
resource assignments to activities and project expenses in the open project.
1) Choose Enterprise, Projects and display Project Details.
2) Select the project to which you want to assign a default cost account.
3) Click the Defaults tab.
4) In the Defaults for New Activities section, click in the Cost Account field.
5) Select the cost account you want to assign as the default, then click the Select
button.
Note
The default cost account is only used for new resource assignments to activities
and new project expenses. Changing this setting does not affect existing resource
assignments to activities or existing project expenses.
Performing Top-down Estimation (P6 Professional Only)
Top-Down Estimation enables you to apply labor, nonlabor, and/or material resource
units to activities in a top-down manner using assigned weights.
To perform top-down estimations, you must first assign estimation weights to WBS
elements and activities. You can limit the scope of your estimate according to WBS
element and resource. After you develop a top-down estimate, save the estimate for
later reference or use, or apply the estimate to the project. If you apply an estimate,
remaining labor/nonlabor units are updated for activities that are not started or are in
progress and activity resource assignments within the estimation scope. Completed
activities, that is activities with remaining units equal to zero, are not affected by
top-down estimation.Top-down estimations do not affect project expenses.
P6 Professional User's Guide
162
When performing a top-down estimation, you should first determine the total number of
labor or nonlabor resource units to apply. You can determine this number using prior
experience on similar projects. You can also use the Function Point option if you are
estimating an information technology project.
You must select material resources individually because their units of measure may differ.
Performing top-down estimations using prior experience (P6 Professional Only)
1) Choose Tools, Top Down Estimation.
2) Choose to estimate labor or nonlabor resource units.
3) In the WBS field, click the Browse button to select the WBS element whose activities
you want to estimate. Click Select.
4) In the Resource field, select the resource to estimate activities assigned to a specific
resource within the specified WBS element. Click Select.
5) Choose Prior Experience.
6) Enter the estimate in the Estimated Units field.
7) Mark the Apply adjustment checkbox to apply an adjusted percentage to the
estimate. Type the adjustment percentage. For example, if the estimated units are
400.00h and you apply an adjustment of 50%, P6 Professional will add 200.00h (50% of
400) to the estimated units. The Adjusted Units field will display 600.00h.
8) Click Save As to save the estimate without applying it. Type a name and any
assumptions and notes about the estimate, then click Save.
9) Click apply to perform top-estimation. Click Yes when prompted to confirm that you
want to apply a top-down estimate to the project, then Click OK.
Performing top-down estimations using function points (P6 Professional Only)
1) Choose Tools, Top Down Estimation.
2) Choose to estimate labor or nonlabor resource units, or select a material resource in
the Resource field.
3) In the WBS field, click the Browse button to select the WBS element whose activities
you want to estimate. Click Select.
4) Choose Function Point, then click Function Points.
5) In the Function Point Estimation dialog box, enter the Unadjusted Function Point
Count (UFP) value you want to use, or click Calculate to calculate the UFP. If you
choose to calculate the UFP, the Function Point Estimation - Data and Transactions
dialog box will appear.
6) In the Function Point Estimation - Data and Transactions dialog box, enter the number
of low, average, and high complexity files and transactions to be developed under
the WBS element and resource, if any, you are estimating.
7) Click Close. In the Function Point Estimation dialog box, the UFP value is listed in the
Unadjusted Function Point Count (UFP) field.
Developing Projects
163
8) Enter the Total Degree of Influence (TDI) value you want to use, or click
Characteristics to calculate the TDI. If you choose to calculate the TDI, the Function
Point Estimation - System Characteristics dialog box will appear.
9) In the Function Point Estimation - System Characteristics dialog box, select a system
characteristic, then choose the numeric value that indicates the characteristic's
degree of influence on the WBS element you are estimating.
Zero (0) indicates no influence while 5 indicates the strongest influence.
When you select a value, the Value Description box displays text describing the value
for the selected characteristics. Select a value for all system characteristics, then click
Close.
10) In the Function Point Estimation dialog box, the TDI value is listed in the Total Degree of
Influence (TDI) field.
11) Type the average productive value (function points/person month), then click Close.
12) Mark the Apply adjustment checkbox to apply an adjusted percentage to the
estimate. Type the adjustment percentage. For example, if the estimated units are
400.00h and you apply an adjustment of 50%, P6 Professional will 200.00h (50% of 400)
to the estimated units. The Adjusted Units field will display 600.00h.
13) Click Save As to save the estimate without applying it. Type a name and any
assumptions and notes about the estimate, then click Save.
14) Click apply to perform top-estimation. Click Yes when prompted to confirm that you
want to apply a top-down estimate to the project, then Click OK.
Applying Saved Top-Down Estimations To a Project (P6 Professional Only)
After you specify the number of units you want to apply, P6 Professional distributes the
total units to the selected activities, using the estimated weights assigned to the project's
WBS elements and activities. P6 Professional uses these weights to calculate the
proportion of resource units that each WBS element and activity should receive in
relation to other WBS elements. P6 Professional also maintains a history of saved
top-down estimations.
Apply saved top-down estimations
1) Choose Tools, Top Down Estimation.
2) Click History.
3) In the Estimation History dialog box, select the estimate you want to apply, then click
Apply.
View a project's top-down estimations
1) Choose Tools, Top Down Estimation.
2) Click History.
P6 Professional User's Guide
164
Note: To apply top-down estimations to a project, you must have
the "Add/Edit Activities Except Relationships" privilege, which is set
in the Security Profiles dialog box.
Adding Activity Steps
Activity steps
Activity steps provide a way to break activities down into smaller units and track the
completion of those units. For example, the activity Prepare for System Integration and
Testing might contain the following steps:
Step 1
Step 2
Step 3
You can add as many steps to an activity as you need: some activities will require more
steps to complete than others and some activities might require no additional steps at
all. If progress occurs on the step, enter a percent complete in the Step % Complete
column, or mark the Completed checkbox to indicate the step is 100% complete.
You can assign additional information to steps, such as cost, start and finish dates, and
text. Define user-defined fields for activity steps in the User Defined Fields dialog box
(choose Enterprise, User Defined Fields), then add fields as columns in the Steps tab of
Activity Details.
You can also create activity step templates (using P6 when P6 Professional is connected
to a P6 EPPM database) that capture a group of steps common to multiple activities,
then assign the step group to activities.
Weighted steps
Weighted steps enable you to track the progress of an activity based on the number of
steps completed. When you mark the Activity Percent Complete Based on Activity Steps
checkbox in the Calculations tab in the Projects window, and choose Physical as the
activity's percent complete type in the General tab in the Activities window, activity
percent complete is updated based on the weight you assign to each activity step.
For example, in the activity Prepare for System Integration and Testing mentioned above,
the steps are assigned weights of 3.0, 2.0, and 1.0 respectively. When you mark the
Completed checkbox or enter 100% in the Step % Complete column for the step Establish
Test Cases and Test Procedures, the activity’s physical percent complete is updated to
50 percent (because the total weight for the steps in this activity is 6.0 and the weight for
this step is 3.0; therefore, half the work on this activity, according to the weight of the
steps, has been completed).
Developing Projects
165
Add steps to activities
For unique, activity-specific steps, you can add steps to activities as described below.
When connected to a P6 EPPM database: For general, repeatable groups of steps, you
can assign templates (including steps, weights, and descriptions) created using P6 to
activities.
When connected to a P6 Professional database: For general, repeatable groups of
steps, you can convert existing steps to a template, create activity step templates, and
assign templates.
1) Choose Project, Activities.
2) Select the activity to which you want to add a step.
3) Display Activity Details, then click the Steps tab.
To display the Steps tab, click the Layout Options bar and choose Bottom Layout
Options. In the Available Tabs section, select Steps, click , then click OK.
4) Click Add.
5) Type the name of the new step.
6) Click Modify to type a description of the step in an HTML editor.
In the editor, you can format text, insert pictures and tables, copy and paste
information from other document files (while retaining formatting), and add
hyperlinks.
7) Position the step within the listed steps for the activity.
To move the step to an earlier stage of the activity, click .
To move the step to a later stage of the activity, click .
Tip
Use activity step user-defined fields (Enterprise, User Defined Fields) to enter start
and finish dates, cost, or text you would like to display for the step. To add step UDF
columns to the Steps tab, right-click in the step area and choose Customize Steps
Columns.
Update activity steps
The Physical percent complete for the activity calculates each time you mark or clear a
Completed checkbox, edit the Step % Complete, change the weight of a step, or add
or remove steps from the activity. To calculate the percent complete, select Physical as
the percent complete type.
P6 Professional User's Guide
166
Mark the Completed checkbox beside the steps you want to update.
Or
Display the Step % Complete column, and enter a percent complete value for the
steps you want to update.
Note
When the Step % Complete is set to 100%, the checkbox is marked as Completed.
If you mark the Completed checkbox, the Step % Complete becomes 100%.
Tips
To display additional step columns for updating, right-click in the Steps tab and
click Customize Steps Columns. Select the columns to display in the Steps tab.
Add user-defined columns to the Steps tab to update additional information, such
as the finish date, start date, cost, and the number of hours worked for a step.
Add weights to steps
Weighted steps enable you to track the progress of an activity based on the number of
steps completed. To calculate weighted steps you must first mark the Activity Percent
Complete Based on Activity Steps checkbox for the project you want to use (this
checkbox is located on the Calculations tab in the Project details view). Then, for each
activity containing weighted steps, set the percent complete type to Physical.
When you add a step to an activity that already has steps defined, the default weight for
the new step is 1, providing no steps have been marked Completed, and no steps have
a Step % Complete of 100%. If some of the steps for the activity have already been
completed, the default weight for the new step is 0.
1) Choose Project, Activities.
2) Select the activity to which you want to add a step weight.
3) Display Activity Details, then click the Steps tab.
4) Double-click the Step Weight column of the step you want to modify.
5) Type a value for the weight of the step.
The higher the value you enter, the greater the importance of the step in the activity.
Based on the total weight for all steps in the activity, the percent for each step is
calculated and displayed in the Step Weight Percent column.
Notes
To change the weight of a step, double-click the Step Weight column and type
the new weight for the step.
Developing Projects
167
Select Physical as the percent complete type on the General tab of Activity
Details to calculate the percent for each weighted step.
Creating and Assigning Activity Step Templates
Activity step templates
Activity step templates enable you to define a group of steps common to multiple
activities, then assign the template to activities.
Your organization might have several activities that repeat within a project or across
projects. For example, every time you start a project, several specifications must be
written and approved. Developing a specification is a multi-step process that never
changes.
As an example, the “Write Specifications” activity could have the following steps:
1) Submit initial spec
2) Review initial spec
3) Revise initial spec
4) Final review
5) Final revision
These steps might apply to many or all “Write Specifications” activities in a project or
across all projects.
Rather than manually inputting these steps into each “Write Specifications” activity, you
can create an activity step template containing these steps (using P6 when connected
to a P6 EPPM database) and assign the template to each applicable activity at once.
If a commonly used step or set of steps have already been defined for an activity, you
can convert the steps to a template (using P6 when connected to a P6 EPPM database).
Create activity step templates manually (P6 Professional Only)
1) Choose Enterprise, Activity Step Templates.
2) In the upper grid, click Add.
3) In the Step Template Name field, enter a descriptive name for the template.
4) In the lower grid, click Add.
The Step Count field in the upper grid automatically updates the number of steps in
the template.
5) In the Step Name field, enter the name of the step.
6) In the Step Weight field, enter a step weight (at least 1.0).
The higher the value you enter, the greater the importance of the step in the activity.

P6 Professional User's Guide
168
Notes
You can add an unlimited number of templates. There is no limit on the number of
steps per template.
You can customize the bottom grid to display user-defined field columns in which
you can add step data such as dates and costs. Any user-defined field data you
enter in an activity step template is saved as part of the template.
Convert steps into an activity step template (P6 Professional Only)
You can convert existing step(s) into an activity step template rather than creating the
template manually.
1) In the Activity Table, select the activity that contains the step(s) you want to convert
to a template.
2) Display Activity Details.
3) In the Steps tab of Activity Details, ctrl-click to select the steps.
4) Right-click on the selected steps and choose Create Template.
5) In the Create Template dialog, enter a unique name for the template. You can also
add UDFs assigned to the selected steps to the activity step template.
The steps and their associated name, description, weight, and UDFs (if selected) are
added to the new template.
Notes
The Activity Step Templates dialog box does not open after you convert the steps
to a template. To view the template choose Enterprise, Activity Step Templates.
The module automatically updates step UDF information in activity step templates
when a step UDF is added, deleted, or modified in the User Defined Fields dialog
box.
Assign activity step templates to activities
You can assign one or more activity step templates to one or more activities.
1) In the Activities window, select the activity to which you want to assign an activity
step template.
To select multiple activities, use Ctrl-Click or Shift-Click.
2) Click on the Assign toolbar.
3) In the Assign Activity Step Templates dialog box, select the template you want to
assign to the selected activities.
You can Ctrl-Click to assign more than one template.
Developing Projects
169
4) Click Assign .
The steps, weights, descriptions, and UDFs contained in the template are loaded into
the Steps tab of Activity Details.
Tip
After assigning a step template to an activity, if necessary, you can modify the
steps on the Steps tab of Activity Details.
Assigning Notebooks to Activities
Assign notebooks to activities
1) Choose Project, Activities.
2) Select the activity to which you want to assign a note.
3) Display Activity Details, then click the Notebook tab.
To display the Notebook tab, click the Layout Options bar and choose Bottom Layout
Options. In the Available Tabs section, select Notebook, click , then click OK.
4) Click Add.
5) Select the notebook you want to assign.
To assign multiple notebooks, hold down the Ctrl key, then click each notebook you
want to assign.
6) Click the Assign button, then click the Close button.
7) Click Modify to type a description of the activity notebook in an HTML editor.
In the editor, you can format text, insert pictures and tables, copy and paste
information from other document files (while retaining formatting), and add
hyperlinks.
Global Change
Global change
The Global change feature enables you to make changes to all activities, resource
assignments, or project expenses, or a selected group of these items, at one time. You
can use Global change to edit existing values or assign new values. For example, you
can create a statement to assign resource assignments to a group of activities.
P6 Professional User's Guide
170
When you run Global change, data exclusively locked by another user does not change.
To obtain exclusive access, before opening the project, choose Exclusive in the Access
Mode section of the Open Project dialog box.
Notes
You must have access to the activities, resource assignments, and expenses to which
you want to make global changes. If your security profile does not enable you to
access all of these items, you will not be able to commit the changes you make.
If you manually plan future period resource/role allocation, changing data globally
may change or delete manual future period values.
How?
For activity resource assignments, globally changing the Planned Finish, Remaining
Finish, and Actual Start may cause manual future period values to change.
Manual future period values are deleted when you globally change the assigned
Curve, specify an Actual Finish date, or set the Budgeted or Planned and
Remaining Units or Units/Time (Labor, Non-Labor, or Material) to zero.
For activities, globally changing the Actual Start, Planned Finish, Planned or
Original Duration, Remaining Finish, or Remaining Duration may cause manual
future period values to change. Manual future period values are deleted when
you globally change the Duration Type to Fixed Units or Fixed Units/Time, specify
an Actual Finish date, or set the Budgeted or Planned Units/Time to zero.
Global change conditions
If statements control which project data changes. Then statements and Else statements
specify the changes to be made. You can define an unlimited number of If, Then, or Else
statements.
All global change specifications require at least one Then statement. If statements are
optional. A Then statement with no If statement is applied to all activities in the current
filter.
Multiple instances of global change specifications are not stored. When you choose
Tools, Global Change, the last set of conditions you specified are the only ones available.
If statements
If statements define the conditions used to make changes to project data. When you
define multiple If statements, link them by selecting All of the Following or Any of the
Following. When you select All of the Following, data changes only if all If statement
conditions are true. When you select Any of the Following, data changes if at least one
of the If statement conditions are true.
Developing Projects
171
Then statements
Then statements specify the changes to make to project data when the If conditions are
satisfied. Multiple Then statements are executed in the sequence you list them. If you
want to set the Parameter/Value equal to a user-entered number, the second
Parameter/Value field and the Operator field must be left blank.
Else statements
Else statements specify the changes to make to project data when the If conditions are
not met. To specify an Else statement, you must define at least one If statement. If you
want to set the Parameter/Value equal to a user-entered number, the second
Parameter/Value field and the Operator field must be left blank.
Change data globally
1) Choose Tools, Global Change.
2) Click New.
3) Select a Subject Area.
4) Type a name to identify the global change specification.
5) Define If, Then, Else and statements to specify the data you want to change.
Click Add to define additional If, Then, or Else statements.
6) Click Change.
7) To accept the changes, click Commit Changes; to cancel the global change and
return the data to its original state, click Cancel Changes.
Notes
If you manually plan future period resource/role allocation, changing data
globally may change or delete manual future period values.
How?
For activity resource assignments, globally changing the Planned Finish,
Remaining Finish, and Actual Start may cause manual future period values
to change. Manual future period values are deleted when you globally
change the assigned Curve, specify an Actual Finish date, or set the
Budgeted or Planned and Remaining Units or Units/Time (Labor, Non-Labor,
or Material) to zero.
For activities, globally changing the Actual Start, Planned Finish, Planned or
Original Duration, Remaining Finish, or Remaining Duration may cause
manual future period values to change. Manual future period values are
deleted when you globally change the Duration Type to Fixed Units or Fixed
Units/Time, specify an Actual Finish date, or set the Budgeted or Planned
Units/Time to zero.
P6 Professional User's Guide
172
You must have access to the activities to which you want to make global
changes. If your security profile does not enable you to access all the activities,
you will not be able to commit the changes you make.
When you type a value for duration or units in Parameter/Value fields (in Then and
Else statements), the value is entered into the database without being converted
to hours. So, for example, if you enter 2d, the value stored is 2 days, not 16 hours. If
you do not specify a unit when entering a value (for example, you enter 2 rather
than 2d), the time unit defaults to the time unit specified in user preferences (User
Preferences, Time Units tab).
When connected to a P6 Professional database: If you are applying a global
change to a unit or duration field, the Use the assigned calendar to specify the
number of work hours for each time period checkbox (on the Admin Preferences,
Time Periods tab) is ignored if set. Because it is ignored, the global change applies
the unit or duration value based on the Admin Preferences hours per time period
settings.
When connected to a P6 EPPM database: If you are applying a global change to
a unit or duration field, the Use the assigned calendar to specify the number of
work hours for each time period checkbox (set using the P6, Application
Settings) is ignored if set. Because it is ignored, the global change applies the
unit or duration value based on the Application Settings hours per time period
settings.
Add an If statement
An If statement defines conditions under which certain changes should be made to
project data. When the If statement is true, the changes specified in the Then statement
are applied. When the If statement is not true, the changes in the Else statement are
applied.
1) Choose Tools, Global Change.
2) Click New, or select an existing specification and click Modify.
3) In the topmost section of the Modify Global Change dialog box, select Activities,
Activity Resource Assignments, or Project Expenses for Subject Area.
4) Type a name to identify the Global change specification.
5) For Parameter, select to include All of the Following conditions in the If statement, Any
of the Following conditions in the statement, or a data item.
6) Select a statement criteria in the Is field.
7) Define a value for the specified parameter.
8) If necessary, define a high value for the specified parameter.
9) To define more than one If statement for this Global change session, click Add and
repeat steps 5 through 8.
Developing Projects
173
Add Then and Else statements
1) Choose Tools, Global Change.
2) Click New, or select an existing specification and click Modify.
3) Click in the Then section to define a Then statement and in the Else section to define
an Else statement.
4) Click Add.
5) In the Parameter field, select a data item.
6) In the Parameter/Value field, select a data item to use as the first parameter in the
statement. Select Custom to type a text or numeric value.
7) Select an operator to define an arithmetic equation to change numeric data.
Arithmetic operators can connect two data items, a data item and a number, or two
numbers.
8) Depending on the data items selected for the first parameter, either type a value in
the second Parameter/Value field, or select it from a predefined list.
If the first parameter requires a valued definition rather than a second parameter,
you can leave this field empty.
Note
You can define Then statements without defining either an If statement or an Else
statement. To define an Else statement, you must first define an If statement.
Edit a statement
1) Choose Tools, Global Change.
2) Select a global change specification, then click Modify.
3) Click in the If, Then, or Else sections of the Global Change dialog box.
4) Double-click the parameter, criteria, parameter/value, or operator you want to
change.
5) Type or select a new data item, condition, operator, or value.
Notes
Changing some parameters of an If, Then, or Else statement may affect the
operators and criteria available in the statement.
Changing the subject area of a specification will clear all existing If, Then, and Else
statements.
P6 Professional User's Guide
174
Rearrange Global change statements
Global change statements execute in the order they are presented in the Global
Change dialog box.
1) Select the statement you want to move.
2) Click the arrows in the Global Change dialog box to move a statement within the list
of defined statements.
Cut, copy, or paste a statement
1) Choose Tools, Global Change.
2) Select the global change specification you want to edit, then click Modify.
3) Select the statement you want to cut or copy, then click either Cut or Copy.
4) Click the section into which you want to paste the statement.
5) Click Paste.
The new statement is placed at the bottom of the list of statements.
Note
You cannot paste statements from the If section of the Global Change dialog box
into the Then or Else sections; however, you can cut or copy and paste between
the Then and Else sections.
Combine text fields
You can use Global Change to modify text data items such as activity IDs and names,
and activity codes by linking two text fields using the ampersand (&) operator. This is
called concatenation. The following statement adds the Location activity code value to
the Activity ID field, if a value is assigned to the activity:
Then: Activity ID = Activity ID & Location
Tip
Use a dash (-) or underscore (_) to represent spaces when concatenating data.
Use arithmetic with Global change
You can use mathematical equations to change numeric data such as quantities, costs,
and durations. Use addition, subtraction, multiplication, and division to calculate new
values. Click the Operator column to list the various operator symbols. Join text strings
with an ampersand (&) symbol.

Developing Projects
175
Arithmetic operators can link two data items, a data item and a number, or two numbers
that you enter. Use arithmetic operators in Then and Else statements to calculate new
values for a data item. Arithmetic operations are not used in If: statements; only
comparisons.

177
In This Section
Creating Baselines .................................................................................................. 177
Comparing Projects and Baselines ...................................................................... 186
Updating Projects ................................................................................................... 187
Store Period Performance ..................................................................................... 199
Creating and Using Reflections ............................................................................ 203
Working with remote projects ............................................................................... 207
Scheduling Projects ................................................................................................ 209
Leveling Resources ................................................................................................. 213
Adding and Assigning Issues ................................................................................. 216
Adding and Assigning Thresholds ......................................................................... 219
Adding and Assigning Risks (P6 Professional Only) ............................................. 222
Adding and Assigning Work Products and Documents .................................... 229
Creating Baselines
Baselines
Before you update a schedule for the first time, you should create a baseline plan. A
baseline is a complete copy of a project plan that you can compare to the current
schedule to evaluate progress. Within layouts, you can display baseline data in graphical
and column data format to perform cost and schedule analysis.
The simplest baseline plan is a complete copy, or snapshot, of the original schedule. This
snapshot provides a target against which you can track a project's cost, schedule, and
performance. When you create a baseline, you can save a copy of the current project
to use as the baseline or you can choose to convert another project in the EPS hierarchy
to a baseline for the current project.
You can save an unlimited number of baselines per project; however, the number of
baselines you can actually save per project is determined by administrative preference
settings, which are typically controlled by the administrator. Regardless of the number of
baselines you save for a project, at any given time you can select only up to three
baselines for comparison purposes.
The Baselines feature includes an option for you to specify which baselines you want to
use for comparison. The project-level baseline is used for project/activity usage
spreadsheets and profiles, as well as earned value calculations.
Managing Projects
P6 Professional User's Guide
178
When P6 Professional is connected to a P6 Professional database, you must have the Edit
Project Details Except Costs/Financials project privilege to set the project baseline.
When P6 Professional is connected to a P6 EPPM database, you must have the
appropriate project privilege as defined in P6 to set the project baseline.
You can assign primary, secondary, and tertiary baselines. If you do not select a baseline
to use, the current project is used by default. Using the administrative preference setting,
you can choose which values to use for earned value calculations, either budgeted or
planned or at completion.
To help categorize, or track, multiple baselines for a single project, you can assign each
baseline a type that reflects its purpose, for example, initial planning baseline, what-if
project baseline, or midproject baseline. The administrator defines the available baseline
types.
You can restore or update an original or copied baseproject controls coordinatorline.
Baselines do not exist as separate projects that you can access. To modify a baseline
project, you must first unlink it from its current project by restoring it as a separate project.
You can then work with this restored baseline project as you would any other project in
the EPS.
You can also automatically add new data from the current project to the baseline and
modify existing baseline data that has changed in the current project using the Update
Baseline feature.
Create a baseline
1) Open the projects for which you want to create a baseline.
2) Choose Project, Maintain Baselines, then, if more than one project is open, select the
projects for which you want to create a baseline.
If you want to copy the current project as a new baseline, you can select multiple
projects; a baseline will be created for all selected projects. If you want to convert
another project to a baseline, you can select only one project.
3) Click Add.
4) Choose to save a copy of the current project as a new baseline or convert another
project into a baseline of the current project, then click OK.
If you choose to convert another project, select the project in the Select Project
dialog box, then click the Select button.
Managing Projects
179
Tip
Before converting a project to a baseline, if you still want to have access to the
original project, you should make a copy of it. Once you convert a project to a
baseline, it is no longer available in the project hierarchy. You can restore a
baseline, making it available again as a separate project in the project hierarchy.
You can also update a baseline with new/modified data from the current project.
Notes
When you save a copy of the current project as a new baseline, the baseline title
uses the project name and a suffix of - Bx, where x equals 1 for the first baseline you
save for a project, 2 for the second, and so on. You can change the baseline
name.
When you choose to convert another project to a baseline, the project you want
to convert cannot be open or have baselines assigned to it. The converted
project's name is used as the baseline name.
Assign baselines to projects
You can assign a project baseline to use for summarization purposes and up to three
baselines to use for comparison purposes.
1) Choose Project, Assign Baselines.
2) In the Project field, select the project to which you want to assign baselines.
3) To set an existing baseline as the project, primary, secondary, or tertiary baseline,
select a baseline from the menu in the appropriate field.
To use the current state of the project as the project, primary, secondary, or tertiary
baseline, select the current project from the menu in the appropriate field.
Notes
You can only assign one project, primary, secondary, and tertiary baseline to a
project.
Secondary and tertiary baselines are not required.
When connected to a P6 Professional database: You must have the Edit Project
Details Except Costs/Financials project privilege to set the project baseline.
When connected to a P6 EPPM database: You must have the appropriate project
privilege as defined in P6 to set the project baseline.
Assign the baseline to use for summarization or earned value
To choose which baseline to use for summarizing a project, open the project for which
you want to select a project baseline.
1) Choose Project, Assign Baselines.
2) In the Project field, select the project to which you want to assign a project baseline.
P6 Professional User's Guide
180
3) In the Project Baseline field, select the desired baseline or the current project. If no
baseline is designated as active, the current project is used as the baseline project.
Note: You can assign only one project baseline to a project. You
must have the appropriate security privileges to select the project
baseline.
Assign the baselines to use for the current project
Use the Assign Baselines dialog box to choose the primary baseline for a project. Open
the projects for which you want to select a baseline.
1) Choose Project, Assign Baselines.
2) In the Project field, select the project to which you want to assign a primary baseline.
3) Select an existing baseline in the Primary field to use an existing baseline as the
primary baseline.
Note:
If you do not select a value for the primary baseline, the current
project is used as the primary baseline.
Assign baselines for comparison
1) Choose Project, Assign Baselines.
2) In the Project field, select the project to which you want to assign baselines.
3) In the Secondary and Tertiary fields, select an existing baseline of the current project.
Note: The Current Project is automatically used as the Primary
baseline; thus, it does not have to be set.
Comparing Current and Baseline Schedules
After a project is updated, you can quickly evaluate progress and performance
onscreen. Use a layout that shows current and baseline bars to identify tasks that start or
finish later than planned. In the list of activities, include columns for the planned value,
actual costs to date, and earned value to identify tasks that are behind schedule or over
budget. For detailed reporting, create schedule and activity matrix reports and resource
and cost graphics. Run the Earned Value report to analyze cost and schedule variance
using the project or primary baseline. Displaying baseline and current bars in the Gantt
Chart indicates how the schedule is progressing according to the original plan.
Managing Projects
181
A target comparison makes it easy to see variances between the current and baseline
dates. Add columns in the Activity Table for almost any data item from the baseline
project. Display activity bars that represent baseline dates. You can display target and
variance data on the activity bars.
Note: When the current project is open, you can view, but not
change, baseline data. To modify the baseline, you must first
restore it as a separate project. You can also update baseline
project data using the Update Baseline utility.
Setting preferences for baseline values
Choose to calculate the earned value from the Budgeted (or Planned) or At Completion
values of the project or primary baseline. For example, based on the settings chosen, you
can add the budgeted, original, or planned duration to the BL Start date to calculate
the BL Finish date, or you can use the duration at completion to calculate the actual
baseline finish date.
To choose the type of baseline you want to use to calculate earned value,
1) In the Projects window, select a project.
2) On the Projects Details, Settings tab, choose to calculate earned value using the
project baseline or the baseline you have defined as your primary baseline.
To specify how earned value is calculated,
1) Choose Admin, Admin Preferences.
2) On the Earned Value tab, in the Earned Value Calculation section, choose to
calculate earned value using At Completion values with current dates, Budgeted,
Original, or Planned values with current dates, or Budgeted, Original, or Planned
values with planned dates.
Note: When P6 Professional is connected to P6 EPPM database,
preferences for baseline values are set in P6.
Copy a baseline
As a project progresses, you may want to update the project's baseline, or restore the
project's baseline and modify it to capture changes to the original schedule. When you
update or restore a baseline, the baseline's original state is not preserved. To preserve the
baseline's original state, you can copy the baseline, then update or restore the baseline
copy, rather than updating or restoring the original baseline. When you copy a baseline,
a new copy of the original baseline is copied under the same project.
1) Choose Project, Maintain Baselines.
2) In the Maintain Baselines dialog box, select the baseline you want to copy.
3) Click Copy.
P6 Professional User's Guide
182
Tips
When you copy a baseline, the Last Update Date field of the Maintain Baselines
dialog box displays the same date and time as the original (copied) baseline.
Baselines can not be copied between projects. When you copy a baseline, the
copied baseline is placed under the same project as the original baseline.
When you copy a baseline, the copied baseline exists as a separate baseline,
subject to the same rules as original baselines. For example, after you copy a
baseline, you can delete, update, restore, or assign it as the project, primary,
secondary, or tertiary baseline.
Note
When connected to a P6 Professional database: You must have the project
privilege Maintain Project Baselines to copy a baseline.
When connected to a P6 EPPM database: You must have the appropriate project
privilege assigned using P6 to copy a baseline.
When you copy a baseline, the copied baseline title uses the project name and a suffix
of - Bx, where x equals 1 for the first baseline you save for a project, 2 for the second, and
so on. You can change the baseline name.
Update a baseline
As a project progresses, you may want to update baseline data without restoring the
baseline or creating a new baseline. When a project is in progress, creating a new
baseline may not yield accurate comparison results. When you update a baseline, only
the data types you select will be updated.
1) Choose Project, Maintain Baselines.
2) In the Maintain Baselines dialog box, select the baseline you want to update.
3) Click Update.
4) In the Update Baseline dialog box, select the types of data you want to update.
For project-level data, you can choose to update project details, work products and
documents, and risks, issues, and thresholds. You do not have to select any of these
options.
Note: If you choose to update project details, the following items are NOT updated:
all data in the Default, Settings, and Resources tabs; the Risk Level and the Project
Leveling Priority fields in the General tab; and, the Default Price/Unit for Activities
Without Resource or Role Price/Units field in the Calculations tab.
For activity-level data, you can choose to update all activities or activities that meet
a filter's criteria. If you choose to update activities based on a filter, click the browse
button to select a filter. If you choose to update all activities, the module overwrites all
activities in the baseline.
Managing Projects
183
You can also choose to add new activities to the baseline, delete activities from the
baseline that are no longer in the project, and update existing activities with new
activity data. If you only want to update project-level data (and not activity-level
data), clear all of the activity-level data options.
5) If you are updating existing activity data, click Update Options.
6) In the Update Baseline Options dialog box, select the types of activity and
resource/role assignment data you want to update.
Note: If you choose to update 'Dates, durations, and data date' in the Update
Baseline Options dialog box, the following date fields are NOT updated because they
are calculated by the scheduler: Early Start, Early Finish, Late Start, and Late Finish. To
ensure that these fields are updated, after you run the baseline update, you should
restore the baseline project, then schedule and re-baseline the project.
7) Click OK.
8) In the Update Baseline dialog box, you can enter or select a filename to log errors
during the update process.
9) Click Update.
Tips
If you encounter errors during the Update Baseline process, schedule the project
to the current data date, then run Update Baseline again. This may resolve some
errors that can occur when updating a baseline.
When you update a baseline, the module stores the date on which the baseline
was last updated. You can view this date in the Last Update Date field of the
Maintain Baselines dialog box. The module does not consider the last update date
when you choose the Ignore Last Update Date option in the Update Baseline
dialog box. We recommend that you select the Ignore Last Update Date option if
you plan to update different data types at different times (i.e., you will not simply
be updating all baseline data each time). If you do not select this option, some
data types may not be updated from the correct date when you run the baseline
update. For example:
- On June 1st, you run a baseline update that includes activity steps.
- On June 8th, you run a baseline update that does NOT include activity steps.
- On June 15th, you run a baseline update that includes activity steps. You do not
select the Ignore Last Update Date option.
Given this scenario, when you run the baseline update on June 15th, activity steps
are only updated from June 8th because the baseline is updated from the last
update date. If you select the Ignore Last Update Date option, all changes to
activity steps are updated regardless of the date the baseline was last updated.
P6 Professional User's Guide
184
To overwrite all activity data, choose All Activities and all of the activity data
options.
If you only want to update project-level data, select the project data options and
clear the add new, delete, and update activity options. If you clear these activity
data options, it does not matter if All Activities or Activities Within the Following
Filter is selected - no activity data will be updated.
To optimize baseline update performance, select the Run Optimized option in the
Update Baseline dialog box. If errors occur when updating a baseline in optimized
mode, you will not be able to determine the data item that is causing the update
to fail. To determine the data item causing the failure, turn off the Run Optimized
option and rerun the baseline update. After the update is complete, refer to the
log file to determine which data item is causing the update to fail.
Baseline update performance is further optimized when you log in as an Admin
Superuser.
For large projects, you may need to increase the Java VM memory size to
successfully update the project's baselines. To increase the Java VM memory size
on a Windows operating system, click Start, Run. Type regedit, then click OK.
Navigate to the following location:
HKEY_LOCAL_MACHINE/SOFTWARE/Primavera/Shared/Update Baseline.
Double-click Parameters. At the beginning of the Value Data field, enter
-Xmx512m. Be sure to leave a space after the last 'm'. Click OK.
Notes
When connected to a P6 Professional database: You must have the project
privilege Maintain Project Baselines to update a baseline. Additionally, We
recommend that you have all project and global view, create, edit, and delete
privileges (for example, View Project Costs/ Financials, Add/Edit/Delete Work
Products and Documents, etc.) before running a baseline update. If you do not
have these privileges, you may receive an error message when you attempt to
update the baseline.
When connected to a P6 EPPM database: You must have the appropriate global
and project privileges as defined in P6 to update a baseline.
A project's baselines cannot be updated if the project has been opened in
Exclusive mode or if the project is currently checked out by another user.
Baselines that contain future period buckets on resource or role assignments are
updated automatically.
If errors occur while the project is updating, the module logs the errors in the
specified log file (if the Run Optimized option is not selected) and continues
updating the project.
New or modified Primary Resource assignments are always updated for an activity
if you choose to update 'General activity information' in the Update Baseline
Options dialog, even if you do not choose the 'Update existing resource and role
assignments' and 'Add new resource and role assignments' options in the Update
Options dialog.
Managing Projects
185
If you choose to update activity relationships, only relationships between activities
within the project are updated; relationships to activities in external projects are
not updated.
Project calendars, activity codes, and the WBS are always updated.
If you choose to update issues or work products and documents but not activities,
the new issues or work products and documents are added without activity
assignments.
If you choose to update activities that fall within a filter and choose to add new
activities, only activities that meet that filter's criteria will be added.
Modify a baseline manually
As a project progresses and changes occur, you may want to modify one, or more, of
the baselines associated with it. You cannot access and modify a baseline as you would
a project. To modify a baseline manually, you must restore it to the project hierarchy,
which makes it available again as a separate project in which you can update data.
To restore a baseline for the open project
1) Choose Project, Maintain Baselines.
2) Select the baseline you want to restore, click Restore, then click Yes.
The restored project is placed in the same node as the project to which it was linked
as a baseline.
Tips
After you modify the restored baseline project, you can recreate it as a baseline
for comparison against the current project.
You can also automatically update a baseline with new and/or modified data
from the current project without restoring the baseline. You should use this option
when you want to globally update a type of project, activity, or resource/role
assignment data, such as activity steps or project issues, and thresholds.
Note
When a baseline contains relationships to non-baseline projects, these
relationships are maintained and copied when a baseline is restored. This could
result in duplicate relationships if both projects in the original relationship are
non-baseline projects. If one side of the relationship is from a baseline, no copy
can take place.
Delete a baseline
1) Choose Project, Maintain Baselines.
Select the baseline you want to delete, click Delete, then click Yes.
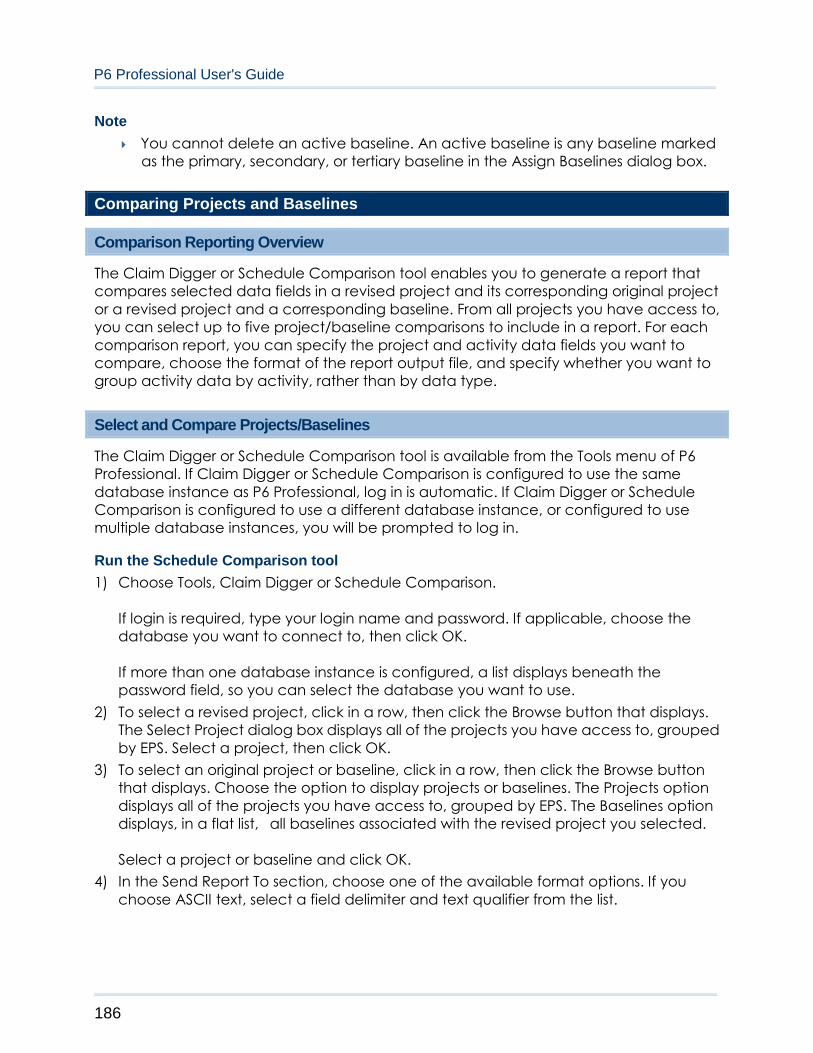
P6 Professional User's Guide
186
Note
You cannot delete an active baseline. An active baseline is any baseline marked
as the primary, secondary, or tertiary baseline in the Assign Baselines dialog box.
Comparing Projects and Baselines
Comparison Reporting Overview
The Claim Digger or Schedule Comparison tool enables you to generate a report that
compares selected data fields in a revised project and its corresponding original project
or a revised project and a corresponding baseline. From all projects you have access to,
you can select up to five project/baseline comparisons to include in a report. For each
comparison report, you can specify the project and activity data fields you want to
compare, choose the format of the report output file, and specify whether you want to
group activity data by activity, rather than by data type.
Select and Compare Projects/Baselines
The Claim Digger or Schedule Comparison tool is available from the Tools menu of P6
Professional. If Claim Digger or Schedule Comparison is configured to use the same
database instance as P6 Professional, log in is automatic. If Claim Digger or Schedule
Comparison is configured to use a different database instance, or configured to use
multiple database instances, you will be prompted to log in.
Run the Schedule Comparison tool
1) Choose Tools, Claim Digger or Schedule Comparison.
If login is required, type your login name and password. If applicable, choose the
database you want to connect to, then click OK.
If more than one database instance is configured, a list displays beneath the
password field, so you can select the database you want to use.
2) To select a revised project, click in a row, then click the Browse button that displays.
The Select Project dialog box displays all of the projects you have access to, grouped
by EPS. Select a project, then click OK.
3) To select an original project or baseline, click in a row, then click the Browse button
that displays. Choose the option to display projects or baselines. The Projects option
displays all of the projects you have access to, grouped by EPS. The Baselines option
displays, in a flat list, all baselines associated with the revised project you selected.
Select a project or baseline and click OK.
4) In the Send Report To section, choose one of the available format options. If you
choose ASCII text, select a field delimiter and text qualifier from the list.
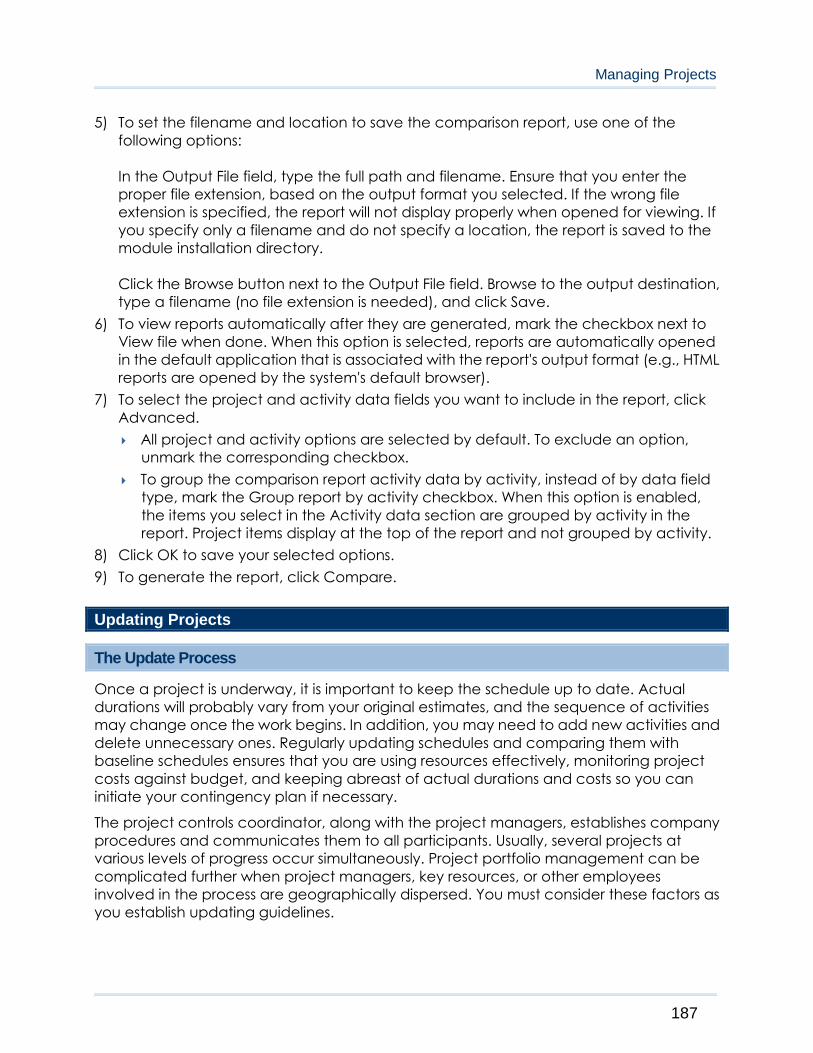
Managing Projects
187
5) To set the filename and location to save the comparison report, use one of the
following options:
In the Output File field, type the full path and filename. Ensure that you enter the
proper file extension, based on the output format you selected. If the wrong file
extension is specified, the report will not display properly when opened for viewing. If
you specify only a filename and do not specify a location, the report is saved to the
module installation directory.
Click the Browse button next to the Output File field. Browse to the output destination,
type a filename (no file extension is needed), and click Save.
6) To view reports automatically after they are generated, mark the checkbox next to
View file when done. When this option is selected, reports are automatically opened
in the default application that is associated with the report's output format (e.g., HTML
reports are opened by the system's default browser).
7) To select the project and activity data fields you want to include in the report, click
Advanced.
All project and activity options are selected by default. To exclude an option,
unmark the corresponding checkbox.
To group the comparison report activity data by activity, instead of by data field
type, mark the Group report by activity checkbox. When this option is enabled,
the items you select in the Activity data section are grouped by activity in the
report. Project items display at the top of the report and not grouped by activity.
8) Click OK to save your selected options.
9) To generate the report, click Compare.
Updating Projects
The Update Process
Once a project is underway, it is important to keep the schedule up to date. Actual
durations will probably vary from your original estimates, and the sequence of activities
may change once the work begins. In addition, you may need to add new activities and
delete unnecessary ones. Regularly updating schedules and comparing them with
baseline schedules ensures that you are using resources effectively, monitoring project
costs against budget, and keeping abreast of actual durations and costs so you can
initiate your contingency plan if necessary.
The project controls coordinator, along with the project managers, establishes company
procedures and communicates them to all participants. Usually, several projects at
various levels of progress occur simultaneously. Project portfolio management can be
complicated further when project managers, key resources, or other employees
involved in the process are geographically dispersed. You must consider these factors as
you establish updating guidelines.

P6 Professional User's Guide
188
To help develop procedures, ask questions such as these:
What data need to be assembled for the update and what methods will be used to
collect the data?
How often should projects be updated?
Are resources local or offsite?
On which project teams are resources participating?
Who on each team will be gathering the information used for the project update?
Who needs to see the results of the update and when do they need to see them?
What types of information need to be generated after each update to
communicate progress before the next update?
The answers to these questions help determine how you will use the module to update
projects.
Identify the types of data to collect
The data to collect may depend on whether you are updating activities or individual
resource assignments. You can update activities by simply recording actual dates and a
remaining duration. For resource assignments, enter the actual hours to date and the
hours remaining. The module can also estimate progress automatically.
Determine how data will be collected
When connected to a P6 EPPM database: Will you automatically collect timesheet entry
data for each employee from the Progress Reporter module? Does your organization
need to collect status from project team members who are not assigned resources or
Progress Reporter users?
Will you import data from other systems supported by your company, such as an
accounting system? Or will updates be handwritten on printouts of the schedule
distributed to project participants, collected weekly by the project manager or team
leader, and entered in the module?
If you answered Yes to one or more of these questions, your update process will probably
involve more than one procedure—all handled equally well by the module.
Determine how often data should be updated
Depending on how quickly your projects change, you may want to update monthly,
weekly, or even daily. Although no rules exist for update frequency, consider these
general guidelines: if your projects never seem to be accurate, you are not updating
often enough, or the scope of your activities is too broad—you should divide activities
into smaller ones. If you spend too much time updating, you’re updating too often, or the
scope of your activities is too narrow.
Analyze and communicate data
Recording progress in the module is only the beginning of the update process; after you
produce an updated schedule, you need to analyze the results.
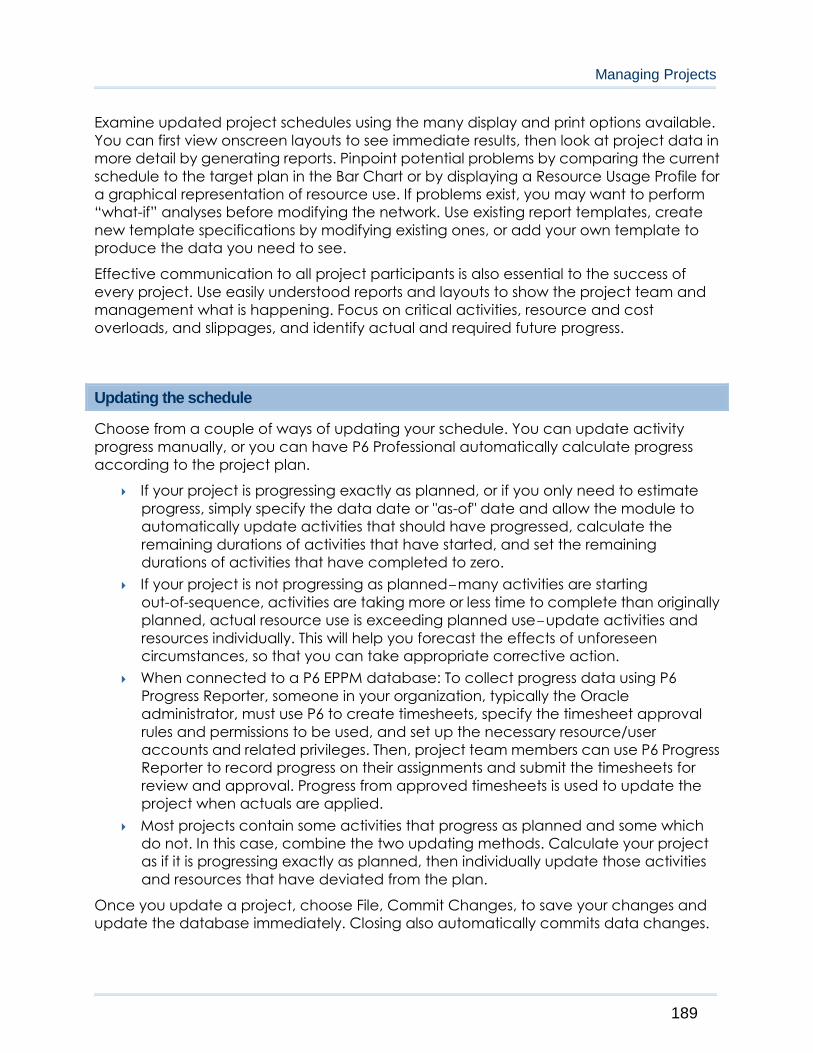
Managing Projects
189
Examine updated project schedules using the many display and print options available.
You can first view onscreen layouts to see immediate results, then look at project data in
more detail by generating reports. Pinpoint potential problems by comparing the current
schedule to the target plan in the Bar Chart or by displaying a Resource Usage Profile for
a graphical representation of resource use. If problems exist, you may want to perform
“what-if” analyses before modifying the network. Use existing report templates, create
new template specifications by modifying existing ones, or add your own template to
produce the data you need to see.
Effective communication to all project participants is also essential to the success of
every project. Use easily understood reports and layouts to show the project team and
management what is happening. Focus on critical activities, resource and cost
overloads, and slippages, and identify actual and required future progress.
Updating the schedule
Choose from a couple of ways of updating your schedule. You can update activity
progress manually, or you can have P6 Professional automatically calculate progress
according to the project plan.
If your project is progressing exactly as planned, or if you only need to estimate
progress, simply specify the data date or "as-of" date and allow the module to
automatically update activities that should have progressed, calculate the
remaining durations of activities that have started, and set the remaining
durations of activities that have completed to zero.
If your project is not progressing as planned many activities are starting
out-of-sequence, activities are taking more or less time to complete than originally
planned, actual resource use is exceeding planned use update activities and
resources individually. This will help you forecast the effects of unforeseen
circumstances, so that you can take appropriate corrective action.
When connected to a P6 EPPM database: To collect progress data using P6
Progress Reporter, someone in your organization, typically the Oracle
administrator, must use P6 to create timesheets, specify the timesheet approval
rules and permissions to be used, and set up the necessary resource/user
accounts and related privileges. Then, project team members can use P6 Progress
Reporter to record progress on their assignments and submit the timesheets for
review and approval. Progress from approved timesheets is used to update the
project when actuals are applied.
Most projects contain some activities that progress as planned and some which
do not. In this case, combine the two updating methods. Calculate your project
as if it is progressing exactly as planned, then individually update those activities
and resources that have deviated from the plan.
Once you update a project, choose File, Commit Changes, to save your changes and
update the database immediately. Closing also automatically commits data changes.
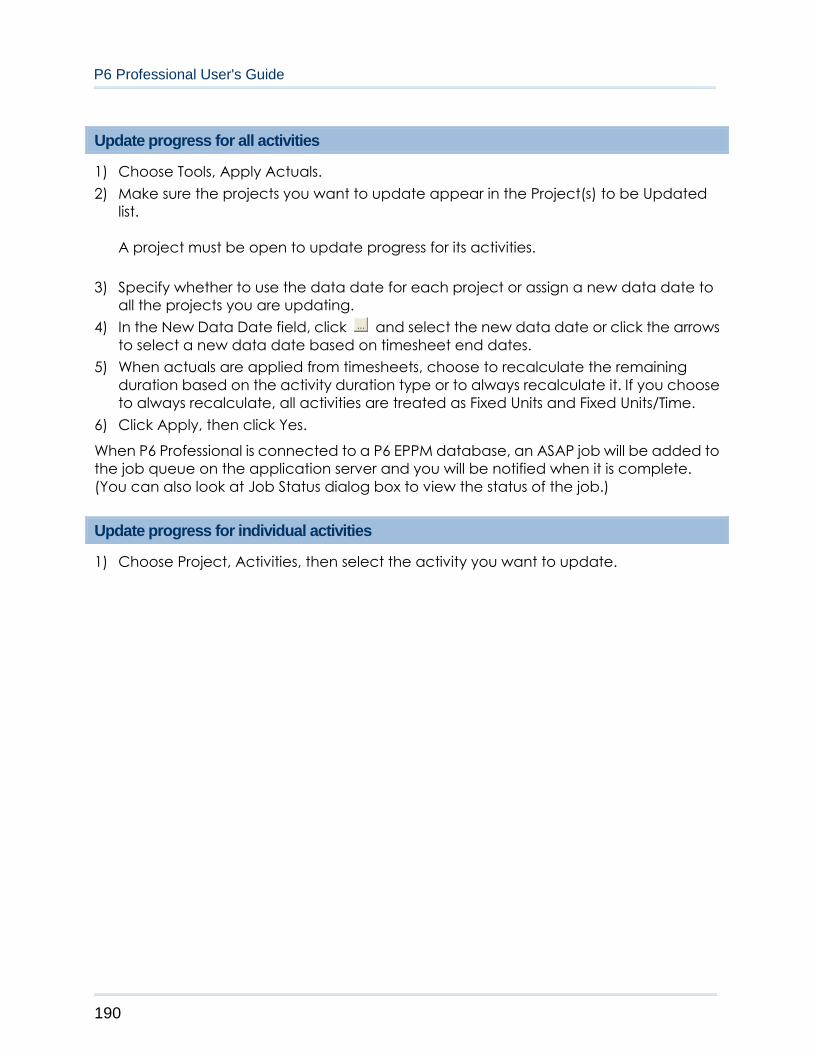
P6 Professional User's Guide
190
Update progress for all activities
1) Choose Tools, Apply Actuals.
2) Make sure the projects you want to update appear in the Project(s) to be Updated
list.
A project must be open to update progress for its activities.
3) Specify whether to use the data date for each project or assign a new data date to
all the projects you are updating.
4) In the New Data Date field, click and select the new data date or click the arrows
to select a new data date based on timesheet end dates.
5) When actuals are applied from timesheets, choose to recalculate the remaining
duration based on the activity duration type or to always recalculate it. If you choose
to always recalculate, all activities are treated as Fixed Units and Fixed Units/Time.
6) Click Apply, then click Yes.
When P6 Professional is connected to a P6 EPPM database, an ASAP job will be added to
the job queue on the application server and you will be notified when it is complete.
(You can also look at Job Status dialog box to view the status of the job.)
Update progress for individual activities
1) Choose Project, Activities, then select the activity you want to update.

Managing Projects
191
2) Display Activity Details, then click the Status tab.
To update actual dates, mark the Started checkbox, then specify the actual start
date in the Started field. If the activity is complete, mark the Finished checkbox, then
specify the actual finish date in the Finished field.
-Or-
To update activities with Duration percent complete type, click the Remaining field
and type the remaining number of workperiods needed to complete the selected
activity. When you schedule or apply actuals, the actual duration is calculated as the
total working time from the actual start date to the current data date (for in-progress
activities) or to the actual finish date (for completed activities), using the activity’s
calendar.
-Or-
To update activities with Physical percent complete type, type the physical percent
complete and the remaining duration for the activity. If resources are assigned, you
must also update each resource’s actual regular units.
3) Repeat the previous steps for each activity you want to update.
Tips
To automatically update actual units and costs when Duration percent complete
is updated, you must mark the checkbox to Recalculate Actual Units and Cost
when Duration % Complete Changes in the Calculations tab of Project Details.
If you manually plan future period resource/role distribution in the Resource Usage
Spreadsheet, the module updates progress for individual activities based on the
manual values you enter for assignments. How?
If you update activity progress by modifying Duration % Complete or
Remaining Duration on the activity, the activity's actual units are updated
using the manual remaining unit distribution when you apply actuals, as
long as the project option 'Recalculate Actual Units and Cost when
duration percent complete changes' (Project Details, Calculations tab) is
marked.
If you update activity progress by modifying the Remaining Units or
Remaining Early Finish on the assignment, the activity's actual units are
updated using the manual planned or budgeted unit distribution when you
apply actuals, as long as the project option 'Recalculate Actual Units and
Cost when duration percent complete changes' (Project Details,
Calculations tab) is marked.
P6 Professional User's Guide
192
If you update activity progress by modifying the Actual Units on the activity
or assignment, manual future period planned or budgeted and remaining
unit values are not updated when you apply actuals.
Progress Spotlight
The Progress Spotlight feature highlights the activities that should have started or finished
during a specified timeperiod. To access this feature, choose View, Progress Spotlight, or
click on the Tools toolbar. You can also drag the data date line until you reach the
new date you want. P6 Professional highlights the activities that fall between the last
data date and the new data date. If you have multiple projects open, P6 Professional
uses the data date of the default project (Project, Set Default Project) as the start of the
highlighted timeperiod. P6 Professional automatically uses the date interval you are
showing for the timescale to select the new data date. For example, if the minimum date
interval for the timescale is set to Day, the new data date will be the next day. Once you
spotlight activities, you can automatically status them or manually update them.
To make it easier to use Progress Spotlight, set up your timescale so that the smallest
increment is equal to your update periods. That way, when you turn this feature on, the
highlighted curtain will indicate the update period immediately and eliminate the
necessity of adjusting the data date. For example, if you update weekly, set the
timescale to weekly increments; right-click on the Gantt Chart and select Timescale, and
select a weekly Date Interval.
When you spotlight activities by dragging the data date line or by using the Progress
Spotlight feature, P6 Professional turns off automatic scheduling. Choose Tools, Schedule,
or press F9 to reschedule after you finish updating; P6 Professional recalculates the
schedule and turns automatic scheduling back on.
Update progress for spotlighted activities
Use the Progress Spotlight feature (View, Progress Spotlight) to highlight activities in the
layout that have started, progressed, or finished between the previous data date and
the new data date. If you have the project privileges required to schedule projects, level
resources, and apply actuals, you can status the activities that have been highlighted.
To update the progress of these activities:
1) Choose Tools, Update Progress.
2) If you do not want to use the current data date to update progress, select a new
data date.
3) Choose to update all highlighted activities in the Gantt Chart, or to update the
activities that have been selected.
4) When actuals are applied from timesheets, choose to recalculate the remaining
duration based on the activity duration type or to always recalculate it. If you choose
to always recalculate, all activities are treated as Fixed Units and Fixed Units/Time.
5) Click Apply.
Managing Projects
193
Note
If you manually plan future period resource/role distribution, updating progress for
spotlighted activities can affect remaining unit values in manual future period
buckets.
How? If you use Progress Spotlight to update activity progress, actuals are applied
using the specified manual planned or budgeted unit distribution; the manual
remaining unit distribution is not considered, even if no manual. planned or
budgeted unit data exists for an assignment. When the planned or budgeted and
remaining unit values are different for an assignment, the planned or budgeted
unit values overwrite the existing remaining unit values when you apply actuals.
Estimate progress automatically
If you want to estimate progress as if activities are proceeding on schedule, you can
automatically calculate actual data based on activity, resource, and/or expense data.
Estimating activity progress is a quick and convenient way to update your project. The
module estimates progress only for those activities that were supposed to take place.
Since progress can occur out of sequence, you may need to update additional
activities.
Set Auto Compute Actuals by activity
1) Choose Project, Activities.
2) Open a layout that contains the activities you want to automatically update.
3) Add a column for the Auto Compute Actuals option.
4) Mark the checkbox next to each activity.
Note: When connected to a P6 EPPM database, you should not
automatically compute actuals for those activities from which you
are collecting timesheet data from the Progress Reporter modules;
otherwise, your timesheet data are overwritten when you apply
actuals.
Set Auto Compute Actuals by resource
1) Choose Enterprise, Resources.
2) Select the resource that you want to automatically update when actuals are
applied.
3) Click the Details tab and mark Auto Compute Actuals.
P6 Professional User's Guide
194
Note: When connected to a P6 EPPM database, you cannot
automatically computer actuals for those resources from which
you are collecting timesheet data from the Progress Reporter
module. If you choose to disable the timesheet usage, your
timesheet data are overwritten when you apply actuals.
Tip
Setting the Auto Compute Actuals option to ON for an activity automatically updates
actual and remaining units/costs for all resources/expenses assigned to the activity,
regardless of whether the individual resources/expenses have the Auto Compute
Actuals options set to ON. If you don't want to update all assignments, turn OFF the
activity's Auto Compute Actuals option and turn it ON only for those resources/expenses
you want updated automatically. For example, you may be collecting actual data from
some, but not all, resources through the Progress Reporter module. For those resources
from which you are collecting actual data, turn OFF the activity- and resource-level Auto
Computer Actuals option, and turn it ON for those resources not reporting data through
the Progress Reporter module.
Highlight activities for updating
You can highlight activities in the layout that are scheduled to occur during a specific
timeperiod. Then, you can choose to manually or automatically update the activities.
1) With the Activities window active, choose View, Progress Spotlight, or click on the
Tools toolbar to add a timeperiod equal to the smallest increment of the displayed
timescale from the previous data date.
P6 Professional spotlights activities that should have started, progressed, or finished
between the previous data date and the new data date in the Gantt Chart.
To increase/decrease the area between the previous data date and the new date
by one or more timescale increments, drag the data date line in the Gantt Chart.
2) Automatically or manually update the highlighted activities, or immediately
reschedule the project according to the new data date by pressing F9.
Notes
If multiple projects are open, P6 Professional will highlight activities from the data
date of the default project (Project, Set Default Project).
Unlike selected activities, when Progress Spotlight is active, activities remain
spotlighted even when you click in another area of the layout.
Update progress for the project
1) Choose Tools, Apply Actuals.
Managing Projects
195
2) Make sure the projects you want to update appear in the Project(s) to be Updated
list.
3) Specify whether to use the data date for each project, or assign a new data date to
all the projects you are updating.
4) In the New Data Date field, specify a new data date for the projects, then click
Apply.
5) Choose Project, Activities, then select the activity you want to update.
6) Display Activity Details, then click the Status tab.
7) Mark the Started checkbox to indicate that the activity started early or mark the
Finished checkbox to indicate that the activity completed early.
If the activity was supposed to start during the update period but did not, clear the
Started checkbox.
If the activity was supposed to finish during the update period but did not, clear the
Finished checkbox.
8) In Activity Details, adjust any activity information, such as Expected Finish or
Remaining Duration, that did not progress according to plan.
When you add an Expected Finish date, the calendar defaults to the date and time
of the activity's Early Finish date.
When you edit an Expected Finish date, the calendar defaults to the date and time
that is currently in the Exp Finish field.
Remove progress from an activity
1) Choose Project, Activities, then select the activity.
2) Display Activity Details, then click the Status tab.
3) Clear the Started and/or Finished checkboxes.
Notes
P6 Professional will calculate the durations and remaining units based on the Link
Budget and At Completion for Not Started Activities setting in the Project Details,
Calculations tab.
If you remove progress from an activity by clearing the Started checkbox, all past
period actual data stored for that activity is deleted (except earned value units
and cost and planned value units and cost).
In the Activities window, you can also display the Activity Status column in which
you can edit activity status.
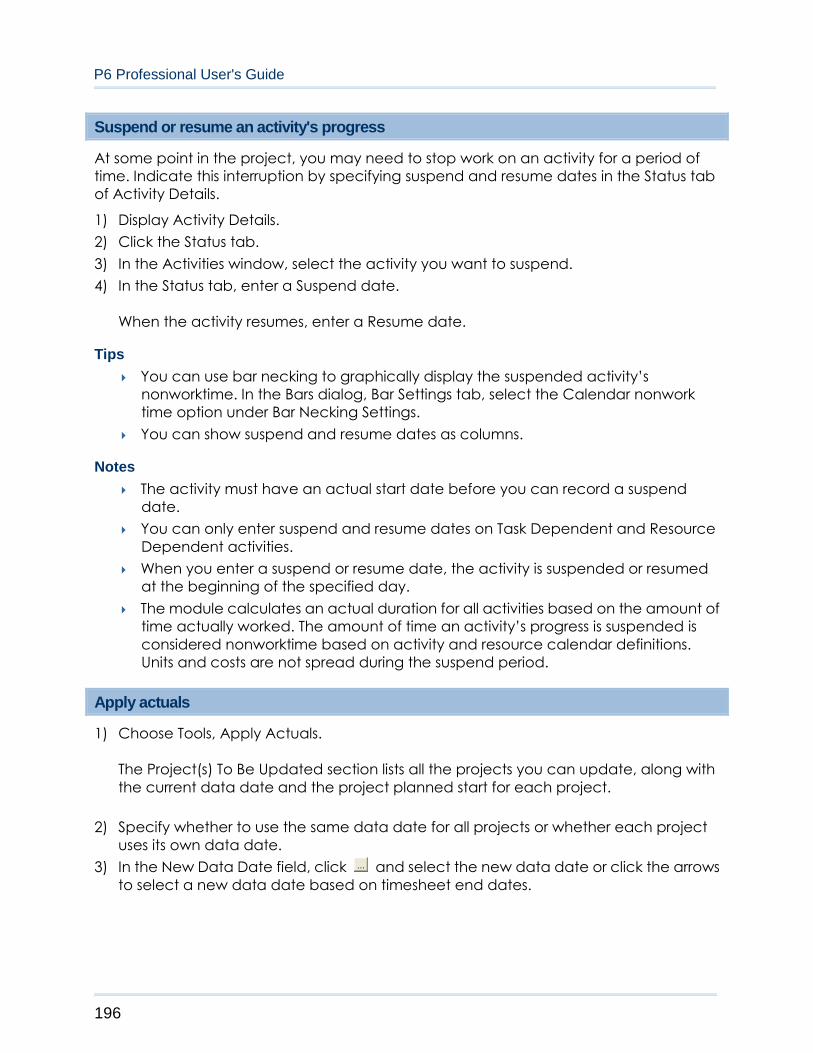
P6 Professional User's Guide
196
Suspend or resume an activity's progress
At some point in the project, you may need to stop work on an activity for a period of
time. Indicate this interruption by specifying suspend and resume dates in the Status tab
of Activity Details.
1) Display Activity Details.
2) Click the Status tab.
3) In the Activities window, select the activity you want to suspend.
4) In the Status tab, enter a Suspend date.
When the activity resumes, enter a Resume date.
Tips
You can use bar necking to graphically display the suspended activity’s
nonworktime. In the Bars dialog, Bar Settings tab, select the Calendar nonwork
time option under Bar Necking Settings.
You can show suspend and resume dates as columns.
Notes
The activity must have an actual start date before you can record a suspend
date.
You can only enter suspend and resume dates on Task Dependent and Resource
Dependent activities.
When you enter a suspend or resume date, the activity is suspended or resumed
at the beginning of the specified day.
The module calculates an actual duration for all activities based on the amount of
time actually worked. The amount of time an activity’s progress is suspended is
considered nonworktime based on activity and resource calendar definitions.
Units and costs are not spread during the suspend period.
Apply actuals
1) Choose Tools, Apply Actuals.
The Project(s) To Be Updated section lists all the projects you can update, along with
the current data date and the project planned start for each project.
2) Specify whether to use the same data date for all projects or whether each project
uses its own data date.
3) In the New Data Date field, click and select the new data date or click the arrows
to select a new data date based on timesheet end dates.

Managing Projects
197
4) Specify whether to recalculate the remaining duration based on the activity duration
type or to always recalculate. If you choose to always recalculate, all activities are
treated as Fixed Units and Fixed Units/Time.
5) Click Apply.
When connected to a P6 EPPM database: The job is now sent to a queue and run as
an ASAP service. Because the job is not run locally from P6 Professional, there might
be a time lag before it is processed. The status of your job, such as pending, failed,
running, or completed, appears in the Last Job Request field in the status bar of your
screen. You can also click Tools, Job Status to display the Job Status dialog box for
details about the status of jobs. Finally, a message appears in the taskbar, along with
the Oracle icon, when the job completes successfully or if it fails to complete
successfully. The message appears for ten seconds and displays the internal job name
of the job. After ten seconds only the Oracle icon continues to appear, and you can
click it to view the message. Use P6 to view the log file.
6) When connected to a P6 EPPM database: When the job completes successfully,
press F5 to refresh open windows with the latest data.
Tips
To calculate activity, resource, and expense actuals according to the project
plan, rather than hours, units, and completion percentages reported by resources,
mark the Auto Compute Actuals checkbox for each resource (in the Details tab of
Resource Details) or nonresource cost (in the Expenses tab of Activity Details).
To use resource curves or manual future period values when applying actuals,
mark the Auto Compute Actuals checkbox for each resource (on the Details tab
of Resource Details). See the Updating projects section of the Future period
bucket planning FAQ for detailed information to consider when applying actuals
for assignments with manual future period values.
When connected to a P6 Professional database: You can set up a job service to
apply actuals to your projects at a specified time.
When connected to a P6 EPPM database: You can use P6 to apply actuals to your
projects as a recurring job that runs at a specified time.
If submitted or resubmitted timesheets exist that have not been approved when
you apply actuals for a project, you are prompted to review the timesheets. Click
Yes if you want to review the timesheets; click No if you want to skip the
unapproved timesheets and apply actuals.
When connected to a P6 EPPM database: The Last Job Request field in the status
bar of your screen displays the status of the last job request that you submitted
during this work session. So if you submit two jobs, only the status of the last request
appears.
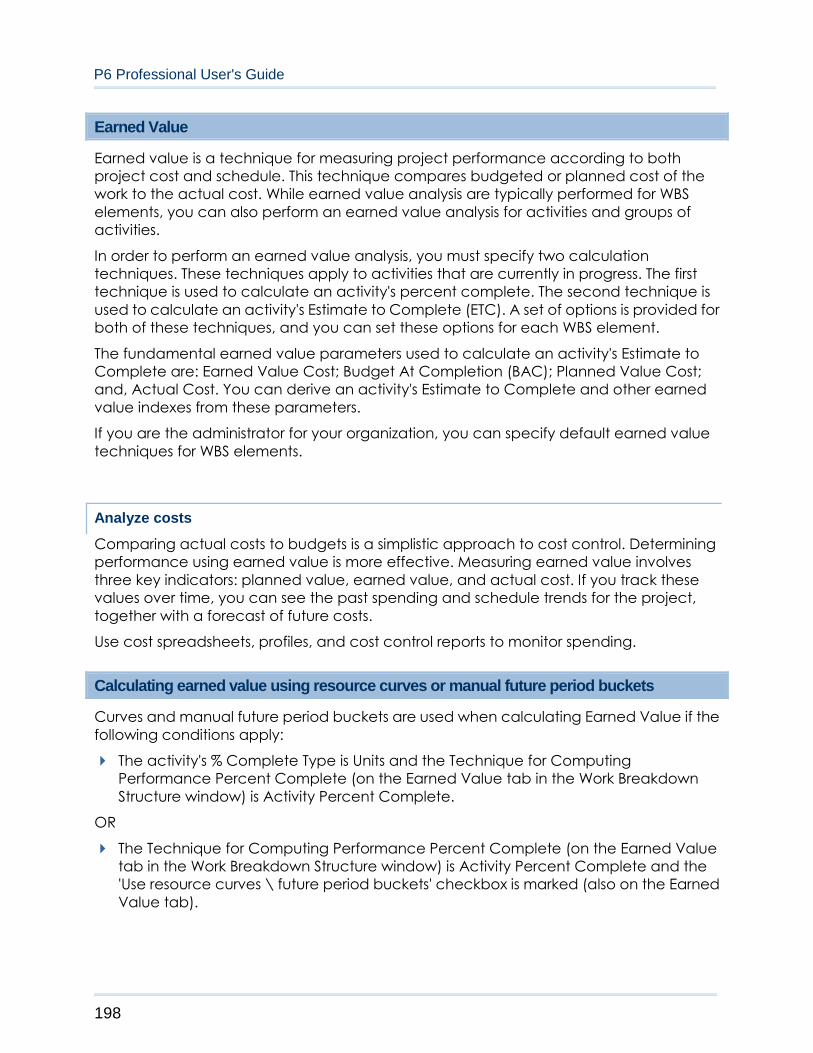
P6 Professional User's Guide
198
Earned Value
Earned value is a technique for measuring project performance according to both
project cost and schedule. This technique compares budgeted or planned cost of the
work to the actual cost. While earned value analysis are typically performed for WBS
elements, you can also perform an earned value analysis for activities and groups of
activities.
In order to perform an earned value analysis, you must specify two calculation
techniques. These techniques apply to activities that are currently in progress. The first
technique is used to calculate an activity's percent complete. The second technique is
used to calculate an activity's Estimate to Complete (ETC). A set of options is provided for
both of these techniques, and you can set these options for each WBS element.
The fundamental earned value parameters used to calculate an activity's Estimate to
Complete are: Earned Value Cost; Budget At Completion (BAC); Planned Value Cost;
and, Actual Cost. You can derive an activity's Estimate to Complete and other earned
value indexes from these parameters.
If you are the administrator for your organization, you can specify default earned value
techniques for WBS elements.
Analyze costs
Comparing actual costs to budgets is a simplistic approach to cost control. Determining
performance using earned value is more effective. Measuring earned value involves
three key indicators: planned value, earned value, and actual cost. If you track these
values over time, you can see the past spending and schedule trends for the project,
together with a forecast of future costs.
Use cost spreadsheets, profiles, and cost control reports to monitor spending.
Calculating earned value using resource curves or manual future period buckets
Curves and manual future period buckets are used when calculating Earned Value if the
following conditions apply:
The activity's % Complete Type is Units and the Technique for Computing
Performance Percent Complete (on the Earned Value tab in the Work Breakdown
Structure window) is Activity Percent Complete.
OR
The Technique for Computing Performance Percent Complete (on the Earned Value
tab in the Work Breakdown Structure window) is Activity Percent Complete and the
'Use resource curves \ future period buckets' checkbox is marked (also on the Earned
Value tab).
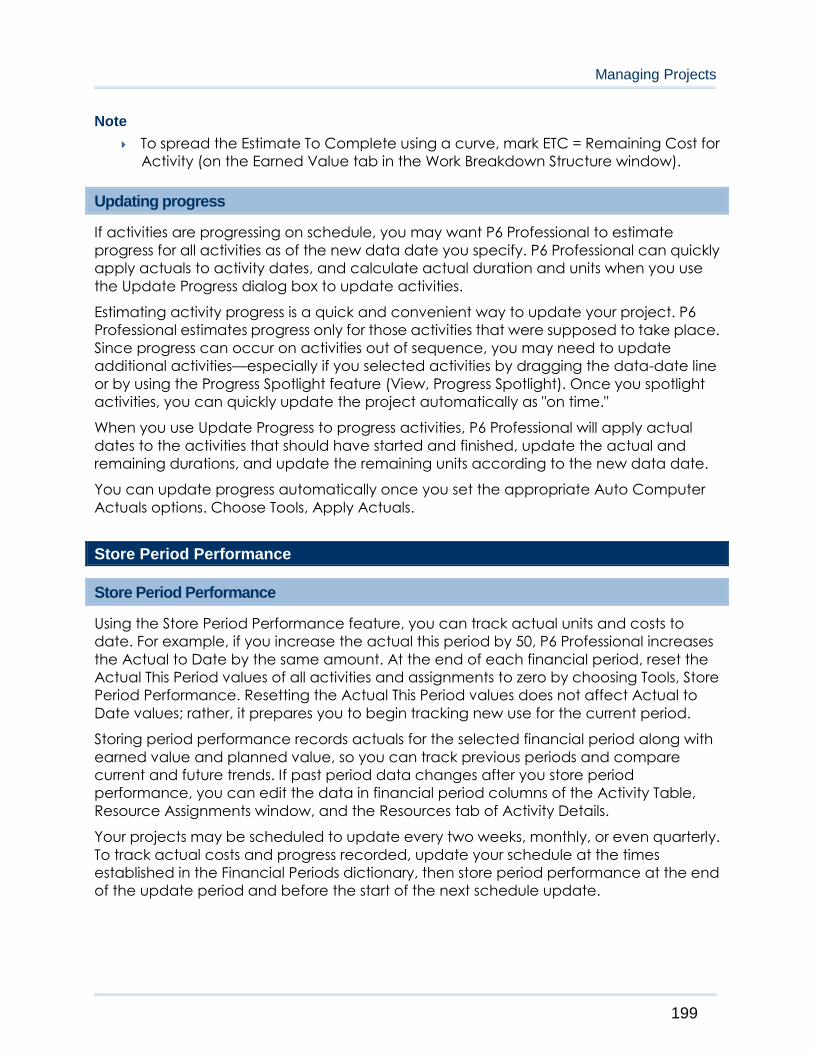
Managing Projects
199
Note
To spread the Estimate To Complete using a curve, mark ETC = Remaining Cost for
Activity (on the Earned Value tab in the Work Breakdown Structure window).
Updating progress
If activities are progressing on schedule, you may want P6 Professional to estimate
progress for all activities as of the new data date you specify. P6 Professional can quickly
apply actuals to activity dates, and calculate actual duration and units when you use
the Update Progress dialog box to update activities.
Estimating activity progress is a quick and convenient way to update your project. P6
Professional estimates progress only for those activities that were supposed to take place.
Since progress can occur on activities out of sequence, you may need to update
additional activities—especially if you selected activities by dragging the data-date line
or by using the Progress Spotlight feature (View, Progress Spotlight). Once you spotlight
activities, you can quickly update the project automatically as "on time."
When you use Update Progress to progress activities, P6 Professional will apply actual
dates to the activities that should have started and finished, update the actual and
remaining durations, and update the remaining units according to the new data date.
You can update progress automatically once you set the appropriate Auto Computer
Actuals options. Choose Tools, Apply Actuals.
Store Period Performance
Store Period Performance
Using the Store Period Performance feature, you can track actual units and costs to
date. For example, if you increase the actual this period by 50, P6 Professional increases
the Actual to Date by the same amount. At the end of each financial period, reset the
Actual This Period values of all activities and assignments to zero by choosing Tools, Store
Period Performance. Resetting the Actual This Period values does not affect Actual to
Date values; rather, it prepares you to begin tracking new use for the current period.
Storing period performance records actuals for the selected financial period along with
earned value and planned value, so you can track previous periods and compare
current and future trends. If past period data changes after you store period
performance, you can edit the data in financial period columns of the Activity Table,
Resource Assignments window, and the Resources tab of Activity Details.
Your projects may be scheduled to update every two weeks, monthly, or even quarterly.
To track actual costs and progress recorded, update your schedule at the times
established in the Financial Periods dictionary, then store period performance at the end
of the update period and before the start of the next schedule update.

P6 Professional User's Guide
200
When P6 Professional is connected to a P6 EPPM database, you can only store period
performance if financial periods have been defined in P6.
Link actual to date and actual this period units and costs
To store period performance or edit past period actuals for a project, the actual and
actual this period units and cost must be linked. If you want to recalculate actual or
actual this period units and costs when one of these values is updated, this option must
be marked.
1) Choose Enterprise, Projects.
2) Click the Layout Options bar and choose Show On Bottom, Project Details.
3) In the Project Details, Calculations tab, mark the Link actual to date and actual this
period units and costs option.
Post actual amounts for a period
1) Choose Tools, Store Period Performance.
The Store Period Performance dialog box lists all open projects.
2) Determine the projects you want to post actual amounts for, then double-click in the
Financial Period column to select a financial period for each applicable project.
When connected to a P6 Professional database: The Select Financial Period dialog
box lists all financial periods defined in the Financial Periods dictionary.
When connected to a P6 EPPM database: The Select Financial Period dialog box lists
all financial periods defined in P6.
3) Determine the projects you do not want to post actual amounts for, then clear the
corresponding checkbox in the Selected column for each applicable project.
4) Click Store Now.
P6 Professional stores the Actual This Period values in the selected financial period for
each project (regardless of the data date or Actual Start dates), then sets Actual This
Period values to zero in anticipation of the next schedule update period.
Tips
To store period performance on a project, the actual and actual this period units
and cost must be linked. Before storing period performance on a project, verify
that the Link actual to date and actual this period units and costs option is
selected in the Project Details, Calculations tab.

Managing Projects
201
You can store period performance for the same financial period for a project
more than once. When you store period performance after it has already been
stored for a period, the module appends any new values to the existing period
values and does not overwrite them, except for earned value and planned value
data. For earned value and planned value costs and units, the data is
recalculated and the existing period values are overwritten (see note below).
You can customize the Resource Usage and Activity Usage spreadsheets to
display Financial Period Value fields. When displaying Financial Period Value fields,
past period actuals stored per financial period are distributed evenly from the start
date to the finish date defined for a financial period and earned value
calculations are based on these stored period quantities. Financial Period Value
fields are only available for display if you define the range of financial periods that
are available for display as columns in User Preferences.
Notes
When connected to a P6 Professional database: To store period performance,
you must be assigned the Store Period Performance and Add/Edit Activities
Except Relationships project privileges.
When connected to a P6 EPPM database: To store period performance, you must
have the appropriate project privileges as defined in P6.
If any open project is read only or checked out, the Store Period Performance
menu option is disabled.
You do not have to store period performance sequentially (i.e., you can skip
periods).
Earned value cost and units, as well as planned value cost and units, are
calculated as follows (using Earned Value Units as an example): Actual Earned
Value Units = This Period Earned Value Units - total Earned Value Units for all stored
periods in the database.
Edit past period actual data
You can view and edit past period actual data for any financial period in the Activity
Table and the Resources tab of Activity Details. The available financial period columns
are listed in the Financial Period Value group of columns in the Columns dialog box.
You can display Activity Table columns for all of the following financial period fields:
(Period Name): Actual Expense Cost
(Period Name): Actual Labor Cost
(Period Name): Actual Labor Units
(Period Name): Actual Material Cost
(Period Name): Actual Nonlabor Cost
(Period Name): Actual Nonlabor Units
(Period Name): Earned Value Cost
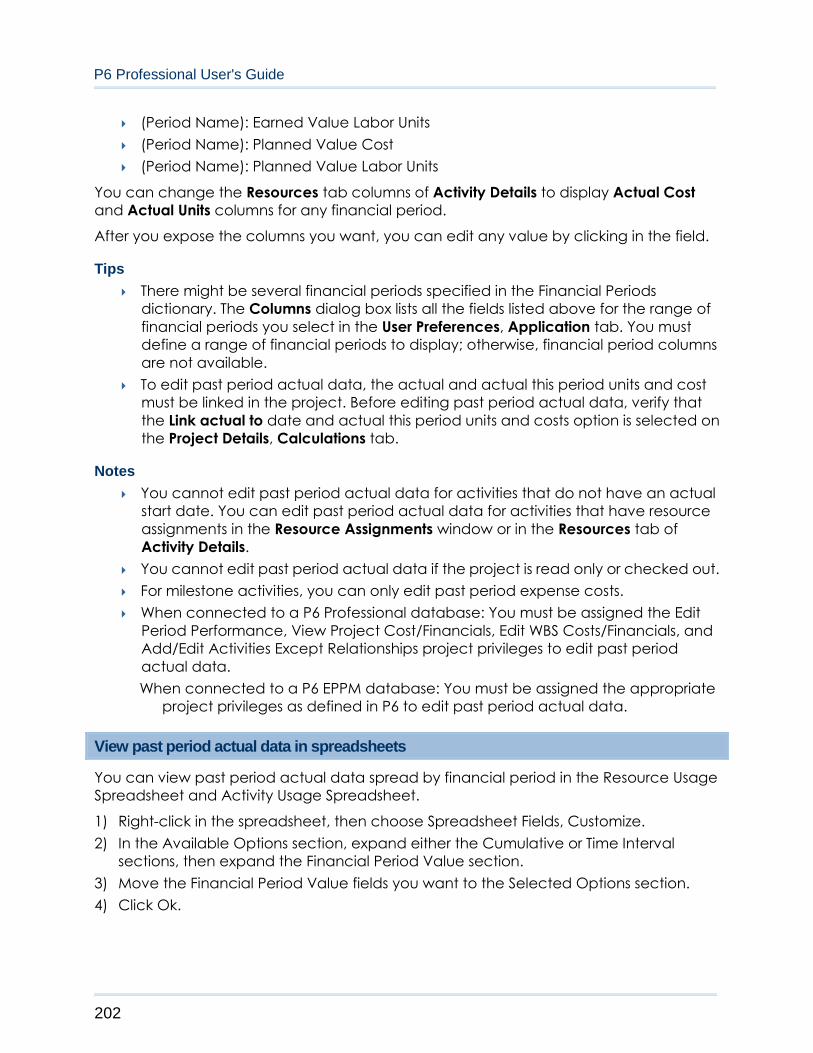
P6 Professional User's Guide
202
(Period Name): Earned Value Labor Units
(Period Name): Planned Value Cost
(Period Name): Planned Value Labor Units
You can change the Resources tab columns of Activity Details to display Actual Cost
and Actual Units columns for any financial period.
After you expose the columns you want, you can edit any value by clicking in the field.
Tips
There might be several financial periods specified in the Financial Periods
dictionary. The Columns dialog box lists all the fields listed above for the range of
financial periods you select in the User Preferences, Application tab. You must
define a range of financial periods to display; otherwise, financial period columns
are not available.
To edit past period actual data, the actual and actual this period units and cost
must be linked in the project. Before editing past period actual data, verify that
the Link actual to date and actual this period units and costs option is selected on
the Project Details, Calculations tab.
Notes
You cannot edit past period actual data for activities that do not have an actual
start date. You can edit past period actual data for activities that have resource
assignments in the Resource Assignments window or in the Resources tab of
Activity Details.
You cannot edit past period actual data if the project is read only or checked out.
For milestone activities, you can only edit past period expense costs.
When connected to a P6 Professional database: You must be assigned the Edit
Period Performance, View Project Cost/Financials, Edit WBS Costs/Financials, and
Add/Edit Activities Except Relationships project privileges to edit past period
actual data.
When connected to a P6 EPPM database: You must be assigned the appropriate
project privileges as defined in P6 to edit past period actual data.
View past period actual data in spreadsheets
You can view past period actual data spread by financial period in the Resource Usage
Spreadsheet and Activity Usage Spreadsheet.
1) Right-click in the spreadsheet, then choose Spreadsheet Fields, Customize.
2) In the Available Options section, expand either the Cumulative or Time Interval
sections, then expand the Financial Period Value section.
3) Move the Financial Period Value fields you want to the Selected Options section.
4) Click Ok.

Managing Projects
203
Tip:
If Financial Period Value is not an available section in the Columns dialog box, you
have not specified a range of financial periods that are available for display. To
specify an available range, choose Edit, User Preferences. Select the Application
tab, then specify the range of financial periods you want to display as columns in
the Columns section.
If your organization manually plans future period resource distribution, you can
manually enter future period assignment values in Financial Period timescale
intervals. Once you baseline the project plan, progress the current project
schedule, and store period performance, you can compare the baseline plan's
manual assignment values to the current project's past period actuals in
spreadsheets and reports.
Note
You cannot edit past period actual data in spreadsheets. You can edit past
period actuals in columns of the Activity Table, Resource Assignments window,
and the Activity Details, Resources tab.
Creating and Using Reflections
What is a reflection
A reflection is a copy of a project that has the following characteristics:
1) Has the same name as the original source project with reflection appended to it.
2) Internally, contains a link to the source project that allows the application to merge
changes to the reflection into the source project.
3) Has a what-if status.
After creating a reflection, you can make changes to it. You can then merge selected
changes back into the source project keeping active data in the source project intact.
Creating a reflection facilitates the following work flows and processes:
Creating a sandbox area to test different project scenarios.
Reviewing changes made in collaboration with other users of a reflection. Using
the reflection as an intermediary project lets you review and accept changes
before merging the reflection back into the source project.
Reviewing changes to a project by exporting a reflection as an .XER file. You can
send the .XER file to outside users who can import the file into their database. After
making changes to the project, the outside users can export the file and send the
resulting .XER file back to you. By importing the .XER file back into your reflection,
you can decide which changes to keep when you merge the reflection back into
the source project.
P6 Professional User's Guide
204
Creating and using reflections
Follow this procedure to create and use reflections.
1) Create a reflection.
2) Make changes to the reflection.
3) Preview the changes to the project.
4) Optionally, print a report of the changes to the project.
5) Merge selected changes into the source project.
Create a Reflection
Follow this procedure to create a reflection of a source project. The reflection you create
will have the same name as the source project with an incremental number appended
to it.
Notes:
The Create Reflection context menu will only be available when selecting a
project under an EPS node in which you have the privilege to create projects.
Generally this means that the Responsible Manager assigned to the EPS node in
which the project resides must be assigned to your user name with a profile that
includes the "Add Projects" project privilege when P6 Professional is connected to
a P6 Professional database and to your user name with a profile that includes the
appropriate project privilege as defined in P6 when connected to a P6 EPPM
database.
When connected to a P6 EPPM database: Project Managers can use the
Reflection project and Activity Owner features together to collect and review
activity status information reported by users with Contributor module access
assigned in P6.
Create a reflection
1) In the Projects view, right click on the project for which you want to create a
reflection.
2) In the context menu, click Create Reflection. If the project does not contain any
baselines, the system responds by creating a reflection. Otherwise, the system
responds by displaying the Copy Baselines dialog box. For any baselines you want to
copy, mark checkbox(s) in the Copy column of the Copy Baselines dialog box and
click OK. The system responds by creating a reflection.
Make changes in the reflection
Once a reflection has been created, you can make changes to the reflection as
needed to explore alternative project scenarios.
Managing Projects
205
Merging a Reflection with the Source project
Creating a reflection allows you to make a copy of a project known as a reflection.
Once a reflection has been created, you can make changes to the reflection as
needed to explore alternative project scenarios. Then, you can merge these updates to
the original project, allowing you to keep active project data intact. This topic assumes
that you have already created a reflection, you have made changes to the reflection
and are ready to either preview and/or merge selected changes into the source project.
Notes:
The Merge Reflection into Source Project context menu will only be available
when selecting a reflection to which you have superuser access. You will also
need superuser access to the source project associated with the reflection.
Additionally, the source project cannot be opened in Exclusive mode by another
user nor can it be checked out.
Changes you make to the following fields in a reflection project will result in new
entries being added to the source project when you merge a reflection into the
source project: Project ID, Activity ID, Resource ID, Role ID, Cost Account, and
Price/Unit. For example, assume that the source project contains an activity with
an Activity ID of A1000. After creating a reflection, you change the Activity ID from
A1000 to A1005 in the reflection project. Then, when you merge the reflection
project into the source project, the source project now contains two activities,
A1000 and A1005, which are identical except for the Activity ID.
Preview changes to be merged
Begin by previewing the changes.
1) In the Projects view, right click on the reflection that you want to merge with the
source project.
2) In the context menu, click Merge Reflection into Source Project. If there are any
changes to merge, the system responds by displaying the Preview Changes to
Project dialog box.
Choose changes to merge
Next, choose changes from the reflection to merge into the source project. There are
two ways the changes can be viewed, or grouped, in the Preview Changes to Project
dialog box: by subject area or by activity. The default is by activity. When you view the
changes by activity, check boxes appear in the Merge column for activity rows. This
allows you to select which activities to merge into the source project.
Notes:
By default, if there are any activities with changes, all activity check boxes will be
marked.
P6 Professional User's Guide
206
Marking or clearing an activity check box in the Activity grouping has a
corresponding affect in the Subject Area grouping even though the check boxes
are not available. Ensure the Activity radio button is marked if you need to
understand or change which activities are to be merged.
1. In the Group Changes By, choose how you would like group the changes.
2. If you choose Activity in step 1, select activities to be merged by marking the
appropriate Merge checkbox in the Merge column.
Tip:
If the application has detected activities that have changed, two buttons will be
enabled: Select All and Clear All. You can use these buttons to save time if you
have a lot of activities to consider. For example, suppose you knew that there
were only two activities that should be merged out of a large number of changed
activities. In this example, you could save time by clicking the Clear All and then
marking only the two that should be merged.
Determine actions the application should take prior to merging
Under Prior to merging, mark the appropriate check box.
1) Mark the Create a copy of the source project as a baseline if you would like to create
a baseline in the source project with the name of the project with - Bx appended to it,
where x is an incremented number.
2) Mark the Create a backup file of source project if you would like export the project to
an .xer file. You could use this file to rollback the source project after the merge.
Determine actions the application should take after merging
Under After merging, mark the appropriate check box.
1) Mark the Keep reflection check box if you would like the application to keep the
reflection in the EPS after the reflection is successfully merged.
2) Mark the Delete reflection check box if you would like the application to delete the
reflection from the EPS after the reflection is successfully merged.
3) Mark the Replace reflection checkbox if you would like to replace the reflection with
an updated reflection based on the current data in the source project after the
merge.
Note
If you choose the Replace reflection option, the new reflection will be created
with the same baselines that were in the original reflection.
When connected to a P6 EPPM database: Mark the Keep reflection checkbox if
you want to keep a record of Risk data. Otherwise, Risk data for the Reflection
project will be lost since Risks data is not merged (the source project's Risk data
remains unchanged).
Managing Projects
207
Merge the changes
If for whatever reason, you decide not to merge the changes in the Reflection into the
Source project, click Cancel and no changes will be made to the source project.
Otherwise, click Merge Changes to merge the changes into the source project.
Notes
We suggest opening and scheduling the source project after merging changes
into it.
When you export resource assignments to an XLS file, only the lowest level of cost
accounts associated with resource assignments is exported to the XLS file. For
example, assume your cost account hierarchy has a cost account named CA,
with a subordinate level named CA.A. If you assign the cost account CA.A to a
resource assignment, when you export resource assignments to an XLS file, the XLS
file displays "A" as the cost account, not "CA.A." If you then import this XLS file to
the same project in P6 Professional, in some cases, a duplicate resource
assignment will be created that lists "A" as the assigned cost account for the
duplicate resource assignment.
Working with remote projects
Managing remote projects
You can "check out" projects so that they can be worked on remotely. Once a project is
checked out, it can no longer be modified until it has been checked in. In addition to
checking in the project, you may replace the existing project with the remote copy of
the project by using the Import wizard.
Check out a project
1) Open the projects you want to check out.
2) Choose File, Check Out.
3) Select the projects you want to check out.
To check out a project, it must be open. If the project you want to check out is not on
the list, click Cancel, open the project, and restart the wizard.
4) Type the name of the file and the location where the file will be saved.
5) Click Finish.
An XER file is created that exports complete project information to other P6
Professional or P6 EPPM applications.
P6 Professional User's Guide
208
Note
To move between different wizard windows, click Prev or Next.
View the check-out status of a project
1) Choose Enterprise, Projects.
A red checkmark displays beside any project that is currently checked out.
2) Choose View, Show on Bottom, Project Details.
3) Click the General tab, and check the status of the project in the Check Out Status
field. Privileged users can also change the status of a project in this field.
The Checked Out By field indicates the user that checked out the project.
The Date Checked Out field indicates the date and time the user checked out the
project.
Notes
Changing the status of a project to Checked Out or Checked In, in the General
tab, does not export project information or import updated project information. To
import or export information when checking in or out a project, select Check In or
Check Out on the File menu.
The Checked Out By and Date Checked Out fields are blank when the Check Out
Status is Checked In.
Modify check in update options
1) Open the projects you want to check in.
2) Choose File, Check In, then select the project you want to check in.
3) In the Update Project Options dialog box, select the layout you want to modify and
click Modify.
4) In the Modify Import Configuration dialog box, select the data you want to modify.
5) Select the action to perform during the check-in process.
6) Mark the Delete checkbox to remove unreferenced data, data in the project you are
updating but not included in the check-out file, from the project.
7) Click OK.
Note
The Delete field applies only to relationships to external projects, thresholds,
activities, activity relationships, and activity resource assignments. Global data
types are not affected by this setting.

Managing Projects
209
Check in a project
1) Open the projects you want to check in.
2) Choose File, Check In.
3) Select the file you want to check in.
4) Double click the Import Action field to select how the project data is checked in.
Select Update Existing Project to update with any new new/modified date in the XER
file.
Select Replace Existing Project to delete the existing project and replace it with the
project checked in from the XER file
Select Ignore this Project to not check in the project.
5) Select the data to check in by modifying the layout configuration in the Update
Project Options dialog box.
6) Select the currency for the projects in the Currency Type dialog box.
7) Click Finish.
Note
To move between different wizard windows, click Prev or Next.
Scheduling Projects
Scheduling projects
Your project schedule can be calculated one of two ways: when you choose the
Schedule command or each time you make a change that affects schedule dates.
The Critical Path Method (CPM) scheduling technique is used to calculate project
schedules. CPM uses activity durations and relationships between activities to calculate
the project schedule.
Calculating a schedule
When you choose to calculate a schedule, all activities in the network are examined,
beginning with the first and ending with the last, to calculate the earliest start and finish
dates for each activity.
The activities are then reexamined in a backward pass, beginning with the latest early
finish of the last activity in the network and ending with the first activity, to calculate the
latest start and finish dates for each activity.
Float values are calculated using the duration and calendar definitions for the activity.
In addition to scheduling a project, you can also level resources.
P6 Professional User's Guide
210
Automatic scheduling
You can calculate the schedule each time activity data change, rescheduling activities
that have changed significantly and or that were affected by a change to the first
activity. If automatic scheduling is turned on, the schedule recalculates each time a
significant change is made to an activity, relationship, or resource. If you turn off
automatic scheduling, changes to activities are not reflected in the schedule until you
calculate the schedule again.
You can also level resources during automatic scheduling.
Calculate multiple float paths
When you schedule a project, you can choose to calculate multiple critical float paths.
1) Choose Tools, Schedule.
2) Click Options, then click the Advanced tab.
3) Mark the Calculate multiple float paths option.
4) Choose to calculate multiple paths using Total Float or Free Float.
5) In the Display multiple float paths ending with activity field, click the Browse button to
choose the activity on which you want the float paths to end.
You can choose any activity; however, typically this activity is a milestone or some
other major activity in the project schedule.
6) Specify the number of float paths you want the module to calculate.
Enter a low number (10 or less) to optimize performance.
7) Click Close.
Notes
If you choose to calculate multiple paths using Total Float, to calculate the most
critical path, the module first determines which relationship has the most critical
total float. Using this relationship as the starting point, the module determines
which predecessor and successor activities have the most critical relationship
total float, among all possible paths, until an activity is reached that does not
have any relationships. The path that contains these activities is the most critical
path. These activities are assigned a Float Path value of 1 (the most critical float
path) and the process begins again until the specified number of paths are
calculated.
Managing Projects
211
If you choose to calculate multiple paths using Free Float, the most critical path
will be identical to the critical path that is derived when you choose to define
critical activities as Longest Path in the General tab of the Schedule Options
dialog box. In a multicalendar project, the longest path is calculated by
identifying the activities that have an early finish equal to the latest calculated
early finish for the project and tracing all driving relationships for those activities
back to the project start date.
Schedule a project
1) Open the projects you want to schedule.
Tip: If you want to schedule multiple projects simultaneously, you should set the data
date for each project individually before scheduling. To set the data date for each
project, choose Enterprise, Projects. For each project you want to schedule, select
the project in the project table, then modify the Data Date field on the Project
Details, Dates tab.
2) Choose Tools, Schedule.
3) To set scheduling options, click Options.
To display and/or use the default scheduling settings, click Default in the Schedule
Options dialog box.
4) If only one project is open, click in the Current Data Date field if you want to
change the data date before scheduling the project.
Tip: If multiple projects are open, this field displays the Earliest Data Date of all open
projects; you can not change the data date for all open projects from this field. You
can change the data date for individual projects on the Project Details, Dates tab
and when you apply actuals (Tools, Apply Actuals).
5) If enabled, mark the 'Set Data Date and Project Planned Start to Project Forecast
Start during scheduling' checkbox if you want to schedule using forecast dates rather
than the data date.
When you mark this checkbox and schedule the projects, each project's data date is
changed to match each project's forecast start date during scheduling.
Tip: A forecast start date is shown if the start date of a project was manually changed
by dragging the project bar to a new timeframe in Tracking layouts.
6) To record your scheduling results in a log file, mark the Log to File checkbox, then click
to specify a filename and location.
P6 Professional User's Guide
212
7) Click Schedule.
8) If you're scheduling multiple projects and the projects have different data dates, a
message appears indicating that each open project will be scheduled using its own
data date (as specified on the Project Details, Dates tab). Click Yes to continue
scheduling, or click No to cancel.
9) If, in the Schedule Options dialog box, you chose to calculate float based on the
latest finish date of all open projects, you may be prompted with an additional
warning message. Read the contents of the message, then click Yes to continue
scheduling, or click No to cancel.
Notes
When scheduling, to recalculate actual units for resource assignments that use
curves, mark Recalculate Actual Units and Cost When Duration % Complete
Changes (in the Calculations tab in the Projects window).
Relationships to and from WBS Summary activities are ignored when you schedule
a project, even if you choose to maintain activity relationships between projects.
Schedule a project automatically
Follow these steps to turn on "automatic scheduling" so that the schedule calculates
each time you add or delete an activity or relationship, change an activity duration or
relationship type, or change anything that affects schedule dates.
1) Choose Tools, Schedule.
2) Click Options.
3) In the General tab, mark the Schedule Automatically When a Change Affects Dates
checkbox.
4) If you want to level resources automatically after it schedules, mark the Level
Resources During Scheduling checkbox.
5) Click Close, then click Schedule.
Schedule project data as a service (P6 Professional Only)
1) Choose Tools, Job Services, then click Add.
2) Select Schedule in the Service Type field.
3) Specify a number in the Job # field to indicate the sequence in which the service
should be performed, if more than one service is listed.
4) Type a brief description of the service in the Job Name field.
5) In the Status field, select Enabled to activate the scheduling service.
You can suspend a service at any time by selecting Disabled in the Status field.
6) In the Run Job area on the Job Details tab, schedule when the service should be run:
every day at a specific time, or weekly, every two weeks, or monthly on a day and
time you specify.
Managing Projects
213
Leveling Resources
Leveling resources
Resource leveling is a process that helps you ensure that sufficient resources are
available to perform the activities in your project according to the plan. During resource
leveling, an activity is only scheduled to occur when its resource demands can be met.
To accomplish this, tasks may be delayed to resolve resource availability conflicts.
Typically, you level during the forward pass through a project. This determines the earliest
dates to schedule an activity when sufficient resources will be available to perform the
task.
If forward leveling delays the project's early finish date, late dates remain unchanged
unless you clear the checkbox to preserve scheduled early and late dates in the Level
Resources dialog box. In this case, a backward pass recalculates late dates.
Tip
While resource leveling provides one way to resolve resource conflicts, you may
also want to consider alternative solutions, such as changing activity relationships
or reallocating resources.
Notes
The maximum amount of work that a resource is capable of doing for a given
timeperiod is defined by the resource’s Max Units/Time value in the Units & Prices
tab of Resource Details.
Leveling is disabled when no projects are open.
Resource curves are not used when leveling; however, manual future period
values are considered when leveling.
Leveling priority definitions
Projects typically contain more than one chain of activities. If two activities from different
chains are ready for leveling, P6 Professional chooses one using the priorities you specify
in the Leveling Priorities area of the Level Resources dialog box. Then, it sorts numbers first,
then alphabetic characters, followed by blank values. If you specify no prioritization
codes, P6 Professional sorts by activity ID.
The following table defines your priority and order options for leveling resources.
Priority Ascending Descending
Activity ID Levels activities with lower
IDs first.
Levels activities with higher
IDs first.
Activity Priority Levels lower priority Levels higher priority
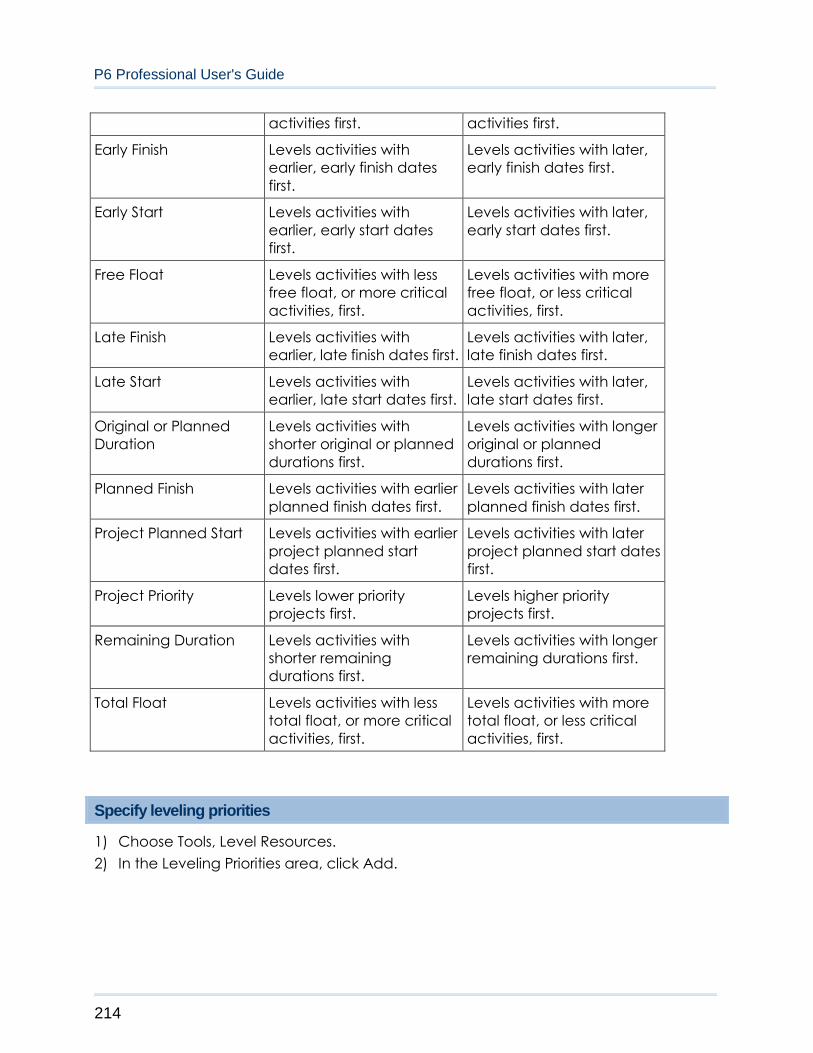
P6 Professional User's Guide
214
activities first. activities first.
Early Finish Levels activities with
earlier, early finish dates
first.
Levels activities with later,
early finish dates first.
Early Start Levels activities with
earlier, early start dates
first.
Levels activities with later,
early start dates first.
Free Float Levels activities with less
free float, or more critical
activities, first.
Levels activities with more
free float, or less critical
activities, first.
Late Finish Levels activities with
earlier, late finish dates first.
Levels activities with later,
late finish dates first.
Late Start Levels activities with
earlier, late start dates first.
Levels activities with later,
late start dates first.
Original or Planned
Duration
Levels activities with
shorter original or planned
durations first.
Levels activities with longer
original or planned
durations first.
Planned Finish Levels activities with earlier
planned finish dates first.
Levels activities with later
planned finish dates first.
Project Planned Start Levels activities with earlier
project planned start
dates first.
Levels activities with later
project planned start dates
first.
Project Priority Levels lower priority
projects first.
Levels higher priority
projects first.
Remaining Duration Levels activities with
shorter remaining
durations first.
Levels activities with longer
remaining durations first.
Total Float Levels activities with less
total float, or more critical
activities, first.
Levels activities with more
total float, or less critical
activities, first.
Specify leveling priorities
1) Choose Tools, Level Resources.
2) In the Leveling Priorities area, click Add.
Managing Projects
215
3) Select a new leveling priority.
A priority within the table takes precedence over any priorities below it.
4) Specify a sort order.
5) Click Level.
Notes
To remove a priority from the list, select the priority, then click Remove.
To edit a priority, click the field name, then select a new field name and/or
double-click the Sort Order column and select Ascending or Descending.
Level resources
1) Choose Tools, Level Resources.
2) Mark the Consider Assignments in Other Projects With Priority Equal/Higher Than
checkbox and specify a priority number if you want to consider other project
assignments when determining whether a resource is overallocated.
3) Mark the Preserve Scheduled Early and Late Dates checkbox to preserve the early
and late dates that were calculated during project scheduling.
4) Mark the Level All Resources checkbox to level all the resources within the project. To
level specific resources, clear the Level All Resources checkbox and click Select
Resources to choose the resources that you want to include in the leveling run.
5) Specify leveling priorities.
6) Mark the Log to File checkbox to record your leveling results in a log file, then click
to specify a filename and location.
7) Click Level.
Tip
To display and/or use the resource leveling defaults, click Default.
Notes
Resource curves are not used when leveling.
A Resource assigned to a suspended activity is considered available for
assignment to other activities until the resume date of the suspended activity.
Level resources automatically
1) Choose Tools, Level Resources.
2) Mark the Automatically Level Resources When Scheduling checkbox to
automatically level resources each time you schedule a project.
P6 Professional User's Guide
216
Adding and Assigning Issues
Issues
Issues are known problems within a project plan that require attention or corrective
action. You can manually create issues and you can generate issues automatically by
defining project thresholds. You can associate these issues with work breakdown
structure (WBS) elements, activities, or resources.
When you add an issue, you can assign a priority level, tracking layout, and responsible
manager to the issue. An issue's tracking layout assignment is helpful when you want to
quickly open the tracking layout that best displays the problem area. An issue's
responsible manager assignment identifies the person responsible for addressing the
issue. You can record historical details for the issue and e-mail issue details, along with
your notes and the issue’s history, to any member of the project's staff.
In addition to these features, an Issue Navigator feature enables you to select a current
issue and navigate to specific areas of the module to view different issue details quickly.
Add an issue
1) Choose Project, Issues.
2) Click on the Edit Toolbar or choose Edit, Add.
3) Display Issue Details, then click the General tab.
4) Type the issue's name.
5) In the Responsible Manager field, click , select the person to assign, then click the
Select button.
6) In the Tracking Layout field, click , select the layout to associate with the issue, then
click the Select button.
7) In the Date Identified field, click to select a date (if different than the current
system date).
8) Select the issue's status.
9) Select the issue's priority level.
10) Click the Details tab.
If applicable to the issue you are adding, type values in the Lower Threshold, Upper
Threshold, and Actual Value fields. For issues that you add manually, these fields are
informational only and are not used for calculations. For threshold-generated issues,
these fields display the threshold values assigned to a threshold parameter and the
actual value calculated for the threshold.
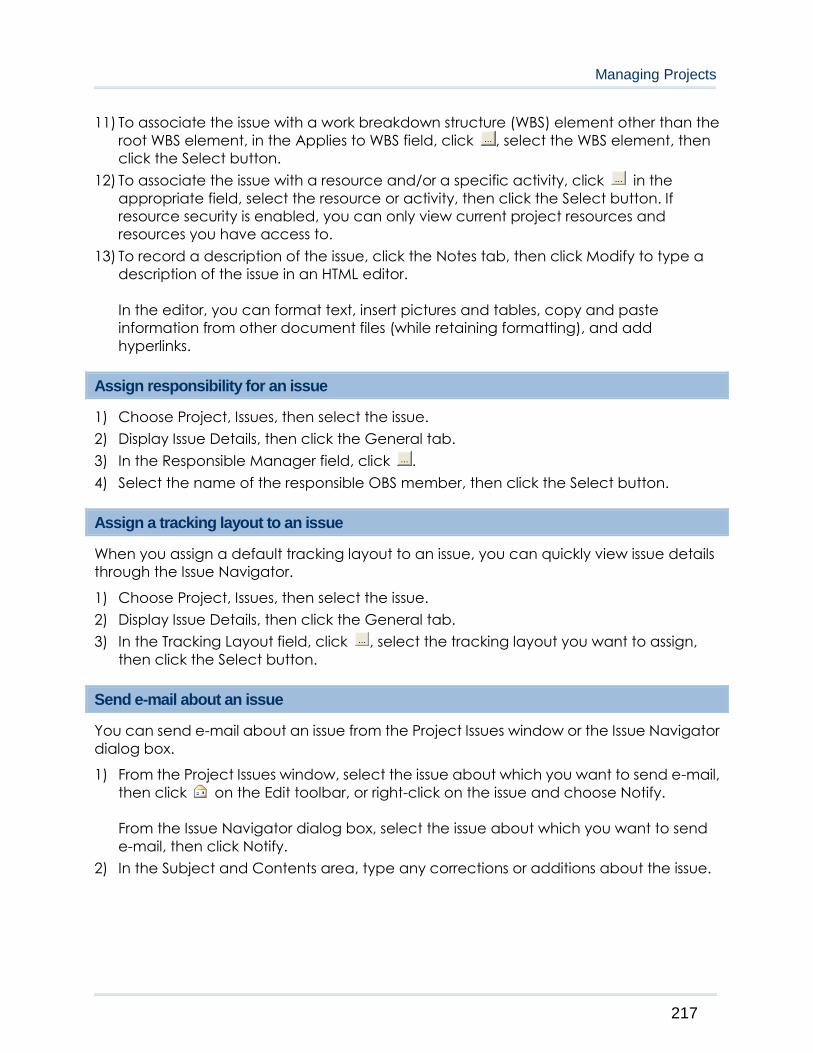
Managing Projects
217
11) To associate the issue with a work breakdown structure (WBS) element other than the
root WBS element, in the Applies to WBS field, click , select the WBS element, then
click the Select button.
12) To associate the issue with a resource and/or a specific activity, click in the
appropriate field, select the resource or activity, then click the Select button. If
resource security is enabled, you can only view current project resources and
resources you have access to.
13) To record a description of the issue, click the Notes tab, then click Modify to type a
description of the issue in an HTML editor.
In the editor, you can format text, insert pictures and tables, copy and paste
information from other document files (while retaining formatting), and add
hyperlinks.
Assign responsibility for an issue
1) Choose Project, Issues, then select the issue.
2) Display Issue Details, then click the General tab.
3) In the Responsible Manager field, click .
4) Select the name of the responsible OBS member, then click the Select button.
Assign a tracking layout to an issue
When you assign a default tracking layout to an issue, you can quickly view issue details
through the Issue Navigator.
1) Choose Project, Issues, then select the issue.
2) Display Issue Details, then click the General tab.
3) In the Tracking Layout field, click , select the tracking layout you want to assign,
then click the Select button.
Send e-mail about an issue
You can send e-mail about an issue from the Project Issues window or the Issue Navigator
dialog box.
1) From the Project Issues window, select the issue about which you want to send e-mail,
then click on the Edit toolbar, or right-click on the issue and choose Notify.
From the Issue Navigator dialog box, select the issue about which you want to send
e-mail, then click Notify.
2) In the Subject and Contents area, type any corrections or additions about the issue.
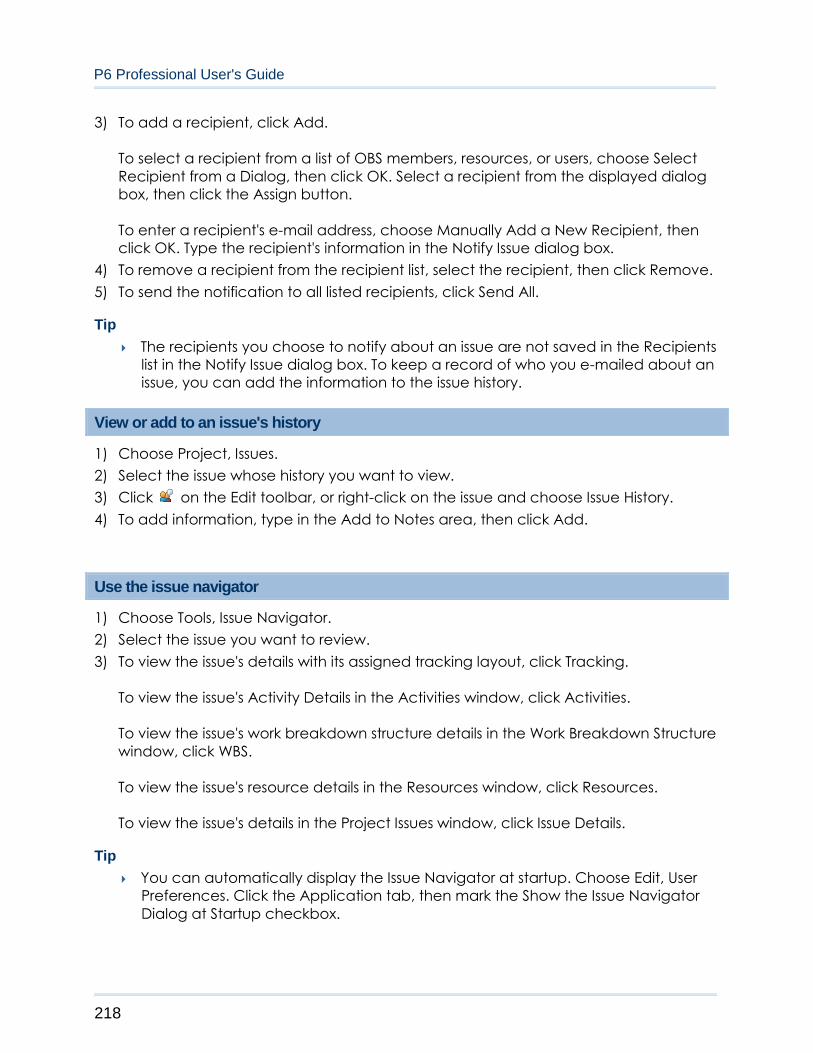
P6 Professional User's Guide
218
3) To add a recipient, click Add.
To select a recipient from a list of OBS members, resources, or users, choose Select
Recipient from a Dialog, then click OK. Select a recipient from the displayed dialog
box, then click the Assign button.
To enter a recipient's e-mail address, choose Manually Add a New Recipient, then
click OK. Type the recipient's information in the Notify Issue dialog box.
4) To remove a recipient from the recipient list, select the recipient, then click Remove.
5) To send the notification to all listed recipients, click Send All.
Tip
The recipients you choose to notify about an issue are not saved in the Recipients
list in the Notify Issue dialog box. To keep a record of who you e-mailed about an
issue, you can add the information to the issue history.
View or add to an issue's history
1) Choose Project, Issues.
2) Select the issue whose history you want to view.
3) Click on the Edit toolbar, or right-click on the issue and choose Issue History.
4) To add information, type in the Add to Notes area, then click Add.
Use the issue navigator
1) Choose Tools, Issue Navigator.
2) Select the issue you want to review.
3) To view the issue's details with its assigned tracking layout, click Tracking.
To view the issue's Activity Details in the Activities window, click Activities.
To view the issue's work breakdown structure details in the Work Breakdown Structure
window, click WBS.
To view the issue's resource details in the Resources window, click Resources.
To view the issue's details in the Project Issues window, click Issue Details.
Tip
You can automatically display the Issue Navigator at startup. Choose Edit, User
Preferences. Click the Application tab, then mark the Show the Issue Navigator
Dialog at Startup checkbox.
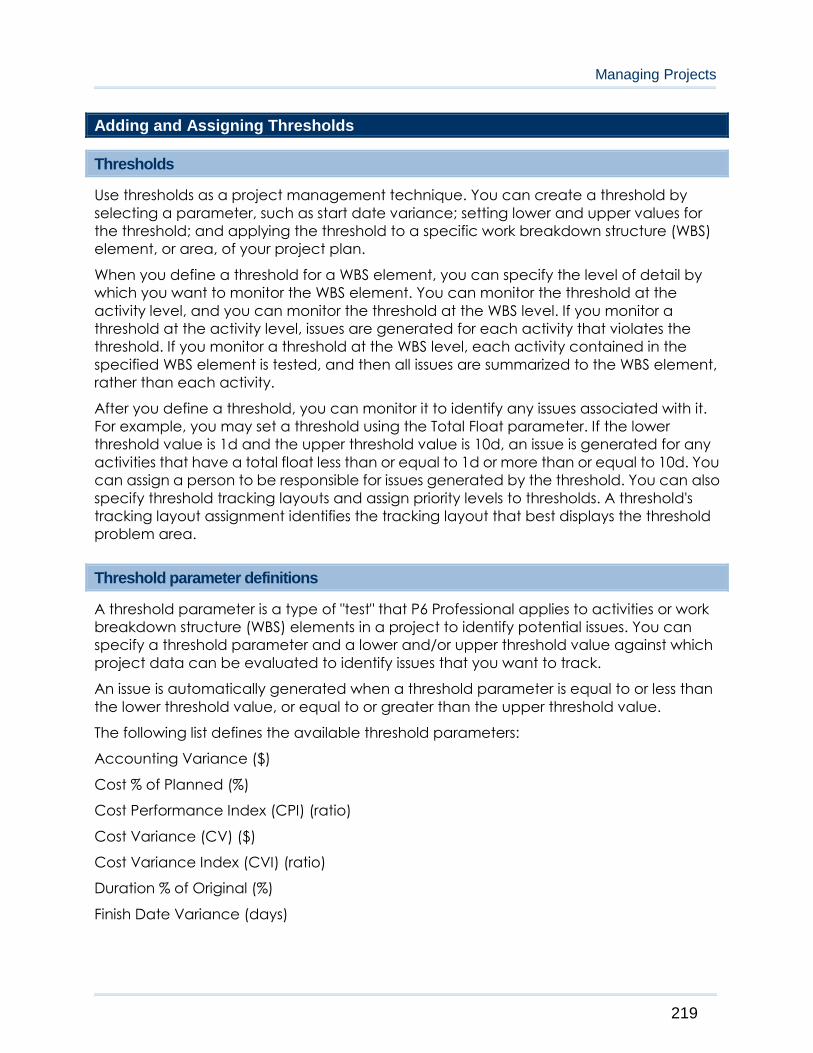
Managing Projects
219
Adding and Assigning Thresholds
Thresholds
Use thresholds as a project management technique. You can create a threshold by
selecting a parameter, such as start date variance; setting lower and upper values for
the threshold; and applying the threshold to a specific work breakdown structure (WBS)
element, or area, of your project plan.
When you define a threshold for a WBS element, you can specify the level of detail by
which you want to monitor the WBS element. You can monitor the threshold at the
activity level, and you can monitor the threshold at the WBS level. If you monitor a
threshold at the activity level, issues are generated for each activity that violates the
threshold. If you monitor a threshold at the WBS level, each activity contained in the
specified WBS element is tested, and then all issues are summarized to the WBS element,
rather than each activity.
After you define a threshold, you can monitor it to identify any issues associated with it.
For example, you may set a threshold using the Total Float parameter. If the lower
threshold value is 1d and the upper threshold value is 10d, an issue is generated for any
activities that have a total float less than or equal to 1d or more than or equal to 10d. You
can assign a person to be responsible for issues generated by the threshold. You can also
specify threshold tracking layouts and assign priority levels to thresholds. A threshold's
tracking layout assignment identifies the tracking layout that best displays the threshold
problem area.
Threshold parameter definitions
A threshold parameter is a type of "test" that P6 Professional applies to activities or work
breakdown structure (WBS) elements in a project to identify potential issues. You can
specify a threshold parameter and a lower and/or upper threshold value against which
project data can be evaluated to identify issues that you want to track.
An issue is automatically generated when a threshold parameter is equal to or less than
the lower threshold value, or equal to or greater than the upper threshold value.
The following list defines the available threshold parameters:
Accounting Variance ($)
Cost % of Planned (%)
Cost Performance Index (CPI) (ratio)
Cost Variance (CV) ($)
Cost Variance Index (CVI) (ratio)
Duration % of Original (%)
Finish Date Variance (days)

P6 Professional User's Guide
220
Free Float (days)
Schedule Performance Index (SPI) (ratio)
Schedule Variance (SV) ($)
Schedule Variance Index (SVI) (ratio)
Start Date Variance (days)
Total Float (days)
Variance at Completion (VAC) ($)
Add a threshold
1) Choose Project, Thresholds.
2) Click on the Edit toolbar or choose Edit, Add.
3) To specify a threshold parameter, in the Threshold Parameter field on the General
tab, click . Select the parameter, then click the Select button.
4) In the Lower Threshold and/or Upper Threshold fields, type a numeric value.
To identify issues, project data is evaluated using a less than or equal to algorithm for
the lower threshold value and a greater than or equal to algorithm for the upper
threshold value. For example, to generate a Start Date Variance issue if an activity
starts one or more days early or three or more days late, you would specify a lower
threshold of –1 and an upper threshold of 3.
5) To select the work breakdown structure (WBS) element you want to monitor for the
new threshold, in the WBS to Monitor field, click . Select the element, then click the
Select button.
6) In the Detail to Monitor field, select the level at which you want to monitor the WBS
element.
When Detail to Monitor is set to Activity, the threshold monitor will review activities
belonging to the WBS element you specified, as well as the activities for all of its child
WBS elements.
7) To assign responsibility for the threshold’s issues to a member of the OBS structure, in
the Responsible Manager field, click . Select the name of the manager, then click
the Select button.
8) To associate a tracking layout with the threshold’s issues, in the Tracking Layout field,
click . Select the layout, then click the Select button.
9) To assign a priority level to issues generated by the selected threshold, in the Issue
Priority field, select a priority level.
10) Click the Details tab.
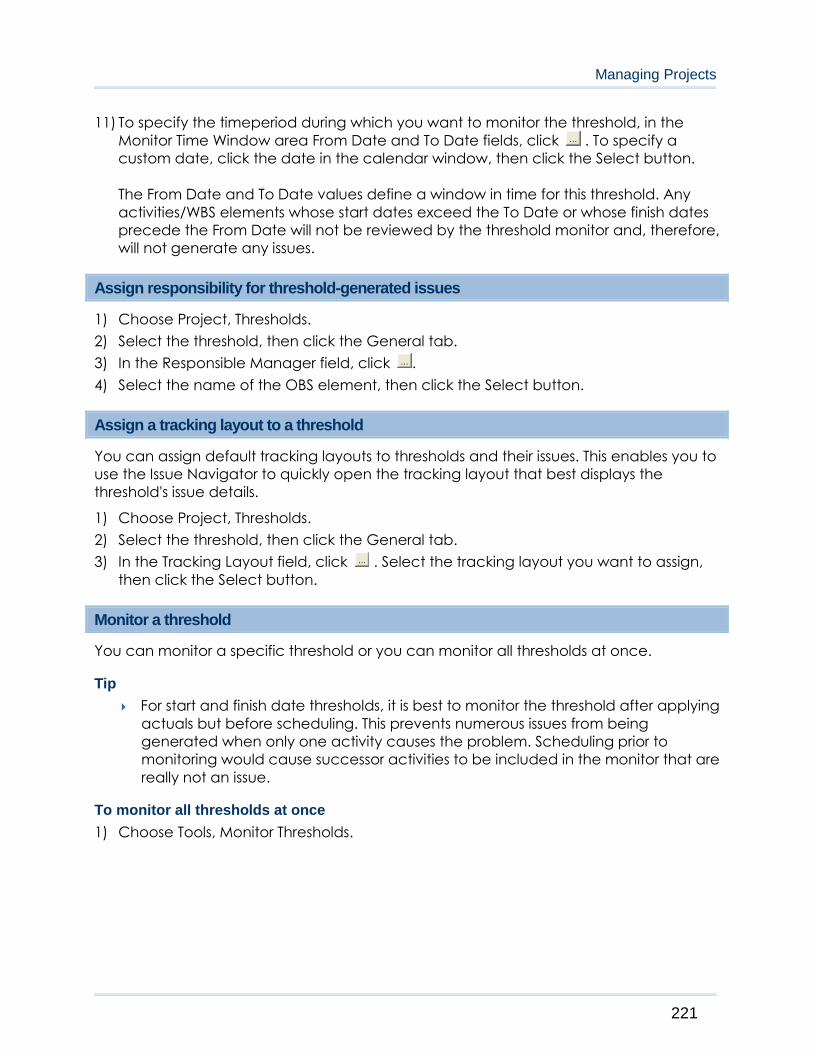
Managing Projects
221
11) To specify the timeperiod during which you want to monitor the threshold, in the
Monitor Time Window area From Date and To Date fields, click . To specify a
custom date, click the date in the calendar window, then click the Select button.
The From Date and To Date values define a window in time for this threshold. Any
activities/WBS elements whose start dates exceed the To Date or whose finish dates
precede the From Date will not be reviewed by the threshold monitor and, therefore,
will not generate any issues.
Assign responsibility for threshold-generated issues
1) Choose Project, Thresholds.
2) Select the threshold, then click the General tab.
3) In the Responsible Manager field, click .
4) Select the name of the OBS element, then click the Select button.
Assign a tracking layout to a threshold
You can assign default tracking layouts to thresholds and their issues. This enables you to
use the Issue Navigator to quickly open the tracking layout that best displays the
threshold's issue details.
1) Choose Project, Thresholds.
2) Select the threshold, then click the General tab.
3) In the Tracking Layout field, click . Select the tracking layout you want to assign,
then click the Select button.
Monitor a threshold
You can monitor a specific threshold or you can monitor all thresholds at once.
Tip
For start and finish date thresholds, it is best to monitor the threshold after applying
actuals but before scheduling. This prevents numerous issues from being
generated when only one activity causes the problem. Scheduling prior to
monitoring would cause successor activities to be included in the monitor that are
really not an issue.
To monitor all thresholds at once
1) Choose Tools, Monitor Thresholds.
P6 Professional User's Guide
222
2) To monitor the thresholds using their original monitor timeframe, choose Use Original
Threshold Monitor Windows.
To specify a new monitor timeframe, choose Use New Threshold Monitor Window,
then, in the From Date and To Date fields, click to select new dates.
3) Click Monitor.
To monitor a specific threshold
1) Choose Project, Thresholds.
2) Select the threshold you want to monitor.
3) Click on the Edit toolbar.
Note
If you monitor a threshold whose status is Disabled, no issues are generated.
View threshold issue details
1) Choose Project, Thresholds.
2) Select the threshold whose issue details you want to view, then click the Details tab.
3) Select the issue, then click Go To.
Adding and Assigning Risks (P6 Professional Only)
Risks (P6 Professional Only)
Risks are any uncertain events or conditions that, if they occur, have a positive or
negative effect on project objectives.
Use the integrated risk management feature to identify, categorize, and prioritize risks, to
assign an owner (a person responsible for managing the risk) to each potential risk, to
assign risks to activities that could be effected by the risk, and to perform qualitative
analysis on each project risk. You can respond to a risk and create an associated risk
response.
Managing Risks
When a risk is identified, it is automatically assigned to the open project. If more than one
project is open, the project it assigns the risk to depends on the current grouping. Then
you can assign the risk to activities it may impact. Assigning a risk to an activity, or an
activity to a risk, creates a risk assignment. A risk can be assigned to multiple activities;
likewise an activity can be assigned to multiple risks.
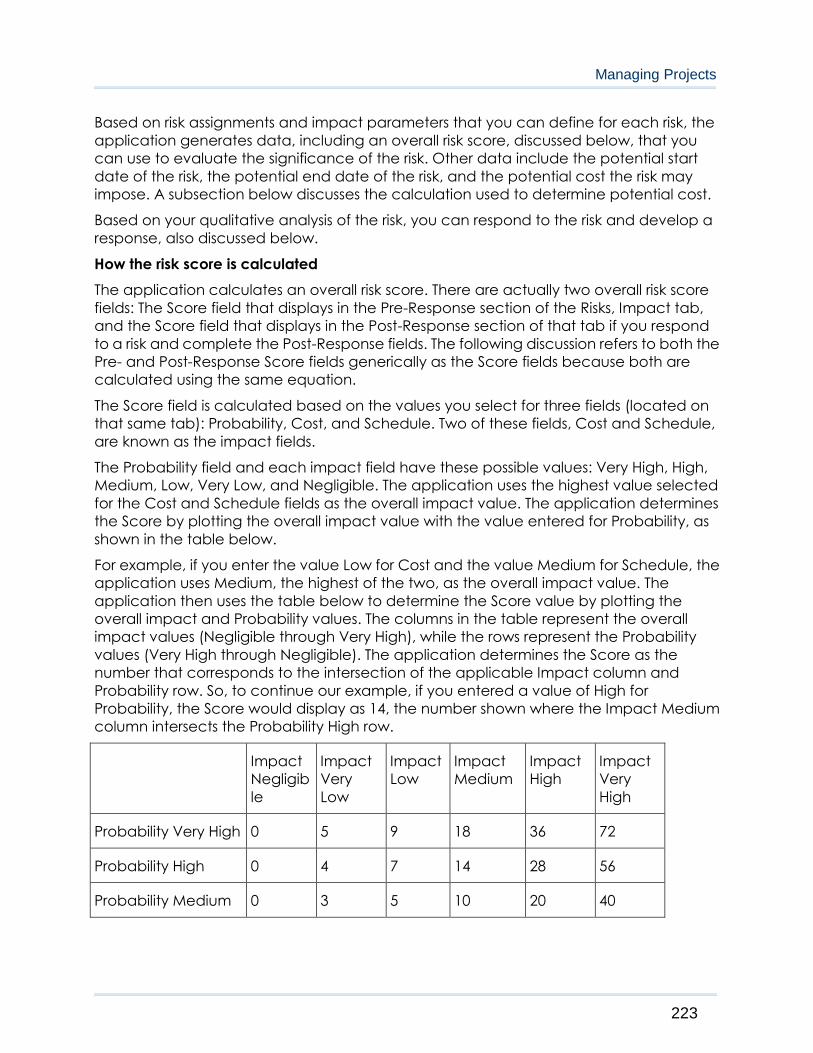
Managing Projects
223
Based on risk assignments and impact parameters that you can define for each risk, the
application generates data, including an overall risk score, discussed below, that you
can use to evaluate the significance of the risk. Other data include the potential start
date of the risk, the potential end date of the risk, and the potential cost the risk may
impose. A subsection below discusses the calculation used to determine potential cost.
Based on your qualitative analysis of the risk, you can respond to the risk and develop a
response, also discussed below.
How the risk score is calculated
The application calculates an overall risk score. There are actually two overall risk score
fields: The Score field that displays in the Pre-Response section of the Risks, Impact tab,
and the Score field that displays in the Post-Response section of that tab if you respond
to a risk and complete the Post-Response fields. The following discussion refers to both the
Pre- and Post-Response Score fields generically as the Score fields because both are
calculated using the same equation.
The Score field is calculated based on the values you select for three fields (located on
that same tab): Probability, Cost, and Schedule. Two of these fields, Cost and Schedule,
are known as the impact fields.
The Probability field and each impact field have these possible values: Very High, High,
Medium, Low, Very Low, and Negligible. The application uses the highest value selected
for the Cost and Schedule fields as the overall impact value. The application determines
the Score by plotting the overall impact value with the value entered for Probability, as
shown in the table below.
For example, if you enter the value Low for Cost and the value Medium for Schedule, the
application uses Medium, the highest of the two, as the overall impact value. The
application then uses the table below to determine the Score value by plotting the
overall impact and Probability values. The columns in the table represent the overall
impact values (Negligible through Very High), while the rows represent the Probability
values (Very High through Negligible). The application determines the Score as the
number that corresponds to the intersection of the applicable Impact column and
Probability row. So, to continue our example, if you entered a value of High for
Probability, the Score would display as 14, the number shown where the Impact Medium
column intersects the Probability High row.
Impact
Negligib
le
Impact
Very
Low
Impact
Low
Impact
Medium
Impact
High
Impact
Very
High
Probability Very High 0 5 9 18 36 72
Probability High 0 4 7 14 28 56
Probability Medium 0 3 5 10 20 40

P6 Professional User's Guide
224
Probability Low 0 2 3 6 12 24
Probability Very Low 0 1 1 2 4 8
Probability
Negligible
0 0 0 0 0 0
How the potential cost is calculated
The application calculates the potential cost of a risk. The potential cost displays in the
Pre-Response Exposure Cost and Post-Response Exposure Cost fields on the Risks, General
tab. (The Post-Response Exposure Cost field displays only after a response is made to a
risk using the Post-Response fields on the Impact tab.) The following discussion refers to
both the Pre- and Post-Response Exposure Cost fields generically as Exposure Cost fields
because both are calculated using the same equation.
The value for the Exposure Cost field is based on the values selected for the Probability
and Cost fields, located on the Risks, Impact tab, and on cost figures associated with the
activities assigned to the risk or to the project, if no activity assignments have been
made.
The application calculates the Exposure Cost value using this equation: Exposure Cost =
Planned/Budgeted Total Cost * (Probability Midpoint * Cost Midpoint).
The Planned/Budgeted Total Cost is the sum of the Planned/Budgeted Cost values for
each activity assigned to the risk (or the planned project cost, if no activities are assigned
to the risk).
The Probability Midpoint is the midpoint of the Probability field value for the selected risk.
The Cost Midpoint is the midpoint of the Cost field value for the selected risk. The way
each is calculated is discussed below.
Note: The Cost and Probability midpoint for the value Negligible is always zero, so the
value of Negligible is not relevant to the following discussion.
The equation for the calculation of Probability Midpoint and Cost Midpoint varies,
depending on which values are selected for the Probability and Cost fields:
When using a value between highest and lowest:
When a value of High (50% to 70%), Medium (30% to 50%), or Low (10% to 30%) is
selected for the Probability field, then the Probability Midpoint is calculated using
this equation: Probability Midpoint = (lower range for selected value + higher
range of selected value)/2. So if the Probability value is Medium (30% to 50%), then
the Probability Midpoint is calculated as follows: (30+50)/2 = 40%.
When a value of High (20% to 40%), Medium (10% to 20%), or Low (1% to 10%) is
selected for the Cost field, then the Cost Midpoint is calculated using the same
equation as Probability Midpoint. So if the Cost value is Medium (10% to 20%), then
the midpoint is calculated as follows: (10 + 20)/2 = 15%
Managing Projects
225
For highest values:
When the value Very High (70% or higher) is selected for the Probability field, then
the Probability Midpoint is calculated as the midpoint between the lower value
and 100%. So the Probability Midpoint for the value Very High (70% or higher)
midpoint is calculated as follows: (70 + 100)/2 = 85%.
When the value Very High (40% or higher) is selected for the Cost field, then the
Cost Midpoint is calculated using this equation: ((the lower range for the selected
value * 2) + the high range for the selected value)/2. So the Cost Midpoint for the
value Very High (40% or higher) is calculated as follows: ((40 * 2) + 100)/2 = 90%.
For lowest values:
When the value Very Low (<=10%) is selected for the Probability field, then the
Probability Midpoint is calculated as the midpoint between zero and the upper
value. So the Probability Midpoint for the value Very Low is calculated as follows:
(0 + 10)/2 = 5%.
When the value Very Low (Up to 1%) is selected for the Cost field, then the Cost
Midpoint is calculated as the midpoint between zero and the upper value. So the
Cost Midpoint for the value Very Low is calculated as follows: (0 + 1)/2 = .005%.
So if the Planned/Budgeted Total Cost is $700,689.00, and the Probability Midpoint is
Medium (40%), and the Cost Midpoint is Very High (90%), then the Exposure Cost would
be calculated as follows: $700,689.00 * (.4 * .9) = $252,248.00.
Responding to a Risk
If, based on your qualitative analysis of a risk, you determine that a risk is sufficient to
warrant a response, then you can do so by selecting a response and by adding a
response description. If the risk is a threat, you can select to accept, avoid, transfer, or
reduce the risk. If the risk is an opportunity, you can select to enhance, exploit, facilitate,
or reject the risk.
Response planning allows you to identify and document methods you might use to
manage risks. Use a risk response to determine what actions could be taken to promote
the most favorable outcome. You can enter a description of the risk and then select
post-response values for Probability, Schedule, and Cost fields, which the application
uses to calculate the score and the exposure cost.
Creating Risks (P6 Professional Only)
Add risks to capture potential threats or opportunities that might impact your project,
and to perform qualitative analysis to reduce or eliminate negative impact on the
project. After you add a risk, it can be assigned to activities.
Note: You must have Add/Edit/Delete Risks privilege to add, edit, or remove risks.
To add a risk:
1) Choose Project, Risks.
P6 Professional User's Guide
226
2) Display Risk Details.
3) Click on the Edit toolbar or choose Edit, Add.
4) Click the General tab.
5) On the General tab:
a. In the ID field, edit the identifier if you want a different one. (It must be a unique
identifier.)
b. In the Name field, type the risk's name.
c. In the Category field, click . Select the Risk Category then click the Select
button.
d. In the Type list, select the risk type.
e. In the Owner field, click . Select the resource who owns this risk, then click the
Select button. If resource security is enabled, you can only view current project
resources and resources you have access to.
f. In the Status list, select a status for the risk.
g. Exposure Start displays the earliest date the risk may occur.
h. Exposure Finish displays the potential end date of the risk.
i. Pre-Response Exposure Cost displays the cost the risk may impose.
j. Post-Response Exposure Cost displays the cost the risk may impose based on your
response.
k. In the Identified On field, type or select the date this risk was identified.
l. In the Identified By field, click . Select the resource who identified this risk.
6) Click the Risk Details, Impact tab.
7) On the Impact tab, Pre-Response section:
a. In the Probability list, select the likelihood range of the risk occurring.
b. In the Schedule list, select the impact range on the schedule if the risk occurs.
c. In the Cost list, select the monetary impact on the project if the risk occurs.
d. Observe the Score field. It shows the risk calculation based on the values you
selected for the Probability, Cost, and Schedule fields.
Tip
You can copy existing risks to create new risks. If you copy an existing risk to the same
project, all data, including response and associated activities is retained. If you copy
an existing risk to a different project, activity associations and responses are removed.
Assigning a risk to an activity (P6 Professional Only)
Once a risk has been added, you can assign the risk to an activity to explicitly identify the
activity impacted by the risk.
Note: You must have Add/Edit/Delete Risks and Add/Edit Activities Except Relationships
privileges to assign or remove risks.
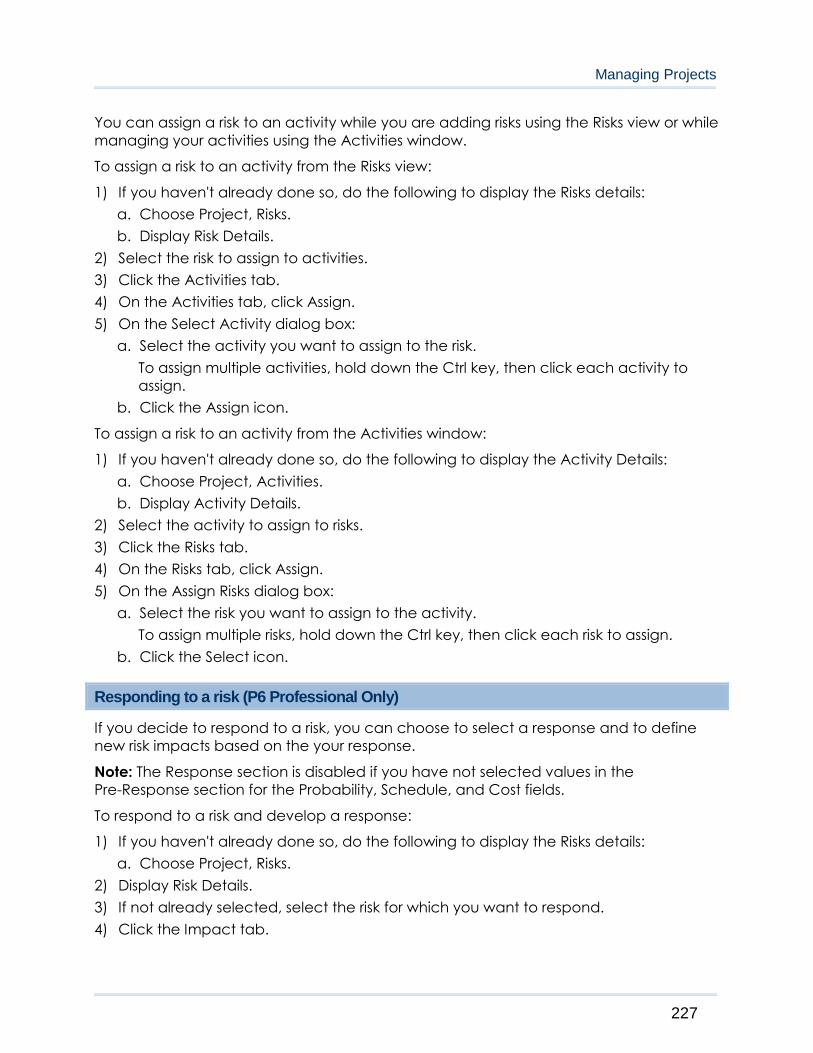
Managing Projects
227
You can assign a risk to an activity while you are adding risks using the Risks view or while
managing your activities using the Activities window.
To assign a risk to an activity from the Risks view:
1) If you haven't already done so, do the following to display the Risks details:
a. Choose Project, Risks.
b. Display Risk Details.
2) Select the risk to assign to activities.
3) Click the Activities tab.
4) On the Activities tab, click Assign.
5) On the Select Activity dialog box:
a. Select the activity you want to assign to the risk.
To assign multiple activities, hold down the Ctrl key, then click each activity to
assign.
b. Click the Assign icon.
To assign a risk to an activity from the Activities window:
1) If you haven't already done so, do the following to display the Activity Details:
a. Choose Project, Activities.
b. Display Activity Details.
2) Select the activity to assign to risks.
3) Click the Risks tab.
4) On the Risks tab, click Assign.
5) On the Assign Risks dialog box:
a. Select the risk you want to assign to the activity.
To assign multiple risks, hold down the Ctrl key, then click each risk to assign.
b. Click the Select icon.
Responding to a risk (P6 Professional Only)
If you decide to respond to a risk, you can choose to select a response and to define
new risk impacts based on the your response.
Note: The Response section is disabled if you have not selected values in the
Pre-Response section for the Probability, Schedule, and Cost fields.
To respond to a risk and develop a response:
1) If you haven't already done so, do the following to display the Risks details:
a. Choose Project, Risks.
2) Display Risk Details.
3) If not already selected, select the risk for which you want to respond.
4) Click the Impact tab.
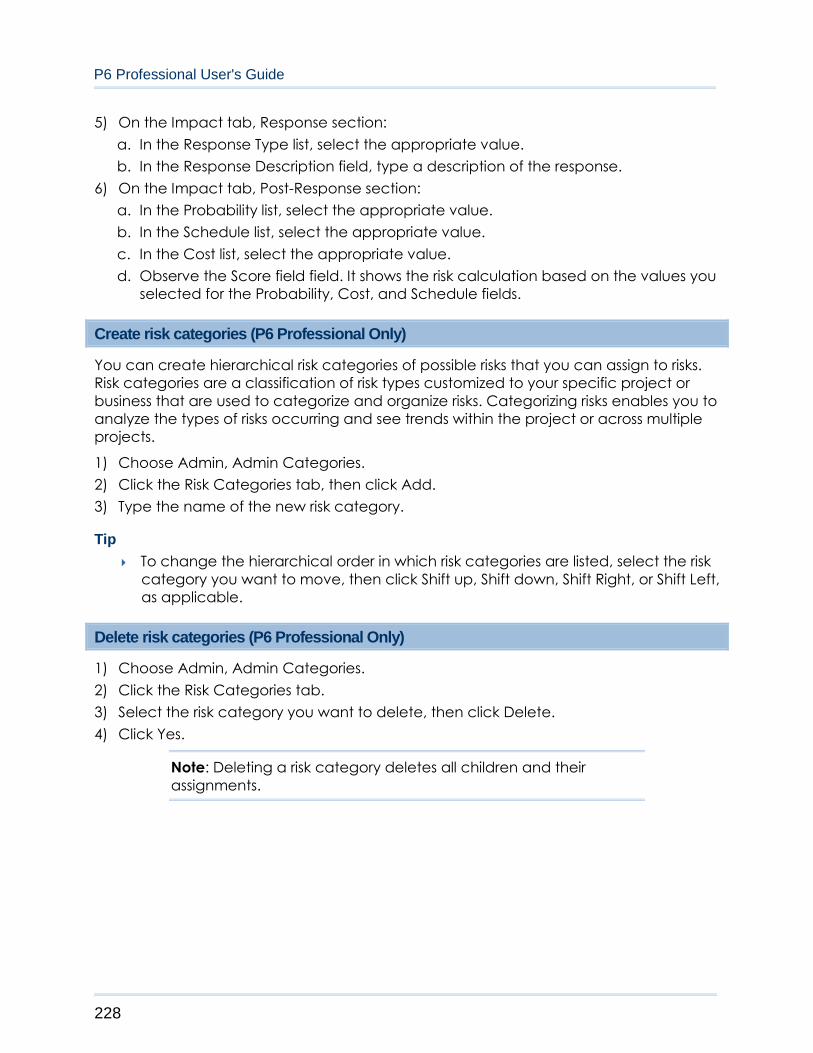
P6 Professional User's Guide
228
5) On the Impact tab, Response section:
a. In the Response Type list, select the appropriate value.
b. In the Response Description field, type a description of the response.
6) On the Impact tab, Post-Response section:
a. In the Probability list, select the appropriate value.
b. In the Schedule list, select the appropriate value.
c. In the Cost list, select the appropriate value.
d. Observe the Score field field. It shows the risk calculation based on the values you
selected for the Probability, Cost, and Schedule fields.
Create risk categories (P6 Professional Only)
You can create hierarchical risk categories of possible risks that you can assign to risks.
Risk categories are a classification of risk types customized to your specific project or
business that are used to categorize and organize risks. Categorizing risks enables you to
analyze the types of risks occurring and see trends within the project or across multiple
projects.
1) Choose Admin, Admin Categories.
2) Click the Risk Categories tab, then click Add.
3) Type the name of the new risk category.
Tip
To change the hierarchical order in which risk categories are listed, select the risk
category you want to move, then click Shift up, Shift down, Shift Right, or Shift Left,
as applicable.
Delete risk categories (P6 Professional Only)
1) Choose Admin, Admin Categories.
2) Click the Risk Categories tab.
3) Select the risk category you want to delete, then click Delete.
4) Click Yes.
Note: Deleting a risk category deletes all children and their
assignments.

Managing Projects
229
Adding and Assigning Work Products and Documents
Work Products and Documents
The Work Products and Documents feature enables you to catalog and track all
project-related documents and deliverables. This includes guidelines, procedures,
standards, plans, design templates, worksheets, and all types of project deliverables. A
work product or document can provide standards and guidelines for performing an
activity's work, or it can be formally identified as a project standard. A work product or
document can also be activity output, such as testing plans and blueprints. You can also
use the Work Products and Documents feature to identify project deliverables,
documents that will be delivered to the end user or customer at the end of the project.
With P6 Professional, you can assign work products and documents to activities and to
work breakdown structure (WBS) elements. During a project's early planning stages, you
can assign a work product or document to a WBS element. Later, you can assign the
same work product or document to one or more activities as your project's activity
details develop.
The Work Products and Documents feature enables you to maintain general information
about project documents, such as revision date, location, and author. The actual
document files can be stored on a network file server, configuration management
system, or Web site, depending on project requirements. You can specify a public or
private location for the document files. Specifying a public location enables any P6
Professional user to view the document.
View a project's document library
Choose Project, Work Products and Documents.
Tip
To change the document display from outline to list view, click the Title column
label. A triangle symbol in the Title column label indicates a list display.
Add a work product or document record
Before you can assign a work product or documents to a project, you need to add a
record for it in the project database.
1) Choose Project, Work Products & Documents.
2) Click on the Edit toolbar or choose Edit, Add.
3) Type a title for the document.
4) To record general details for the document, such as title, reference number, and
author, display WP & Doc Details, click the General tab, then type the information.

P6 Professional User's Guide
230
Assign a document status or category
Document status and category designations can help you track project work products
and documents. For example, status designations can identify which documents are in
review or completed, and category designations can identify documents that are
project standards or project deliverables. You create document status and document
category designations through the Administrative Categories feature and assign status
and category designations in the Work Products & Documents window.
1) Choose Project, Work Products and Documents, then select the document.
2) Display WP & Doc Details, then click the General tab.
3) In the Document Category field, click , select a category, then click the Select
button.
4) In the Status field, select a status.
Specify work product and document location references
P6 Professional supports two types of document location references, private and public.
Private location references can only be viewed by P6 Professional users. Public location
references can be viewed by all project participants. For this reason, public location
references typically refer to files stored in a widely accessible network location such as
an intranet or the Internet.
1) Choose Project, Work Products and Documents, then select the work product or
document.
2) Display WP & Doc Details, then click the Files tab.
3) In the appropriate location field, type the full path and filename of the document.
Tip
Click the Browse button to select a file.
Identify a document as a work product
You can identify a document as a work product if it is assigned to a WBS element or
activity.
1) Choose Project, Work Products & Documents, then select the document.
2) Display WP & Doc Details, then click the Assignments tab.
3) If the document is already assigned to the WBS or activity for which it is a work
product, mark the corresponding Work Product checkbox.
If the document is not yet assigned to a WBS element or activity, click Assign, then
select the WBS element or activity to which you want to assign the document. Click
the Assign button and the Close button, then mark the Work Product checkbox.

Managing Projects
231
Display work product and document details in the WPs and Docs window
Right-click and select WP & Doc Details.
Display work product and document details in the Activities window
1) Choose Project, Activities.
2) Select an activity associated with the document.
3) Display Activity Details, then click the WPs & Docs tab.
To display the WPs & Docs tab, click the Layout Options bar and choose Bottom
Layout Options. In the Available Tabs section, select WPs & Docs, click , then click
OK.
4) Select the work product or document, then click Details.
To view the work product or document, click Launch next to the appropriate
Location field.
Note
Only P6 Professional users can open private location documents. Public location
documents can be viewed by all project participants.
Display work product and document details in the Work Breakdown Structure window
1) Choose Project, WBS.
2) Select a WBS element associated with the work product or document.
3) Display WBS Details, then click the WPs & Docs tab.
To display the WPs & Docs tab, right-click in the Details area and choose Customize
WBS Details. In the Available Tabs section, select WPs & Docs, click , then click OK.
4) Select the work product or document, then click Details.
To view the work product or document, click Launch next to the appropriate
Location field.
Note
Only P6 Professional users can open private location documents. Public location
documents can be viewed by all project participants.
Assign work products and documents from the WPs and Docs window
1) Select the work product or document.
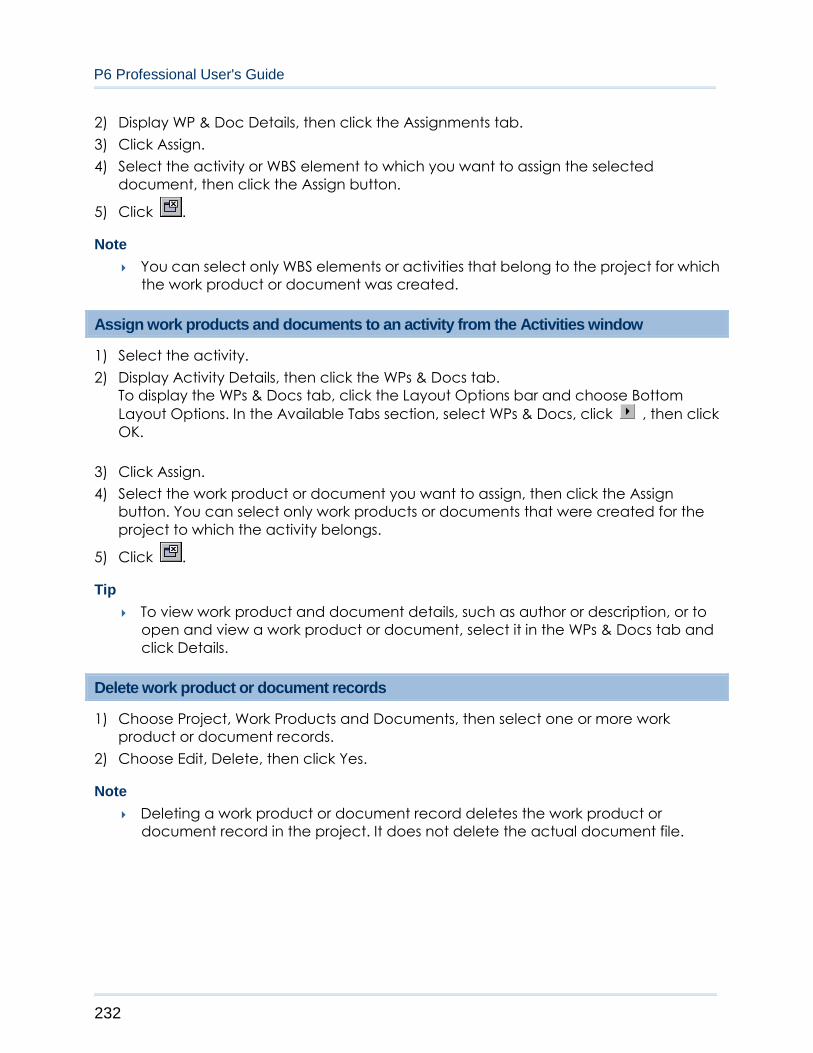
P6 Professional User's Guide
232
2) Display WP & Doc Details, then click the Assignments tab.
3) Click Assign.
4) Select the activity or WBS element to which you want to assign the selected
document, then click the Assign button.
5) Click .
Note
You can select only WBS elements or activities that belong to the project for which
the work product or document was created.
Assign work products and documents to an activity from the Activities window
1) Select the activity.
2) Display Activity Details, then click the WPs & Docs tab.
To display the WPs & Docs tab, click the Layout Options bar and choose Bottom
Layout Options. In the Available Tabs section, select WPs & Docs, click , then click
OK.
3) Click Assign.
4) Select the work product or document you want to assign, then click the Assign
button. You can select only work products or documents that were created for the
project to which the activity belongs.
5) Click .
Tip
To view work product and document details, such as author or description, or to
open and view a work product or document, select it in the WPs & Docs tab and
click Details.
Delete work product or document records
1) Choose Project, Work Products and Documents, then select one or more work
product or document records.
2) Choose Edit, Delete, then click Yes.
Note
Deleting a work product or document record deletes the work product or
document record in the project. It does not delete the actual document file.
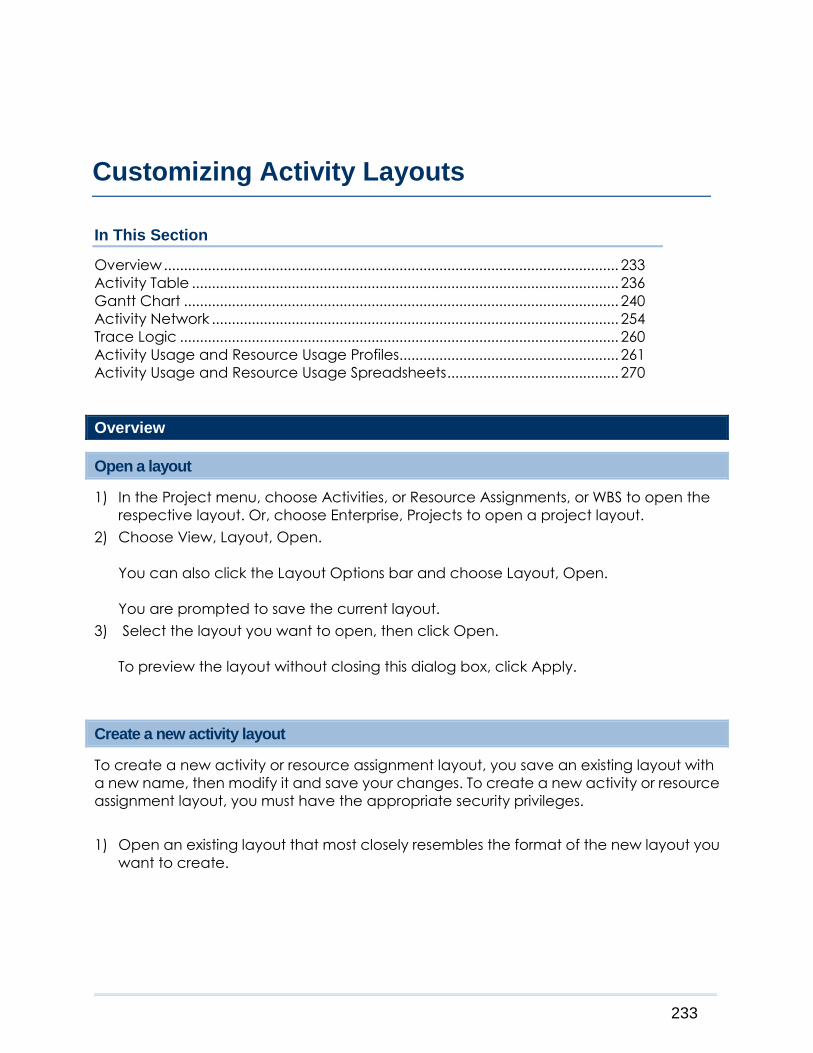
233
In This Section
Overview .................................................................................................................. 233
Activity Table ........................................................................................................... 236
Gantt Chart ............................................................................................................. 240
Activity Network ...................................................................................................... 254
Trace Logic .............................................................................................................. 260
Activity Usage and Resource Usage Profiles....................................................... 261
Activity Usage and Resource Usage Spreadsheets ........................................... 270
Overview
Open a layout
1) In the Project menu, choose Activities, or Resource Assignments, or WBS to open the
respective layout. Or, choose Enterprise, Projects to open a project layout.
2) Choose View, Layout, Open.
You can also click the Layout Options bar and choose Layout, Open.
You are prompted to save the current layout.
3) Select the layout you want to open, then click Open.
To preview the layout without closing this dialog box, click Apply.
Create a new activity layout
To create a new activity or resource assignment layout, you save an existing layout with
a new name, then modify it and save your changes. To create a new activity or resource
assignment layout, you must have the appropriate security privileges.
1) Open an existing layout that most closely resembles the format of the new layout you
want to create.
Customizing Activity Layouts

P6 Professional User's Guide
234
2) Choose View, Layout, Save As.
You can also click the Layout Options bar and choose Layout, Save As.
3) Type a name for the new layout.
4) In the Available To field, select a user category, then click Save.
To create a global layout, choose All Users.
To create a layout only for your own use, choose Current User.
To create a layout for another user, choose Another User. Then, in the User field, click
to specify the user.
5) Modify the layout, if necessary, then choose View, Layout, Save.
Note
If you save a layout for a specific user, the layout is listed in the Open Layout
dialog box only for that user. You must log in under the specified user name to
open the layout.
Save a layout as a project layout
You can save layouts in the Activities, Resource Assignments and WBS views as project
layouts. Layouts can be saved as project layouts in any project that you have opened
and to which you have Add/Edit Project Level Layouts privilege. Consider saving a layout
as a project layout if you want to do any of the following:
Export the project with the layout
Copy and paste the project and want the layout to be copied and pasted with
the project
Share the layout with other users of the project without unnecessarily adding
layouts to the global layouts
Saving the Layout as a Project Layout
Before you begin, you must have at least one project open.
1) Choose View, Layout, Save As.
You can also click the Layout Options bar and choose Layout, Save As.
2) Type a new name for the current layout.
3) In the Available To field, select Project.
4) In the Project field, click to specify a project. The Select Project dialog box
displays.

Customizing Activity Layouts
235
5) Select a project from the list.
Note:
Only currently opened projects will appear in the Select Project dialog box. To select
a project that is not in the list, cancel out of the Select Project and the Save Layout As
dialog boxes. Then use the Projects view to open both the project with the layout
you are copying and the target project. Ensure the project with the layout is the
default project. Then repeat the steps in this topic.
6) Click Save.
Notes
Only global or layout filters can be assigned to a project layout. When a layout is
saved as a project, any previously applied user filter is automatically copied to the
layout filters section.
Saving a layout as a project layout requires Add/Edit Project Level Layouts
privileges to the target project.
Exporting and Importing Layouts
Exporting a layout
1) In the Project menu, choose Activities, or Resource Assignments, or WBS to open the
respective layout. Or, choose Enterprise, Projects to open a project layout.
2) Choose View, Layout, Open.
You can also click the Layout Options bar and choose Layout, Open.
You are prompted you to save the current layout.
3) Highlight the layout you would like to export.
4) Click Export. Browse to the location where to save the . plf file.
5) Click Save.
Importing a layout
1) In the Project menu, choose Activities, or Resource Assignments, or WBS to open the
respective layout. Or, choose Enterprise, Projects to open a project layout.
2) Choose View, Layout, Open.
You can also click the Layout Options bar and choose Layout, Open.
You are prompted you to save the current layout.
3) Click Import. The application responds by prompting you to choose a . plf file.
4) In the Import Layout As dialog box, type an appropriate name for the layout.
5) In the Available To field, select a user category. Depending on your privileges, you
will be able to choose All Users, Another User, Current User, or Project.
P6 Professional User's Guide
236
If you selected Another User, in the User field, click to specify a user. The
Select User dialog box displays.
If you selected Project, in the Project field, click to specify a project. The Select
Project dialog box displays.
Note: Only currently opened projects will appear in the Select Project dialog box.
6) Click Save.
Copying Data to External Applications
You can copy data from P6 Professional and paste it into any external application, such
as Microsoft Excel or OpenOffice.
1) Navigate to any data table or spreadsheet window, select one or more rows,
right-click, and choose Copy.
2) Hold the Shift or Ctrl key to select multiple roles. All values, as well as associate rows
and column headers, are temporarily copied to the clipboard.
3) Open an external application and choose Paste to view or edit the data as needed.
For example, right-click in Excel, then choose Paste.
Notes:
Any edits made in an external application cannot be returned
to your P6 Professional project. Use this feature for reporting
only.
You may need to expand column widths to display all the
project information.
The external application may reformat the data. To prevent
this, reformat the cells as text before pasting the data, or paste
the data into a different application.
Activity Table
The Activity Table
Use the Activity Table to view the open project's activity information in table format. You
can customize Activity Table columns, fonts, and colors. You can also filter, sort, and
group the Activity Table.
You can use the Activity Table to
Create a list of activities and activity information quickly when you don't need to see
the information graphically over time.
Customizing Activity Layouts
237
Group activities in categories that share a common attribute. For example, focus on
activities by resource, responsibility, or date. Once you organize activities into groups,
you can summarize or "roll up" project data to simplify their presentation.
Sort activities to arrange them in an order you specify. For example, to view activities
chronologically, you might sort them by early start date.
To make the Activity Table fit your needs exactly, you can
Change the information displayed in columns to show scheduling data, resource and
cost data, user-defined fields, or any data item you select, including calculated data.
Format specific information to call attention to it by using the filter, group and sort,
and table display features.
Define Activity Table columns
1) Choose View, Columns.
You can also click the Layout Options bar and choose Columns.
2) To add a column to the Activity Table, select it in the Available Columns section, then
click .
3) To add all available columns to the Activity Table, click .
4) To remove a column from the Activity Table, select it in the Selected Options section,
then click .
5) To remove all current display columns from the Activity Table, click .
You must select at least one column to display in the Activity Table.
6) To change the order in which columns display, in the Selected Options section, select
a column you want to move:
To move the column left, click .
To move the column right, click .
7) To use a column display format from another activity layout, click Copy From, select a
layout, then click Open.
8) To update columns in the Activity Table, click OK, or to view your changes without
closing this dialog box, click Apply.
To restore the default column settings for this layout, click Default.
P6 Professional User's Guide
238
Tip
To locate a specific column in the Columns dialog box, to group and sort the
available columns in the Columns dialog box, or to collapse or expand all the
groupings in the dialog box, click the Available Columns Options bar.
Customize activity column titles
1) Choose View, Columns.
You can also click the Layout Options bar and choose Columns.
2) In the Available Columns or Selected Options section, select the column whose title
you want to change.
3) Click Edit Column.
4) In the Edit Column dialog box, type a new title, then click OK.
You can also specify a new width and alignment for the column.
5) To update columns in the Activity Table, click OK, or to view your changes without
closing the Columns dialog box, click Apply.
Notes
The default column title appears in parentheses after the new title in the Columns
dialog box; however, only your revised title appears in the actual layout.
To restore the default column title, click Default in the Edit Column dialog box.
Change activity information in the Activity Table
To change activity information, double-click the information you want to change.
Note
You may need the required security privileges to edit certain activity information.
Sort activity information in the Activity Table
To sort the display, click a column label.
A down arrow in the column title indicates that the Activity Table is sorted highest to
lowest (numerical column) or A to Z (alphabetical column). An up arrow in the
column title indicates that the Activity Table is sorted lowest to highest.
Customizing Activity Layouts
239
Change group row fonts and colors
1) Choose View, Group and Sort.
You can also click the Layout Options bar and choose Group and Sort.
2) Double-click the Font & Color cell you want to change.
To change a font, click the Font button, then select a new font.
To change a color, click the Color button, then select a new color.
Change Activity Table font, color, and row height
You can specify the font, background color, and row height for information displayed in
a table.
1) Choose View, Table Font and Row.
2) To specify a general table font, click the Font button.
3) To select a background color, click the Color button.
4) In the Row Height area:
To use the current row heights you set, mark the Keep Current Row Heights checkbox.
To automatically size row heights based on the cell content, clear the Keep Current
Row Heights checkbox and choose Optimize row heights by content. Mark the
checkbox, Do not exceed X lines per row, to limit the amount of lines created by text
wrapping and optimizing the row heights.
To specify a row height for all rows in the current layout, clear the Keep Current Row
Heights checkbox and choose Select height for all rows. Type a new row height in the
field, or click the arrow buttons.
5) To display symbols, mark the Show Icons checkbox.
6) Click OK.

P6 Professional User's Guide
240
Gantt Chart
The Gantt Chart
Use the Gantt Chart to view a graphical display of the open project's schedule
information or the order in which activities occur over the course of the project. The
Gantt Chart shows each activity's duration, using the timescale specified, as a horizontal
bar. A line connecting activity bars indicates a relationship.
Use the Gantt Chart in combination with the Activity Table to
View activities both graphically and in table format
Establish relationships between activities, so you can see how changing activity
duration affects the start and finish dates of other activities and the project finish date
Track progress by comparing planned and actual start and finish dates and by
checking the percentage of each activity that is complete
To use the Gantt Chart more effectively, you can
Change the information displayed in columns to show scheduling data, resource and
cost data, user-defined fields, or any data item you select
Distinguish schedule dates by using different formats and colors for the bars and
endpoints
Change the timescale to show more or less detail
Change background lines to enhance the readability or clarity of the Bar Chart
Display the Gantt Chart
With the Activities, Projects, or Work Breakdown Structure windows active, do one of the
following:
Choose View, Show on Top or Show on Bottom, Gantt Chart.
Click the Layout Options bar and choose Show on Top or Show on Bottom, Gantt
Chart.
Click on the Top Layout toolbar.
Tips
In the Projects and Work Breakdown Structure windows, you can only display the
Gantt Chart in the top layout.
To hide the Activity Table and display only the Gantt Chart, drag the split bar that
separates the Activity Table from the Gantt Chart all the way to the left.
Customizing Activity Layouts
241
Change a layout's timescale format
You can change the timescale for a Gantt Chart, profile, or spreadsheet. When one of
these layout components is displayed in both the Top and Bottom Layout windows,
changing the timescale affects both windows.
1) Display the Gantt Chart, profile, or spreadsheet then click the Layout Options bar and
choose Timescale.
2) Choose to display Two Lines or Three Lines for the timescale.
3) To indicate the beginning date from which you want to display data, in the Timescale
Start field click , then select a standard date or a custom date.
4) Click the Font & Color button to format the font type, size, and color for the timescale
and column headings. Click Default Font to change the timescale to its original font
and color settings.
5) In the Date Format section, choose to show the primary dates to specify the date
interval increments for the timescale, or ordinal dates to display the date intervals as
sequential numbers, beginning from the ordinal start date specified.
If you choose Show Primary Dates, in the Type field, select the format in which to
display date intervals.
In the Date Interval field, select an interval. If you choose Day/Shift, click in the Shift
Calendar field and select a shift.
If you choose Ordinal Dates, specify a start date for the ordinal dates in the Ordinal
Start field. Then, select the ordinal date interval.
6) Click OK.
To see the timescale settings without closing the Timescale dialog box, click Apply.
Notes
If you customize a profile or spreadsheet to display past period actual data (rather
than actual to date values) and you want to display a financial period timescale,
choose Calendar or Fiscal as the Type. Then, in the Date Interval field choose
Year/Financial Period, Quarter/Financial Period, Month/Financial Period, or
Week/Financial Period. You can display a financial period timescale at any time,
even if you do not store past period actuals.
When you customize a profile or spreadsheet to display a financial period
timescale, activity and resource data must be summarized by financial period to
accurately display actual to date values for closed projects.
P6 Professional User's Guide
242
When connected to a P6 Professional database: If you have administrator rights,
you can choose to summarize data in financial period intervals by choosing
Admin, Preferences. Select the Options tab, then select the 'By financial period'
checkbox.
When connected to a P6 EPPM database: If you have administrator rights, you
can choose to summarize data in financial period intervals from the P6
Application Settings.
Move around a Gantt Chart
To change the timeperiod for which the Gantt Chart displays activities, move the
mouse pointer over the major time unit of the timescale until the mouse pointer turns
into a hand. Click and hold the mouse button while dragging it. To move backward in
time, drag the mouse pointer to the right. To move forward in time, drag the mouse
pointer to the left.
To expand or contract the Gantt chart’s visible area, move the mouse over the minor
time unit of the timescale. Click the mouse button down and hold it. To expand the
Gantt Chart, drag the mouse pointer to the right. To contract the Gantt Chart, drag
the mouse pointer to the left.
Tip
You can also use the horizontal scroll bar at the bottom of the Gantt Chart to
change the timeperiod for which the layout is displaying information.
Add a bar to the Gantt Chart
1) Choose View, Bars.
You can also click the Layout Options bar and choose Bars.
2) Click Add.
3) Mark the Display checkbox next to the new bar.
4) Type a name for the new bar.
5) In the Timescale column, select the timescale you want the new Gantt Chart bar to
represent.
6) In the Filter column, choose the filter you want to attach to the bar.
Filters determine which activities the bar represents.
7) Click the Bar Style tab and configure the new bar's style.
The Preview column shows you what the configured bar will look like in the Gantt
Chart.
8) Click the Bar Settings tab and select grouping and necking options.
9) Click the Bar Labels tab and specify the new bar’s label and position.
10) To preview your changes, click Apply.

Customizing Activity Layouts
243
Note
To restore the default bar settings, click Default.
Change a bar in the Gantt Chart
1) Choose View, Bars
You can also click the Layout Options bar and choose Bars.
2) Select the bar you want to change and mark or clear the Display checkbox.
3) In the Name column, type a new name for the bar.
4) In the Timescale column, select the timescale you want the Gantt Chart bar to
represent.
5) In the Filter column, choose the filter you want the Gantt Chart bar to represent.
6) Click the Bar Style tab and reconfigure the Gantt Chart bar's style.
7) Click the Bar Settings tab and select grouping and necking options.
8) Click the Bar Labels tab and redefine the Gantt Chart bar’s label and position.
9) Click OK.
To view your changes without closing this dialog box, click Apply.
Apply Gantt Chart settings from another layout
1) Choose View, Bars.
You can also click the Layout Options bar and choose Bars.
2) Click Copy From.
3) Select the layout with the Gantt Chart settings you want to apply.
To view the Gantt Chart settings, click Apply.
To apply the selected layout’s Gantt Chart settings and close the dialog box, click
Open.
Position a bar in the Gantt Chart
1) Choose View, Bars.
You can also click the Layout Options bar and choose Bars.
2) Select the Gantt Chart bar for which you want to specify a position.
P6 Professional User's Guide
244
3) Click the Bar Style tab.
4) In the Options section, specify a row.
Bars are drawn on the Gantt Chart according to their position in the Bars dialog box.
Rows indicate where bars should be drawn: bars can be drawn stacked one above
another, or occupying the same row so that only some of the bars are visible.
5) Click OK.
To view your changes without closing this dialog box, click Apply.
Tip
When displaying the Gantt chart, you can increase the space between the bars
by adjusting the height of rows in the Activity Table.
Change the background lines in the Gantt Chart
1) Choose View, Bars.
You can also click the Layout Options bar and choose Bars.
2) Click Options.
3) Click the Sight Lines tab.
4) To show background horizontal lines before every Summary bar, mark the Show Major
Lines checkbox in the Horizontal Lines section.
5) To show background horizontal lines at a specific interval of rows, mark the Show
Minor Lines Every checkbox in the Horizontal Lines section, then type or select the row
interval at which you want to the minor lines to be displayed.
6) To show background vertical lines based on a time interval you specify, mark the
Show Major Lines Every checkbox in the Vertical Lines section.
Select the line style and specify the number of time intervals to display the sight line,
then select the time unit.
7) To show minor vertical lines, mark the Show Minor Lines Every checkbox and format
the lines as described in Step 6.
To view your changes without closing this dialog box, click Apply.
Show or hide the Gantt Chart legend
1) Choose View, Barchart Options.
2) Click the General tab.

Customizing Activity Layouts
245
3) To display the Gantt Chart legend, mark the Show Legend checkbox.
To hide the Gantt Chart legend, clear the Show Legend checkbox.
4) Click OK.
To view your changes without closing this dialog box, click Apply.
Note
You can move the legend within the Gantt Chart. Move the mouse over the
legend, click and hold the mouse button, and drag the legend.
Show or hide relationship lines in the Gantt Chart
1) Choose View, Barchart Options.
2) Click Options.
3) Click the General tab.
4) To display relationship lines in the Gantt Chart, mark the Show Relationships
checkbox.
To hide relationship lines, clear the Show Relationships checkbox.
You can also click on the Top Layout toolbar to show or hide relationship lines.
5) Click OK.
To view your changes without closing this dialog box, click Apply.
Customize the data date line
You can customize the data date line in the Activities and Tracking windows.
1) With the Activities window active, choose View, Bars. You can also click the Layout
Options bar and choose Bars.
With the Tracking window active, display the layout, then choose View, Bars. You can
also click the Display Options bar (in the right pane) in the Top Layout window and
choose Top Layout Options, Bars.
2) Click Options.
3) Click the Data Date tab.
P6 Professional User's Guide
246
4) To change the style for your data date line, select a style from the drop down list. The
line can be solid, or contain dashes and dots.
To change the thickness of your data date line, select a value between 1 and 10
pixels. This option is only available when the solid line is selected as the style. If your
line style is something other than the solid line and you increase the size to a number
greater than one, the bar style will switch to a solid line.
To change the color of your data date line, choose a color from the color palette.
5) Click OK.
To view your changes without closing this dialog box, click Apply.
Change a Gantt Chart bar's filter - under Gantt Chart
1) Choose Project, Activities, then display the Gantt Chart.
2) Choose View, Bars.
You can also click the Layout Options bar and choose Bars.
3) Select the Gantt Chart bar for which you want to change the filter.
4) Double-click the Filter column.
5) Mark the checkbox next to each filter you want to use.
To view a filter's settings before applying it to your Gantt Chart bar, click Modify. You
can only view and modify user-defined filters.
6) Click OK.
To view your changes without closing this dialog box, click Apply.
Change a Gantt Chart bar's label - under Gantt Chart
1) Choose View, Bars.
You can also click the Layout Options bar and choose Bars.
2) Select the Gantt Chart bar for which you want to change the label.
3) Click the Bar Labels tab.
4) To add a label to a bar, click the Add button at the bottom of the Bar Labels tab.
Customizing Activity Layouts
247
5) To remove a label from a bar, select the label you want to remove and click the
Delete button at the bottom of the Bar Labels tab.
6) To change the position of a label, select the label for which you want to change the
position, then double-click the Position column and select a position from the list.
7) To change the label's display value, select the label for which you want to change
the display value, then double-click the Label column and select a display value from
the list.
8) Click OK.
To view your changes without closing this dialog box, click Apply.
Change a Gantt Chart bar's settings
1) Choose View, Bars.
You can also click the Layout Options bar and choose Bars.
2) Select the Gantt Chart bar for which you want to change the label.
3) Click the Bar Settings tab.
4) To include the selected bar when you collapse the display to summary-level
information, select Show bar when collapsed.
5) To display the selected bar as a summary bar only, select Show bar for grouping
bands.
6) To show the selected bar's nonwork time as a neck based on the activity's calendar,
select Calendar nonwork time.
7) To show the selected bar's nonwork intervals as a neck based on out-of-sequence
progress and suspended/resumed activities, select Activity nonwork intervals.
8) Click OK.
To view your changes without closing this dialog box, click Apply.
Customize collapsed bars in the Gantt Chart
1) In the Bars dialog box, click Options.
2) Click the Collapsed Bars tab.
3) Choose the Collapse to Grouping Bands option to display the activity bars as a single
bar.
P6 Professional User's Guide
248
4) If the Show Relationships checkbox in the General tab is marked, you can mark the
Show Relationships for Collapsed Bars to show relationship lines from the collapsed
bar to other collapsed and individual bars.
5) On the Bars dialog box Bar Settings tab, under the Bar Necking Settings section, mark
the Calendar Nonwork Time checkbox to show nonwork time from the activity's
calendar as a neck, or thin bar, on the collapsed bar.
6) Mark the Activity Nonwork Intervals checkbox to show a neck, or thin bar, for activity
and/or calendar nonwork time, including suspend/resume dates.
Change a Gantt Chart bar's style - under Gantt Chart
1) Choose View, Bars.
You can also click the Layout Options bar and choose Bars.
2) Select the Gantt Chart bar for which you want to change the display style.
3) Click the Bar Style tab.
4) To change the shape of the bar’s Start Endpoint (first field), the height and position of
the bar (second field), and Finish Endpoint (end field), click each corresponding field
and select a shape.
5) To change the color of the bar’s Start Endpoint (first field), body (second field), and
the Finish Endpoint (end field), click each corresponding field and select a color.
6) To change the pattern of the bar’s Start Endpoint (first field), body (second field), and
Finish Endpoint (end field), click each corresponding field and select a pattern.
7) In the Options section, specify whether to show the bar when collapsed, as summary
bars only, or both.
8) Specify a row.
Rows indicate where the bars should be drawn on the Gantt Chart: bars can be
drawn stacked one above another, or occupying the same row so that only some of
the bars are visible.
9) Click OK.
To view your changes without closing this dialog box, click Apply.
Note
Bars are drawn on the Gantt Chart according to their position in the Bars dialog
box. Bars at the bottom of the list are drawn below bars higher in the list when the
bars are stacked; they are drawn on top of bars that are higher in the list when
these bars occupy the same row.

Customizing Activity Layouts
249
Change a Gantt Chart bar's timescale - under Gantt Chart
1) Choose View, Bars.
You can also click the Layout Options bar and choose Bars.
2) Select the Gantt Chart bar for which you want to change the timescale.
3) In the Timescale column, select the timescale you want the Gantt Chart bar to
represent.
4) Click OK.
To view your changes without closing this dialog box, click Apply.
Change an activity's start and finish dates in the Gantt Chart
1) Move the mouse pointer over the activity’s Gantt Chart bar end until it displays a
hand pointer.
2) Click and hold the mouse button.
To move the activity’s start date and finish date back in time, drag the bar to the left.
To move the activity’s start date and finish date forward in time, drag the bar to the
right.
Notes
You cannot move the activity if the activity has already started.
Changing a bar’s position in the Gantt Chart does not affect activity duration.
When you change a start or finish date, depending on your application settings, a
dialog box may display to prompt you to enter a constraint. To accept the
constraint, click Yes in the Confirmation dialog box. If you specify start and/or finish
dates without applying Must Start On or Must Finish On constraints, the dates you
enter may be changed when the project is scheduled.
If resources are assigned to the activity, and the resource assignment has manual
future period values, the values may be affected when you change the activity
start or finish dates.
P6 Professional User's Guide
250
Delete a bar from the Gantt Chart
1) Choose View, Bars.
You can also click the Layout Options bar and choose Bars.
2) Select the Gantt Chart bar that you want to delete.
3) Click Delete.
Tip
To remove the Gantt Chart bar from the Gantt Chart display without deleting it,
you can clear the Display checkbox.
Change an activity's duration in the Gantt Chart
1) Move your mouse over the right end of an activity’s Gantt Chart bar until it displays a
double-ended arrow.
2) Click and hold the mouse button.
To increase the duration of the activity, drag the bar to the right.
To decrease the duration of the activity, drag the bar to the left.
Notes
If resources are assigned to the activity, the activity’s labor/ nonlabor units or the
activity's resource assignment units per time are adjusted when you change the
activity’s duration in accordance with the activity’s duration type.
If resources are assigned to the activity, and the resource assignment has manual
future period values, the values may be affected when you change the activity
duration.
Add a curtain attachment in a Gantt Chart
1) In the Activities window, click the Layout Options bar and choose Attachments,
Curtain, Add Curtain.
2) Mark the 'Display curtain attachment' checkbox.
3) Click to select the Start and Finish Dates.
4) Select the color to use for the curtain.
5) Select the fill pattern for the curtain date range.
6) Click OK.
Customizing Activity Layouts
251
Tip
When you add a curtain attachment, it is added to the open layout, not the open
project(s). If you save the open layout after adding a curtain attachment, the
attachment is saved as part of the layout. The curtain attachment is then
displayed whenever you view the layout, unless you subsequently choose to
delete or hide the curtain attachment.
Notes
The data range defaults to the longest date interval. For example, if the date
interval is Month/Week, the default range will be one month.
You can manually shift the entire curtain or change the start and finish dates of the
curtain display. Move the mouse pointer over the curtain and click and drag the
curtain to the new dates.
Click Cancel to close the dialog box without saving any changes.
Hide a curtain attachment in a Gantt Chart
1) Double-click on the selected curtain in the Gantt Chart.
2) Clear the Display curtain attachment checkbox in the Curtain Attachment dialog
box.
3) Click OK.
Tip
When you hide a curtain attachment contained in a saved layout, the
attachment is not deleted from the layout. If you save the layout after hiding the
attachment, the attachment is still available for display by all users who have
access to the layout.
Add a text attachment to a Gantt Chart
1) In the Activities window, select the activity to which you want to add the attachment.
2) Click the Layout Options bar and choose Attachments, Text.
3) Click the Font button to select the attachment's font and font style.
4) Click OK.
Notes
Click Cancel to close the dialog box without saving any changes.
The attachment text displays in the foreground of the Gantt Chart, wherever you
click in the layout.
To modify an existing text attachment, double-click to select it, then modify it in
the Text Attachment dialog box.
P6 Professional User's Guide
252
Remove a text attachment from a Gantt Chart
1) In the Gantt Chart, click to select the text attachment you want to remove.
2) Press the Delete key.
Attach notebook items to bars in a Gantt Chart
1) Click the Layout Options bar and choose Bars.
2) Click the Bar Labels tab.
3) Click Add to add a label, then select a position for the label.
4) Click in the Label field and select a notebook item from the list of available bar labels.
5) Click options to set the dimensions of the notebook item.
Notes
Only one notebook item can be attached to each bar.
Notebook items can be printed with the layout or published with the layout to the
project Web site.
Hide all curtain attachments in the Gantt Chart
In the Activities window, click the Layout Options bar and choose Attachments,
Curtain, Hide All. The Hide All menu item is only available if at least one curtain
attachment is currently displayed in the Gantt Chart.
Tip
When you hide a curtain attachment contained in a saved layout, the
attachment is not deleted from the layout. If you save the layout after hiding the
attachment, the attachment is still available for display by all users who have
access to the layout.
Delete a curtain attachment from a Gantt Chart
1) Double-click the curtain attachment in the Gantt Chart.
2) Click Delete.
Note
If the curtain attachment you delete is part of a saved layout, you must save your
changes to the layout after deleting the attachment; otherwise, the attachment
will not be deleted.
Apply a Progress Line to the Gantt Chart
Applying a progress line to the Gantt chart enables you to quickly view the progress of
activities with regard to their scheduled deadlines.
Customizing Activity Layouts
253
As a variance line, the progress line can represent a variance between the
planned and actual start dates or finish dates of a task.
As a progress point line, the progress line shows either the remaining duration of an
activity or the percent of the activity that has been completed.
In the Progress Line tab of the Bar Chart Options dialog box, you have complete control
over how the line is drawn, whether it will be a variance line based on start or finish dates,
or a progress point line based on remaining duration or completion percentages.
Tips
This feature applies to the Gantt Chart in the Activities window only.
The progress line will not be drawn if you do not display a baseline bar and you
choose to base the line on activity % complete or remaining duration.
1) Select View, Bar Chart Options, and click the Progress Line tab.
2) Type or select the value between 1 and 10 points to set the thickness of your progress
line.
3) Click the color button to choose a color for your Progress Line.
4) Select to use the Project baseline or Primary baseline when calculating the Progress
Line.
5) Select one of the following:
If you want the progress line drawn based on the difference between activity start
or finish dates in the current project and baseline project dates, select Based on
Difference between Current and Baseline Activity's option.
From the list, select Finish Date to calculate the progress line based on the
variance between the baseline finish and the current finish, or select Start Date to
calculate the progress line based on the variance between the baseline start and
the current start.
If you want the progress line drawn by connecting progress points based on each
activity's remaining duration or percent complete, select By Connecting Progress
Points Based on Activity's option.
From the list, select % Complete to calculate the progress point based on each
activity's percent complete (which is the same as viewing the % Complete bar), or
select Remaining Duration to calculate the progress point based on each
activity's remaining duration. For Remaining Duration, the progress line is drawn to
activities that have started or that should have started (when the project baseline
start is earlier than the current data date) relative to the baseline start dates.
6) Click OK.
7) Choose View, Progress line to display the line.
In the Gantt chart, the new progress line is displayed. When the progress line is drawn to
the left of the data date, the activity is behind schedule. When the progress line is drawn
to the data date, the activity is on schedule. When the progress line is drawn to the right
of the data date, the activity is ahead of schedule.
P6 Professional User's Guide
254
Activity Network
Activity Network
The Activity Network displays your project as a diagram of activities and relationships
according to the work breakdown structure (WBS). A red border around an activity box
indicates a critical activity. A line connecting activity boxes indicates an activity
relationship.
You can control nearly every aspect of the Activity Network, including the appearance
of activities, the contents of activity boxes, and the spacing between activities.
The left pane of the Activity Network layout always displays the WBS hierarchy, regardless
of the current grouping selection. The right pane displays the selected WBS element’s
assigned activities. If you specify a grouping option other than WBS, the right pane of the
Activity Network layout groups and displays the selected WBS element’s activities
according to the activity data item you specify, for example, grouped by project status
or budget at completion.
You can save the Activity Network layout on your computer to e-mail to another project
user or to retrieve later.
To display the Activity Network:
With the Activities window active, do one of the following:
Click on the Top Layout toolbar.
Click the Layout bar, choose Show on Top, Activity Network.
From the View menu, choose Show on Top, Activity Network.
You can use an Activity Network layout to
Easily view relationships among activities and the flow of work through a project
Examine and edit an activity and its predecessors and successors
Focus on the driving relationship path
Determine at a glance whether an activity has started or finished
To make the Activity Network layout more effective, you can
Change the Activity Network template to view different activity information and
levels of detail
Right-click anywhere in the Activity Network to access commands that enable you to
change the information displayed or format data
Combine the Activity Network with a Trace Logic layout to focus on a specific
sequence of activities
Tips
To edit or remove an activity relationship, double-click the line that indicates the
relationship you want to change, then enter new details in the dialog box that
appears.
Customizing Activity Layouts
255
To display an activity's ID and name, place your pointer on the activity whose
details you want to view.
To zoom in, hold down the Alt key, click anywhere in the Activity Network layout,
then drag the pointer down while holding down the mouse button. To zoom out,
hold down the Alt key, click anywhere in the Activity Network layout, then drag
the pointer up while holding down the mouse button. Right-click anywhere in the
Activity Network table to display a menu of additional options.
Display the Activity Network
With the Activities window active, do one of the following:
Choose View, Show on Top, Activity Network.
Click the Layout Options bar and choose Show on Top, Activity Network.
Click on the Top Layout toolbar.
Tip
To hide the left pane and display only the Activity Network, drag the split bar
separating the right and left panes all the way to the left.
Apply Activity Network settings from another layout
1) Choose View, Activity Network, Activity Network Options.
You can also click the Layout Options bar, then choose Activity Network, Activity
Network Options.
2) Click Copy From.
3) Select the layout containing the Activity Network settings you want to apply, then
click Open.
Customize the Activity Network layout
1) Choose View, Activity Network, Activity Network Options.
You can also click the Layout Options bar, then choose Activity Network, Activity
Network Options.
2) Click the Activity Network Layout tab.
P6 Professional User's Guide
256
3) In the Organization Options section, specify how to organize the Activity Network
layout:
To align activity boxes towards the top of the Activity Network window in relation to
their predecessors/successors, choose Organize Along the Top.
To center activity boxes in relation to their predecessors/successors, choose Organize
Centered.
When an activity’s predecessor/successor is not immediately adjacent to the activity
in the Activity Network, the relationship line, in some cases, cannot be seen because
of other activity boxes. To reposition the activity boxes so that all relationship lines are
visible, mark the Adjust to Show All Relationships checkbox.
To automatically zoom in/out each time you reorganize the layout to find the best fit
for showing activity boxes in Activity Network, mark the Always Zoom to Best Fit After
Reorganize checkbox.
To view whether an activity has started or finished, mark the Show Progress checkbox.
To change the vertical space between activity boxes in Activity Network, specify a
vertical spacing factor.
To change the horizontal space between activity boxes in Activity Network, specify a
horizontal spacing factor.
4) In the Network Order Options section, specify the order in which activity networks
display:
To display the activity networks with the longest path of linked activities on top,
choose Longest on Top.
To display the activity networks with the shortest path of linked activities on top,
choose Shortest on Top.
5) To preview your changes, click Apply.
Tips
To copy the Activity Network layout from another activity layout, click Copy From,
select the layout whose Activity Network layout you want to copy, then click
Open.
To save the Activity Network layout, click the Layout Options bar, then choose
Activity Network, Save Network Positions. Type a unique name to identify the
layout and click Save.

Customizing Activity Layouts
257
Customize the activity box layout
1) Display the Activity Network in the Activities window, then choose View, Activity
Network, Activity Network Options.
You can also click the Layout Options bar, then choose Activity Network, Activity
Network Options.
2) Click the Activity Box Template tab.
3) Click Box Template.
4) To add a field to the activity boxes, click Add.
Click the Field Name column, then select the field you want to display.
Double-click the Width column, then specify the width of the field.
Double-click the Height column, then specify the height of the field.
See More Detail: Specifying activity box field widths for more information.
5) To position the field within the activity box, click and .
6) To remove a field, select it, then click Delete.
7) Click OK.
Tips
To copy the activity box layout from another activity layout, click Copy From,
select the layout whose activity box layout you want to copy, then click Open.
To change the width of the Activity Network activity boxes, specify a new box
width in the Total Width field.
Select the activity box layout
1) Choose View, Activity Network, Activity Network Options.
You can also click the Layout Options bar, then choose Activity Network, Activity
Network Options.
2) Click the Activity Box Template tab.
3) Select an activity box layout from the list of predefined activity box layouts.
The example activity box uses the selected box layout.
4) To preview your changes, click Apply.

P6 Professional User's Guide
258
Tip
To copy the activity box layout from another activity layout, click Copy From, then
select the layout whose activity box layout you want to copy, then click Open.
Save and Open an Activity Network Layout
To save the Activity Network layout, click the Layout Options bar, then choose
Activity Network, Save Network Positions. Type a unique name to identify the layout
and click Save.
To open a saved Activity Network layout, click the Layout Options bar, then choose
Activity Network, Open Network Positions. Browse to the directory where the saved
layout (ANP) file is located. Select this file and click Open.
Create a future period bucket planning layout
You can budget or plan future period resource/role assignments in any type of layout in
the Resource Assignments and Activities windows. This topic contains some steps you
may want to follow when you create a layout to use for future period bucket planning.
When you create a future period bucket planning layout, you should save the layout for
future use.
1. Display editable future period bucket planning fields
You can enter future period budgeted or planned and remaining values in the Budgeted
or Planned Units and Remaining (Early) Units fields in the Resource Usage Spreadsheet. To
display these fields, click the Display Options bar and choose Spreadsheet Fields,
Customize. Move the Budgeted or Planned Units and Remaining Early Units fields to the
Selected Options list; you can also remove all other fields from the Selected Options list.
Click Apply, OK.
Tips
You can display the Actual Units field as well to compare the work that was
planned to be performed (Budgeted or Planned Units) for an assignment versus
the work that has actually occurred (Actual Units). Once an assignment is in
progress, if work is not being performed according to plan, you can adjust the
Remaining (Early) Units as necessary; or, if you choose to re-estimate an
assignment's remaining work, you can adjust the assignment's Budgeted or
Planned Units instead.
To see costs related to the assignments you are manually planning, display the
Budgeted or Planned Cost and Actual Cost fields.
2. Display the Curve, Budgeted or Planned Units, and Remaining (Early) Units columns
When you manually enter a value in a future period bucket for an assignment, the
module automatically enters a value of Manual in the assignment’s associated Curve
column. By displaying the Curve column, you can determine which assignments already
have an assigned resource curve, or a defined manual curve.
Customizing Activity Layouts
259
For assignments that do not have a defined total Budgeted or Planned Units or
Remaining (Early) Units value, it is useful to display the Budgeted or Planned Units and
Remaining (Early) Units columns. When you display these columns, you can enter or edit
an assignment's total Budgeted or Planned or remaining units to spread the units evenly
over the original or planned duration of the assignment, then manually modify the future
period distribution as necessary.
To display these columns, click the Layout Options bar and choose Columns, Customize.
Move the Curve, Budgeted or Planned Units, and Remaining (Early) Units columns to the
Selected Options list, then modify the remaining columns. Click Apply, OK.
3. Adjust the timescale to reflect your planning periods
Adjust the timescale in the Resource Usage Spreadsheet to reflect the planning periods
in which you typically plan future resource distribution. For example, if you plan your work
in daily buckets, adjust the timescale to Week/Day and enter hourly planning unit values.
Note
If you track past period actuals per financial period and plan to report
performance against manual budgeted or planned future period values, you
should enter future period planning values in financial period timescale units. You
can adjust the timescale to reflect your predefined financial periods. For example,
if your organization has defined weekly financial periods, set the timescale to
Week/Financial Period.
4. Logically group and sort data
Group and sort data in a way that enables you to easily identify resources/roles, the
activities to which they are assigned, and the activities’ associated projects (because
the same activity name may appear in different projects). For example, you can group
and sort the Resource Usage Spreadsheet by project and by resource.
5. Filter out activities you don't want to manually plan
If you are planning future period resource distribution for a project that has already
started, you may want to apply a filter to display only the activities you want to plan,
such as activities that don't have an actual duration or that have a project planned start
after the current date or data date.
Alternatively, if a project has already started and you want to update the remaining units
for activities that are in progress, you could apply a filter to display only activities that
have an Actual Start date and do not have an Actual Finish date.
P6 Professional User's Guide
260
Trace Logic
Trace Logic
Trace Logic enables you to step forward or backward through a sequence of activities to
focus on predecessor/successor relationships.
Trace Logic, which is displayed in the lower layout, represents relationships for an activity
you select in the Activity Table, Activity Network, Activity Usage spreadsheet, or Gantt
Chart currently displayed in the upper layout. A red border around an activity box
indicates a critical activity. A line connecting activity boxes indicates an activity
relationship.
Use the Trace Logic layout to
Examine an activity and its predecessors and successors
Determine why an activity is scheduled at a particular time, answering questions such
as: Were any of its predecessors delayed? Do any of its predecessors or successors
have an obsolete constraint? Are two activities that should be linked start to start
currently linked finish to start? Why is there negative float?
Tips
Zoom in or out without affecting the level of detail displayed in the upper layout.
Choose View, Bottom Layout Options or click the Display Options bar and choose
Bottom Layout Options to specify how many levels of predecessors and successors
you want to view.
Display Trace Logic
With the Activities window active, do one of the following:
Choose View, Show on Bottom, Trace Logic.
Click the Layout Options bar and choose Show on Bottom, Trace Logic.
Click on the Bottom Layout toolbar.
Note
The activity boxes in Trace Logic display the same information as the boxes
defined for the current Activity Network layout.
Move around in Trace Logic
To view an activity's relationships in Trace Logic, click the activity in the Activity Table,
Gantt Chart, Activity Usage Spreadsheet, Activity Network, or Trace Logic window.
Customizing Activity Layouts
261
Set Trace Logic preferences
You can specify the number of activity relationships you want to display in Trace Logic.
1) Choose View, Bottom Layout Options.
You can also click the Layout Options bar, then choose Bottom Layout Options.
2) Specify the number of predecessors you want to display.
3) Specify the number of successors you want to display.
4) To preview your changes, click Apply.
Activity Usage and Resource Usage Profiles
Activity Usage Profile
The Activity Usage Profile
Use the Activity Usage Profile to view cost or unit values for activities in the open
project over time according to a timescale you specify. The Activity Usage Profile
displays resource allocations for all activities or for the activities you select in the
Activity Table, Activity Usage Spreadsheet, Gantt Chart, or the Activity Network.
The Activity Usage Profile can display labor, nonlabor, material, and expense costs and
labor and nonlabor units allocated to the activities in your project over time. Costs and
units allocated to activities for each period in the timescale are represented as vertical
bars. You can also display curves for charting cumulative costs or units over time.
You can customize the Activity Usage Profile to:
Specify the type of information you want to display.
Change the timescale.
Customize the bars and background.
Display past period actual or actual to date values.
Display unit and cost values by both remaining early and remaining late dates.
Save any of these changes so that you can always access the same set of activity
information, or share your Activity Usage Profile with someone else.
You can filter the Activity Usage Profile to include all activities displayed in the top layout,
or to include only the activities you select in the top layout. You can also filter the top
layout to display only those activities that correspond to the timeperiod you select in the
bottom layout.
P6 Professional User's Guide
262
Tips
If you apply activity filters to the Activity Table, Gantt Chart, Activity Usage
Spreadsheet, or the Activity Network, these filters also apply to the Activity Usage
Profile.
When you display a financial period timescale and display data for all projects
(rather than for open projects only), activity and resource data must be
summarized by financial period to accurately display data for closed projects.
When connected to a P6 Professional database: If you have administrator rights,
to ensure that activity and resource data is summarized by financial period
when you summarize projects, choose Admin, Admin Preferences, select the
Options tab, then mark the 'By financial periods' checkbox.
When connected to a P6 EPPM database: If you have administrator rights, to
ensure that activity and resource data is summarized by financial period when
you summarize projects, use the Application Settings, General link in P6, then
mark the 'By financial periods' checkbox.
The Planned Value Cost and Earned Value Cost curves may display different
values in the profile, even if the total Planned Value Cost and Earned Value Cost
values are the same in Activity Table columns. This occurs when an activity has an
expense with an Accrual Type of Start of Activity or End of Activity (rather than
Uniform over Activity). Since these are one-time expenses, and the planned value
and earned value curves are cumulative (representing total values spread over
time), the planned value spread is different than the earned value spread, even
though the total values are the same.
Display the Activity Usage Profile
With the Activities window active, do one of the following:
Choose View, Show on Bottom, Activity Usage Profile.
Click the Layout Options bar and choose Show on Bottom, Activity Usage Profile.
Click on the Bottom Layout toolbar.
Note
The numbers on the left side of the Activity Usage Profile correspond to the vertical
bars. The numbers on the right side of the Activity Usage Profile correspond to the
cumulative curves (these numbers appear only if you include cumulative curves in
the profile).
Customizing Activity Layouts
263
Define the Activity Usage Profile
1) Display the Activity Usage Profile, then click the Display Options bar in the profile and
choose Activity Usage Profile Options.
You can also right-click in the profile and choose Activity Usage Profile Options.
2) Click the Data tab.
3) Choose the category of information to display: Cost or Units.
4) Mark the Display Actual and Earned Value using Financial Period data option if you
want to display past period actual values. Do not mark the checkbox if you want to
display actual to date values.
Note: If projects are summarized by financial period (which is controlled by an
administrative setting), this option is ignored. When projects are summarized by
financial period and you display a financial period timescale, the profile displays past
period actual values if performance has been stored for a financial period; for
financial periods that do not have stored performance, the profile displays actual to
date values in financial period intervals.
5) To select the data included in the profile, mark the checkbox next to each filter type.
Then, select the pattern to use to display each data type.
If you choose to display cost data, you can select more than one filter to view a
combination of cost values in the project profile.
To display cost totals, mark the Total checkbox.
6) In the Show Bars/Curves area, mark the checkbox for each category of cost/units you
want to display.
To show these data by date, mark the By Date checkbox. To show these data as a
curve representing cumulative value, mark the Cumulative checkbox.
To select the color for each bar/curve, click the Color button.
7) In the Show Earned Value Curves area, mark the checkbox for each cumulative
earned value curve you want to display.
To select the color for each curve, click the Color button.
8) Click the Graph tab.
P6 Professional User's Guide
264
9) To display a vertical background line for major and/or minor timescale increments, in
the Vertical Lines area, mark the corresponding checkbox. For example, in a
Year/Month format timescale, major lines would display between years; minor lines
would display between months.
10) To display horizontal lines for each numerical increment listed along the side of the
profile, choose the type of line you want to display, then select the line color. Choose
None to hide background horizontal lines.
11) To specify additional profile display options, mark the corresponding checkboxes:
Show Legend: Mark to display a legend for the profile's bars/curves.
3D Bars: Mark to display the profile’s bars in 3D.
Background Color: Click to change the profile's background color.
Calculate Average: Mark to specify the values you want to use to divide the
timescale interval totals.
Divide Interval Totals By: To divide the timescale interval totals by an increment you
specify, type it in this field.
Base on Hours Per Timeperiod: To divide the timescale interval totals by automatic
increments, based on the date interval selected, mark this checkbox. When you
choose this option, the Divide Interval Totals By field displays the division increment
based on the division increment specified in User Preferences for the corresponding
date interval: 1h for Hour date interval, 2h for Shift date interval, 8h for Day date
interval, 40h for week date interval, and so on.
Unit of Measure: Specify the unit of measure for the timescale intervals.
12) To view your profile options without closing the dialog box, click Apply; to save your
selections, click OK.
Show or hide the profile legend in the histogram
1) Display the profile, then click the Display Options bar in the profile and choose the
Profile Options.
You can also right-click in the profile to choose the Profile Options.
2) Click the Graph tab.
3) In the Additional Display Options section, mark or clear the Show Legend checkbox.
Customizing Activity Layouts
265
Note
You can move the profile legend within the profile. Move the mouse over the
legend, click and hold the mouse button, and drag the legend.
Resource Usage Profile
The Resource Usage Profile
Use the Resource Usage Profile to analyze quantity or cost usage for resources or roles.
You can view a resource's or role's cost and quantity data for a specific project or for all
projects across the enterprise (total allocation).
Define the profile to specify whether you want to display cost or quantity information and
set the timescale for displaying data values. Choose to display past period actual or
actual to date values in bars and curves. Choose to display vertical bars to represent
costs or units allocated to your resources for each timeperiod, and include cumulative
curves to represent accumulated units and costs over time.
Use the Resource Usage Profile to
Determine how many hours each resource is scheduled to work
Identify overloaded resources
Track expenditures per timeperiod
Determine resource usage by late dates
Display a "banana" curve to compare early and late dates
Display different colors or patterns on the histogram bars when showing the
stacked histogram
In addition to customizing data, you can customize the look of the profile by specifying
display options, for example, bar color, background line type, or averaging. You can also
save a customized profile so that you can always access the same set of activity
information or share the Resource Usage Profile with someone else.
The Resource Usage Profile is available only in the bottom layout of the Activities window.
The bottom layout window is divided into two panes.
The left pane lists all the resources or roles stored in the hierarchy, depending on
your current view. In the stacked histogram view, the left pane lists all the resource
or role filter/group names in the hierarchy.
The right pane displays the values for the activities assigned to each resource or
role in the histogram, or resource or role filter/group name in the stacked
histogram.
P6 Professional User's Guide
266
Notes
If you are displaying actual to date values (rather than past period actual values)
and you do not want the resource unit/cost values spread evenly, use resource
curves to distribute those values nonlinearly, or manually enter values for
assignments in the Resource Usage Spreadsheet. The Resource Usage Profile
reflects the resource curves and manual values. If the planned work on an activity
cannot be accurately captured by applying a resource curve, you should
manually enter values to achieve the most accurate resource distribution per
timeperiod.
When you display a financial period timescale and display data for all projects
(rather than for open projects only), activity and resource data must be
summarized by financial period to accurately display data for closed projects.
When connected to a P6 Professional database: If you have administrator rights,
to ensure that activity and resource data is summarized by financial period
when you summarize projects, choose Admin, Admin Preferences, select the
Options tab, then mark the 'By financial periods' checkbox.
When connected to a P6 EPPM database: If you have administrator rights, to
ensure that activity and resource data is summarized by financial period when
you summarize projects, use the application Settings, General link in P6, then
mark the 'By financial periods' checkbox.
When displaying units, bars do not display for summary rows if your selection
contains mixed units of measure or a mixture of labor/ nonlabor and material type
resources.
Bars and cumulative curves with negative values do not display in the profile. You
can view the negative values in the profile details. Double-click in the profile area
to view the profile details.
Display the Resource Usage Profile
With the Activities window active, do one of the following:
Choose View, Show on Bottom, Resource Usage Profile.
Click the Layout Options bar and choose Show on Bottom, Resource Usage Profile.
Click on the Bottom Layout toolbar.
Notes
The numbers on the left side of the Resource Usage Profile correspond to the
vertical bars. The numbers on the right side of the Resource Usage Profile
correspond to the cumulative curves (these numbers appear only if you include
cumulative curves in the profile).
To view a stacked histogram in the Resource Usage Profile, click the Display
Options bar and select Stacked Histogram.
Customizing Activity Layouts
267
Bars and cumulative curves with negative values do not display in the profile. You
can view the negative values in the profile details. Double-click on the profile to
view the profile details.
Define the Resource Usage Profile
Display the Resource Usage Profile, then click the Display Options bar in the profile and
choose Resource Usage Profile Options.
To display the profile options for the stacked histogram, click the Display Options bar in
the profile and choose Stacked Histogram. Then, click the Display Options bar in the
profile and choose Resource Usage Profile Options. You can also right-click in the profile
and choose Resource Usage Profile Options.
The options available to define the Resource Usage Profile depend on whether you
display the Regular Histogram or the Stacked Histogram.
Define the Resource Usage Profile - Regular Histogram
The options you can specify for a Resource Usage Profile differ depending on whether
you display the profile in resource or role view, and on whether you choose to display
resource allocation for one or more open projects or total allocation for all projects
across the enterprise.
You choose the resource(s) to include in the profile by selecting them in the left pane of
the Bottom Layout window. To specify whether you want to display the profile in role or
resource view, click the Display Options bar in the left pane, then choose Select View, By
Resource or By Role.
1) In the Resource Usage Profile Options, click the Data tab.
2) Choose the type of information to display: Cost or Units.
3) Mark the Display Actual using Financial Period data option if you want to display past
period actual values. Do not mark the checkbox if you want to display actual to date
values.
4) In the Show Bars/Curves area, mark the checkbox to specify which cost/unit
categories you want to display and whether to show these data by date or as a
curve representing cumulative value. Select the color for each bar/curve.
5) If the profile displays resource allocation across the enterprise (all projects), you can
choose how you want to display remaining values: as total values across all projects
in the enterprise, or as values in the open projects vs. values in closed projects.
If you are displaying roles in the profile, you can choose to view staffed vs. unstaffed
costs/units. Staffed units are those for which resources have been assigned to fill role
assignments.
P6 Professional User's Guide
268
6) To display additional resource data in the profile, mark the corresponding
checkboxes:
Show Overtime (open projects view only): Mark to show the resource's overtime units
for each time unit in the current layout.
Show Limit: Mark to show the resource's maximum units for each timescale interval in
the current layout. This option is available only if you choose to display Units.
Show Overallocation: Mark to display overallocated values in the current layout. This
option is available only if you choose to display Units and select Show Limit.
Show Available Units: Mark to display a horizontal line that indicates the resource's
available units. This option is available only if you choose to display Units.
7) Click the Graph tab.
8) To display a vertical background line for major and/or minor timescale increments, in
the Vertical Lines area, mark the corresponding checkbox. For example, in a
Year/Month format timescale, major lines would display between years; minor lines
would display between months.
9) To display horizontal lines for each numerical increment listed along the side of the
profile, choose the type of line you want to display, then select the line color. Choose
None to hide background horizontal lines.
10) To specify additional profile display options, mark the corresponding checkboxes:
Show Legend: Mark to display a legend for the profile's bars/curves.
3D Bars: Mark to display the profile’s bars in 3D.
Background Color: Click to change the profile's background color.
Calculate Average: Mark to specify the values you want to use to divide the
timescale interval totals.
Divide Interval Totals By: To divide the timescale interval totals by an increment you
specify, type it in this field.
Base on Hours Per Timeperiod: To divide the timescale interval totals by automatic
increments, based on the date interval selected, mark this checkbox. When you
choose this option, the Divide Interval Totals By field displays the division increment
based on the division increment specified in User Preferences for the corresponding
date interval: 1h for Hour date interval, 2h for Shift date interval, 8h for Day date
interval, 40h for week date interval, and so on.
Unit of Measure: Specify the unit of measure for the timescale intervals.
Customizing Activity Layouts
269
11) To specify the interval and dates to use to calculate time-distributed data for the
profile, and to specify which projects are included (open only or open and specific
closed projects) when you select the Show Remaining Bars As, Total Remaining
option, click Preferences. Then, click the Resource Analysis tab.
Define the Resource Usage Profile - Stacked Histogram
The options you can specify for a Resource Usage Profile differ depending on whether
you display the profile in resource or role view. Add resource filters to choose the
resources to include in the profile The profile legend in the left pane displays a list of the
resource filters and their corresponding colors and patterns. To specify whether you want
to display the profile in role or resource view, click the Display Options bar in the left
pane, then choose Select View, By Resource or By Role.
1) In the Resource Usage Profile Options, click the Data tab.
2) Select the type of information to display: At Completion Units or At Completion Cost.
3) Mark the Display Actual using Financial Period data option if you want to display past
period actual values. Do not mark the checkbox if you want to display actual to date
values.
4) In the Show area, choose to show individual curves representing the cumulative
value for each filter/group name of resources or choose to show one cumulative
curve as a total for all filter/group names of resources .
5) Add a resource or role filter to view in the profile. Double-click the Resource/Role
Filter/Group Name field to modify the selected resource or role filter specification.
Click Add to specify a new resource or role filter. Create a resource or role filter
specification to select an individual resource or role, or a group of resources or roles.
For example, you can specify a filter that selects resources with the same resource
code value.
Click Delete to remove a resource/role filter/group name.
6) Select the pattern and color for the selected resource/role filter/group name.
Click the Up or Down arrows to arrange the filter list in the order it will display in the
stacked histogram.
7) Click the Graph tab.
8) To display a vertical background line for major and/or minor timescale increments, in
the Vertical Lines area, mark the corresponding checkbox. For example, in a
Year/Month format timescale, major lines would display between years; minor lines
would display between months.
9) To display horizontal lines for each numerical increment listed along the side of the
profile, choose the type of line you want to display, then select the line color. Choose
None to hide background horizontal lines.

P6 Professional User's Guide
270
10) Specify the additional profile display options:
3D Bars: Mark to display the profile’s bars in 3D.
Background Color: Click to change the profile's background color.
Calculate Average: Mark to specify the values you want to use to divide the
timescale interval totals.
Divide Interval Totals By: To divide the timescale interval totals by an increment you
specify, type it in this field.
Base on Hours Per Timeperiod: To divide the timescale interval totals by automatic
increments, based on the date interval selected, mark this checkbox. When you
choose this option, the Divide Interval Totals By field displays the division increment
based on the division increment specified in User Preferences for the corresponding
date interval: 1h for Hour date interval, 2h for Shift date interval, 8h for Day date
interval, 40h for week date interval, and so on.
Unit of Measure: Specify the unit of measure for the timescale intervals.
11) To specify the interval and dates to use to calculate time-distributed data for the
profile, and to specify which projects are included (open only or open and specific
closed projects) when you select the Show Remaining For, All Projects option, click
Preferences. Then, click the Resource Analysis tab. See More Detail: Set Resource
Analysis Preferences.
Activity Usage and Resource Usage Spreadsheets
Activity Usage Spreadsheet
The Activity Usage Spreadsheet
The Activity Usage Spreadsheet displays activity data in a spreadsheet format. View
baseline, budgeted or planned, actual, remaining, and at completion values or review
information such as earned value cost, actual labor and nonlabor units, and remaining
total cost for the activities in your project.
Display the Activity Usage Spreadsheet in the top or bottom layout of the Activities
window.
Use the Activity Usage Spreadsheet to
Quickly analyze activity data
Filter activities
Group and sort activity data

Customizing Activity Layouts
271
The Activity Usage Spreadsheet is split into two panes. The left pane displays the Activity
Table, including all the columns, grouping, sorting, and filtering options defined for the
Activity Table. The right pane displays timescaled spreadsheet data for each activity;
you can specify the data fields you want to include.
Tip
You can display past period actual values in the Activity Usage Spreadsheet. In
the right pane of the bottom layout, click the Display Options bar and choose
Spreadsheet Fields, Customize. The available past period actual fields are listed in
the Financial Period Value section for both Cumulative and Time Interval. If the
Financial Period Value section is not available in the Columns dialog box, you must
specify the range of financial periods available for display as columns on the User
Preferences, Application tab. When displaying Financial Period Value fields, past
period actuals stored per financial period are distributed evenly, within each
financial period, from the financial period start date to the financial period end
date and earned value calculations are based on these stored period quantities.
For all other columns, actuals are spread evenly from the actual start to the data
date or actual finish date of the activity or assignment.
Notes
You cannot change the data in the Activity Usage Spreadsheet.
Multiple resource rates are not reflected in the Activity Usage Spreadsheet.
When you display a financial period timescale and display data for all projects
(rather than for open projects only), activity and resource data must be
summarized by financial period to accurately display data for closed projects.
When connected to a P6 Professional database: If you have administrator rights,
to ensure that activity and resource data is summarized by financial period
when you summarize projects, choose Admin, Admin Preferences, select the
Options tab, then mark the 'By financial periods' checkbox.
When connected to a P6 EPPM database: If you have administrator rights, to
ensure that activity and resource data is summarized by financial period when
you summarize projects, use the Application Settings, General link in P6, then
mark the 'By financial periods' checkbox.
Display the Activity Usage Spreadsheet
With the Activities window active, do one of the following:
Choose View, Show on Top or Show on Bottom, Activity Usage Spreadsheet.
Click the Layout Options bar and choose Show on Top or Show on Bottom, Activity
Usage Spreadsheet.
Click on the Top Layout toolbar or Bottom Layout toolbar.

P6 Professional User's Guide
272
Resource Usage Spreadsheet
The Resource Usage Spreadsheet
Use the Resource Usage Spreadsheet to analyze quantity or cost usage for resources or
roles. For every role and resource in the project, you can review cost or quantity
information for a specific project or for all projects across the enterprise (total allocation).
You can also select the spreadsheet fields to specify which cost or quantity information
you want to view and set the timescale for displaying data values. If you have the
appropriate security privilege, you can manually enter values for budgeted or planned
and remaining (early) units in the spreadsheet.
Use the Resource Usage Spreadsheet to
Quickly analyze resource data.
View past period actual data.
View resource or role data.
Filter resources, roles, and activities.
Group and sort resource data.
Manually plan future resource distribution.
In the Activities window, the Resource Usage Spreadsheet is available only in the bottom
layout.
When you choose to display information for all projects, the bottom layout is divided into
two panes.
The left pane lists all the resources or roles stored in the hierarchy, depending on
your current view.
The right pane displays the values for the activities assigned to each resource or
role.
When you choose to display information only for a specific project, the bottom layout is
divided into three panes.
The left pane lists all the resources or roles stored in the hierarchy, depending on
you current view.
The middle pane displays all of the activity assignments for the resource or role
currently selected in the left pane.
The right pane displays the values for the activities assigned to the resource or role
currently selected in the left pane.
In the Resource Assignments window, the Resource Usage Spreadsheet is available in the
right pane.
You can group, sort, or filter the resources or roles displayed in the Resource Usage
Spreadsheet.
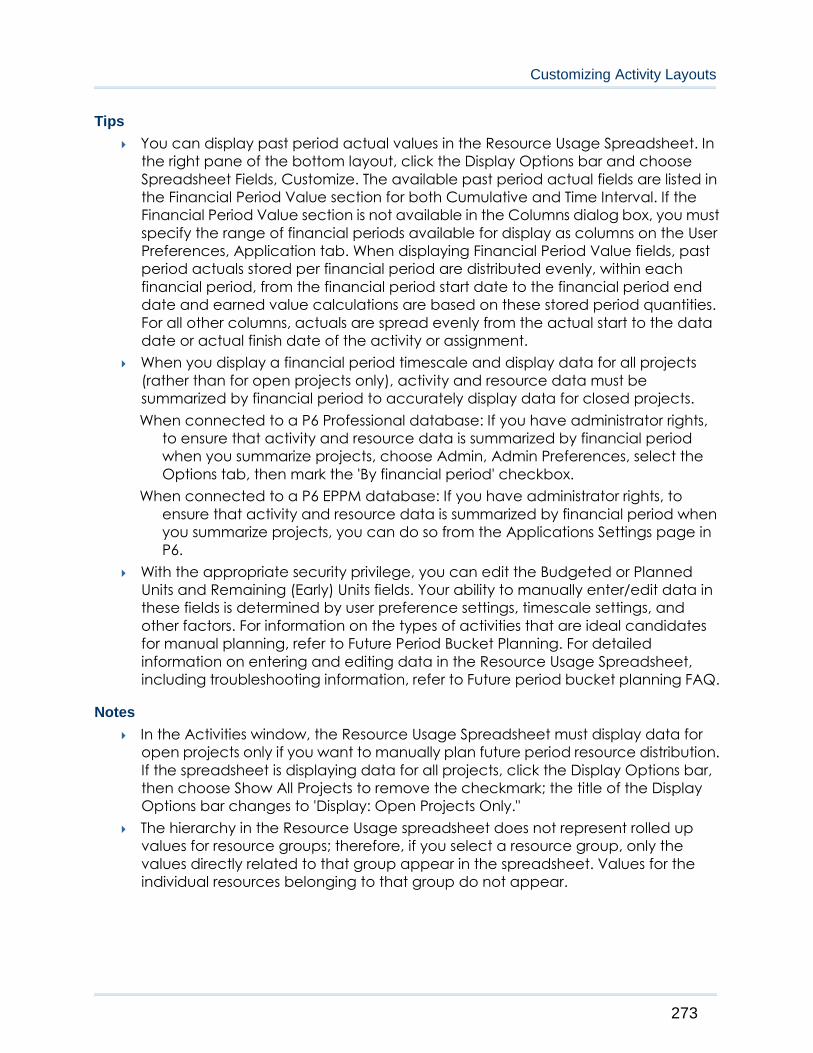
Customizing Activity Layouts
273
Tips
You can display past period actual values in the Resource Usage Spreadsheet. In
the right pane of the bottom layout, click the Display Options bar and choose
Spreadsheet Fields, Customize. The available past period actual fields are listed in
the Financial Period Value section for both Cumulative and Time Interval. If the
Financial Period Value section is not available in the Columns dialog box, you must
specify the range of financial periods available for display as columns on the User
Preferences, Application tab. When displaying Financial Period Value fields, past
period actuals stored per financial period are distributed evenly, within each
financial period, from the financial period start date to the financial period end
date and earned value calculations are based on these stored period quantities.
For all other columns, actuals are spread evenly from the actual start to the data
date or actual finish date of the activity or assignment.
When you display a financial period timescale and display data for all projects
(rather than for open projects only), activity and resource data must be
summarized by financial period to accurately display data for closed projects.
When connected to a P6 Professional database: If you have administrator rights,
to ensure that activity and resource data is summarized by financial period
when you summarize projects, choose Admin, Admin Preferences, select the
Options tab, then mark the 'By financial period' checkbox.
When connected to a P6 EPPM database: If you have administrator rights, to
ensure that activity and resource data is summarized by financial period when
you summarize projects, you can do so from the Applications Settings page in
P6.
With the appropriate security privilege, you can edit the Budgeted or Planned
Units and Remaining (Early) Units fields. Your ability to manually enter/edit data in
these fields is determined by user preference settings, timescale settings, and
other factors. For information on the types of activities that are ideal candidates
for manual planning, refer to Future Period Bucket Planning. For detailed
information on entering and editing data in the Resource Usage Spreadsheet,
including troubleshooting information, refer to Future period bucket planning FAQ.
Notes
In the Activities window, the Resource Usage Spreadsheet must display data for
open projects only if you want to manually plan future period resource distribution.
If the spreadsheet is displaying data for all projects, click the Display Options bar,
then choose Show All Projects to remove the checkmark; the title of the Display
Options bar changes to 'Display: Open Projects Only."
The hierarchy in the Resource Usage spreadsheet does not represent rolled up
values for resource groups; therefore, if you select a resource group, only the
values directly related to that group appear in the spreadsheet. Values for the
individual resources belonging to that group do not appear.

P6 Professional User's Guide
274
If you are displaying actual to date values (not past period actual values) and you
do not want the resource unit/cost values spread evenly, use resource curves to
distribute those values nonlinearly, or manually enter the values. The Resource
Usage Spreadsheet reflects the resource curves. If the planned work on an activity
cannot be accurately captured by applying a resource curve, you should
manually enter values to achieve the most accurate resource distribution per
timeperiod. If you are displaying past period actual values, the resource unit/cost
data is spread by financial period.
Multiple resource rates are not reflected in the Resource Usage Spreadsheet.
Dashes display in the cells of summary rows if your selection contains a mixture of
labor/ nonlabor and material type resources.
Display the Resource Usage Spreadsheet
With the Activities window active, do one of the following:
Choose View, Show on Bottom, Resource Usage Spreadsheet.
Click the Layout Options bar and choose Show on Bottom, Resource Usage
Spreadsheet.
Click on the Bottom Layout toolbar.
With the Resource Assignments window active, do one of the following:
Choose View, Show on Top, Resource Usage Spreadsheet.
Click the Layout Options bar, then choose Resource Usage Spreadsheet.
Click on the Top Layout toolbar.
Tip
To hide the upper layout and display only the Resource Usage Spreadsheet in the
Activities window, drag the split bar separating the upper layout from the
Resource Usage Spreadsheet all the way to the top.
Group and sort Resource Usage Spreadsheet columns in the Activities window
In the left or middle panes of the Resource Usage Spreadsheet layout, click the
Display Options bar, then choose Group and Sort By. Choose one of the predefined
group and sort options, or, to customize grouping and sorting, choose Customize.
If you choose Customize
1) In the Group By column, double-click the cell, then select the field by which you want
to group.
2) Click Sort, then select the field names you want to sort by for the grouping. Click OK.
3) To change a group's display color and font, double-click the appropriate Font &
Color field.
4) To group and sort by additional fields, repeat steps 1 and 2.
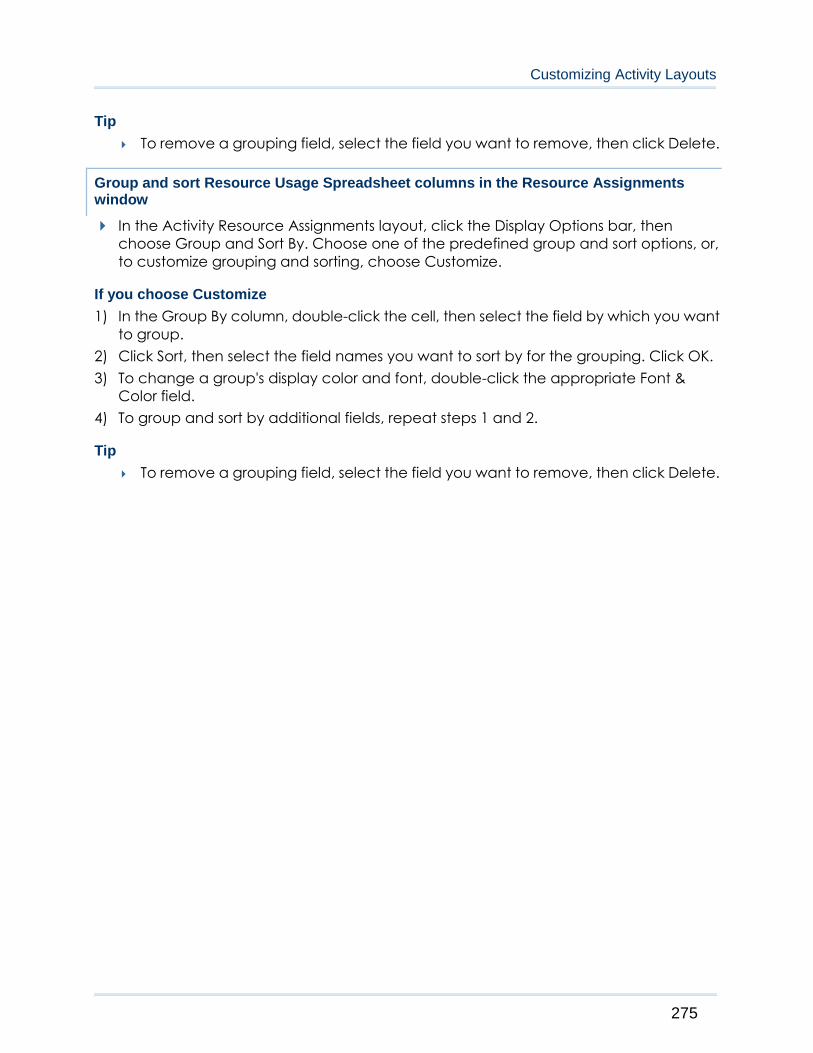
Customizing Activity Layouts
275
Tip
To remove a grouping field, select the field you want to remove, then click Delete.
Group and sort Resource Usage Spreadsheet columns in the Resource Assignments window
In the Activity Resource Assignments layout, click the Display Options bar, then
choose Group and Sort By. Choose one of the predefined group and sort options, or,
to customize grouping and sorting, choose Customize.
If you choose Customize
1) In the Group By column, double-click the cell, then select the field by which you want
to group.
2) Click Sort, then select the field names you want to sort by for the grouping. Click OK.
3) To change a group's display color and font, double-click the appropriate Font &
Color field.
4) To group and sort by additional fields, repeat steps 1 and 2.
Tip
To remove a grouping field, select the field you want to remove, then click Delete.


277
In This Section
Overview .................................................................................................................. 277
Project Table ............................................................................................................ 284
Project Bar Chart ..................................................................................................... 284
Project Gantt/Profile and Resource Analysis ...................................................... 284
Overview
Tracking
The tracking features assist you in performing schedule, cost, and resource analysis by
enabling you to access, display, and manipulate project data in a variety of formats.
Review summarized or live project data at various levels of detail. The Tracking window
always displays summarized data for closed projects but also when you choose to open
only global data. When P6 Professional is connected to a P6 Professional database, note
that summarized data are available only for projects that have been summarized in the
Oracle Job Service. For open projects, you can display live WBS data.
Tip
To check if and when project data were summarized, select the project in the
Project Explorer window, then right-click, choose Project Details, and click the
Summary tab.
The Summary tab displays the date the summarizer was last run for the selected project.
This gives you an idea of how current your summary data are. The Summary tab also
displays information about the WBS level to which the project was summarized. For
example, a project may use four WBS levels, but only be summarized to WBS level 2. As a
result, the Tracking window data show rolled up values to the second WBS level for that
project, when viewed in Summary mode.
In the Tracking window, you display data in a layout, which is simply a set of criteria that
control how data are presented. The sample database includes several sample layouts
that reflect common project analysis methods, for example, earned value, resource
allocation, resource forecast, and total costs over time. You can also create customized
layouts for viewing project data based on your own requirements.
Tracking Projects
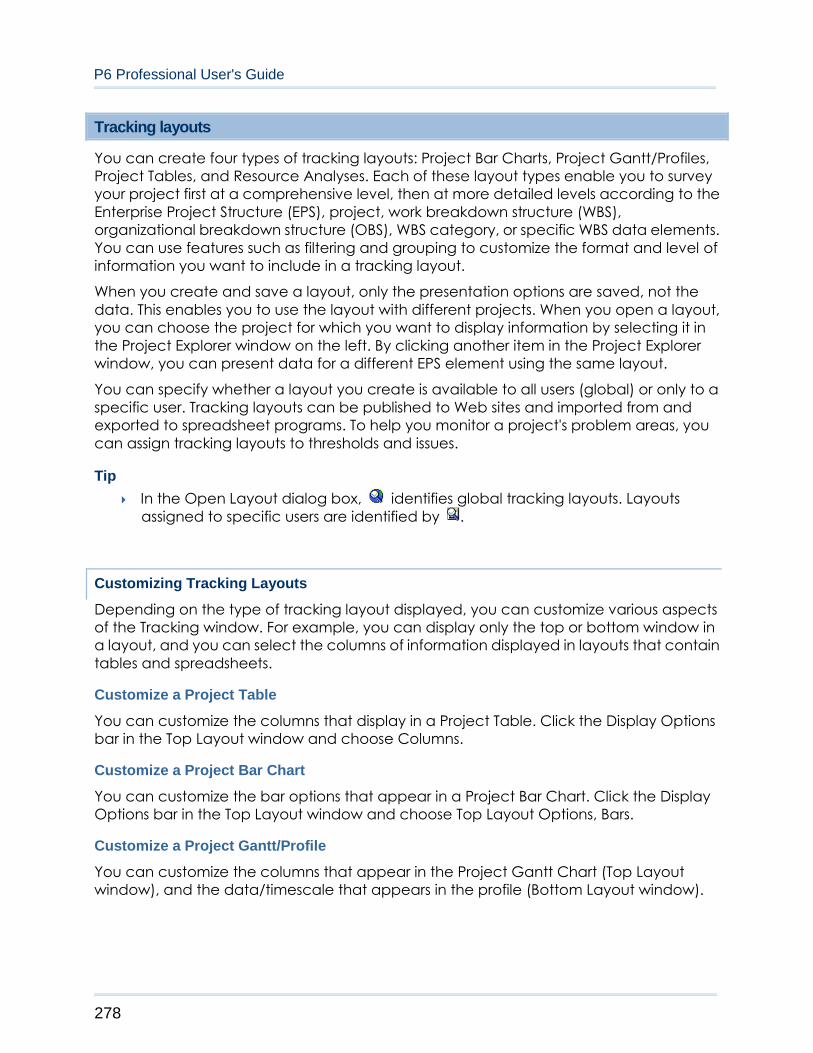
P6 Professional User's Guide
278
Tracking layouts
You can create four types of tracking layouts: Project Bar Charts, Project Gantt/Profiles,
Project Tables, and Resource Analyses. Each of these layout types enable you to survey
your project first at a comprehensive level, then at more detailed levels according to the
Enterprise Project Structure (EPS), project, work breakdown structure (WBS),
organizational breakdown structure (OBS), WBS category, or specific WBS data elements.
You can use features such as filtering and grouping to customize the format and level of
information you want to include in a tracking layout.
When you create and save a layout, only the presentation options are saved, not the
data. This enables you to use the layout with different projects. When you open a layout,
you can choose the project for which you want to display information by selecting it in
the Project Explorer window on the left. By clicking another item in the Project Explorer
window, you can present data for a different EPS element using the same layout.
You can specify whether a layout you create is available to all users (global) or only to a
specific user. Tracking layouts can be published to Web sites and imported from and
exported to spreadsheet programs. To help you monitor a project's problem areas, you
can assign tracking layouts to thresholds and issues.
Tip
In the Open Layout dialog box, identifies global tracking layouts. Layouts
assigned to specific users are identified by .
Customizing Tracking Layouts
Depending on the type of tracking layout displayed, you can customize various aspects
of the Tracking window. For example, you can display only the top or bottom window in
a layout, and you can select the columns of information displayed in layouts that contain
tables and spreadsheets.
Customize a Project Table
You can customize the columns that display in a Project Table. Click the Display Options
bar in the Top Layout window and choose Columns.
Customize a Project Bar Chart
You can customize the bar options that appear in a Project Bar Chart. Click the Display
Options bar in the Top Layout window and choose Top Layout Options, Bars.
Customize a Project Gantt/Profile
You can customize the columns that appear in the Project Gantt Chart (Top Layout
window), and the data/timescale that appears in the profile (Bottom Layout window).
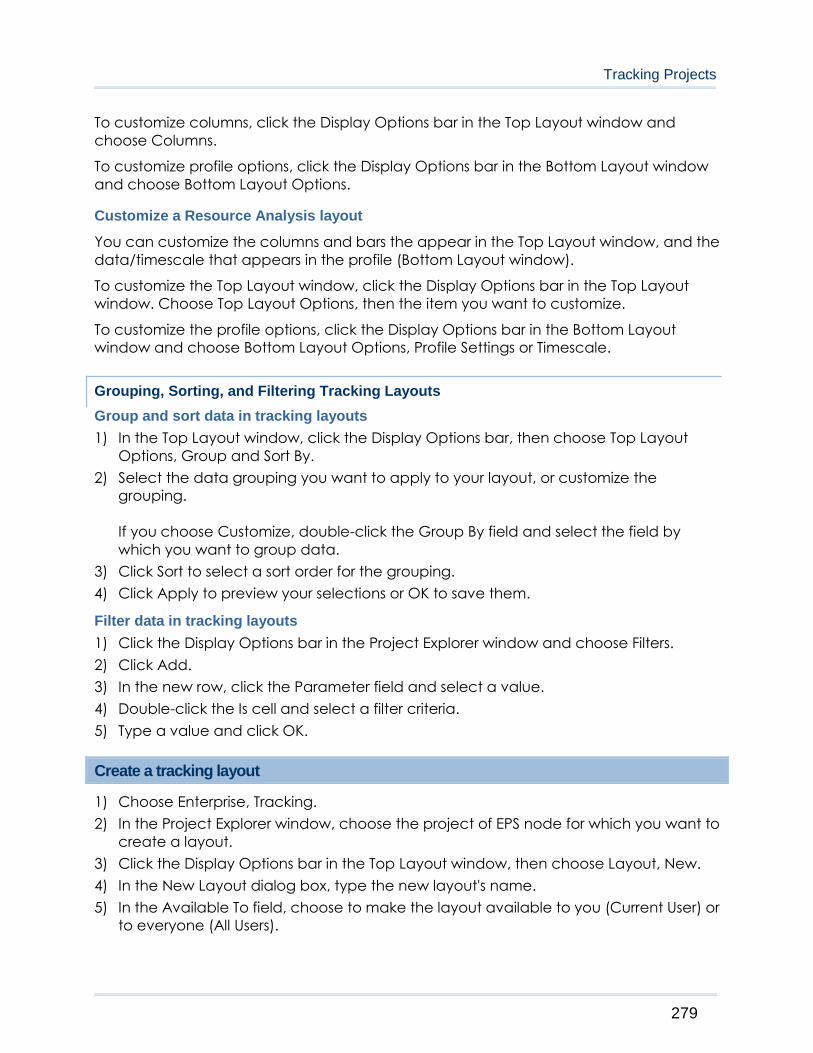
Tracking Projects
279
To customize columns, click the Display Options bar in the Top Layout window and
choose Columns.
To customize profile options, click the Display Options bar in the Bottom Layout window
and choose Bottom Layout Options.
Customize a Resource Analysis layout
You can customize the columns and bars the appear in the Top Layout window, and the
data/timescale that appears in the profile (Bottom Layout window).
To customize the Top Layout window, click the Display Options bar in the Top Layout
window. Choose Top Layout Options, then the item you want to customize.
To customize the profile options, click the Display Options bar in the Bottom Layout
window and choose Bottom Layout Options, Profile Settings or Timescale.
Grouping, Sorting, and Filtering Tracking Layouts
Group and sort data in tracking layouts
1) In the Top Layout window, click the Display Options bar, then choose Top Layout
Options, Group and Sort By.
2) Select the data grouping you want to apply to your layout, or customize the
grouping.
If you choose Customize, double-click the Group By field and select the field by
which you want to group data.
3) Click Sort to select a sort order for the grouping.
4) Click Apply to preview your selections or OK to save them.
Filter data in tracking layouts
1) Click the Display Options bar in the Project Explorer window and choose Filters.
2) Click Add.
3) In the new row, click the Parameter field and select a value.
4) Double-click the Is cell and select a filter criteria.
5) Type a value and click OK.
Create a tracking layout
1) Choose Enterprise, Tracking.
2) In the Project Explorer window, choose the project of EPS node for which you want to
create a layout.
3) Click the Display Options bar in the Top Layout window, then choose Layout, New.
4) In the New Layout dialog box, type the new layout's name.
5) In the Available To field, choose to make the layout available to you (Current User) or
to everyone (All Users).

P6 Professional User's Guide
280
Open a tracking layout
1) Choose Enterprise, Tracking, then choose View, Layout, Open.
You can also click the Display Options bar in the Layout window and choose Layout,
Open.
2) Select a layout and click OK.
Types of tracking layouts
You can create four types of tracking layouts:
Project Table: displays project data in a table.
Project Bar Chart: displays project data in a horizontal bar chart.
Project Gantt/Profile: displays project information in columns and a Gantt Chart in the
Top Layout window and as time-distributed project data in spreadsheet or profile in the
Bottom Layout window. The Bottom Layout window also includes column data when you
display a spreadsheet.
Resource Analysis: displays time-distributed resource usage information in three formats:
Gantt Chart, profile, and spreadsheet. When you display the Gantt Chart or
spreadsheet, the Layout window also includes column data in the left pane. You can use
a Resource Analysis layout to examine resource allocation for one or more specific
projects and/or total allocation for all projects across the enterprise.
Share a layout with other users
You can share a layout with other users several different ways:
When you first create the layout (Tracking only), specify that it be available to All
Users.
Save an existing layout using a different name and then specify that it be
available to All Users or Another User. If you specify Another User, select a specific
user.
Export the layout to a file and then e-mail the file or its location to other users.
Publish the layout to a Web site.

Tracking Projects
281
Save a tracking layout
1) Choose View, Layout, Save or Save As.
You can also click the Display Options bar in the Layout window and choose Layout,
Save or Save As.
2) If you choose Save As, type a new name for the layout and indicate whether the
layout should be available to All Users, the Current User, or Another User. If you select
Another User, click in the User field, then select the user.
Export a tracking layout
1) Choose View, Layout, Open.
You can also click the Display Options bar in the Layout window and choose Layout,
Open.
2) Select the layout you want to export, then click Export.
3) Specify the drive and folder to which you want to export the layout, type a name for
the layout, then click Save.
The layout is saved in Primavera Layout File (. PLF) format.
Import a tracking layout
1) Choose View, Layout, Open.
You can also click the Display Options bar in the Layout window and choose Layout,
Open.
2) Click Import.
3) Locate the layout you want to import and select it, then click Open.
Delete a tracking layout
1) Choose View, Layout, Open.
You can also click the Display Options bar in the Layout window and choose Layout,
Open.
P6 Professional User's Guide
282
2) Select the layout you want to delete, then click Delete.
3) Click Yes.
Filter a tracking layout
For layouts that include data displayed in column or table format, you can add one or
more filters to further customize the type of information you want display.
1) Choose View, Filter By, Customize.
In the Top Layout window, you can also click the Display Options bar (in the right
pane), then choose Top Layout Options, Filters, or right-click in the table and choose
Filters.
2) In the Parameter column, double-click the first row and select Any of the Following or
All of the Following.
3) In the Parameter column, double-click the first blank row, then select a field by which
to filter.
4) In the Is column, double-click the corresponding field and select the filter’s search
condition or comparison operator.
5) In the Value column, double-click the corresponding field and type or select the
value you want to display for the specified field.
6) To add another filter field, click Add, then repeat steps 2 through 6 for each field you
want to include in the filter.
Tips
To change the order of the filter criteria, select an item, then click or .
To delete an item in the filter, select it, then click Delete.
Group and sort a tracking layout using standard settings
Tracking offers various standard options for grouping and sorting layout information
displayed in a table. For example, when viewing project-level information you can group
and sort by project, EPS/ WBS, OBS, or WBS category.
Choose View, Group and Sort By, and the group and sort option you want to use.
You can also right-click in the table in the Top Layout window, then choose Group
and Sort By, and the group and sort option you want to use.
Tips
Grouping a layout by OBS enables you to display information about activities that
belong to WBS elements for which a particular OBS is responsible.
Tracking Projects
283
The Group and Sort options list the name of the WBS category, for example, Phase,
which is the WBS category defined in Admin Categories when P6 Professional is
connected to a P6 Professional database and in P6 when connected to a P6
EPPM database.
Group and sort a tracking layout using custom settings
You can specify custom group and sort settings for layout information displayed in a
table format. For example, data displayed in a Project Table or column data displayed
to the left of a Gantt Chart or spreadsheet.
1) Choose View, Group and Sort By, Customize.
In the Top Layout window toolbar, you can also click the Display Options bar (in the
right pane), then choose Top Layout Options, Group and Sort By, Customize, or
right-click in the table, then choose Group and Sort By, Customize.
2) To include totals in the layout, mark the Show Grand Totals checkbox.
3) To show only summary data for each hierarchical level included in the layout, mark
the Show Summaries Only checkbox.
4) In the first row of the Group By column, double-click, then select the first category by
which to group.
5) If you select WBS, mark the Indent checkbox to list the WBS levels you select in the To
Level column. (To hide WBS levels that do not contain any data, mark the Hide If
Empty checkbox at the bottom of the Group and Sort dialog box.) Select a font and
color for each data group.
6) If you select date fields, select the group interval.
7) Mark the appropriate checkbox to determine the text that displays on the grouping
band.
To display the field name on the grouping band, mark the Show Title checkbox.
To display the ID or Code value on the grouping band, mark the Show ID/Code
checkbox.
To display the Name or Description on the grouping band, mark the Show
Name/Description checkbox.
8) Mark Sort grouping bands alphabetically to display the grouping bands in
alphabetical order rather than their order in their respective hierarchy.
9) Mark Hide if empty to hide group title bands that do not contain activities within the
group.
10) To define sort fields, click Sort.

P6 Professional User's Guide
284
11) Click Add, then in the Field Name column, double-click and select a sort field.
In the Sort Order column, select Ascending, Descending, or Hierarchical (option only
appears for fields that are hierarchical). Repeat this step for each sort field you want
to add.
12) Click OK, then click OK again.
Tips
To use the predefined grouping, click Default.
To delete a group or sort item, select it, then click Delete.
Project Table
Customize a Project Table
You can customize an existing Project Table by specifying the font, colors, and row
height; filtering the information it includes; specifying how you want the data grouped
and sorted; and specifying which data field columns you want to include.
Display the table, then use the View menu to select the type of information you want
to change.
Project Bar Chart
Customize a Project Bar Chart
You can customize an existing Project Bar Chart by specifying the data you want each
bar to represent, selecting the bar display options, and specifying how the information is
grouped and sorted.
Display the Project Bar Chart, then use the View menu to select the type of
information you want to change.
Project Gantt/Profile and Resource Analysis
Customize a Project Gantt/Profile
You can customize an existing Project Gantt/Profile by specifying options that determine
the data that are displayed and how they are displayed.
Display the Project Gantt/Profile. In the Top Layout window, click the Display Options
bar and choose Top Layout Options, then choose the type of information you want to
change. In the Bottom Layout window, click the Display Options bar and choose
Bottom Layout Options, then choose the type of information you want to change.

Tracking Projects
285
This layout displays a Gantt Chart in the Top Layout window and a project profile or
spreadsheet in the Bottom Layout window of the Tracking window. Column data are
displayed to the left of the Gantt Chart in the Top Layout window and to the left of the
spreadsheet in the Bottom Layout window. You can specify the bar data, spreadsheet
fields, and columns you want to display and choose filter, group, and sort options to
customize the information included in the layout. You can also specify the font,
background color, and row color and height for the columns; bar display options for the
Gantt Chart; and bar, curve, and graph display options for the profile. You can specify
the timescale for the Top and Bottom Layout windows.
Group and sort resources in the Resource Explorer window
1) To view by resource, in the Resource Explorer window, click the Display Options bar
and choose Select View, By Resource.
2) Click the Display Options bar again, then choose Group and Sort By and one of the
resource codes listed. You can also choose Default to show resources by level or
Customize to specify how you want resources to be grouped and sorted.
Tip
When you group resources by resource code or primary role, the resource profile
displays a total for the code or role, as well as for each resource assigned to the
code or role.
Filter resources in the Resource Explorer window
Click the Display Options bar in the Resource Explorer window, then choose Filter By
and one of the options listed below.
View by Resource
All Active Resources: Displays all resources assigned in the enterprise.
All Resources: Displays all resources defined for the enterprise.
Current Project's Resources: Displays resources assigned to the project currently selected
in the Project Explorer window.
Customize: Enables you to specify how you want to filter resources.
View by Role
All Roles: Displays all roles defined for the enterprise.
Current Project's Roles: Displays roles assigned to the project currently selected in the
Project Explorer window.
Customize: Enables you to specify how you want to filter roles.

P6 Professional User's Guide
286
Working with the Gantt Chart
Change a Gantt Chart bar's timescale
1) Display the Gantt Chart, then choose View, Top Layout Options, Bars.
2) Select the bar.
3) In the Timescale column, select the timeperiod you want the bar to represent.
4) To preview the new bar without closing the Bars dialog box, click Apply.
Here is more detail about specifying a bar's timescale:
Depending on whether an activity layout or a tracking layout is displayed, the options
vary for specifying the timeperiod represented by a Gantt Chart bar. Some timeperiods
are available for both layout types. In activity layouts the bars represent dates for an
activity; in tracking layouts, depending on the current view, bars may represent an EPS
node, project, or WBS element.
To represent this value: Select this bar:
Start Date to Finish Date Current Bar
Percent Complete % Complete Bar
Performance Percent Complete Performance %
Complete Bar
Planned Start Date to Planned Finish Date Plan Bar
Actual Start Date to Actual Finish Date Actual Bar
Remaining Start Date to Remaining Finish Date Remain Bar
Primary Baseline Planned Start Date to Primary
Baseline Planned Finish Date
Primary Baseline Bar
Secondary Baseline Planned Start Date to Secondary
Baseline Planned Finish Date
Secondary Baseline Bar
Tertiary Baseline Planned Start Date to Tertiary
Baseline Planned Finish Date
Tertiary Baseline Bar
Early Start Date to Early Finish Date Early Bar
Late Start Date to Late Finish Date Late Bar
Remaining Finish Date to Late Finish Date Float Bar
Remaining Finish Date to Late Finish Date with
Remaining after the late date
Neg Float Bar
User start and end dates defined in the activity
columns
User Defined Bars
Tracking Projects
287
Change a Gantt Chart bar's label
1) Display the Gantt Chart, then choose View, Top Layout Options, Bars.
2) Select the bar.
3) Click the Bar Labels tab.
To add a label to your bar, click Add at the bottom of the Bar Labels tab.
To delete a label from your bar, select the label and click Delete at the bottom of the
Bar Labels tab.
To change the position of a label, select the label, click the Position field, and select a
new position.
To change a label's display value, select the label, click the Label field, and select a
new value.
4) Click OK.
To view your changes without closing this dialog box, click Apply.
Change a Gantt Chart bar's style
1) Display the Gantt Chart, then choose View, Top Layout Options, Bars.
2) Select the bar.
3) Click the Bar Style tab.
4) To change the shape of the bar’s Start Endpoint (first field), the height and position of
the bar (second field), and the Finish Endpoint (end field), click each corresponding
field and select a shape.
5) To change the color of the bar’s Start Endpoint (first field), body (second field), and
the Finish Endpoint (end field), click each corresponding field and select a color.
6) To change the pattern of the bar’s Start Endpoint (first field), body (second field), and
the Finish Endpoint (end field), click each corresponding field and select a pattern.
7) To show the bar when you collapse the display to summary level information or to
show the bar as a summary bar only, mark the appropriate checkbox.
8) Specify the row in which the bar should appear in the Gantt Chart.
9) Click OK.
To view your changes without closing this dialog box, click Apply.
P6 Professional User's Guide
288
Change a Gantt Chart's background lines
1) Display the Gantt Chart, then choose View, Top Layout Options, Bars.
2) Click Options.
3) Click the General tab.
4) To show background horizontal lines before every Summary bar, mark the Show Major
Lines checkbox in the Horizontal Lines section.
5) To show background horizontal lines at a specific interval of rows, mark the Show
Minor Lines Every checkbox in the Horizontal Lines section, then type or select the row
interval at which you want to the minor lines to be displayed.
Customize the data date line
You can customize the data date line in the Activities and Tracking windows.
1) With the Activities window active, choose View, Bars. You can also click the Layout
Options bar and choose Bars.
With the Tracking window active, display the layout, then choose View, Bars. You can
also click the Display Options bar (in the right pane) in the Top Layout window and
choose Top Layout Options, Bars.
2) Click Options.
3) Click the Data Date tab.
4) To change the style for your data date line, select a style from the drop down list. The
line can be solid, or contain dashes and dots.
To change the thickness of your data date line, select a value between 1 and 10
pixels. This option is only available when the solid line is selected as the style. If your
line style is something other than the solid line and you increase the size to a number
greater than one, the bar style will switch to a solid line.
To change the color of your data date line, choose a color from the color palette.
5) Click OK.
To view your changes without closing this dialog box, click Apply.
Working with the Profile and Spreadsheet
Change a profile's background lines
1) Right-click on the profile and choose Activity Usage Profile Options, Resource Usage
Profile Options, or Profile Settings, depending on the type of profile and the active
window.
Tracking Projects
289
2) Click the Graph tab.
3) To display a vertical background line for major and/or minor timescale increments, in
the Vertical Lines area, mark the corresponding checkbox. For example, in a
Year/Month format timescale, major lines would display between years; minor lines
would display between months.
4) To display horizontal lines for each numerical increment listed along the side of the
profile, choose the type of line you want to display, then select the line color. Choose
None to hide background horizontal lines.
5) To specify additional profile display options, mark the corresponding checkbox(es):
Show Legend: Mark to display a legend for the profile's bars.
3D Bars: Mark to display the profile’s bars in 3D.
Background Color: Click to change the profile's background color.

291
In This Section
Grouping and Sorting ............................................................................................. 291
Filtering ..................................................................................................................... 298
Summarizing ............................................................................................................. 303
Grouping and Sorting
Grouping activities by field
Organize activities by grouping one or more data items, including phase, department,
responsible person, dates, total float, custom user field, and others. Grouping data
enables you to focus on activities that have something in common.
You can further organize your layout by using sorting to arrange the order of activities. If
you use both grouping and sorting to organize your layout, the items are grouped first
and then sorted.
Grouping by hierarchy
Various hierarchies are available for viewing project data, including the EPS (Enterprise
Project Structure), OBS (organizational breakdown structure), and WBS (work breakdown
structure).
You can further organize a hierarchical view of data by grouping and sorting activities.
In addition, some fields available for grouping may also have a hierarchy (or number of
levels) associated with them. For example, cost accounts may contain several levels of
codes. You can specify the number of levels to display in the layout when you group by
a hierarchical code.
Grouping activities by WBS path
You can organize multiple projects that use the same WBS structure by grouping their
identical WBS levels. The WBS path lists activities grouped by WBS levels, without
displaying the project level node. Group by WBS path in the Activities and WBS views.
You can also filter or display the WBS Path as a column in your projects and reports.
Grouping, Filtering, and Summarizing Data

P6 Professional User's Guide
292
Further organize your layout by using sorting to arrange the order of activities. If you use
both grouping and sorting to organize your layout, the items are grouped first, then
sorted.
Sorting
Arrange how activities are ordered in a layout by specifying sorting criteria. Sort activities
chronologically, alphabetically, numerically, or hierarchically depending on the data
items you select. When you use both grouping and sorting to organize your layout, the
data are grouped first and then sorted.
The following table describes how dates, numbers, and text are sorted.
Data Ascending Order Descending Order Hierarchical
Dates Sorts
chronologically,
from earliest to
latest dates.
Sorts
chronologically,
from latest to
earliest dates.
Dates can not be
sorted
hierarchically.
Numbers Sorts from largest
negative number
to largest positive
number.
Sorts from largest
positive number to
largest negative
number.
Numbers can not
be sorted
hierarchically.
Codes and Text Sorts
alphanumerically,
from 0 to 9, and
then A to Z.
Sorts
alphanumerically,
from Z to A, and
then from 9 to 0.
Sorts codes in the
order in which they
occur in their
respective
hierarchy.
Note
The option to sort Hierarchical only appears for fields that are hierarchical (for
example, WBS or Responsible Manager).
Grouping, Filtering, and Summarizing Data
293
Group activities by field
1) Choose Project, Activities, then choose View, Group and Sort By, Customize.
2) In the Group By section, click the cell, then select the item by which you want to
group.
3) Click Sort, then select a sort order for the group. Click OK.
4) To change a grouping band's attributes, such as the color and font, double-click the
appropriate Font & Color field.
5) To group by additional items (up to 20 levels), repeat step 2.
Tip
To remove a field, select the field you want to remove, then click Delete.
Note
In the Activity Network, when you select a field grouping, the hierarchy on the left
side of the window contains the WBS hierarchy so you can filter activities
according to the hierarchy.
Group activities by hierarchy
When viewing hierarchical data, such as by EPS, you can further organize the layout by
grouping and sorting.
1) Choose Project, Activities, then choose View, Group and Sort By, Customize.
2) Click a cell in the Group By section, then select the field by which you want to group.
3) If the field you are grouping by has a hierarchy (or levels) associated with it, choose
whether to display all levels or up to a specific level in the layout in the To Level field.
Hierarchical fields include WBS, resources, roles, cost accounts, activity codes,
resource codes, and project codes.
4) To change the grouping band’s appearance, double-click the Font & Color cell and
select the text properties and color you want to use.
5) To group by additional fields (up to 20 levels or items), repeat steps 2 through 4.
Note
If both Indent and Sort Grouping Bands Alphabetically are checked, the grouping
bands are sorted alphabetically within each parent.
In the Activity Network, when you select a hierarchy grouping, the left side of the
window contains the WBS hierarchy so you can filter activities according to the
WBS.

P6 Professional User's Guide
294
Group activities by WBS path
1) Choose Project, Activities, then choose View, Group and Sort By, Customize.
To view the WBS Path in the WBS view, choose Project, WBS. Then choose View, Group
and Sort by, WBS Path.
2) In the Group By section, click the cell, then select WBS Path.
3) Click Sort, then select a sort order for the WBS path. Click OK.
4) To change the grouping band's attributes, such as the color and font, double-click
the appropriate Font & Color field.
Sort activities
You can specify one or more sorting criteria to control the order of activities in a layout.
1) Choose Project, Activities, then choose View, Group and Sort By, Customize.
2) Click Sort.
3) Click Add.
4) Click the Field Name column to select the field by which you want to sort.
5) Double-click the Sort Order column, then select a sort order: ascending
(alphabetically from lowest to highest), descending (alphabetically from highest to
lowest), or hierarchical (option only appears for fields that are hierarchical).
To sort by additional fields, repeat steps 3 through 5.
6) Click OK.
7) To preview your changes, click Apply.
Note
If you use both grouping and sorting to organize your layout, the items are
grouped first and then sorted.
Format grouping bands
1) Choose View, Group and Sort By, Customize.
2) Double-click the Font & Color cell you want to change.
Click the Font box to change the text properties.
Click the Color box to change the grouping band color.

Grouping, Filtering, and Summarizing Data
295
3) Mark the appropriate checkbox to determine the text that displays on the grouping
band.
To display the field name on the grouping band, mark the Show Title checkbox.
To display the ID or Code value on the grouping band, mark the Show ID/Code
checkbox.
To display the Name or Description on the grouping band, mark the Show
Name/Description checkbox.
Set Page Breaks by Group Band
You can set page breaks by group bands from the Projects, Resources, Activities (except
for the Activity Network layout), and Resource Assignments windows.
Notes:
This procedure assumes you have already set or selected the applicable Group By
fields in the Group and Sort dialog box to group items.
When you set page breaks by group band for a layout, the Break Page Every
Group option on the Page Setup dialog box Options tab is disabled for that
layout.
1) From the Projects, Resources, or Resource Assignments windows, choose View, Group
and Sort By, Customize. From the Activities window, choose View, Group and Sort.
2) Mark the Page Break checkbox in the row of the group you want to set to cause a
page break when printing this layout. Repeat this step for each additional group by
field that you want to set to cause a page break.
3) Click OK.
Tips
Page breaks are only visible in Print Preview and in published layouts.
Page break settings are saved with the layout.
Show or hide empty title bands
When you group activities by field, a title band is listed for all values in that field. You can
specify whether to show or hide the title bands that do not contain activities within the
group.
1) Choose Project, Activities, then choose View, Group and Sort By, Customize.
2) Mark the Hide If Empty checkbox at the bottom of the dialog box to hide empty
group title bands.
Clear the Hide If Empty checkbox at the bottom of the dialog box to display empty
group title bands.
P6 Professional User's Guide
296
Show field titles in grouping bands
1) Choose Project, Activities, then choose View, Group and Sort By, Customize.
2) Mark the Show Title checkbox at the bottom of the dialog box.
Group and sort resource assignments
1) Choose Project, Resource Assignments, then choose View, Group and Sort By, or click
the Display Options bar and choose Group and Sort By.
2) Choose one of the predefined group and sort options, or, to customize grouping and
sorting, choose Customize.
If you choose Customize
1) In the Group By column, double-click the cell, then select the field by which you want
to group.
2) Click Sort, then select a sort order for the grouping. Click OK.
3) To change a group's display color and font, double-click the appropriate Font &
Color field.
4) To group and sort by additional fields, repeat steps 1 and 2.
Tips
To remove a grouping field, select the field you want to remove, then click Delete.
If you manually plan future period resource/role allocation in the Resource Usage
Spreadsheet, you should group and sort data in a way that enables you to easily
identify resources/roles, the activities to which they are assigned, and the
activities’ associated projects (because the same activity name may appear in
different projects). For example, you can group and sort the Resource Usage
Spreadsheet by project and by resource.
Set as a user preference
To display a label on grouping bands for windows/dialog boxes where you cannot
access a Group and Sort dialog box,
1) Choose Edit, User Preferences.
2) Click the Application tab.
3) In the Group and Sorting section, mark Show ID/Code, Show Name/Description, or
both.

Grouping, Filtering, and Summarizing Data
297
Auto-Reorganization
Reorganizing window data automatically
By default, when you add, edit, or remove data in a window (for example, the Activities
or Projects window), the module automatically reorganizes data in the active window
according to the group and sort criteria specified for the window.
You can disable this feature temporarily per view (Tools, Disable Auto-Reorganization) to
make it easier if you have many changes to make. If you close the project you are
working on or log out of P6 Professional, Auto-Reorganization will automatically be
switched on again. However, if you are working on one project with Auto-Reorganization
turned off and open another project (without closing the first), Auto-Reorganization will
stay switched off.
Notes
When you change views, apply a filter, cut, copy, paste, or refresh data, P6
Professional will reorganize the data, regardless of whether Disable
Auto-Reorganization is enabled or disabled.
Auto-reorganization applies to main windows only; dialog boxes are not affected.
Additionally, your auto-reorganization setting (enabled or disabled) applies to the
active window only.
Enable or disable auto-reorganization
The module automatically reorganizes data in the current window according to the
group and sort criteria specified for the window when you add or move data, unless you
disable auto-reorganization. Do one of the following:
With any window active, choose Tools, Disable Auto-Reorganization.
Click on the Tools toolbar.
Tips
By default, Disable Auto-Reorganization is turned off, meaning that window data
will be automatically reorganized unless you turn this feature on.
A square outline surrounding the icon on the menu or in the toolbar indicates that
Auto-Reorganization is currently disabled.
Auto-reorganization applies to window-level data only; it does not apply to data
stored in dialog boxes. For example, activities in the Activities window may be
reorganized using this feature, but related elements in an associated dialog box
will not be reorganized, even if Disable Auto-Reorganization is turned off.
When you change views, apply a filter, cut, copy, paste, or refresh data, P6
Professional will reorganize the data, regardless of whether Disable
Auto-Reorganization is enabled or disabled.
Your auto-reorganization setting (enabled or disabled) applies to the active
window only.

P6 Professional User's Guide
298
Filtering
Filtering data
A filter temporarily limits the projects or activities that appear on screen, according to
criteria you establish. For example, you can view active projects or activities scheduled
to start during the next three weeks. Use the filters supplied or create your own. Apply
one or more filters to the layout at any time.
Default filter criteria
The following table lists the criteria used for the predefined activity filters.
Filter Name Display all
rows
Parameter Is Value
Completed Where Activity Status Equals Completed
Critical Where Critical Equals Yes
Has Finish Constraint Where
Or
Or
Or
Or
Or
Or
Or
Primary
Constraint
Primary
Constraint
Primary
Constraint
Primary
Constraint
Secondary
Constraint
Secondary
Constraint
Secondary
Constraint
Secondary
Constraint
Equals
Equals
Equals
Equals
Equals
Equals
Equals
Equals
Finish On
Finish On or
Before
Finish On or
After
Mandatory
Finish
Finish On
Finish On or
Before
Finish On or
After
Mandatory
Finish
Has Start Constraint Where
Or
Or
Or
Or
Or
Primary
Constraint
Primary
Constraint
Primary
Constraint
Primary
Equals
Equals
Equals
Equals
Equals
Equals
Start On
Start On or
Before
Start On or After
Mandatory Start
Start On
Start On or
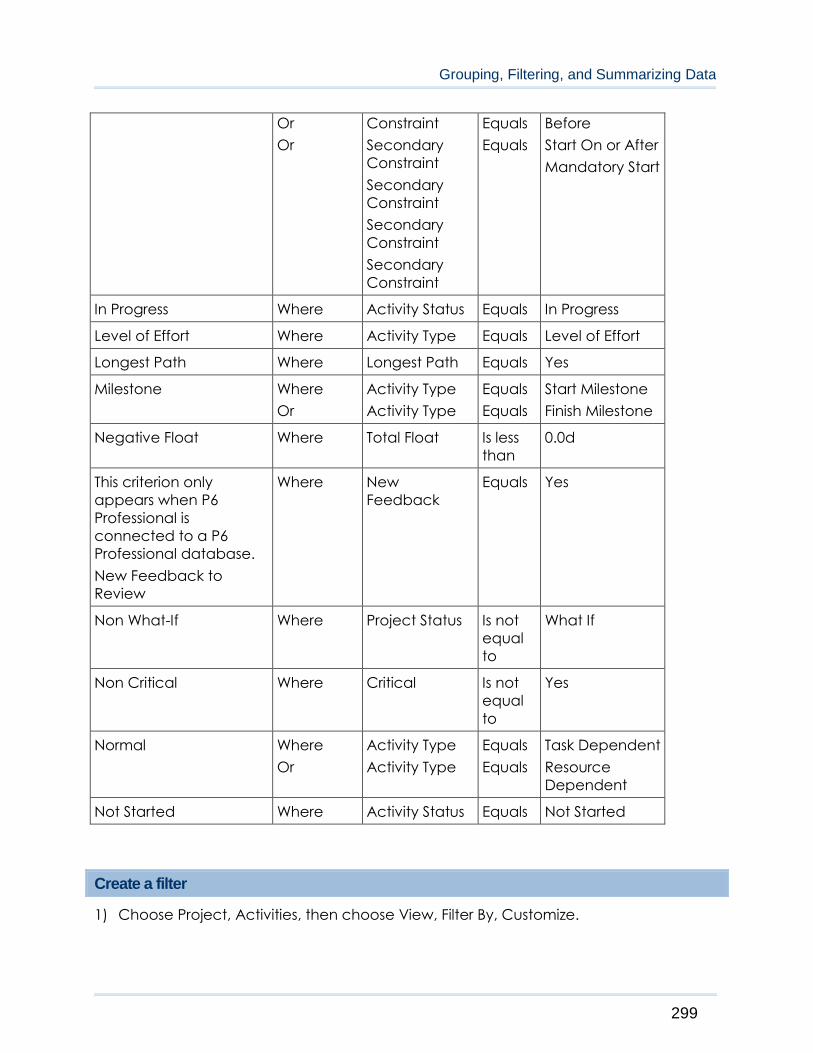
Grouping, Filtering, and Summarizing Data
299
Or
Or
Constraint
Secondary
Constraint
Secondary
Constraint
Secondary
Constraint
Secondary
Constraint
Equals
Equals
Before
Start On or After
Mandatory Start
In Progress Where Activity Status Equals In Progress
Level of Effort Where Activity Type Equals Level of Effort
Longest Path Where Longest Path Equals Yes
Milestone Where
Or
Activity Type
Activity Type
Equals
Equals
Start Milestone
Finish Milestone
Negative Float Where Total Float Is less
than
0.0d
This criterion only
appears when P6
Professional is
connected to a P6
Professional database.
New Feedback to
Review
Where New
Feedback
Equals Yes
Non What-If Where Project Status Is not
equal
to
What If
Non Critical Where Critical Is not
equal
to
Yes
Normal Where
Or
Activity Type
Activity Type
Equals
Equals
Task Dependent
Resource
Dependent
Not Started Where Activity Status Equals Not Started
Create a filter
1) Choose Project, Activities, then choose View, Filter By, Customize.

P6 Professional User's Guide
300
2) Click New, then type a filter name.
3) Click the Parameter field and select a data item.
4) Double-click the Is field to select a filtering criteria. Specify a value in the Value field.
5) To add multiple criteria to the filter, click Add. In the new row, click the Parameter
field and select a value. Double-click the Is field and select a filter criteria. Specify a
value.
To review your filter criteria to eliminate redundancy, from the Display Options bar,
choose Optimize.
6) When you are finished specifying filter criteria, click OK.
Notes
New selection criteria enables you to select values within or outside a specified
range. "Is within range of" enables you to select date or numeric items that fall
within the specified range. "Is not within range of" enables you to select date or
numeric items that fall outside the specified range.
When you type a value for duration or units in the Value field, the value is entered
into the database without being converted to hours. So, for example, if you enter
2d, the value stored is 2 days, not 16 hours. If you do not specify a unit when
entering a value (for example, you enter 2 rather than 2d), the time unit defaults to
the time unit specified in user preferences (User Preferences, Time Units tab).
When connected to a P6 Professional database: If you are filtering by unit or
duration field and the Use assigned calendar to specify the number of work hours
for each time period checkbox is cleared (Admin Preferences, Time Periods tab),
then filtering applies the unit or duration value based on the Admin Preferences
hours per time period settings.
When connected to a P6 EPPM database: If you are filtering by unit or duration
field and the Use assigned calendar to specify the number of work hours for
each time period checkbox is cleared (Application Settings, Time Periods link in
P6), then filtering applies the unit or duration value based on the Application
Settings, Time Periods link, Hours per Time Period in P6.
If the checkbox is marked, then filtering applies the unit or duration values as
follows: For a task-dependent activity, duration or unit values are applied
based on the applicable global or project calendar; for a resource-dependent
activity, duration or unit values are applied based on the resource calendar.
Tip
To make this filter available to all users, select it, then click Make Global in the
Filters dialog box.
Apply a filter
1) Choose Project, Activities.

Grouping, Filtering, and Summarizing Data
301
2) Choose View, Filter By, Customize.
3) Mark the checkbox next to the filter you want to apply.
To preview your changes, click Apply.
Tip
Combine existing filters to narrow the activities selected. Use any combination of
default, global, layout, and user-defined filters. For example, combine the Critical
and Milestone filters to view critical start and finish milestone activities in the layout.
Combine filters
You can combine existing filters to narrow your activity selection. Use any combination of
default, global, layout, and user-defined filters. For example, combine the Critical and
Milestone filters to view critical start and finish milestone activities in the layout.
1) Choose Project, Activities, then choose View, Filter By, Customize.
2) Mark the checkbox next to each filter you want to apply.
3) Choose All or Any to determine how criteria are met.
4) Click Apply to preview the results.
Change a Gantt Chart bar's filter
1) Choose Project, Activities, then display the Gantt Chart.
2) Choose View, Bars.
3) Select the Gantt Chart bar for which you want to change the filter. Double-click the
Filter column.
4) Mark the checkbox next to each filter you want to use.
5) Click OK.
To view your changes without closing this dialog box, click Apply.
Create a lookahead filter
When defining filters, you can select data based on their relationship to the project start
date, finish date, or current date, rather than specific calendar dates. This prevents you
from having to update the filter each time you update the project.
To create a six-week lookahead filter
1) Choose Project, Activities, then choose View, Filter By, Customize.
2) Click New.
3) Type a filter name, such as Six-Week Lookahead.
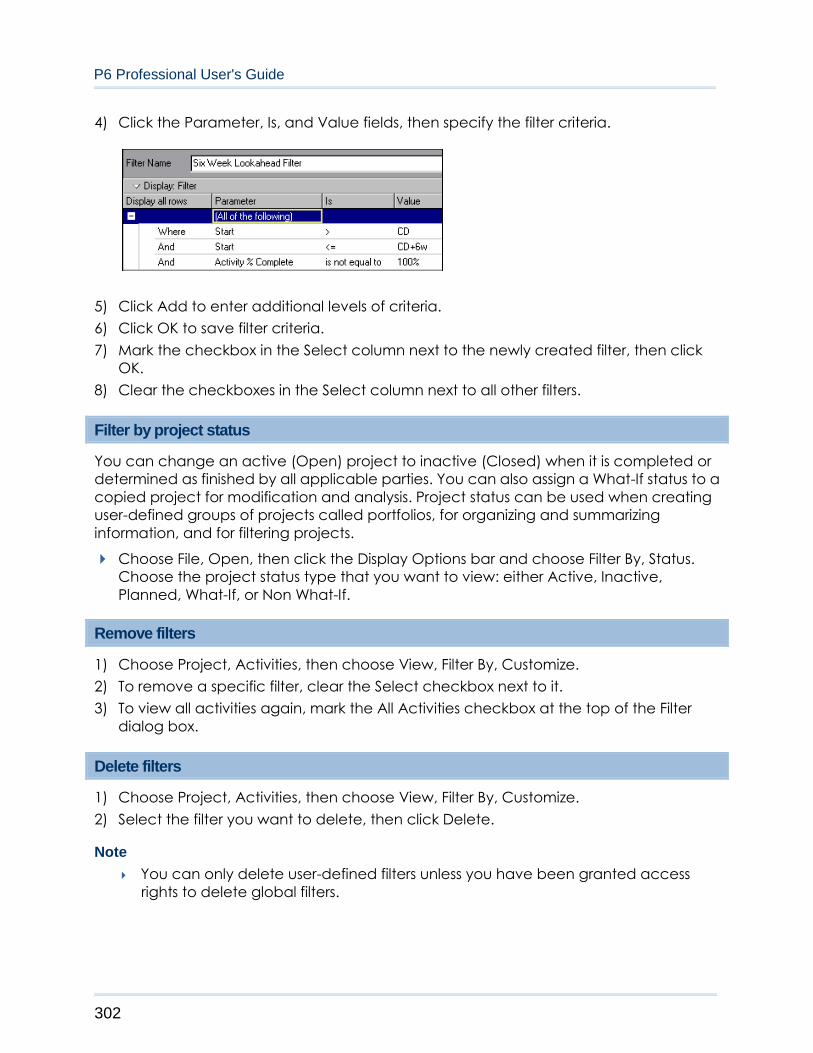
P6 Professional User's Guide
302
4) Click the Parameter, Is, and Value fields, then specify the filter criteria.
5) Click Add to enter additional levels of criteria.
6) Click OK to save filter criteria.
7) Mark the checkbox in the Select column next to the newly created filter, then click
OK.
8) Clear the checkboxes in the Select column next to all other filters.
Filter by project status
You can change an active (Open) project to inactive (Closed) when it is completed or
determined as finished by all applicable parties. You can also assign a What-If status to a
copied project for modification and analysis. Project status can be used when creating
user-defined groups of projects called portfolios, for organizing and summarizing
information, and for filtering projects.
Choose File, Open, then click the Display Options bar and choose Filter By, Status.
Choose the project status type that you want to view: either Active, Inactive,
Planned, What-If, or Non What-If.
Remove filters
1) Choose Project, Activities, then choose View, Filter By, Customize.
2) To remove a specific filter, clear the Select checkbox next to it.
3) To view all activities again, mark the All Activities checkbox at the top of the Filter
dialog box.
Delete filters
1) Choose Project, Activities, then choose View, Filter By, Customize.
2) Select the filter you want to delete, then click Delete.
Note
You can only delete user-defined filters unless you have been granted access
rights to delete global filters.
Grouping, Filtering, and Summarizing Data
303
Summarizing
How data is summarized
This topic describes how P6 Professional calculates and displays summary information for
costs and units, custom user fields, dates, durations, float, progress, baselines,
comparison data, and variances.
Costs and units: P6 Professional totals cost and unit data items, such as budgeted or
planned cost and budgeted or planned quantity, by adding the values for each activity
in the summary.
Custom user fields: P6 Professional summarizes user fields according to type. For example,
items representing start dates show the earliest start date, and items for finish dates show
the latest finish dates. A numeric user field is totaled for the summarized activities.
Dates: If you display early dates, P6 Professional shows the earliest early (or actual) start
and the latest early (or actual) finish dates. The same rules apply for late dates and
target early and late dates.
Durations: P6 Professional summarizes original or planned and remaining duration values.
For activities with no progress, the original or planned and remaining durations are the
number of workperiods between the earliest start and latest finish dates. If the summary
activity has an actual start date, P6 Professional calculates the original or planned
duration from the actual start date to the latest finish date. In this case, P6 Professional
calculates remaining duration from the earliest early start date to the latest early finish
date.
If the summary activity is 100 percent complete, P6 Professional calculates the original or
planned duration as the difference between the actual start and the actual finish dates;
the remaining duration is zero.
If you display actual duration, the data is calculated as follows:
Earliest Actual Start - Data Date (for activities with no actual finish date)
Earliest Actual Start - Latest Actual Finish (all activities in the summary must have an
actual finish date)
Float: You can base total float of the summarized data on the start dates, finish dates, or
most critical dates. Set this option in the Compute Total Float As field on the General tab
of the Schedule Options dialog box (choose Tools, Schedule, Options). If you base float
on start dates, and all activities are assigned to the same calendar, total float is the
difference between the earliest late start and the earliest early start dates in workperiods.
For finish dates, P6 Professional uses the latest late finish and the latest early finish dates to
calculate total float. The most critical float is the lowest total float encountered in the
detailed activities from each summary group.
If all activities are not assigned to the same calendar, P6 Professional defines total float
based on the default global calendar.

P6 Professional User's Guide
304
Progress: The simplest measure of percent complete uses duration to compare the
amount of time remaining to complete the activities to their original or planned duration.
In this case, P6 Professional uses the following ratio for each summarized group.
[(Summary Current Original or Planned Duration – Summary Remaining Duration) /
Summary Current Original or Planned Duration] * 100
Baseline data, comparison data, and variances: You classify each baseline, comparison,
or variance data item as either a date or a duration data item. See the Dates and
Durations sections earlier in this topic for descriptions of how P6 Professional summarizes
dates and durations.
Calendar used to calculate units and durations in grouping (summary) bands
Duration and unit values in grouping bands are calculated using the hours per time
period settings defined in the default global calendar, default project calendar,
resource calendar, or activity calendar, as follows:
For live (detail) data:
Activities window
When a single project is open and all activities in a group are using the same
calendar, then the rolled up duration and unit values are calculated using that
calendar. If all the activities are not using the same calendar, then the rolled up
duration and unit values are calculated using the project’s default calendar.
When multiple projects are open and all the activities in a group are using the
same calendar, then the rolled up duration and unit values are calculated using
that calendar. However, if all the activities are not using the same calendar, then
the values are calculated as follows:
If all the activities under the group band are in the same project, then rolled
up duration and unit values are calculated using the project’s default
calendar.
If all activities under the group band do not belong to the same project,
then rolled up duration and unit values are calculated using the default
global calendar.
Work Breakdown Structure window
When all activities under a WBS use the same calendar, then the rolled up
duration values are calculated using that calendar. If all the activities are not
using the same calendar, then the rolled up duration values are calculated using
the project’s default calendar.
Projects window
Grouping, Filtering, and Summarizing Data
305
When projects are open, rolled up duration values are calculated based on live
rollup calculations. When projects are closed, the rolled up duration values are
calculated based on summarized data. The project's default calendar is typically
used to calculate the project's duration values for live data. However, if all
activities under a group band are using the same calendar (one that is other than
the project's default calendar), then the duration values are calculated using that
calendar.
Resource Assignments window (the following applies only to an open project)
If all resource assignment records under a band belong to the same resource (that
is, are grouped by resource), then duration values are calculated using the
resource's calendar.
If resource assignment records under a band belong to different resources (using
the same calendar or not), then duration values are calculated using the default
global calendar.
Note
The Resource Assignments window may display duration values you do not expect
because resource assignment durations are based on the activity's calendar
when task dependent and on the resource calendar when resource dependent.
The following items provide the reasoning for the duration values that are
displayed:
If grouped by resource and all tasks are resource dependent, then the
resource's duration for tasks and group bands will be the same duration
value.
If grouped by resource and all tasks are task dependent, then the resource's
duration for tasks and group bands can show different duration values
based on the calendars assigned to each. For example, the duration value
for the group band may be 12.0h based on the resource calendar in the
group band, while the duration value for an associated task dependent
task may be 10.0h, based on the task calendar. However, if both resource
and activity are assigned to the same calendar, then the values at task and
group bands are the same.
If grouped by resource and all tasks are a mix of resource and task
dependent, then the resource's duration for tasks and group bands will
show different duration values based on the calendars assigned to each.
Tracking window
When projects are open, rolled up duration values are calculated based on live
rollup calculations. When projects are closed, the rolled up duration values are
calculated based on summarized data. The project's default calendar is typically
used to calculate the project's duration values for live data. However, if all
activities under a group band are using the same calendar (one that is other than
the project's default calendar), then the duration values are calculated using that
calendar.
P6 Professional User's Guide
306
For summarized data:
For project-level and WBS-level summary data: If all activities under the group
band are using the same calendar, then the summarized duration and unit values
are calculated using that calendar. If all the activities are not using that calendar,
then the values are calculated using the project’s default calendar.
For enterprise resource and role summaries: The summarized duration and unit
values are calculated using the resource’s calendar.
For EPS-level summary data: If all projects under an EPS are assigned to the same
default project calendar, then the summarized duration and unit values are
calculated using that calendar. If all projects under an EPS are not assigned to the
same default calendar, then the summarized duration and unit values are
calculated using the default global calendar.
Tip
For hierarchical banding, the calendars for all activities directly under the band
and all bands under that must be the same or else the default project or global
calendar is used. The rules for whether the default project or global calendar is
used are the same as listed above.
Viewing summary project information
After you summarize project data, you can easily view this information. For example, add
the Planned Value Cost, Earned Value Cost, Actual Cost, Cost Variance, and Schedule
Variance columns to the Projects view and group by EPS to quickly see which projects
are behind schedule and/or over budget in the enterprise.
The module summarizes two sets of project data: past period actuals and actual to date.
You can choose the set of data you want to view in profile options.
Note
A schedule variance occurs when earned value is less than planned value. Cost
variances occur when actual cost exceeds earned value.
Set a project's summarization options
1) Choose Enterprise, Projects.
2) Select the project you want to summarize.
3) Display Project Details, then click the Settings tab.
Grouping, Filtering, and Summarizing Data
307
4) In the Summarized Data section, type the maximum WBS level to which the project
can be summarized in the Summarize to WBS Level field. When P6 Professional is
connected to a P6 EPPM database, this value represents the number of levels of data
that will display in the Portfolios section of P6.
When connected to a P6 EPPM database: Choose whether you want the summarizer
to calculate and display summarized resource data based on project-level or
activity-level resource assignments. Typically, use the High Level Resource Planning
option for future projects that are currently planning high-level resource allocation
requirements, or for projects that are underway, but for which you do not want to
assign resources at a detailed activity-level. Use the Detail Activity Resource
Assignments option for in-progress projects when you want to review detailed
activity-level summarized data, for example, for earned value reporting.
The Last Summarized On field displays the last time data were summarized for the
project.
Summarize project data
Follow these steps to use the summary service to roll up and save resource quantity, cost,
and/or custom user field information for projects at any level of the WBS or EPS.
1) Choose Enterprise, Projects.
2) Select the project you want to summarize.
3) Choose Tools, Summarize, then choose Open Projects or All Projects.
When connected to a P6 EPPM database: The job is now sent to a queue and run as
an ASAP service. Because the job is not run locally from P6 Professional, there may be
a time lag before it is processed. The status of your job, such as pending, failed,
running, or completed, appears in the Last Job Request field in the status bar of your
screen. You can also click Tools, Job Status to display the Job Status dialog box for
details about the status of jobs. Finally, a message appears in the taskbar, along with
the Oracle icon, when the job completes successfully or if it fails to complete
successfully. The message appears for ten seconds and displays the internal job name
of the job. After ten seconds only the Oracle icon continues to appear, and you can
click it to view the message. Use P6 to view the log file.
4) When connected to a P6 EPPM database: When the job completes successfully,
press F5 to refresh open windows with the latest data.
Tips:
When connected to a P6 Professional database: P6 Professional can
automatically summarize project data at regularly scheduled intervals.
When connected to a P6 EPPM database: The Last Job Request field in the status
bar of your screen displays the status of the last job request that you submitted. So
if you submit two jobs, only the status of the last request appears.
P6 Professional User's Guide
308
Notes:
When connected to a P6 Professional database: Global resource summaries are
only recalculated when you select "All Projects."
When connected to a P6 EPPM database: Global resource summaries always
occur.
When connected to a P6 EPPM database: Enterprise project summaries do not
occur when you run a summarizer job from the client.
Summarize project data as a distributed job service
Primavera distributed job services (PDJS) enable large summarization jobs to be
separated into smaller jobs by running the services concurrently on multiple servers. For
example, you can summarize an EPS with four EPS nodes (projects) in two, three, or four
separate summarizing jobs.
1) Choose Tools, Job Services, then click Add.
2) Select Summarize in the Service Type field.
3) Specify a number in the Job # field to indicate the sequence in which the service
should be performed.
4) Type a brief description of the service in the Job Name field.
5) In the Status field, select Enabled to activate the summary service.
You can suspend a service at any time by selecting Disabled in the Status field.
6) For Job 1, in the Run Job area on the Job Details tab, schedule when the service
should be run.
7) For each subsequent job, in the Run Job area on the Job Details tab, select the
option to run the job Immediately after previous job#.
8) For each job, in the Job Options tab, assign the EPS nodes you want to include in the
job.
309
In This Section
Report Basics ........................................................................................................... 309
Working with Report Groups .................................................................................. 316
Working with Report Batches ................................................................................ 317
Using the Report Editor to Modify Reports ........................................................... 325
Producing Graphics ................................................................................................ 351
Publishing Layouts and Reports in HTML Format ................................................. 353
Report Basics
Reporting features
In addition to providing a large library of standard project management reports, two
reporting tools are available to access and report information stored in the database:
the Report Wizard and the Report Editor.
Report Wizard
You can use the Report Wizard to easily create a wide variety of customized reports. The
wizard steps you through the process of creating new reports, enabling you to select the
category of information and specific data fields to include. You can group, sort, and filter
project information and include time-distributed data for units and costs. When you
create a report with the Report Wizard, you can later use the wizard or the Report Editor
to modify the report, if necessary.
Reports created with the Report Wizard have the wizard icon:
Report Editor
The Report Editor is a powerful tool that enables you to create reports that are highly
customized. Although you can create customized reports with the Report Wizard, the
Report Editor provides the capability to tailor a report more closely to your specific
requirements. The Report Editor enables you to group, sort, filter, and roll up project
information. You can display time distributions for units and costs and include graphics
and HTML links in your reports. You can use the Report Editor to further customize reports
you create with the Report Wizard. However, if you modify a wizard report in the Report
Editor, when you reopen the report in the wizard, you lose all of the modifications made
in the Report Editor.
Producing Reports and Graphics
P6 Professional User's Guide
310
Reports created with the Report Editor have the report icon:
Note that to create a new report with the Report Editor, you need to modify an
existing report created with the Report Wizard.
Printing and saving reports
You can preview and print reports and you can save reports as text or HTML files. If you
save a report to a file, you can import the data to a spreadsheet program, e-mail the
report, publish the report on a Web site, and/or archive the report. You can also compile
a report and create a WP & Docs record for the report. Creating a WP & Docs record for
the report allows that report to be accessed from the WPs & Docs window. When P6
Professional is connected to a P6 EPPM database, reports can also be accessed from the
Project Documents portlet and the Projects, Documents page in P6.
To view a list of the standard reports, select Tools, Reports, Reports.
Creating default headers, footers, and custom labels (P6 EPPM database Only)
You can define three default sets of headers, footers, and custom labels for reports.
These default settings apply to all projects and can be viewed by all users, but you must
have Add/Edit/Delete Global Reports global privilege, as defined in P6, to edit these
settings.
To create default headers, footers, and custom labels, select Tools, Reports, Report
Preferences.
Report Wizard
You can use the Report Wizard to create new reports and modify existing wizard reports.
The Report Wizard helps you easily create new customized reports by enabling you to
Select the subject areas and specific fields you want to include
Group, sort, and filter report data
Choose to display report data based on actual to date or past period actual
values
Control report column sizes
Add a report title
Preview the report and modify it
When you create and save a report using the Report Wizard, you can later use the
wizard or the Report Editor to modify it. However, if you modify a wizard report in the
Report Editor, when you reopen the report in the wizard, you lose all of the modifications
made in the Report Editor.
Tip
If you want to modify a report, but think you might want to use the original report
again, make a copy of it first.

Producing Reports and Graphics
311
Create a new report with the Report Wizard
Choose Tools, Report Wizard. Follow the prompts on each dialog box in the wizard to
create the report.
Notes
When connected to a P6 Professional database: To create or edit global reports
from the Report Wizard or Report Editor, you must have Edit Global Reports
security privileges. To create or edit project reports from the Report Wizard or
Report Editor, you must have Edit Project Reports security privileges. You do not
require security privileges to view global or project reports.
When connected to a P6 EPPM database: To create or edit global reports from the
Report Wizard or Report Editor, you must have the appropriate global privileges
as defined in P6. To create or edit project reports from the Report Wizard or
Report Editor, you must have the appropriate project security privileges as
defined in P6. You do not require security privileges to view global or project
reports.
You can use the Report Editor to further customize reports you create using the
wizard. However, if you modify a wizard report in the Report Editor, when you
reopen the report in the wizard, you lose all of the modifications made in the
Report Editor.
Modify a report with the Report Wizard
1) In the Reports window, select the report.
2) Click the Reports Wizard icon on the Reports toolbar.
3) On the first wizard screen, choose Modify Wizard Report, then click Next.
4) Follow the prompts on each dialog box in the wizard to modify the report.
Report Editor
The Report Editor enables you to create highly customized reports. You can use the
Report Editor to modify reports that you create in the Report Wizard and to create new
reports. If you modify a wizard report in the Report Editor, when you reopen the report in
the wizard, you lose all of the modifications made in the Report Editor.
Use the Report Editor window to add, edit, and organize report components and to
customize the look of a report by specifying font styles, and adding images, headers and
footers, and comments. The main report components you can work with are data
sources, rows, and cells. The Report Editor window includes a toolbar and right-click
menus that enable you to easily add and customize report components.
P6 Professional User's Guide
312
Create a blank report
1) Select an existing report.
Copy and paste an existing report first if you do not want to modify the original report.
2) Right-click on the selected report and choose Modify.
3) Click Yes to confirm that you want to use the Report Editor.
4) Within the Report Editor, click the new report icon:
5) Click Yes to confirm.
You can now start creating a new report with the Report Editor.
Preview a report
1) In the Reports window, select the report and click on the Reports toolbar, or
right-click on the report and choose Run, Report.

Producing Reports and Graphics
313
2) Choose Print Preview, then click OK.
To change the page setup options, such as paper size, margins, header, and footer,
click . These setup options will not be saved. To change page setup options for a
report permanently, use the Report Editor.
To set the default printer, paper size, and page orientation, click
To magnify the display size, click .
To reduce the display size, click .
To display the first page of the report, click .
To display the previous page of a two-page horizontal spread, click .
To display the next page of a two-page horizontal spread, click .
To display the previous page of the report, click .
To display the next page of the report, click .
To display the last page of the report, click .
Tip
You can copy or save the current page displayed in the Print Preview window.
Right-click and choose Copy or Save As. Copy saves the page to the clipboard.
Save As enables you to choose a file format and specify where you want to save
the file.
Note: International characters that are not supported by the
default font, Microsoft Sans Serif, or Times New Roman, may
appear correctly.
Print a report
Use this task to preview and print reports and to save reports as text or HTML files. You can
also use this task to compile and e-mail a report, and to compile a report and create a
WP & Docs record for the report. Creating a WP & Docs record for the report allows that
report to be accessed from the WPs & Docs window. When P6 Professional is connected
to a P6 EPPM database, reports can also be accessed from the Project Documents
portlet and the Projects, Documents page in P6.
P6 Professional User's Guide
314
When P6 Professional is connected to a P6 Professional database:
1) From the Reports window, select the report and click on the Reports toolbar, or
right-click on the report and choose Run, Report.
2) Proceed as follows:
a. To preview the report before printing it, choose Print Preview.
b. To print the report, choose Directly to Printer.
c. To generate the report and attach it to an e-mail, choose E-mail Attachment. If
you select this option, go to substep f.
d. To save the report as an HTML file, choose HTML File. In the Output file field, click
and select a location to save the report file. If you choose Create WP & Docs
record, below, select a network location or some other publicly accessible
location. To open the report text file in your default HTML viewer when it is finished
compiling, mark the View file when done checkbox.
e. To save the report as a delimited text format (.txt) file, choose ASCII Text File and
select a Field Delimiter and Text Qualifier. In the Output File field, click and
select a location to save the report file. If you choose Create WP & Docs record,
below, select a network location or some other publicly accessible location. To
open the report text file in your default TXT viewer when it is finished compiling,
mark the View file when done checkbox.
f. In the Notes field, you can type report comments. The comments you enter are
printed and saved in the report. The next time you run a report, you can clear or
edit the Notes field. If you choose E-mail Attachment, the content in this field is
copied to the body of the e-mail.
g. Click OK. If you chose E-mail Attachment, clicking OK launches the default e-mail
application and attaches the report to a new e-mail.
When P6 Professional is connected to a P6 EPPM database:
1) From the Reports window, select the report and click on the Reports toolbar, or
right-click on the report and choose Run, Report.
2) Proceed as follows:
a. To preview the report before printing it, choose Print Preview.
b. To print the report, choose Directly to Printer.
c. To generate the report and attach it to an e-mail, choose E-mail Attachment. If
you select this option, go to substep g.
d. To save the report as an HTML file, choose HTML File. In the Output file field, click
and select a location to save the report file. If you choose Create WP & Docs
record, below, select a network location or some other publicly accessible
location. To open the report text file in your default HTML viewer when it is finished
compiling, mark the View file when done checkbox.

Producing Reports and Graphics
315
e. To save the report as a delimited text format (.txt) file, choose ASCII Text File and
select a Field Delimiter and Text Qualifier. In the Output File field, click and
select a location to save the report file. If you choose Create WP & Docs record,
below, select a network location or some other publicly accessible location. To
open the report text file in your default TXT viewer when it is finished compiling,
mark the View file when done checkbox.
f. To create a WP & Docs record for this report, choose Store report in Work Products
and Documents for this project.
Note: To create a WP& Doc record for a report, only a single project can be open,
and you must have the Add/Edit/Delete Project Work Products and Documents
privilege for the open project.
g. In the Notes field, you can type report comments. The comments you enter are
printed and saved in the report. The next time you run a report, you can clear or
edit the Notes field. If you choose Store report in Work Products and Documents for
this project, the content in the Notes field is copied to the Description for the WP &
Docs record. If you choose E-mail Attachment, the content in this field is copied to
the body of the e-mail.
h. Click OK. If you chose Store report in Work Products and Documents for this
project, clicking OK generates the report and creates a WP & Docs record that
has the same name as the Output file name. If you chose E-mail Attachment,
clicking OK launches the default e-mail application and attaches the report to a
new e-mail.
Note
When you print the report as an HTML file or ASCII Text File, page breaks are not
shown.
Copy a report
1) In the Reports window, select the report you want to copy.
2) Choose Edit, Copy.
3) If you want to copy the report to a specific report group, click the Display Options bar
and select Group and Sort By, Report Group. Select the report group to which you
want to add the copy.
4) Click Paste.
5) To rename the report copy, click in the Report Name column, then type a new name.
Import a report
You can only import reports in Report Definition Files (. ERP) format.
1) Choose Tools, Reports, Reports.
P6 Professional User's Guide
316
2) To import a report to a specific group, select the report group. To overwrite an existing
report, select the appropriate report.
3) Click on the Reports toolbar, or right-click on the selected report or report group,
then choose Import.
4) If you did not select a report group, choose whether you want to create a new report
or overwrite the selected report.
5) Locate and select the . ERP report file you want to import.
6) Click Open.
Notes
If you import a report that was created by the Report Wizard, it will be imported as
a standard (non-wizard) report and cannot be modified using the Report Wizard.
Export a report
1) Choose Tools, Reports, Reports.
2) Select the report, then click on the Reports toolbar, or right-click on the report and
choose Export.
3) Select the drive and folder in which you want to save the report’s export file.
4) In the File Name field, type a name for the export output file, without a file extension.
5) In the Save As Type field, select Report Definition Files (*. ERP), if not already selected.
6) Click Save.
Note
You can only export reports in Report Definition Files (. ERP) format.
Delete a report
From the Reports window, select the report. Choose Edit, Delete, then click Yes.
Note
When connected to a P6 Professional database: To delete a global report, you
must have Edit Global Reports privileges. To delete a project report, you must
have Edit Project Reports privileges.
When connected to a P6 EPPM database: To delete a global or project report,
you need the appropriate global or project privileges as defined in P6.
Working with Report Groups
Create a report group
When connected to a P6 Professional database: To create a report group, you must
have Edit Global Reports privileges.
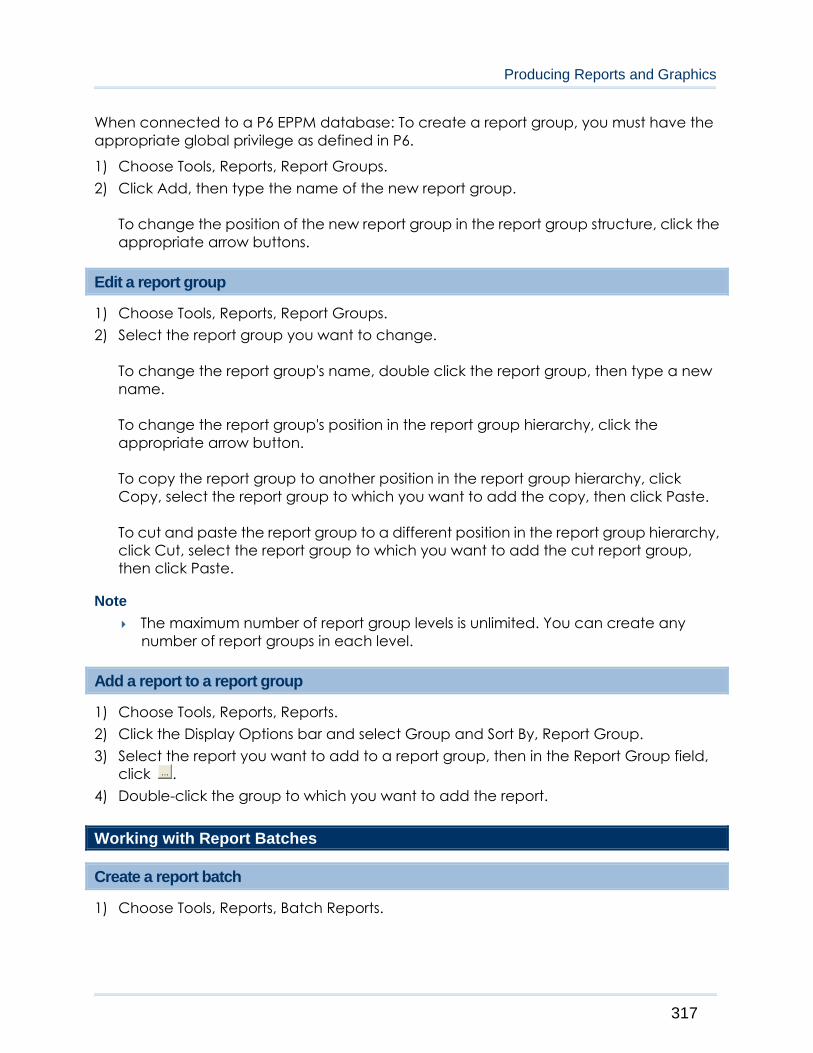
Producing Reports and Graphics
317
When connected to a P6 EPPM database: To create a report group, you must have the
appropriate global privilege as defined in P6.
1) Choose Tools, Reports, Report Groups.
2) Click Add, then type the name of the new report group.
To change the position of the new report group in the report group structure, click the
appropriate arrow buttons.
Edit a report group
1) Choose Tools, Reports, Report Groups.
2) Select the report group you want to change.
To change the report group's name, double click the report group, then type a new
name.
To change the report group's position in the report group hierarchy, click the
appropriate arrow button.
To copy the report group to another position in the report group hierarchy, click
Copy, select the report group to which you want to add the copy, then click Paste.
To cut and paste the report group to a different position in the report group hierarchy,
click Cut, select the report group to which you want to add the cut report group,
then click Paste.
Note
The maximum number of report group levels is unlimited. You can create any
number of report groups in each level.
Add a report to a report group
1) Choose Tools, Reports, Reports.
2) Click the Display Options bar and select Group and Sort By, Report Group.
3) Select the report you want to add to a report group, then in the Report Group field,
click .
4) Double-click the group to which you want to add the report.
Working with Report Batches
Create a report batch
1) Choose Tools, Reports, Batch Reports.
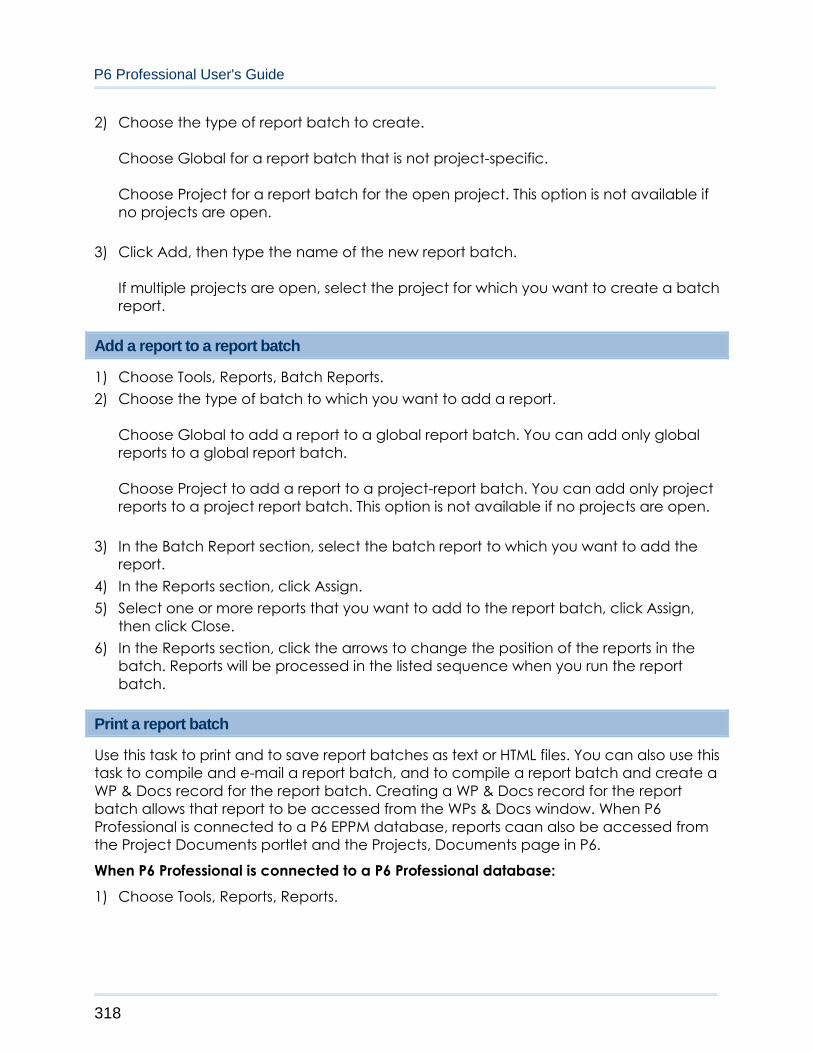
P6 Professional User's Guide
318
2) Choose the type of report batch to create.
Choose Global for a report batch that is not project-specific.
Choose Project for a report batch for the open project. This option is not available if
no projects are open.
3) Click Add, then type the name of the new report batch.
If multiple projects are open, select the project for which you want to create a batch
report.
Add a report to a report batch
1) Choose Tools, Reports, Batch Reports.
2) Choose the type of batch to which you want to add a report.
Choose Global to add a report to a global report batch. You can add only global
reports to a global report batch.
Choose Project to add a report to a project-report batch. You can add only project
reports to a project report batch. This option is not available if no projects are open.
3) In the Batch Report section, select the batch report to which you want to add the
report.
4) In the Reports section, click Assign.
5) Select one or more reports that you want to add to the report batch, click Assign,
then click Close.
6) In the Reports section, click the arrows to change the position of the reports in the
batch. Reports will be processed in the listed sequence when you run the report
batch.
Print a report batch
Use this task to print and to save report batches as text or HTML files. You can also use this
task to compile and e-mail a report batch, and to compile a report batch and create a
WP & Docs record for the report batch. Creating a WP & Docs record for the report
batch allows that report to be accessed from the WPs & Docs window. When P6
Professional is connected to a P6 EPPM database, reports caan also be accessed from
the Project Documents portlet and the Projects, Documents page in P6.
When P6 Professional is connected to a P6 Professional database:
1) Choose Tools, Reports, Reports.

Producing Reports and Graphics
319
2) Click on the Reports toolbar, or right-click anywhere in the Reports window and
choose Run, Batch.
3) Select the report batch you want to run, then click OK.
4) Proceed as follows:
a. To print the report, choose Directly to Printer.
b. To compile the report batch and attach it to an e-mail, choose E-mail
Attachment. If you select this option, go to substep e.
c. To save the report batch as an HTML file, choose HTML File. In the Output File field,
click and select a location to save the report batch's filename and location.
d. To save the report batch as a delimited text format (.txt) file, choose ASCII Text Files
and select a Field Delimiter and Text Qualifier. In the Output File field, click and
select a location to save the report batch's filename and location. Use the ASCII
Text Files option to import the report batch to a spreadsheet application.
e. In the User's Notes field, you can type report comments corresponding to the
report batch. If you choose E-mail Attachment, the content in this field is copied to
the body of the e-mail.
f. Click OK. If you chose E-mail Attachment, clicking OK launches the default e-mail
application and attaches the report batch to a new e-mail.
Tip
You can set up a job service to run a batch report at a specified time.
When P6 Professional is connected to a P6 EPPM database:
1) Choose Tools, Reports, Reports.
2) Click on the Reports toolbar, or right-click anywhere in the Reports window and
choose Run, Batch.
3) Select the report batch you want to run, then click OK.
4) Proceed as follows:
a. To print the report, choose Directly to Printer.
b. To compile the report batch and attach it to an e-mail, choose E-mail
Attachment. If you select this option, go to substep f.
c. To save the report batch as an HTML file, choose HTML File. In the Output File field,
click and select a location to save the report batch's filename and location. If
you choose Store report in Work Products and Documents for this project, below,
select a network location or some other publicly accessible location.
d. To save the report batch as a delimited text format (.txt) file, choose ASCII Text Files
and select a Field Delimiter and Text Qualifier. In the Output File field, click and
select a location to save the report batch's filename and location. If you choose
Store report in Work Products and Documents for this project, below, select a
network location or some other publicly accessible location. Use the ASCII Text
Files option to import the report batch to a spreadsheet application.

P6 Professional User's Guide
320
e. To create a WP & Docs record for this report batch, choose Store report in Work
Products and Documents for this project.
Note: To create a WP& Doc record for a report, only a single project can be open,
and you must have the Add/Edit/Delete Project Work Products and Documents
privilege for the open project.
f. In the User's Notes field, you can type report comments corresponding to the
report batch. If you choose Store report in Work Products and Documents for this
project, the content in the User's Notes field is copied to the Description for the WP
& Docs record. If you choose E-mail Attachment, the content in this field is copied
to the body of the e-mail.
g. Click OK. If you chose Store report in Work Products and Documents for this
project, clicking OK compiles the report batch and creates a WP & Docs record
that has the same name as the Output File name. If you chose E-mail Attachment,
clicking OK launches the default e-mail application and attaches the report
batch to a new e-mail.
Tip
To run reports unattended at a specified time, see "Run a report batch from the
command line."
Note
When you print the report as an HTML file or ASCII Text File, page breaks are not
shown.
Run a report batch from the command line
You can use the Windows command line interface to run batch reports as a service.
To use the Windows command line interface to run batch reports as a service, do the
following:
1) Using a text editor, or any program that can save text files, create an actions.config
file that specifies the batch report you want to run.
You can specify more than one import action in a single file, by including multiple
<action> nodes.
The following is a sample actions.config file that drives the run of one batch report. All
tags must appear in the file; however, you can leave some tags empty, as noted
below. Values in bold are literal values you must enter as shown. The other values are
samples that will vary with your configuration.
When connected to a P6 EPPM database:
<actions>
<action>

Producing Reports and Graphics
321
<type>batchrpt</type>
<BatchReportName>Project Weekly Reports</BatchReportName>
<Projects>
<ProjectID>Highway Project</ProjectID>
</Projects>
<outputtype>html</outputtype>
<outputFile>C:\batchoutput.htm</outputFile>
<outputFieldDelimiter>,</outputFieldDelimiter>
<outputTextQualifier>"</outputTextQualifier>
<StoreReport>Y</StoreReport>;
</action>
</actions>
When connected to a P6 Professional database:
<actions>
<action>
<type>batchrpt</type>
<BatchReportName>Project Weekly Reports</BatchReportName>
<Projects>
<ProjectID>Highway Project</ProjectID>
</Projects>
<outputtype>html</outputtype>
<outputFile>C:\batchoutput.htm</outputFile>
<outputFieldDelimiter>,</outputFieldDelimiter>
<outputTextQualifier>"</outputTextQualifier>
</action>
</actions>
Tag Description
<type> Required. The type of action to take. This is case sensitive.
Valid values: batchrpt
<BatchReportNa
me>
Required. The name of the batch report that is configured in
P6 Professional or P6 EPPM.
<ProjectID> Optional. A project against which to run the report. Leave this
tag pair empty to run a global report. Use a separate pair of
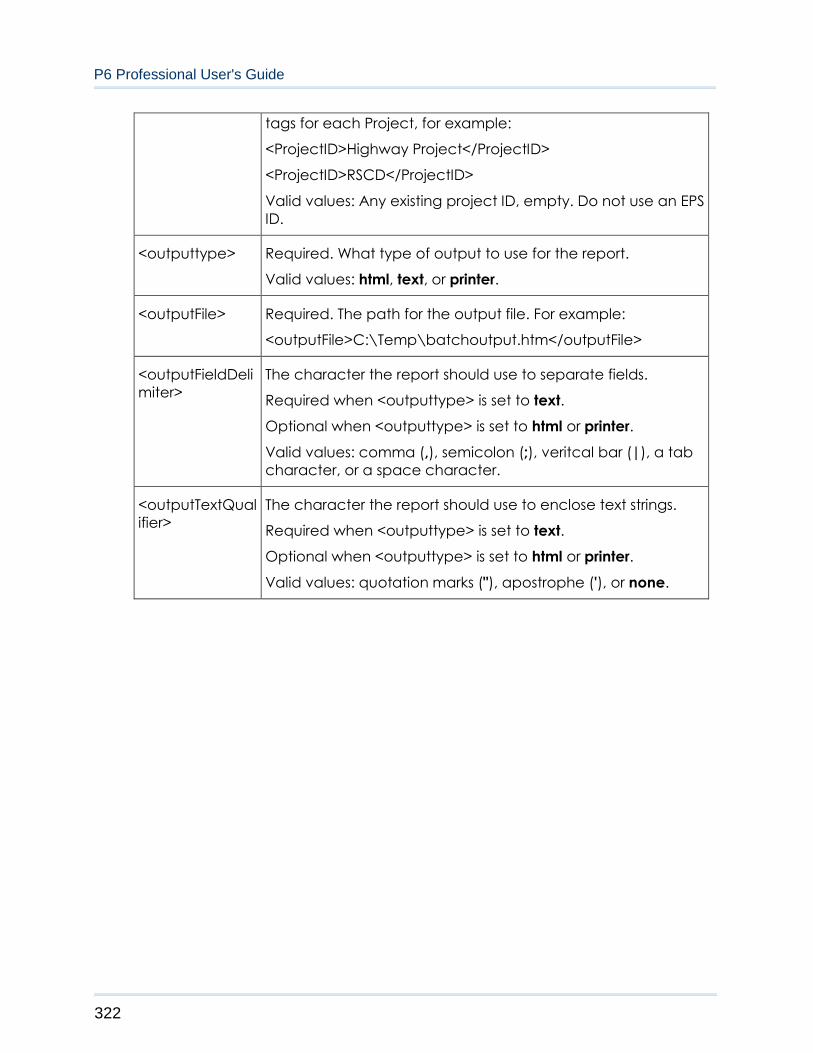
P6 Professional User's Guide
322
tags for each Project, for example:
<ProjectID>Highway Project</ProjectID>
<ProjectID>RSCD</ProjectID>
Valid values: Any existing project ID, empty. Do not use an EPS
ID.
<outputtype> Required. What type of output to use for the report.
Valid values: html, text, or printer.
<outputFile> Required. The path for the output file. For example:
<outputFile>C:\Temp\batchoutput.htm</outputFile>
<outputFieldDeli
miter>
The character the report should use to separate fields.
Required when <outputtype> is set to text.
Optional when <outputtype> is set to html or printer.
Valid values: comma (,), semicolon (;), veritcal bar (|), a tab
character, or a space character.
<outputTextQual
ifier>
The character the report should use to enclose text strings.
Required when <outputtype> is set to text.
Optional when <outputtype> is set to html or printer.
Valid values: quotation marks ("), apostrophe ('), or none.
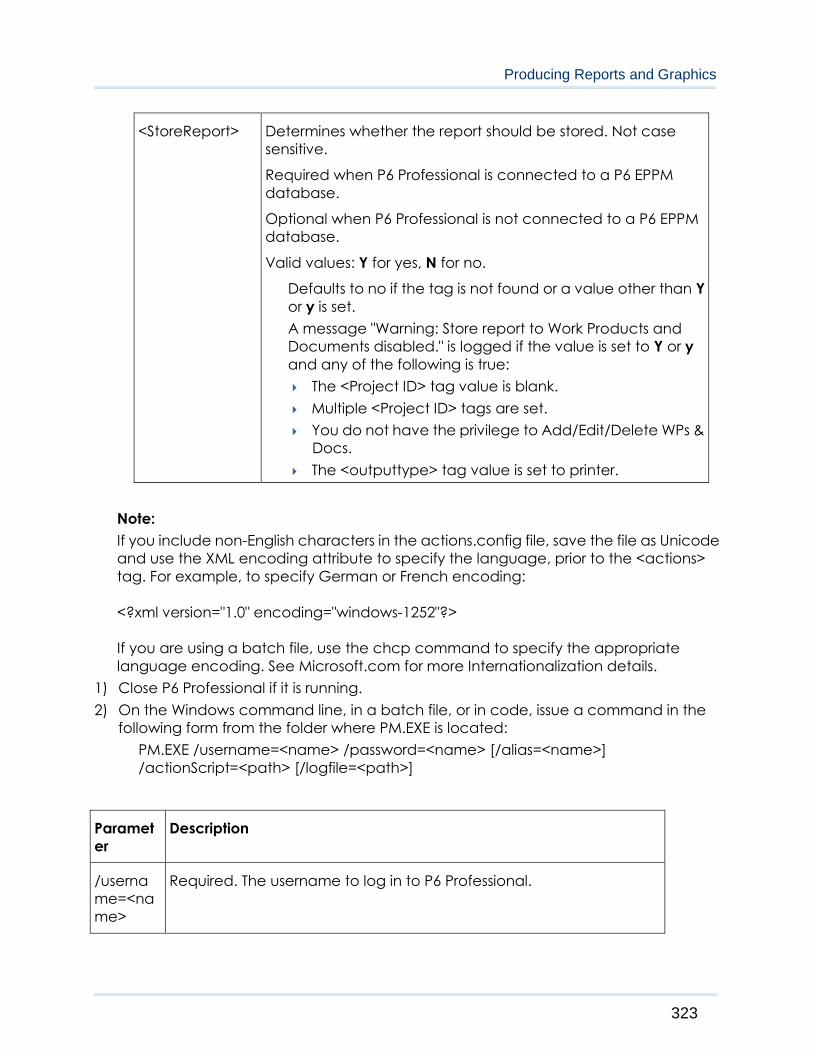
Producing Reports and Graphics
323
<StoreReport> Determines whether the report should be stored. Not case
sensitive.
Required when P6 Professional is connected to a P6 EPPM
database.
Optional when P6 Professional is not connected to a P6 EPPM
database.
Valid values: Y for yes, N for no.
Defaults to no if the tag is not found or a value other than Y
or y is set.
A message "Warning: Store report to Work Products and
Documents disabled." is logged if the value is set to Y or y
and any of the following is true:
The <Project ID> tag value is blank.
Multiple <Project ID> tags are set.
You do not have the privilege to Add/Edit/Delete WPs &
Docs.
The <outputtype> tag value is set to printer.
Note:
If you include non-English characters in the actions.config file, save the file as Unicode
and use the XML encoding attribute to specify the language, prior to the <actions>
tag. For example, to specify German or French encoding:
<?xml version="1.0" encoding="windows-1252"?>
If you are using a batch file, use the chcp command to specify the appropriate
language encoding. See Microsoft.com for more Internationalization details.
1) Close P6 Professional if it is running.
2) On the Windows command line, in a batch file, or in code, issue a command in the
following form from the folder where PM.EXE is located:
PM.EXE /username=<name> /password=<name> [/alias=<name>]
/actionScript=<path> [/logfile=<path>]
Paramet
er
Description
/userna
me=<na
me>
Required. The username to log in to P6 Professional.

P6 Professional User's Guide
324
/passwor
d=<nam
e>
Required. The password for the username.
/alias=<n
ame>
Optional. The name of an existing destination database alias. If you
do not specify an alias, the most recently accessed alias is used.
/actionS
cript=<p
ath>
Required. The full path to the edited actions.xml file. Must include the
file name.
/logfile=<
path>
Optional. The full path for creating the log file that contains
processing results, up to and including the file name. If the logfile is
not set, the default log file destination is PrimaveraCmdLineLog.txt in
the PM.exe application folder.
For example:
PM.EXE /username=admin /password=admin /alias=PMDB
/actionScript=actions.config /logfile=c:\myLog.txt
Note that the entire string must be entered on one line.
If any values include spaces, enclose the value in quotation marks (").
If the batch report runs successfully, then an exit code of 0 is returned. If the batch report
fails to run, any errors are logged to the log file and an exit code greater than 0 is
returned.
Processing results are written to the log file, or you can echo them to the command line
interface. These are the possible results:
Code Description
0 Success.
1 Invalid alias.
2 Invalid username or password.
3 XML file not found.
4 Invalid action type (did not specify batchrpt).
9 Batch report action failure.
Producing Reports and Graphics
325
214783647 Unhandled exception, including invalid characters.
If the command does not include all the required parameters, P6 Professional opens.
Run a batch report as a service
1) Choose Tools, Job Services, then click Add.
2) Select Batch Reports in the Service Type field.
3) Specify a number in the Job # field to indicate the sequence in which the service
should be performed, if more than on service is listed.
4) Type a brief description of the service in the Job Name field.
5) In the Status field, select Enabled to activate the batch report service.
You can suspend a service at any time by selecting Disabled in the Status field.
6) In the Run Job area on the Job Details tab, schedule when the service should be run.
Using the Report Editor to Modify Reports
Report Editor window
The title bar of the Report Editor window displays the name of the currently selected
report.
The Report Editor window contains the following major parts:
Toolbar
Ruler
Left margin
Report Canvas
The Report Canvas occupies the majority of the window and is the workspace you
use to add and position the components of the report.
Right-click menu
Using the toolbar
The toolbar icons have the following functions:
Click this button to create a new report. You are prompted to verify that you want to
delete the current report components.
Click this button to add a data source.

P6 Professional User's Guide
326
Click this button to add a row.
Click this button to add a text cell.
Click this button to add an image cell.
Click this button to add a line cell.
Click this button to preview the report on screen before printing.
Select a report component, then click this button to view or edit its properties.
Properties are characteristics of a report component, such as type and field for a text
cell, sort and group options for a data source, and height for a row.
Tip
You can also right-click on a component to view its properties.
Select this button to run the Report Wizard. Before the wizard opens, you are
prompted to verify that you want to delete the current report components.
Using the ruler
The ruler indicates the horizontal position of each report component. A blue, shaded
area indicates the position and width of the selected cell. A red, vertical bar indicates
your cursor's position on the Report Canvas.
Using the left margin
The left margin helps you identify each data source and row. To help you identify data
sources, the left margin displays each data source's name and grouping, if any, in the
upper-left corner of the data source area. To help you identify rows, the left margin
displays each row's type in the upper-left corner of the row. The symbol indicates rows
that are part of a header area. The symbol indicates rows that are part of a footer
area.

Producing Reports and Graphics
327
Using the Report Canvas
You use the Report Canvas to add report components, to specify where you want
components to be positioned, and to select existing components and view or edit their
properties. Properties are characteristics of a report component, such as type and field
for a text cell, sort and group options for a data source, and height for a row.
To select a component, click on it; a blue border surrounds the selected
component. To increase the scope of the selected area, press Esc. For example, if
a text cell within a row is selected, press Esc to select the entire row. If the row is
contained within a data source, press Esc again to select the data source that
contains the row.
To view or edit the properties of a report component, double-click the
component.
The Report Canvas contains several standard areas, which appear in any new report:
Page Header Area: This area contains report components that appear at the top of
each page of the compiled report. You can add rows and variable or custom text cells
to the Page Header Area.
The Page Header Area is different than the standard header you specify in the Page
Setup dialog box. If you specify a standard header, the standard header is displayed at
the top of the page in the compiled report, followed by the report's Page Header.
Report Header Area: This area contains report components that appear before the
compiled report's details and on the first page of the report only. You can add rows and
cells to the Report Header Area.
Data Source Header Area: Report components that appear before the data source's
records in the compiled report. You can add rows and cells to the Data Source Header
Area.
Detail Area: This area contains the bulk of the project data that are being reported and is
the only area of the report to which you can add a data source. The data source
indicates which category of database information the report compiles, for example,
activity resource assignments or cost accounts. After selecting a data source, you add
rows, and then cells within the rows, to the Detail Area. The cells specify the individual
data fields you want to report for the data source you have selected. For example, in the
following graphic, the data source is Activities. The row between the Data Source
Header and Detail areas contains four field data text cells: Activity ID, Activity Name,
Start, and Finish. In this example, the report will list the activity ID, activity name, start
date, and finish date for all activities in the open project.

P6 Professional User's Guide
328
For each data source you add to a report, a Data Source Header, Detail Area, and Data
Source Footer are added to the Report Canvas. The Data Source Header and Data
Source Footer are required as upper and lower borders for the Detail Area.
Data Source Footer Area: Report components that appear after the data source's details
in the compiled report. You can add rows and cells to the Data Source Footer Area.
Report Footer Area: Report components that appear after the compiled report's details
and on the last page of the report only. You can add rows and cells to the Report Footer
Area.
Page Footer Area: Report components that appear at the bottom of each page of the
compiled report. You can add rows and cells to the Page Footer Area.
The Page Footer Area is different than the standard footer you specify in the Page Setup
dialog box. If you specify a standard footer, the standard footer is displayed in the
compiled report at the bottom of the page, after the report's Page Footer.
The Report Canvas provides visual cues to identify some report component properties.
Data sources are color-coded. If a data source is embedded, or nested, in a parent
data source, each data source displays in a different color. See Parent Data
Source.
Text cells are coded in the upper-right corner to indicate the type of data they report.
- indicates a Custom Text cell, a cell that contains text you specify.
- indicates a Field Data cell, a cell that compiles and reports information from a
database field you specify.
- indicates a Field Title cell, a cell that contains the name of a database field you
specify.
- indicates a Variable cell, a cell that reports information related to the overall
report, rather than a specific data source, for example, date or page number.
Text cells displayed in red indicate that the cell's properties either have not been
defined or that they conflict with the properties of the data source that contains the
cell.
Note
The Report Canvas does not display the actual height, or amount of vertical
space, each report component will occupy in the compiled report. To view the
report's vertical spacing, preview the report.
Report Editor tasks
Add a background image to a report
Add a border to a text cell
Producing Reports and Graphics
329
Add a custom text cell to a report
Add a data source to a report
Add a field data or field title cell to a report
Add a line cell to a report
Add a report title
Add a row to a report
Add a variable cell to a report
Add an embedded data source to a report
Add an image cell to a report
Add comments to reports
Add HTML links to a text cell
Add HTML links to an image cell
Change report margins
Change text cell color
Change the sort order of report records
Copy a data source
Copy a row
Copy and paste cells
Cut and paste a data source
Cut and paste a row
Cut and paste cells
Define a report header and footer
Define default text styles for reports
Define HTML print settings for an image cell
Define layout options for a data source
Define page setup options for a report
Delete a data source filter
Delete a data source from a report
Delete a data source that contains embedded data sources
Delete a line cell from a report
Delete a row filter
Delete a row from a report
Delete a text cell filter
Delete an image cell from a report
Disable HTML links in a text cell
Disable HTML links in image cells
Filter a data source
Filter a report row
Filter a text cell
Format text in a text cell
P6 Professional User's Guide
330
Indicate hierarchy levels in reports
Remove a background image from a report
Remove borders from a text cell
Show time distributions in a report
Sort report records
Specify a timeperiod for a report
Specify image cell width and position in a row
Specify line cell width and position in a row
Specify text cell width and alignment in a row
Basic Procedures
Copy and paste cells
1) In the Report Editor window, right-click the cell you want to copy and choose Copy.
2) Right-click the row in which you want to paste the copied cell and choose Paste.
To paste the cell to a row that contains other cells, select a cell in the row, press the
keyboard Esc key, then press Ctrl+V.
Cut and paste cells
1) In the Report Editor window, right-click the cell you want to cut and paste and
choose Cut.
2) Right-click the row in which you want to paste the cut cell and choose Paste.
To paste the cell to row that contains other cells, select a cell in the row, press the
keyboard Esc key, then press Ctrl+V.
Add a report title
1) From the Reports window, select the report and click Modify.
2) To add a row for the title, click in the Page Header Area of the Report Canvas, then
click . Type a new height or click the color button to specify a new row color.
3) To add a text cell, click . In the Cell Type field, select Variable. In the Cell Variable
field, select Report Title. In the Font Style field, select one of the available default
heading fonts.
4) Click the Report tab. In the Title field, type the report's title.
Tip
To center the report title on the page, in the Align Cell and Text Alignment fields,
choose Center.
Producing Reports and Graphics
331
Define default text styles for reports
You can define six default font styles for report text cells: three heading styles and three
body styles.
1) With the Reports window active, click on the Reports toolbar, or right-click on the
report and choose Modify.
2) Click , then click Report Font Styles.
3) Select the style you want to define, click Modify, then select the formatting options
you want to apply to the style.
Define a report header and footer
You can define a standard three-section header and footer that will appear on every
page of a report.
1) With the Reports window active, click on the Reports toolbar, or right-click on the
report and choose Modify.
2) Click , then click the Report tab.
3) Click Page Setup.
4) In the Divide Into Sections field, select the number of appropriate sections to divide
the header into.
5) To specify when you want to print the header, choose First Page, Last Page, All Pages,
or No Pages in the Include On field.
6) Mark the Show Section Divider Lines checkbox to display divider lines between
sections in the header.
P6 Professional User's Guide
332
7) In the Define header section, select the subject area for each section:
To leave the section below the header grid blank, choose None.
To add a text variable, choose Text/Logo. From the list, select a global variable and
click Add. When connected to a P6 Professional database, global variables include
data such as current project properties (Project Name, Project Start, Data Date, and
so on) and Admin Preferences (Header / Footer / Custom Label 1 / 2 / 3). When
connected to a P6 EPPM database, global variables include data such as current
project properties (Project Name, Project Start, Data Date, and so on) and
Application Settings in P6. The Header or Footer Sample illustrates how the report
header or footer will print. You can add more than one text variable.
To add your own text to the header, type directly in the text area of the selected
header section. Do not modify a variable field, that is, the text between square
brackets.
To change the font, click , specify the font settings, and click OK.
To add a logo, click . In the Picture Source field, click Browse, then select a
filename and click Open. The logo image is displayed in the text area of the selected
header section.
To add dates, approvals, and revision information, choose Revision Box and enter a
title in the Revision Box Title. Click Add to insert a new row in the revision box. In the
Date column, click , then select a date. Enter information in the Revision, Checked,
and Approved columns, or leave it blank so information can be entered manually.
Click Delete to remove the selected row. Click Font to specify the font settings, and
click OK.
8) To add pictures to the header or footer, choose Picture. In the Select Filename field,
click to select the picture file. Mark the Resize Picture to Fit the Section checkbox
to show the complete picture in the section.
9) Click the Footer tab. Repeat the preceding steps.
Note
To add a header and footer only for the current report, preview the report and use
the Page Setup dialog box to specify the header and footer. When you add a
header and footer from the Page Setup dialog box, they are applied only to the
current printing.

Producing Reports and Graphics
333
Tip
To define a standard report header and footer or any other Page Setup properties
for multiple reports, create a report that is empty except for the header and
footer. Use the empty report as a template to create other reports by making a
copy of it in the Reports window. Rename the copied report and open it in the
Report Editor to define the components.
Define page setup options for a report
1) With the Reports window active, click on the Reports toolbar, or right-click on the
report and choose Modify.
2) Click , then click the Report tab.
3) Click Page Setup and specify the orientation, scaling, and paper size options.
Note
To define page setup options only for the current report, preview the report and
use the Page Setup dialog box. When you specify page setup options from the
Page Setup dialog box, they are applied only to the current printing.
Change report margins
1) With the Reports window active, click on the Reports toolbar, or right-click on the
report and choose Modify.
2) Click , then click the Report tab.
3) Click Page Setup, then click the Margins tab.
To change a margin, type a new size.
Top and bottom margins specify the distance between the top or bottom edge of
the paper and the top or bottom edge of the report text, not including the header or
footer.
Header and footer margins specify the distance between the top or bottom edge of
the paper and the top or bottom edge of the report header or footer, respectively.
The header margin cannot be greater than the top margin and the footer margin
cannot be greater than the bottom margin.
Note
To change report margins only for the current report, preview the report and use
the Page Setup dialog box. When you change report margins from the Page
Setup dialog box, they are applied only to the current printing.
Add a background image to a report
1) In the Reports window, select the report and click Modify.
P6 Professional User's Guide
334
2) Click , then click the Report tab.
3) Click Background Image, then click Load.
4) Select the image file, click Open, then click OK.
Notes
BMP and JPG files are supported.
If the background image is smaller than the report's page, the image tiles, or
repeats, to fill the report's background area.
If the background image is larger than the report's page, the image positions in
the upper-left corner of the report page, then excludes those areas of the image
that do not fit within the report's right and bottom margins.
Remove a background image from a report
1) In the Report Editor, click , then click the Report tab.
2) Click Background Image, click Clear, then click OK.
Add comments to reports
You can add comments to reports in two ways.
Add comments as custom text in a custom text cell.
Custom text cells are useful for comments you do not need to update frequently. To edit
the contents of a custom text cell, you need to modify the report.
Add comments when you run the report.
Comments that you enter when you run a report are saved, but you can easily edit these
comments in the Run Report dialog box the next time you run a report.
Add comments when running a report
All reports created with the wizard automatically include a row that contains the variable
text cell Notes, which corresponds to the Notes field of the Run Report dialog box. When
you run a wizard report, the comments you enter in the Notes field are printed in the
report and saved. These comments are included each time you run the same report or
another report, unless you clear or edit the Notes field.
Producing Reports and Graphics
335
1) With the Reports window active, select the report and click on the Reports
toolbar.
You can also right-click on the report and choose Report, Run.
2) In the Notes field, type your comments.
Tip
For the comments you enter in the Notes field to be included in the printed report,
the report must include the variable text cell Notes. If you edited a wizard report
and removed the variable Notes field, use the following steps to restore it.
1) With the Reports window active, click on the Reports toolbar.
You can also right-click on the report and choose Modify.
2) To add a row for comments, click in the area of the Report Canvas where you want
the comments to appear, then click . You can type a new height or click the color
button to specify a new row color.
3) To add a text cell to the row, click . In the Cell Type field, select Variable. In the
Cell Variable field, select Notes. In the Font Style field, select one of the available
default body fonts.
Indicate hierarchy levels in reports
If you are reporting hierarchical information for a data source, you can format the report
to indent records according to hierarchy level.
1) In the Report Editor window, click the field data text cell whose contents you want to
report hierarchically, then click .
2) Click the Cell tab, then mark the Indent Cell checkbox.
3) Click the Source tab, then mark the Organize Hierarchically checkbox.
Specify a timeperiod for a report
When you define the timeperiod for which you want to report project data, you can also
specify various timescale interval and timescale format options for displaying
time-distributed data.
1) In the Report Editor window, click .
2) Click the Report tab, then click Timescale Options.
P6 Professional User's Guide
336
3) In the Timescale Start field, click and select the report's start date.
To run the report for a specific amount of time following the start date, choose
Duration and type a time value. Then, in the Date Interval field, select a time interval
for the report's duration. For example, if the Duration is 2 and the Date Interval is
weeks, the report will include information for a two-week period following the
specified start date. The Date Interval you specify also determines the timescale
interval used to display time-distributed data.
To select a specific end date for the report, choose Timescale Finish, click , then
select an end date.
4) If you select shift as the Date Interval, in the Shift Calendar field, click , then
double-click the shift you want to use.
5) To specify the date format used to display time-distributed data, select one of the
date format options.
To display time intervals according to the standard calendar year, for example,
Month/Year, choose Calendar.
To display time intervals according to the fiscal year, for example, FM1/FY2000,
FM2/FY2000, choose Fiscal.
To display time intervals according to each week of the year, consecutively,
beginning with January, choose Week of the Year.
To display time intervals according to ordinal intervals, based on a start date you
specify, for example, Week #-1 (08/May/00), Week #1 (15/May/00), choose Ordinal
and type a start date in the Timescale Start field.
6) To divide the interval totals by automatic increments, based on the date interval
selected, in the Averaging section, mark the Calculate Average checkbox. The
Divide Interval Totals By field displays the division increment for the corresponding
date interval: 1h for Hour date interval, 2h for Shift date interval, 8h for Day date
interval, 40h for week date interval, and so on.
To base the intervals totals on hours per time period, mark the appropriate checkbox.
Specify a unit of measure for each timeperiod.
Producing Reports and Graphics
337
Tip
You can adjust a report's start or finish date according to a specific time value.
Place the cursor at the end of the start or finish date text, then type + or -, followed
by the time value and the appropriate timeperiod abbreviation. For example, a
start date that is two months prior to the current date appears as "CD-2m" where "
m" is the abbreviation for month.
Advanced Procedures
Working with Data Sources
Data sources in reports
Data sources are categories of information. The data source component in the Report
Editor corresponds to the subject area you select when you use the wizard to create a
report. Examples of data sources are activities, cost accounts, expense categories, and
work breakdown structure (WBS).
In the Report Editor, you can add, modify, and delete report data sources. When you
add a data source, you also need to identify the fields within that data source that you
want to include in the report. For example, to report labor, and nonlabor expenses for
cost accounts, specify cost accounts as the data source and labor expenses and
nonlabor expenses as the data fields to include in the report.
You can also embed, or nest, a data source within another data source. By embedding
data sources, you can outline relationships between different types of information. For
example, if you embed an activity data source within a WBS data source, the report lists
activity information according to WBS.
Add a data source to a report
A data source defines the category of information you want to include in a report. After
you add a data source to a report, you then need to add one or more rows, and cells
within the rows, to specify which database fields you want to report for the selected data
source. As a very simplified example, to create a report that lists actual costs for all
activities, you would select Activities as the data source. Then, within the Activities data
source area of the report, you would add a row and, within that row, add a field data
cell that corresponds to actual cost.
1) In the Report Editor window, click the gray Detail Area, then click .
2) Click the Source tab. In the Loop Through field, select the category of information to
report in the new data source.
3) To further organize the data source information, specify group and sort options.
In the Group By field, select a grouping category. The Group By field lists categories
that correspond to the selected data source.
In the Sort area, click Add. Select a sort object, sort field, and sort order, then click OK.
P6 Professional User's Guide
338
Add an embedded data source to a report
1) In the Report Editor window, click the Detail Area of the data source in which you
want to embed the new data source, then click .
2) Click the Source tab. In the Loop Through field, select the category of information you
want to report in the new data source.
The list of available data sources reflects the new data source's relationship to the
parent data source.
3) To further organize the data source information, specify group and sort options.
In the Group By field, select a grouping category. The Group By field lists categories
that correspond to the selected data source.
In the Sort area, click Add. Select a sort object, sort field, and sort order, then click OK.
Copy a data source
1) In the Report Editor window, click an area of the data source you want to copy, then
press the keyboard Esc key until the entire data source is selected. A blue border
indicates the selected area.
2) Press Ctrl+C.
To embed the copied data source in another data source, click the Detail Area of
the data source in which you want to embed the copy and press Ctrl+V.
To paste the data source without embedding it in another data source, click the gray
Detail Area and press Ctrl+V.
Tip
You can copy and paste data sources between different reports.
Cut and paste a data source
1) In the Report Editor window, click an area of the data source you want to cut, then
press the keyboard Esc key until the entire data source is selected. A blue border
indicates the selected area.
2) Press Ctrl+X.
To embed the cut data source in another data source, click the Detail Area of the
data source in which you want to embed the cut data source and press Ctrl+V.
To paste the data source without embedding it in another data source, click the gray
Detail Area and press Ctrl+V.
Producing Reports and Graphics
339
Tip
You can cut and paste data sources between different reports.
Define layout options for a data source
1) In the Report Editor window, click the data source, then click .
2) Click the Source tab. In the Page Break Options field, select where you want to insert
page breaks in the compiled report.
3) To specify the number of hierarchy levels you want to include in the compiled report,
in the Max Level field, type a number. To include all hierarchy levels, type 0.
4) To report information in hierarchy order, mark the Organize Hierarchically checkbox.
The Max Level field and Organize Hierarchically checkbox are available only if the
data source reports hierarchical information.
5) To exclude the data source's report components from the compiled report, if the
data source does not produce any records, mark the Hide If Empty checkbox. If you
mark the Hide if Empty checkbox and no records exist for the data source, the data
source header and footer are also excluded from the compiled report.
6) To exclude the records of a parent data source from the compiled report, if its child
data sources do not produce any records, mark the Hide Record If No Children
checkbox.
Sort report records
To sort a report's records, specify a sort order for one or more of the report's data sources.
1) In the Report Editor window, click the data source, then click .
2) Click the Source tab, then, in the Sort area, click Add.
3) Select a sort object, sort field, and sort order, then click OK.
The list of available sorting fields reflects the sort object you select.
4) To sort by additional objects and fields, click Add and repeat step 3.
Change the sort order of report records
You can change the sort order of a report's records by changing the sort settings for one
or more of the report's data sources.
1) In the Report Editor window, click the data source whose records you want to sort
differently, then click .

P6 Professional User's Guide
340
2) Click the Source tab.
To add a new field to the sort order, click Add. Select a sort object, sort field, and sort
order, then click OK.
To delete a field from the sort order, select it and click Delete.
To change a sort field's position in the sort order, select it and click the appropriate
arrow button.
Filter a data source
You can filter data sources to customize a report so that the report includes only the data
you want. For example, you might filter a report to show data only for certain projects
within the EPS structure. In this way, you could create one report that includes the same
data categories and fields for various users, but tailor each printed report to individual
users' projects.
1) In the Report Editor window, click the data source, then click .
2) Click the Source tab, then click Edit Filter.
3) In the Parameter column, select the field you want to use to filter the data.
4) In the Is column, select the search condition, or comparison operator.
5) In the Value field, type or select the field value you want to use to filter the data.
Delete a data source filter
Data source filters customize a report so that the report includes only a specific subset of
the data contained in the data source. To include all records contained in a data
source, you can delete the filter.
1) In the Report Editor window, click the data source whose filter you want to delete,
then click .
2) Click the Source tab, then click Edit Filter.
3) Select the filter you want to remove, click Delete, then click Yes.
Delete a data source from a report
1) In the Report Editor window, click an area of the data source you want to delete,
then press the keyboard Esc key until the entire data source is selected. A blue border
indicates the selected area.
2) Press the keyboard Delete key, then click Yes.
Delete a data source that contains embedded data sources
When a data source contains one or more embedded data sources, you can remove
the top-level data source without removing the embedded data sources.
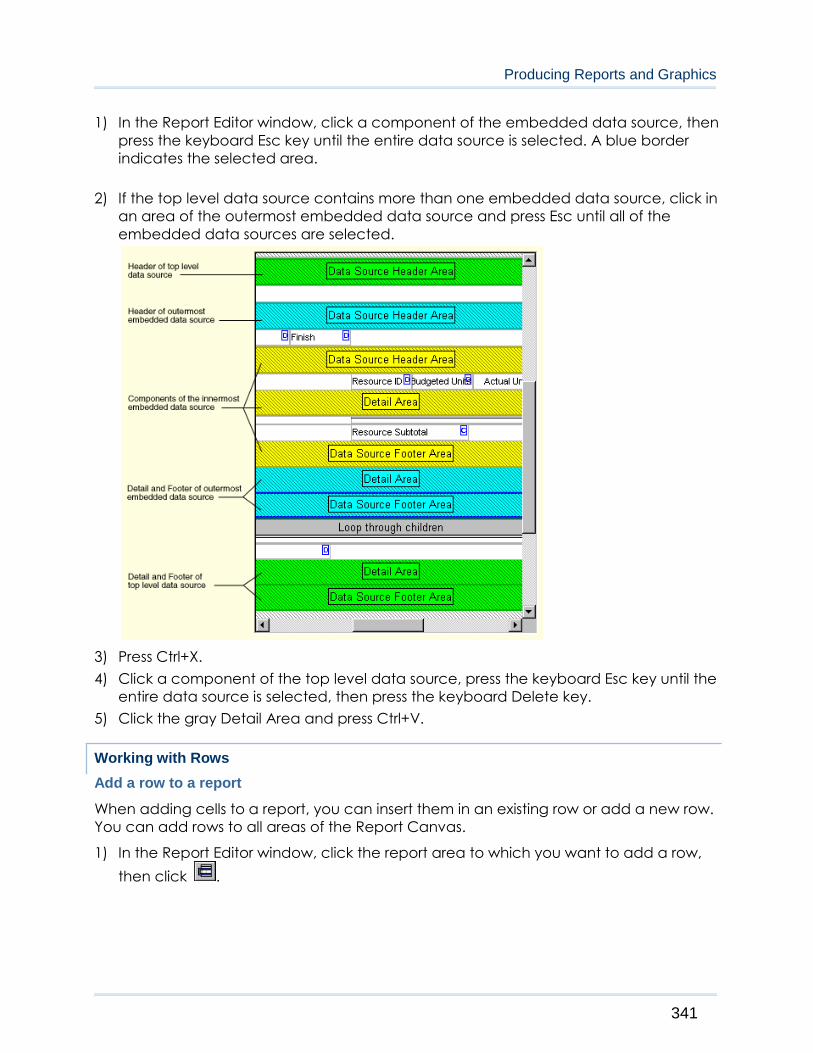
Producing Reports and Graphics
341
1) In the Report Editor window, click a component of the embedded data source, then
press the keyboard Esc key until the entire data source is selected. A blue border
indicates the selected area.
2) If the top level data source contains more than one embedded data source, click in
an area of the outermost embedded data source and press Esc until all of the
embedded data sources are selected.
3) Press Ctrl+X.
4) Click a component of the top level data source, press the keyboard Esc key until the
entire data source is selected, then press the keyboard Delete key.
5) Click the gray Detail Area and press Ctrl+V.
Working with Rows
Add a row to a report
When adding cells to a report, you can insert them in an existing row or add a new row.
You can add rows to all areas of the Report Canvas.
1) In the Report Editor window, click the report area to which you want to add a row,
then click .
P6 Professional User's Guide
342
2) Click the Row tab, then type the height of the new row.
To change the row's background color, click the Color button and select a new
color.
Tip
The Report Editor window does not display the actual height, or amount of vertical
space, the row will occupy in the compiled report. To view the row's actual height
in the compiled report, click .
Copy a row
1) To copy an empty row, right-click the row in the Report Editor window and choose
Copy.
To copy a row that contains cells, click a cell in the row. Press the keyboard Esc key
until the entire row is selected, then press Ctrl+C.
2) Right-click the report area where you want to paste the copied row, then choose
Paste.
Cut and paste a row
1) To cut an empty row, right-click the row in the Report Editor window and choose Cut.
To cut a row that contains cells, click a cell in the row. Press the keyboard Esc key until
the entire row is selected, then press Ctrl+X.
2) Right-click the report area where you want to paste the row, then choose Paste.
Filter a report row
1) In the Report Editor window, click the row you want filter, then click .
2) Click the Row tab, then click Edit Filter.
3) In the Parameter column, select the field you want to use to filter the data.
4) In the Is column, select the search condition, or comparison operator.
5) In the Value field, type or select the field value you want to use to filter the data.
Delete a row filter
1) In the Report Editor window, click the row whose filter you want to delete, then click
.
2) Click the Row tab, then click Edit Filter.
3) Select the filter you want to remove, click Delete, then click Yes.
Producing Reports and Graphics
343
Delete a row from a report
To delete an empty row, right-click the row you want to delete from the Report Editor
window, choose Delete, then click Yes.
To delete a row that contains cells, click a cell in the row. Press the keyboard Esc key
until the entire row is selected, press the keyboard Delete key, then click Yes.
Working with Text Cells
Text cell types
You can include four types of text cells in a report: Field Title, Field Data, Variable, and
Custom Text.
Field Title cells contain the name of a database field you specify. Field Title cells
are helpful when you want to label a column or another text cell that contains
database data. Examples of field titles are WBS Code and Activity Name.
Field Data cells contain project information from a database field you specify. For
example, if you add a Field Data cell that refers to the field WBS Code, the cell
reports codes for WBS elements.
Variable cells report information related to the overall report, rather than a
specific data source. Report name and page number are examples of variable
cell information.
Custom Text cells contain custom text you specify.
Add a field data or field title cell to a report
You can add field data and field title cells only within a data source. Therefore, you must
first add the data source to the report.
1) In the Report Editor window, select the row to which you want to add the cell.
2) Click .
3) Click the Cell tab. In the Cell Type field, select Field Title or Field Data.
4) In the Cell Object field, select the category of information that contains the database
field or field title you want to report in the cell.
The choices in the Cell Object field reflect the data source (table) you specified. If the
table is joined to one or more other tables in the database, the full path to the
selected data source is displayed. For example: Activity Name \ <activity_name> \
Activity Code \ Project \ Default Cost Account \ Parent Cost Account.
If you change the data source, the list of available field names will also change.
5) In the Cell Field field, select the database field or field title you want to report in the
cell.
P6 Professional User's Guide
344
Show time distributions in a report
For some field data and field title cells, for example, units and costs, you can report
time-distributed data. You can also specify how you want to see summary data reported
across the timescale; for example, you can select to display data for each timescale
interval, or period totals only.
1) In the Report Editor window, click the text cell whose time distributions you want to
show, then click .
2) Click the Cell tab. In the Timescale Type field, select the type of data you want to
report.
3) Mark the Repeat Over Timescale checkbox, then click .
4) In the Data Source Header area for the data source that contains the cell, select the
row in which you want column labels for the time distributions to appear, then click
.
5) Click the Cell tab. In the Cell Type field, select Variable.
6) In the Cell Variable field, select Column Date.
7) Mark the Repeat over Timescale checkbox.
Tip
The values distribute according to the date interval, or timeperiod, you specify for
the report. To change the date interval, click the Report tab, then click Timescale
Options.
Add a variable cell to a report
1) In the Report Editor window, select the row to which you want to add a variable cell.
2) Click .
3) Click the Cell tab, then in the Cell Type field, select Variable.
4) In the Cell Variable field, select the type of information you want to report in the cell.
Add a custom text cell to a report
1) In the Report Editor window, select the row to which you want to add a custom text
cell. If necessary, add a row for the custom text cell.
2) Click .
3) Click the Cell tab. In the Cell Type field, select Custom Text as the cell type.
4) In the Custom Text field, type the text you want to appear in the cell.
Format text in a text cell
1) In the Report Editor window, click the text cell, then click .
Producing Reports and Graphics
345
2) Click the Cell tab, then specify the text format options.
To specify the position of the text within the cell boundaries, in the Text Alignment
field, select an alignment option.
In the Font Style field, select a default report text style or, to define a custom style,
select Custom, then click Custom Font to specify formatting options.
To display the appropriate character to designate time (hours/h days/d), currency
($), or percentage (%) in value fields, mark the Format Cell Text checkbox. If you do
not mark this checkbox, only the numeric value displays in these fields.
Specify text cell width and alignment in a row
1) In the Report Editor window, click the text cell, then click .
2) Click the Cell tab. In the Align Cell field, select the position you want the cell to
occupy in the row:
To use your mouse to drag the cell to the appropriate position in the row, select None.
To position the cell relative to the left margin, select Left, then in the Left field, type the
cell's left indent.
To position the cell flush against the right margin, select Right.
To extend the cell across the entire row, select Center.
3) In the Width field, type the cell's numeric width, the distance you want the cell to
occupy between the report's left and right margins.
If the cell's alignment is Center, you cannot specify the cell width.
Tip
You can also change a cell's width directly in the Report Editor window. Select the
cell, then position the mouse pointer over the cell's left or right edge. When the
pointer changes to a double-headed arrow, drag the cell's edge to a new
position.
Change text cell color
1) In the Report Editor window, click the text cell, then click .
2) Click the Cell tab, then click the Color button.
3) Select a color from the Basic Colors palette or define a custom color, then click OK.
Add a border to a text cell
1) In the Report Editor window, click the text cell, then click .
P6 Professional User's Guide
346
2) Click the Cell tab, then click Borders.
3) Mark the appropriate checkboxes to add borders to the cell.
Note
Cell borders always appear in black. You cannot change the border color.
Remove borders from a text cell
1) In the Report Editor window, click the text cell, then click .
2) Click the Cell tab, then click Borders.
3) Clear the appropriate checkboxes to remove the cell's borders.
Add HTML links to a text cell
1) In the Report Editor window, click the text cell, then click .
2) Click the Cell tab, then click HTML links.
3) In the Link Prefix field, type the portion of the Internet address, or URL, that specifies
the server location of the file to which you want to link the cell, for example
http://www.yourcompany.com.
4) If you want each report record to be a hot link to another file, mark the Enable Link
Field checkbox. Select an object, or category of information, and a field from the Link
Object and Link Field lists. The list of available objects and fields reflects the type of
information reported by the cell's row.
To disable the link if a specific field does not produce any records in the compiled
report, mark the Disable Link If Empty Value checkbox.
5) Type the suffix of the Internet address to which you want the selected cell to link. If
you chose the Enable Link field option, specify only the filename extension in this field,
for example, .html. If you did not choose the Enable Link Field option, specify both the
filename and extension in this field, for example, yourfile.html.
6) To create a link to a specific frame in the Web page, if the Web page uses frames,
type the URL address of the frame.
Note
Both Link Prefix and Link Suffix are always used to build the URL link for the text cell.
The Link Prefix identifies the server location of the file to which you want to link the
cell. If you choose the Enable Link Field option, then the Link Object and Link Field
fields are used to determine the filename, and the Link Suffix field identifies the
extension of the file to which you want to link the cell. In this case, the URL is built as
follows: [Link Prefix]+[Link Field]+[Link Suffix]. If you do not choose the Enable Link
Field option, then the Link Suffix field is used to determine both the filename and
extension of the file to which you want to link the cell. In this case, the URL is built as
follows: [Link Prefix]+[Link Suffix].

Producing Reports and Graphics
347
Disable HTML links in a text cell
1) In the Report Editor window, click the text cell, then click .
2) Click the Cell tab, then click HTML links.
3) Clear the Enable Link Field checkbox.
Filter a text cell
1) In the Report Editor window, click the text cell, then click .
2) Click the Cell tab, then click Edit Filter.
3) In the Parameter column, select the field you want to use to filter the data.
4) In the Is column, select the search condition, or comparison operator.
5) In the Value field, type or select the field value you want to use to filter the data.
Delete a text cell filter
1) In the Report Editor window, click the text cell, then click .
2) Click the Cell tab, then click Edit Filter.
3) Select the filter you want to remove, click Delete, then click Yes.
Delete a text cell from a report
In the Report Editor window, right-click the text cell you want to remove, select
Delete, then click Yes.
Working with Line Cells
Add a line cell to a report
1) In the Report Editor window, select the row to which you want to add a line cell.
2) Click .
3) Click the Line tab, then type the number of lines you want to appear in the cell.
Specify line cell width and position in a row
1) In the Edit Report window, click the line cell, then click .
P6 Professional User's Guide
348
2) Click the Line tab. In the Line alignment field, select the position you want the cell to
occupy in the row.
To use your mouse to drag the cell to the appropriate position in the row, select None.
To position the cell relative to the left margin, select Left, then type the cell's left
indent in the Left field.
To position the cell flush against the right margin, select Right.
To extend the cell, or line, across the entire row, select Center.
3) In the Width field, type the cell's numeric width, the distance you want the cell to
occupy between the report's left and right margins.
If the cell's alignment is Center, you cannot enter the cell's width.
Tip
You can also change a cell's width directly in the Report Editor window. Select the
line cell, then position the mouse pointer over the cell's left or right edge. When the
pointer changes to a double-headed arrow, drag the cell's edge to a new
position.
Delete a line cell from a report
In the Report Editor window, right-click the line cell you want to delete, select Delete,
then click Yes.
Working with Image Cells
Add an image cell to a report
BMP and JPG files are supported.
1) In the Report Editor window, select the row to which you want to add an image cell.
2) Click .
3) Click the Image tab. Click Select Image, then click Load.
4) Select the image file, then click Open.
To expand the image to the size of the selected image cell, mark the Stretch Image
checkbox.
5) Click OK.
Producing Reports and Graphics
349
Specify image cell width and position in a row
1) In the Report Editor window, click the image cell, then click .
2) Click the Image tab, in the Image alignment field, select the position you want the
cell to occupy in the row.
To use your mouse to drag the cell to the appropriate position in the row, select None.
To position the cell relative to the left margin, select Left, then type the cell's left
indent in the Left field.
To position the cell flush against the right margin, select Right.
To extend the cell across the entire row, select Center.
3) In the Width field, type the cell's numeric width, or the distance you want the cell to
occupy between the report's left and right margins. If the cell's alignment is Center,
you cannot enter the cell's width.
Tip
You can also change a cell's width directly in the Report Editor window. Select the
cell, then position the mouse pointer over the cell's left or right edge. When the
pointer changes to a double-headed arrow, drag the cell's edge to a new
position.
Add HTML links to an image cell
1) In the Report Editor window, click the image cell, then click .
2) Click the Image tab, then click HTML Links.
3) In the Link Prefix field, type the portion of the Internet address, or URL, that specifies
the server location of the file to which you want to link the cell, for example,
http://www.yourcompany.com.
4) If you want each report record to be a hot-link to another file, mark the Enable Link
Field checkbox. Select an object, or category of information, and a field from the Link
Object and Link Field lists. The list of available objects and fields reflects the type of
information reported by the cell's row.
To disable the link if a specific field does not produce any records in the compiled
report, mark the Disable Link If Empty Value checkbox.
5) Type the suffix of the Internet address to which you want the selected cell to link. If
you chose the Enable Link field option, specify only the filename extension in this field,
for example, .html. If you did not choose the Enable Link Field option, specify both the
filename and extension in this field, for example, yourfile.html.

P6 Professional User's Guide
350
6) To create a link to a specific frame in the Web page, if the Web page uses frames,
type the URL address of the frame.
Note
Both Link Prefix and Link Suffix are always used to build the URL link for the image
cell. The Link Prefix identifies the server location of the file to which you want to link
the cell. If you choose the Enable Link Field option, the Link Object and Link Field
fields are used to determine the filename, and the Link Suffix field identifies the
extension of the file to which you want to link the cell. In this case, the URL is built as
follows: [Link Prefix]+[Link Field]+[Link Suffix]. If you do not choose the Enable Link
Field option, the Link Suffix field is used to determine both the filename and
extension of the file you wish to link to. In this case, the URL is built as follows: [Link
Prefix]+[Link Suffix].
Disable HTML links in image cells
1) In the Report Editor window, click the image cell whose HTML link you want to disable,
then click .
2) Click the Image tab, then click HTML Links.
3) Clear the Enable Link Field checkbox.
Define HTML print settings for an image cell
When you print a report to an HTML file and the report includes either background
images or image cells, you must specify whether you want to copy the image files to the
destination folder of the HTML report or reference the image files. Copying an image file
allows you to maintain a consistent HTML folder for the report. If the content of the image
files changes frequently, it may be more efficient to reference the files so that they are
current when you view the report.
1) In the Report Editor window, click the image cell whose HTML settings you want to
define, then click .
2) Click the Image tab, then click Select Image.
To copy the image file, in the Relative Image Path field, type a location and name for
the copied image file, relative to the report's HTML folder. If you do not enter a
location, the image automatically copies to the file destination you specify when you
print the report to an HTML file.
To reference the image's file, rather than copy the file, mark the Reference Image
Instead checkbox. Then, in the Relative Image Path field associated with the
checkbox, type the location and name of the image file. Referencing an image's file
is helpful when the image's content changes frequently.
Delete an image cell from a report
In the Report Editor window, right-click the image cell you want to delete, select
Delete, then click Yes.

Producing Reports and Graphics
351
Producing Graphics
Print features
The print features enable you to create a variety of graphics to support project initiatives.
You can use the Print option to print activity layouts, tracking layouts, and project data
displayed in main windows such as Projects, Expenses, and Work Breakdown Structure.
You can also use the Report Wizard to print the data currently displayed in a window and
save it as a report. With the Report Wizard, you can also modify the report output from
the current window display by adding or deleting data fields or applying a filter. For
example, to create a report of project expenses for a particular expense category,
display the Expenses window, then use the Report Wizard to filter the data and include
only one specific expense category in the report.
Print a layout or window data
Display the layout or window you want to print and choose File, Print.
Tip
To preview the layout or window before printing, choose File, Print Preview.
Change page setup options
1) Choose File, Page Setup.
2) To set the page orientation, scaling, and paper size options, click the Page tab and
type or select the options you want to use.
3) To set page margins, click the Margins tab.
To change a margin, type a new size.
Top and bottom margins specify the distance between the top or bottom edge of
the paper and the top or bottom edge of the report text, not including the header or
footer.
Header and footer margins specify the distance between the top or bottom edge of
the paper and the top or bottom edge of the report header or footer, respectively.
The header margin cannot be greater than the top margin and the footer margin
cannot be greater than the bottom margin.
4) To define the header and footer content, click the Header or Footer tab. In the Divide
Into Sections field, select the number of appropriate sections to divide the header or
footer into.
5) To specify when you want to print the header or footer, choose First Page, Last Page,
All Pages, or No Pages in the Include On field.
P6 Professional User's Guide
352
6) In the Define header/footer section, mark the Show Section Divider Lines checkbox to
display dividers between each section of the header or footer.
7) In the Define header/footer section, select the subject area for each section:
To leave the section below the header/footer grid blank, choose None.
If the Gantt Chart is displayed in the layout, you can choose Gantt Chart Legend to
specify the font for the legend. If the Activity Network is displayed in the layout, you
can choose Activity Network Legend to specify the font settings.
To add a text variable, choose Text/Logo. From the list, select a global variable and
click Add. When connected to a P6 Professional database, global variables include
data such as current project properties (Project Name, Project Start, Data Date, and
so on) and Admin Preferences (Header / Footer / Custom Label 1 / 2 / 3). When
connected to a P6 EPPM database, global variables include data such as current
project properties (Project Name, Project Start, Data Date, and so on) and
Application Settings in P6. The Header or Footer Sample illustrates how the report
header or footer will print. You can add more than one text variable.
You can add your own text to the header or footer, type directly in the text area of
the selected header/footer section. Do not modify a variable field, that is, the text
between square brackets. To change the font, click , specify the font settings, and
click OK. To add a logo, click . In the Picture Source field, click Browse, then select
a filename and click Open. The logo image is displayed in the text area of the
selected header/footer section.
To add dates, approvals, and revision information, choose Revision Box and enter a
title in the Revision Box Title. Click Add to insert a new row in the revision box. In the
Date column, click , then select a date. Enter information in the Revision, Checked,
and Approved columns, or leave it blank so information can be entered manually.
Click Delete to remove the selected row. Click Font to specify the font settings, and
click OK.
To add pictures to the header or footer, choose Picture. In the Select Filename field,
click to select the picture file. Mark the Resize Picture to Fit the Section checkbox
to show the complete picture in the section.
8) To choose whether you want to print icons and grid lines, to specify which elements of
a layout you want to print, and to choose page break options, click the Options tab.
Mark the applicable checkboxes.
The choices available on the Options tab vary according to the layout that is
currently displayed.
Producing Reports and Graphics
353
Notes
If you are displaying the Activity Network in the layout, you can select Activity
Network Legend as the subject area and format the legend.
The Options tab is not available for Reports.
Select a specific printer to print a layout
Use Print Setup to select a printer other than the current default to print layouts and
reports.
1) Choose File, Print Setup.
2) In the Printer section, select a printer.
3) Click Properties to adjust the features and settings for the selected printer.
4) In the Paper section, choose the paper settings from a list of available page sizes and
paper sources that match the capabilities of the selected printer.
5) Choose Portrait or Landscape for the paper orientation.
6) Click Network to direct your output to any network print queue.
7) Click OK.
Note
Only the paper size and orientation is saved when you save a layout and log out
of P6 Professional.
Publishing Layouts and Reports in HTML Format
Use Print Preview to publish layouts and reports at HTML files and post them to a Web site
to share with other project team members.
1) Choose File, Print Preview.
2) Click the Publish to HTML button.
3) In the Publish to HTML dialog box, select the drive and folder where the file should be
stored.
4) Type a name for the file in the File name field.
5) Click Save.

355
In This Section
Project Web Site Publisher ..................................................................................... 355
Project Web sites ..................................................................................................... 355
Publishing activity and tracking layouts .............................................................. 356
Publish projects as Web sites ................................................................................. 356
Publish activity and tracking layouts on a Project Website .............................. 357
Publish reports on a Project Website .................................................................... 358
Customize a Project Website ................................................................................ 358
Publish Activity layouts ........................................................................................... 359
Publish tracking layouts .......................................................................................... 359
Project Web Site Publisher
To facilitate communicating project data in a company with offices local or worldwide,
you can publish project plans in HTML format using the Project Web Site Publisher. Transfer
these documents to either the World Wide Web (using FTP) or your office intranet, and
view them using an Internet browser.The documents contain hypertext links, or jumps, to
other pages in the structure, allowing you to move between projects and reports and
from page to page within a report.
When publishing a project Web site, you control the level of detail published in terms of
activity information and personal information for resources, as well as which project
reports you want to include in the Web site.
Note
You can use the default Web site template, or "scheme," to build your project Web
site. You can customize the existing scheme or create your own, adding or
changing graphics, fonts, and colors.
Project Web sites
The Project Web Site layout enables you to both browse a project plan at a high level
and quickly view more detailed information about specific activities, work products and
documents, resources, and so on. The Project Web Site layout is divided into three panes.
The upper pane contains a navigation toolbar that enables you to look at the various
sections of the Web site. The left pane is the navigation pane; the right pane displays the
specific details for project elements. Select the element you want to view in the left
pane; the right pane displays detailed information about that element.
Publishing Project Web sites
P6 Professional User's Guide
356
You can navigate a project Web site using the project's work breakdown structure (WBS),
resource hierarchy, roles, work products and documents outline, activity codes, and
issues. For example, visitors can select a resource in the left pane and view the resource's
information and activity assignments in the right pane. Similarly, visitors can select a work
product or document and view the document’s details and WBS and activity
assignments. The level of detailed information a visitor can view depends on the
information you choose to publish.
You can also view reports, activity layouts, and tracking layouts in the project Web site.
The list of reports or layouts appears in the left pane, and the report or layout itself is
displayed in the right pane when you select it.
Publishing activity and tracking layouts
In addition to publishing activity and tracking layouts as part of a project Web site, you
can publish individual activity and tracking layouts on the Internet or on your corporate
intranet. These layouts are not connected to any previously created project Web site,
but instead are self-contained Web sites consisting of the activity or tracking layouts you
specify. When no projects are open, layout publishing features are disabled.
For activity and tracking layouts
Published layouts are a snapshot of your project; they are not interactive.
The columns displayed in the Web pages are defined by the layout you select.
Header and footer information saved for a layout is included in the published layout.
Regardless of the view settings, layouts are published with all project elements
expanded.
For timescaled layouts, the published timescale begins with the earliest Start Date
and ends with the latest Finish Date, regardless of the view settings.
For tracking layouts
Information is published only for open projects, regardless of the layout view. To
publish a layout that includes closed projects, publish the layout through the Print
Preview feature. Choose File, Print Preview, then click .
Publish projects as Web sites
Before you publish a project as a Web site for the first time, you may want to create a
new folder on your computer or network or verify that the existing folder you want to use
is empty.
1) Open the project you want to publish.
2) Choose Tools, Publish, Project Web Site.
3) Click the General tab.
Publishing Project Web sites
357
4) In the Web Site Name field, type the title of the Web site.
5) In the Web Site Description field, type a description of the Web site. This description
appears on the Web site’s initial page.
6) In the Publish Directory field, type the full path for the folder in which you want to save
the project's Web site files, or click and select the location.
7) Click Edit Scheme to modify the specified scheme or select another scheme.
8) Click the Topics tab and mark the appropriate checkboxes to specify the project
information you want to publish on the project's Web site.
The checkboxes determine what Activity Details are available on the project Web
site. If you clear all checkboxes, then the General activity information option is
automatically selected because at least one type of activity detail information must
be included in the Web site.
9) Click the Graphics tab and specify which activity or tracking layouts to include as
graphical reports in the Web site.
10) Click the Reports tab and specify which reports to include in the Web site.
11) Click Publish.
If the folder you selected contains older Web site files or other files, a message warns
you that those files will be deleted. Choose Yes to continue or No to cancel.
Tip
To preview the Web site after creating the files, mark the Automatically Launch
Web Site Preview After Publishing checkbox in the General tab.
Publish activity and tracking layouts on a Project Website
Before you publish a project as a Web site for the first time, you may want to create a
new folder on your computer or network or verify that the existing folder you want to use
is empty.
1) Open the project you want to publish.
2) Choose Tools, Publish, Project Web Site.
3) Click the Graphics tab.
4) Mark the Include in Project Web Site checkbox to include activity and/or tracking
layouts in the project Web site.
5) In the Activity Layouts section, click the Assign button, select the activity layouts you
want to include in the Web site, then click the Select button.
6) In the Tracking Layouts section, click the Assign button, select the tracking layouts you
want to include in the Web site, then click the Select button.

P6 Professional User's Guide
358
7) Click Publish.
If the folder you selected contains older Web site files or other files, a message warns
you that those files will be deleted. Choose Yes to continue or No to cancel.
The layouts are added to the project Web site's HTML folder.
Publish reports on a Project Website
Before you publish a project as a Web site for the first time, you may want to create a
new folder on your computer or network or verify that the existing folder you want to use
is empty.
1) Open the project you want to publish.
2) Choose Tools, Publish, Project Web Site.
3) Click the Reports tab.
4) Mark the Include in Project Web Site checkbox to include reports in the project Web
site.
5) Click the Assign button.
6) Select the reports you want to include in the Web site, then click the Select button.
7) Click Publish.
If the folder you selected contains older Web site files or other files, a message warns
you that those files will be deleted. Choose Yes to continue or No to cancel.
The reports are added to the project Web site's HTML folder.
Customize a Project Website
1) Choose Tools, Publish, Project Web Site.
2) Click the General tab, then click Edit Scheme.
3) Click the Splash Tab.
4) Click a splash screen element to select it, or choose an element from the item
selector (see image below), then customize it in the fields at the top of the dialog box.
5) Click the Main tab.
6) Click a screen element to select it, or choose an element from the item selector (see
image below), then customize it in the fields at the top of the dialog box.
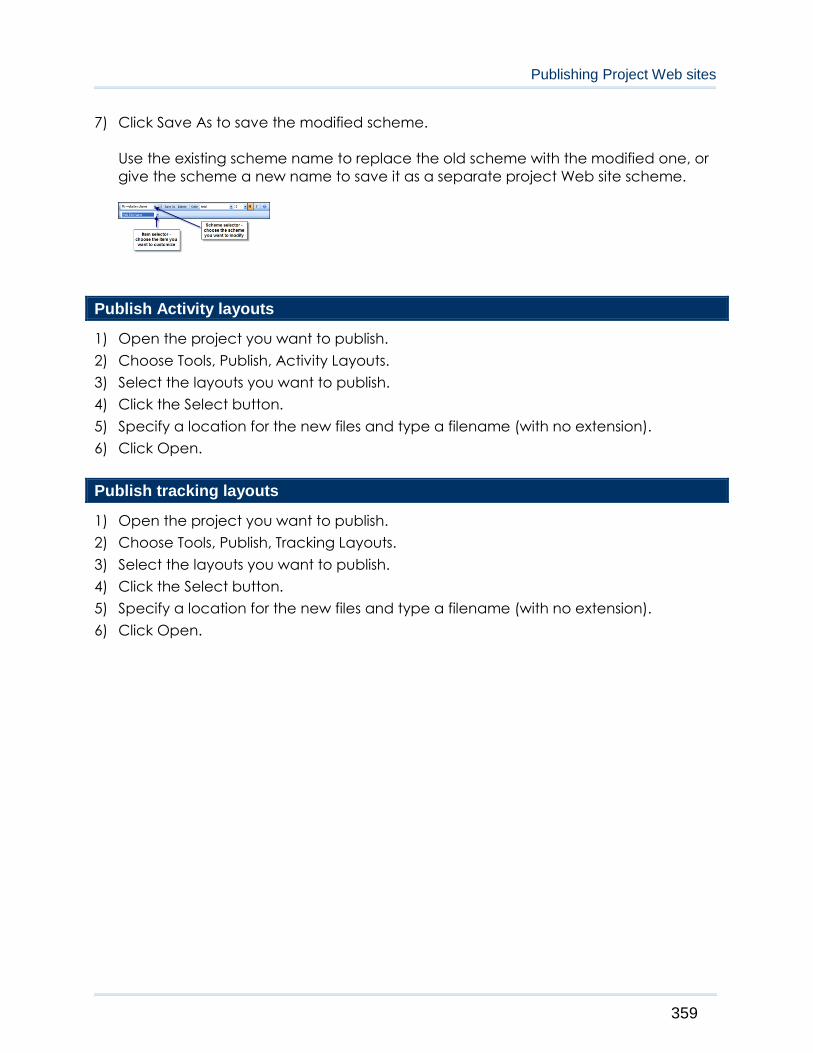
Publishing Project Web sites
359
7) Click Save As to save the modified scheme.
Use the existing scheme name to replace the old scheme with the modified one, or
give the scheme a new name to save it as a separate project Web site scheme.
Publish Activity layouts
1) Open the project you want to publish.
2) Choose Tools, Publish, Activity Layouts.
3) Select the layouts you want to publish.
4) Click the Select button.
5) Specify a location for the new files and type a filename (with no extension).
6) Click Open.
Publish tracking layouts
1) Open the project you want to publish.
2) Choose Tools, Publish, Tracking Layouts.
3) Select the layouts you want to publish.
4) Click the Select button.
5) Specify a location for the new files and type a filename (with no extension).
6) Click Open.


361
In This Section
Linking Contract Management (Expedition) data ............................................ 361
Import/Export Overview ......................................................................................... 367
XER ............................................................................................................................ 374
Primavera P6 XML ................................................................................................... 385
P3 ............................................................................................................................... 389
Microsoft Excel/XLS ................................................................................................. 403
Microsoft Project ..................................................................................................... 409
Oracle Primavera Contractor ............................................................................... 413
UN/CEFACT IMS (XML) ............................................................................................ 415
Linking Primavera Unifier data (P6 EPPM Only) ................................................... 417
Linking Contract Management (Expedition) data
Linking Contract Management data
You can import data from the Contract Management module to update schedule
dates, cost information, the Activity Code dictionary, and the Cost Accounts dictionary.
You can also link documents in Contract Management to your project's activities.
Linking to Contract Management and importing data is a three step process detailed in
the following topics:
1) Link P6 Professional to Contract Management (on page 362)
2) Link your project to a Contract Management project (on page 362)
3) Import Contract Management data (on page 363)
Notes
A project can link to only one Contract Management project.
When P6 Professional is connected to a P6 EPPM database: For information about
the tables and fields that are converted, see the Field Mappings for the Transfer
from Contract Management to a P6 Client document.
When P6 Professional is connected to a P6 Professional database: For information
about the tables and fields that are converted, see the Field Mappings for the
Transfer from Contract Management to a P6 Client document.
Importing and Exporting Data
P6 Professional User's Guide
362
Link P6 Professional to Contract Management
When P6 Professional is connected to a P6 Professional database: Before you can link
your project to a Contract Management project, you must first set up access to Contract
Management in Admin Preferences.
When P6 Professional is connected to a P6 EPPM database: Before you can link your
project to a Contract Management project, you must first set up access to Contract
Management using the P6 Application Settings.
See Link your project to a Contract Management project (on page 362). Setting up
access is generally a one time task that is completed by the Project Administrator to
identify the Contract Management version to which you are connecting. You must also
identify the Contract Management web server.
To set up access to Contract Management (P6 Professional Only):
1) Choose Admin, Admin Preferences.
2) Click the Options tab. Then, in the Link to Contract Management section, mark the
Enable Link to Contract Management checkbox. Next, choose the Contract
Management product version to which you are connecting. Type the URL and port
number to the Contract Management web server.
3) Click Close.
4) Once you set up access to Contract Management, with the required privilege you
can link your project to a Contract Management project to enable users to import
and view Contract Management data. See Link your project to a Contract
Management project (on page 362). See Import Contract Management data (on
page 363).
Link your project to a Contract Management project
Linking your project to a Contract Management project enables you to import Contract
Management data to update schedule dates, cost information, the Activity Codes
dictionary, and the Cost Accounts dictionary.
When P6 Professional is connected to a P6 Professional database: Before you can link
your project, you must first link P6 Professional to Contract Management in Admin
Preferences.
When P6 Professional is connected to a P6 EPPM database: Before you can link your
project, you must first link P6 Professional to Contract Management using the P6
Application Settings.
See Link P6 Professional to Contract Management (on page 362). Setting up access is
generally a one time task that is completed by the Project Administrator to identify the
Contract Management product version to which you are connecting. Once access to
Contract Management is set up, if you have the required security privilege, you can then
link your project to a project in Contract Management.

Importing and Exporting Data
363
To link your project to a Contract Management project:
1) Choose Enterprise, Projects and display Project Details.
2) Select the project to which you want to link a Contract Management project.
3) Click the Contract Management tab, then mark the 'Allow this project to link with a
Contract Management Project' checkbox. (If the Contract Management tab is not
displayed, right click on a tab at the bottom (for example, General) to display the
Project Details dialog box, and move Contract Management tabs section.)
4) In the Group Name:Project Name field, click . Select the name of the Contract
Management/Expedition project to link to your project, then click the Select button.
If you are using Expedition version 8.5, in the Group Name field, type the name of the
Expedition database that contains the project you want to link to. In the Project
Name field, type the name of the Expedition project to link to your project.
5) Choose whether you are prompted for your login and password when retrieving
Contract Management/Expedition data. If you choose to log in without being
prompted, type your login name and password.
Note: If an identical username and password do not already exist in both Contract
Management and P6 Professional, you will be prompted to enter the Contract
Management Name and Password. If an identical username and password already
exist in both Contract Management and P6 Professional, the Select Project Manager
Project popup menu will display for you to select the project.
6) Click Close.
Import Contract Management data
Once you link P6 Professional to Contract Management and link your project to a
Contract Management project, you can specify which schedule, cost, and dictionary
information to import. See Link P6 Professional to Contract Management (on page 362).
See Link your project to a Contract Management project (on page 362) .
1) Choose File, Import from Contract Management.
This option is enabled when the project is linked to a Contract Management project
on the Contract Management tab of Project Details.
2) Mark the checkbox next to each item that you want to import to your project.
3) Click Import, then click OK.
4) The Contract Management Import Report lists all the information that is imported to
your project. Click Commit Changes, then click Yes or No to save the report to a log
file. If you select Yes, specify a filename and location.
P6 Professional User's Guide
364
5) Click Close. Click Yes to save any changes you made to the import settings or No to
discard changes.
Import considerations
Global activity codes
The Spec section code is available to all projects in P6 Professional. For Contract
Management data, this activity code may be referred to as SPCS.
Project activity codes
The Responsibility, Contracts, Bid Package, and Submittal activity codes are imported as
project activity codes. (For Contract Management 14.0, these activity codes were
referred to as RESP, CNTR, BIDP, and ISSB, respectively.)
The Responsibility code is imported from the Contacts subsection of the Project
Information section. The Abbreviation and Company Name columns are used as the
code value and description, respectively.
The Contracts code is imported from the Contracts and Purchase Orders subsections of
the Contract Information section. The No. and Description columns are used as the code
value and description, respectively.
When you import the Submittal Activity code, the activity is assigned the code value Yes
to indicate that the item is a submittal.
How activity codes are imported
If the code or value does not exist, the imported code or value is added to the
dictionary. If the code exists but the value does not, the value is added to the dictionary.
If the code and value exist, but the value assigned to the activity does not match the
imported value, the value on the activity is overwritten. If the activity does not exist, it is
created.
Cost accounts
Cost codes in Contract Management are imported to the Cost Accounts dictionary. The
Cost Accounts dictionary is available to all projects in P6 Professional. All items in the Cost
Worksheet are imported as cost accounts and placed under a root node having the
same name as the imported Contract Management project. The Cost Code and Title
columns are imported as the Cost Account ID and Cost Account Name, respectively.
Cost information
Cost information from Contract Management is imported as Expenses for activities.
How data is imported from Contract Management
You can import activity and cost information from Contract Management.
Importing and Exporting Data
365
New Activities
Any document in Contract Management that is linked to an activity ID is imported. If the
activity ID matches an ID in the project, the activity is updated. If activity IDs are assigned
in Contract Management that do not match an activity ID in the project, a new activity
is created.
All new activities are placed under the project’s root EPS node. The activities are
assigned the default duration for new activities; they do not contain any dependencies.
Activity Codes dictionary
Global Activity Code: The Spec Section code is available to all projects in the enterprise.
Project Activity Codes: The Responsibility, Contracts, Bid Package, and Submittal Activity
codes are imported at the project level. They are not available to all projects in the
enterprise.
The Responsibility code is imported from the Contacts subsection of the Project
Information section. The Abbreviation and Company Name columns are used as the
code value and description, respectively.
The Contracts code is imported from the Contracts and Purchase Orders subsections of
the Contract Information section. The No. and Description columns are used as the code
value and description, respectively.
When you import the Submittal Activity code, the activity is assigned the code value Yes
to indicate that the item is a submittal.
How Activity Codes are imported
If the code or value does not exist, the imported code or value is added to the
dictionary.
If the code exists but the value does not, the value is added to the dictionary.
If the code and value exist, but the value assigned to the activity does not match the
imported value, the value on the activity is overwritten.
If the activity does not exist, it is created.
Cost Accounts dictionary
Cost codes in Contract Management are imported to the Cost Accounts dictionary. The
Cost Accounts dictionary is available to all projects in the enterprise. All items in the Cost
Worksheet are imported as cost accounts and placed under a root node having the
same name as the imported Contract Management project. The Cost Code and Title
columns are imported as the Cost Account ID and Cost Account Name, respectively.
Cost information
Cost information from Contract Management is imported as Expenses for activities.
P6 Professional User's Guide
366
Notes
For information about the tables and fields that are converted, see the
ExpMappings9xandlater.pdf file located in the \Documentation\<language>
folder of the physical media or download.
Some data you import from Contract Management may impact manual future
period assignment values. See Manual future period buckets.
How? The following task information you can import from Contract Management
may affect the spread of manual future period buckets:
Remaining Early Finish
Remaining Finish
Original Duration
Duration % Complete
If the duration of an activity with manual future period assignment buckets
changes after importing data from Contract Management, one of the
following will occur:
For activities with a duration type of Fixed Duration & Units, the manual
future period units are logically spread over the new duration of the activity.
For activities with a duration type of Fixed Duration & Units/Time, the
difference in units will be removed from, or added to, the last bucket.
Viewing Contract Management documents
You can view the following types of Contract Management documents as long as the
document is associated with an activity ID from your project schedule:
Drawing Sets
Daily Reports
Materials
Punch Lists
Submittals
Budgeted Contracts
Committed Contracts
Schedule of Values
Change Orders
Purchase Orders
You cannot add, delete, or modify Contract Management documents.
Notes
To display the most current Contract Management documents associated with
the selected project, choose File, Refresh Data.
Importing and Exporting Data
367
For information about the tables and fields that are converted, see the
ExpMappings9xandlater.pdf file located in the \Documentation\<language>
folder of the physical media or download.
View Contract Management documents
Once you link your project to a Contract Management project, you can view Contract
Management documents, such as submittals and contracts. See Link your project to a
Contract Management project (on page 362).
1) Choose File, Open, then select the project that is linked with Contract Management.
Mark the Retrieve Contract Management documents checkbox at the bottom of the
dialog box to retrieve Contract Management documents.
This checkbox is available only if your project is linked to a Contract Management
project.
2) Click OK to open the project.
3) Choose Project, Activities, then choose View, Show on Bottom, Activity Details.
4) Right-click in Activity Details, then choose Customize Activity Details.
5) In the Available Tabs section, select Contract Management Docs, then click the right
arrow to add it to the tabs displayed in Activity Details. Click OK.
6) Click the Contract Management tab. Select a document, then click View. Then type
your Contract Management username and password. The document displays in your
default web browser.
Tip
Click the Refresh button to ensure you are viewing the most current Contract
Management documents associated with the selected project.
Import/Export Overview
Importing and exporting projects
All project data is stored in a central database. You can import and export information to
and from this database using external files and then share this information with other P6
Professional users, Oracle Contractor users, other project management tools (such as
Microsoft Project and Microsoft Excel), and your organization's human resource and
accounting systems. You can also use external files to archive your projects or create a
backup of your database.
You can import and export between P6 Professional and other applications using the
following file formats:
P6 Professional User's Guide
368
The Oracle proprietary format (XER) supports all project, resource, and role
information developed using the P6 Professional or P6 EPPM suite of project
management tools. The Primavera PM XER file format enables you to export data
between PM release 5.0 and more recent versions for use within P6 Professional.
The Contractor XER format is supported to import data from Contractor 4.0 and
subsequent versions into P6 Professional, as well as export data to Contractor 5.0
or 6.1.
P6's XML format, which enables you to share project information between P6
Professional or P6 EPPM databases.
XLS files enable you to export information to spreadsheet applications.
MPP files enable you to share information with Microsoft Project 2003.
MPX format enables you to share information with Microsoft Project, as well as to
integrate with other third-party tools.
Microsoft Project XML format enables you to share information with Microsoft
Project 2003, 2007, and 2010.
P3 format enables you to share project information with Oracle Project Planner
version 3.x.
UN/CEFACT Integrated Master Schedule (IMS) Schema XML files enable you to
export information to organizations that require UN/CEFACT format, such as the
Defense Contract Management Agency (DMCA).
Importing and exporting resources and roles
All resource and role information is stored in a central database. You can import and
export information to and from this database using external files and share this
information with other P6 Professional users. Since resources and roles are defined at the
global level, you can import and export them without opening the projects that contain
them.
Resource information can be imported and exported using either the Primavera PM
(XER), Spreadsheet (XLS), or eXtensible Markup Language (XML). Roles can only be
imported and exported using the Primavera PM (XER) format. You can import and export
all resource and role information to ensure that resources and roles are consistent
throughout your organization. XER format transfers all resource and role information, such
as the resource hierarchy, resource categories, category values, and category value
assignments.
Import/Export file formats
You can import and export between P6 Professional and other applications using the
following file formats:
Importing and Exporting Data
369
The Oracle proprietary format (XER) supports all project, resource, and role
information developed using the P6 Professional or P6 EPPM suite of project
management tools. The Primavera PM XER file format enables you to export data
between P6 Professional release 5.0 or more recent versions, for use within P6
Professional. The Contractor XER format is supported to import data from
Contractor 4.0 and subsequent versions into PM, as well as export data to
Contractor 5.0 or 6.1 and later.
Primavera's P6 XML format enables you to share project information between P6
Professional or P6 EPPM databases.
XLS files enable you to share information with other spreadsheet applications.
MPP files enable you to share information with Microsoft Project 2003. You must
have Microsoft Project 2003 installed on your computer to export an MPP file.
MPX format enables you to share information with Microsoft Project, as well as to
integrate with other third-party tools.
Microsoft Project XML format enables you to share information with Microsoft
Project 2003, 2007, and 2010.
P3 format enables you to share project information with Oracle Project Planner
version 3.x.
The file format you select when you import or export determines the type of
information you can share.
UN/CEFACT Schema XML files enable you to export information to organizations
that require UN/CEFACT format, such as the Defense Contract Management
Agency (DMCA).
Differences Between XML and XER Export Formats
The following table compares the features and benefits of both formats for exporting
project data. A checkmark represents that a particular format is better suited for that
functionality.
Functionality XML XER
Data formats
XER is proprietary.
XML is an industry-standard format.
Multiple projects
XER supports exporting multiple projects at once to a
single XER file.
XML supports exporting multiple projects at once to a
single XML file.
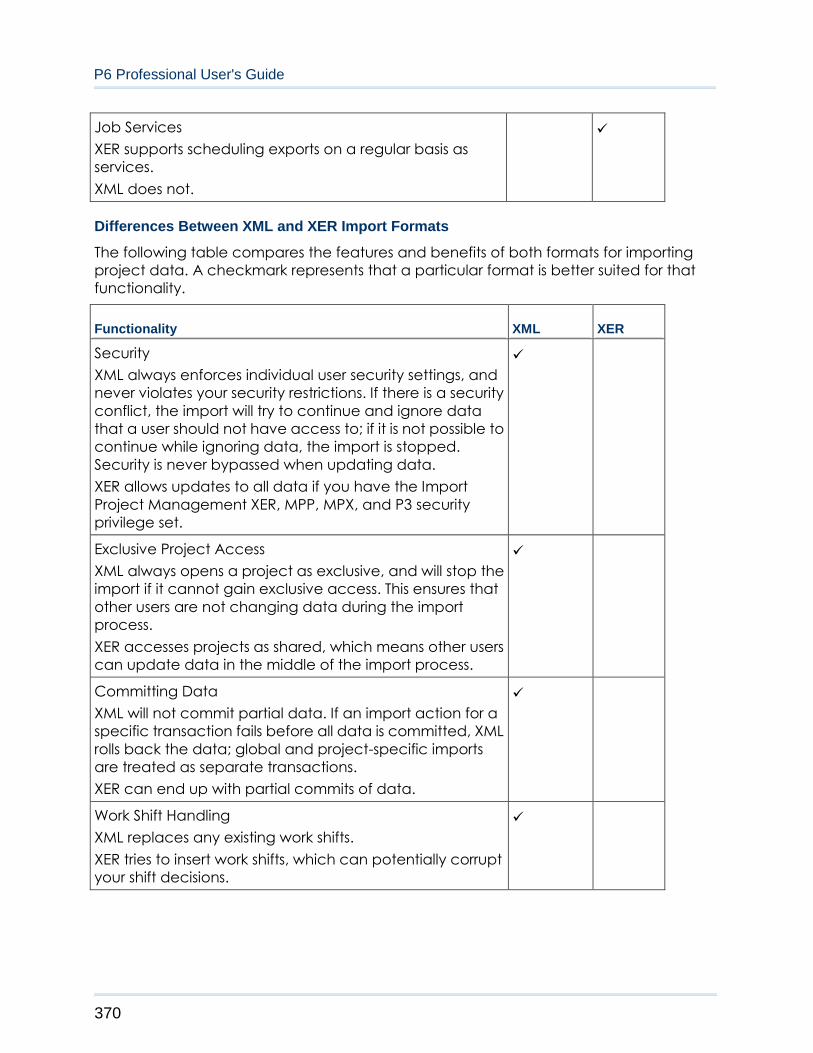
P6 Professional User's Guide
370
Job Services
XER supports scheduling exports on a regular basis as
services.
XML does not.
Differences Between XML and XER Import Formats
The following table compares the features and benefits of both formats for importing
project data. A checkmark represents that a particular format is better suited for that
functionality.
Functionality XML XER
Security
XML always enforces individual user security settings, and
never violates your security restrictions. If there is a security
conflict, the import will try to continue and ignore data
that a user should not have access to; if it is not possible to
continue while ignoring data, the import is stopped.
Security is never bypassed when updating data.
XER allows updates to all data if you have the Import
Project Management XER, MPP, MPX, and P3 security
privilege set.
Exclusive Project Access
XML always opens a project as exclusive, and will stop the
import if it cannot gain exclusive access. This ensures that
other users are not changing data during the import
process.
XER accesses projects as shared, which means other users
can update data in the middle of the import process.
Committing Data
XML will not commit partial data. If an import action for a
specific transaction fails before all data is committed, XML
rolls back the data; global and project-specific imports
are treated as separate transactions.
XER can end up with partial commits of data.
Work Shift Handling
XML replaces any existing work shifts.
XER tries to insert work shifts, which can potentially corrupt
your shift decisions.

Importing and Exporting Data
371
Multiple projects
XER supports importing multiple projects at once from a
single XER file.
XML supports importing multiple projects at once from a
single XML file.
Importing information using a wizard
The following table summarizes how you can use the Import wizard.
File Format Information Type Purpose
Primavera PM XER Project Import complete project
information from other P6
Professional or P6 EPPM modules
and Oracle Primavera Contractor
Primavera P6 XML Project Import project information from
other P6 Professional or P6 EPPM
modules. This is a subset of
complete project data; for
example, neither future bucket
data nor work products and
documents are not imported.
Primavera PM XER Resource Only Import complete resource
information from other P6
Professional or P6 EPPM modules
and Oracle Primavera Contractor
Primavera PM XER Role Only Import complete role information
from other P6 Professional or P6
EPPM modules
Microsoft Project
XML
Project Import project information to
Microsoft Project
MPP, MPX Project Import project information from
Microsoft Project or other third-party
applications that support the MPX
format
MPP, MPX Resource Only Import resource information from
Microsoft Project or other third-party
applications that support the MPX
format
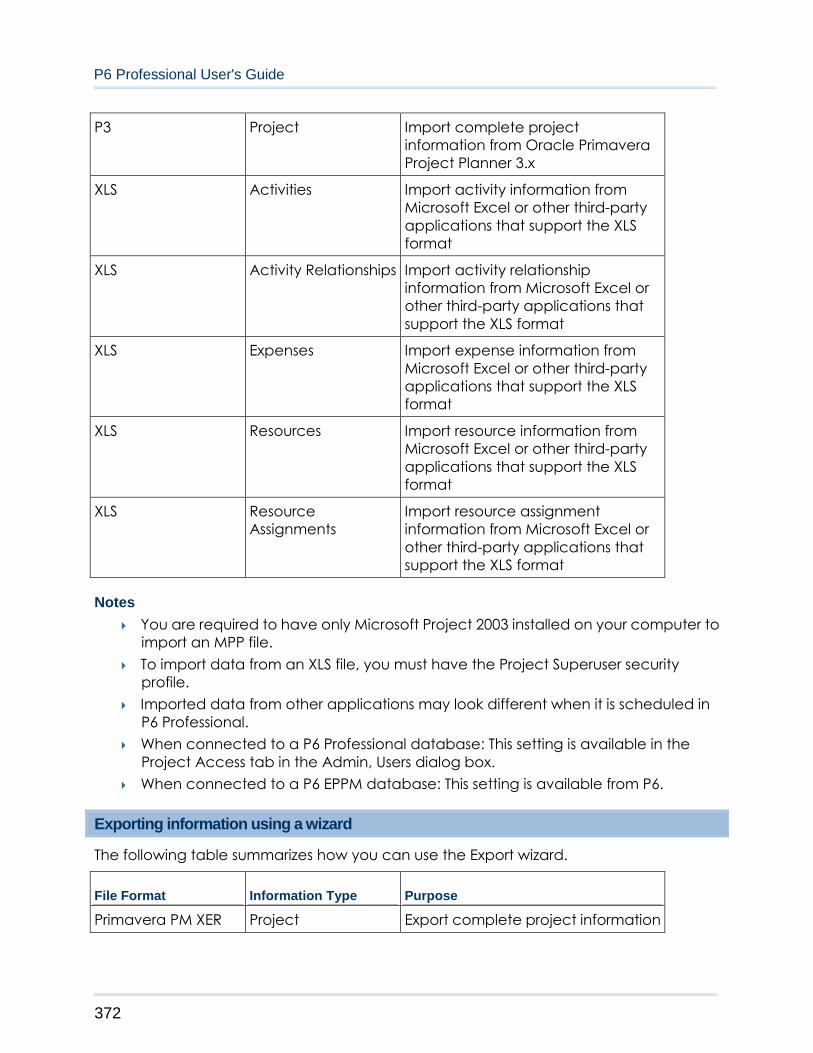
P6 Professional User's Guide
372
P3 Project Import complete project
information from Oracle Primavera
Project Planner 3.x
XLS Activities Import activity information from
Microsoft Excel or other third-party
applications that support the XLS
format
XLS Activity Relationships Import activity relationship
information from Microsoft Excel or
other third-party applications that
support the XLS format
XLS Expenses Import expense information from
Microsoft Excel or other third-party
applications that support the XLS
format
XLS Resources Import resource information from
Microsoft Excel or other third-party
applications that support the XLS
format
XLS Resource
Assignments
Import resource assignment
information from Microsoft Excel or
other third-party applications that
support the XLS format
Notes
You are required to have only Microsoft Project 2003 installed on your computer to
import an MPP file.
To import data from an XLS file, you must have the Project Superuser security
profile.
Imported data from other applications may look different when it is scheduled in
P6 Professional.
When connected to a P6 Professional database: This setting is available in the
Project Access tab in the Admin, Users dialog box.
When connected to a P6 EPPM database: This setting is available from P6.
Exporting information using a wizard
The following table summarizes how you can use the Export wizard.
File Format Information Type Purpose
Primavera PM XER Project Export complete project information

Importing and Exporting Data
373
to other P6 Professional 5.0 and later
users
Primavera P6 XML Project Export project information to other
P6 Professional or P6 EPPM users. This
is a subset of complete project
data; for example, baseline
information is not exported.
Primavera PM XER Resource Only Export complete resource
information to other P6 Professional
5.0 and later users
Primavera PM XER Role Only Export complete role information to
other P6 Professional 5.0 and later
users
Primavera
Contractor XER
Project Export complete project information
to Oracle Primavera Contractor 5.0
or 6.1
Primavera
Contractor XER
Resource Only Export complete resource
information to Oracle Primavera
Contractor 5.0 or 6.1
MPP Project Export project information to
Microsoft Project
MPP Resource Only Export resource information to
Microsoft Project
MPX Project Export project information to
Microsoft Project or other third-party
applications
MPX Resource Only Export resource information to
Microsoft Project or other third-party
applications
Microsoft Project
XML
Project Export project information to
Microsoft Project
P3 Project Export complete project information
to Oracle Primavera Project Planner
3.x
XLS Activities Export activity information to
Microsoft Excel
XLS Activity Relationships Export activity relationships, such as
predecessor and successor IDs, to
Microsoft Excel
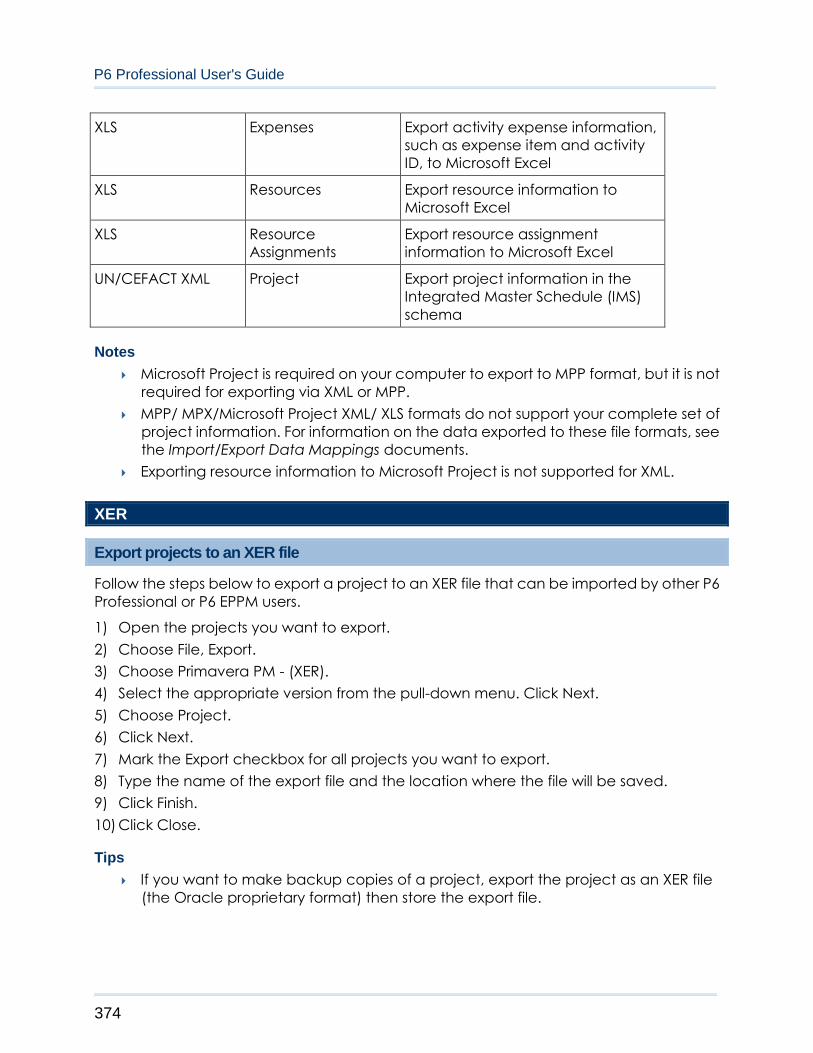
P6 Professional User's Guide
374
XLS Expenses Export activity expense information,
such as expense item and activity
ID, to Microsoft Excel
XLS Resources Export resource information to
Microsoft Excel
XLS Resource
Assignments
Export resource assignment
information to Microsoft Excel
UN/CEFACT XML Project Export project information in the
Integrated Master Schedule (IMS)
schema
Notes
Microsoft Project is required on your computer to export to MPP format, but it is not
required for exporting via XML or MPP.
MPP/ MPX/Microsoft Project XML/ XLS formats do not support your complete set of
project information. For information on the data exported to these file formats, see
the Import/Export Data Mappings documents.
Exporting resource information to Microsoft Project is not supported for XML.
XER
Export projects to an XER file
Follow the steps below to export a project to an XER file that can be imported by other P6
Professional or P6 EPPM users.
1) Open the projects you want to export.
2) Choose File, Export.
3) Choose Primavera PM - (XER).
4) Select the appropriate version from the pull-down menu. Click Next.
5) Choose Project.
6) Click Next.
7) Mark the Export checkbox for all projects you want to export.
8) Type the name of the export file and the location where the file will be saved.
9) Click Finish.
10) Click Close.
Tips
If you want to make backup copies of a project, export the project as an XER file
(the Oracle proprietary format) then store the export file.
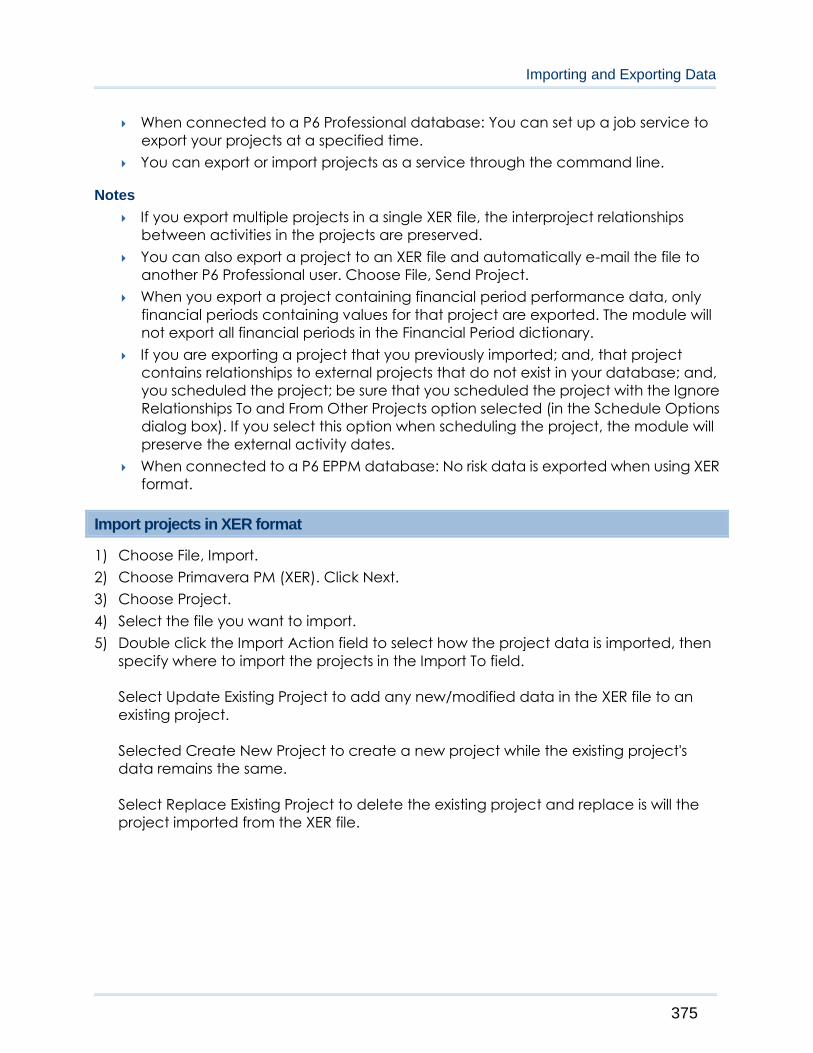
Importing and Exporting Data
375
When connected to a P6 Professional database: You can set up a job service to
export your projects at a specified time.
You can export or import projects as a service through the command line.
Notes
If you export multiple projects in a single XER file, the interproject relationships
between activities in the projects are preserved.
You can also export a project to an XER file and automatically e-mail the file to
another P6 Professional user. Choose File, Send Project.
When you export a project containing financial period performance data, only
financial periods containing values for that project are exported. The module will
not export all financial periods in the Financial Period dictionary.
If you are exporting a project that you previously imported; and, that project
contains relationships to external projects that do not exist in your database; and,
you scheduled the project; be sure that you scheduled the project with the Ignore
Relationships To and From Other Projects option selected (in the Schedule Options
dialog box). If you select this option when scheduling the project, the module will
preserve the external activity dates.
When connected to a P6 EPPM database: No risk data is exported when using XER
format.
Import projects in XER format
1) Choose File, Import.
2) Choose Primavera PM (XER). Click Next.
3) Choose Project.
4) Select the file you want to import.
5) Double click the Import Action field to select how the project data is imported, then
specify where to import the projects in the Import To field.
Select Update Existing Project to add any new/modified data in the XER file to an
existing project.
Selected Create New Project to create a new project while the existing project's
data remains the same.
Select Replace Existing Project to delete the existing project and replace is will the
project imported from the XER file.

P6 Professional User's Guide
376
6) Choose the data to import by modifying the layout configuration in the Update
Project Options dialog box (if necessary).
In the Modify Import Configuration dialog box, select the data you want to modify. If
resource security is enabled, some restrictions apply when importing activity resource
assignments.
Select the action to perform during the import process. Mark the Delete checkbox to
remove unreferenced data (i.e., data in the project you are updating but is not
included in the import file) from the project. (The Delete field applies only to
relationships to external projects, thresholds, activities, activity relationships, and
activity resource assignments. Global data types are not affected by this setting.)
7) Select the currency in which to import cost fields. (This dialog box only displays if the
import file does not specify a currency, or if the currency does not match a currency
defined in P6 Professional when P6 Professional is connected to a P6 Professional
database and using P6 when connected to a P6 EPPM database.)
8) Click Finish.
9) Click Close.
Notes
When you import an XER project file that contains financial periods, the financial
periods in the XER file must exactly match the financial periods in the Financial
Periods dictionary. If they do not match, no past period actual data will be
imported.
When selecting the import action, you must select the Create New Project option
if you want P6 Professional to import past period actual data. If you choose any
other option, past period actual values are not imported.
For projects containing WBS Summary tasks, you should not choose to delete
unreferenced data (Step 6 above). If you choose to delete unreferenced data, all
WBS Summary tasks will be deleted.
When you import a project that contains relationships to external projects that do
not exist in your database, the module will preserve the external activity dates
when you schedule the project if you select the Ignore Relationships To and From
Other Projects option in the Schedule Options dialog box.
If you manually plan future period distribution for resource/role assignments to
activities, be sure to select the appropriate import action when importing data;
otherwise, manual future period assignment values may be assigned. For
example, if you are updating an existing project with imported data and you
choose to import activity resource assignments, future period assignment values
that exist in the project you are importing will overwrite future period assignment
values in the project you are updating. Therefore, if the project you are importing
does not contain manual future period assignment values and the project you are
updating does contain manual future period assignment values, the manual
future period values will be lost when the same assignment exists in both projects.
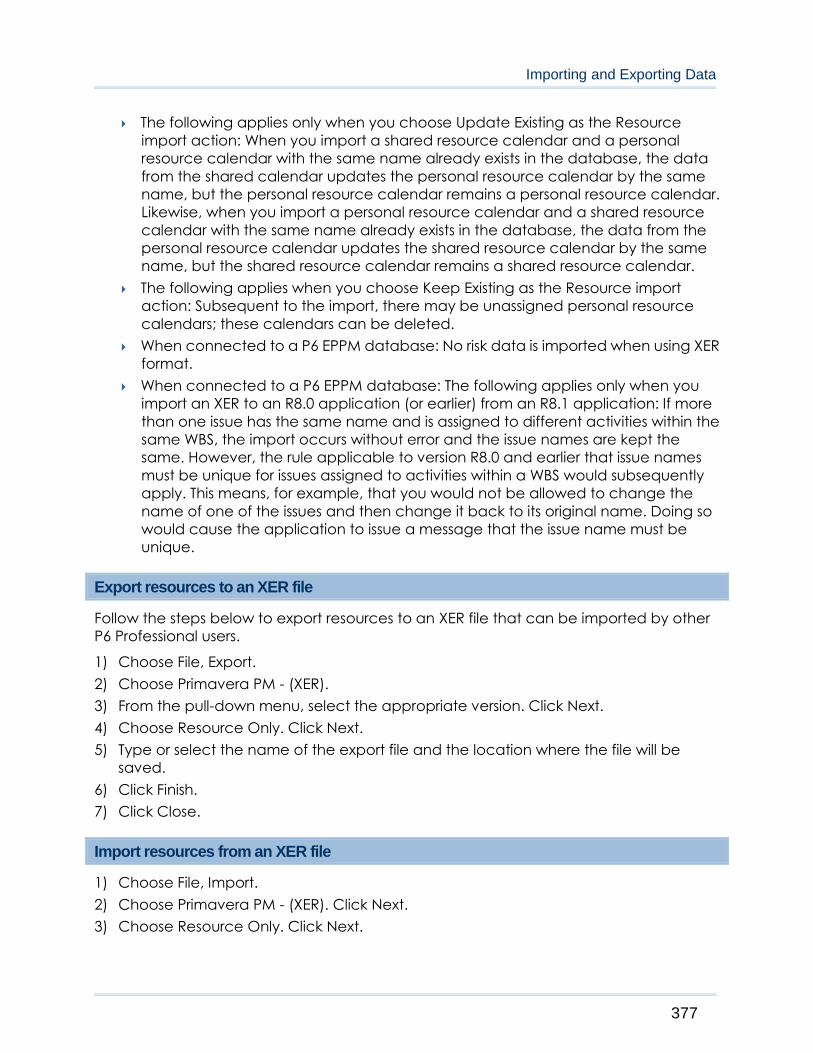
Importing and Exporting Data
377
The following applies only when you choose Update Existing as the Resource
import action: When you import a shared resource calendar and a personal
resource calendar with the same name already exists in the database, the data
from the shared calendar updates the personal resource calendar by the same
name, but the personal resource calendar remains a personal resource calendar.
Likewise, when you import a personal resource calendar and a shared resource
calendar with the same name already exists in the database, the data from the
personal resource calendar updates the shared resource calendar by the same
name, but the shared resource calendar remains a shared resource calendar.
The following applies when you choose Keep Existing as the Resource import
action: Subsequent to the import, there may be unassigned personal resource
calendars; these calendars can be deleted.
When connected to a P6 EPPM database: No risk data is imported when using XER
format.
When connected to a P6 EPPM database: The following applies only when you
import an XER to an R8.0 application (or earlier) from an R8.1 application: If more
than one issue has the same name and is assigned to different activities within the
same WBS, the import occurs without error and the issue names are kept the
same. However, the rule applicable to version R8.0 and earlier that issue names
must be unique for issues assigned to activities within a WBS would subsequently
apply. This means, for example, that you would not be allowed to change the
name of one of the issues and then change it back to its original name. Doing so
would cause the application to issue a message that the issue name must be
unique.
Export resources to an XER file
Follow the steps below to export resources to an XER file that can be imported by other
P6 Professional users.
1) Choose File, Export.
2) Choose Primavera PM - (XER).
3) From the pull-down menu, select the appropriate version. Click Next.
4) Choose Resource Only. Click Next.
5) Type or select the name of the export file and the location where the file will be
saved.
6) Click Finish.
7) Click Close.
Import resources from an XER file
1) Choose File, Import.
2) Choose Primavera PM - (XER). Click Next.
3) Choose Resource Only. Click Next.
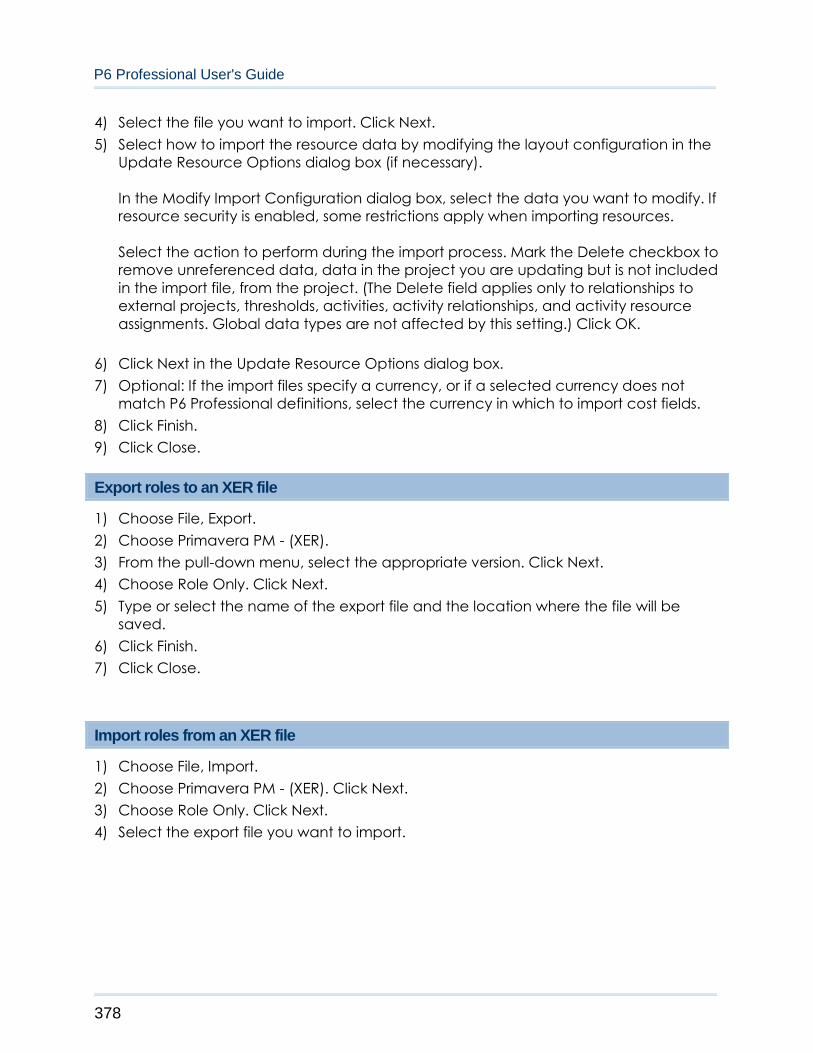
P6 Professional User's Guide
378
4) Select the file you want to import. Click Next.
5) Select how to import the resource data by modifying the layout configuration in the
Update Resource Options dialog box (if necessary).
In the Modify Import Configuration dialog box, select the data you want to modify. If
resource security is enabled, some restrictions apply when importing resources.
Select the action to perform during the import process. Mark the Delete checkbox to
remove unreferenced data, data in the project you are updating but is not included
in the import file, from the project. (The Delete field applies only to relationships to
external projects, thresholds, activities, activity relationships, and activity resource
assignments. Global data types are not affected by this setting.) Click OK.
6) Click Next in the Update Resource Options dialog box.
7) Optional: If the import files specify a currency, or if a selected currency does not
match P6 Professional definitions, select the currency in which to import cost fields.
8) Click Finish.
9) Click Close.
Export roles to an XER file
1) Choose File, Export.
2) Choose Primavera PM - (XER).
3) From the pull-down menu, select the appropriate version. Click Next.
4) Choose Role Only. Click Next.
5) Type or select the name of the export file and the location where the file will be
saved.
6) Click Finish.
7) Click Close.
Import roles from an XER file
1) Choose File, Import.
2) Choose Primavera PM - (XER). Click Next.
3) Choose Role Only. Click Next.
4) Select the export file you want to import.
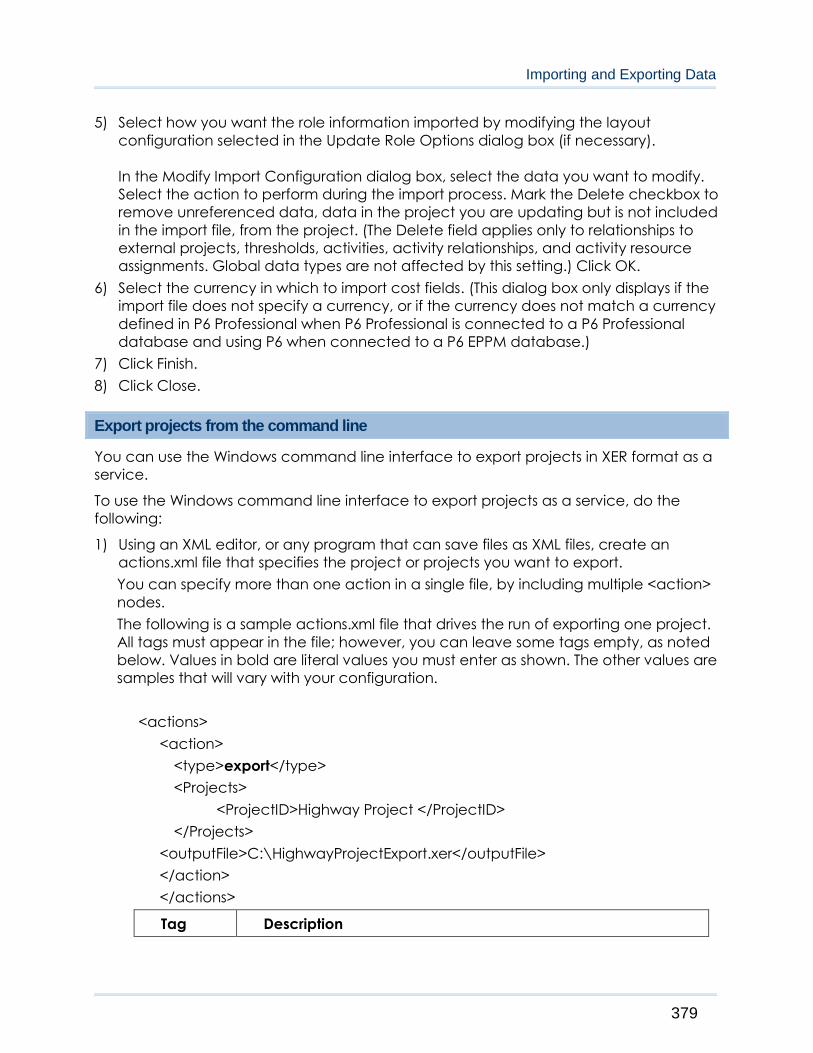
Importing and Exporting Data
379
5) Select how you want the role information imported by modifying the layout
configuration selected in the Update Role Options dialog box (if necessary).
In the Modify Import Configuration dialog box, select the data you want to modify.
Select the action to perform during the import process. Mark the Delete checkbox to
remove unreferenced data, data in the project you are updating but is not included
in the import file, from the project. (The Delete field applies only to relationships to
external projects, thresholds, activities, activity relationships, and activity resource
assignments. Global data types are not affected by this setting.) Click OK.
6) Select the currency in which to import cost fields. (This dialog box only displays if the
import file does not specify a currency, or if the currency does not match a currency
defined in P6 Professional when P6 Professional is connected to a P6 Professional
database and using P6 when connected to a P6 EPPM database.)
7) Click Finish.
8) Click Close.
Export projects from the command line
You can use the Windows command line interface to export projects in XER format as a
service.
To use the Windows command line interface to export projects as a service, do the
following:
1) Using an XML editor, or any program that can save files as XML files, create an
actions.xml file that specifies the project or projects you want to export.
You can specify more than one action in a single file, by including multiple <action>
nodes.
The following is a sample actions.xml file that drives the run of exporting one project.
All tags must appear in the file; however, you can leave some tags empty, as noted
below. Values in bold are literal values you must enter as shown. The other values are
samples that will vary with your configuration.
<actions>
<action>
<type>export</type>
<Projects>
<ProjectID>Highway Project </ProjectID>
</Projects>
<outputFile>C:\HighwayProjectExport.xer</outputFile>
</action>
</actions>
Tag Description

P6 Professional User's Guide
380
<type> Required. The type of action to take. For project exporting,
type is export. Note that export is case sensitive.
<Project
ID>
Required. Specify one or more valid project IDs. (Do not enter
an EPS ID.) You can specify multiple project IDs by specifying a
list of projects separately, each with a separate tag on its own
line, such as shown below:
<ProjectID>Highway Project </ProjectID>
<ProjectID>RSCD</ProjectID>
<outputFil
e>
Required. Must be set to a valid path and filename, for
example, to C:\HighwayProjectExport.xer.
Note:
If you include non-English characters in the actions.xml file, save the file as Unicode
and use the XML encoding attribute to specify the language, prior to the <actions>
tag. For example, to specify German or French encoding:
<?xml version="1.0" encoding="windows-1252"?>
If you are using a batch file, use the chcp command to specify the appropriate
language encoding. See Microsoft.com for more internationalization details.
2) Close P6 Professional if it is running.
3) On the Windows command line, a batch file, or code, issue a command in the
following form from the folder where PM.EXE is located:
PM.EXE /username=<name>
[/password=<name>]
[/alias=<name>] /actionScript=<path>
[/logfile=<path>]
Parameter Description
/username=<
name> Required. The username to log in to P6 Professional.
/password=<
name>
The password for the username, if there is one for the
username.
/alias=<name
>
Optional. The name of an existing destination database
alias. If you do not specify an alias, the most recently
accessed alias is used.
/actionScript
=<path>
Required. The full path to the edited actions.xml file. You
must include the file name.
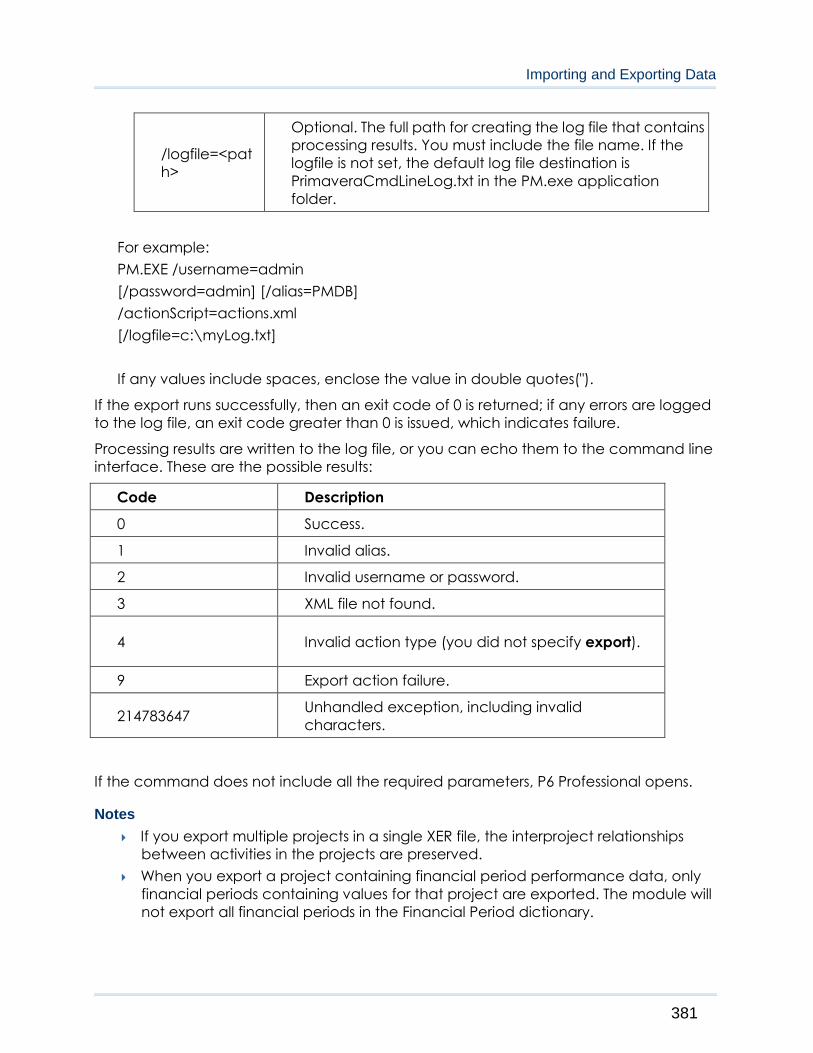
Importing and Exporting Data
381
/logfile=<pat
h>
Optional. The full path for creating the log file that contains
processing results. You must include the file name. If the
logfile is not set, the default log file destination is
PrimaveraCmdLineLog.txt in the PM.exe application
folder.
For example:
PM.EXE /username=admin
[/password=admin] [/alias=PMDB]
/actionScript=actions.xml
[/logfile=c:\myLog.txt]
If any values include spaces, enclose the value in double quotes(").
If the export runs successfully, then an exit code of 0 is returned; if any errors are logged
to the log file, an exit code greater than 0 is issued, which indicates failure.
Processing results are written to the log file, or you can echo them to the command line
interface. These are the possible results:
Code Description
0 Success.
1 Invalid alias.
2 Invalid username or password.
3 XML file not found.
4 Invalid action type (you did not specify export).
9 Export action failure.
214783647 Unhandled exception, including invalid
characters.
If the command does not include all the required parameters, P6 Professional opens.
Notes
If you export multiple projects in a single XER file, the interproject relationships
between activities in the projects are preserved.
When you export a project containing financial period performance data, only
financial periods containing values for that project are exported. The module will
not export all financial periods in the Financial Period dictionary.
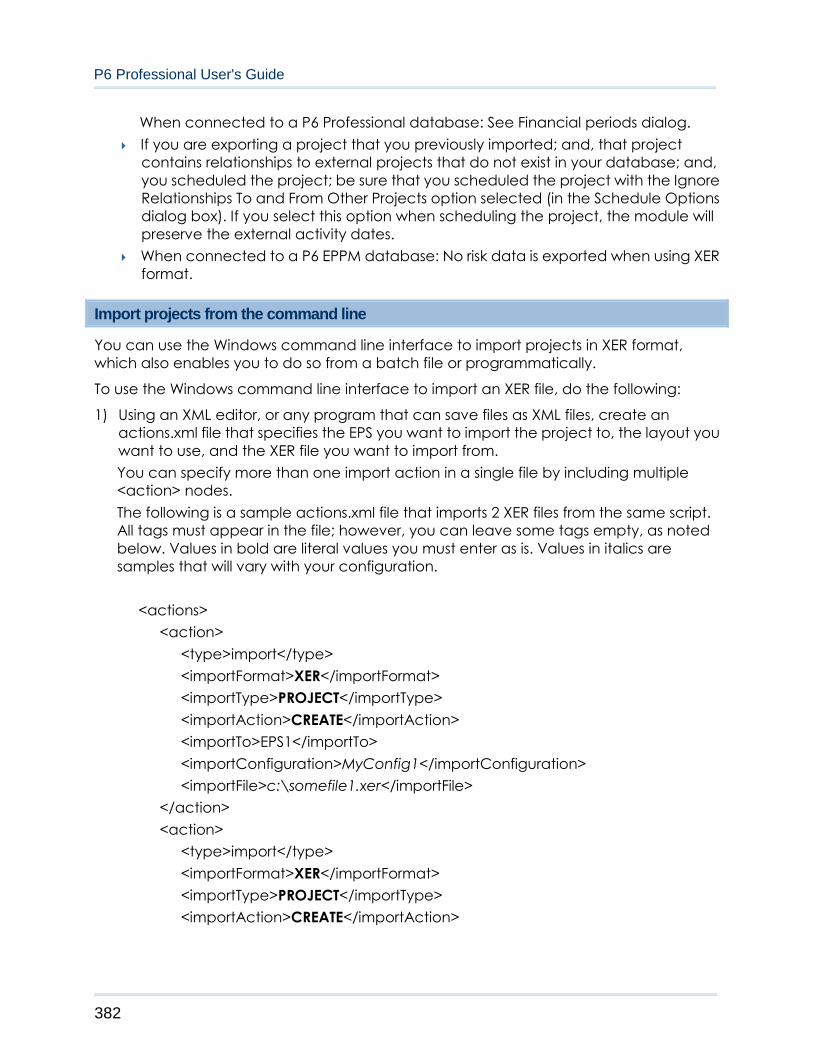
P6 Professional User's Guide
382
When connected to a P6 Professional database: See Financial periods dialog.
If you are exporting a project that you previously imported; and, that project
contains relationships to external projects that do not exist in your database; and,
you scheduled the project; be sure that you scheduled the project with the Ignore
Relationships To and From Other Projects option selected (in the Schedule Options
dialog box). If you select this option when scheduling the project, the module will
preserve the external activity dates.
When connected to a P6 EPPM database: No risk data is exported when using XER
format.
Import projects from the command line
You can use the Windows command line interface to import projects in XER format,
which also enables you to do so from a batch file or programmatically.
To use the Windows command line interface to import an XER file, do the following:
1) Using an XML editor, or any program that can save files as XML files, create an
actions.xml file that specifies the EPS you want to import the project to, the layout you
want to use, and the XER file you want to import from.
You can specify more than one import action in a single file by including multiple
<action> nodes.
The following is a sample actions.xml file that imports 2 XER files from the same script.
All tags must appear in the file; however, you can leave some tags empty, as noted
below. Values in bold are literal values you must enter as is. Values in italics are
samples that will vary with your configuration.
<actions>
<action>
<type>import</type>
<importFormat>XER</importFormat>
<importType>PROJECT</importType>
<importAction>CREATE</importAction>
<importTo>EPS1</importTo>
<importConfiguration>MyConfig1</importConfiguration>
<importFile>c:\somefile1.xer</importFile>
</action>
<action>
<type>import</type>
<importFormat>XER</importFormat>
<importType>PROJECT</importType>
<importAction>CREATE</importAction>

Importing and Exporting Data
383
<importTo>EPS2</importTo>
<importConfiguration>MyConfig2</importConfiguration>
<importFile>c:\somefile2.xer</importFile>
</action>
</actions>
Tag Description
<type>
Required. The type of action to take. For project
importing, type is import. Note that import is case
sensitive.
<importFormat> Required. The format being imported. Value must be
XER.
<importType> Required. The type data being imported. Value must
be PROJECT.
<importAction> Required. The action to take while importing. Value
must be CREATE.
<importTo>
Optional. The short name of the EPS element you are
importing to. This name must exist in the destination
database. If you do not provide a name, the default
EPS is used.
<importConfigur
ation>
Optional. The import configuration to use while
importing. This name must exist in the destination
database. If you do not provide a name, the default
import configuration used.
<importFile> Required. The full path to the XER file you want to
import.
Note:
If you include non-English characters in the actions.xml file, save the file as Unicode
and use the XML encoding attribute to specify the language, prior to the <actions>
tag. For example, to specify German or French encoding:
<?xml version="1.0" encoding="windows-1252"?>
If you are using a batch file, use the chcp command to specify the appropriate
language encoding. See Microsoft.com for more internationalization details.
2) Close P6 Professional if it is running.
3) On the Windows command line, a batch file, or code, issue a command in the
following form from the folder where PM.EXE is located:
PM.EXE /username=<name>

P6 Professional User's Guide
384
[/password=<name>]
[/alias=<name>] /actionScript=<path>
[/logfile=<path>]
Parameter Description
/username=<
name> Required. The username to log in to P6 Professional.
/password=<
name>
The password for the username, if there is one for the
username.
/alias=<name
>
Optional. The name of an existing destination database
alias. If you do not specify an alias, the most recently
accessed alias is used.
/actionScript
=<path>
The full path to the actions.xml file you created. You must
include the file name.
/logfile=<pat
h>
Optional. The full path for creating the log file that contains
processing results. You must include the file name. If the
logfile is not set, the default log file destination is
PrimaveraCmdLineLog.txt in the PM.exe application
folder.
For example:
PM.EXE /username=admin /password=admin /alias=PMDB
/actionScript=c:\somefolder\importprojects.xml/logfile=c:\somefolder\myLog.txt
If any values include spaces, enclose the value in double quotes("). For example:
PM.EXE /username=admin /password=admin /alias=PMDB
/actionScript="c:\somefolder\importprojects.xml" /logfile="c:\somefolder\myLog.txt"
If the import runs successfully, then an exit code of 0 is returned; if any errors are logged
to the log file, an exit code greater than 0 is issued, which indicates failure.
Processing results are written to the log file, or you can echo them to the command line
interface. These are the possible results:
Code Description
0 Success.
1 Invalid alias.
2 Invalid username or password.
3 XML file not found.
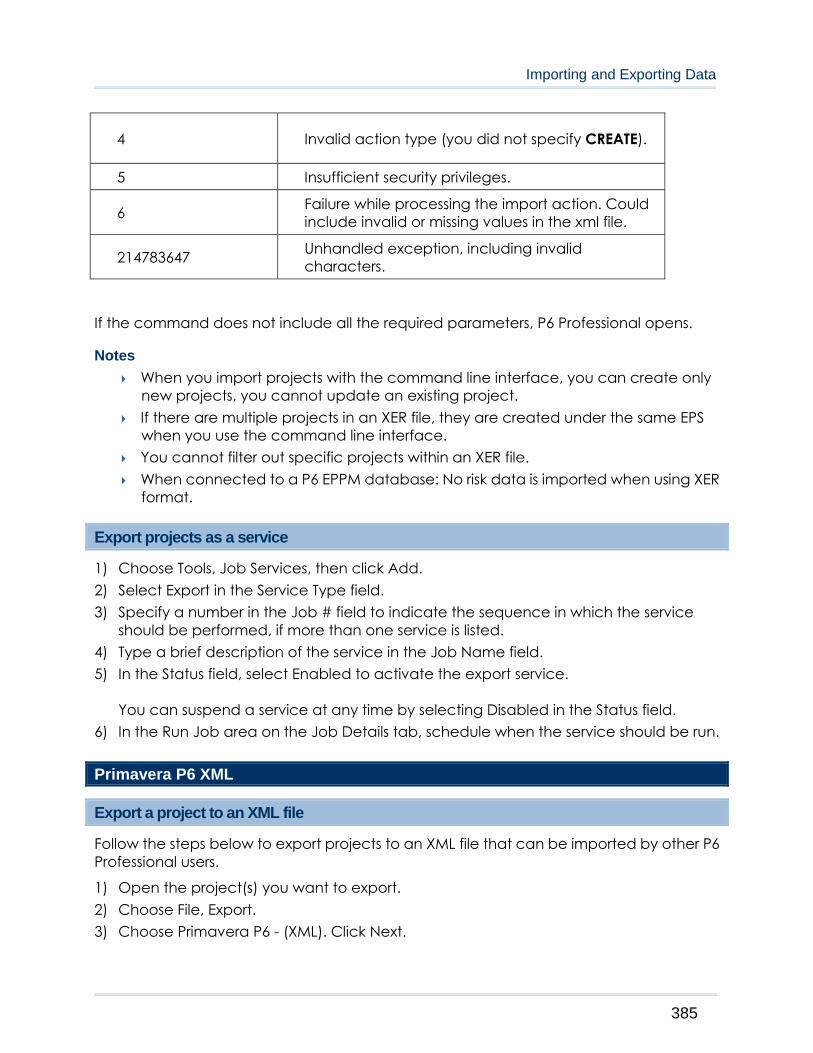
Importing and Exporting Data
385
4 Invalid action type (you did not specify CREATE).
5 Insufficient security privileges.
6 Failure while processing the import action. Could
include invalid or missing values in the xml file.
214783647 Unhandled exception, including invalid
characters.
If the command does not include all the required parameters, P6 Professional opens.
Notes
When you import projects with the command line interface, you can create only
new projects, you cannot update an existing project.
If there are multiple projects in an XER file, they are created under the same EPS
when you use the command line interface.
You cannot filter out specific projects within an XER file.
When connected to a P6 EPPM database: No risk data is imported when using XER
format.
Export projects as a service
1) Choose Tools, Job Services, then click Add.
2) Select Export in the Service Type field.
3) Specify a number in the Job # field to indicate the sequence in which the service
should be performed, if more than one service is listed.
4) Type a brief description of the service in the Job Name field.
5) In the Status field, select Enabled to activate the export service.
You can suspend a service at any time by selecting Disabled in the Status field.
6) In the Run Job area on the Job Details tab, schedule when the service should be run.
Primavera P6 XML
Export a project to an XML file
Follow the steps below to export projects to an XML file that can be imported by other P6
Professional users.
1) Open the project(s) you want to export.
2) Choose File, Export.
3) Choose Primavera P6 - (XML). Click Next.
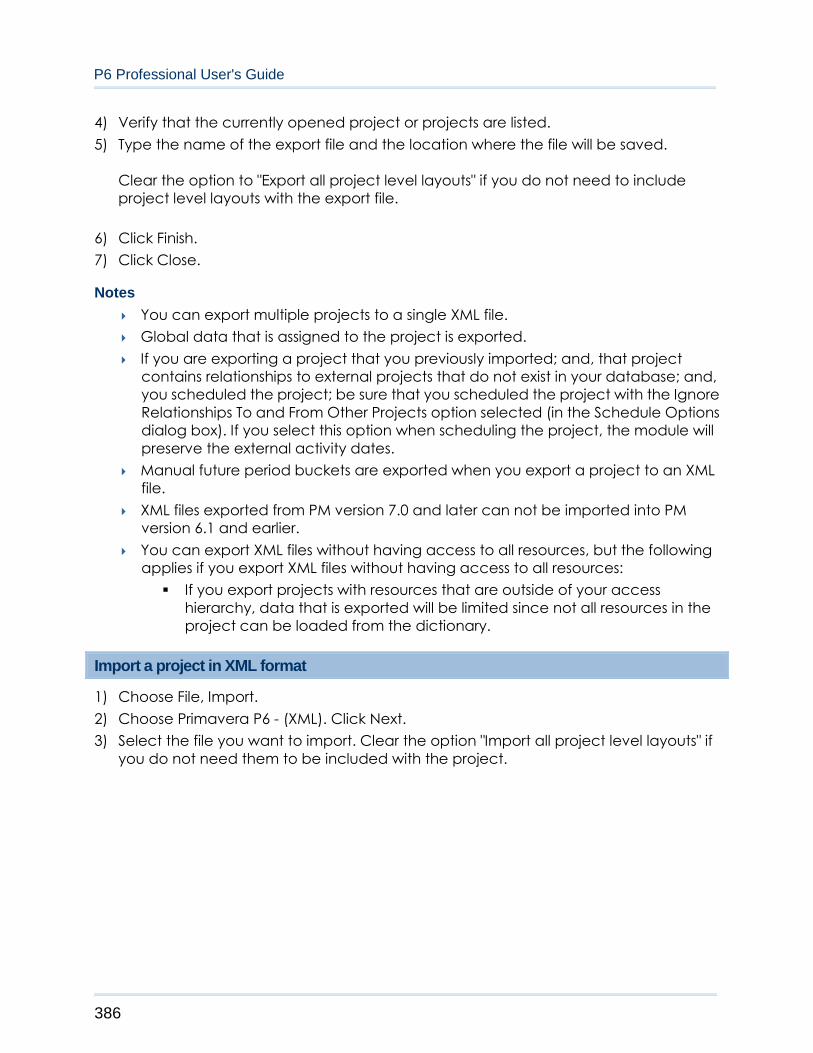
P6 Professional User's Guide
386
4) Verify that the currently opened project or projects are listed.
5) Type the name of the export file and the location where the file will be saved.
Clear the option to "Export all project level layouts" if you do not need to include
project level layouts with the export file.
6) Click Finish.
7) Click Close.
Notes
You can export multiple projects to a single XML file.
Global data that is assigned to the project is exported.
If you are exporting a project that you previously imported; and, that project
contains relationships to external projects that do not exist in your database; and,
you scheduled the project; be sure that you scheduled the project with the Ignore
Relationships To and From Other Projects option selected (in the Schedule Options
dialog box). If you select this option when scheduling the project, the module will
preserve the external activity dates.
Manual future period buckets are exported when you export a project to an XML
file.
XML files exported from PM version 7.0 and later can not be imported into PM
version 6.1 and earlier.
You can export XML files without having access to all resources, but the following
applies if you export XML files without having access to all resources:
If you export projects with resources that are outside of your access
hierarchy, data that is exported will be limited since not all resources in the
project can be loaded from the dictionary.
Import a project in XML format
1) Choose File, Import.
2) Choose Primavera P6 - (XML). Click Next.
3) Select the file you want to import. Clear the option "Import all project level layouts" if
you do not need them to be included with the project.

Importing and Exporting Data
387
4) Double click the Import Action field to select how the project data is imported, then
specify where to import the projects in the Import To field.
Select Update Existing Project to add any new/modified data in the XML file to an
existing project.
Selected Create New Project to create a new project while the existing project's
data remains the same.
Select Ignore this Project to not import the selected projects.
5) Choose the data to import by adding or editing a template in the Update Project
Options dialog box (if necessary).
In the Update Project Options dialog box, you can search for templates using the
Search field. As you type, it will filter only those templates that match the text in this
field.
6) Click Edit to launch the Import Options dialog box.
7) On the Basic tab of the Import Options dialog box, modify the selected option by
choosing the action to take when the same data exists in the import file and the
project being updated. If resource security is enabled, some restrictions apply when
importing activity resource assignments.
Select the action to perform during the import process. Mark the Delete checkbox to
remove unreferenced data (i.e., data in the project you are updating but is not
included in the import file) from the project. (The Delete field applies only to
relationships to external projects, thresholds, activities, activity relationships, and
activity resource assignments. Global data types are not affected by this setting.)
8) On the Advanced tab of the Import Options dialog box, modify global data,
including codes, UDFs, calendars, and resources, as necessary.
Note: This tab is disabled if multiple projects are being imported.
However, if you select the "Ignore this Project" option for all projects
but one, this tab is enabled.
9) Click Save to update the existing template or click Save As to create a new template
with a unique name.
Click Next.
10) Click Finish.
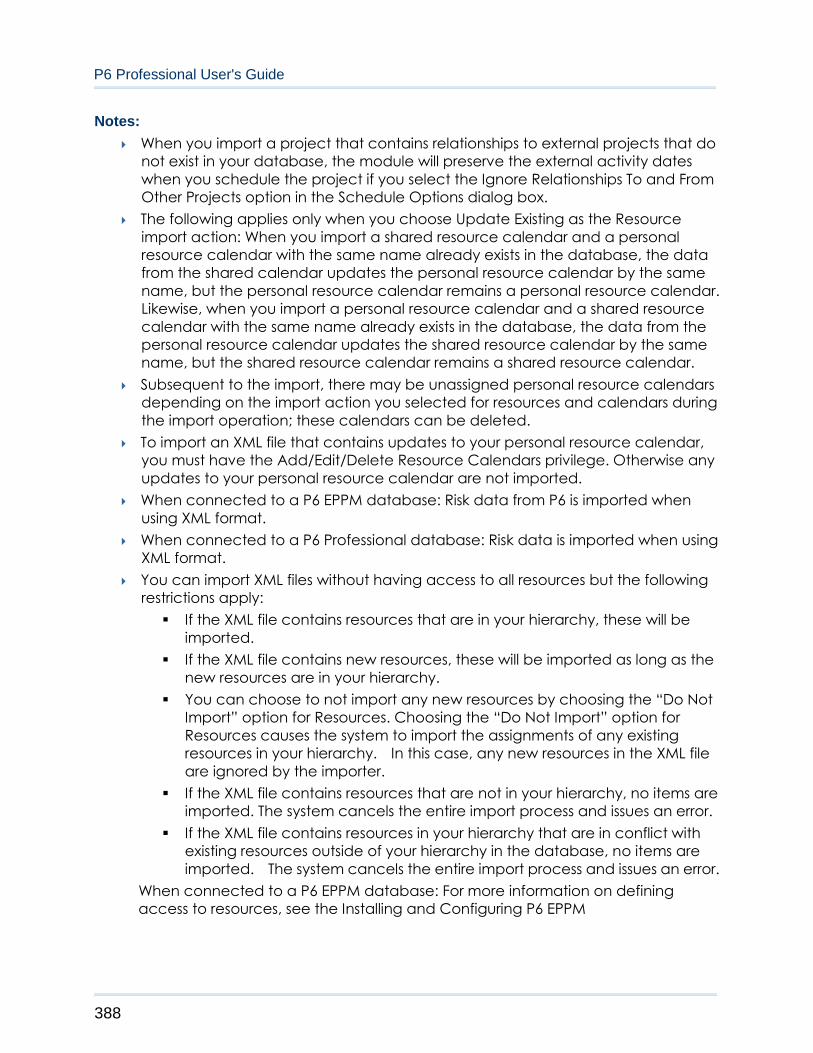
P6 Professional User's Guide
388
Notes:
When you import a project that contains relationships to external projects that do
not exist in your database, the module will preserve the external activity dates
when you schedule the project if you select the Ignore Relationships To and From
Other Projects option in the Schedule Options dialog box.
The following applies only when you choose Update Existing as the Resource
import action: When you import a shared resource calendar and a personal
resource calendar with the same name already exists in the database, the data
from the shared calendar updates the personal resource calendar by the same
name, but the personal resource calendar remains a personal resource calendar.
Likewise, when you import a personal resource calendar and a shared resource
calendar with the same name already exists in the database, the data from the
personal resource calendar updates the shared resource calendar by the same
name, but the shared resource calendar remains a shared resource calendar.
Subsequent to the import, there may be unassigned personal resource calendars
depending on the import action you selected for resources and calendars during
the import operation; these calendars can be deleted.
To import an XML file that contains updates to your personal resource calendar,
you must have the Add/Edit/Delete Resource Calendars privilege. Otherwise any
updates to your personal resource calendar are not imported.
When connected to a P6 EPPM database: Risk data from P6 is imported when
using XML format.
When connected to a P6 Professional database: Risk data is imported when using
XML format.
You can import XML files without having access to all resources but the following
restrictions apply:
If the XML file contains resources that are in your hierarchy, these will be
imported.
If the XML file contains new resources, these will be imported as long as the
new resources are in your hierarchy.
You can choose to not import any new resources by choosing the “Do Not
Import” option for Resources. Choosing the “Do Not Import” option for
Resources causes the system to import the assignments of any existing
resources in your hierarchy. In this case, any new resources in the XML file
are ignored by the importer.
If the XML file contains resources that are not in your hierarchy, no items are
imported. The system cancels the entire import process and issues an error.
If the XML file contains resources in your hierarchy that are in conflict with
existing resources outside of your hierarchy in the database, no items are
imported. The system cancels the entire import process and issues an error.
When connected to a P6 EPPM database: For more information on defining
access to resources, see the Installing and Configuring P6 EPPM

Importing and Exporting Data
389
When connected to a P6 Professional database: For more information on defining
access to resources, see the P6 Professional for P6 EPPM Installation and
Configuration Guide.
P3
Export a project for use with P3
1) Open the projects you want to export.
2) Choose File, Export.
3) Choose Primavera Project Planner (P3). Click Next.
4) Mark the Export checkbox for the project you want to export. Click Next.
5) Type a name for the exported project and select the location where the file will be
saved. Click Next.
6) Choose the default planning unit, then mark the appropriate checkboxes to indicate
how P3 should calculate costs in the project.
7) Click Finish.
8) Click Close.
Considerations when exporting projects to P3
The following subsections describe how the associated data items are transferred from
P6 Professional to P3 3.x.
Activity codes
P3 3.x supports up to 10 characters for the activity code value length; P6 Professional
allows a maximum of 20 characters. P3 3.x truncates P6 Professional code values to 10
characters. The maximum number of activity codes in P3 3.x is 20, and the total of the
lengths assigned to the codes cannot exceed 64. You can create an unlimited number
of codes in P6 Professional. When you export a P6 Professional project to P3 3.x, only the
first 64 characters of activity codes are converted to P3 3.x.
Also, P6 Professional exports the first four letters of the activity code description to P3 3.x
as the activity code name. For example, if the activity code description is Responsibility in
P6 Professional, the module will export RESP as the activity code name in P3 3.x.
Activity IDs
In P6 Professional, activity IDs can contain 20 characters, while in P3 3.x, they are limited
to 10 characters. P3 3.x truncates P6 Professional’s activity IDs to 10 characters. When
duplicate IDs exist, the first eight characters of the activity ID are converted and P3 3.x
increments the last two characters starting with 00. For example, P6 Professional’s activity
IDs ABCDEFGHIJKLMNOPQRST and ABCDEFGHIJKLMNOPPPP are converted to
ABCDEFGHIJ and ABCDEFGH00 in P3 3.x.
Calendars
P6 Professional User's Guide
390
In P6 Professional you can create an unlimited number of global, project, and resource
calendars. Global and project calendars can be assigned to activities; global and
resource calendars can be assigned at the resource level. In P3 3.x, you can create one
global calendar, 31 project calendars, and an unlimited number of resource calendars.
When you import a P6 Professional project to P3 3.x, the global calendar in P3 3.x is not
changed. All resource calendars are imported to P3 3.x.
Note
Resource holidays and exceptions are not converted to P3 3.x. Only the standard
worktime is converted. For example, if a resource calendar’s standard worktime is
three days per week, then the resource calendar is imported with a standard
worktime of three days per week. No other nonworktime is imported.
If P6 Professional contains less than 31 calendars (global plus project), the calendars are
imported directly to the project calendars in P3 3.x. However, if contains more than 31
calendars, only the first 30 calendars assigned are exported. These calendars are
assigned numbers 2 to 31 in P3 3.x. Any activity in P6 Professional assigned to a calendar
that is not exported is assigned to Calendar 1, the standard five-day, eight-hour calendar
in P3 3.x.
You can define work hours in P6 Professional in half hour increments. The smallest unit in
P3 3.x is hour. If one half of an hour is work time and the other half is nonworktime in P6
Professional, the entire hour will be nonworktime in P3 3.x.
Cost accounts
The Cost Accounts Dictionary for both P6 Professional and P3 3.x can contain an
unlimited number of cost accounts; however, in P6 Professional the dictionary is global,
while in P3 3.x it is project-specific. Only the cost accounts assigned in P6 for the P6
Professional project are converted to P3 3.x. In P6 and P6 Professional, cost accounts can
contain 15 characters; in P3 3.x they can contain 12 characters. P3 3.x truncates cost
accounts to 12 characters. When duplicate accounts exist, P3 3.x automatically
increments the last two characters of the account.
Custom data items
The first eight custom data items in P6 Professional are converted to P3 3.x.
Duration types
P6 Professional’s duration types control the way resource and activity dates are
scheduled. Duration types are similar to Autocost rules in P3 3.x. When the duration type
in P6 Professional is Fixed Units or Fixed Units/Time, the resource assignment becomes
driving in P3 3.x. When the duration type in P6 Professional is Fixed Duration & Units/Time or
Fixed Duration & Units, the resource assignment becomes nondriving in P3 3.x. Using Fixed
Duration & Units/Time is comparable to marking the Freeze Resource Units per Timeperiod
checkbox in P3 3.x.
Expenses
Importing and Exporting Data
391
All expenses become resource assignments in P3 3.x. An “expense” cost account is
assigned to the resource assignment if a cost account is not already assigned.
Manual future period buckets
When you export a P6 Professional project that contains manual future period
assignment buckets, the total units for assignments with manual future period buckets are
spread evenly over the planned duration of the assignment in P3; the values you
manually entered are not saved.
Notebooks
In P6 Professional, each activity is assigned a Notebook field, which can contain up to
32,000 characters. P3 3.x contains 99 log records. Each log can contain 48 characters.
Notebooks are converted to logs in P3 3.x, but the information is truncated if it does not fit
in the 99 log records.
Project codes
P3 3.x supports up to 10 project codes. All project codes assigned to the P6 Professional
project are exported. However, only the first 10 project codes exported are imported to
P3 3.x.
Project level calculations
In P6 Professional, you can choose how you want to update resource assignments.
Choose to Add Actual to Remaining or Subtract Actual from At Completion when
updating Actual Units or Costs. In P3 3.x this setting is the same as the autocost rule, Add
actual to ETC or Subtract actual from EAC.
The Recalculate Actual Units and Cost when duration % complete changes setting
determines if the actual units and cost are updated when the % complete is updated. If
the setting is marked, both the Actual quantity to date and Actual cost to date fields are
marked in the autocost settings in P3 3.x. If it is not marked in P6 Professional, neither field
is marked in P3 3.x.
The Link actual to date and actual this period units and costs field converts to the Link
actual to date and actual this period autocost rule in P3 3.x
Resources
P6 Professional contains a global dictionary of resources that are used for all projects in
the organization. P3 3.x stores resources at the project level. Only resources assigned to
activities in the project being exported are imported into P3 3.x. The resource ID in P6
Professional can contain 15 characters; resource IDs in P3 3.x can contain eight
characters. P3 3.x truncates resource IDs to 8 characters. If duplicate IDs exist, P3 3.x
automatically increments the last two characters of the ID.
Scheduling options
The following advanced scheduling options convert to P3 3.x:
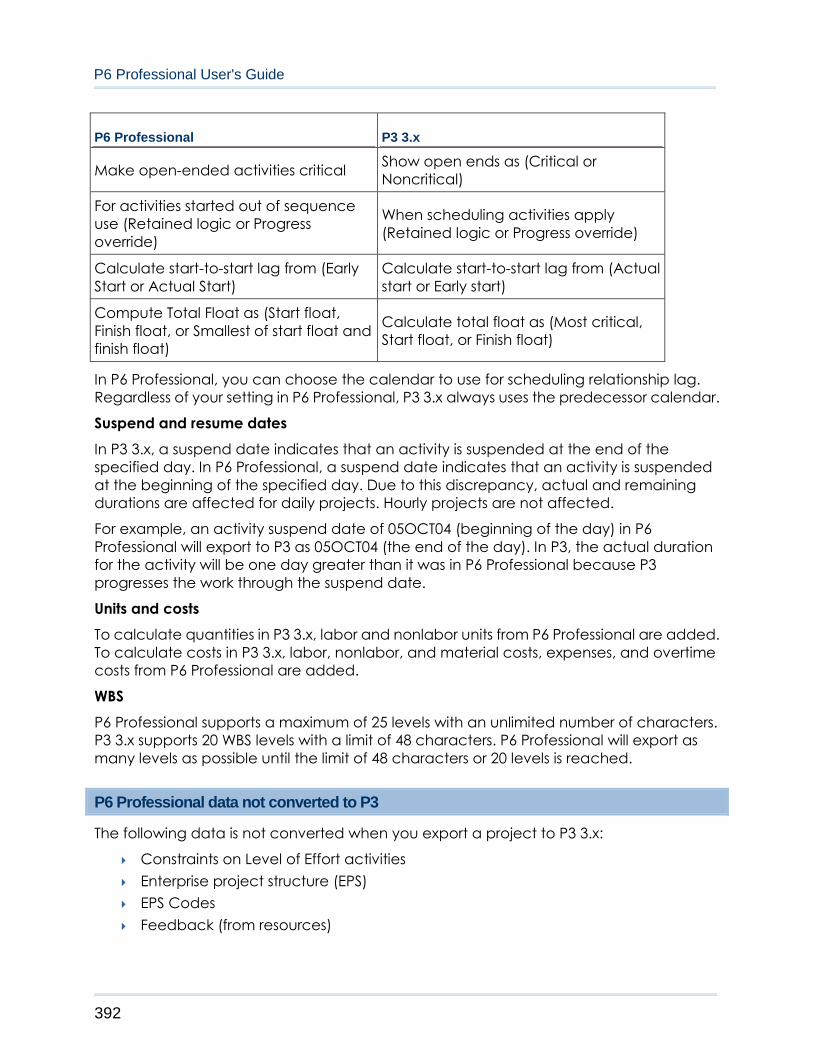
P6 Professional User's Guide
392
P6 Professional P3 3.x
Make open-ended activities critical Show open ends as (Critical or
Noncritical)
For activities started out of sequence
use (Retained logic or Progress
override)
When scheduling activities apply
(Retained logic or Progress override)
Calculate start-to-start lag from (Early
Start or Actual Start)
Calculate start-to-start lag from (Actual
start or Early start)
Compute Total Float as (Start float,
Finish float, or Smallest of start float and
finish float)
Calculate total float as (Most critical,
Start float, or Finish float)
In P6 Professional, you can choose the calendar to use for scheduling relationship lag.
Regardless of your setting in P6 Professional, P3 3.x always uses the predecessor calendar.
Suspend and resume dates
In P3 3.x, a suspend date indicates that an activity is suspended at the end of the
specified day. In P6 Professional, a suspend date indicates that an activity is suspended
at the beginning of the specified day. Due to this discrepancy, actual and remaining
durations are affected for daily projects. Hourly projects are not affected.
For example, an activity suspend date of 05OCT04 (beginning of the day) in P6
Professional will export to P3 as 05OCT04 (the end of the day). In P3, the actual duration
for the activity will be one day greater than it was in P6 Professional because P3
progresses the work through the suspend date.
Units and costs
To calculate quantities in P3 3.x, labor and nonlabor units from P6 Professional are added.
To calculate costs in P3 3.x, labor, nonlabor, and material costs, expenses, and overtime
costs from P6 Professional are added.
WBS
P6 Professional supports a maximum of 25 levels with an unlimited number of characters.
P3 3.x supports 20 WBS levels with a limit of 48 characters. P6 Professional will export as
many levels as possible until the limit of 48 characters or 20 levels is reached.
P6 Professional data not converted to P3
The following data is not converted when you export a project to P3 3.x:
Constraints on Level of Effort activities
Enterprise project structure (EPS)
EPS Codes
Feedback (from resources)
Importing and Exporting Data
393
Financial periods
Issues
Manual future period buckets
OBS
Past period actuals
Resource curves
When connected to a P6 Professional database: Risks
Roles
Secure codes
Steps
Thresholds
Work products and documents
Import a P3 project
1) Choose File, Import.
2) Choose Primavera Project Planner - (P3). Click Next.
3) Select the location and project group(s) that contains the project(s) you want to
import.
You can select one or more project groups. You should select multiple project groups
only when you want to import all subprojects contained in each project group. You
should import project groups individually when you want to specify the subprojects to
import.
Note:
The import wizard displays different screens and options when you import a single
project group versus multiple project groups.
P6 Professional User's Guide
394
4) If you chose multiple project groups in the previous step, skip to Step 5.
If you chose a single project group in the previous step, clear the checkbox next to
each subproject you do not want to import. You do not have to import the master
project. Then, choose to combine subprojects or create separate projects.
Mark the Combine subprojects option if you want to import the selected projects as
one project rather than separating them into individual projects. For example, in P3
3.x, the project group APEX contains three projects, AUTO, BLDG, and CONV (as
shown in the following figure). If you select the Combine subprojects option, P6
Professional imports one project named APEX with all selected subprojects as WBS
levels.
Mark the Create separate projects option if you want to import each selected
subproject as an individual project. If you select this option, you cannot import the
master project. For example, in P3 3.x, the project group APEX contains three
subprojects, AUTO, BLDG, and CONV. This group is converted to three individual
projects (APEX is not converted). Before the import, create an EPS node to select as
the location for the converted projects.
5) For each project you are importing, select whether to create a new project, replace
an existing project, or update an existing project. Then, specify where to import the
project in the Import To field.
6) Select the parent resource and other elements, depending on the selection you
made in the previous step.
7) Select whether to create a new notebook topic for activity logs or use an existing
notebook.
8) Choose the data to import by modifying the layout configuration in the Update
Project Options dialog box (if necessary).
In the Modify Import Configuration dialog box, select the data you want to modify. If
resource security is enabled, some restrictions apply when importing activity resource
assignments.
Select the action to perform during the import process. Mark the Delete checkbox to
remove unreferenced data, data in the project you are updating but is not included
in the import file, from the project. (The Delete field applies only to relationships to
external projects, thresholds, activities, activity relationships, and activity resource
assignments. Global data types are not affected by this setting.) Click OK.

Importing and Exporting Data
395
9) Click Advanced to indicate how to calculate costs, then set the project options.
Note:
Projects are merged automatically when your Import Type is Replace Existing Project.
If your Import Type is Update Existing Project, projects are merged automatically only
when you import multiple project groups or multiple subprojects (in a single project
group).
10) Click Finish.
11) Click Close.
Considerations when importing P3 projects
Most data is converted directly from P3 3.x to P6 Professional. The subsections below
explain how data is handled after it is imported into P6 Professional and a direct match
does not exist.
Activity codes
P6 Professional contains global and project activity codes. Global activity codes are
provided with the sample data delivered with P6 Professional. If you choose to create
separate projects (rather than combine them) in the Import wizard, all activity codes,
activity ID codes, and alias codes from P3 3.x import as global activity codes in P6
Professional, so they are available to all projects. If you choose to combine subprojects
into one project to import, the activity codes, activity ID codes, and alias codes import as
project-specific activity codes.
Note
Activity code values assigned to activities in P3 3.x that do not exist in the Activity
Codes Dictionary are not converted to P6 Professional.
When activity codes are imported into P6 Professional, the P3 activity code description is
used as the activity code in P6 Professional. For example, if the activity code name in P3
is RESP and the description is Responsibility, then Responsibility is imported as the activity
code in P6 Professional. If there is no description associated with an activity code, then
the four-character name is imported as the activity code.
Activity types
P6 Professional supports the following activity types that correspond to activity types in P3
3.x:
P3 3.x Activity Type P6 Professional Activity Type
Task Task Dependent
Independent Resource Dependent
Start Milestone Start Milestone
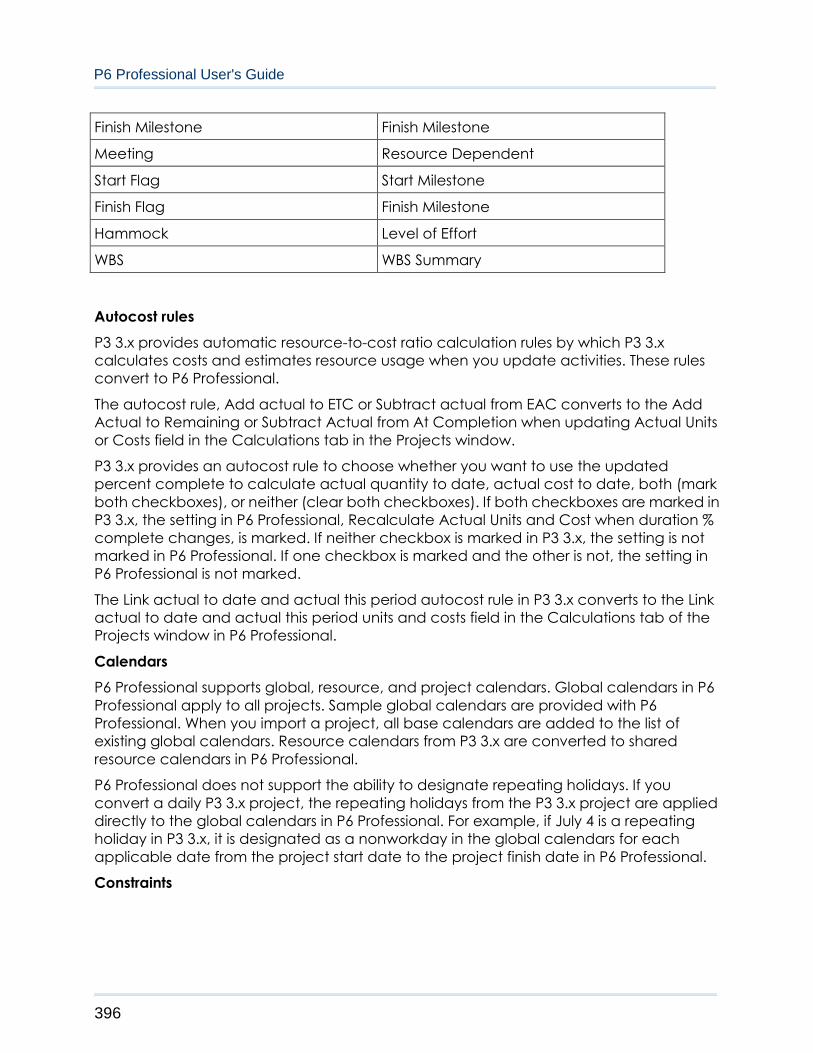
P6 Professional User's Guide
396
Finish Milestone Finish Milestone
Meeting Resource Dependent
Start Flag Start Milestone
Finish Flag Finish Milestone
Hammock Level of Effort
WBS WBS Summary
Autocost rules
P3 3.x provides automatic resource-to-cost ratio calculation rules by which P3 3.x
calculates costs and estimates resource usage when you update activities. These rules
convert to P6 Professional.
The autocost rule, Add actual to ETC or Subtract actual from EAC converts to the Add
Actual to Remaining or Subtract Actual from At Completion when updating Actual Units
or Costs field in the Calculations tab in the Projects window.
P3 3.x provides an autocost rule to choose whether you want to use the updated
percent complete to calculate actual quantity to date, actual cost to date, both (mark
both checkboxes), or neither (clear both checkboxes). If both checkboxes are marked in
P3 3.x, the setting in P6 Professional, Recalculate Actual Units and Cost when duration %
complete changes, is marked. If neither checkbox is marked in P3 3.x, the setting is not
marked in P6 Professional. If one checkbox is marked and the other is not, the setting in
P6 Professional is not marked.
The Link actual to date and actual this period autocost rule in P3 3.x converts to the Link
actual to date and actual this period units and costs field in the Calculations tab of the
Projects window in P6 Professional.
Calendars
P6 Professional supports global, resource, and project calendars. Global calendars in P6
Professional apply to all projects. Sample global calendars are provided with P6
Professional. When you import a project, all base calendars are added to the list of
existing global calendars. Resource calendars from P3 3.x are converted to shared
resource calendars in P6 Professional.
P6 Professional does not support the ability to designate repeating holidays. If you
convert a daily P3 3.x project, the repeating holidays from the P3 3.x project are applied
directly to the global calendars in P6 Professional. For example, if July 4 is a repeating
holiday in P3 3.x, it is designated as a nonworkday in the global calendars for each
applicable date from the project start date to the project finish date in P6 Professional.
Constraints
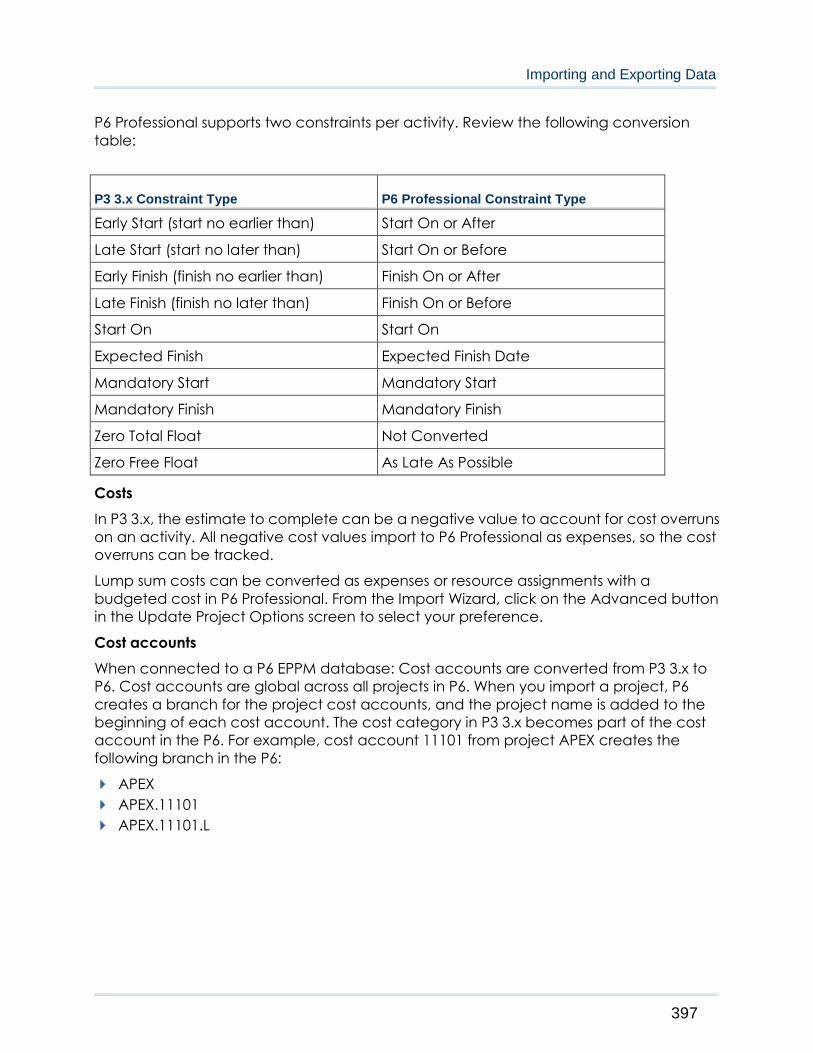
Importing and Exporting Data
397
P6 Professional supports two constraints per activity. Review the following conversion
table:
P3 3.x Constraint Type P6 Professional Constraint Type
Early Start (start no earlier than) Start On or After
Late Start (start no later than) Start On or Before
Early Finish (finish no earlier than) Finish On or After
Late Finish (finish no later than) Finish On or Before
Start On Start On
Expected Finish Expected Finish Date
Mandatory Start Mandatory Start
Mandatory Finish Mandatory Finish
Zero Total Float Not Converted
Zero Free Float As Late As Possible
Costs
In P3 3.x, the estimate to complete can be a negative value to account for cost overruns
on an activity. All negative cost values import to P6 Professional as expenses, so the cost
overruns can be tracked.
Lump sum costs can be converted as expenses or resource assignments with a
budgeted cost in P6 Professional. From the Import Wizard, click on the Advanced button
in the Update Project Options screen to select your preference.
Cost accounts
When connected to a P6 EPPM database: Cost accounts are converted from P3 3.x to
P6. Cost accounts are global across all projects in P6. When you import a project, P6
creates a branch for the project cost accounts, and the project name is added to the
beginning of each cost account. The cost category in P3 3.x becomes part of the cost
account in the P6. For example, cost account 11101 from project APEX creates the
following branch in the P6:
APEX
APEX.11101
APEX.11101.L
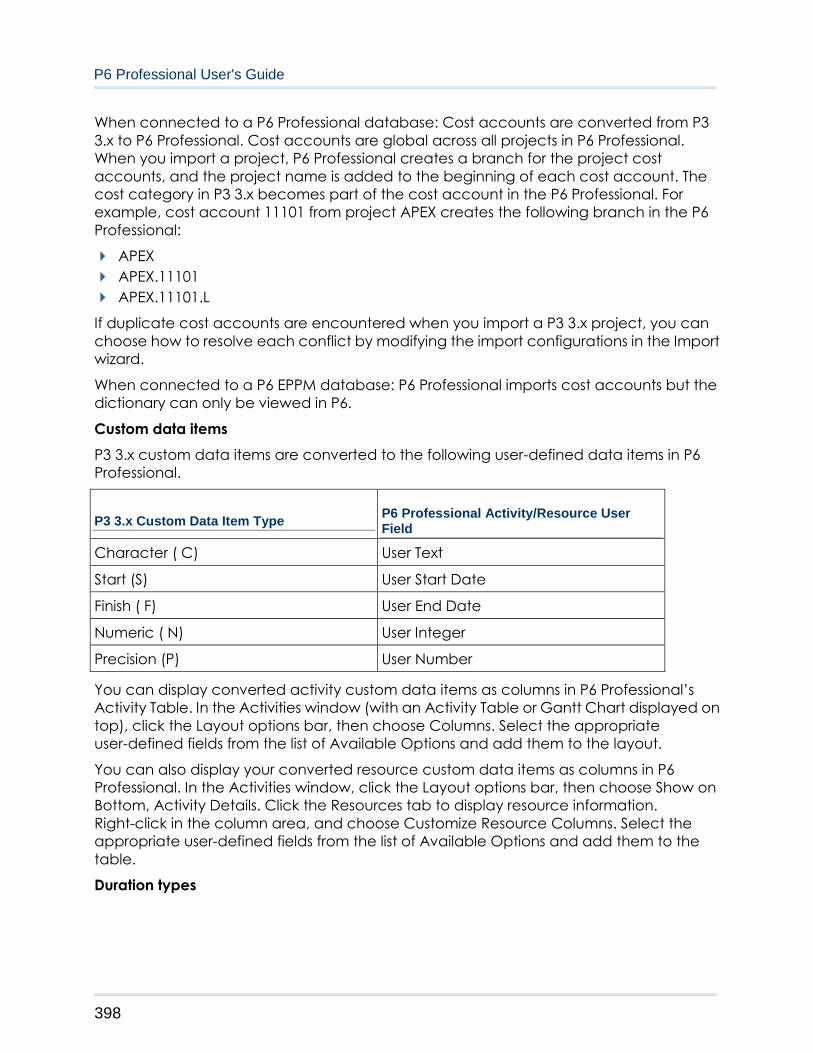
P6 Professional User's Guide
398
When connected to a P6 Professional database: Cost accounts are converted from P3
3.x to P6 Professional. Cost accounts are global across all projects in P6 Professional.
When you import a project, P6 Professional creates a branch for the project cost
accounts, and the project name is added to the beginning of each cost account. The
cost category in P3 3.x becomes part of the cost account in the P6 Professional. For
example, cost account 11101 from project APEX creates the following branch in the P6
Professional:
APEX
APEX.11101
APEX.11101.L
If duplicate cost accounts are encountered when you import a P3 3.x project, you can
choose how to resolve each conflict by modifying the import configurations in the Import
wizard.
When connected to a P6 EPPM database: P6 Professional imports cost accounts but the
dictionary can only be viewed in P6.
Custom data items
P3 3.x custom data items are converted to the following user-defined data items in P6
Professional.
P3 3.x Custom Data Item Type P6 Professional Activity/Resource User Field
Character ( C) User Text
Start (S) User Start Date
Finish ( F) User End Date
Numeric ( N) User Integer
Precision (P) User Number
You can display converted activity custom data items as columns in P6 Professional’s
Activity Table. In the Activities window (with an Activity Table or Gantt Chart displayed on
top), click the Layout options bar, then choose Columns. Select the appropriate
user-defined fields from the list of Available Options and add them to the layout.
You can also display your converted resource custom data items as columns in P6
Professional. In the Activities window, click the Layout options bar, then choose Show on
Bottom, Activity Details. Click the Resources tab to display resource information.
Right-click in the column area, and choose Customize Resource Columns. Select the
appropriate user-defined fields from the list of Available Options and add them to the
table.
Duration types

Importing and Exporting Data
399
P6 Professional allows you to specify each activity's duration type as Fixed Units/Time,
Fixed Duration and Units/Time, Fixed Units, or Fixed Duration and Units. When all resource
assignments on the P3 3.x task are non-driving, the duration type becomes Fixed Duration
& Units/Time, which indicates that an activity's duration will not change, regardless of the
number of resources assigned to the activity or the amount of work required to finish the
activity.
When any resource assignment on the P3 3.x task is driving and Freeze Resource Units per
Timeperiod is marked in the autocost rules, the duration type becomes Fixed Units/Time.
When any resource assignment on the P3 3.x task is driving and Freeze Resource Units per
Timeperiod is not marked in the autocost rules, the duration type becomes Fixed Units.
Manual future period buckets
When you import a P3 project to a P6 Professional project that contains manual future
period assignment buckets, the manual values are deleted if you choose the Update
Existing or Replace Existing import option.
Percent complete type
Each activity in P6 Professional must be assigned one of the following percent complete
types: physical, duration, or units.
When you import P3 3.x activities to P6 Professional, they are assigned the percent
complete type of Duration, which specifies that the activity's percent complete is
calculated from the original and remaining durations.
Planning unit
You can only convert projects with an hourly or daily planning unit. Weekly and monthly
planning units are not supported. To display duration units in hours, choose Edit, User
Preferences, Time Units. Choose Hour as the Units format and either Hour or Day as the
Durations format.
Project codes
P6 contains a global project codes dictionary which is available to all projects in the
organization. You can assign a project code value to projects for each project code you
create. All 10 project codes defined in the P3 3.x project and their assignments are
imported.
Note
If the import option “Combine subprojects” (when importing a single project
group) or “Merge Subprojects” (when importing multiple project groups) is marked
in the Import wizard, the project codes and values assigned to the master project
are imported.
Resources
P6 Professional User's Guide
400
P6 Professional contains one master resource pool across all projects. A sample resource
hierarchy is provided when you install P6 Professional. When you import a project, the
resources are imported to the location in the hierarchy you specify in the Import wizard. If
duplicate resource IDs are encountered during the import process, you can choose how
to resolve each conflict by modifying the import configurations in the Import wizard.
In P6 Professional, resources are classified as labor, nonlabor, or material. Any resource in
P3 3.x with a unit of measure equal to most variations of a time unit, such as h, hr, or hour,
is converted as a labor resource. When connected to a P6 Professional database, any
resource in P3 3.x with a unit of measure equal to those defined in the Admin Categories,
Units of Measure tab in P6 Professional is converted as a material resource. When
connected to a P6 EPPM database, any resource in P3 3.x with a unit of measure equal
to those defined using P6 is converted as a material resource. All other resources are
classified as nonlabor. Labor units are displayed as hrs/day. You can change the display
unit by choosing Edit, User Preferences, and then clicking the Time Units tab.
All time-based calculations in P6 Professional are based on hourly units. If your project in
P3 3.x is planned in days, P6 Professional refers to each resource’s unit of measure to
determine how to convert resource assignments. If the resource unit of measure is equal
to most variations of an hourly time unit such as, hr or mh, then P6 Professional assumes
the resource assignment is based on hours and converts it as-is. If the resource unit of
measure is something other than hours such as, day or d, then P6 Professional assumes
the resource assignment is in days and multiplies all resource values by a factor of eight
(assuming 8 hr/day). In this case, decide if eight is the correct multiplier. If the resource is
classified as a material resource, the resource units are not multiplied; they convert as-is.
You can change the multiplier in the PRMCONVERT.INI file. You can also modify the list of
unit of measure abbreviations that P6 Professional refers to during the conversion.
For resources that have a blank unit of measure, use the Import wizard to decide how to
handle the assignments.
Note
The conversion process creates additional levels in the resource structure for P3 3.x
hierarchical resources. P6 Professional supports only maximum limits for resources.
Normal resource limits are not converted.
Resources assigned to milestone activities in P3 3.x become expenses in P6 Professional.
The resource name is used for the expense name, and the resource’s budgeted cost is
the expense’s planned or budgeted cost. The first resource found on the milestone
becomes the primary resource in P6 Professional.
Resource curves
You can specify the allocation of resources and costs over the duration of an activity
using resource curves. All resource curve definitions assigned to the projects being
exported from P3 3.x, are imported into P6 Professional. The curve name is prefaced by
the P3 3.x project name in P6 Professional (e.g., APEX - Triangular). The resource curve
assignments are also imported.
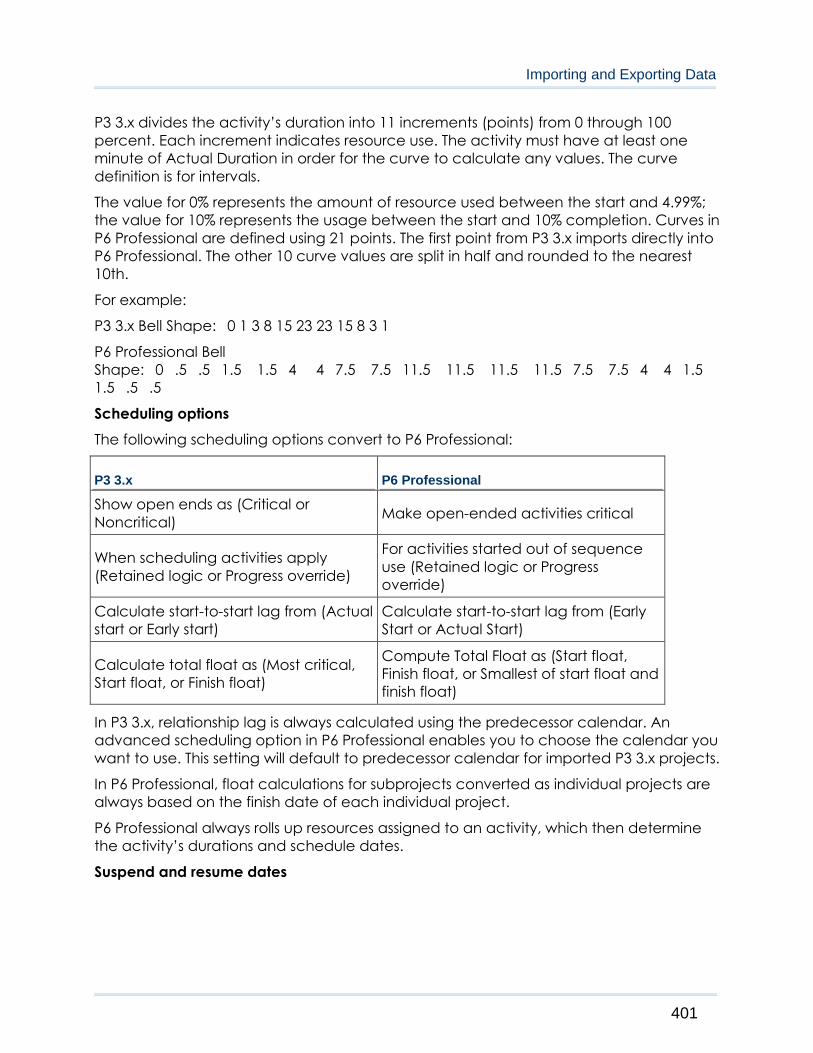
Importing and Exporting Data
401
P3 3.x divides the activity’s duration into 11 increments (points) from 0 through 100
percent. Each increment indicates resource use. The activity must have at least one
minute of Actual Duration in order for the curve to calculate any values. The curve
definition is for intervals.
The value for 0% represents the amount of resource used between the start and 4.99%;
the value for 10% represents the usage between the start and 10% completion. Curves in
P6 Professional are defined using 21 points. The first point from P3 3.x imports directly into
P6 Professional. The other 10 curve values are split in half and rounded to the nearest
10th.
For example:
P3 3.x Bell Shape: 0 1 3 8 15 23 23 15 8 3 1
P6 Professional Bell
Shape: 0 .5 .5 1.5 1.5 4 4 7.5 7.5 11.5 11.5 11.5 11.5 7.5 7.5 4 4 1.5
1.5 .5 .5
Scheduling options
The following scheduling options convert to P6 Professional:
P3 3.x P6 Professional
Show open ends as (Critical or
Noncritical) Make open-ended activities critical
When scheduling activities apply
(Retained logic or Progress override)
For activities started out of sequence
use (Retained logic or Progress
override)
Calculate start-to-start lag from (Actual
start or Early start)
Calculate start-to-start lag from (Early
Start or Actual Start)
Calculate total float as (Most critical,
Start float, or Finish float)
Compute Total Float as (Start float,
Finish float, or Smallest of start float and
finish float)
In P3 3.x, relationship lag is always calculated using the predecessor calendar. An
advanced scheduling option in P6 Professional enables you to choose the calendar you
want to use. This setting will default to predecessor calendar for imported P3 3.x projects.
In P6 Professional, float calculations for subprojects converted as individual projects are
always based on the finish date of each individual project.
P6 Professional always rolls up resources assigned to an activity, which then determine
the activity’s durations and schedule dates.
Suspend and resume dates
P6 Professional User's Guide
402
In P3 3.x, a suspend date indicates that an activity is suspended at the end of the
specified day. In P6 Professional, a suspend date indicates that an activity is suspended
at the beginning of the specified day. Due to this discrepancy, actual and remaining
durations are affected for daily projects. Hourly projects are not affected.
For example, an activity suspend date of 05OCT04 (end of the day) in P3 will import to P6
Professional as 05OCT04 (the beginning of the day). In P6 Professional, the actual
duration for the activity will be one day shorter than it was in P3 because P3 progresses
the work through the suspend date (while P6 Professional suspends progress at the
beginning of the day).
Target projects
You can convert target projects just as you would any other project; however, the target
designators are not converted. To designate a target project in P6 Professional, choose
Projects, Maintain Baselines. Click Add and choose Convert Another Project to a New
Baseline of the Current Project. Select the converted target project as the baseline for
the current project.
WBS codes
In P6 Professional, a WBS must exist and all activities must be assigned to a WBS code. If
the imported P3 3.x project uses a WBS, it is converted to P6 Professional. If no WBS exists,
P6 Professional creates a WBS root node and names it PROJ, where PROJ is the P3 3.x
project name. All activities are assigned to this WBS code.
Because P6 Professional uses the WBS to define a project structure, you should not assign
the same WBS code to different activities across projects within a project group in P3 3.x.
For example, if activity CS300 is part of the Conveyor System project, it should not be
assigned a WBS code that belongs to the Automation System project. If the conversion
program encounters this situation, it duplicates the code's entire branch in both projects.
To distinguish the projects, the program and project names are added as a prefix to the
WBS code structure. For example, for the APEX project, APEX.CONV.AM.01 and
APEX.AUTO.AM.01 would be included as branches in the WBS.
P3 data not converted to P6 Professional
This following data items are not converted from P3 3.x to P6 Professional.
Layouts, filters, Global Change specifications, and report and graphic
specifications
Layouts, filters, Global Change specifications, and report and graphic
specifications are not converted with the project; however, sample data is
provided for these items in P6 Professional.
Access rights
Access rights are not converted in P6 Professional. Your system administrator must
set up global and project profiles that determine privileges.

Importing and Exporting Data
403
Leveling options and leveling priorities
Choose Tools, Level Resources, to set options for leveling in P6 Professional.
Financial periods and past period actuals
When connected to a P6 Professional database: In P6 Professional, financial
periods are global. Financial periods and past period actual data are not
converted to P6 Professional because financial periods are project-specific in P3.
Choose Admin, Financial Periods, to define financial periods in P6 Professional.
When connected to a P6 EPPM database: In P6 Professional, financial periods are
global. Financial periods and past period actual data are not converted to P6
because financial periods are project-specific in P3. You define financial
periods in P6.
After you define financial periods choose Tools, Store Period Performance, to store
past period actuals per financial period.
Microsoft Excel/XLS
Delete data in the XLS file
To delete project data using Microsoft Excel, place a 'D' or ' d' in the Delete This Row
column for the selected row in the worksheet. When importing, the information included
in the deleted row will be removed from the project.
Note
Deleting an activity will delete all records related to the activity including issues,
resource assignments, relationships, and activity codes.
Modify Unique Fields in the XLS file
Do the following to change the value of a unique field in the exported file.
1) In Excel, choose Edit, Copy to copy the row you want to update.
2) Choose Edit, Paste to add a copy of the row to the Excel sheet.
3) Modify the value for the field you want to update in the new row.
4) Type ‘ d’ or ‘D’ in the ‘Delete this row’ column in the original row to delete the old
activity. The Delete column is the last column in the Excel sheet.
Note
To modify the Activity ID of an activity, you must first delete the activity. Deleting
an activity will delete all records related to the activity, including issues,
assignments, relationships, and activity codes.
The table below lists the unique fields for each subject area.
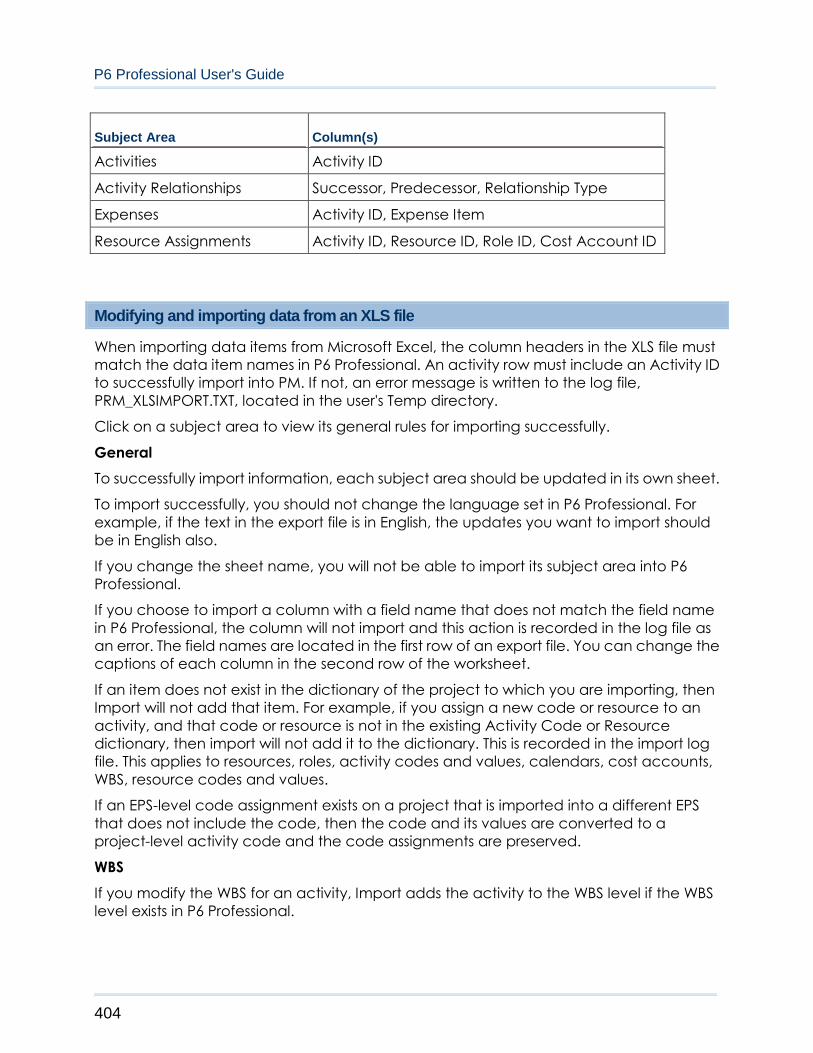
P6 Professional User's Guide
404
Subject Area Column(s)
Activities Activity ID
Activity Relationships Successor, Predecessor, Relationship Type
Expenses Activity ID, Expense Item
Resource Assignments Activity ID, Resource ID, Role ID, Cost Account ID
Modifying and importing data from an XLS file
When importing data items from Microsoft Excel, the column headers in the XLS file must
match the data item names in P6 Professional. An activity row must include an Activity ID
to successfully import into PM. If not, an error message is written to the log file,
PRM_XLSIMPORT.TXT, located in the user's Temp directory.
Click on a subject area to view its general rules for importing successfully.
General
To successfully import information, each subject area should be updated in its own sheet.
To import successfully, you should not change the language set in P6 Professional. For
example, if the text in the export file is in English, the updates you want to import should
be in English also.
If you change the sheet name, you will not be able to import its subject area into P6
Professional.
If you choose to import a column with a field name that does not match the field name
in P6 Professional, the column will not import and this action is recorded in the log file as
an error. The field names are located in the first row of an export file. You can change the
captions of each column in the second row of the worksheet.
If an item does not exist in the dictionary of the project to which you are importing, then
Import will not add that item. For example, if you assign a new code or resource to an
activity, and that code or resource is not in the existing Activity Code or Resource
dictionary, then import will not add it to the dictionary. This is recorded in the import log
file. This applies to resources, roles, activity codes and values, calendars, cost accounts,
WBS, resource codes and values.
If an EPS-level code assignment exists on a project that is imported into a different EPS
that does not include the code, then the code and its values are converted to a
project-level activity code and the code assignments are preserved.
WBS
If you modify the WBS for an activity, Import adds the activity to the WBS level if the WBS
level exists in P6 Professional.

Importing and Exporting Data
405
If a specified WBS does not exist in P6 Professional, but the parent WBS does exist, then
Import adds the activity to the parent WBS and record this action in the import log file. For
example, if you have an activity and add ProjectB.A.1.01 as its WBS, if this node does not
exist, Import adds the activity to ProjectB.A.1.
If a specified WBS for an activity does not exist in P6 Professional, and the parent WBS
does not exist, then the activity will not import successfully. An error message is recorded
in the import log file.
Resource/Role Assignments
If you change the value of a unique field, P6 Professional adds a new value to the
project. For example, if you change the Activity ID for resource assignments, Import
keeps the original assignment and adds a duplicate assignment with the new Activity ID.
Dates
The date format used to export dates to Excel is a text field. When editing the date fields
in Excel, the format is based on the date format selected in Excel.
When importing, the project planned start date uses the data date as its value. The
planned dates cannot be modified.
Dates are imported based on the date format selected in P6 Professional (Edit, User
Preferences, Dates tab).
Duration and Units
The format used to display durations and units is based on the preferences set in P6
Professional (Edit, User Preferences, Time Units tab).
Export does not support sub-units as a time format. Make sure the sub-unit checkboxes
are clear in the Edit, User Preferences, Time Units tab.
When connected to a P6 Professional database: If the planned duration for activities is
null in the export file, the default activity duration (Admin, Admin Preferences, General
tab) is used during import.
When connected to a P6 EPPM database: If the planned duration for activities is null in
the export file, the default activity duration, defined using P6, is used during import.
Percent Complete
The percentage value must be between 0 and 1. If the value is between 0 and 100, P6
Professional recognizes that value as a percentage. For example, if the value in the
import file is 5, the value is imported as 5%.
Cost
The currency symbol type exported is based on the setting defined in Edit, User
Preferences, Currency tab.
P6 Professional User's Guide
406
Notes
To import data from an XLS file, you must have the Project Superuser security
profile for the project you are updating, and your assigned security profile must
include the global privilege required to import XLS files.
To successfully import data, do not edit the USERDATA sheet in the export file. Use
this sheet as a reference for the user preference settings (Edit, User Preferences).
To ensure data integrity, you should only import user-defined fields (UDFs) into the
same P6 Professional or P6 EPPM database from which the data was exported. If
you import UDFs into a different database, make sure the P6 Professional or P6
EPPM databases have identical UDF dictionaries.
Do not remove, edit, or enter null values for unique fields. These fields are
necessary to import data successfully.
P6 Professional ignores financial period (past period actual) columns when
importing XLS file.
Export project data and resources to an XLS file
1) Open the projects you want to export.
2) Choose File, Export.
3) Choose Spreadsheet - (XLS).
4) Select the subject area(s) you want to export.
5) Mark the checkbox for the project from which you want to export its data. If exporting
resources only, you will skip this step in the wizard.
6) Add, modify, or select a template that specifies the fields you want to export. You
can create a filter to export only a portion of the activities in the project. In the
template, select each subject area from the dropdown list to modify its columns, filter,
and sort information. Click OK.
The export file will use the default template for the selected subject areas if you do
not add a new one.
7) Type or select the name of the export file and the location where the file will be
saved. If you have selected more than one subject area to export, each subject area
will appear in a separate worksheet in the same spreadsheet file.
8) Click Finish.
9) Click Close.
Notes
You can right-click in the Activity Table in the Activities window and select Export
to Excel to instantly export activity data for the open project.
Export does not support sub-units as unit and duration formats. Make sure the
Sub-unit checkbox is cleared in the Edit, User Preferences, Time Units tab.
Importing and Exporting Data
407
To successfully import information, you must update each subject area in its own
sheet in the export file.
The first row in the export file lists the field name for each column. Do not edit these
fields; they are necessary for importing. You can edit the caption in the second
row of the export file. However, caption changes are ignored during import.
When selecting the fields to export with each subject area in the template,
required fields cannot be removed from the selected options list.
If you change the sheet name in the export file, you will not be able to import its
data into P6 Professional.
You can export financial period (past period actual) data to an XLS file; however,
past period actual data is ignored when you import an XLS file to P6 Professional.
When you export resource assignments to an XLS file, only the lowest level of cost
accounts associated with resource assignments is exported to the XLS file. For
example, assume your cost account hierarchy has a cost account named CA,
with a subordinate level named CA.A. If you assign the cost account CA.A to a
resource assignment, when you export resource assignments to an XLS file, the XLS
file displays "A" as the cost account, not "CA.A." If you then import this XLS file to
the same project in P6 Professional, in some cases, a duplicate resource
assignment will be created that lists "A" as the assigned cost account for the
duplicate resource assignment.
Import project information and resources in XLS format
To import data from an XLS file, you must have the Project Superuser security profile.
When P6 Professional is connected to a P6 Professional database, this setting is available
in the Project Access tab in the Admin, Users dialog box. When P6 Professional is
connected to a P6 EPPM database, this setting is available from P6.
1) Choose File, Import.
2) Select Spreadsheet - (XLS). Click Next.
3) Click the Browse button to select the file you want to import. The subject areas
available are based on the export file.
4) Mark the checkboxes to select the subject areas you want to import.
5) Click the browse button in the Import To field to select the project in which you want
to import. Click Next.
6) View the summary and click Finish.
7) Click Close.
Notes
To ensure data integrity, you should only import user-defined fields (UDFs) into the
same P6 Professional or P6 EPPM database from which the data was exported. If
you import UDFs into a different database, make sure the P6 Professional or P6
EPPM databases have identical UDF dictionaries.
P6 Professional User's Guide
408
The language used in the export file must remain the same, to import successfully.
For example, if the text in the export file is in English, the updates you want to
import must be in English also.
P6 Professional ignores past period actual (financial period) columns when
importing data from XLS files.
To import data from an XLS file, you must have the Project Superuser security
profile for the project you are updating, and your assigned security profile must
include the global privilege required to import XLS files.
When you export resource assignments to an XLS file, only the lowest level of cost
accounts associated with resource assignments is exported to the XLS file. For
example, assume your cost account hierarchy has a cost account named CA,
with a subordinate level named CA.A. If you assign the cost account CA.A to a
resource assignment, when you export resource assignments to an XLS file, the XLS
file displays "A" as the cost account, not "CA.A." If you then import this XLS file to
the same project in P6 Professional, in some cases, a duplicate resource
assignment will be created that lists "A" as the assigned cost account for the
duplicate resource assignment.
Update Unit, Cost, Duration, and Percent Complete fields in Excel
When updating unit, cost, duration, and percent complete fields, you may want to
import one updated field at a time, into P6 Professional. For example, you can export the
Activities subject area, and update the activity percent complete and the remaining
duration in the export file. When you import, PM updates the activity data. However, to
update other activity values related to the remaining duration and percent complete,
PM does not know which field was updated first. In PM, you cannot update these fields
simultaneously.
To update unit, cost, duration, and percent complete fields
1) Make a copy of the export file.
2) In the copied file, update the necessary field for an activity.
3) In the selected activity row, use the Backspace or Delete key to null the remaining
fields that are not unique, and those that are not marked with an asterisk (*). As a
result, during import, only the field with the new value updates and PM calculates the
other fields as necessary.
4) Import the file into the selected project. Repeat these steps for each unit, cost,
duration, and percent complete field you want to update.
Export activity data to Excel
You can export activity data to Excel using the right-click menu in the Activity Table.
Right-click in the Activity Table and choose Export to Excel. P6 Professional will export the
columns displayed in the Activity Table for the open project.

Importing and Exporting Data
409
Notes
You must choose File, Export to export multiple projects to Microsoft Excel.
You can export baseline fields to Microsoft Excel.
Microsoft Project
Export projects to a Microsoft Project file
1) Open the projects you want to export.
2) Choose File, Export.
3) Choose Microsoft Project.
4) From the pull-down menu, select one of the following options:
XML 2003- for an export to Microsoft Project 2003
XML 2007- for an export to Microsoft Project 2007
XML 2010- for an export to Microsoft Project 2010
MPX - for an export to Microsoft Project 2002
MPP - for an export to Microsoft Project 2003
5) Select the type of file to which you want to export. Click Next.
6) Mark the Export checkbox of all projects you want to export. Double click in the
Export File Name field if you want to change the name and location of the Microsoft
Project file.
7) Add a new template or modify the existing template (if necessary). The template
contains options for exchanging data with Microsoft Project.
8) Click Next to review the settings for your export.
9) Click Finish.
10) Click Close.
Notes
If you are transferring data in XML format, you must map Cost-type custom fields in
MSP to Cost-type UDFs in P6 Professional. Likewise, you must map Number-type
custom fields in MSP to Number-type UDFs in P6 Professional. If there is a mismatch
in the custom mappings you define, you will receive an error during import or
export. You can define custom mappings when you create or modify a template
in the Modify Template dialog box.
To export manual future period values, you require Microsoft Project 2002 or a
more recent version. If you plan to exchange project data containing manual
future period assignment values with Microsoft Project, you will achieve the most
accurate conversion results using Microsoft Project 2003.
The MPX file format does not support resource curves. Therefore, if your exported
projects contain resource curves or manual future period assignment values,
choose a different export file format if you want to retain these values.

P6 Professional User's Guide
410
You are required have Microsoft Project 2003 installed on your computer to export
an MPP file. MPP appears as an option for Microsoft Project on the Export Format
screen if you have only Microsoft Project 2003 installed.
When you export project data, secure codes and secure code assignments
related to the project are not exported.
P6 Professional does not export past period actual data to Microsoft Project.
Suspend and resume dates can only be exported to MPP format.
Do not use the following characters in the code value column when defining
Activity Codes at the project level if you want to export the project to a Microsoft
Project profile in MPP format: ., - , +, /.
Import a Microsoft Project file
1) Choose File, Import.
2) Choose Microsoft Project.
3) Select the appropriate format from the drop down menu. Click Next.
4) Choose Project.
5) Click Select to choose the files you want to import.
Type a password for any file that is password protected.
Double click the Import Action field to select how the project data is imported, then
specify where to import the projects in the Import To field. Click Next.
Select Create New Project to create a new project while the existing project's data
remains the same.
Select Add into Existing Project to append to the selected WBS.
Select Replace Existing Project to delete the existing project without preserving
information and replace it with the project imported from the Microsoft Project file.
6) Add a new template or modify the existing template (if necessary). The template
contains options for exchanging data with Microsoft Project. When you finish, click
Next.

Importing and Exporting Data
411
7) Perform this step only if you chose Update Existing Project as the import option:
In the Update Project Options dialog box, click Modify and choose the data to import
by modifying the layout configuration (if necessary).
In the Modify Import Configuration dialog box, select the data you want to modify. If
resource security is enabled, some restrictions apply when importing activity resource
assignments.
Select the action to perform during the import process. Mark the Delete checkbox to
remove unreferenced data (i.e., data in the project you are updating but is not
included in the import file) from the project. (The Delete field applies only to
relationships to external projects, thresholds, activities, activity relationships, and
activity resource assignments. Global data types are not affected by this setting.)
Click OK.
8) Click Next to review the settings for your import.
9) Click Finish.
10) Click Close.
Notes
You must be an Admin superuser with all resources access to import MSP XML files.
P6 Professional supports the import and export of Microsoft Project (MSP) 2002 and
2003 files using MSP or MPX formats, MSP 2003 files using MPP format, and MSP 2003,
2007, and 2010 files using MSP XML format.
MPP appears as an option for Microsoft Project on the Import Format screen if you
have only Microsoft Project 2003 installed.
If you are transferring data in XML format, you must map Cost-type custom fields in
MSP to Cost-type UDFs in P6 Professional. Likewise, you must map Number-type
custom fields in MSP to Number-type UDFs in P6 Professional. If there is a mismatch in
the custom mappings you define, you will receive an error during import or export.
You can define custom mappings when you create or modify a template in the
Modify Template dialog box.
Microsoft Jet 4.0 users should install Service Pack 6. Import errors may occur on
computers running Microsoft Jet 4.0 Service Pack 5 or earlier.
If you manually plan future period distribution for resource/role assignments to
activities in P6 Professional, here are some import considerations for projects with
manual future period assignment values:
Suspend and resume dates in MSP are not honored when imported to P6. When you
import an MSP project that has suspend and resume dates, the suspend time is
imported as a 0 (zero) bucket value.
The MPX file format does not support time-phased data and therefore does not
support manual future period buckets. When you import an MPX file, if you choose
the Replace Existing import action and the project you are replacing contains
manual future period buckets, all manual buckets will be deleted.

P6 Professional User's Guide
412
Since ProjectLink was removed from P6 Professional, importing a Microsoft Project
XML file that was exported from P6 Professional is not supported.
You must have the Project Superuser security profile to use the Update Existing Project
option to update existing P6 Professional projects with MSP.
Export resources to Microsoft Project (supported for MPP or MPX formats)
1) Choose File, Export.
2) Choose Microsoft Project.
3) Select MPP or MPX. Either file format is supported for the export file. Click Next.
4) Choose Resource Only.
5) Type or select the name of the export file and the location where the file will be
saved. Click Next.
6) Add a new template or modify the existing template (if necessary). The template
contains options for exchanging data with Microsoft Project.
7) Click Finish.
8) Click Close.
Import resources from a Microsoft Project file (supported for MPP and MPX formats)
1) Choose File, Import.
2) Choose Microsoft Project.
3) From the pull-down menu, select MPP or MPX.
4) Choose Resource Only.
5) Select the files you want to import.
6) Add a new template or modify the existing template (if necessary). The template
contains options for exchanging data with Microsoft Project.
7) Click Next to review the settings for your import.
8) Click Finish.
9) When connected to a P6 Professional database: Click Close.
Note
Microsoft Jet 4.0 users should install Service Pack 6. Import errors may occur on
computers running Microsoft Jet 4.0 Service Pack 5 or earlier.
Modify template options
Add a new template or modify an existing template (if necessary).
Importing and Exporting Data
413
Click the Activity tab in the Modify Template dialog box and confirm your import
configuration. In the Import section, choose how you want to import milestone activities
that have resource assignments. You can import them into P6 Professional as Start
Milestone activities with associated expenses, or as Task Dependent activities with
associated resource assignments. Then, choose to import the Task ID from Microsoft
Project to the Activity ID field in P6 Professional or to a selected user-defined text field.
Select if you want to import MSP’s fixed costs as project expenses. If you do not choose
this option, fixed costs are not imported.
Click the Resource tab in the Modify Template dialog box. Choose whether you want to
import the Resource Initials or the Resource Name.
Choose whether you want to add a new resource if the resource does not already exist
in the project management database but is contained in the Microsoft Project import
file. Then, select the level of the hierarchy at which resources should be imported. Click
the Browse button, then select the resource under which to place all new resources from
the Microsoft Project file.
Click the Notebooks tab in the Modify Template dialog box. Notebook fields are defined
in Admin Categories (choose Admin, Admin Categories, then click the Notebook Topics
tab). These notebook fields can be exported to project, WBS, and activity notes fields in
Microsoft Project.
Click the Custom Field Mappings tab in the Modify Template dialog box. You can import
information from Microsoft Project into user-defined fields in P6 Professional. Choose
Resources from the drop-down list. For each Microsoft Project field you want to import,
select a user-defined field in the P6 Professional Field column. The Field column is sorted
by field type.
Click OK to save your modifications to the template. Click Next to confirm the settings for
the current import, then click Finish to import the Microsoft Project resources.
Oracle Primavera Contractor
Export a project for use with Oracle Primavera Contractor
You can export a P6 Professional project to XER format, then import the XER project to
Oracle Primavera Contractor 5.0 or 6.1 or later. You cannot import an XER file to an
earlier version of Oracle Primavera Contractor than 5.0.
1) Open the project you want to export.

P6 Professional User's Guide
414
2) Choose File, Export.
3) Choose Primavera Contractor - (XER).
4) Select the appropriate version from the pull-down menu. Click Next.
5) Choose Project.
6) Mark the Export checkbox for the project you want to export.
You can only select one project.
7) Type the name of the export file and the location where the file will be saved.
8) Click Finish.
9) Click Close.
Notes
While both P6 Professional and Oracle Primavera Contractor can import and
export XER files, the formats of the XER files are different. Therefore, when exporting
a project for use with Oracle Primavera Contractor, you must select the Primavera
Contractor - (XER) option instead of the Primavera PM - (XER) option.
If you are exporting a project that you previously imported; and, that project
contains relationships to external projects that do not exist in your database; and,
you scheduled the project; be sure that you scheduled the project with the Ignore
Relationships To and From Other Projects option selected (in the Schedule Options
dialog box). If you select this option when scheduling the project, the module will
preserve the external activity dates.
Export resources for use with Oracle Primavera Contractor
You can export the resource dictionary in P6 Professional project to XER format, then
import the XER file to Oracle Primavera Contractor 5.0 or 6.1 or later. You cannot import
an XER file to an earlier version of Oracle Primavera Contractor than 5.0.
1) Choose File, Export.
2) Choose Primavera Contractor - (XER).
3) Select the appropriate version from the pull-down menu. Click Next.
4) Choose Resource Only. Click Next.
5) Type or select the name of the export file and the location where the file will be
saved.
6) Click Finish.
7) Click Close.

Importing and Exporting Data
415
Note
While both P6 Professional and Oracle Primavera Contractor 5.0 or 6.1 or later can
import and export XER files, the formats of the XER files are different. Therefore,
when exporting resources for use with Oracle Primavera Contractor 5.0 or 6.1 or
later, you must select the Primavera Contractor - (XER) option instead of the
Primavera PM - (XER) option.
Data not exported to Oracle Primavera Contractor
Oracle Primavera Contractor does not contain some of the functionality available in P6
Professional. To enable Oracle Primavera Contractor to import an XER file exported from
P6 Professional, the following data is contained in the XER file but not imported into
Oracle Primavera Contractor:
Budget data
EPS Codes
Financial periods
Funding data
Issues
Issue Codes
Manual future period assignment values
Multiple critical float paths
Past period actuals
Portfolios
Project Codes
Resource Shifts
When connected to a P6 Professional database: Risks
Roles
Thresholds
Work products and documents
UN/CEFACT IMS (XML)
Export projects to a UN/CEFACT IMS (XML) file
1) Open the project you want to export.
2) Choose File, Export.
3) Choose UN/CEFACT IMS - (XML). Click Next.
4) Verify that the currently opened project is listed. Click Next.
5) Type the name of the export file and the location where the file will be saved.
6) Click Finish.

P6 Professional User's Guide
416
7) Click Close.
Note
You can only export one project at a time.
417
Linking Primavera Unifier data (P6 EPPM Only)
In This Section
Link a project with a Primavera Unifier Project (P6 EPPM Only) ....................... 417
Link a project with a Primavera Unifier Project (P6 EPPM Only)
1) Choose Enterprise, Projects.
2) Display Project Details, then click the Primavera Unifier tab.
3) Mark Allow this project to link with a Unifier Project.
4) In the Project Name field, click to select the Unifier project you want to link with a P6
Professional project.
5) In the Schedule Sheet field, click to select the schedule sheet for the selected project.
6) In the Data Mapping field, click to select the data mapping defined for the selected
schedule sheet.
7) Mark Delete from Unifier any activities no longer in the P6 Schedule if you want to
remove activities from Unifier that are not in the P6 Schedule.
8) Mark Only send activities with CBS codes assigned if you want to send only activities
that are assigned a CBS code.
9) Select Send to Primavera Unifier from the File Menu.
Note: You must have the Send Project Data to Unifier privilege set in
P6.
P6 Visualizer overview
P6 Visualizer is a reporting-tool that you can use to create customizable Gantt charts and
Timescaled Logic Diagrams for time-based, daily comparison reporting. Visualizer can be
launched as a standalone application that can connect to P6 Professional and P6 EPPM
databases. You can also open Visualizer from P6 Professional by selecting Tools,
Visualizer.
Project data is not sent from P6 Professional to Visualizer. Instead, you can select projects
from within the Visualizer.
P6 Visualizer
P6 Professional User's Guide
418
Gantt charts provide a graphical display of the project's schedule information in the
order determined by grouping and sorting options. The Gantt chart shows each activity's
duration, using the timescale specified, as a horizontal bar. A line connecting activity
bars indicates a relationship. Gantt charts allocate a row for each activity.
TSLDs allows more than one activity per row, which condenses the project entire project
plan and the chains of activities that drive the project schedule. TSLDs present a graphic
depiction of activities and the overall logic of a project according to time.
Visualizer allows you to set options, then visualize the reports. You can directly output
reports to print or an XPS document.
When you start the Visualizer application, the Visualizer workspace appears. The
Visualizer workspace is the user interface. From the Visualizer workspace, you can draw,
view, edit, print, and save Gantt Charts and TSLDs.
See the P6 Visualizer Help for more information about Visualizer. That help is available
from the Visualizer workspace.
Launching P6 Visualizer from P6 Professional
Use this procedure to launch P6 Visualizer. Project data is not sent from P6 Professional,
therefore, it does not matter if projects are currently opened, scheduled, or filtered. You
can select projects from Visualizer. You can select or create a Gantt or Timescaled Logic
Diagram layout and draw a Gantt chart or TSLD.
To launch P6 Visualizer, click Tools, Visualizer.