p53 Protocols - Tulane University School of Medicine · Cytokine Protocols, edited by Marc Le Dey,...
282
Transcript of p53 Protocols - Tulane University School of Medicine · Cytokine Protocols, edited by Marc Le Dey,...


p53 Protocols

M E T H O D S I N M O L E C U L A R B I O L O G Y TM
John M. Walker, SERIES EDITOR
249. Cytokine Protocols, edited by Marc Le Dey, 2004248. Antibody Engineering: Methods and Protocols, edited by Benny
K. C. Lo, 2004247. Drosophila Cytogenetics Protocols, edited by Daryl S.
Henderson, 2004246. Gene Delivery to Mammalian Cells: Volume 2: Viral Gene
Transfer Techniques, edited by William C. Heiser, 2004245. Gene Delivery to Mammalian Cells: Volume 1: Nonviral Gene
Transfer Techniques, edited by William C. Heiser, 2004244. Protein Purification Protocols, Second Edition, edited by Paul
Cutler, 2004243. Chiral Separations: Methods and Protocols, edited by Gerald
Gübitz and Martin G. Schmid, 2004242. Atomic Force Microscopy: Methods and Applications, edited
by Pier Carlo Braga and Davide Ricci, 2004241. Cell Cycle Checkpoint Control Protocols, edited by Howard
B. Lieberman, 2004240. Mammalian Artificial Chromosomes: Methods and Protocols,
edited by Vittorio Sgaramella and Sandro Eridani, 2003239. Cell Migration in Inflammation and Immunity: Methods and
Protocols, edited by Daniele D’Ambrosio and FrancescoSinigaglia, 2003
238. Biopolymer Methods in Tissue Engineering, edited byAnthony P. Hollander and Paul V. Hatton, 2003
237. G Protein Signaling: Methods and Protocols, edited by Alan V.Smrcka, 2003
236. Plant Functional Genomics, edited by Erich Grotewold, 2003235. E. coli Plasmid Vectors: Methods and Applications, edited by
Nicola Casali and Andrew Preston, 2003234. p53 Protocols, edited by Sumitra Deb and Swati Palit Deb, 2003233. Protein Kinase C Protocols, edited by Alexandra C. Newton, 2003232. Protein Misfolding and Disease: Principles and Protocols,
edited by Peter Bross and Niels Gregersen, 2003231. Directed Evolution Library Creation: Methods and Protocols,
edited by Frances H. Arnold and George Georgiou, 2003230. Directed Enzyme Evolution: Screening and Selection Methods,
edited by Frances H. Arnold and George Georgiou, 2003229. Lentivirus Gene Engineering Protocols , edited by Maurizio
Federico, 2003228. Membrane Protein Protocols: Expression, Purification, and
Characterization, edited by Barry S. Selinsky, 2003227. Membrane Transporters: Methods and Protocols, edited by
Qing Yan, 2003226. PCR Protocols, Second Edition, edited by John M. S. Bartlett
and David Stirling, 2003225. Inflammation Protocols, edited by Paul G. Winyard and Derek
A. Willoughby, 2003224. Functional Genomics: Methods and Protocols, edited by
Michael J. Brownstein and Arkady Khodursky, 2003223. Tumor Suppressor Genes: Volume 2: Regulation, Function, and
Medicinal Applications, edited by Wafik S. El-Deiry, 2003
222. Tumor Suppressor Genes: Volume 1: Pathways and IsolationStrategies, edited by Wafik S. El-Deiry, 2003
221. Generation of cDNA Libraries: Methods and Protocols ,edited by Shao-Yao Ying, 2003
220. Cancer Cytogenetics: Methods and Protocols, edited by JohnSwansbury, 2003
219. Cardiac Cell and Gene Transfer: Principles, Protocols, andApplications, edited by Joseph M. Metzger, 2003
218. Cancer Cell Signaling: Methods and Protocols, edited by DavidM. Terrian, 2003
217. Neurogenetics: Methods and Protocols, edited by Nicholas T.Potter, 2003
216. PCR Detection of Microbial Pathogens: Methods and Proto-cols, edited by Konrad Sachse and Joachim Frey, 2003
215. Cytokines and Colony Stimulating Factors: Methodsand Protocols, edited by Dieter Körholz and WielandKiess, 2003
214. Superantigen Protocols, edited by Teresa Krakauer, 2003213. Capillary Electrophoresis of Carbohydrates, edited by Pierre
Thibault and Susumu Honda, 2003212. Single Nucleotide Polymorphisms: Methods and Protocols,
edited by Pui-Yan Kwok, 2003211. Protein Sequencing Protocols, Second Edition, edited by Bryan
John Smith, 2003210. MHC Protocols, edited by Stephen H. Powis and Robert W.
Vaughan, 2003209. Transgenic Mouse Methods and Protocols, edited by Marten
Hofker and Jan van Deursen, 2003208. Peptide Nucleic Acids: Methods and Protocols, edited by Peter
E. Nielsen, 2002207. Recombinant Antibodies for Cancer Therapy: Methods
and Protocols. edited by Martin Welschof and JürgenKrauss, 2002
206. Endothelin Protocols, edited by Janet J. Maguire and AnthonyP. Davenport, 2002
205. E. coli Gene Expression Protocols, edited by Peter E.Vaillancourt, 2002
204. Molecular Cytogenetics: Protocols and Applications, edited byYao-Shan Fan, 2002
203. In Situ Detection of DNA Damage: Methods and Protocols,edited by Vladimir V. Didenko, 2002
202. Thyroid Hormone Receptors: Methods and Protocols, editedby Aria Baniahmad, 2002
201. Combinatorial Library Methods and Protocols, edited by LisaB. English, 2002
200. DNA Methylation Protocols, edited by Ken I. Mills and BernieH. Ramsahoye, 2002
199. Liposome Methods and Protocols, edited by Subhash C. Basuand Manju Basu, 2002
198. Neural Stem Cells: Methods and Protocols, edited by TanjaZigova, Juan R. Sanchez-Ramos, and Paul R. Sanberg, 2002

Humana Press Totowa, New Jersey
Edited by
Sumitra Deband
Swati Palit DebMedical College of Virginia, Virginia Commonwealth University,
Richmond, VA
p53 Protocols
M E T H O D S I N M O L E C U L A R B I O L O G Y TM

© 2003 Humana Press Inc.999 Riverview Drive, Suite 208Totowa, New Jersey 07512
www.humanapress.com
All rights reserved. No part of this book may be reproduced, stored in a retrieval system, or transmitted in any form orby any means, electronic, mechanical, photocopying, microfilming, recording, or otherwise without written permis-sion from the Publisher.
All papers, comments, opinions, conclusions, or recommendatoins are those of the author(s), and do not necessarilyreflect the views of the publisher. Methods in Molecular BiologyTM is a trademark of The Humana Press, Inc.
This publication is printed on acid-free paper. ANSI Z39.48-1984 (American Standards Institute)Permanence of Paper for Printed Library Materials.
Production Editor: Tracy Catanese.Cover design by Patricia F. Cleary.
For additional copies, pricing for bulk purchases, and/or information about other Humana titles, contact Humana atthe above address or at any of the following numbers: Tel.: 973-256-1699; Fax: 973-256-8341; E-mail:[email protected]; or visit our Website: www.humanapress.com.
Photocopy Authorization Policy:Authorization to photocopy items for internal or personal use, or the internal or personal use of specific clients, isgranted by Humana Press Inc., provided that the base fee of US $20.00 per copy is paid directly to the CopyrightClearance Center at 222 Rosewood Drive, Danvers, MA 01923. For those organizations that have been granted aphotocopy license from the CCC, a separate system of payment has been arranged and is acceptable to Humana PressInc. The fee code for users of the Transactional Reporting Service is: [0-58829-106-5/03 $20.00].
Printed in the United States of America. 10 9 8 7 6 5 4 3 2 1
Library of Congress Cataloging in Publication Data
p53 protocols / edited by Sumitra Deb and Swati Palit Deb. p. cm. -- (Methods in molecular biology ; v. 234) Includes bibliographical references and index. ISBN 1-58829-106-5 (alk. paper);1-59259-408-5 (e-book) ISSN 1064-3745 1. p53 protein--Laboratory manuals. 2. p53 antioncogene--Laboratory manuals. I. Deb, Sumitra. II. Deb, Swati Palit. III. Methods in molecular biology (Totowa, N.J.) ; v. 234. [DNLM: 1. Protein p53--analysis. 2. Protein p53--therapeutic use. 3. Tumor Suppressor Proteins-- analysis. 4. Genes, p53--physiology. 5. Neoplasms--genetics. QZ 200 P109 2003] RD94.W695 2003 617.1'4027--dc21
2002027304

Preface
v
Since the discovery of p53 as a tumor suppressor, numerous methods haveevolved to reveal the unique structural features and biochemical functions ofthis protein. Several unique properties of p53 posed a challenge to understand-ing its normal function in the initial phase of its research. The low levels of p53in normal cells, its stabilization under situations of genotoxic stress, inductionof growth arrest, and apoptosis with stabilization of the protein, obstructed thevisibility of its normal, unmutated function. The property of p53 that can sensea promoter and transactivate or inhibit is still not well understood. It is still notknown whether it is the absence of the protein that causes tumorigenesis, or ifits mutants have a dominant role in inducing cancer.
p53 Protocols comprises eighteen chapters for the study of the diverseproperties of p53 and related proteins. The methods included are invaluable fordelineating the function of other proteins that may function as tumor suppres-sors or growth suppressors. The chapters are not presented in any schematicorder, for the importance and diversity of the functions of p53 make it impos-sible to organize them suitably.
We have made a sincere effort to collect the methods most useful tothose investigators working on tumor suppressors or growth suppressors. Thepurpose of p53 Protocols is not only to provide investigators with methods toanalyze similar biochemical functions, but also to familiarize them with theassociated problems that arose during the course of investigations. In keepingwith the other volumes of the series, we have provided detailed protocols withtroubleshooting notes. Special effort has been made to discuss problems andtheir solutions to ease the learning curve for standardizing a new method. Wedid not attempt to cover all of the methods that are currently available. Rather,the emphasis was to present protocols from authors who have used these meth-ods successfully.
We thank Professor John Walker for giving us the opportunity andencouragement to structure and edit this book. We also thank the staff ofHumana Press for their work in its behalf. We sincerely thank all contributingauthors for sharing the extensive benchtop experience they have developedover the years and also for generating high quality manuscripts. We wouldlike to extend special thanks to our graduate students: Rebecca Frum, forenthusiastically helping us with grammatical editing, communication with

authors, and organizing the manuscripts, and Katie Roth Stagliano, MarianoScian, and Evie Carchman for their help and support.
Sumitra DebSwati Palit Deb
vi Preface

Contents
Preface ..............................................................................................................vContributors ..................................................................................................... ix
1 Adenovirus Expressing p53Matthew Holmes, Elizabeth Rosenberg,
and Kristoffer Valerie ........................................................................... 12 Purification of Recombinant p53 from Sf9 Insect Cells
Xiu Zhu Sun, John Nguyen, and Jamil Momand .................................... 173 Generation and Characterization of p53 Mutant Mice
Melissa L. Dumble, Lawrence A. Donehower,and Xiongbin Lu ................................................................................. 29
4 Identification of p53 Target Genesby Fluorescent Differential Display
Susanne Stein, Yong-Jig Cho, Roger S. Jackson II,and Peng Liang ................................................................................... 51
5 p53-Induced Gene Expression AnalysisJoanna K. Sax and Wafik S. El-Deiry ...................................................... 65
6 Real-Time Polymerase Chain Reaction Quantitationof Relative Expression of Genes Modulatedby p53 Using SYBR® Green I
Katherine E. Roth Stagliano, Evie Carchman,and Sumitra Deb ................................................................................ 73
7 Transactivation and Transrepression Studies with p53Mariano J. Scian, Rebecca Frum, Swati Palit Deb,
and Sumitra Deb ................................................................................ 938 Methods to Study p53-Repressed Promoters
Patrick Dumont, Anthony Della Pietra,and Maureen E. Murphy .................................................................. 111
9 Interaction of p53 with Cellular ProteinsDavid M. Keller, Shelya X. Zeng, and Hua Lu ..................................... 121
10 Interaction of p53 with the Adenovirus E1B-55 kDa ProteinJudith Roth and Matthias Dobbelstein ................................................. 135
vii

viii Contents
11 In Vivo Footprinting and DNA Affinity Chromatographyfor Analysis of p53 DNA Binding Ability
Maria Patricia Molina, Christine Cain, and Jill Bargonetti .................. 15112 Signaling to p53:
The Use of Phospho-Specific Antibodies to Probefor In Vivo Kinase Activation
Ashley L. Craig, Susan E. Bray, Lee E. Finlan,Neil M. Kernohan, and Ted R. Hupp ............................................... 171
13 Detection of Mitochondrial Localization of p53Motohiro Mihara and Ute M. Moll ...................................................... 203
14 Analysis of Nuclear and Cytoplasmic Degradationof p53 in Cells after Stress
Troy W. Joseph and Ute M. Moll ......................................................... 21115 Mutational Analysis of p53 in Human Tumors:
Direct DNA Sequencing and SSCPSusan Erster, Neda Slade, and Ute M. Moll ......................................... 219
16 Mutational Analysis of p53 in Human Tumors:Immunocytochemistry
Neda Slade and Ute M. Moll ................................................................ 23117 Flow Cytometric Analysis of p53-Induced Apoptosis
Michael Berger and Ygal Haupt ........................................................... 24518 Flow Cytometric Analysis of MDM2-Mediated Growth Arrest
Rebecca Frum and Swati Palit Deb ...................................................... 257
Index ............................................................................................................ 269

ix
Contributors
JILL BARGONETTI • Biology Department, Hunter College, City University ofNew York, New York, NY
MICHAEL BERGER • Lautenberg Center for General and Tumor Immunology,The Hebrew University Hadassah Medical School, Jerusalem, Israel
SUSAN E. BRAY • Department of Surgery and Molecular Oncology, TaysideTissue/Tumour Bank, Ninewells Hospital and Medical School, DundeeUniversity, Dundee, Tayside, Scotland, UK
CHRISTINE CAIN • Biology Department, Hunter College, City University ofNew York, New York, NY
EVIE CARCHMAN • School of Medicine, Virginia Commonwealth University,Richmond, VA
YONG-JIG CHO • Vanderbilt-Ingram Cancer Center, Department of CancerBiology, School of Medicine, Vanderbilt University, Nashville, TN
ASHLEY L. CRAIG • Department of Cellular and Molecular Pathology,Ninewells Hospital and Medical School, Dundee University, Dundee,Tayside, Scotland, UK
SUMITRA DEB • Department of Biochemistry and The Massey Cancer Center,Virginia Commonwealth University, Richmond, VA
SWATI PALIT DEB • Department of Biochemistry and The Massey CancerCenter, Virginia Commonwealth University, Richmond, VA
ANTHONY DELLA PIETRA • Department of Pharmacology, Fox Chase CancerCenter, Philadelphia, PA
MATTHIAS DOBBELSTEIN • Institut für Virologie, Klinikum der UniversitätMarburg, Marburg, Germany
LAWRENCE A. DONEHOWER • Departments of Molecular Virology andMicrobiology and of Molecular and Cellular Biology, Baylor College ofMedicine, Houston, TX
MELISSA L. DUMBLE • Department of Molecular Virology andMicrobiology, Baylor College of Medicine, Houston, TX
PATRICK DUMONT • Department of Pharmacology, Fox Chase Cancer Center,Philadelphia, PA

WAFIK S. EL-DEIRY • Laboratory of Molecular Oncology and Cell CycleRegulation, Howard Hughes Medical Institute, Departments of Medicine,Genetics, and Pharmacology, and the Cancer Center, University ofPennsylvania School of Medicine, Philadelphia, PA
SUSAN ERSTER • Department of Pathology, State University of New York atStony Brook, Stony Brook, NY
LEE E. FINLAN • Department of Cellular and Molecular Pathology,Ninewells Hospital and Medical School, Dundee University, Dundee,Tayside, Scotland, UK
REBECCA FRUM • Department of Biochemistry, Medical College of Virginia,Virginia Commonwealth University, Richmond, VA
YGAL HAUPT • Lautenberg Center for General and Tumor Immunology, TheHebrew University Hadassah Medical School, Jerusalem, Israel
MATTHEW HOLMES • Department of Radiation Oncology, Virus VectorShared Resource, Massey Cancer Center, Medical College of Virginia,Virginia Commonwealth University, Richmond, VA
TED R. HUPP • Department of Cellular and Molecular Pathology, NinewellsHospital and Medical School, Dundee University, Dundee, Tayside,Scotland, UK
ROGER S. JACKSON II • Vanderbilt-Ingram Cancer Center, Department ofCancer Biology, Vanderbilt University, Nashville, TN
TROY W. JOSEPH • Department of Pathology, State University of New York atStony Brook, Stony Brook, NY
DAVID M. KELLER • Department of Biochemistry and Molecular Biology,Oregon Health and Science University, Portland, OR
NEIL M. KERNOHAN • Department of Cellular and Molecular Pathology,Ninewells Hospital and Medical School, Dundee University, Dundee,Tayside, Scotland, UK
PENG LIANG • Department of Cancer Biology, Vanderbilt-Ingram CancerCenter, Vanderbilt University, Nashville, TN
HUA LU • Department of Biochemistry and Molecular Biology, OregonHealth and Science University, Portland, OR
XIONGBIN LU • Department of Molecular Virology and Microbiology, BaylorCollege of Medicine, Houston, TX
MOTOHIRO MIHARA • Department of Pathology, State University of New Yorkat Stony Brook, Stony Brook, NY
MARIA PATRICIA MOLINA • Science Department, Borough of ManhattanCommunity College, City University of New York, New York, NY
UTE M. MOLL • Department of Pathology, State University of New York atStony Brook, Stony Brook, NY
x Contributors

JAMIL MOMAND • Department of Chemistry and Biochemistry, CaliforniaState University at Los Angeles, Los Angeles, CA
MAUREEN E. MURPHY • Department of Pharmacology, Fox Chase CancerCenter, Philadelphia, PA
JOHN NGUYEN • Department of Chemistry and Biochemistry, California StateUniversity at Los Angeles, Los Angeles, CA
ELIZABETH ROSENBERG • Virus Vector Shared Resource, Department ofRadiation Oncology, Massey Cancer Center, Medical College ofVirginia, Virginia Commonwealth University, Richmond, VA
JUDITH ROTH • Abteilung Gastroenterologie, Klinikum der UniversitätMarburg, Marburg, Germany
JOANNA K. SAX • Laboratory of Molecular Oncology and Cell CycleRegulation, Howard Hughes Medical Institute, Departments of Medicine,Genetics, and Pharmacology, and the Cancer Center, University ofPennsylvania School of Medicine, Philadelphia, PA
MARIANO J. SCIAN • Department of Biochemistry, Virginia CommonwealthUniversity, Richmond, VA
NEDA SLADE • Department of Pathology, State University of New York atStony Brook, Stony Brook, NY
KATHERINE E. ROTH STAGLIANO • Department of Biochemistry, VirginiaCommonwealth University, Richmond, VA
SUSANNE STEIN • Department of Cancer Biology, Vanderbilt-Ingram CancerCenter, Vanderbilt University, Nashville, TN
XIU ZHU SUN • Department of Chemistry and Biochemistry, California StateUniversity at Los Angeles, Los Angeles, CA
KRISTOFFER VALERIE • Virus Vector Shared Resource, Department of RadiationOncology, Massey Cancer Center, Medical College of Virginia, VirginiaCommonwealth University, Richmond, VA
SHELYA X. ZENG • Department of Biochemistry and Molecular Biology,Oregon Health and Science University, Portland, OR
Contributors xi

Adenovirus Expressing p53 1
1
From: Methods in Molecular Biology, vol. 234: p53 ProtocolsEdited by: S. Deb and S. P. Deb © Humana Press Inc., Totowa, NJ
1
Adenovirus Expressing p53
Matthew Holmes, Elizabeth Rosenberg, and Kristoffer Valerie
1. IntroductionMutation in the p53 gene is the most frequently found genetic abnormality
in human tumors, resulting in increased resistance to chemo- and radiotherapy(1,2). The underlying rationale for p53-mediated cancer gene therapy is torestore the ability of p53 mutant tumors to undergo apoptosis. When the wild-type p53 gene is delivered into tumor cells of various origins by adenoviralvector, the cells become more sensitive to cisplatin and radiation therapy (3).In addition, adenovirus expressing p53 is a great laboratory tool for the deter-mination of function, for conveniently producing large quantities of p53 pro-tein, and for determining the effect of p53 on cellular gene expression usingmicroarray technology (4).
The technology for making recombinant adenovirus was developed in theearly 1980s by several groups (5,6). Although the principles for makingrecombinant adenovirus remain the same today, sophisticated and clever waysof conveniently making these viruses are continuously evolving. The mostcommonly used virus DNA backbone has the EIA/E1B genes deleted, whichmakes this virus replication incompetent, unless these protein functions areprovided in trans. Stably transfected cell lines that express the E1A and E1Bproteins can support replication of virus (7,8). The E3 region, which is notessential for the adenovirus life cycle, has also been used as an integration sitefor trans-genes in E1A+ adenovirus, in which case the virus is able to replicatein a variety of different cell types (9). The maximum DNA packaging capacityof an adenovirus is 105% of the approx 36-kb adenovirus genome, making itpossible to insert DNA fragments of 7.5–8 kb in the first and second generation
2 Holmes et al.
adenovirus vectors (10), which is usually more than sufficient for typicalapplications. More recent vector designs have taken advantage of removingeither the E2 or E4 or both regions (11,12), making it possible to insert evenlarger pieces of DNA. Conditionally replicating adenoviruses have beendeveloped that only replicate in p53 mutant cells or in tumor cells using atumor-specific promoter driving E1A/E1B expression, and are expected toimprove the spread of virus within the tumor (13,14).
A number of different ways for constructing recombinant adenovirus havebeen reported (5,6). More recently, methods have been developed that relyentirely on making virus in bacteria (15–17). A plasmid having the entire aden-ovirus genome with the desired mutations and/or deletions is used. This plas-mid is linearized at the desired site of trans-gene insertion, e.g., either in theE1A or E3 regions, and mixed with a DNA fragment having the trans-geneflanked by DNA sequences homologous to the flanking sequences in the lin-earized plasmid. These DNAs are then introduced by standard bacterial trans-formation into an Escherichia coli strain with mutations in the recB and recCgenes (16). As a result, these cells are void of any exonuclease RecB/C activityand are highly prone to undergo homologous recombination of the linearizedDNAs. A large proportion of the resulting plasmid clones will have the desiredtrans-gene inserted into the larger plasmid. The adenovirus DNA, includingthe trans-gene, is then released from this plasmid by digestion with a restric-tion endonuclease. Subsequently, adenovirus is made by transfecting human293 cells, which express the E1A/E1B proteins, allowing for replication andmaturation of virus. This bacterial approach for generating recombinant aden-ovirus is very attractive, not only because of the ease and speed by which onecan generate new virus, but also because the resulting adenovirus is clonaleven before it passes through the 293 cells. Therefore, only one or a few plas-mid clones may have to be transfected into 293 cells and tested for trans-genefunction without the tedious and repeated plaque purification that is neededusing the more traditional methods for making virus.
This chapter describes in detail our protocol for making adenoviruses inbacteria expressing various p53 derivatives, including wild-type and mutantproteins (R175H, N239S, R248W, R273H, D281G, CTD305–392), that we haveused to investigate ways of increasing radiosensitization of human glioma cells(3) (Valerie et al., in preparation).
2. Materials1. pTGCMV, pZeroTGCMV, p53 cDNA plasmids.2. E. coli strains BJ5183, XL1-Blue (Stratagene, La Jolla, CA, USA).3. Restriction endonucleases (New England Biolabs, Beverly, MA, USA), PacI,
PmeI, etc.

Adenovirus Expressing p53 3
4. HEK293 (for making virus), A549, or other suitable cell line that can easily betransduced by adenovirus.
5. Tissue culture media and fetal bovine serum (FBS), antibiotics, dishes and flasks,Noble agar (Difco, Detroit, MI, USA), etc.
6. Standard molecular biology supplies: CsCl, Tris buffer, NaCl, polythylene gly-col (PEG)-8000 (Fisher Scientific, Pittsburgh, PA, USA), etc.
7. Supplies for growing E. coli: T broth, agar, Petri dishes, etc.8. Ampicillin, kanamycin, carbenicillin (Sigma, St. Louis, MO, USA).9. Centrifuges and rotors: Sorvall® (GS-3) (NEN® Life Science Products, Boston,
MA, USA); Beckman Instruments (Fullerton, CA, USA) (SW28, SW41), orequivalent.
10. Superfect (Qiagen, Valencia, CA, USA; cat. no. 301307), or equivalent transfec-tion reagent.
11. Agarose electrophoresis equipment.12. Sodium dodecyl sulfate polyacrylamide gel electrophoresis (SDS-PAGE) equip-
ment and gels.13. Anti-p53 antibody (Ab-1; Calbiochem-Novabiochem, San Diego, CA, USA).14. Western blot equipment, e.g., Bio-Rad (Hercules, CA, USA) electrophoresis and
transfer units.15. Dialysis cassettes (Pierce Chemical, Rockford, IL, USA)
2.1. Solutions
1. LB agar (500 mL): 5 g bacto-tryptone, 2.5 g bacto-yeast extract, 5 g NaCl, 7.5 gbacto-agar. Adjust the pH by adding 150 μL of 10 N NaOH. Bring vol to 500 mLwith deionized water. Autoclave.To pour plates:Melt agar in microwave or use directly from autoclave.Cool to 55°C.To 500 mL of agar, add 500 μL filter-sterilized ampicillin (100 mg/mL stock) orcarbenicillin (50 mg/mL stock) to 100 or 50 μg/mL final concentration or 500 μLkanamycin (30 mg/mL stock) to 30 μg/mL final concentration.Add 5 mL filter-sterilized 20% glucose.Makes 20–25 plates.
2. SOB (500 mL): 10 g bacto-tryptone, 2.5 g bacto-yeast extract, 0.25 g NaCl. Bringvol to 500 mL with deionized water. Autoclave.
3. T broth (4 L): 48 g bacto-tryptone, 96 g bacto-yeast extract, 16 mL glycerol.Bring vol to 4 L with deioinized water. Autoclave.
4. SOC (25 mL): 25 mL SOB, 250 μL 1 M MgCl2, 250 μL 1 M MgSO4, 500 μL 20%glucose. Filter-sterilize (0.22 μm).
5. TB salt (100 mL): 2.31 g KH2PO4, 12.54 g K2HP04. Bring vol to 100 mL withdeionized water. Autoclave. Add 50 mL TB salt per 500 mL TB broth before use.
6. 1.8% Noble agar: 0.45 g Noble agar (Difco; cat. no. 0142-15-2). Put into 125-mLbottle. Bring vol to 25 mL with distilled water. Autoclave.

4 Holmes et al.
7. 10 mM Tris-HCl (500 mL): 0.6 g Tris-base. Bring vol to 450 mL. Use concen-trated HCl to adjust the pH to 8.0. Bring vol to 500 mL with distilled water.Filter-sterilize (0.22 μm) and store refrigerated.
8. Light CsCl (100 mL): 28.85 g CsCl. Bring vol to 100 mL with 10 mM Tris-HCl(pH 8.0). Filter-sterilize (0.22 μm) and store refrigerated.
9. Heavy CsCl (100 mL): 73.44 g CsCl. Bring vol to 100 mL of 10 mM Tris-HCl(pH 8.0). Filter-sterilize (0.22 μm) and store refrigerated.
10. Dialysis buffer: 13% glycerol in 1X phosphate-buffered saline (PBS) with 2 mMMgCl2 (4 L): 520 mL glycerol, 38.2 g PBS (Sigma), 4 mL 2 M MgCl2 (sterile).Bring vol to 4 L with distilled water. Filter-sterilize (0.22 μm) into 500-mL ster-ile glass bottles (store refrigerated).
11. 20% PEG-8000 with 2.5 M NaCl (1 L): 200 g of PEG-8000, 146.1 g NaCl. Bringvol to 1 L with distilled water. Heat gently to dissolve. Autoclave.
12. 2X Dulbecco’s modified Eagle’s medium (DMEM) (500 mL): 13.5 g DMEM(Sigma; cat. no. D-7777), 3.7 g sodium bicarbonate. Bring vol to 500 mL withdistilled water. Filter-sterilize (0.22 μm) and dispense 100 mL in sterile 125-mLglass bottles. Store refrigerated. Add 1 mL FBS and 0.5 mL penicillin–strepto-mycin (pen/strep) per 25 mL when used.
3. MethodsIn the following sections, we describe how to make a first-generation aden-
ovirus expressing human p53. The steps involve: (i) cloning of the p53 cDNAin the adenovirus transfer plasmid, pZeroTGCMV; (ii) recombination of thep53 expression cassette into the adenovirus plasmid, pTGCMV; (iii) genera-tion of adenovirus in HEK293 cells; (iv) characterization of p53 adenovirus;and (v) purification of a large-scale preparation of p53 adenovirus.
3.1. Transformation and Recombination in Bacteria
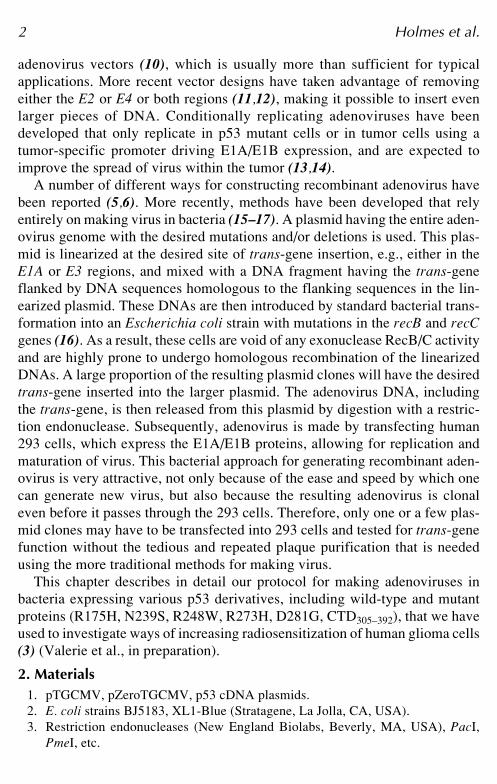
The first step to generate an adenovirus expressing p53 is to clone the cDNAinto pZeroTGCMV, a modified version of the plasmid pTG9539 (16), whichconfers kanamycin resistance rather than ampicillin. The wild-type and R273Hp53 cDNAs were isolated from pLp53BRHL and pLp53ERNL (kindly pro-vided by Wen-Hwa Lee, University of Texas, San Antonio, TX) on an agarosegel and cloned into pZeroTGCMV (18). Once the “transfer plasmid” has beenmade (Fig. 1), follow the procedure below.
3.1.1. Preparation of Adenovirus Transfer Plasmid
1. Digest 5–10 μg of pZeroTGCMV-p53 plasmid DNA overnight with PacI, fol-lowed by digestion with a second enzyme that cuts downstream of the insert (butdoes not cut within the insert). We generally use BglII or Bsu36I (see Note 1).Sequential digestion may be necessary if the enzymes are not compatible withthe same buffer.
2. Run 5 μL (1/20 total vol) on 1% agarose gel to ensure complete digestion.

Adenovirus Expressing p53 5
3. Phenol extract and ethanol precipitate DNA.4. Resuspend in 10 μL TE buffer and run 1 μL on an agarose gel to quantify by
visualization.
3.1.2. Transformation of BJ5183 Cells
In this step, the released Ad-cytomegalovirus (CMV)-p53-Ad DNAfragment is recombined into ClaI-digested pTGCMV (Fig. 2). Co-transform3–5 μg of digested pZeroTGCMV-p53 with 0.5 μg of ClaI-digested pTGCMV,as follows:
1. Thaw competent BJ5183 cells (see Note 2) on ice. Aliquot 50 μL of cells for eachtransformation. Include in separate tubes; negative controls (no DNA andpTGCMV digested with ClaI [0.5 μg]) and positive control (uncut pTGCMV[0.5 μg]). The pTGCMV/ClaI control transformation should produce significantlyfewer colonies on agar plates than co-transformation with pZero-TGCMV-p53.
2. Add DNA to competent cells, and incubate on ice for 30 min. Keep DNA to 10%or less of cell vol (e.g., 5 μL of DNA to 50 μL of cells).
3. Heat shock at 42°C degrees for 80 s.
Fig. 1. Advenovirus transfer plasmid.

6 Holmes et al.
4. Incubate on ice for 2 min.5. Add 400 μL SOC broth to each tube.6. Incubate at 37°C for 1–1.5 h.7. Spread 150 μL from each transformation reaction onto a LB-carbenicillin plate
and incubate plate overnight at 37°C. We use carbenicillin rather than ampicillin,because “satellites” form on ampicillin plates.
8. The following morning, check negative and positive control plates. There shouldbe no colonies on the “No DNA” plate, many on the “uncut pTGCMV” plate, andno to few colonies on the “pTGCMV/ClaI” plate. There should be more colonieson the plate that received both pZeroTGCMV-p53 and pTGCMV/ClaI. Pick fourcolonies from this plate, and grow 10-mL cultures in T Broth supplemented withampicillin (100 μg/mL).
9. Shake at 37°C for 6–8 h or overnight (see Note 3).10. Centrifuge at 5000 rpm (4400g) for 5 min, pour off supernatant, freeze bacterial
cell pellet on dry ice, and store at –20°C until ready to proceed.
Fig. 2. Recombination in E. coli for generating adenovirus.

Adenovirus Expressing p53 7
3.1.3. Purification of Plasmid DNA and Transformationinto XL-1 Blue Cells
The quality of the plasmid DNA from BJ5183 cells is generally very poor.Therefore, we find it more convenient to pick a handful of colonies, transferthe plasmid DNA into XL-1 Blue cells, and perform restriction digest analysisrather than using polymerase chain reaction (PCR) to identify positive clones.The recombination in BJ5183 cells occurs with high probability, so one doesnot need to examine many clones to get the desired one.
1. Purify plasmid DNA using Bio-Rad’s Plasmid Miniprep Kit or similar method.Elute DNA in 100 μL.
2. Transform 5 μL of DNA (1/20 of miniprep) with 50 μL of competent cells. Set upone reaction for each BJ5183 colony pick (should be four reactions total) and onepositive control using 0.5 μL of pUC18 control from Stratagene (provided withcompetent cells).
3. Add 0.85 μL of 2-mercaptoethanol per reaction and incubate on ice for 10 min.4. Add DNA to tubes and incubate on ice for 30 min.5. Heat shock at 42°C for 45 s.6. Incubate on ice for 2 min.7. Add 400 μL TB broth to each tube.8. Incubate at 37°C for 1.5 h.9. Spread 50–150 μL from each transformation reaction onto LB-ampicillin plates
and incubate overnight at 37°C.10. The following day, pick one colony from each plate and grow 10-mL cultures in
T Broth supplemented with ampicillin.11. Shake at 37°C overnight.12. Remove 1-mL of bacterial culture from each tube, and store at 4°C in microfuge
tube until positive clones have been identified. Upon positive confirmation thatthe p53 gene has been successfully recombined into the pTGCMV plasmid, freezecells in 20% sterile glycerol at –80°C in a screw-cap tube.
13. Centrifuge remaining 9 mL of bacterial culture at 5000 rpm (4400g) for 5 min, pouroff supernatant, and purify plasmid DNA using Bio-Rad’s Plasmid Miniprep Kit.
3.1.4. Confirmation of Successful Transfer of the p53 cDNAinto Adenoviral Plasmid and Preparation of DNA for Transfection
1. Digest 4 μL of DNA (1/25 total miniprep elution) with EcoRI. Digest 1 μg ofpTGCMV as a control. Run an aliquot from each digest on a 1% agarose gel.
2. Determine if plasmids are positive for the trans-gene by comparing EcoRI-digestedpTGCMV and pTGCMV-p53. The smallest fragment of 1.7 kb should change insize, since this is the fragment into which the p53 cassette is transferred.
3. Choose one positive plasmid, and digest 50 μL of DNA (1/2 total miniprep elu-tion) with PacI overnight.

8 Holmes et al.
4. The next day, check for completion of digest by agarose gel electrophoresis. Afragment corresponding to the plasmid backbone (approx 3 kbp) should be visibleon the gel. Phenol/CHCl3 extract and EtOH precipitate. Dry pellet, and resus-pend in 20 μL of TE buffer. Check quantity of DNA on agarose gel.
5. Proceed with transfection.
3.2. Transfection and Generation of Adenovirus
3.2.1. Transfection of p53 Adenoviral Plasmid into HEK293 Cells
1. Grow 293 cells to approx 90% confluence on 6-cm dishes. Dishes should beseeded 2 d prior to transfection to allow for sufficient cell attachment.
2. Use 3–5 μg of DNA (pTGCMV-p53/PacI) and 2.5 μg of control DNA(pTGCMV/PacI). Also use one dish as a negative control. Add DNA to a sterile5-mL polypropylene tube.
3. Add 150 μL of DMEM (without FBS and pen/strep) to each tube and vortex mix.4. Add 30 μL of Superfect transfection reagent to each tube and vortex mix. Spin at
2000 rpm (700g) for 15–20 s.5. Incubate 5–10 min at room temperature.6. Immediately before adding DNA/Superfect complex to cells, remove all media
from dishes.7. Add 1 mL complete DMEM (10% FBS, pen/strep) to each tube, mix by pipeting,
and add to cells.8. Rock 2 h on a rocker (Bellco) placed in a tissue culture incubator.9. Add 4 mL of fresh media to each dish and incubate overnight.
10. Remove the media the following morning and overlay (as when titering virus;see Subheading 3.4.) with a 1.8% Noble agar/DMEM solution. Add 5 mL ofoverlay solution to each dish. Let cool in hood for 10 min and return dishes toincubator.
11. Wait for plaques to show, which generally takes 1 to 2 wk (see Note 4).
3.2.2. Isolation of Primary Plaque
1. Grow 293 cells to confluence in a 24-well plate.2. Add 300 μL of fresh DMEM (10% FBS, pen/strep) to sterile microfuge tubes.3. Using sterile Pasteur pipets, pick isolated virus plaques by penetrating the agar
overlay with the pipet tip. Remove the agar piece and transfer into a microfugetube containing DMEM. Pipet up and down to wash the tip and drop a smallamount of media onto the plaque to wash as well. Pick five plaques per plate.Vortex mix each tube and incubate on ice for 30 min to 1 h. Centrifuge at 14,000rpm (16,000g) for 1 min.
4. Remove media from wells of 24-well plate, leaving approx 150 μL per well.Add 100 μL of virus to each well. Freeze primary pick plaques and store frozenat –20°C.
5. Rock plate for 2 h in tissue culture incubator.6. Add 1 mL of fresh media to each well of infected cells.

Adenovirus Expressing p53 9
7. Incubate and wait for cells to lift from plate. Monitor daily for cytopathic effects,which could take up to 1 wk.
8. After evidence of good infection, pipet up and down to detach all cells and removemedia from each well into a sterile 2-mL screw-cap tube. Freeze and store –20°C(see Note 5).
3.3. Large-Scale Virus Preparation and CsCl Purification
3.3.1. Infection of 293 Cells
1. Start with 50 15-cm dishes of 293 cells grown to confluence grown in DMEMsupplemented with 10% FBS and pen/strep. Add 2 mL of Fungizone (Life Tech-nologies, Rockville, MO, USA) per liter DMEM to avoid fungal contamination.
2. Thaw secondary virus stock at 37°C and place on ice.3. Dilute appropriate vol of crude virus (based on known titer and multiplicity of
infection [MOI] equal to 1) in enough conditioned media to achieve final vol of55 mL.
4. Remove media from the 15-cm dishes, leaving 10 mL of media on each dish, andadd 1 mL of virus suspension to each dish.
5. Rock plates for 2 h on rocker in tissue culture incubator.6. Add back 9 mL of fresh media (supplemented only with pen/strep, no FBS) to
each dish.7. Incubate until all cells have lifted from surface of plate, which takes 5–7 d with
an MOI of 1.
3.3.2. Harvesting of Cells
1. Harvest by scraping cells with media still on dish. Be careful to avoid contami-nated dishes (add Chlorox to contaminated dishes [10% final concentration] andautoclave infectious waste).
2. Remove the cell-containing media from each dish with a 25-mL pipet, and trans-fer into autoclaved 200-mL centrifugation buckets (Sorvall).
3. After all dishes have been harvested, spin at 5000 rpm (2100g) for 15 min toremove cell debris (see Note 6).
4. Transfer virus-containing lysate into autoclaved 500-mL centrifugation buckets.5. Resuspend cell pellets in 10–20 mL of the supernatant and transfer to a 50-mL
conical tube. For CsCl gradient the following day, store buckets on ice at 4°Covernight. Otherwise, freeze virus-containing supernatant and resuspended cellpellet on dry ice and store at –20°C (thaw overnight at 4°C when ready for CsClgradient).
3.3.3. Washing of Cell Pellet
1. Resuspended cell pellet must go through 3 freeze–thaw cycles (freeze on dry iceand thaw at 37°C).
2. After thawing cell suspension for the third time (only proceed with this step onthe day of CsCl purification), spin at 3000 rpm (1600g) for 5 min.

10 Holmes et al.
3. Transfer supernatant into a new tube and wash remaining cell pellet with 5 mL ofsterile 10 mM Tris-HCl (pH 8.0). Spin again at 3000 rpm (1600g) for 5 min.
4. Transfer supernatant to previously collected supernatant and wash again with5 mL Tris-HCl. Spin at 5000 rpm (2100g) for 5 min. Transfer supernatant again,and wash once more (third wash) with 5 mL Tris-HCl. Spin at 5000 rpm for5 min and transfer supernatant. Now take collected supernatant and spin at 5000rpm for 5 min. Distribute supernatant equally among virus-containing lysate al-ready in 500-mL buckets. Discard cell pellet.
3.3.4. Precipitation of Virus with PEG
1. Add 0.5 vol 20% PEG-8000/2.5MNaCl to each bucket. Incubate on ice for 1 h toprecipitate virus particles.
2. Centrifuge buckets in a Sorvall Superlite GS-3 rotor at 8000 rpm (10,800g) for30 min at 4°C. Remove supernatant, autoclave, and dispose. Resuspend viralpellet in 25 mL of 10 mM Tris-HCl, using a 10-mL plastic pipet. Be sure toresuspend precipitate thoroughly. Keep virus suspension on ice while working.Transfer virus suspension to a sterile 50-mL tube.
3.3.5. First CsCl Gradient
1. In each of two 30-mL polyallomer tubes, aliquot 8 mL of light CsCl. Underlaylight CsCl with 8 mL of heavy CsCl. Carefully add the virus suspension onto thetop of the light CsCl layer. Distribute virus equally between the two tubes. Addno more than 13 mL of virus suspension to each tube.
2. Spin at 20,000 rpm (72,000g) for 2 h at 4°C in Beckman SW28 rotor. If neces-sary, balance with 10 mM Tris-HCl. Disable brake after centrifuge has startedspinning. This is a “timed” spin.
3. Carefully collect virus band (in a sterile 15-mL tube) by piercing the bottom ofeach tube with a sterile 20-gage needle. Collect waste below, and above virusband in 50-mL tubes.
4. Quantify the collected vol of virus (limit to 3 mL) and slowly add an equal vol of10 mM Tris-HCl. Add Tris-HCl in a drop-wise fashion, mixing while adding.
3.3.6. Second CsCl Gradient
1. In each of two 12-mL polyallomer tubes, aliquot 3.3 mL of light CsCl. Underlaylight CsCl with 3.3 mL of heavy CsCl, using a Pasteur pipet. Evenly distributevirus among the two tubes by carefully adding it onto the layer of light CsCl (asin the preparation of the first CsCl gradient). Add no more than 3 mL of virus toeach tube.
2. Spin overnight (approx 16 h) at 20,000 rpm (68,500g) and 4°C. Use BeckmanSW41 or equivalent rotor.

Adenovirus Expressing p53 11
3.3.7. Dialysis
1. The following morning, stop the centrifuge without using the brake. Collect thevirus band as before, and again limit collection to 3 mL total vol.
2. Using a 3-mL syringe and 1.5-in. 20-gage needle, withdraw the virus, and care-fully inject it into a 3-mL dialysis cassette (Pierce Chemical). We use dialysiscassettes, but regular dialysis tubing could be used instead. However, it is criticalto keep the virus sterile, which is easier when using the dialysis cassette.
3. Attach a styrofoam floater to the top of the cassette where the virus suspensionwas injected, and place into a sterile 250-mL beaker (with magnetic stir bar). Fillbeaker with dialysis buffer and place it on a stir plate at 4°C in a cold room. After30 min, change dialysis buffer. Continue to change dialysis buffer four moretimes at 1-h intervals. Entire dialysis should take 5 to 6 h.
4. Remove the cassette from the beaker. Using another 3-mL syringe with needle,remove the virus from the cassette, and transfer purified virus into a sterile 2-mLtube on ice. Be sure to insert the needle through the top of the cassette to avoidcontamination.
5. Aliquot purified virus into sterile 500-μL microtubes in appropriate sizes, snap-freeze in liquid nitrogen, and store in –80°C freezer.
6. Autoclave and clean reusable items, such as centrifuge buckets, etc. (see Note 7).
3.4. Quantification of Virus
3.4.1. Titering
For each virus to be titered, grow five 6-cm dishes of 293 cells to confluence.For crude virus, thaw at 37°C. For CsCl purified virus, thaw on ice.
3.4.2. Serial Dilutions
1. Serially 10-fold dilute virus in microfuge tubes containing fresh DMEM (10%FBS and pen/strep), starting with 1:100 dilution of virus. Use aerosol-resistantpipet tips, changing them between each dilution. For the first dilution, add 5 μLof virus to 495 μL of media. Vortex mix for 5 s, and be careful not to splashmedia onto cap of microfuge tube.
2. Next, remove 50 μL from the first tube and add it to 450 μL of media in thesecond tube. Vortex mix. Continue diluting 1:10 until end dilution is reached(typically 10–10 for CsCl-purified virus) (see Note 8).Example:Tube 1 = 10–2dilution: add 5 μL of virus to 495 μL of media. Vortex mix.Tube 2 = 10–3dilution: remove 50 μL from Tube 1 and add to 450 μL of media.Vortex mix.

12 Holmes et al.
Tube 3 = 10–4dilution: remove 50 μL from Tube 2 and add to 450 μL of media.Vortex mix, etc.
3. After dilutions are completed, remove media from 6-cm dishes, leaving 2 mL/dish. Beginning with the highest dilution, add 200 μL of virus dilution per dish.One dish per dilution for four dilutions. Rock plates for 2 h on rocker in tissueculture incubator.
3.4.3. Agar Overlay
1. Approximately 30 min before overlaying dishes, prepare overlay solutions:melt previously autoclaved 25 mL of 1.8% Noble agar solution in 125-mLglass bottle in microwave and keep at 42°C in water bath. Aliquot 25 mL of2X DMEM into a sterile 50-mL tube, add 1 mL of FBS and 0.5 mL of pen/strep, and warm to 37°C.
2. Immediately before overlaying, combine 25 mL of Noble agar with 25 mL of 2XDMEM in glass bottle to make overlay solution. Swirl to obtain a homogenousmixture. It is critical that the final vol is 50 mL. In case water has evaporatedfrom the bottle with the autoclaved agar, which happens occasionally whenstored, add sterile distilled water to 50 mL final.
3. Beginning with the dish with the highest virus dilution, remove all of the virus-containing media from each of the four dishes, and discard in a virus waste con-tainer (bleach added to make a concentration of 10% of final waste vol) using a10-mL plastic pipet. Use the same pipet to speed up the process. It is critical thatthe cell monolayer is not left to dry for more than 1 min.
4. Again, beginning with the dish of highest dilution (least virus), slowly add 5 mLof overlay solution to each dish from a 25-mL plastic pipet. Add the overlaysolution drop-wise with the tip close to the edge of the dish while gently tiltingthe dish. Be careful not to break the cell monolayer.
5. After adding overlay to a dish, immediately rock back and forth gently a fewtimes to allow for any remaining medium left on the dish to mix fully with theoverlay. If this is not done, there may be a liquid layer between the cells and theoverlay. This causes the cells and virus to move freely, and no distinct plaqueswill be obtained.
6. Allow dishes to cool in hood for 10 min and then return to incubator. It is advan-tageous to leave the dishes on the cool metal surface, since this dissipates the heatmore quickly than if left on a more heat-buffering surface.
7. Plaques should show over the next 2 wk.
3.4.4. Neutral Red Agar Overlay
1. Thirteen days after infection, overlay the existing overlay with a 3-mL overlaysolution containing neutral red (Sigma). Prepare overlay solution as before, butadd 500 μL of 1% neutral red (100X) to the 50 mL of Noble agar/DMEM solu-tion. Swirl to mix. Add 3 mL of overlay solution (now containing neutral red) toeach plate over the existing overlay.

Adenovirus Expressing p53 13
2. Allow plates to cool in hood and return to incubator. Count plaques the followingday, when cells are stained red, and plaques appear as opaque holes.
3.4.5. Counting Virus Plaques and Calculating the Titer
1. The day following the neutral red overlay, plaques should be counted on eachplate. This is exactly 14 d after infection. A 10-fold difference in plaque numbersbetween plates should be observed if dilutions were done accurately. Calculatetiter by multiplying number of plaques by appropriate dilution factor (see Note 9):Plate Dilution factor10–5dilution no. plaques multiplied by 5 × 10⁵
10–6dilution no. plaques multiplied by 5 × 10⁶, etc.Example:Eight plaques counted on a 10–6 dish = 8 × 5 × 106 = 4 × 10⁷ plaque-forming unit(pfu)/mL
3.4.6. Viral Particle Number
Because the conditions for determining viral titers vary tremendously fromlaboratory to laboratory, a more objective way of estimating the titer is to de-termine the DNA concentration of SDS-treated CsCl-purified virus by deter-mining the absorbance using 260/280 readings on any standard UVspectrometer. The relationship between virus particle (vp) number and absor-bance is: 1 A260 unit = 1.1 × 10¹² vp (19). If a pure virus preparation is obtainedfrom the second CsCl gradient without any contamination of cellular DNA,RNA, or protein, then the A260/A280 ratio should be between 1.2–1.3 (20). Un-der our conditions for titering virus on 6-cm dishes (slowly rocking in tissueculture incubator for 2 h) and reading the plates after 14 d, we see a vp:pfu ratioof 20, i.e., for each infectious virus there are 20 vp.
3.5. Characterization of p53 Virus
To determine whether the virus expresses p53, we perform Western blotanalysis of extracts from appropriate cells transduced at different MOI. Thecells used should be those planned for future experiments. When we check forexpression of the trans-gene, we often use 293 cells. The signal on Westernblots will be amplified due to virus replication. It is then important to harvestthe cells within 24 h after transduction, since they would otherwise lyse, andthe proteins would then get lost into the tissue culture medium. In case of p53adenovirus, infection and expression of p53 in 293 cells is not possible, sincep53 is highly unstable in 293 cells due to the presence of E1A. In the exampleshown here, we use mouse astrocytoma p53 (–/–) knock-out cells or humanU87 (p53+) glioma cells transduced with viruses expressing either wild-typeor R273H mutant p53 at MOIs of 10 or 100 (Fig. 3).

14 Holmes et al.
4. Notes1. We have modified the pZeroTGCMV plasmid to have a PmeI site instead of the
BglII site, thus making it more convenient to release the trans-gene cassette. PmeIis a rare cutting restriction enzyme that is unlikely to cut the DNA insert.
2. We usually prepare competent BJ5183 by the method of Hanahan (21) and keepfrozen aliquots in the –80°C freezer.
3. We find that if the BJ5183 culture is overgrown, then plasmid deletions occur athigher frequency. Therefore, we are careful not to overgrow these cultures.
4. To speed up the process of generating adenovirus, we usually pool the contentfrom one transfected dish that has not been overlaid with Noble agar. Thus, thesupernatant contains a mixture of clones, but since the plasmid they were gener-ated from was cloned in bacteria, they should all be the same.
5. Secondary stocks are prepared by infecting 10- or 15-cm dishes confluent with293 cells. Upon complete detachment of cells from the dish, collect cells in me-dium, freeze-thaw 3X, and centrifuge to obtain a clear supernatant that isaliquoted and snap-frozen for future use.
6. Save the equivalent of two dishes to make crude virus stocks to be used for futurelarge-scale infections and virus purification. Harvest by scraping, but transfermedia from these dishes separately into a sterile 50-mL tube. Proceed as in crudevirus production with three freeze–thaw cycles. Centrifuge and transfer superna-tant to sterile 15-mL tubes. Save a small aliquot for titering. Freeze all tubes ondry ice and store at –20°C.
Fig. 3. Transduction of (A) mouse Ast. 11.9-2 (p53-/-) and (B) human U87 gliomacells with adenovirus expressing p53.

Adenovirus Expressing p53 15
7. For small and large collection bottles, add tap water until one-fourth full. Auto-clave on liquid cycle for 30 min. Discard liquid waste and rinse with deionizedwater. Allow to dry, and then autoclave on dry cycle (30 min to sterilize and 10min to steam dry) for the next time. For SW28 and SW41 swinging buckets, letsoak in a warm detergent solution (use Alconox) for several hours. Rinse withdeionized water to remove detergent residue, allow to dry, and return buckets tostorage at 4°C.
8. When titering crude virus, end dilution will be 10–8. Plate dilutions 10–5 through10–8. When titering CsCl-purified virus, the end dilution will be 10–10. Plate dilu-tions 10–7 through 10–10.
9. Crude stocks usually range in titer from 107–109 pfu/mL. CsCl-purified stocksrange in titer from 1010–1012 pfu/mL.
Acknowledgments
We thank Wen-Wha Lee and Mathias Wymann for plasmids. This work wassupported by U. S. Public Health Serive (USPHS) grant nos. CA53119,CA65896, and P01CA72955.
References
1. Roth, J. A., Swisher, S. G., and Meyn, R. E. (1999) p53 tumor suppressor genetherapy for cancer. Oncology (Huntingt) 13, 148–154.
2. Roth, J. A., Grammer, S. F., Swisher, S. G., Nemunaitis, J., Merritt, J., and Meyn,R. E., Jr. (2000) Gene replacement strategies for treating non-small cell lung can-cer. Semin. Radiat. Oncol. 10, 333–342.
3. Broaddus, W. C., Liu, Y., Steele, L. L., et al. (1999) Enhanced radiosensitivityof malignant glioma cells after adenoviral p53 transduction. J. Neurosurg. 91,997–1004.
4. Maxwell, S. A. and Davis, G. E. (2000) Differential gene expression in p53-medi-ated apoptosis-resistant vs. apoptosis-sensitive tumor cell lines. Proc. Natl. Acad.Sci. USA 97, 13,009–13,014.
5. Berkner, K. L. and Sharp, P. A. (1983) Generation of adenovirus by transfectionof plasmids. Nucleic Acids Res. 11, 6003–6020.
6. Gluzman, Y., Reichl, H., and Solnick, D. (1982) Helper-free adenovirus type-5vectors, in Eukaryotic Viral Vectors (Gluzman, Y., ed.), Cold Spring Harbor Press,Cold Spring Harbor, NY, pp. 187–192.
7. Gerard, R. D. and Meidell, R. S. (1995) Adenovirus vectors, in DNA Cloning—APractical Approach: Mammalian Systems, (Rickwood, D. and Hanes, B. D., eds.),IRL Press, Oxford, UK, pp. 285–306.
8. Hitt, M. M., Bett, A. J., Addison, C. L., Prevec, L., and Graham, F. L. (1995)Techniques for human adenovirus vector construction and characterization, in:Methods in Molecular Genetics (Adolph, K. W., ed.), Academic Press, San Diego,pp. 13–30.

16 Holmes et al.
9. Johnson, D. C., Ghosh-Choudhury, G., Smiley, J. R., Fallis, L., and Graham, F. L.(1988) Abundant expression of herpes simplex virus glycoprotein gB using anadenovirus vector. Virology 164, 1–14.
10. Bett, A. J., Prevec, L., and Graham, F. L. (1993) Packaging capacity and stabilityof human adenovirus type 5 vectors. J. Virol. 67, 5911–5921.
11. Gorziglia, M. I., Kadan, M. J., Yei, S., et al. (1996) Elimination of both E1 and E2from adenovirus vectors further improves prospects for in vivo human genetherapy. J. Virol. 70, 4173–4178.
12. Gao, G. P., Yang, Y., and Wilson, J. M. (1996) Biology of adenovirus vectorswith E1 and E4 deletions for liver-directed gene therapy. J. Virol. 70, 8934–8943.
13. Zhang, W. W. (1999) Development and application of adenoviral vectors for genetherapy of cancer. Cancer Gene Ther. 6, 113–138.
14. Kruyt, F. A. and Curiel, D. T. (2002) Toward a new generation of conditionallyreplicating adenoviruses: pairing tumor selectivity with maximal oncolysis. Hum.Gene Ther. 13, 485–495.
15. Crouzet, J., Naudin, L., Orsini, C., et al. (1997) Recombinational construction inEscherichia coli of infectious adenoviral genomes. Proc. Natl. Acad. Sci. USA 94,1414–1419.
16. Chartier, C., Degryse, E., Gantzer, M., Dieterle, A., Pavirani, A., and Mehtali, M.(1996) Efficient generation of recombinant adenovirus vectors by homologousrecombination in Escherichia coli. J. Virol. 70, 4805–4810.
17. He, T. C., Zhou, S., da Costa, L. T., Yu, J., Kinzler, K. W., and Vogelstein, B.(1998) A simplified system for generating recombinant adenoviruses. Proc. Natl.Acad. Sci. USA 95, 2509–2514.
18. Chen, P. L., Chen, Y. M., Bookstein, R., and Lee, W. H. (1990) Genetic mecha-nisms of tumor suppression by the human p53 gene. Science 250, 1576–1580.
19. Maizel, J. V., Jr., White, D. O., and Scharff, M. D. (1968) The polypeptides ofadenovirus I. Evidence for multiple protein components in the virion and a com-parison of types 2, 7A, and 12. Virology 36, 115–125.
20. Shabram, P. W., Giroux, D. D., Goudreau, A. M., et al. (1997) Analytical anion-exchange HPLC of recombinant type-5 adenoviral particles. Hum. Gene Ther. 8,453–465.
21. Hanahan, D. (1983) Studies on transformation of Escherichia coli with plasmids.J. Mol. Biol. 166, 557–580.

Purification of p53 17
17
From: Methods in Molecular Biology, vol. 234: p53 ProtocolsEdited by: S. Deb and S. P. Deb © Humana Press Inc., Totowa, NJ
2
Purification of Recombinant p53 from Sf9 Insect Cells
Xiu Zhu Sun, John Nguyen, and Jamil Momand
SummaryWe describe a method for purifying recombinant p53 from baculovirus infected cells in one
step by anion exchange chromatography. The p53 is full-length with no flanking sequences andits expression is driven by the baculovirus polyhedron promoter. We also describe how to con-centrate the p53 up to 0.9 mg/mL. By gel filtration analysis, we demonstrate that 20% of thep53 forms a tetramer, and 80% forms a monomer. In a DNA binding assay known as theelectromobility shift assay, the purified p53/DNA complex forms a single band the gel. Thissimple procedure should be useful for investigations into the biochemistry of the p53 protein.
Key Wordsanion exchange chromatography, gel filtration chromatography, virus titer
1. IntroductionHuman p53 is a protein with a theoretical molecular weight of 43,653 Da,
based on its amino acid sequence. p53 is conserved within a wide variety ofeukaryotes (1). The term p53 was coined because it has an apparent molecularweight of 53,000 Da when compared to proteins of known size upon analysis bysodium dodecyl sulfate polyacrylamide gel electrophoresis (SDS-PAGE). Aftercellular DNA damage, p53 up-regulates the expression of genes that repairDNA, prevent cell cycle progression, and initiate apoptosis. These activities areessential for human tumor suppression and, hence, mutations in the p53 geneare prevalent in a wide variety of tumors (2,3). The full-length polypeptide ofthe gene product can form a homotetramer that has an unusual shape. The tet-ramer has an increased Stokes’ radius when compared to globular proteins ofknown molecular weight (4). The homotetramer binds to p53 responsivesequences in the promoters of several genes. Perturbation of the C terminus byacetylation, phosphorylation, or noncovalent interaction with other macromol-

18 Sun et al.
ecules often increases the affinity of p53 for its responsive element. This com-munication describes the method we use to routinely generate high levels ofhuman p53 from Spodoptera frugiperda 9 (Sf9) insect cells infected withrecombinant baculovirus. This method is a modification of the one originallyused by Delphin and his colleagues (5). We also describe an analysis of thepurified p53 by gel filtration chromatography and electromobility shift assay.
The methods described below outlines: (i) infection of cells for virus pro-duction; (ii) the virus plaque assay; (iii) the titer calculation; (iv) the optimiza-tion of protein expression; (v) the infection of Sf9 cells for p53 production; (vi)the harvesting of cells and preparation of soluble nuclear lysate; (vii) the anionexchange column purification; (viii) the concentration of p53; (ix) the analysisby gel filtration chromatography; and (x) the electromobility shift assay.
2. Materials2.1. Commercial Products
1. Sf9 cells (Invitrogen, Carlsbad, CA, USA; cat. no. B825-01).2. Complete insect media: 90% Grace’s insect medium, supplemented (Invitrogen;
cat. no. 11605-094), 10% heat-inactivated fetal bovine serum (Cellgro-Mediatech, Herndon, VA, USA; cat. no. 35-010-CV) (see Note 1), 10 μg/mLgentamycin (Invitrogen; cat. no. 15710-064), 0.25 μg/mL Fungizone (also knownas amphotericin B; Invitrogen; cat. no. 15290-018), 100 U/mL penicillin/100 μg/mL streptomycin (Bio Whittaker, Walkersville, MD, USA; cat. no. 17-602E).
3. Recombinant full-length human p53 baculovirus (with no flanking codingsequences). Our recombinant virus was originally created by the Prives labora-tory (6).
4. 4% Baculovirus agar (Invitrogen; cat. no. 18300-012).5. 2X Complete Grace’s insect media: 90% 2X Grace’s insect media (Invitrogen;
cat. no. 11667-037), 20% heat-inactivated fetal bovine serum, 20 μg/mLgentamycin, 0.50 μg/mL Fungizone.
6. Agarose–media overlay: a 1:3 mixture of 4% agarose gel to 2X complete Grace’sinsect medium. Prepare just prior to use. To prepare, heat agarose to 70°C in awater bath to melt. Cool to 37°C (see Note 2). Heat 2X complete Grace’s insectmedia to 37°C. Then mix at the appropriate ratio.
7. Q Sepharose® Fast Flow (Amersham Pharmacia Biotech, Piscataway, NJ, USA;cat. no. 17-0510-01).
8. Open column (1.5 × 20 cm) (Bio-Rad, Hercules, CA, USA; cat. no. 737-1521).9. -32P-ATP (6000 Ci/mmol at 150 mCi/mL) (Perkin Elmer Life Science,
Gaithersburg, MD, USA; cat. no. NEG-035C).10. mdm2 promoter oligonucleotide sequence: 5'-AAAGGAGTTAAGTCCTGAC
TTGTCTCCAGCT-3' and its complement (Integrated DNA Technologies,Coralville, IA, USA).

Purification of p53 19
2.2. Buffers1. Isotonic buffer: 10 mM Na2HPO4, pH 7.2, 130 mM NaCl, 1 mM diethylene-
triaminepentaacetic acid dianhydride (DTPA) (Sigma, St. Louis, MO, USA; cat.no. D 6518).
2. Cell lysis buffer: 50 mM Tris-HCl, pH 8.0, 5 mM ethylenediamine tetraaceticacid (EDTA), 150 mM NaCl, 0.5% (v/v) Nonidet® P-40.
3. Phosphate-buffered saline (PBS): 8 mM Na2HPO4, 1.5 mM KH2PO4, 137 mMNaCl, 2.7 mM KCl.
4. Buffer A: 20 mM Tris-HCl, pH 8.0, 12% sucrose, 2 mM ethyleneglycol-bis-(2-aminoethylether)-N,N,N',N'-tetraacetic acid (EGTA), 2 mM phenylmethyl-sulfonylfluoride (PMSF) (Fisher Scientific, Tustin, CA; cat. no. A 270184G005)(see Note 3), 5 mM dithiothreitol (DTT), 1 mM DTPA.
5. Buffer B: 20 mM Tris-HCl, pH 8.0, 2 mM EGTA, 2 mM PMSF, 10 mM DTT,50 μg/mL leupeptin (Roche Molecular Biochemicals, Indianapolis, IN, USA; cat.no. 1017128), 10 μg/mL pepstatin (Roche Molecular Biochemicals; cat. no.1524488), 10 μg/mL E-64 (Roche Molecular Biochemicals; cat. no. 1585673),1 mM DTPA.
6. Buffer C: 40 mM Tris-HCl, pH 8.0, 10 mM DTT, 1 mM DTPA.7. Laemmli protein denaturation buffer: 1.25 M Tris-HCl, pH 6.8, 20% glycerol
(v/v), 0.02% bromphenol blue (w/v), 5% SDS (w/v), 10% -mercaptoethanol (v/v).8. 5X DNA binding buffer: 50 mM Tris-HCl, pH 7.5, 250 mM NaCl, 5 mM MgCl2,
2.5 mM EDTA, 2.5 mM DTT, 20% (v/v) glycerol, 0.1 mg/mL poly(dI-dC)·poly(dI-dC) (Amersham Pharmacia Biotech; cat. no. 27-7880-02)
9. 10X Electrophoretic mobility shift assay (EMSA) gel loading buffer: 250 mMTris-HCl, pH 7.5, 40% (v/v) glycerol, 0.2% (w/v) bromphenol blue, 0.2% (w/v)xylene cyanol.
10. TE: 10 mM Tris-HCl, pH 7.4, 1 mM EDTA.
3. Methods3.1. Infection for Virus Production
1. Seed each of two T-25 flasks with 2 × 10⁶ Sf9 cells (in the log-phase of growth) in5 mL of complete Grace’s insect media and incubate at 27°C in a nonhumidifyingincubator with no added CO2. Wait 2 to 3 h for the cells to attach to the bottom ofthe flask. Cells must be at least 50% confluent prior to the next step.
2. Transfer 20 μL of P1 (passage 1 virus) from virus stock stored at 4°C to eachflask. Briefly rock flasks to ensure even distribution of virus.
3. At 8 d postinfection, remove the media containing the P2 virus to a 15-mL coni-cal plastic tube and centrifuge (2500g for 5 min) to remove cell debris.
4. Transfer 2 mL of the supernatant (P2 virus) to a new tube and store at –80°C forlong-term storage. Store the remaining portion of the P2 virus at 4°C.
5. To generate P3 virus, seed 2 × 10⁷ Sf9 cells in each of four T-175 flasks with25 mL of complete Grace’s insect media.

20 Sun et al.
6. At 12 h postseeding, add 500 μL of P2 virus from 4°C stock to each flask toinfect cells.
7. At 9 d postinfection, harvest the P3 virus as described above.8. Store the majority of the P3 virus at 4°C for use within 2 yr, and store a small
aliquot at –80°C for long-term storage. The P3 virus will be used to determinethe titer.
3.2. Plaque Assay1. Prewet the 10-cm tissue culture dishes (Falcon 353003) with complete Grace’s
insect media and seed with 5 × 10⁶ Sf9 cells that are in the log phase of growth.Prepare two dishes for each virus dilution you plan to use (we usually use sixdilutions), plus an extra pair for mock infection.
2. Rock dishes for 10 min at room temperature (8 side-to-side motions/min) on aplatform rocker.
3. Stop rocker and ensure the platform is level to produce an evenly distributedmonolayer of cells. After 10 min, use a microscope to inspect a few dishes toensure that the cells are evenly distributed.
4. Remove dishes to a level area, and allow cells to attach to bottom surface (approx30 min). Cells should be approx 50% confluent on the dish bottom.
5. Prepare 10-fold serial dilutions of virus inoculum in 1-mL total vol of completeGrace’s insect media. The dilutions should range from 100-fold to 107-fold.
6. Aspirate all but 2 mL of the medium in pre-seeded dishes.7. Carefully add 1 mL of the diluted virus dropwise over the course of 90 s, taking
special care not to disturb the monolayer of cells.8. Incubate plates at room temperature on a rocking platform (approx 2 side-to-side
motions/min) for 1 h.9. Aspirate remaining media and overlay the infected cells with 10 mL of agarose–
media overlay.10. Incubate cells at 27°C in the incubator until plaques are formed (approx 5 to 6 d).11. View cells at 30× magnification with a dissecting microscope and count plaques
as distinct opaque white dots.
3.3. Titer CalculationThe titer is the number of plaque-forming units (pfu)/mL of virus. Use the
following formula to calculate titer:
pfu/mL = (1/dilution) × number of plaques produced by the inoculum on dish.
The pfu/mL for the p53 virus is typically 108. To determine the amount ofinoculum needed for p53 protein production, we use the following formula:
mL of inoculum = (multiplicity of infection [MOI] × total number of cells to be infected)
titer of virus (pfu/mL)
We typically use an MOI of 6 for large-scale p53 production.

Purification of p53 21
3.4. Optimization of Protein Expression
The optimal time for p53 expression post-virus infection is obtained from asimple timecourse experiment followed by SDS-PAGE and Coomassie®
staining.
1. Seed seven T-25 flasks with 3 × 10⁶ Sf9 cells in 5 mL of complete Grace’s insectmedia.
2. Infect six of the seven flasks with 125 μL (approx 4 MOI) of virus inoculum.3. Collect cells on day 2, 3, 4, 5, 6 and 10 postinfection.4. Collect the uninfected cells on day 2.5. Remove cells by scraping the surface of the flasks with disposable cell scrapers
(Falcon®; cat. no. 353086).6. Pour the cell–medium mixture into 15-mL plastic tubes with screwtops. Centri-
fuge the cells (3200g for 5 min) at 4°C in a swinging bucket rotor. In all subse-quent steps, maintain cells at 0°C by keeping the tubes on wet ice.
7. Remove supernatant and add 5 mL of ice-cold PBS. Gently resuspend cells byflicking the bottom of the tube with a finger, then centrifuge, and remove super-natant.
8. Add 300 μL of cell lysis buffer and resuspend cells by vortex mixing.9. Sonicate cells in a bath sonicator (Fisher Scientific 550 Sonic Dismembrator,
setting 5) in continuous mode for 10 s with 1 min rest intervals. Sonicate fivetimes, and centrifuge the lysed cells (3200g for 5 min) to remove particulatematerial.
10. Add 10 μL of supernatant to 10 μL of Laemmli protein denaturation buffer. Vor-tex mix, boil for 5 min, and load onto a 10% Laemmli gel. After electrophoresis,stain gel with Coomassie Blue dye.
One typically finds that 3 d postinfection is optimal for p53 expression(Fig. 1). The p53 protein can be detected by eye as a protein with an apparentmolecular weight of 53 kDa (see Note 4).
3.5. Infection of Sf9 Cells for p53 Purification
1. Seed 5 × 10⁶ Sf9 cells in the log phase of growth into a T-75 flask containing 15 mLof complete Grace’s insect media. Incubate overnight at 27°C.
2. Mix 2 mL of complete Grace’s insect media with 300 μL of P3 p53 virus stock(6 MOI) to create inoculum.
3. Remove old media from cells and replace with 2.3 mL inoculum.4. Rock flasks at a rate of 4 side-by-side motions/min for 1 h at room temperature.5. Add 13 mL of complete Grace’s insect media and incubate at 27°C in
nonhumidified incubator, 0% CO2 for 72 h.
In a typical preparation, p53 is purified from 14 T-75 flasks of infected cells.

22 Sun et al.
3.6. Harvesting Cells and Preparation of Soluble Nuclear Lysate
1. Scrape cells from flasks, without draining the media, using cell scrapers. Pourcell–media mixture into 50-mL plastic tubes with screwtops.
2. Centrifuge at 4°C (3200g for 5 min), remove media, and wash cell pellet 2× withice-cold isotonic buffer.
3. To lyse cells, resuspend the cell pellet in 100 mL of Buffer A plus 0.2% (v/v)Triton® X-100 by gentle inversion. Transfer cell lysate to appropriate centrifugetubes (see Note 5). Centrifuge the nuclei at 5600g for 8 min and discard thesupernatant.
4. Resuspend the pellet in 100 mL of Buffer A plus 0.1% (v/v) Triton X-100 bygentle inversion. Centrifuge the nuclei at 5600g for 8 min and discard the super-natant.
5. Lyse nuclei by adding 30 mL of Buffer B plus 0.5 M NaCl and vortex vigorously.Allow the mixture to remain on ice for 20 min.
6. Transfer the lysate to centrifuge tubes (Ultra-Clear™, 1 × 3.5 in.; Beckman-Coulter, Fullerton, CA, USA) and add more Buffer B plus 0.5 M NaCl to top offif necessary. Centrifuge mixture at 100,000g for 60 min at 4°C in a swingingbucket rotor.
7. Remove supernatant and dilute five-fold with Buffer B plus 0.1 M NaCl. Gentlymix, and centrifuge the diluted mixture at 20,000g for 30 min at 4°C.
8. Remove soluble nuclear lysate (supernatant) and aliquot to new tubes. These maybe stored at –80°C indefinitely at this point (see Note 6).
Fig. 1. Equal vol of soluble cell lysate was loaded onto a 10% polyacrylamide gel.Lane 1, molecular weight standards; lane 2, lysate from uninfected cells; lanes 3–8,lysate from infected cells obtained at indicated days postinfection.

Purification of p53 23
3.7. Anion Exchange Column Purification of p53
1. Rinse Q Sepharose Fast Flow beads with water.2. Equilibrate Q Sepharose Fast Flow beads with Buffer C plus 0.1 M NaCl, accord-
ing to the manufacturer’s instructions.3. Pour equilibrated beads into an open 1.5 × 20 cm column up to a final column vol
of 15 mL.4. Wash the column with 50 mL of Buffer C plus 0.1 M NaCl.5. Thaw soluble lysate on ice and add 75 mL to column. The flow rate of the column
should be approx 0.625 mL/min. Allow lysate to completely pass through column.6. Wash column with 50 mL Buffer C plus 0.1 M NaCl.7. Wash column with 50 mL of Buffer C plus 0.2 M NaCl.8. Elute p53 with Buffer C plus 0.4 M NaCl in three successive 15-mL fractions.
The second fraction contains the highest level of p53.
3.8. Concentrating p53
p53 tends to bind irreversibly to ultrafiltration membranes during concen-tration. We have found that pretreating the membranes with bovine serumalbumin (BSA) helps to prevent some of the p53 loss during ultrafiltration.
1. Pretreat YM30 Centricon® (Millipore, Bedford, MA, USA) with 2 mL of 0.01mg/mL (w/v) BSA (Sigma; cat. no. A-7906) dissolved in water.
2. Centrifuge for 10 min at 5000g and remove collected filtrate.3. Rinse the Centricon 12X with water.4. Centrifuge 2 mL of water through the Centricon for 10 min at 5000g.5. Place purified p53 into pretreated Centricon and centrifuge at 5000g per
manufacturer’s instructions.6. Determine the final p53 protein concentration by Bradford assay (7) or by com-
parison of p53 protein band intensity to the intensity of known amounts of BSAseparated by 10% SDS-PAGE (we usually perform both tests).
Figure 2 shows the unconcentrated and concentrated p53 compared to BSAstandards on a gel stained with Coomassie Blue dye. In the second fractionfrom the column, we obtain an initial concentration of 0.2 mg/mL of p53. Afterthe Centricon step, the p53 concentration is between 0.6–0.9 mg/mL. How-ever, approx 50% of the p53 is lost due to its nonspecific binding to theCentricon during the concentration step.
3.9. Analysis by Gel Filtration Chromatography
p53 can form a tetramer through an oligomerization domain in its C termi-nus. One method to demonstrate that p53 forms a tetramer is gel filtration analy-

24 Sun et al.
sis. The p53 that we purify contains approx 20% tetramer and 80% monomerby comparison to protein standards of known MW.
Concentrated p53 (94 μL, 0.5 mg/mL) was injected onto a 300 × 7.8 mmBio-Sil SEC 250-5 high-performance liquid chromatography (HPLC) column,5-μm particle size (Bio-Rad) equilibrated with 100 mM NaHPO4, pH 7.06, 1 mMEDTA. The HPLC components were a Varian 9050 UV/VIS detector, a Varian9012 pump, and a Varian 9100 autosampler. The flow rate was 1 mL/min, andthe p53 elution profile was monitored at a wavelength of 280 nm. Figure 3shows a chromatograph of p53 protein. Comparison to molecular weight (MW)standards indicates that the monomer has a MW of 69.3 kDa, and the tetramerhas a MW of 328 kDa. The ratio of monomer to tetramer was 4:1.
3.10. Electromobility Gel Shift Assay
We use a standard DNA binding assay called the EMSA to determinewhether p53 is functional. Briefly, p53 is incubated with radiolabeled syntheticdouble-stranded DNA containing a p53-responsive element. The p53/DNAcomplex is separated from the nonbound DNA by electrophoresis. The gel isdried and exposed to X-ray film to visualize the DNA bound to p53. To ensurespecificity of the binding, we usually run a number of controls. Negative con-trols include nonaddition of p53 to the reaction mixture, excess nonradiolabeledDNA (competitive inhibitor), and excess poly(dI-dC)·poly(dI-dC) (nonspecificinhibitor).
3.10.1. Annealing Complementary Strands
1. Dissolve complementary single-stranded oligonucleotides containing consensussequence in TE at a concentration of 1 μg/μL. We used the second p53 responseelement within the P2 promoter of human mdm2.
Fig. 2. Purification of p53 through a Q Sepharose Fast Flow column. ST, MWstandards; lane 1, unconcentrated p53; lane 2, p53 after ultrafiltration-mediated con-centration; lane 3, BSA protein standard (1 μg); lane 4, BSA protein standard (2 μg);lane 5, BSA protein standard (4 μg); lane 6, BSA protein standard (10 μg).

Purification of p53 25
2. Add 20 μL of each oligonucleotide to a polylethylene tube and heat to 85°C for5 min.
3. Remove from heat source and allow sample to cool down to room temperature onbenchtop for 3 h.
3.10.2. End-Labeling Double-Stranded Oligonucleotide with -32P-ATP
1. Add the following reagents together in the following order: (i) 5 μL T4 poly-nucleotide kinase 10X buffer (Roche Molecular Biochemicals); (ii) 2 μL T4 poly-nucleotide kinase (Roche Molecular Biochemicals); (iii) 1 μL DNA probe (1 μg/μL); (iv) 3 μL -32P-ATP (6000 Ci/mmol at 150 mCi/mL); and (v) 39 μL waterfor a total of 50 μL.
2. Mix and incubate at 37°C for 10 min. Stop the reaction by adding 1 μL of 0.5 MEDTA, pH 8.0.
Fig. 3. Gel filtration analysis of purified p53. Chromatogram of concentrated p53eluted from a Bio-Sil SEC 250-5 column monitored at 280 nm. Elution positions ofprotein standards are depicted within the chromatogram and their MWs (in kDa) areshown.

26 Sun et al.
3.10.3. Removal of Unreacted -32P-ATP from Radiolabeled DNA
Gel filtration is used to remove unreacted -32P-ATP from DNA. The radio-labeled DNA will be excluded from the column beads, and the -32P-ATP willbe trapped within the column beads.
1. Centrifuge G-50 spin column (Roche Molecular Biochemicals; cat. no. 1 273965) with its collection tube at 1100g for 2 min at room temperature.
2. Discard the collection tube and eluted buffer. Keep the column in the uprightposition and add 50 μL of the quenched reaction mixture to the center of thecolumn bed (it is essential that the mixture not contact the sides of the columnduring pipeting).
3. Place the column into a new collection tube, while maintaining it in an uprightposition. Centrifuge on a swinging bucket rotor at 1100g for 4 min at room tem-perature (see Note 7).
4. Recover the labeled DNA in the collection tube, and remove 1 μL for scintilla-tion cocktail counting. We typically achieve a specific radioactivity in the rangeof 0.7–3 × 10⁷ counts per minute .
5. Dilute radiolabeled DNA with TE to a final concentration of 6000 cpm/μL (seeNote 8).
3.10.4. DNA Binding Reaction1. Add the following in a polyethylene tube:
(i) 3.5 μL 5X DNA binding buffer; (ii) 1 μL poly(dI-dC)·poly(dI-dC) (1 μg/μL);(iii) 6 μL water; and (iv) 3 μL p53 protein (0.2–0.5 μg/μL) for a total of 13.5 μL.
2. Mix and leave at room temperature for 10 min.3. Add 2 μL of radiolabeled DNA (6000 cpm/μL) and incubate at room temperature
for 20 min.4. Add 2 μL of 10X EMSA gel loading buffer to quench the DNA binding reac-
tion. Mix.5. Load quenched samples onto 6% nondenaturing polyacrylamide gel and electro-
phorese with 0.5X TBE running buffer. Figure 4 shows an autoradiogram of ap53 EMSA.
4. Notes1. To heat inactivate fetal bovine serum, first thaw at 4°C. Then incubate in water
bath at 56°C for 30 min.2. Use extra caution to ensure that temperature is no higher than 37°C and no lower
than 35°C. A higher temperature will kill the insect cells, and a lower tempera-ture will cause the agarose–media overlay to form lumps.
3. Create PMSF stock solution by preparing a 0.1 M solution in 100% ethanol. Becareful not to inhale the PMSF powder during handling.
4. Sometimes it is difficult to distinguish between p53 and virus proteins in theCoomassie-stained gel. To ensure that p53 is expressed, perform an immunoblot
cpmμg

Purification of p53 27
analysis with a commercially available antibody. After the immunoblot image isrecorded, stain the membrane with Coomassie Blue dye for 15 min and air dry.Within 1 h, many abundant proteins can be detected on the membrane. Compari-son of the immunoblot image with the Coomassie-stained membrane will indi-cate which stained protein is p53.
5. We use 50 mL Oak Ridge polycarbonate centrifuge tubes (Nalge, Rochester, NY,USA) for centrifugation at g forces between 4000 and 20,000g.
6. Delphin et al. reported that p53 undergoes oxidation when p53 is stored in theabsence of DTT (5). It has been our experience that p53 is extremely sensitive tooxidation as well. Ensure that DTT is fresh whenever buffers are made, andremake the buffers every 3 mo. We purge our solutions with N2 gas for 5–10 minto remove dissolved O2.
7. We use the Centra CL2 IEC centrifuge equipped with a 52212 IEC rotor. Onemust use some caution in choosing the correct centrifuge–rotor combination. Wefound that at 1100g, some heavy swinging buckets do not achieve the verticalposition in a timely manner, the result of which forces the sample to the side ofthe column prior to its migration to the collection tube. The recovery of purifiedDNA from these preparations is often very low.
8. Only dilute a portion of the radiolabeled DNA. If an experiment must be repeatedlater, then use a more concentrated solution of radiolabeled DNA to compensatefor the radioactivity decay.
Fig. 4. EMSA assay to detect p53 binding to DNA. An autoradiograph of a geldemonstrating p53 binding to DNA. mdm2 p53 responsive element-2 was incubatedwith p53 under various conditions to demonstrate specificity of p53 binding activity.Lane 1, absence of p53 from the reaction mixture; lane 2, complete reaction mixture;lane 3, complete reaction mixture plus excess unlabeled mdm2 p53 responsive ele-ment-2; lane 4 complete reaction mixture plus excess poly(dI-dC)·poly(dI-dC).

28 Sun et al.
AcknowledgmentsThe authors thank Drs. Prives (Columbia University) and Zambetti (St. Jude’s
Childrens Research Hospital) for the recombinant p53-expressing baculovirus.This works was supported by Minorities in Biomedical Research Sciences Pro-gram (NIGMS08101).
References1. Soussi, T. and May, P. (1996) Structural aspects of the p53 protein in relation to
gene evolution: a second look. J. Mol. Biol. 260, 623–637.2. Olivier, M., Eeles, R., Hollstein, M., Khan, M. A., Harris, C. C., and Hainaut, P.
(2002) The IARC TP53 database: New online mutation analysis and recommen-dations to users. Hum. Mutat. 19, 607–614.
3. Soussi, T., Dehouche, K., and Beroud, C. (2000) p53 website and analysis of p53gene mutations in human cancer: forging a link between epidemiology and car-cinogenesis. Hum. Mutat. 15, 105–113.
4. Friedman, P. N., Chen, X., Bargonetti, J., and Prives, C. (1993) The p53 protein isan unusually shaped tetramer that binds directly to DNA. Proc. Natl. Acad. Sci.USA 90, 3319–3323.
5. Delphin, C., Cahen, P., Lawrence, J. J., and Baudier, J. (1994) Characterization ofbaculovirus recombinant wild-type p53. Eur. J. Biochem. 223, 683–692.
6. Friedman, P. N., Kern, S. E., Vogelstein, B., and Prives, C. (1990) Wild-type, butnot mutant, human p53 proteins inhibit the replication activities of simian virus40 large tumor antigen. Proc. Natl. Acad. Sci. USA 87, 9275–9279.
7. Bradford, M. M. (1976). A rapid and sensitive method for the quantitation ofmicrogram quantities of protein utilizing the principle of protein-dye binding.Anal. Biochem. 72, 248–254.

p53 Mutant Mice 29
29
From: Methods in Molecular Biology, vol. 234: p53 ProtocolsEdited by: S. Deb and S. P. Deb © Humana Press Inc., Totowa, NJ
3
Generation and Characterization of p53 Mutant Mice
Melissa L. Dumble, Lawrence A. Donehower, and Xiongbin Lu
Summaryp53 is one of the most well-characterized members of the tumor suppressor gene family. The
role of p53 in controlling cellular homeostasis has proven critical, with over half of all humantumors having either lost or mutated p53. The emergence of technology facilitating the ablationof a gene within an animal’s genome allowed great advances in the study of p53. The p53 knock-out mouse was one of the first of its kind and provided a powerful tool for the study of p53.Production of the p53 knock-out mouse demonstrated the protein’s dispensability duringembryogenesis, while highlighting its essential role in controlling tumor formation. A variety ofp53 mutant models have emerged since the original p53 knock-out mouse, along with improvedtechniques for regulating gene targeting. This chapter describes the necessary steps and proto-cols involved in producing a mutant mouse as well as the characterization that follows.
Key Wordsp53, tumor suppressor, mutant, knock-out, gene targeting, ES cells, chimera, pheno-
type, genotype
1. IntroductionThe p53 tumor suppressor gene encodes a transcriptional regulatory protein.
In response to various forms of stress, p53 exerts an antiproliferative effecteither via growth arrest, apoptosis, or cellular senescence (1–3). Highlightingits pivotal role in cancer prevention, the p53 gene is found mutated or lost inmore than half of all human tumors (4). The development of transgenic andgene targeting technologies enables us to utilize mouse models to investigatethe critical functioning of p53. During the last decade, numerous p53 transgenicand knock-out mouse models have been developed, which have greatlyimproved our understanding of the role of p53 in organismal development,carcinogenesis, and cancer therapy (5).

30 Dumble et al.
Among the targeted p53 mutant mouse models, the p53 knock-out mouse hasbeen the most widely used for cancer studies. Inactivation of the p53 gene in themouse germline has provided a model similar in many respects to the inheritedhuman cancer predisposition, Li-Fraumeni syndrome. Li-Fraumeni is a rareautosomal dominant syndrome characterized by the occurrence of diverse mes-enchymal and epithelial neoplasms at multiple sites (4,6). p53-deficient micehave been particularly valuable in examining the effects of p53 loss on tumorinitiation and progression (7,8). A p53 mutant mouse with an allele encodingchanges at Leu25 and Trp26 was generated by Jimenez, Wahl, and colleagues(9). Since these mutated amino acids are known to be essential for transcrip-tional transactivation and Mdm2 binding, this mouse is p53 transactivationdeficient and provides insights into p53 regulation and function during tumorformation. To understand the relevance of p53 missense mutations in vivo, Liuand Lozano’s group generated a mouse containing an Arg-His substitution atcodon 172 in the p53 protein (10). Osteosarcomas and carcinomas that devel-oped in these mutant mice more frequently metastasized. The associationbetween p53 and organismal aging has recently been reported. Our laboratorygenerated a mouse with a deletion mutation in the first six exons of the p53 geneand a point mutation at codon 245 (11). This mutant mouse exhibits enhancedresistance to spontaneous tumors, but displays early aging phenotypes.
Regulatable or conditional gene targeting technologies are now utilized toestablish correlations between a specific genetic lesion and a particular pheno-type. Multiple approaches now exist to switch genes on and off under temporalor spatial control. The most commonly used system employs either the phageP1 Cre recombinase that recognizes 34bp LoxP sites or, alternatively, the Sac-charomyces cerevisiae Flp recombinase that recognizes the 48bp Frt site. Boththe Cre and Flp proteins work as site-specific recombinases, which bind totheir respective LoxP or Frt sites and mediate reciprocal recombination. In thepresence of Cre or Flp, the two LoxP or Frt sites (inserted into genomic DNAin the same orientation) will recombine and, thus, delete the DNA sequenceslying between (12). When produced, mice carrying conditional alleles lackovert phenotypes. However, when bred to transgenic mice that express Cre orFlp recombinase (from a variety of cellular promoters), these alleles can beexcised and inactivated in an organ or cell lineage-specific way. The Bernslaboratory used this Cre-LoxP system to generate mice carrying conditionalBrca2 and/or Trp53 alleles and a cre transgene under control of the humanK14 gene promoter, which is only active in dividing cells of the stratified epi-thelia. This mouse model was used to study the role of BRCA2 in mammarytumorigenesis (13).
Inducible transcription systems are also widely used to create mice in whichexpression of the targeted allele is induced by agents such as doxycycline or

p53 Mutant Mice 31
tamoxifen. The tetracycline operon (tTA) and the tetracycline transcriptionalactivators (rtTA) have shown great utility in the inducible transcription sys-tems. Mice bitransgenic for the tet-operon gene of interest and rtTA willexpress the gene of interest when the drinking water is supplemented with thetetracycline analogue, doxycycline. However, bitransgenic mice for the tet-operon gene of interest and tTA will constitutively express the gene of interestunless doxycycline is supplied (14). This approach has yielded several induc-ible mouse models, including the Hras-G12V mouse model of melanoma andthe c-Myc model of T cell lymphoma and acute myeloid leukemia (15,16). Theconditional control of gene expression in these mouse models allows the inves-tigation of complex and multistaged biological processes, such as cancer andembryogenesis.
This chapter attempts to provide experimental design and protocols to gen-erate and characterize p53 targeted mutant mice. We have described variousgene targeting strategies and methods for constructing p53 gene targeting vec-tors, culturing of embryonic stem (ES) cells, introducing targeting vector DNAto ES cells, utilizing targeted ES cells to generate p53 mutant mice, genotyping,and characterizing p53 mutant mice. Given the large array of protocols, it wasnot possible to include all methods for generating and analyzing mouse mod-
Fig. 1. Integration patterns for a replacement target vector. The “+” and “–” repre-sent positive and negative selection markers respectively. The black box representscoding sequences of a target gene that is disrupted by a positive selection cassette inthe targeting vector. The horizontal lines in the targeting vector represent regions ofhomology with the targeted allele. Vectors that recombine with the endogenous tar-geted allele will lose the negative selection cassette. Cells with the properly targetedallele will be resistant to negative selection, whereas ES cells containing random in-sertions of the targeting vector will retain the negative selection cassette and be sensi-tive to the negative selection drugs.

32 Dumble et al.
els, so for further and more detailed information, other reviews, databases, andbooks should be consulted (17–19).
2. Materials1. Targeting vector sequences.2. Restriction enzymes and DNA modifying enzymes.3. Agarose and DNA purification kit (Qiagen, Valencia, CA, USA).4. ES and feeder cell line.5. Cell medium, ES qualified fetal bovine serum (FBS), trypsin, sterile plasticware,
laminar flow hood, tissue culture humidified incubator (37°C, 5% CO2).6. Electroporator.7. Selection drugs (see Table 1).8. Stable platform mounted micromanipulation apparatus and inverted phase mi-
croscope.9. Mice: donor females, stud males, pseudopregnant surrogate mothers, vasecto-
mized males, and wild-type mice for breeding to chimeras.10. Hormones: human chorionic gonadotrophin (hCG) and pregnant mare serum
(PMS).11. Oligonucleotide primers (polymerase chain reaction [PCR] genotyping), Taq
DNA polymerase.12. cDNA probe (Southerns), nylon membrane (Zeta-Probe® GT; Bio-Rad, Her-
cules, CA, USA).
Table 1Commonly Used Positive and Negative Selection Markers
Selection markers Selection drug
Positive selectionNeomycin phosphotransferease (neo) G418Puromycin N-acetyltransferase (puro) PuromycinHygromycin B phosphotransferease (hph) Hygromycin BBlasticidin S deaminase (bsr) Blasticidin SXanthine–guanine phosphoribosyl transferase (gpt) Mycophenolic acid
Negative selectionHerpes simplex thymidine kinase (HSV-tk) GANC, FIAUMammalian thymidine kinase (tk) 5BdUHypoxanthine phosphoribosyl transferase (hprt) 6TGXanthine/guanine phosphoribosyl transferase (gpt) 6TG
GANC, gancyclovir; FIAU, 1(1-2-deoxy-2-fluoro- -D-arabinofuranosyl)-5-iodouracil;6TG, 6-thioguanine; and 5BdU, 5-bromodeoxyuridine

p53 Mutant Mice 33
3. Methods3.1. Targeting Vectors
The majority of knock-out mice and standard lines of p53 mutant mice havebeen generated by targeting in ES cells using an allelic replacement strategy. Areplacement vector is typically composed of homologous regions flanking theportion of the gene to be targeted, along with positive and/or negative selectionmarkers (see Fig. 1). Expression of selection markers is usually driven by astrong mammalian gene promoter; this may also influence expression of thetargeted gene. To avoid this problem, many take advantage of Cre-loxP tech-nology to excise the selection marker from the recombinant locus after thetargeted ES cell clone is identified (see Figs. 2A and 2B).
The desired genetic recombination is that vector sequences effectivelyreplace the homologous region in the chromosome (see Note 1). Positiveselection markers can be used to select colonies that contain integrated vectorDNA. However, most colonies are produced from random integration, becausethe frequency of random integration is generally several orders of magnitudehigher (see Fig. 1). To eliminate undesirable randomly integrated clones, nega-tive selection markers are attached to the end of the vector. Homologousrecombination occurring correctly between the targeting vector and the endog-enous gene should result in the loss of the negative selection cassette. One ofthe more common negative selection cassettes is the herpes simplex virus thy-midine kinase (HSV-tk) gene. Correct homologous recombination yields clonesthat are tk minus and survive the negative drug selection after gancyclovir isadded to the cell culture medium. The commonly used positive and negativeselection markers are listed in Table 1. Adequate amounts of targeting DNA isamplified and purified in preparation for electroporation (see Note 2).
3.2 ES Cells: Maintenance, Gene Delivery, Microinjection,and Transplantation
ES cells were first isolated over 20 yr ago and were derived from the innercell mass (ICM) of a d 3.5 mouse blastocyst, and specific conditions weredefined for their maintenance and growth in vitro (20,21). ES cells are definedas pluripotent cells that resemble cells of the ICM in their ability to differentiateinto any functional cell of the adult organism. Conditions for ES cell cultureare outlined in this section, along with procedures for ES cell transduction, selec-tion, screening, microinjection, transfer, and finally, the generation of the chi-meric mice carrying a germline mutation. Figure 3 illustrates the sequence ofevents involved in mutant mouse production; as well, there are texts availabledescribing these methods in precise detail and should be referred to (18,19).

34 Dumble et al.
Fig. 2. Creating subtle mutations or a conditional allele by gene targeting and use ofCre-loxP technology. The “+” and “–” boxes represent positive and negative selectionmarkers. The black box represents exons of a target gene. In panel A, a white strip in theblack box represents the subtle mutation(s) of the target gene. Two black arrows flank-ing the selection markers and exons represent a pair of loxP sites inserted in the sameorientation. The arrow line above the black rectangular box represents the transcrip-tional direction of the target gene. Following transfection with the linerized replace-ment vector, ES cells undergo positive and negative selection. The proper integration ofthe targeting vector by homologous recombination should result in loss of the negativeselection cassette, yielding clones that are resistant to both positive and negative selec-tion. Finally, the selection markers are removed by introducing Cre into the properlytargeted ES cells. In panel B, an endogenous gene is targeted in a manner that leaves thecoding sequences intact but flanked by loxP. Following positive drug selection

p53 Mutant Mice 35
3.2.1. Maintenance and Propagation of ES Cells
Many different ES cell lines exist, and each has recommended growth mediaand culture conditions. All culture procedures are carried out using aseptictechniques, sterile plasticware, and medium (warmed to 37°C prior to use,stored at 4°C, and supplemented with glutamine every 4 wk). ES cell lines arecultured on a feeder layer, which is either made from preexisting cell lines orfreshly isolated embryonic fibroblasts with the addition of leukemia inhibitoryfactor (LIF) to the medium. More commonly, many use feeder cells transducedwith a LIF construct and, therefore, constitutively express LIF, eliminating theneed for an exogenous supply. These conditions ensure the maintenance of EScell pluripotency (22,23). The p53 knock-out mouse (7) was created using theAB1 ES cell line (24), so the conditions for their culture will be described inthis section.
The AB1 cell line was derived from a 129/Sv mouse using standard proce-dures (24). AB1 cells are grown on a feeder layer of SNL76/7 cells mademitotically inactive by exposure to mitomycin C. The SNL76/7 cell line wasclonally derived from STO embryonic fibroblast cells transfected with boththe G418 resistance and LIF expression constructs. The AB1 cells are grown inDulbecco’s modified essential medium (DMEM) with glucose, sodium pyru-vate, and FBS added. The ES cells are maintained at subconfluency (just untilindividual colonies are touching) and passaged regularly (every 2 to 3 d), eachtime splitting 1:5 to 1:7 (see Note 3). ES cells are passaged by exposure totrypsin-ethylenediamine tetraacetic acid (EDTA) diluted in calcium- and mag-nesium-free buffer to detach cells from the plate.
3.2.2. ES Cell Transduction and Selection of Positive Clones
Introduction of a gene targeting vector to ES cells can be performed by eitherelectroporation or transfection. Electroporation is the favored technique, sincecells do not need to be highly proliferative; an electrical current is passed
Fig. 2 (continued from page 6), identification and expansion of properly targeted clones,Cre is introduced into the ES cells to excise the drug selection markers. Negative selec-tion will result in loss of either the drug selection cassettes only, or loss of both the drugselection cassettes and the nearby exon of the target gene. The first event creates aconditional allele, whereas the second event would generate a loss of function allele.Genotyping of ES cell clones by PCR or Southern analysis can be used to distinguishthese two different events. The conditional allele has two loxP sites flanking the exonand thus will excise the exon upon subsequent transduction of Cre in the cells of tissuesof mice.

36 Dumble et al.
Fig
. 3. G
ener
atio
n of
a ta
rget
ed m
utan
t mou
se u
sing
ES
cel
ls. E
S c
ells
are
gro
wn
in c
ultu
re a
nd e
lect
ropo
rate
d w
ith
the
targ
etin
gve
ctor
of
choi
ce. C
orre
ctly
tar
gete
d E
S c
ells
are
sel
ecte
d us
ing
posi
tive
and
neg
ativ
e dr
ug s
elec
tion
. Tar
gete
d E
S c
ells
are
tra
ns-
ferr
ed t
o ha
rves
ted
blas
tocy
ts a
nd t
rans
plan
ted
back
int
o a
pseu
dopr
egna
nt m
othe
r. S
ome
offs
prin
g ar
e ch
imer
ic c
onta
inin
g bo
thce
lls
of E
S c
ell o
rigi
n an
d ce
lls
of m
ater
nal b
last
ocys
t ori
gin.
The
se c
him
eric
off
spri
ng a
re c
ross
ed w
ith
wil
d-ty
pe m
ice,
res
ulti
ngin
pro
duct
ion
of F
1 he
tero
zygo
tes
that
car
ry o
ne c
opy
of th
e m
utan
t all
ele.
The
se h
eter
ozyg
otes
can
be
cros
sed
to p
rodu
ce h
omoz
y-go
te m
utan
t mic
e. C
ross
ing
chim
eric
mic
e w
ith
wil
d-ty
pe c
an r
esul
t in
a w
ild-
type
off
spri
ng, i
ndic
atin
g th
e en
gine
ered
mut
atio
nis
not i
n th
e ge
rmli
ne. T
he p
heno
type
of t
he h
eter
ozyg
ous
and
hom
ozyg
ous
mut
ant m
ice
is th
en d
eter
min
ed u
sing
the
sugg
este
d pa
nel
of c
hara
cter
izat
ions
.

p53 Mutant Mice 37
through the cells creating pores in the cell membrane through which the DNAcan pass (25) (see Note 4).
The following is a brief summary of the electroporation of AB1 ES cellswith the vector sequence used to create the p53 knock-out mice (7). AB1 EScells (2 × 10⁸) were collected by trypsinizing 3 h following feeding. The cellswere centrifuged out of trypsin and resuspended in phosphate-buffered saline(PBS) (void of calcium and magnesium ions) to a cell density of 1.2 × 10⁷
cells/mL. The linearized vector DNA was used at a concentration of 25 μg/mL.Aliquots (0.9 mL) of the AB1 cells were exposed to one round ofelectroporation at 230 V, 500 μF, followed by another at 240 V, 500 μF. Thecells were then plated back onto 90-mm feeder plates and allowed to recoverfor 24 h prior to selection.
Gene targeting vector sequences usually contain both a positive drug resis-tance gene (e.g., neomycin) to select for the colonies containing the introducedDNA, as well as a negative selection marker (e.g., HSV-tk) to select againstcolonies with the vector sequence inserted randomly in the DNA. This increasesthe frequency of clones containing homologously recombined vector sequence.There are numerous agents (see Table 1) that can be used for these selectionpurposes. ES cells with the targeting vector used to produce the p53 knock-outmouse were selected in both G418 (positive selection) and FIAU (negativeselection). Selection begins 24 h after electroporation and proceeds for 9–12 dthereafter without subculture.
3.2.3. Screening of Resistant ES Cell Clones
Once the ES cells have been selected and resistant clones remain, coloniesare picked, expanded, and analyzed for correct transgene incorporation. Colo-nies can be picked around 10–12 d following electroporation; by this time thecolonies will be approx 1.5–2 mm in diameter (see Note 5). Single ES cellcolonies are grown, some are frozen down, and the remainder are expandedand screened to isolate clones that have integrated the vector sequence appro-priately. Screening of ES cell colonies can be done by both Southern analysisand PCR. These techniques are described in Subheading 3.3. of this chapter.
3.2.4. Microinjection of ES Cells to Blastocyst and Transfer to Mouse
The correctly targeted ES cells are then transferred back into the blastocyst.Blastocysts are isolated on the day of transfer from female mice who are 3.5 dpostcoitum (pc). C57BL/6 mice are commonly used for blastocyst injectionand were used in the production of the p53 knock-out mouse. The C57BL/6strain is preferred, as they differ from 129/sv mice (from which most ES celllines are derived) in coat color (black, nonagouti) and other useful markers.Furthermore, the C57BL/6 blastocysts have been shown to be compatible hosts

38 Dumble et al.
for the 129/sv-derived ES cells, as chimera formation and germline transmis-sion is easily obtainable.
The protocols for blastocyst recovery, manipulation, and targeted ES cellinjection are very well-established and can be found in many texts (e.g., seerefs. 18,19. Thus, these will not be discussed in detail. In brief, an average of10–15 targeted ES cells are transferred to each blastocyst injected. TargetedES cells in the exponential phase of growth are fed 1 h before being trypsinizedto create a single cell suspension, and resuspended in medium. ES cells (10–15)are drawn into the injection pipet while the blastocyst is held by suction to theholding pipet, so that the ICM can be clearly seen. The ES cells are then injectedinto the blastocoelic cavity, and the injected blastocysts are allowed to recoverfor 30–60 min prior to being transferred back into the mouse. These microma-nipulations are performed using a standard inverted phase microscope–micro-manipulator setup mounted on a stable platform.
Once the harvested blastocysts have been injected, they are then transferredback into the oviducts of a pseudopregnant host mouse until they are delivered(see Note 6).
3.2.5. Generation of Chimeric Mice
Pups are generally delivered 17 d after transfer into the pseudopregnantfemale and can be visually identified as being chimeric 10 d later by the agoutipigmentation (from the AB1 agouti ES cells) of their coat. Chimeric males canthen be set up to breed 6 wk later with C57BL/6 females. Germline transmis-sion of the targeted gene can be determined by the agouti coat of the F1offspring, as well as by allele-specific PCR on blastocyst outgrowths after 3 dof in vitro culture.
3.3. Genotyping of Targeted Mice and ES Cell Colonies
Protocols 1 and 2 describe the isolation of DNA from ES cell colonies andmouse tails, respectively. To screen targeted ES cell colonies and genotype tar-geted mice, usually Southern (Protocol 3) or PCR-based analysis of genomicDNA (Protocol 4) is performed (see Note 7).
To eliminate the need for conventional genotyping, genes that affect coatcolor have been cloned and used to facilitate genotyping visually (26–28). Forexample, Bradley and colleagues introduced a tyrosinase minigene to the vectorfor targeting a p53 gene knock-out (28). The tyrosinase gene has been shown togive pigment to an albino mouse. Thus, p53–/– mice, with two copies of thetyrosinase gene, exhibit a darker coat color (brown) than p53 +/– mice (beige),and wild-type mice (white) have no coat color. This visual approach avoids theneed for laborious and error-prone genotyping methods.

p53 Mutant Mice 39
3.4. Characterization of p53 Mutant Mice
3.4.1. Assessment of Mutant Mouse Development
Germline mutation of genes has often been shown to cause embryoniclethality. Many tumor suppressor gene knock-outs (e.g., Rb –/– [29,30] andBrca1 –/– [31,32]) are prone to lethality because of the pivotal role they play incell cycle control and apoptosis, which are two elements critical to embryonicdevelopment. Thus, it was initially surprising that the p53 knock-out and othermutant mice were shown to be embryonically viable (7,33,34). Even thoughlive homozygous knock-out births are obtained, this does not exclude the pos-sibility that a subset of knock-out mice die in utero.
One test to determine this is to set up matings of heterozygous mice anddetermine whether the genotypes of the resulting offspring give the expectedMendelian ratio. That is, you would expect approx 25% of the offspring to behomozygous null. In fact, this was not the case for the p53 knock-out mouse,and it has been reported that approx 16% of the female p53 null mice exhibitexencephaly, resulting from failure of the neural tube to completely close (35).Any significant reduction in the number of mutant mice from what is expectedshould be investigated to determine the stage at which normal embryonicdevelopment ceases. If a developmental problem is suspected, embryos shouldbe analyzed at mid-gestation (10.5–12.5 pc) and early gestation (6.5–8.5pc).The embryos can be sectioned and examined for developmental defects.
The reproductive capacity of both the male and female adult mutant miceshould also be assessed. Often the adult homozygous mutant mice have diffi-culties with either reduced or absent fertility or maternal instinct. For example,a fraction of male p53 null mice do not reproduce. p53 is reported to play a rolein spermatogenesis (36–38). Lack of p53 in the testes results in development ofa degenerative syndrome in the spermatogenic pathway. The female homozy-gous knock-out mice are found to have a poor maternal instinct and oftencannibalize offspring shortly after birth. Also, in some cases, female p53 nullmice gestate fetuses to term but fail to deliver the litter (unpublished observa-tions). p53 null and heterozygous knock-out mice are produced by crossing ahomozygous male (with a reproductive history) with a heterozygous femalemouse. Breeding pairs should be organized and monitored for any reproductivedifficulties.
3.4.2. Assessment of Tumor Development
Since p53 has been so heavily implicated in the development of many tumors(from various animals and tissue types), analyzing the incidence and spectrumof tumors is one of the more important characterizations. Generally, we take a

40 Dumble et al.
fairly large sample size of wild-type, heterozygous, and homozygous mutantmice (50–80 mice of each genotype) from both sexes and observe them for18–24 mo to record time for tumors to develop, as well as the types of tumorsthat arise. The large sample size is important to generate data reflecting therange of the tumor spectrum and also to generate comprehensive survival plots.The monitoring time of 18–24 mo is suggested, since we have noticed someweakly tumor-susceptible lines that will develop the odd tumor before 18 mo,but increase in frequency between 18 and 24 mo (L. Donehower, unpublisheddata). In our colony, wild-type C57BL/6 × 129/Sv mice are susceptible to tumordevelopment after 21 mo (39,40), so a large enough population of these con-trols is necessary to establish a background tumor incidence. Generally, wemonitor mice that are 3 to 4 backcrosses into the C57BL/6 strain background,so in most cases the mice are predominately C57BL/6 strain with some 129/Sv.Because each strain’s background can affect tumor incidence and spectra, theideal situation would be to backcross each mutation into a pure inbred back-ground, such as C57BL/6. The Jackson Laboratory (Bar Harbor, ME, USA)has backcrossed the p53 null allele into several different inbred backgrounds.
The colony of mice should be monitored through daily checks by animalcare technicians and once a week by the scientist in charge of the project. Thereare a number of characteristics of a mouse that may indicate the growth of atumor. These include: obvious growths, swelling of the abdomen or other areas(possible internal tumor), overall reduction in body size or wasting, sluggish-ness, difficulty moving, ruffled and thinning fur, pale ears and tail, heavybreathing, and hind limb paralysis (in the p53 +/– mouse this indicates possibleosteosarcoma). When the animal displays such signs of tumor development, itis sacrificed immediately to limit pain and suffering and subjected to a com-plete examination and necropsy.
Necropsies should ideally be carried out in collaboration with a veterinarypathologist. However, if one is not available, there are many texts detailing theprocedure (41–44). Results of the examination should be thoroughly recorded,noting the type, size, and position of the primary tumor, any other tissue abnor-malities, and smaller secondary tumors. The primary tumor and some unaf-fected organs should be excised, and a portion fixed in formalin (or the bestfixative for later analyses) for histology, while the remainder should be snap-frozen in liquid nitrogen for subsequent molecular analysis (RNA, DNA, andprotein). The tumor tissue should be cleaned free of any skin, connective tis-sue, blood, or other tissue types prior to freezing to minimize contamination offuture results by nontumorigenic tissue. Also, at this stage, blood and urine canbe collected and passed through routine, automated biochemical tests common

p53 Mutant Mice 41
to veterinary pathology laboratories. The fixed tissues can be passed throughgraded ethanols and embedded into paraffin. The tissues are sectioned at 4 μmand stained with hematoxylin and eosin (H & E) to determine tissue architec-ture and cell composition. The stained sections should be examined to deter-mine the tumor type. This should be performed by a veterinary pathologist or aclinical pathologist who is familiar with mouse tissues.
When tumor monitoring is completed, our laboratory then charts the spec-trum of tumors and plots the survival of the various mutant mice. Tumor spec-trum is represented in a simple table listing the type of primary tumor and thenumber of mice of each genotype to succumb to such a lesion. To simplify thisinformation, the incidence of the most common tumors can be represented in apie graph for each mouse genotype, and the remaining tumor types groupedtogether as “others.” The tumor incidences are best displayed by a Kaplan-Meier graph, which plots the percentage of tumor-free mice in each genotypeagainst the age of the mice. Details of the construction of this graph can beobtained from any biostatistics book (45,46). Our laboratory uses the StatView(SAS Institute, Cary, NC, USA) software to construct these plots.
3.4.3. Assessment of the Aging Process
Recently, our laboratory has documented a p53 mutant mouse (p53 +/m)that is resistant to tumor formation. However, this mutant line displayed early-aging-associated phenotypes at 16–18 mo (11). The p53 +/m mouse has exons1–6 deleted and a mutation at codon 245. This resulted in a C-terminal p53fragment being produced that is thought to activate wild-type p53. This agingphenotype was identified as the p53 +/m lifespan was significantly reducedwith no signs of overt neoplasms and by the “aged appearance” of the mouse.The p53 +/m mouse appears smaller (reduced adipose tissue and muscle atro-phy), with a hunched spine, ruffled fur, and sluggish movements. Many testswere used to characterize this accelerated aging phenotype, a few of which aredescribed below.
Some of the more simple tests to perform on these animals is to weigh boththe whole body as well as individual organs. Body weight is reported to declinewith the aging process, as is the weights of organs such as the liver, spleen,kidney, and muscle. Bone density is known to decrease with age, and so simpleX-rays of the whole animal can reveal any changes to bone mass. If differencesare seen between the mutant and wild-type mouse, histological examination ofthe affected organs can be performed to assess cellular changes. Organs shouldbe excised, fixed in formalin, paraffin-embedded, sectioned to 4 μm, andstained with a routine histological stain, such as H & E, to assess cellularity. In

42 Dumble et al.
collaboration with a pathologist experienced in mouse histology, it is possibleto assess morphological changes to organ architecture and any aberrations incellular composition.
Three organ systems that can be simply studied to assess aging include theskin, hair, and hematopoietic system. Our laboratory uses a wound-healingassay to assess the re-epithelialization ability of skin from various p53 mutantmice (47). This assay involves anesthetizing the mouse (2.5% Avertin; see ref.18) and shaving a small dorsal region of the mouse. Two 3-mm biopsy punchesare made in the shaved area, and the skin is excised using curved scissors. Themouse is allowed to recover for 4 d, after which it is sacrificed, the diameter ofthe holes measured, and the area sampled and prepared for histological cross-section. Routine staining with H&E will reveal the degree of re-epithelializa-tion, and comparisons can be made between the various genotypes. Assessmentof the rate of hair regrowth after shaving is another good indicator of age (48).Our laboratory conducts studies whereby the dorsal region on the mouse isagain shaved, and the length of the hair 20 d after shaving is recorded andcompared. With age, the rate of hair regrowth is dramatically reduced.
Finally, the use of 5-fluorouracil (5-FU) to ablate rapidly diving maturehematopoietic cells is another simple way to assess age. The rate at whichprecursor hematopoietic cells reconstitute the adult population is reduced in anolder animal. An intraperitoneal injection of 5-FU (100 mg/kg body weight) isgiven to the test and control mice. Prior to injection, and on d 6 and 11 afterinjection, a small amount of peripheral blood is taken from the tail vein, andthis blood can be analyzed for hemoglobin amounts as well as blood cell counts.We express the white blood counts as a function of time to generate a graphdisplaying the number of cells over this time period. Cells from an older oraging mouse exhibit a reduced ability to reconstitute the adult blood cell popu-lation compared to the control.
3.5. Protocol 1. Genomic DNA Purification from ES Cellsin 96-Well Plate (49)
1. When ES cells are confluent, remove medium from plate. Wash 2× with PBS.2. Add 50 μL of lysis buffer (10 mM Tris-HCl, pH 7.5, 10 mM EDTA, 10 mM
NaCl, 1 mg/mL proteinase K, 0.5% sodium dodecyl sulfate [SDS]) to each well.3. Seal plate with tape and incubate overnight at 55°C.4. Remove tape and add 100 μL of fresh ice-cold NaCl/ethanol (15 μL of 5 M NaCl
per 1 mL of cold 100% ethanol) to each well. Shake plate gently.5. Incubate at room temperature for > 1 h. DNA precipitate should be visible.6. Cover the plate with several layers of paper towels. Invert the plate with paper
towel, and blot away liquid from wells. DNA precipitate is attached to the bottomof well.

p53 Mutant Mice 43
7. Add 200 μL of 70% ethanol into each well; then remove the DNA with a blunt-end pipet tip into a microcentrifuge tube. Wash the DNA 2× with 70% ethanol.
8. Air-dry DNA for 1 to 2 min; then resuspend in 20 μL of TE buffer (10 mM Tris-HCl, 1 mM EDTA, pH 8.0). Leave at room temperature for several hours to allowthe DNA to dissolve completely.
3.6. Protocol 2. Preparation of Genomic DNA from Mouse Tails
1. Cut approx 1.5 cm of tail from each 3- to 6-wk-old mouse, and put the tail into a1.5-mL microcentrifuge tube. Store tails at –20 °C if not used immediately.
2. Add 0.5 mL of fresh tail lysis buffer (50 mM Tris-HCl, pH 7.5, 50 mM EDTA,100 mM NaCl, 1% SDS, 5 mM dithiothreitol [DTT]) plus 2 μL of 50 mg/mLproteinase K to each tube. Incubate tails overnight at 60°C.
3. Invert tubes several times to ensure the tail is completely digested. Usually onlysmall pieces of bone and hair are visible inside the tube. Add 0.5 mL ofphenol:chlorofrom (1:1) to each tail lysate. Invert tube vigorously for 30 s. Donot vortex mix.
4. Spin lysate at 10,000g for 2 to 3 min. Transfer aqueous phase to a fresh tube witha wide-bore 1-mL pipet tip. Avoid the interface.
5. Add 0.8 mL of 100% ethanol to each tube. Invert tube gently until cloudy DNAprecipitate forms. Spool out DNA with a pipet tip into a clean tube. Wash DNAwith 70% ethanol once and air-dry the DNA for 1 to 2 min.
6. Add 100 μL of TE buffer (10 mM Tris-HCl, 1 mM EDTA, pH 8.0) and incubateat 37°C for 1 to 2 h to dissolve completely.
3.7. Protocol 3. PCR Analysis of p53 Genotype:for p53 Mutant Mice Engineered by Donehower and Bradley (7)
1. In a 200-μL or 500-μL thin-wall PCR tube, mix in the following order: 5.0 μL10X PCR buffer with 1.5 mM MgCl2, 5.0 μL 10 mM dNTPs, 1.0 μL forwardprimer (1 μg/μL), 1.0 μL reverse primer (1 μg/μL), 1.0 μL Taq DNA polymerse(0.5 U/μL), 33.0 μL sterile double-distilled water, and 1.0 μL genomic DNA(250 ng/μL).Primer sequences: forward (WT p53) 5'-GTG TTT CAT TAG TTC CCC ACCTTG AC-3'; reverse (WT p53) 5'-ATG GGA GGC TGC CAG TCC TAA CCC-3'; forward (mutant p53) 5'-CTT GGG TGG AGA GGC TAT TC-3'; reverse (mu-tant p53) 5'-CCT GAT GCT CTT CGT CCA G-3'.
2. If thermal cycler does not have a heated lid, overlay the reaction mixtures with 50μL of mineral oil to prevent evaporation. Place tubes in the thermal cycler.
3. Set PCR cycles as follows: 1 cycle of 1 min at 94°C, then 30 cycles of 30 s at94°C, 30 s annealing at 55°C, 30 s at 72°C, then 1 cycle of 2 min at 72°C. An-nealing temperature depends on the melting temperature of the primers used. Forgenotyping PCR, amplified PCR products are usually shorter than 1 kb, there-fore, 1 min of elongation is sufficient. If longer PCR products are expected, werecommend elongation times calculated as 1 min/1 kb.

44 Dumble et al.
4. Prepare 2.0% agarose gel with 0.5 μg/μL ethidium bromide (EtBr). Electro-phorese 20 μL of product, and visualize under UV light. The wild-type p53 prim-ers generate a 320-bp product, while the primers specific to the neomycin cassettein the mutant allele produce a 450-bp product.
3.8. Protocol 4. Genotyping p53-Deficient Mice (Donehower–BradleyStrain) by Southern Analysis
1. Digest tail DNA with appropriate restriction enzyme overnight. For genotypingp53 –/–, +/–, and +/+, BamHI is used. Mix 21 μL double-distilled water (DDW),3 μL 10X enzyme buffer, 5 μL tail DNA (Protocol 2), 1 μL restriction enzyme,total vol 30 μL.
2. Southern blot protocol is adapted from that described by Reed and Mann (50).Prepare 0.7% agarose gel including 0.5 μg/mL of ethidium bromide. Load andelectrophorese digested DNA samples. Following electrophoresis, soak gel in0.25 M HCl for 10 min, and rinse 2X with double-deionized water.
3. In a deep dish, invert a gel tray, and place a wick made of filter paper and soakedwith 0.4 M NaOH over the platform. Eliminate all air bubbles. Place gel upsidedown on wick, and then place presoaked nitrocellulose membrane on gel. Wetfour filter papers and place on top of membrane followed by 2 in. of paper tow-els. Add 200–400 g weight and allow to transfer by capillary overnight.
4. Disassemble the transfer, and rinse the membrane once in wash Solution 1. Bakemembrane at 70°C for 1 h to immobilize the DNA to the membrane.
5. Slide the membrane into a Teche hybridization tube (22 × 8 cm). Add 20 mL ofprehybridization buffer to the tube and then prehybridize the membrane in theTeche HB-1D hybridization oven for 1 h at 68°C. Prehybridization solution(20 mL): 1 mL 10% milk, 2 mL 10% SDS, 1.5 mL 20X SSPE (3.0 M NaCl, 0.2 MNaH2PO4, 0.02 M EDTA, pH 7.4), and 14.5 mL DDW. Heat this solution to70°C. Boil 1 mL of 2.5 μg/μL salmon sperm DNA for 5 min; then add toprehybridization solution just before use.
6. Prepare radiolabeled probe from murine p53 cDNA comprising exons 2–6. In amicrocentrifuge tube, add 10 μL of DDW and 1 μL of DNA template (approx20 ng). Boil for 5 min and cool immediately on ice. Add 5 μL of isotope (32P -dCTP, 10 μci/μL) and 4 μL of High Prime solution (Roche MolecularBiochemicals, Indianapolis, IN, USA; cat. no. 1585592). Mix well and incubatethe reaction tube at 37°C for 10–20 min.
7. Purify radiolabeled probe with MicroSpin G-50 spin column (AmershamPharmacia Biotech , Piscataway, NJ, USA; cat. no. 27-5330-01).
8. Heat purified probe at 100°C for 5 min. Prepare hybridization solution. Hybrid-ization solution (20 mL): 7.5 mL DDW, 1.5 mL 20X SSPE, 2 mL 10% SDS, 1 mL10% fat-free milk, 8 mL 25% dextran sulfate. Heat this solution to 70°C, immedi-ately add denatured probe, and hybridize the membrane overnight at 68 °C.
9. Following hybridization, rinse membrane with Wash Solution 1 briefly. Washmembrane for 10 min in each of Wash Solution 2, 3, 4, and 5 (heated to 50°C)sequentially. Rinse membrane with Wash Solution 6. Air-dry membrane for 2 to
p53 Mutant Mice 45
3 min. Wrap it in plastic wrap, and expose to X-ray film in cassette at –80°C for12 h to 1 wk, depending on radioactive counts per minute recorded from the blot.
Wash Solution 1: 2X SSC (20X: 3.0 M NaCl and 0.3 M sodium acetate, pH 7.0.Wash Solution 2: 2X SSC with 0.1% (w/v) SDS.Wash Solution 3: 0.5X SSC with 0.1% (w/v) SDS.Wash Solution 4: 0.1X SSC with 0.1% (w/v) SDS.Wash Solution 5: 0.1X SSC with 0.1% (w/v) SDS.Wash Solution 6: 0.1X SSC.
10. For wild-type mice, the autoradiograph will exhibit a band at 10 kb (pseudogene)and at 5 kb (wild-type allele). For heterozygote mice, the film will show bands at10 k, 5 kb, and 6.5 kb (mutant allele). For homozygous mutant mice, only 10 and6.5-kb bands will appear.
4. Notes
1. The length and sequence of the homologous sequences in the vector will affectthe targeting efficiency. For most vectors, the length of homology ranges from2–8 kb.
2. Recombination-deficient bacterial strains, such as DH5 and HB101, should beused to amplify vector DNA. A large-scale preparation of vector DNA is usuallyprepared and purified over a CsCl gradient. Sometimes DNA isolated using com-mercial columns can be toxic to ES cells. After restriction enzyme digestion tolinearize the vector DNA, the DNA should be extracted 2× with phenol–chloro-form, ethanol-precipitated, washed 2× with 70% ethanol, and resusupended insterile PBS. The DNA concentration for electroporation should be optimized toacquire enough positive colonies after selection, but avoid a high number of non-specific insertions of vector DNA into chromosomal DNA.
3. DMEM is best bought ready-made to eliminate the introduction of endotoxins;the FBS should be batch-tested to ensure support of optimal growth. Extremecare is essential culturing ES cells, so they should not be allowed to overgrowand should not be split at too low a density, minimizing the number of popula-tions the cells pass through.
4. Electroporation should be optimized to determine the best conditions for a bal-ance between a high transfection efficiency and cell viability (in general,electroporation causes 50% of cells to die). Conditions that influence these twoparameters include the voltage, ion concentration, the concentration of DNA,and the ES cell confluency.
5. It is easiest to pick the colony using a drawn out pasteur pipet or yellow tip andtransfer the cells to a small vol of trypsin to be broken up. Following disaggrega-tion, the trypsin is diluted by addition of growth media, and the cells are replatedon gelatin-coated plastic.
6. The foster mother is usually chosen for her reproductive performance. Highfecundity and good maternal instinct are found in the commercially availableB6D2 line, although any random-bred mice with these maternal characteristicswill work. Likewise, the same strain vasectomized males (reproductively viru-

46 Dumble et al.
lent) can be used to produce the pseduopregnant females. Ideally, a coat colormarker could be incorporated to distinguish any offspring that result from thevasectomized male instead of the transferred blastocysts.
7. The PCR method has many advantages: (i) lower amount of DNA is needed; (ii)the PCR analysis can be done on pools of DNA samples; (iii) isotopes are notused for the PCR analysis; and (iv) the PCR analysis only takes a few hours to geta result, while Southern analysis takes a few days to a week. However, signifi-cant numbers of false positives and negatives can appear in the PCR results, whichreduces the reliability of the technique. Our laboratory prefers Southern analysis,despite the time and labor, since misgenotyping by PCR can have devastatingeffects further along. Actually, many other investigators prefer Southern analysisto genotype when they have sufficient genomic DNA available from ES cell colo-nies or mouse tails.
References1. Lane, D. P. (1994) p53 and human cancers. Br. Med. Bull. 50, 582–599.2. Donehower, L. A. and Bradley, A. (1993) The tumor suppressor p53. Biochim.
Biophys. Acta 1155, 181–205.3. Bargonetti, J. and Manfredi, J. J. (2002) Multiple roles of the tumor suppressor
p53. Curr. Opin. Oncol. 14, 86–91.4. Malkin, D., Li, F. P., Strong, L. C, et al. (1990) Germ line p53 mutations in a
familial syndrome of breast cancer, sarcomas, and other neoplasms. Science 250,1233–1238.
5. Lubet, R. A., Zhang, Z., Wiseman, R. W., and You, M. (2000) Use of p53transgenic mice in the development of cancer models for multiple purposes. Exp.Lung Res. 26, 581–593.
6. Srivastava, S., Zou, Z. Q., Pirollo, K., Blattner, W., and Chang, E. H. (1990) Germ-line transmission of a mutated p53 gene in a cancer-prone family with Li-Fraumenisyndrome. Nature 348, 747–749.
7. Donehower, L. A., Harvey, M., Shagle, B. L., et al. (1992) Mice deficient for p53are developmentally normal but susceptible to spontaneous tumours. Nature 356,215–221.
8. Donehower, L. A. (1996) The p53-deficient mouse: a model for basic and appliedcancer studies. Semin. Cancer Biol. 7, 269–278.
9. Jimenez, G. S., Nister, M., Stommel, J. M., et al. (2000) A transactivation-defi-cient mouse model provides insights into Trp53 regulation and function. Nat.Genet. 26, 37–43.
10. Liu, G., McDonnell, T. J., Montes de Oca Luna, R., et al. (2000) High metastaticpotential in mice inheriting a targeted p53 missense mutation. Proc. Natl. Acad.Sci. USA 97, 4174–4179.
11. Tyner, S. D., Venkatachalam, S., Choi, J., et al. (2002) p53 mutant mice that dis-play early ageing-associated phenotypes. Nature 415, 45–53.
12. Sauer, B. (1998) Inducible gene targeting in mice using the Cre/lox system. Meth-ods 14, 381–392.

p53 Mutant Mice 47
13. Jonkers, J., Meuwissen, R., van der Gulden, H., Peterse, H., van der Valk, M., andBerns, A. (2001) Synergistic tumor suppressor activity of BRCA2 and p53 in aconditional mouse model for breast cancer. Nat. Genet. 29, 418–425.
14. Tuveson, D. A. and Jacks, T. (2002) Technologically advanced cancer modelingin mice. Curr. Opin. Genet. Dev. 12, 105–110.
15. Chin, L., Tam, A., Pomerantz, J., et al. (1999) Essential role for oncogenic Ras intumour maintenance. Nature 400, 468–472.
16. Felsher, D. W. and Bishop, J. M. (1999) Reversible tumorigenesis by MYC inhematopoietic lineages. Mol. Cell. 4, 199–207.
17. Bradley, A. (1996) Introduction: Mutant mice in cancer research. Semin. CancerBiol. 7, 227–228.
18. Hogan, B., Beddington, R., Costantini, F., and Lacey, E. (1994) Manipulating theMouse Embryo: A Laboratory Manual. 2nd ed. CSH Laboratory Press, ColdSpring Harbor, NY.
19. Joyner, A. L. (2000) Gene Targeting: A Practical Approach. 2nd ed. Oxford Uni-versity Press, Oxford.
20. Martin, G. R. (1981) Isolation of a pluripotent cell line from early mouse embryoscultured in medium conditioned by teratocarcinoma stem cells. Proc. Natl. Acad.Sci. USA 78, 7634–7638.
21. Evans, M. J. and Kaufman, M. H. (1981) Establishment in culture of pluripotentialcells from mouse embryos. Nature 292, 154–156.
22. Williams, R. L., Hilton, D, J., Pease, S., et al. (1988) Myeloid leukaemia inhibi-tory factor maintains the developmental potential of embryonic stem cells. Nature336, 684–687.
23. Smith, A. G., Heath, J. K., Donaldson, D. D., et al. (1988) Inhibition ofpluripotential embryonic stem cell differentiation by purified polypeptides. Nature336, 688–690.
24. Robertson, E. J. (1987) Teratocarcinomas and Embryonic Stem Cells: A Practi-cal Approach. Oxford University Press, Oxford.
25. Potter, H., Weir, L., and Leder, P. (1984) Enhancer-dependent expression ofhuman kappa immunoglobulin genes introduced into mouse pre-B lymphocytesby electroporation. Proc. Natl. Acad. Sci. USA 81, 7161–7165.
26. Kucera, G. T., Bortner, D. M., and Rosenberg, M. P. (1996) Overexpression of anAgouti cDNA in the skin of transgenic mice recapitulates dominant coat colorphenotypes of spontaneous mutants. Dev. Biol. 173, 162–173.
27. Tanaka, S. and Takeuchi, T. (1992) Expression of tyrosinase gene in transgenicalbino mice: the heritable patterned coat colors. Pigment Cell Res. 5, 300–303.
28. Zheng, B., Mills, A. A., and Bradley, A. (1999) A system for rapid generation ofcoat color-tagged knockouts and defined chromosomal rearrangements in mice.Nucleic Acids Res. 27, 2354–2360.
29. Lee, E. Y., Chang, C. Y., Hu, N., et al. (1992) Mice deficient for Rb are nonviableand show defects in neurogenesis and haematopoiesis. Nature 359, 288–294.
30. Jacks, T., Fazeli, A., Schmitt, E. M., Bronson, R. T., Goodell, M. A., and Weinberg,R. A. (1992) Effects of an Rb mutation in the mouse. Nature 359, 295–300.

48 Dumble et al.
31. Liu, C. Y., Fleskin-Nikitin, A., Li, S., Zeng, Y., and Lee, W. H. (1996) Inactiva-tion of the mouse Brca1 gene leads to failure in the morphogenesis of the eggcylinder in early postimplantation development. Genes Dev. 10, 1835–1843.
32. Hakem, R., de la Pompa, J. L., Sirard, C., et al. (1996) The tumor suppressorgene Brca1 is required for embryonic cellular proliferation in the mouse. Cell85, 1009–1023.
33. Jacks, T., Remington, L., Williams, B. O., et al. (1994) Tumor spectrum analysisin p53-mutant mice. Curr. Biol. 4, 1–7.
34. Purdie, C. A., Harrison, D. J., Peter, A., et al. (1994) Tumour incidence, spectrumand ploidy in mice with a large deletion in the p53 gene. Oncogene 9, 603–609.
35. Sah, V. P., Seasholta, T. M., Sagi, S. A., and Brown, J. H. (1995) A subset of p53-deficient embryos exhibit exencephaly. Nat. Genet. 10, 175–180.
36. Yin, Y., Stahl, B., De Wolf, W., and Morgentaler, A. (1998) p53-mediated germcell quality control in spermatogenesis. Dev. Biol. 204, 165–171.
37. Rotter, V., Schwartz, D., Almon, E., et al. (1993) Mice with reduced levels of p53protein exhibit the testicular giant-cell degenerative syndrome. Proc. Natl. Acad.Sci. USA 90, 9075–9079.
38. Schwartz, D., Goldfinger, N., and Rotter V. (1993) Expression of p53 protein inspermatogenesis is confined to the tetraploid pachytene primary spermatocytes.Oncogene 8, 1487–1494.
39. Altaman, P. L. and Katz, D. (1979) Inbred and Genetically Defined Strains ofLaboratory Animals: Part 1, Mouse and Rat. FASEB, Bethesda.
40. Mohr, U., Dungworth, D. L., Ward, J., Capen, C. C., Carlton, W., and Sundberg,J. (1996) Pathobiology of the Aging Mouse. ILSI Press, Washington, DC.
41. Suckow, M. A., Danneman, P., and Brayton, C. (2001) The Laboratory Mouse.CRC Press, Boca Raton.
42. Brayton, C. A., Justice, M., and Montgomery, C. A. (2001) Evaluating mutantmice: Anatomic pathology. Vet. Pathol. 38, 1–19.
43. Relyea, M. J., Miller, J., Baggess, D., and Sundberg, J. P., et al. (2000) Necroscopymethods for laboratory mice: biological characterizations of a new mutation, inSystematic Approach to Evaluation of Mouse Mutations. CRC Press, Boca Raton,FL, pp. 57–89.
44. Ward, J. M. (2000) Pathology phenotyping of genetically engineered mice, inPathology of Genetically Engineered Mice (Ward, J. M., ed.) Iowa State Univer-sity Press, Ames, IA, pp. 155–160.
45. Lang, T. A. and Secic, M. (1997) How to Report Statistics in Medicine: AnnotatedGuidelines for Authors, Editors and Reviewers. American College of Physicians,Philadelphia.
46. Glantz, S. A. (1997) Primer of Biostatistics. 4th ed. McGraw-Hill, New York.47. Wojcik, S. M., Bundman, D. S., and Roop, D. R. (2000) Delayed wound healing
in keratin 6a knockout mice. Mol. Cell Biol. 20, 5248–5255.48. Archer, J. R. and Harrison, D. E. (1996) L-deprenyl treatment in aged mice slightly
increases life spans, and greatly reduces fecundity by aged males. J. Gerontol. ABiol. Sci. Med. Sci. 51, B448–B453.

p53 Mutant Mice 49
49. Matise, M. D., Auerbach, W., and Joyner, A. L. (2000) Production of targetedembryonic stem cell clones, in Gene Targeting: A Practical Approach. OxfordUniversity Press, Oxford.
50. Read, K. C. and Mann, D. A. (1985) Rapid transfer of DNA from agarose gels tonylon membranes. Nucleic Acids Res. 13, 7207–7221.

Screening for p53 Target Genes by FDD 51
51
From: Methods in Molecular Biology, vol. 234: p53 ProtocolsEdited by: S. Deb and S. P. Deb © Humana Press Inc., Totowa, NJ
4
Identification of p53 Target Genesby Fluorescent Differential Display
Susanne Stein, Yong-Jig Cho, Roger S. Jackson II, and Peng Liang
SummaryDifferential display (DD) is a method used worldwide for identifying differentially
expressed genes in eukaryotic cells. The mRNA DD technology works by systematic amplifi-cation of the 3' terminal regions of mRNAs. Using anchored primers designed to bind 5' bound-ary of the polyA tails for reverse transcription, followed by polymerase chain reaction (PCR)amplification with additional upstream primers of arbitrary sequences, mRNA subpopulationsare separated by denaturing polyacrylamide electrophoresis. This allows direct side-by-sidecomparison of most of the mRNAs between or among related cells. Because of its simplicity,sensitivity, and reproducibility, the mRNA DD method is finding wide-ranging and rapidapplications in developmental biology, cancer research, neuroscience, pathology, endocrinol-ogy, plant physiology, and many other areas. Since the recent development of the fluorescentdifferential display (FDD), the first nonradioactive DD system with equivalent sensitivity tothe original 33P isotopic labeling method, it is now possible with this technology to automate,which can greatly increase the throughput and accuracy of mRNA DD.
Key WordsmRNA differential display, fluorescent differential display, differential gene expres-
sion, tumor suppressor gene p53, p53 target genes
1. IntroductionCancer is a disease state caused by multiple genetic alterations, which lead
to unregulated cell proliferation. The most frequently mutated gene among allgenes known to be involved in human cancers is the tumor suppressor p53. Amajor outcome of such mutations is inactivation of the biochemical and bio-logical functions of the wild-type (wt) p53 protein. Among the biologicaleffects elicited by wt p53, the best documented are cell cycle arrest and pro-

52 Stein et al.
grammed cell death (apoptosis). p53 is a transcription factor that can mediatemany downstream effects by the activation or repression of target genes. Thetumor suppressor p53 is activated by a variety of cellular stresses such as heatshock, hypoxia, osmotic shock, and DNA damage (e.g., UV), which in turnleads to growth arrest and/or apoptosis. Apoptosis is likely to be the mostimportant function of p53 in suppressing tumor formation. However, themechanism by which p53 actually induces apoptosis remains to be determined.p53 can induce expression of proteins that target both the mitochondrial andthe death receptor-induced apoptotic pathways. Presently, particular interesthas focused on identifying target genes that mediate p53-induced apoptosis,because the induction of programmed cell death appears to be a critical compo-nent of p53-mediated tumor suppression and because of the therapeutic poten-tial of reactivation of this response in tumors. Recently, several p53 target geneswere reported, which appear to contribute to p53-dependent apoptosis path-ways (1–4). Remarkably, many of these p53 target genes were found by thedifferential display (DD) method. However, the identification of additional, ifnot all, p53 target genes remains to be of great importance, which could pro-vide the missing link between p53-mediated apoptosis and tumor suppression.
In this chapter, we present the procedure of DD and also discuss some criti-cal factors affecting the accuracy of the method. DD methodology was inventedin 1992 (5). Traditionally, DD is based on 33P radioactive labeling of cDNAbands. This is the most commonly used DD technology because of its sensitiv-ity, simplicity, versatility, and reproducibility. Since its description, numerousdifferentially expressed genes have been successfully identified in diverse bio-logical fields ranging from cancer research, developmental biology, neuro-science, plant physiology, and many other areas. Recently, a very similarsensitive DD method was established by fluorescent labeling (6). This is thefirst nonradioactive DD system with the equivalent sensitivity to the 33P isoto-pic labeling method. Fluorescent labeling is optimal for automation, which cangreatly increase the throughput and accuracy of DD. The general strategy forfluorescence differential display (FDD), which is very similar to the radioac-tive DD, is outlined in Fig. 1. Total or poly(A) RNA can be used for DDtechnique. Removal of all chromosomal DNA from the RNA samples withDNase I (with addition of RNase inhibitor) is essential before carrying out DD.The principle of the DD and FDD methods is to detect different gene expres-sion patterns by reverse transcription polymerase chain reaction (RT-PCR).The RT used one of the three individual one-base anchored oligo(dT) primers,which anneals to the beginning of a subpopulation of the poly(A) tails ofmRNAs. This anchored oligo(dT) (H-T11V) primer consists of 11 T’s (T11)with a 5' HindIII (AAGCTT) site plus one additional 3' base V (V may be dG,dA, or dC), which provide specificity. For FDD, fluorescent (rhodamine [R],

Screening for p53 Target Genes by FDD 53
red)-labeled anchored R-H-T11V primers are combined with various arbitraryprimers (AP) (13-mer, also containing a 5´ HindIII site, H-AP primers) in PCRsteps. The amplified PCR products up to 700 bp can be separated on a denatur-ing polyacrylamide gel. FDD image can be obtained using a fluorescent laserscanner. Side-by-side comparisons of cDNA patterns between or among rel-evant RNA samples would reveal differences in gene expression. The cDNAfragments of interest can be retrieved from the gel, purified, and reamplifiedwith the same set of primers (but without fluorescent labeling of H-T11Vprimer) under the same PCR conditions as in the initial FDD-PCRs. For furthermolecular characterization, the obtained reamplified PCR fragments are clonedand sequenced. DNA sequence analysis of these cDNA fragments by Basic
Fig. 1. Schematic representation of FDD. Illustration courtesy of GenHunterCorporation.

54 Stein et al.
Local Alignment Search Tool (BLAST) Search of the GenBank® (http://www.ncbi.nlm.nih.gov/BLAST/) may provide information whether a geneidentified by DD is a known, homologous to known, or a novel gene. The finalstep of the DD procedure is to confirm the differential expression of theobtained partial cDNAs by Northern blotting. The result of this analysis pro-vides not only confirmation by a method independent of DD, but also informa-tion about the size of the gene. After confirmation by Northern blot, the clonedcDNA probe can be used to screen a cDNA library for a full-length clone,which is helpful for the functional characterization of the gene.
2. Materials2.1. RNA Isolation and RNA Purification
1. RNApure™ Reagent (GenHunter®, Nashville, TN, USA).2. MessageClean® kit (GenHunter), 10X reaction buffer: 10 mM Tris-HCl, pH 8.3,
50 mM KCl, 1.5 mM MgCl2.3. Diethyl pyrocarbonate (DEPC)-treated distilled water (dH2O) (GenHunter).4. RNA loading dye (GenHunter).5. 10X 4-Morpholinepropanesulfonic acid (MOPS) buffer: 0.4 M MOPS, pH 7.0,
0.1 M sodium acetate, 0.01 M ethylenediamine tetraacetic acid (EDTA), store atroom temperature in the dark.
2.2. RT Reaction and FDD-PCR
1. 5X RT buffer: 125 mM Tris-HCl, pH 8.3, 188 mM KCl, 7.5 mM MgCl2, 25 mMdithiothreitol (DTT) (GenHunter) (see Note 1).
2. Moloney murine leukemia virus (MMLV) reverse transcriptase (100 U/μL)(GenHunter) (see Note 1).
3. dNTP mixture (2.5 mM) (GenHunter) (see Note 1).4. H-T11V anchor primer (V = A, C, G) (2 μM) (GenHunter) (see Note 1).5. R-H-T11V anchor primer (V = A, C, G) (2 μM) (GenHunter) (see Note 1)
(rhodamine [R]-labeled primers are light sensitive).6. H-AP 13-mer primers (1–160) with 50–70% GC content (2 μM) (GenHunter)
(see Note 1).7. 10X PCR buffer: 100 mM Tris-HCl, pH 8.4, 500 mM KCl, 15 mM MgCl2, 0.01%
gelatin (GenHunter) (see Note 1).8. FDD loading dye: 99% formamide, 1 mM EDTA, pH 8.0, 0.009% xylene cyanol
FF, 0.009% bromophenol blue (GenHunter) (see Note 1).9. Rhodamine locator dye (GenHunter) (see Note 1).
10. 10X TBE buffer (for 1 L): 108 g Trizma base, 55 g boric acid, 3.7 g EDTA.

Screening for p53 Target Genes by FDD 55
11. Autoclaved double-distilled water (ddH2O) (dH2O; GenHunter).12. Taq DNA polymerase (5 U/μL) (Qiagen, Valencia, CA, USA).
2.3. Northern Blot Analysis
1. 20X SSC buffer: 3 M sodium chloride, 0.3 M sodium citrate, pH 7.0.2. 100X Denhardt’s solution (for 500 mL): 10 g Ficoll® 400, 10 g polyvinylpyrroli-
done molecular weight (MW) 360,000, 10 g bovine serum albumin (BSA) frac-tion V (store at –20°C).
3. Hybridization buffer: 5X SSC, 50% formamide, 5X Denhardt’s solution, 1%sodium dodecyl sulfate (SDS), and fresh 100 μg/mL heat-denatured shearednonhomologous salmon sperm DNA (store at –20°C).
4. HotPrime™ DNA labeling kit (GenHunter).
3. Methods3.1. RNA Isolation from Cell Cultures
Total RNA can be isolated with one-step acid-phenol extraction method byusing RNApure™ Reagent.
1. After removal of the cell culture medium and wash step with 10–20 mL of coldphosphate-buffered saline (PBS), set the flask or plate on ice. Add 2 mL ofRNApure Reagent per culture flask to lyse the cells; spread the solution by shak-ing the plate, and let sit on ice for 10 min. Pipet the cell lysate (using a sterile cellscraper) into sterile Eppendorf® tubes and add 150 μL of chloroform/mL celllysate; finally, vortex mix well for about 10 s. Freeze the tubes at –80°C or pro-ceed to step 2.
2. Spin the tubes in an Eppendorf centrifuge at 4°C for 10 min with maximal speed(16,000g).
3. Carefully remove the upper (aqueous) phase and save this phase, which con-tained the RNA, into a clean new sterile tube.
4. For RNA precipitation, add an equal vol of isopropanol to the aqueous phase,vortex mix well, and let sit on ice for 10 min. Spin down the RNA pellet for 10 minat 4°C at maximal speed (16,000g). Rinse the RNA pellet with 0.5–1 mL of cold70% ethanol (treated with DEPC-dH2O). Spin down again for 10 min at 4°C atmaximal speed (16,000g). Remove the ethanol and resuspend the RNA pellet in20–50 μL of DEPC-dH2O. Make RNA aliquots and store the RNA at –80°C.
5. Before treatment with DNase I (see Subheading 3.2.), measure the RNA con-centration at OD260 with a spectrometer, and check the integrity (18S and 28SrRNA bands) of the RNA samples by running about 2 μg each RNA on a 1%agarose gel with 7% formaldehyde.

56 Stein et al.
3.2. DNase I Treatment of Total RNA
Removal of all contaminating chromosomal DNA from the RNA sample isabsolutely essential for successful DD. The MessageClean kit is specificallydesigned for the complete digestion of single- and double-stranded DNA.
1. Incubate 50 μL (10–50 μg) of total cellular RNA (use DEPC-dH2O when dilut-ing RNA) with 10 U (1 μL) of DNase I (RNase-free) in 5.7 μL of 10X reactionbuffer for 30 min at 37°C.
2. Inactivate DNase I by adding an equal vol of phenol:chloroform (3:1) to thesample. Vortex mix and leave the sample on ice for 10 min. Centrifuge the samplefor 5 min at 4°C in an Eppendorf centrifuge at maximal speed (16,000g).
3. Save the supernatant and ethanol precipitate the RNA by adding 3 vol of ethanolin the presence of 0.3 M sodium acetate.
4. After incubation at –80°C for 1 h (overnight to a few days at –80°C is recom-mended), pellet the RNA by centrifuging at 4°C for 10 min at maximal speed(16,000g). Rinse the RNA pellet with 0.5 mL of 70% ethanol (made with DEPC-dH2O) and dissolve the RNA in 20 μL of DEPC-treated dH2O.
5. Measure the RNA concentration at OD260 with a spectrophotometer. Check theintegrity of the RNA samples before and after cleaning with DNase I by running2 to 3 μg of each RNA on a 1% agarose gel with 7% formaldehyde. It is recom-mended to store the RNA samples as 1- to 2-μg aliquots at –80°C before usingfor DD.
3.3. RT of mRNAThe success of the DD technique is dependent on the integrity of the RNA
and that it is free of chromosomal DNA contamination (see Subheading 3.2.and Note 1).
1. Set up 3 RT reactions for each RNA sample in 3 PCR tubes (0.2–0.5 mL size);each should contain one of the 3 different one-base-anchored H-T11V primers(where V may be A, C, or G), for 20 μL final vol: 9.4 μL dH2O, buffer 4 μL 5XRT, 1.6 μL dNTP mixture (2.5 mM), total 2μL RNA (0.1 μg/μL freshly diluted indH2O), and 2 μL H-T11V primer (2μM). It is recommended to minimize thepipeting errors that a core mixture without an RNA template is made for eachanchored oligo(dT) primer if two or more RNA samples are to be compared.
2. Program the thermal cycler to 65°C for 5 min, 37°C for 60 min, 75°C for 5 min,and 4°C for 5 min.
3. After 10 min, add 1 μL of MMLV reverse transcriptase to each tube, incubatingat 37°C to initiate the RT reaction. At the end of the reaction, spin the tube brieflyto collect condensation. Set tubes on ice for FDD-RT-PCR or store at –20°C forlater use.

Screening for p53 Target Genes by FDD 57
3.4. FDD
The RNAspectra™ Red kit (GenHunter) can be used for this step as well asthe above RT reactions (see Notes 1–3). This step can be automated withrobotic liquid handling workstation such as BioMek 2000 (Beckman Coulter,Fullerton, CA, USA), which can greatly increase the throughput and accuracy.
1. Set up on ice (in dim light) a 20 μL PCR in thin-walled reaction tubes. For eachprimer set combination, use the following formula: 4.2 μL dH2O, 2 μL 10X PCRbuffer, 1.6 μL dNTP mixture (2.5 mM), 8 μL H-AP-primer (2 μM), 2 μL R-H-T11V (2 μM), 0.2 μL RT mixture from Subheading 3.3. (it has to contain thesame H-T11V primer used for FDD-PCR), and 0.2 μL Taq DNA polymerase.Make as much of the core mixes as possible to avoid pipeting errors.
2. Mix well by pipeting up and down. PCR conditions for 40 cycles are following:94°C for 20 s, 40°C for 2 min, 72°C for 1 min, followed by 72°C for 5 min,and 4°C for 5 min. Keep samples in the dark after running the PCR, and store at–20°C until the gel run.
3. Prepare a 6% denaturing polyacrylamide gel in 1X TBE buffer. Let the gel poly-merize for about 2 h before using. It is recommended that one glass plate betreated with Sigmacote® (Sigma, St. Louis, MO, USA) to facilitate the separa-tion of the plates after running. Prerun the gel for 30 min. Urea in the wells isvery critical and must be completely flushed just before loading of the samples.
4. Mix each PCR with 8 μL of FDD loading dye, and incubate at 80°C for 2 to 3 minimmediately before loading onto the 6% DNA polyacrylamide gel.
5. Electrophorese for 2 h at 60 W constant power until the xylene dye (the slowermoving dye) reaches the bottom.
6. After the gel run, clean the outsides of the plates very well with dH2O and ethanol.7. Scan the gel on a Fluorescence Imager using a 585 nm filter (for rhodamine).8. Cut out the bands of interest after careful separation of both glass plates. For
orientation of the lanes, a very helpful hint is to use the rhodamine locator dye.
3.5. Purification and Reamplification of cDNA Bands from FDD
1. Soak the gel slice (from step 8, see Subheading 3.4.) in 1 mL of dH2O for 30 min,mixing gently by finger-tipping.
2. Remove the water without taking the gel slice and add new 200 μL of dH2O. Boilthe tube with a tightly closed cap for 15 min to elute the DNA from gel. Spin for2 min at maximal speed (16,000g) to collect condensation and pellet the gel.Transfer the supernatant to a new tube and keep for the reamplification reaction.The tube with the gel slice can also be saved for the reamplification PCR.
3. Reamplification should be carried out in a total vol of 40 μL using the sameprimer combination and concentration (4 μL of each 2 μM primer), but without

58 Stein et al.
fluorescent-labeled anchor primer. The PCR conditions should be also the same,except the dNTP concentrations is changed; use 1 μL of a dNTP mixture (250 μM).As DNA template can be used: (i) 4 to 5 μL from supernatant in step 2; and/or (ii)the gel slice, which contains still little traces of the removed DNA (step 2).
4. Check 30 μL of each PCR sample on a 1.5–2% agarose gel (dependent on theexpected cDNA length) stained with ethidium bromide. Save the remaining PCRsamples at –20°C for future experiments (e.g., cloning, Northern blotting). Com-pare the size of the reamplified PCR products with the originally found length onthe FDD gel. Extract the positive reamplified cDNA fragments from the agarosegel with a QIAex® II Gel Extraction Kit (Qiagen).
3.6. Sequencing and Cloning of PCR Products
One crucial advantage of FDD is the rapid identification of the cDNAsequence by direct sequencing of the PCR products without subcloning of thesefragments. After gel purification from step 4 (see Subheading 3.5.),reamplified cDNA probes can be ligated into various cloning vector systemsand then subjected to DNA sequence analysis.
3.7. Confirmation of Different Gene Expression by Northern Blot
The confirmation by Northern blotting of the differential gene expression,which was found by the FDD procedure, is a very important method, becausethey are extremely sensitive and provide details exactly about the mRNA sizeof the screened cDNA fragments. Using the HotPrime DNA labeling kit, fol-lowing the standard procedure (7), a Northern blot can be performed.
One should be reminded that the DD method is not likely to be able to detectmutations at the DNA level directly. For diseases caused by single gene muta-tions that have a clear genetic component, chromosome mapping of the muta-tion locus should be a method of choice. It should be emphasized that themethod is only a simple screening tool. However, after confirmation by North-ern blot, the differentially expressed cDNA probe(s) might release a series ofmolecular studies in order to understand complex pathways.
3.8. Specific Applications of FDD
The p53 tumor suppressor gene has been implicated in the control of cellproliferation and tumor progression. Mutations in p53 are involved in a varietyof human cancers (including breast, ovary, colon, and lung). p53 is not highlyexpressed in the nuclei of normal cells; however, a variety of cellular insults(DNA damage, hypoxia, heat, starvation, etc.) result in elevated levels of thisprotein, whereas no dramatic induction of p53 mRNA levels occurred. Theexpression of the p53 protein protects the genome from accumulating excessmutations. p53 is well known as a cell cycle check point regulator, and pro-moter of cell cycle arrest and apoptosis in response to DNA damage. The

Screening for p53 Target Genes by FDD 59
human p53 contains an N-terminal transcriptional activation domain, a centralDNA-binding domain, and a tetramerization domain on the C-terminal region.The central region binds to a consensus DNA sequence and allows p53 to regu-late the transcription of a series of genes, the best characterized of which aremdm2 and p21WAF/CIP (8). mdm2 (murine double minute 2) is a proto-oncogeneand a negative feedback regulator of the tumor suppressor gene p53. mdm2binds to the N terminus of p53, represses p53-dependent transactivation of tar-get genes, and is also able to promote the rapid degradation of p53 through theubiquitin–proteosome pathway. The transcriptional activity of p53 leads toincreased expression of p21WAF/CIP (cyclin-dependent kinase inhibitor, a uni-versal cell cycle inhibitor). p21WAF/CIP is a direct p53 target gene, and deletionof this gene significantly reduces the cell cycle arrest response to p53 (9). Inthe last years, an intense search occurred for p53 target genes, which areinvolved in the p53-dependent apoptosis pathways. Numerous target genes ofp53 have been identified that play a role in the p53-dependent, as well as p53-independent, apoptosis. Interestingly, the DD methodology could be used tosuccessfully identify such p53 target genes, which are involved in the apoptosispathways (e.g., 1–4). However, at the moment, there is still considerableuncertainty about how exactly p53 expression is able to trigger apoptosis,although there is convincing evidence that p53 is necessary for the induction ofapoptosis. Therefore, it is necessary to search for further p53 target genes,which might be integrated in the p53-mediated programmed cell death.
3.8.1. Identification of p53-Induced and p53-Repressed Genes by FDD
In an attempt to identify p53 target genes, we used a tetracycline-regulated(“tet-off” system) p53 inducible colon cancer cell line, DLD-1 (10). This cellline contains an inactive endogenous p53 gene. The p53 protein in this systemis induced rapidly after removal of tetracycline (tet). The induction of wt p53stimulates the expression of the two well-known p53 target genes, p21 andmdm2, which were confirmed by Western blot analysis (Fig. 2). Some of ourFDD results from a comprehensive FDD screening are shown in Fig. 3. TotalRNA was extracted from the cells at the same time points (8 and 12 h) eitherwith tet (+tet, no p53 induction) or after tet removal (-tet, increased p53expression). As a positive control for our FDD system, specific arbitrary 13-merprimer (5'-AAA GCT TAG TGT AC-3') recognizing p21 was used in combi-nation with an A-anchored primer to confirm the induction of this gene by p53(Fig. 3). Our comprehensive FDD screening using hundreds of FDD primercombinations yielded over two dozen p53-regulated genes (to be publishedelsewhere). Among them are p53 itself, displayed by R-H-T11G with arbitraryprimer H-AP20, and mdm-2, displayed by R-H-T11A with arbitrary primerH-AP10 (Fig. 3). This provides a strong validation of our nonbiased and

60 Stein et al.
exhaustive screening for p53 target genes by DD strategy. Furthermore, FDDalso allows the analysis of digital gene expression profiling and precise quan-tification of gene expression differences (Fig. 4). The cell system used in ourstudy showed also clearly apoptotic features approx 16 h after removal of tet.Furthermore, the expression of apoptotic genes, such as PIGs, Bax, andGADD45, could be confirmed in this cell system (10). We have identified nu-merous p53 target genes (to be published elsewhere), which are either inducedor repressed by p53 using comprehensive FDD screening. Interestingly, over50% of these genes represent novel and previously uncharacterized genes (tobe published elsewhere). This is in contrast to methodology of DNAmicroarrays, which can generally recognize sample known gene sequences.Other advantages of DD over DNA microarrays are the requirement of muchless RNA, the ability to compare more than two different RNA samples simul-taneously, and also, the detection of rare mRNAs.
Fig. 2. Western blot analysis of p53-regulated protein expression. After removal oftet at different time points (8 h -tet and 12 h -tet), protein levels for p53, p21, andMDM-2 were analyzed in DLD-1 cells. The polyclonal antibody (pAb 1801) againstp53 was used. The antibodies against MDM2 (SMP-14) and p21 (C-19) werepurchased from Santa Cruz Biotechnology (Santa Cruz, CA, USA). As control forequivalent protein loading, anti-actin antibody was used (Sigma; cat. no. A2066).

Screening for p53 Target Genes by FDD 61
4. Notes
1. All materials or products for DD and FDD technology are commercially avail-able from GenHunter Corporation. The company offers also automated FDD ser-vices (from RT reactions to FDD results).
2. DD is widely used for the identification and isolation of differentially expressedgenes, and now the description of the FDD method can open a big area for auto-mated screening for many more differentially expressed genes. At the moment,some problems may appear in the technical equipment. For example, check theglass plates for the evenness; this is very critical for a correct scanning. The comb
Fig. 3. FDD analysis of p53-induced gene expression. Both p53 and mdm-2 wereamong genes identified by comprehensive FDD screening, whereas p21 was displayedas a positive control using a p21-specific 13-mer primer.

62 Stein et al.
must fit well between the two glass plates to avoid leaking among the lanes. Themajor problem for FDD has to do with that fact that a fluorescent laser scanner isvery expensive.
3. Information to minimize extrinsic and intrinsic factors can be found in somerecently published papers or reviews (11,12).
AcknowledgmentsThis work was supported in part by National Institutes of Health (NIH) grant
nos. CA76969 and CA74067 to P.L. and by Deutsche Akademie derNaturforscher-Leopoldina (Halle, Germany). We thank GenHunter Corporation(Nashville, TN, USA) for the permission of adapting the protocol from itsRNASpectra Fluorescent Differential Display kits and for using the fluorescentlaser scanner. We also thank Dr. J. Pietenpol for the polyclonal p53 antibody(pAb 1801) and Dr. B. Vogelstein for the tet-p53-regulated DLD-1 cell line.
References1. Lin, Y., Ma, W., and Benchimol, S. (2000) Pidd, a new death-domain-comtaining
protein, is induced by p53 and promotes apoptosis. Nat. Genet. 26, 124–127.2. Oda, E., Ohki, R., Murasawa, H., et al. (2000) Noxa, a BH3-only member of the
Bcl-2 familiy and candidate mediator of p53-induced apoptosis. Science 288,1053–1058.
Fig. 4. Quantification of mdm2, a p53-induced target gene. The fluorescent intensi-ties (see arrows) from the FDD data (see right panel of Fig. 3) were determined andcompared using FMBIO® analysis software (Hitachi Genetic Systems, South San Fran-cisco, CA, USA).

Screening for p53 Target Genes by FDD 63
3. Oda, E., Arakawa, H., Tanaka, T., et al. (2000) p53AIP1, a potential mediator ofp53-dependent apoptosis, and its regulation by Ser-46-phosphorylated p53. Cell102, 849–862.
4. Okamura, S., Arakawa, H., Tanaka, T., et al. (2001) p53DINP1, a p53-induciblegene, regulates p53-dependent apoptosis. Mol. Cell 8, 85–94.
5. Liang, P. and Pardee, A. B. (1992) Differential display of eukaryotic messengerRNA by means of the polymerase chain reaction. Science 257, 967–971.
6. Cho, Y. J., Meade, J. D., Walden, J. C., Chen, X., Guo, Z., and Liang, P. (2001)Multicolor fluorescent differential display. BioTechniques 30, 562–572.
7. Asubel, F., Brent, R., Kingston, R. E., et al. (1993) Current Protocol MolecularBiology, vol. 1, Greene and Wiley, New York, 4.9.1.–4.9.8.
8. May, P. and May, E. (1999) Twenty years of p53 research: structural and func-tional aspects of the p53 protein. Oncogene 18, 7621–7636.
9. El-Deiry, W. S. (1998) Regulation of p53 downstream genes. Semin. Cancer Biol.8, 345–357.
10. Yu, J., Zhang, L., Hwang, P. M., Rago, C., Kinzler, K. W., and Vogelstein, B.(1999) Identification and classification of p-53-regulated genes. Natl. Acad. Sci.USA 96, 14,517–14,522.
11. Liang, P. and Pardee, A. B. (1995) Recent advances in differential display. Curr.Opin. Immunol. 7, 274–280.
12. Cho, Y. J., Prezioso, V. R., and Liang, P. (2002) Systematic analysis of intrinsicfactors affecting differential display. BioTechniques 32, 762–766.

p53-Induced Analysis 65
65
From: Methods in Molecular Biology, vol. 234: p53 ProtocolsEdited by: S. Deb and S. P. Deb © Humana Press Inc., Totowa, NJ
5
p53-Induced Gene Expression Analysis
Joanna K. Sax and Wafik S. El-Deiry
SummaryResearchers in the p53 field have successfully used many high-throughput screening tech-
nologies to analyze and characterize p53-induced gene expression. This chapter will focus onone such technology, the Affymetrix GeneChip®. DNA-Chip technology has grown rapidlyover the last several years. The ability to hybridize RNA from a sample to thousands to tens ofthousands of known and unknown cDNAs spotted on a microarray chip has led to the explosionof information ranging from macro-global expression pattern changes to micro-gene-specificexpression changes. The relative ease of making a nonradioactive probe from either total RNAor mRNA to be hybridized to a GeneChip makes microarray technology highly attractive.
Key Wordsp53, transcription, microarray, gene expression, DNA-Chip
1. IntroductionGene chip expression technology has opened the door to explore both global
expression pattern differences and to discover potentially new transcriptionaltargets of a protein of interest. The minimal amount of starting tissue, cell, orRNA material required and the speed of performing the hybridization to thegene chip and receiving high-throughput statistical analysis in a short timemake gene chip technology highly attractive for large screens. DNA-Chip tech-nology has been used to monitor changes in global gene expression patterns(1–5). Moreover, these microarrays have been successfully used to analyzep53-regulated gene expression (5–7). Thousands of oligonuleotides are syn-thesized on each GeneChip® array (Affymetrix, Santa Clara, CA, USA).Hybridization of RNA probes from both a control and an experimental condi-tion to the GeneChip array allows one to compare which mRNAs are quantita-

66 Sax and El-Deiry
tively increased, decreased, unchanged, or not present. The GeneChip Expres-sion Technical Manual can be used as a guide (with modifications) to preparesamples to be hybridized to GeneChip Expression Probe Arrays. Careful prepa-ration of samples is vital to ensure little to no background on the GeneChip.The following chapter will include a detailed protocol for the preparation ofsamples from mammalian cells to be hybridized to the GeneChip. This chapterwill not include the actual hybridization protocol or the statistical analysismethods.
The basic principle behind the preparation of samples is to make single-stranded biotin-labeled cRNA from total RNA (Fig. 1). The cRNA is thenhybridized to a GeneChip that is made of cDNA. The advantages of usinglabeled cRNA over labeled cDNA include: (i) high stability of RNA/DNAhybrids; (ii) higher target selectivity and avidity; (iii) no self-hybridization;and (iv) strand selectivity (Enzo® Bioarray™ High Yield™ RNA TranscriptLableing Kit). Briefly, total RNA is made into double-stranded cDNA that isthen used as a template to make biotin-labeled cRNA. Once the cRNA ishybridized to the GeneChip, it is stained with fluorescein-labeled steptavidin,and the fluorescent intensity is then measured for each probe set.
2. Materials
1. RNeasy® Total RNA Isolation kit (Qiagen, Valencia, CA, USA).2. SUPERSCRIPT™ Choice system (Life Technologies, Rockville, MD, USA).3. Enzo RNA Trancript Lableing kit (Bioarray; cat. no. 42655).4. T7-(dT)24 primer, high-performance liquid chromatography (HPLC)-purified
DNA: 5'-GGCCAGTGAATTGTAATACGACTCACTATAGGGAGGCGG-(dT)24-3'.
5. Phase lock gel (PLG) (Eppendorf Scientific, Westbury, NY, USA).6. Phenol–chloroform–isoamyl alcohol.7. 7.5 M Ammonium acetate.8. Absolute ethanol.9. 80% Ethanol.
10. Water, molecular biology grade.11. Glycogen, 20 mg/mL.12. 5X fragmentation buffer: 200 mM Tris-acetate, pH 8.1, 500 mM KOAc, 150 mM
MgOAc.Note: make with diethyl pyrocarbonate (DEPC)-treated water, filter through a0.2-μm vacuum filter unit, and store at room temperature.
13. Sterile RNase-free microcentrifuge tubes.14. Sterile-barrier RNase-free pipet tips.15. UV spectrophotometer.16. Heatblock or warm water bath.17. Cooling water bath.

p53-Induced Analysis 67
3. MethodsThe methods described below contain a modified procedure from the
Affymetrix GeneChip Expression Technical Manual. The methods will con-tain: (i) isolation of total RNA using RNeasy Total Isolation kit from mamma-lian cells; (ii) synthesis of double-stranded cDNA from purified total RNA;(iii) clean up of double-stranded cDNA; (iv) in vitro transcription (IVT) reac-tion to label cDNA; (v) clean up of IVT; (vi) quantification of IVT product; and(vii) fragmentation of cRNA for hybridization.
3.1. Total RNA Isolation of Mammalian Cells
A variety of techniques can be used to isolate total RNA from mammaliancells, and most of these methods are probably reliable ways to obtain RNA.Affymetrix recommends the RNeasy Total Isolation kit. Follow themanufacturer’s protocol for total RNA isolation from mammalian cells (seeNote 1).
Fig. 1. Flowchart of steps involved to make the probe for the GeneChip. Begin withthe isolation of total RNA, followed by the synthesis of double-stranded cDNA. ThecDNA is then used as a template to make biotin-labeled cRNA. The labeled cRNA isthen used to hybridize to the GeneChip.

68 Sax and El-Deiry
3.2. Synthesis of Double-Stranded cDNA from Purified Total RNA
The RNA must first be synthesized into double-stranded cDNA, which willlater be used as a template to make the biotin-labeled cRNA (see Subheading3.4.). The following protocol is a modified version of the SUPERSCRIPT ChoiceSystem from Life Technologies combined with the protocol in the GeneChipExpression Technical Manual.
3.2.1. First Strand Synthesis
1. Begin with 8 μg high-quality total RNA. Combine RNA, DEPC-treated distilledwater (dH2O), and 1 μL T7 primer (see Subheading 2. for sequence) to a finalvol of 12 μL in an RNase-free Eppendorf® tube.
2. Incubate at 70°C for 10 min.3. Briefly spin down contents of tube and place on ice.4. Add 4 μL 5X first strand buffer, 2 μL 0.1 M dithiothreitol (DTT) and 1 μL 10 mM
deoxynucleoside triphosphates (dNTPs). Mix gently and incubate at 42°C for 2 min5. Add 1 μL reverse transcriptase, mix well, and incubate at 42°C for 1 h. After the
incubation, spin down the contents briefly, and place the tube on ice.
3.2.2. Second Strand Synthesis
1. Combine the following reagents in the first strand synthesis tube: 91 μL DEPC-treated dH2O, 30 μL 5X second strand buffer, 3 μL 10 mM dNTPs, 1 μL DNAligase, 4 μL DNA polymerase, and 1 μL Rnase H.
2. Gently tap the tube to mix, briefly spin down the contents, and incubate at 16°Cfor 2 h.
3. Add 2 μL T4 DNA polymerase and incubate an additional 5 min at 16°C.4. Add 10 μL 0.5 M ethylenediamine tetraacetic acid (EDTA) to stop reaction.
Proceed directly to clean up or store at –20°C.
3.3. Clean up of Double-Stranded cDNA
1. Pellet the PLG tube at full speed for 20–30 s.2. Combine equal vol of phenol–chloroform to final cDNA synthesis preparation
and vortex mix.3. Transfer the mixture to the PLG tube and centrifuge at 13,000 rpm for 2 min
( 10,000g). Note: do not vortex mix once the mixture has been added to thePLG tube.
4. Transfer the upper aqueous phase to a fresh Eppendorf tube. Discard the PLGtube in appropriate phenol–chloroform waste.
5. Add 0.5 vol of 7.5 M sodium acetate, 2.5 vol cold 100% ethanol, and 1 μL 20 mg/mL glycogen and vortex mix.
6. Centrifuge the samples at 13,000 rpm ( 10,000g) at room temperature for 20 minto precipitate the DNA.
7. Remove the supernatant carefully and wash the pellet 2×with 80% ethanol, sepa-rated by 5-min spins in the centrifuge.

p53-Induced Analysis 69
8. Allow pellet to air-dry, and resuspend in 12 μL DEPC-treated dH2O. Store thesamples at –80°C, or continue on the Enzo labeling kit.
3.4. IVT Reaction to Label cDNA
The following protocol can be used to transcribe the cDNA into cRNA withbiotin-labeled ribonucletides. The use of RNA probes in GeneChip analysishas several advantages, including high target avidity and specificity, strandspecificity, and ease of detection using a fluorophore conjugated to streptavidin(Enzo® BioArray™ Highyield™ RNA Transcript Labeling Kit).
3.4.1. RNA Transcript Labeling Reaction
The following is taken from the Enzo RNA Transcript Labeling kit.1. Combine 10 μL of the double-stranded cDNA with 12 μL dH2O, 4 μL 10X HY
reaction buffer, 4 μL 10X biotin-labeled ribonucleotides, 4 μL 10X DTT, 4 μL10X Rnase inhibitor mix, and 2 μL 20X T7 RNA polymerase. Do the previousadditions in the order given at room temperature.
2. Carefully mix the reagents and centrifuge the tubes briefly to collect the sampleat the bottom of the tube.
3. Incubate the tubes in a 37°C water bath for 4 to 5 h, and gently mix the contentsof the tubes every 30–45 min.
4. Store at –20°C, or proceed to the purification of labeled RNA transcripts.
3.5. Purification of RNA-Labeled Transcripts
To clean up the IVT products, use the RNeasy spin columns from Qiagen,and follow the manufacturer’s protocol for RNA clean up. Purify the entirereaction at one time, and pass the sample over the column twice before thewash and elution steps (see Note 2). Use 35 μL elution buffer and wait 1 minbefore centrifugation.
3.6. Quantification of IVT Products
Dilute the cRNA 1:100 and measure the absorbance using a UV spectropho-tometer. Measure the sample at both 260 and 280 nm. The ratio between themeasurements should be between 1.9 and 2.1 for pure RNA. For quantificationof cRNA, an adjusted yield must be calculated to reflect the carryover of unla-beled RNA (when using total RNA as starting material). As described in theGeneChip Expression Technical Manual, use the following formula to deter-mine the adjusted cRNA yield:
Adjusted cRNA yield = RNAm – (total RNAi)(y), where RNAm = amount ofcRNA measured after IVT (μg); total RNAi = starting amount of total RNA(μg); and Y = fraction of cDNA reaction used in IVT.
For example, starting with 8 μg total RNA, 83% of the cDNA was added tothe IVT reaction (i.e., used 10 μL of the 12 μL final vol in Subheading 3.4.),

70 Sax and El-Deiry
giving a yield of 50 μg cRNA. Therefore, the adjusted yield would equal 50 μgcRNA – (8 μg)(.83) = 43.36 μg.
Approximately 30 μg of cRNA is needed for each GeneChip. The sampleshould be at a minimal concentration of 0.6 μg/μL. If the sample is too diluteafter the Qiagen clean up, then proceed to an ethanol precipitation and resus-pend in a smaller vol of RNase-free dH2O. If the concentration of RNA isappropriate, proceed to fragmentation of cRNA (see Note 3).
3.7. Fragmentation of cRNA
1. Combine 2 μL of 5X fragmentation buffer for every 8 μL of RNA plus H2O.2. Incubate at 94°C for 35 min.3. Place the reaction on ice following the incubation (see Note 4).4. The concentration of cRNA must be adjusted again to take into account the frag-
mentation buffer.5. Store samples at –20°C until ready to hybridize on GeneChip.
4. Notes1. Elute the RNA from the RNeasy spin column in 30 μL total vol. Allow the elu-
tion buffer to stay on the column for 1 min before centrifugation. A concentrationaround 1 μg/μL is optimal.
2. The GeneChip Technical Manual recommends purifying one half of the IVTreaction at a time. However, when beginning with 8 μg RNA as the startingmaterial, it is not necessary to separate the reaction for purification.
3. The GeneChip Technical Manual recommends running a 1% agarose gel with1% of each sample to visualize the yield and size distribution of the labeled tran-scripts. This step is optional.
4. The fragmentation reaction should produce RNA products ranging from 35–200bp. This can be visualized on an agarose gel stained with ethidium bromide.
References1. DeRisi, J. L., Iyer, V. R., and Brown, P. O. (1997) Exploring the metabolic and
genetic control of gene expression on a genomic scale. Science 278, 680–686.2. Iyer, V. R., Eisen, M. B., Ross, D. T., et al. (1999) The transcriptional program in
the response of human fibroblasts to serum. Science 283, 83–87.3. Schena, M., Shalon, D., Davis, R. W., and Brown, P. O. (1995) Quantitative moni-
toring of gene expression patterns with a complementary DNA microarray. Sci-ence 270, 467–470.
4. Wodicka, L., Dong, H., Mittmann, M., Ho, M. H., and Lockhart, D. J. (1997)Genome-wide expression monitoring in Saccharomyces cerevisiae. Nat.Biotechnol. 15, 1359–1367.
5. Zhao, R., Gish, K., Murphy, M., et al. (2000) Analysis of p53-regulated geneexpression patterns using oligonucleotide arrays. Genes Dev. 14, 981–993.

p53-Induced Analysis 71
6. Maxwell, S. A. and Davis, G. E. (2000) Differential gene expression in p53-medi-ated apoptosis-resistant vs. apoptosis-sensitive tumor cell lines. Proc. Natl. Acad.Sci. USA 97, 13,009–13,014.
7. Wang, L., Wu, Q., Qiu, P., et al. (2001) Analyses of p53 target genes in thehuman genome by bioinformatic and microarray approaches. J. Biol. Chem. 276,43,604–43,610.

Real-Time QPCR Using SYBR® Green I 73
73
From: Methods in Molecular Biology, vol. 234: p53 ProtocolsEdited by: S. Deb and S. P. Deb © Humana Press Inc., Totowa, NJ
6
Real-Time Polymerase Chain Reaction Quantitationof Relative Expression of Genes Modulatedby p53 Using SYBR® Green I
Katherine E. Roth Stagliano, Evie Carchman, and Sumitra Deb
SummaryReal-time quantitative polymerase chain reaction (QPCR) using the Roche LightCycler® was
used to verify the expression of asparagine synthetase (ASNS) identified by microarray analysisas a target of p53 transrepression and mutant p53 transactivation. A p53-null cell line derivedfrom lung carcinoma, H1299, was infected with recombinant adenovirus expressing wild-type(WT) p53, mutant p53-D281G, or -galactosidase as a control. After 24 h of infection, RNAwas harvested and used for microarray analysis. ASNS was one of several genes whose expres-sion was down-regulated by WT p53 and up-regulated in the presence of mutant p53. Expres-sion levels of ASNS were measured relative to an exogenously applied quality-control nucleicacid template. Real-time PCR product accumulation was monitored using the intercalating dye,SYBR® Green I, which exhibits a higher fluorescence upon binding of double-stranded DNA.Relative gene expression was calculated using conditions at the early stages of PCR, whenamplification was logarithmic and, thus, could be correlated to initial copy number of genetranscripts. ASNS was found to be down-regulated in the presence of WT p53 and up-regulatedby mutant p53.
Key Wordsp53, real-time PCR, QPCR, SYBR Green I, microarray, asparagine synthetase,
transactivation
1. IntroductionAs a transcription factor, p53’s ability to influence the expression of other
genes has been and continues to be a subject of intense scrutiny. A large groupof genes has been identified as targets of p53-mediated transactivation ortransrepression using techniques, such as microarray analysis or serial analysis
74 Stagliano et al.
of gene expression (1–4). The ability to rapidly analyze the expression levels ofgenes relevant to p53 is a vital component in understanding p53 function anddysfunction. Real-time quantitative polymerase chain reaction (QPCR) is espe-cially suited to validate the modulation of expression of genes affected by p53.
QPCR can be employed to quantify the expression of genes in essentiallyany system where traditional methods such as Northern blot hybridizations orRNase protection assays would be used. QPCR is quantitative, rapid, requiresas little as 1000-fold less RNA than conventional assays, and is easily adaptedto the analyses of new targets (5). Product accumulation is measured duringthe log-linear phase of PCR amplification, making QPCR the most accuratemethod of quantitating gene expression currently available (6). In this chapter,we describe the application of QPCR to quantitate the differential expressionof asparagine synthetase (ASNS) in the presence of either wild-type (WT) p53or mutant p53-D281G. These methods have been optimized in our laboratoryfor use in Roche’s LightCycler®. Adjustments to these protocols should adaptthem to QPCR machines from other manufacturers.
A p53-null cell line derived from lung carcinoma, H1299, was infected withrecombinant adenovirus expressing WT p53, mutant p53-D281G, or -galac-tosidase as a control. After 24 h of infection, RNA was harvested and used formicroarray analysis. ASNS was one of several genes whose expression wasdown-regulated by WT p53 and up-regulated in the presence of mutant p53.Prior to further investigations, this in silico observation was validated usingQPCR. Expression levels of ASNS were measured relative to an exogenouslyapplied quality-control nucleic acid template. Real-time PCR product accumu-lation was monitored using the intercalating dye, SYBR® Green I, whichexhibits a higher fluorescence upon binding of double-stranded DNA. Relativegene expression was calculated using conditions at the early stages of PCR,when amplification was logarithmic and, thus, could be correlated to initialcopy number of gene transcripts.
2. Materials1. Recombinant adenovirus expressing wild-type p53, mutant p53-D281G, and
-galactosidase.2. Trizol® reagent (Invitrogen, Carlsbad, CA, USA).3. Isopropanol for molecular biology (Sigma, St. Louis, MO, USA).4. RNase-free water (RFW) (Sigma).5. UV/VIS spectrophotometer (DU® 530; Beckman Coulter, Fullerton, CA, USA).6. Phenol (Invitrogen).7. Chloroform for molecular biology (Fisher Scientific, Pittsburgh, PA, USA).8. Ethanol (ETOH) for molecular biology (Sigma).9. NaCl Solution for molecular biology (Sigma).
10. 10 mM Tris-HCl, pH 8.0.

Real-Time QPCR Using SYBR® Green I 75
11. RNase-free Tris-borate-ethylenediamine tetraacetic acid (EDTA) (Eppendorf,Westbury, NY, USA).
12. GeneChip™ System (Affymetrix, Santa Clara, CA, USA).13. RQ1 RNase-Free DNase kit (Promega, Madison, WI, USA).14. RiboGreen® RNA quantitation kit (Molecular Probes, Eugene, OR, USA).15. FLUOstar (BMG LabTechnologies, Durham, NC, USA).16. Brome mosaic virus (BMV) RNA (Promega).17. Thermoscript™ reverse transcription (RT)-PCR system (Invitrogen).18. Oligo 5.0 Software (NBI/Genovus, Plymouth, MN, USA).19. Oligonucleotide primers (Sigma-Genosys, The Woodlands, TX, USA).20. LightCycler (Roche Molecular Biochemicals, Indianapolis, IN, USA).21. LightCycler capillaries (Roche Molecular Biochemicals).22. Platinum® Taq DNA polymerase (Invitrogen).23. Taq DNA polymerase PCR buffer 10X (Invitrogen).24. PCR-grade water (Invitrogen).25. 50 mM MgCl2 (Invitrogen).26. 10 mM dNTP mixture (Invitrogen).27. 50 mg/mL Bovine serum albumin (BSA) (Invitrogen).28. SYBR nucleic acid gel stains (Molecular Probes).29. Agarose gel electrophoresis equipment.
3. MethodsThe methods described below outline: (i) preparation of total RNA and
microarray analysis; (ii) synthesis of cDNA from total RNA for QPCR analy-sis; (iii) design and optimization of QPCR primers; (iv) QPCR; and (v) inter-preting QPCR data.
3.1. Preparation of Total RNA and Microarray Analysis
3.1.1. Adenoviral Infection
H1299 cells, 3 × 10⁶ cells in a 10-cm dish, were infected with recombinantadenoviruses at a ratio of five plaque forming units per cell for the followingconstructs: WT p53, mutant p53-D281G, and -galactosidase. Theseadenoviruses were constructed by Dr. Kristoffer Valerie in the Virus CoreCenter of the Massey Cancer Center, Richmond, VA. Total RNA was extracted24 h after infection.
3.1.2. Extraction of Total RNA
Care should be taken when dealing with RNA to protect against degradationby RNases; general precautions have been described by others (7).
1. Extract total RNA from each of the three samples: (i) H1299 cells infected withadenovirus expressing WT p53 (H1299 Ad WT p53); (ii) H1299 cells infectedwith adenovirus expressing mutant p53-D281G (H1299 Ad p53-D281G); and (iii)

76 Stagliano et al.
H1299 cells infected with adenovirus expressing -galactosidase (H1299 Ad gal).Use Trizol reagent according to manufacturer’s instructions. Precipitate RNA bymixing with isopropanol, and store at –80°C for at least 2 h. In our hands, RNAstored at this stage can be recovered successfully more than 1 yr later.
2. Recover RNA from isopropanol as described by the manufacturer, and resuspendin 200 μL of RFW.
3. Determine the concentration of RNA by spectrophotometer. Dissolve RNA(4 μL) in 96 μL of 10 mM Tris, pH 8.8. A 260/280 ratio below 1.6 was consid-ered an indication of the presence of protein or other contaminants. Standardphenol–chloroform extraction followed by ETOH precipitation (2.5 vol ETOHwith 0.1 vol 2 M NaCl) normally enhanced the purity of the sample, as indicatedby a 260/280 ratio between 1.7–2.0.
4. Inspect RNA (3–5 μg) by 1.2% Tris-borate-EDTA agarose gel electrophoresis toverify integrity before continuing.
3.1.3. Microarray Analysis
Microarray analysis was performed using the GeneChip System. TheGeneChip employs a single color system, in which each sample is hybridizedto a separate single use array. The general procedures are described in detailelsewhere (8,9).
3.2. Synthesis of cDNA from Total RNA for QPCR Analysis
Quantitation of gene expression relies on the analysis of highly labilemRNA. Converting total RNA into cDNA permits extensive analysis withoutcompromising the integrity of the transcript. Care must be taken during cDNAsynthesis to maintain the integrity and purity of the sample. Because QPCR ishighly sensitive, trace contamination of salts, ETOH, and the like, can alter theefficiency of the reaction and, thus, skew the data.
3.2.1. DNase Treatment
In order to ensure the absence of contaminating genomic DNA, DNase treat-ment of RNA samples is a standard procedure in our laboratory.
1. Perform RQ1 RNase-free DNase treatment following the manufacturer’s proto-col, and up-scale the vol to accommodate 25 μg of total RNA for each of thethree samples: H1299 Ad gal, H1299 Ad WT p53, and H1299 Ad p53-D281G.
2. Purify the DNase-treated samples by standard phenol–chloroform extraction andethanol precipitation as described elsewhere (7).
3. After recovery from ethanol, suspend RNA in 30 μL of RFW.
3.2.2. Quantitation of Total RNA by RiboGreen
Theoretically, relative quantitation using QPCR does not require that theconcentration of control and experimental cDNA be equal. However, the

Real-Time QPCR Using SYBR® Green I 77
application of relative quantitation by QPCR usually requires relying on theexpression of a “housekeeping gene” whose mRNA levels are thought not tochange in relative abundance between samples. Rather than relying solely onthe expression of a housekeeping gene, we equalized the amount of RNA incontrol and experimental samples prior to cDNA synthesis using a fluorescentdye, RiboGreen. RiboGreen is an ultrasensitive fluorescent dye which, whenused with a standard curve, can quantitate as little as 1 ng/mL of RNA.RiboGreen fluorescence levels increase linearly with the amount of RNA boundto the dye. The RiboGreen kit includes the RiboGreen reagent, RNase FreeTris-EDTA for dilutions and ribosomal RNA for the creation of a standardcurve to allow exact quantification of RNA. Fluorescence was detected using afluorescence microplate reader (FLUOstar), with excitation at 480 nm andemission at 520 nm.
3.2.3. Exogenously Applied Quality Control Template
Efficiency of reverse transcription of RNA into cDNA can be impacted bymany variables, such as contamination by salt or ETOH. In order to take intoaccount efficiency of the RT reaction, we spiked our RNA samples with 50 ngof BMV RNA. BMV infects plants, and its genome contains no homology tomammalian genomes.
3.2.4. cDNA Synthesis
Perform cDNA synthesis using the ThermoScript system, and follow themanufacturer’s instructions. Five synthesis reactions were performed persample of either H1299 Ad gal, H1299 Ad WT p53, or H1299 Ad p53-D281Gusing 1 μg RNA per reaction of 20 μL vol. Each sample set also contained anegative control, devoid of reverse transcriptase. We routinely use randomprimers to generate cDNAs for later QPCR analysis.
3.2.5. Verification of cDNA
After synthesis, test each cDNA reaction using glyceraldehyde-3-phosphatedehydrogenase (GAPDH) primers. This step ascertains if cDNA was synthe-sized. Additionally, by testing the negative control, it determines whether con-tamination by genomic DNA is a problem. Description of QPCR conditionsneeded to verify cDNA are described in Subheading 3.4.
3.2.6. Storage of cDNA
This step allows longer storage of cDNA without compromising its integrity.
1. Combine all five batches of cDNA for the H1299 Ad gal samples and gentlyvortex mix.

78 Stagliano et al.
2. Prepare aliquots (9 μL) in 0.2-mL tubes and then freeze in a –20°C frosty freezerfor storage until needed.
3. Repeat this procedure for cDNA of the other samples: H1299 Ad WT p53 andH1299 p53-D281G.
3.3. Design and Optimization of QPCR Primers
3.3.1. Primer Design
1. Software. Primer design is a crucial step in a successful QPCR. Primer designsoftware makes primer design relatively simple and straightforward. We havehad a good level of success using Oligo 5.0 Software. A number of primer designprograms are also available free on the Web, some of which are listed in Table 1.Using the Oligo 5.0 program, QPCR primers were designed for ASNS, GAPDH,and BMV (Table 2). ASNS was the target gene of interest. BMV served as astandard, to which ASNS expression was normalized, allowing for relativequantitation of gene expression (see Subheading 3.5.). GAPDH, used tradition-ally as a housekeeping gene, was used to verify the absence of contaminatinggenomic DNA in cDNA preparations. Normalization to GAPDH was also exam-ined (see Note 1).
2. Specifications of primers. The following specifications, discussed in more detailin the LightCycler Operator’s Manual, should be kept in mind during primerdesign (10). Roche considers product lengths of 100–150 bp as optimal for am-plification using the LightCycler; however, we routinely design our products be-tween 150 and 250 bp. The upper limit for product length is 500 bp. The primersthemselves should be approx equal in length, ranging from 18–24 nucleotides.The melting temperature (Tm) of most primers ranges from 55–65°C. Ideally,primers that are used together should have a similar Tm value. The Tm of a primeris the temperature at which 50% of the primer is bound to its target and 50% ofthe primer is free or single-stranded. Tm is largely affected by GC content; thus, itis advisable to design primers with an equal GC content. GC contents rangingfrom 40–70% will yield effective primers. In our hands, primers and productswith lower GC contents present fewer problems during primer optimization thanthose with high GC contents. The specifications for the ASNS primers developedusing Oligo 5.0 Software fall within these guidelines (Table 3).
3. Primer dimers. Careful primer design can lessen the occurrence of “primer dim-mers,” which prevent quantification during QPCR analysis (Fig. 1B). Primerdimers are the result of nonspecific annealing and elongation. Primer dimers canresult from primers annealing with other primers or with nonspecific sequences.To avoid primer dimers, we design primers in which the 3' end is free of second-ary structures, repetitive sequences, palindromes, and degenerate sequences.Likewise, we avoid primer sets that complement each other, specifically at their3' end. The 3' end is most important, because amplification starts at this end.Further discussions about the occurrence of primer dimers can be found else-where (10).

Real-Time QPCR Using SYBR® Green I 79
4. Gene structure. While QPCR is well suited for high-throughput analysis of geneexpression, constantly changing the target mRNA sequence can be challenging.It is always useful to dedicate some extra time for checking up on the structure ofthe gene whose expression is being analyzed. For example, some genes havemultiple promoters, which result in multiple tissue or developmental specific tran-scripts. Primer design must include a consideration of such issues. Primer designis a crucible step in QPCR experiments, because it will set the stage for the lateranalysis. Careful primer design will save time and money.
3.3.2. Synthesis of Primers
Roche recommends that primers be highly purified to remove extraneoussalts left over from the synthesis process. We routinely use standard primerssynthesized by Sigma-Genosys without extra purification and without prob-lems. A working primer concentration of 0.5 μM is our standard concentrationfor use in the LightCycler. Precautions should be taken against primer degra-
Table 1Primer Design Software Available Free on the World Wide Web
Software Source
NetPrimer http://www.PremierBiosoft.com/netprimer/netprimer.html
Primer 3 http://www-genome.wi.mit.edu/cgi-bin/primer/primer3_www.cgi
Primer Selection (USC) http://norp5424b.hsc.usc.edu/genetools.htmlPrimer Selection (VGC) http://alces.med.umn.edu/VGC.html
Table 2Primer Sequences Designed for Use in QPCR
Primer Primer sequence 5'-3' Product size (bp)
ASNS-F AGAGATTCTCTGGCGACCAAAAGA 203ASNS-R CTGGGTAATGGCGTTCAAAGACTT
GAPDH-F GTCAACGGATTTGGTCGTATT 223GAPDH-R GATCTCGCTCCTGGAAGATGG
BMV-F CCGAGGTGTCTGTTGAGGTA 195BMV-R CGTCTATGCGATGGTAGGTCT
Primer sequences were designed using Oligo 5.0 Software.F, designates a forward primer; R, designates a reverse primer

80 Stagliano et al.
dation. Inappropriate storage of primers can result in primer degredation,effectively lowering the concentration of primer solutions. Low primer con-centration will result in late amplification or nonamplificaion of targetsequences, making quantification difficult or impossible. In our hands, newlysynthesized primers will amplify effectively at a working concentration of0.5 μM. However, because 200 μM primer stocks stored at –20°C in a frostyfreezer will degrade after as little as one month, we now routinely use 10 μM asour working concentration. To guard against primer degradation, aliquotconcentrated primers (200 μM) and store at –70°C. Thaw only enough aliquotsfor use in one or two experiments. For long-term storage, lyphilize aliquotsand store at –70°C.
3.3.3. Optimization of Primer Sets
Each primer set must be optimized prior to use for quantification. In gen-eral, varying the MgCl2 concentration and the annealing temperature will resultin clean product formation devoid of primer dimers. Other optimization effortsmay be required, however.
1. Use cDNA templates to optimize primer sets. Titrate MgCl2 concentrationbetween 3–7 mM (Table 4). In our experience, the most common optimal MgCl2
Table 3Specifications for ASNS Primers Developed Using Oligo 5.0 Software
Length (bp) Tm (°C) GC content (%)
Product 203 81.2 39.9Forward primer 20 68.4 50.0Reverse primer 20 68.9 50.0
Table 4Titration of MgCl2 to Optimize Primer Sets
Final Concentration
3 mM 4 mM 5 mM 6 mM 7 mM 8 mM 9 mM
50 mM MgCl2 (μL) 1.2 1.6 2 2.4 2.8 3.2 3.6water (μL) 12.5 12.1 11.7 11.3 10.9 10.5 10.1
Using a 50 mM stock of MgCl2, the final concentration of MgCl2 in the 20 μL QPCR can bevaried until an optimal concentration is achieved. The MgCl2 titration described here was used inconjunction with the Master Mixture described in Subheading 3.4.1. by varying the amount ofwater and MgCl2.

Real-Time QPCR Using SYBR® Green I 81
81
Fig
. 1. A
naly
sis
of Q
PC
R p
rodu
cts
by th
erm
al d
enat
urat
ion
prod
ucin
g a
mel
ting
cur
ve. (
A)
Mel
ting
cur
ve f
or A
SNS
prim
er s
etw
ith
a cl
ear
shar
p pe
ak a
t 78.
34°C
, dev
oid
of p
rim
er d
imer
s. T
his
indi
cate
s th
at th
e pr
imer
set
has
bee
n pr
oper
ly o
ptim
ized
. A T
m
of 8
1.2 °
C w
as p
redi
cted
by
the
prim
er d
esig
n so
ftw
are
for
the
ASN
Spr
oduc
t ( T
able
3).
(B
) M
elti
ng c
urve
of
a pr
imer
set
for
anot
her
gene
rev
eali
ng th
e pr
esen
ce o
f pr
imer
dim
ers,
wit
h at
leas
t tw
o se
para
te p
rodu
cts
mel
ting
at 8
0.30°C
and
90.
28°C
, res
pec-
tive
ly. F
urth
er o
ptim
izat
ion
of th
is p
rim
er s
et w
ould
be
requ
ired
bef
ore
it c
ould
be
used
for
qua
ntit
atio
n.

82 Stagliano et al.
concentration is 4 mM, although some primer sets may require as much as 9 mM(Table 4). For all three primer sets, ASNS, GAPDH, and BMV, 4 mM was theoptimal MgCl2 concentration.
2. Ascertain the annealing temperature for each primer set using a touchdown pro-gram. During a touchdown program, the annealing temperature is progressivelylowered by 1°C after the passage of 10 cycles (Table 5). At some point, thepermissive temperature for the primer set will be reached, and amplification ofthe product will begin. This allows for the determination of the highest annealingtemperature for the primer set and prevents the accumulation of nonspecific prod-uct and primer dimers. The annealing temperatures selected for the primer setsqueried were: ASNS, 60°C; GAPDH, 55°C; and BMV, 54°C.
Table 5Touchdown Program Used to Determine Highest AnnealingTemperature Between 65°C and 59°C
Step Temperature (°C) Time (s)
Cycles 1–10 denature 95 15anneal 65 20elongate 72 11
Cycles 11–20 denature 95 15anneal 64 20elongate 72 11
Cycles 21–30 denature 95 15anneal 63 20elongate 72 11
Cycles 31–40 denature 95 15anneal 62 20elongate 72 11
Cycles 41–50 denature 95 15anneal 61 20elongate 72 11
Cycles 51–60 denature 95 15anneal 60 20elongate 72 11
Cycles 61–70 denature 95 15anneal 59 20elongate 72 11
This program can be easily altered to query higher or lower ranges for opti-mal annealing temperatures. For the BMV and GAPDH primer set, tempera-tures between 58°C and 50°C were also investigated.

Real-Time QPCR Using SYBR® Green I 83
3. If primer dimers still persist, reducing annealing time may prove helpful. Forexample, with GC-rich target sequences, which we have found to be the mostproblematic to optimize, reducing annealing time to 0 s usually prevents dimerformation.
4. Using a “hot start” method may also cut down nonspecific product formation.Commercial anti-Taq DNA polymerase antibodies are available, which are eas-ily added to almost any PCR. After incubation with the antibody, polymeraseactivity is prevented until the temperature rises above 70°C, thus ensuring a hotstart and cutting down on the formation of primer dimers. We regularly use Plati-num Taq DNA polymerase in our QPCR preparations, which contains thermo-labile monoclonal antibodies to Taq DNA polymerase and ensures an automatichot start.
5. After attempts to optimize primers, verify specific product formation by deter-mining product Tm, using a melting curve (Fig. 1A). During a melting curveprogram, the temperature is increased in a linear fashion, while fluorescence ismonitored constantly. At the product’s Tm, fluorescence levels rapidly decreaseas the product denatures. The determined Tm can be compared to the theoreticalTm calculated during primer design. Variation between theoretical and actual Tm
can vary as much as +/– 3°C. Products with Tm more divergent than +/– 3°C aresuspect and may be the result nonspecific product formation.
6. Check products by agarose gel electrophoresis to verify product length. Saveproducts from optimized primer sets for the construction of standard curves (Sub-heading 3.2.3.). Product identity can also be verified by sequencing.
3.3.4. Construction of Standard Curves by Serial Dilution
Relative quantitation relies on the construction of an arbitrary standard curvefor each primer set (Fig. 2). The points of the standard curve can be arbitrarilydesignated as 10–1, 10–2, 10–3, etc. Once saved using the LightCycler software,standard curves can be imported and reused in analysis of subsequent QPCRs.
1. Save QPCR products generated during the optimization of each primer set.2. Serially dilute products up to 1:1 × 10⁸. In our hands, dilutions from 1:103 through
1:108 usually generate a robust standard curve.3. Use the product dilutions as target sequences under the optimal conditions deter-
mined during primer optimization. At this step, it is vital to label the points of thestandard curve and designate them as “standard curve” using the LightCyclerprogram. Details about navigating the software are found in the LightCyclerOperator’s Manual (10).
4. Freeze the optimized PCR product and at least one standard from the standardcurve for later use. In order for the electronically saved standard curve to beimported and used for later analysis, at least one of the points of the standardcurve must be physically rerun in subsequent QPCRs, in which the specific stan-dard curve is desired.

84 Stagliano et al.
84
Fig
. 2. G
ener
atio
n of
a s
tand
ard
curv
e fo
r A
SNS
prim
er s
et. T
he A
SNS
prod
uct p
rodu
ced
duri
ng th
e op
tim
izat
ion
of th
e A
SNS
prim
er s
et w
as r
etai
ned
and
seri
ally
dil
uted
. Dil
utio
ns b
etw
een
1 ×
10–3
and
1 ×
10–7
subs
eque
ntly
und
erw
ent Q
PC
R a
mpl
ific
atio
nus
ing
the
ASN
Spr
imer
s, g
ener
atin
g a
rela
tive
sta
ndar
d cu
rve.
The
sta
ndar
d cu
rve
is r
elat
ive
(arb
itra
ry),
rat
her
than
abs
olut
e,be
caus
e th
e ex
act c
opy
num
ber
of th
e st
arti
ng te
mpl
ate
is n
ot k
now
n. R
elat
ive
conc
entr
atio
n of
eac
h po
int o
f th
e st
anda
rd c
urve
isre
late
d to
the
cro
ssin
g po
int
valu
e (C
T),
whi
ch c
orre
spon
ds t
o th
e cy
cle
at w
hich
the
pro
duct
’s l
ogar
ithm
ic a
ccum
ulat
ion
can
bedi
stin
guis
hed
abov
e ba
ckgr
ound
noi
se.
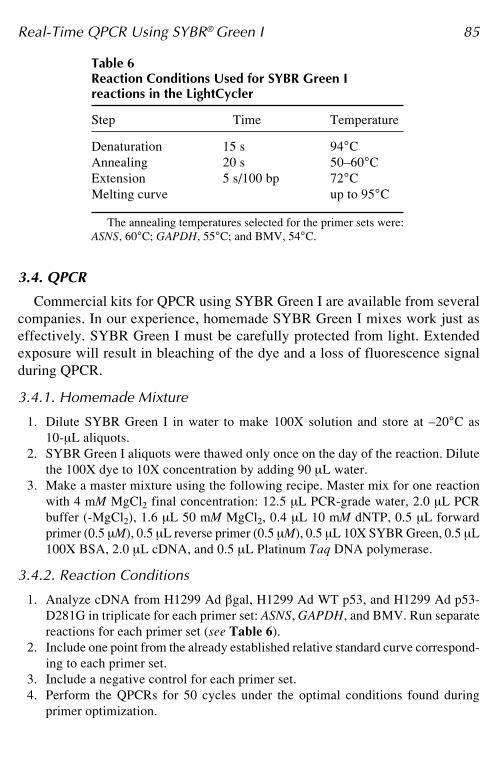
Real-Time QPCR Using SYBR® Green I 85
3.4. QPCR
Commercial kits for QPCR using SYBR Green I are available from severalcompanies. In our experience, homemade SYBR Green I mixes work just aseffectively. SYBR Green I must be carefully protected from light. Extendedexposure will result in bleaching of the dye and a loss of fluorescence signalduring QPCR.
3.4.1. Homemade Mixture
1. Dilute SYBR Green I in water to make 100X solution and store at –20°C as10-μL aliquots.
2. SYBR Green I aliquots were thawed only once on the day of the reaction. Dilutethe 100X dye to 10X concentration by adding 90 μL water.
3. Make a master mixture using the following recipe. Master mix for one reactionwith 4 mM MgCl2 final concentration: 12.5 μL PCR-grade water, 2.0 μL PCRbuffer (-MgCl2), 1.6 μL 50 mM MgCl2, 0.4 μL 10 mM dNTP, 0.5 μL forwardprimer (0.5 μM), 0.5 μL reverse primer (0.5 μM), 0.5 μL 10X SYBR Green, 0.5 μL100X BSA, 2.0 μL cDNA, and 0.5 μL Platinum Taq DNA polymerase.
3.4.2. Reaction Conditions
1. Analyze cDNA from H1299 Ad gal, H1299 Ad WT p53, and H1299 Ad p53-D281G in triplicate for each primer set: ASNS, GAPDH, and BMV. Run separatereactions for each primer set (see Table 6).
2. Include one point from the already established relative standard curve correspond-ing to each primer set.
3. Include a negative control for each primer set.4. Perform the QPCRs for 50 cycles under the optimal conditions found during
primer optimization.
Table 6Reaction Conditions Used for SYBR Green Ireactions in the LightCycler
Step Time Temperature
Denaturation 15 s 94°CAnnealing 20 s 50–60°CExtension 5 s/100 bp 72°CMelting curve up to 95°C
The annealing temperatures selected for the primer sets were:ASNS, 60°C; GAPDH, 55°C; and BMV, 54°C.

86 Stagliano et al.
3.4.3. Verification of Product by Melting Curve Analysis and AgaroseGel Electrophoresis
1. After completion of each QPCR run, perform melting curve analysis to verifyformation of only one specific product.
2. Recover the PCR product by inverting the capillaries in microcentrifuge tubesand pulsing in a microcentrifuge.
3. Analyze products using standard agarose gel electrophoresis techniques to verifycorrect product size.
3.5. Interpreting QPCR Data
After importing the electronically saved relative standard curve unique toeach primer set, use the LightCycler software to determine the relationship ofthe samples relative to the standard curve. Repeat this procedure for eachprimer set. Table 7 demonstrates interpretation of QPCR data to determineASNS gene expression normalized to BMV.
Use the equation to the line obtained from the ASNS standard curve (y =–4.938 × +1.877) (Fig. 2B) to quantitate the relative amounts of ASNS cDNAby linear extrapolation of the CT values. The LightCycler software automati-cally performs this extrapolation after designation of a standard curve. Like-wise, determine the relative amounts of BMV by linear extrapolation, usingthe equation to the line obtained from the BMV standard curve (curve notshown). Divide the average relative concentration of ASNS in each sample bythe average relative concentration of BMV in the same sample, thus normaliz-ing the amount of ASNS. The normalized amount of ASNS, (ASNSN), is aunitless number that represents the relative amount of mRNA in the samples.In order to simplify interpretation of the results, the control sample H1299 galwas considered to express a baseline level of ASNS, and its expression of ASNSwas designated as “1”. All other expression values are understood relative tothis control sample. Divide each normalized value by the Ad gal normalizedvalue. Values generating decimals were expressed as negative numbers bydividing –1 by the decimal. Following this convention in Table 7, the relativeexpression of ASNS in Ad WT p53 is presented as –2.2 instead of 0.464. H1299Ad p53 was found to express ASNS 2.2-fold less than H1299 Ad gal, andH1299 Ad p53-D281G expressed ASNS 18.3-fold more than H1299 Ad gal.
4. Notes1. Choosing GAPDH as the housekeeping gene of reference. Suzuki et al. (2000)
reviewed the pitfalls of relying on GAPDH as a housekeeping gene (11). GAPDHlevels have been seen to vary in certain cellular conditions, e.g., heat shock, hy-poxia, high levels of glucose or insulin, and exposure to UV light (11). Somestudies have indicated that GAPDH regulation is dependent on the cell cycle (11).Elevated GAPDH transcript levels have been observed in breast carcinoma cell

Real-Time QPCR Using SYBR® Green I 87
87
Tabl
e 7
ASN
A G
ene
Expr
essi
on N
orm
aliz
ed t
o B
MV
, Rel
ativ
e to
H12
99 A
d ga
l
ASN
SB
MV
ASN
S N
H12
99 S
ampl
eC
TR
elat
ive
conc
entr
atio
nC
TR
elat
ive
conc
entr
atio
nN
orm
aliz
ed to
BM
VR
elat
ive
to A
d ga
l
Ad
gal
43.2
22.
484E
-09
30.9
59.
109E
-06
43.4
72.
203E
-09
29.9
81.
401E
-05
1.78
5E-0
41.
043
.54
2.21
5E-0
929
.74
1.55
4E-0
5av
erag
e2.
301E
-09
1.28
9E-0
5
Ad
WT
p53
44.7
21.
210E
-09
29.9
1.45
2E-0
544
.33
1.45
9E-0
929
.64
1.62
8E-0
58.
300E
-05
–2.2
44.8
21.
154E
-09
29.7
81.
526E
-05
aver
age
1.27
4E-0
91.
535E
-05
Ad
p53-
D28
1G37
.94
3.09
0E-0
830
.93
9.16
7E-0
637
.70
3.46
9E-0
830
.61
1.05
7E-0
53.
269E
-03
18.3
37.7
93.
328E
-08
30.6
31.
051E
-05
aver
age
3.29
6E-0
81.
008E
-05
Inte
rpre
tati
on o
f QP
CR
dat
a by
nor
mal
izat
ion
to B
MV
and
exp
ress
ed re
lati
ve to
the
cont
rol s
ampl
e, H
1299
Ad
gal,
allo
ws
rela
tive
qua
ntit
atio
nof
ASN
S ge
ne e
xpre
ssio
n le
vels
. ASN
S w
as u
p-re
gula
ted
in th
e pr
esen
ce o
f m
utan
t p53
-281
G a
nd d
own-
regu
late
d in
the
pres
ence
of
WT
p53
.

88 Stagliano et al.
88
Tabl
e 8
Nor
mal
izat
ion
of A
SNS
Expr
essi
on t
o G
APD
H
ASN
SG
AP
DH
ASN
S N
H12
99 S
ampl
eC
TR
elat
ive
conc
entr
atio
nC
TR
elat
ive
conc
entr
atio
nN
orm
aliz
ed to
GA
PD
HR
elat
ive
to A
d ga
l
Ad
gal
43.2
22.
484E
-09
36.6
32.
931E
-07
43.4
72.
203E
-09
37.2
82.
130E
-07
8.97
9E-0
31.
043
.54
2.21
5E-0
936
.85
2.62
6E-0
7av
erag
e2.
301E
-09
2.56
2E-0
7
Ad
WT
p53
44.7
21.
210E
-09
35.7
24.
593E
-07
44.3
31.
459E
-09
36.1
63.
698E
-07
2.80
4E-0
3–3
.344
.82
1.15
4E-0
935
.14
5.34
1E-0
7av
erag
e1.
274E
-09
4.54
4E-0
7
Ad
p53-
D28
1G37
.94
3.09
0E-0
834
.53
8.22
1E-0
737
.70
3.46
9E-0
833
.93
1.11
0E-0
63.
333E
-02
3.7
37.7
93.
328E
-08
34.0
71.
034E
-06
aver
age
3.29
6E-0
89.
887E
-07
Nor
mal
izat
ion
of A
SNS
expr
essi
on d
ata
rela
tive
to
GA
PD
Hdi
d al
ter
the
rela
tive
exp
ress
ion
leve
ls o
f A
SNS.
How
ever
, th
e sa
me
tren
d w
asm
aint
aine
d, w
ith
ASN
S do
wn-
regu
late
d by
WT
53
and
up-r
egul
ated
by
mut
ant p
53-D
281G
.

Real-Time QPCR Using SYBR® Green I 89
lines, mouse cell lines, and hepatocellular carcinoma tissues (11). GAPDH hasbeen implicated in a wide-range of activities, some of which are independent ofits role in glycolysis, including endocytosis, translational control, nuclear tRNAexport, DNA replication, DNA repair, and apoptosis (11). Evidence indicatesthat GAPDH is involved in apoptosis of non-neuronal and neuronal cells (12).Furthermore, GAPDH seems to be up-regulated by p53 during neuronal apoptosis(13). In light of this information, the choice of GAPDH as a housekeeping geneshould be considered cautiously, especially in studies involving p53. Other house-keeping genes, such as -actin, 18S or 28S rRNA, should also be considered care-fully, because they have their own drawbacks (11). We reanalyzed our QPCRdata by normalizing expression of ASNS to the expression of GAPDH (Table 8).The relative expression levels of ASNS did change compared to normalizationwith BMV (Table 7), although the overall pattern still persisted with ASNS down-regulated by wild-type p53 and up-regulated by mutant p53-D281G.
2. Non-normalized gene expression. An alternative to normalizing gene expression,to either a housekeeping gene or to an exogenously applied nucleic acid sequencesuch as BMV RNA, is to analyze data without normalization (Table 9). Assum-ing that RNA amounts used for cDNA synthesis were equal between all samples(i.e., H1299 Ad gal, H1299 Ad WT p53, and H1299 Ad p53-D281G) andassuming that cDNA synthesis efficiency was equal in all samples, there is no
Table 9Non-normalized ASNS Gene Expression
ASNS ASNSN
H1299 Sample CT Relative concentration Relative to Ad gal
Ad gal 43.22 2.484E-0943.47 2.203E-09 1.043.54 2.215E-09
average 2.301E-09
Ad WT p53 44.72 1.210E-0944.33 1.459E-09 –1.744.82 1.154E-09
average 1.274E-09
Ad p53-D281G 37.94 3.090E-0837.70 3.469E-08 14.337.79 3.328E-08
average 3.296E-08
Analysis of the data relative to the H1299 Ad gal control, but without normalization to ahousekeeping gene or other standard, still maintained the trend of WT p53 down-regulating ASNS,and mutant p53-D281G up-regulating its expression.

90 Stagliano et al.
need to normalize ASNS expression. Our main concern using this method ofanalysis is the assumption that cDNA synthesis efficiency is equal. The presenceof salts or other “minor” contaminants can easily disrupt the efficiency of thereverse transcriptase enzyme. Without a reference, such as a housekeeping gene,or a quality control standard, such as BMV RNA, there is no way to compensatefor variations in cDNA synthesis efficiency and/or variation in total RNA con-centration between samples. In order to have confidence in such data, it would benecessary to repeat the entire experiment (e.g., starting from adenoviral infec-tion) a number of times.
3. Use of an exogenous quality control RNA: BMV. The use of BMV as a referenceRNA to monitor cDNA efficiency rests on two points. First, the amount of RNAbetween samples, H1299 Ad gal, H1299 Ad WT p53, and H1299 Ad p53-D281G, must be equal. The use of the ultrasensitive RiboGreen quantitationmethod to quantify total RNA prior to cDNA synthesis allows us to feel confi-dent on this issue. Second, we must ensure that we are spiking the RNA sampleswith equal amounts of BMV prior to cDNA synthesis. This is a very seriouspoint; pipeting error at this stage could very easily skew further data generatedfrom subsequent QPCR analysis. To lessen the risk of pipeting error, we pipetBMV RNA in vol >6 μL. Additionally, multiple independent cDNA preparations(at least three) individually spiked with BMV RNA are used to repeat the analy-ses. Consistent results between preparations is our standard for successfulquantitation of gene expression by QPCR.
4. Further QPCR applications. QPCR has the potential for a broad range of applica-tions including mutation detection, absolute quantitation, and detection of tran-scriptional splice variants. More extensive coverage of theory, applications, andanalysis of data is available (14).
AcknowledgmentsThe work presented here was supported by grants from the National Insti-
tutes of Health (NIH) to Sumitra Deb (CA70712) and to Swati Palit Deb(CA74172). Special thanks to the W. C. Broaddus laboratory for the use oftheir FLUOstar (BMG LabTechnologies).
References1. Deb, D., Scian, M., Roth, K. E., et al. (2002) Hetero-oligomerization does not com-
promise ‘gain of function’ of tumor-derived p53 mutants. Oncogene 21, 176–189.2. Kannan, K., Amariglio, N., Rechavi, G., et al. (2001) DNA mircoarrays identifi-
cation of primary and secondary target genes regulated by p53. Oncogene 20,2225–2234.
3. Wang, L., Wu, Q., Qiu, P., et al. (2001) Analyses of p53 target genes in thehuman genome by bioinformatic and microarray approaches. J. Biol. Chem. 276,43,604–43,610.
4. Yu, J., Zhang, L., Hwang, P. M., Rago, C., Kinzler, K. W., and Vogelstein, B.(1999) Identification and classification of p53-regulated genes. Proc. Natl. Acad.Sci. USA 96, 14,517–14,522.

Real-Time QPCR Using SYBR® Green I 91
5. Rajeevan, M., Vernon, S., Taysavang, N., and Unger, E. (2001) Validation ofarray-based gene expression profiles by real-time (kinetic) RT-PCR. J. Mol.Diagn. 3, 26–31.
6. Wittwer ,C., Hermann, M., Moss, A., and Rasmussen, P. (1997) Continuous fluores-cence monitoring of rapid cycle DNA amplification. BioTechniques 22, 130–138.
7. Sambrook, J. and Russell, D. W. (2001) Molecular Cloning: A LaboratoryManual, 3rd ed. CSH Laboratory Press, Cold Spring Harbor, New York.
8. Lewohl, J. M., Wang, L., Miles, M. F., Zhang, L., Dodd, P. R., and Harris, R. A.(2000) Gene expression in human alcoholism: microarray analysis of frontal cor-tex. Alcohol Clin. Exp. Res. 24, 1873–1882.
9. Thibault, C., Lai, C., Wilke, N., et al (2000) Expression profiling of neural cellsreveals specific patterns of ethanol-responsive gene expression. Mol. Pharmacol.58, 1593–1600.
10. Roche Molecular Biochemicals (1990) LightCycler Operator’s Manual, Version3.0. Roche Molecular Biochemicals, Mannheim.
11. Suzuki, T., Higgins, P. J., and Crawford, D. R. (2000) Control Selection for RNAQuantitation. BioTechniques 29, 332–337.
12. Sawa, A., Khan, A., Hester, L. D., and Snyder, S. H. (1997) Glyceraldehyde-3-phosphate dehydrogenase: nuclear translocation participates in neuronal andnonneuronal cell death. Proc. Natl. Acad. Sci. USA 94, 11,669–11,674.
13. Chen, R., Saunders, P. A., Wei, H., Li, Z., Seth, P., and Chuang, D. (1999)Involvement of glyceraldehyde-3-phosphate dehydrogenase (GAPDH) and p53in neuronal apoptosis: evidence that GAPDH is upregulated by p53. J. Neurosci.19, 9654–9662.
14. Meuer, S., Wittwer, C., and Nakagawara, K. (eds) (2001) Rapid Cycle Real-TimePCR: Methods and Applications. Springer, Berlin.

Transactivation and Transrepression Studies 93
93
From: Methods in Molecular Biology, vol. 234: p53 ProtocolsEdited by: S. Deb and S. P. Deb © Humana Press Inc., Totowa, NJ
7
Transactivation and Transrepression Studies with p53
Mariano J. Scian, Rebecca Frum, Swati Palit Deb, and Sumitra Deb
SummaryThe methods outlined in this chapter are designed to facilitate the study of the transactivation
and transrepression properties of p53 (as well as p63 and p73). Once a gene of interest is iden-tified, its presumptive promoter region can be cloned upstream of a luciferase gene in a plas-mid. The most common reason for transfection experiments is to study gene expression patternsin the presence or absence of a particular gene product (e.g., p53). Three methods of transfec-tion are outlined in this chapter: (i) cationic lipofection; (ii) calcium phosphate precipitation;and (iii) BES precipitation. The first method is ideal for the study of transactivation andtransrepression properties of p53 (or other transcription factors). The last two are more suitedfor experiments where larger numbers of transfected cells are needed. Several examples oftransfections and their respective results are provided.
Key Wordsp53, promoter studies, transactivation, transrepression and transfection methods
1. IntroductionThe p53 gene is located on chromosome 17p and encodes an oligomeric
393-amino acid nuclear phosphoprotein that acts as a tumor suppressor. Wild-type (WT) p53 acts as a sequence-specific DNA-binding protein and transcrip-tional activator as well as a transcriptional repressor (reviewed in refs. 1–5).The consensus DNA-binding site contains two copies of the 10-bp motif 5'-PuPuPuCWWGPyPyPy-3', which can be separated from 0–13 bp (6).
Elevated levels of WT p53 can lead to apoptosis in certain cell types orinduce cell cycle arrest in G1 or G2 (1–5). WT p53 levels increase in responseto cellular stress situations, such as DNA damage. The elevated level of p53induces expression of genes that are involved in various aspects of cellulargrowth regulation. These target genes of WT p53 are systematically being iden-tified using various methods, such as serial analysis of gene expression, differ-

94 Scian et al.
ential display, subtractive hybridization, and gene array (or oligonucleotidearray) analysis (7,8). WT p53 has also been shown to repress transcriptionfrom a number of cellular genes (9–15).
Two homologues of p53 have been identified in recent years: p63 and p73.Both p73 and p63 have structural and functional similarity with p53, althoughp63 and p73 are more similar to each other than to p53 (16,17). Severalisoforms have been identified for these family members; these vary in theirN- or C-terminal regions. Splice variants have been demonstrated for p73, suchas p73 , - , - , - , with p73- and p73- being the most prominent forms.Similar splice variants have been identified for p63 (16,18–20). p73 has beenshown to transactivate promoters with p53-binding sites (21,22). Therefore,transactivation studies can also be conducted with p73 or p63 individually orin comparison to p53.
Once a gene of interest is identified, its presumptive promoter region can becloned upstream of a luciferase gene in a plasmid. After cloning or identifyinga p53 (p73 or p63) target gene, many researchers wish to analyze the character-istics of the particular promoter by reintroducing into cells. The most commonreason for transfection is to study gene expression in the presence or absenceof a particular gene product (e.g., p53). Therefore, selection of a cell line tobe transfected is critical. When studying p53, it is important to select a cell linewith the p53 genotype of choice. In our laboratory, to avoid any effects fromendogenous p53, we routinely use Saos-2 cells, which do not express p53 (23).Saos-2 osteosarcoma cells are easily transfectable by any of the methods out-lined below. However, other cell lines may vary in their susceptibility to trans-fection, and it may be necessary to optimize the protocols outlined below tosuit the cell line.
2. Materials2.1. Cationic Lipofection Method
1. Transfection carrier vector (e.g., pCMV-Bam) (24) with p53 (WT or mutant)cDNA insert.
2. Luciferase reporter vector (e.g., pGL3 or pGL2 from Promega [Madison, WI,USA]) with desired promoter insert.
3. LIPOFECTAMINE 2000 (Invitrogen, Carlsbad, CA, USA).4. Opti-MEM™ I media (Invitrogen).5. 24-well plates.6. A transfectable p53-null cell line (e.g., Saos-2) (23).
2.2. Whole Cell Lysate Preparation
1. 5X Reporter lysis buffer (Promega).2. Phosphate-buffered saline solution.

Transactivation and Transrepression Studies 95
2.3. Calcium Phosphate Transfection Method
It is important to measure the amounts of each component and vol of eachsolution as accurately as possible.
1. 2X (N-[2-hydroxyethyl]piperazine-N’-[2-ethanesulfonic acid]) (HEPES)-buff-ered solution (HEBS): 250 mM NaCl, 10 mM KCl, 10 mM dextrose, 40 mMHEPES. Make 100 mL of the solution. First dissolve the components in 95 mL ofwater, then adjust the pH to 7.08 using one drop of 10 N NaOH and then with 0.1N NaOH. When the desired pH is reached, complete the vol to 100 mL. Filter-sterilize using a 0.2-μm filter under sterile conditions and store the solution at4°C.
2. 2 M CaCl2 solution (100 mL). Filter-sterilize as described above and store thesolution at –20°C.
3. 100X PO4 (50 mL): 120 mM Na2HPO4. Filter-sterilize as described above andstore the solution at 4°C.
2.4. -Galactosidase Assay
1. 2X -Galactosidase assay buffer: 200 mM sodium phosphate, pH 7.3, 2 mMMgCl2, 100 mM -mercaptoethanol, 1.33 g/mL O-nitrophenyl-b- -galactopyra-nosidase (ONPG). This solution can be made in quantity, aliquoted, and stored at–20°C for future use.
2. 500 mM Na2CO3.
2.5. BES Transfection Method
As with the solutions used in the calcium phosphate precipitation method, itis important to measure the amounts and vol as accurately as possible.
1. 2X (N,N-bis[2-hydroxyethyl]-2-aminoethanesulfonic acid])(BES) solution:50 mM BES, 280 mM NaCl, 1.5 mM Na2HPO4. Bring the vol to 100 mL usingsterile water, adjusting the pH to 6.95 using 0.1 N NaOH. Filter-sterilize the solu-tion with a 0.2-μm filter under sterile conditions; make aliquots of 1 mL andstore at –20°C. It is important to not freeze-thaw the BES solution repeatedly, asthis will decrease the effectiveness of the solution.
2. 2.5 M CaCl2 solution. Bring the vol to 100 mL and make a few aliquots of 1 mL.Filter-sterilize with a 0.2-μm filter under sterile conditions, and store at –20°C.
3. 0.5 mM kynureate solution (optional). Filter-sterilize and store the solution at 4°C.
3. Methods
The methods outlined below describe three different protocols of transfec-tion. The cationic lipofection method can primarily be used for the study oftransactivation and transrepression properties, while the latter two are also usedfor studies where larger numbers of transfected cells are necessary (e.g., cellcycle profiling).

96 Scian et al.
3.1. Cationic Lipofection Method
The following protocol is designed to transfect cells growing in 24-wellplates. If larger wells or plates are to be transfected, adjust the vol to be usedaccordingly (see Table 1).
1. Twenty-four hours prior to transfection, plate cells in a manner so that they are90–100% confluent the day of transfection. For example, for Saos-2 cells, approx2.5 × 105 cells in a vol of 500 μL per well must be plated when usingLIPOFECTAMINE 2000.Note: other cell lines may require different starting plating conditions. For refer-ence, refer to the product sheet provided with the transfection reagent, themanufacturer’s Web site, or technical support. If the cell line of choice is notlisted, it will be up to the researchers to choose the starting cell amounts andoptimization (see Note 1).
2. For convenience during transfection, dilute all the DNAs to be used so that thefinal concentration is 100 ng/μL. This dilution can be done using either sterilewater or Opti-MEM I. Other DNA concentrations can also be used.
3. The day of transfection, prior to starting the transfection procedure, replace themedia in the wells with freshly prepared complete media. Opti-MEM I or mediawithout serum can be used instead. In such a case, remove the media withoutserum or Opti-MEM I 4–8 h after transfection and replace it with complete media.
4. Take out one 1.5-mL Eppendorf® tube per well to be transfected and labelaccordingly.
5. Dilute the DNA so that the final concentration does not exceed 1 μg/50 μL. In theexamples below, all DNAs used are diluted to a concentration of 100 ng/μL.Since the total amount of DNA used is 1 μg, 40 μL of Opti-MEM I must be addedto each Eppendorf tube to make up the vol to 50 μL.
6. In a 50-mL Falcon® tube, dilute the LIPOFECTAMINE 2000 by adding 2 μL ofLIPOFECTAMINE 2000 into 48 μL of Opti-MEM I per well to be transfected. Forexample, when transfecting 24 wells, add 48 μL of LIPOFECTAMINE 2000 in1152 μL of Opti-MEM I. Other cationic lipofection agents may require differentdilutions. See the manufacturer’s recommendations for such cases.
7. Vortex mix gently and incubate the LIPOFECTAMINE 2000 dilution for 3 min atroom temperature.
8. At the end of the incubation period, add 50 μL of the diluted LIPOFECTAMINE2000 solution to each of the DNA-containing Eppendorf tubes. The total vol pertube now should be 100 μL.
9. Spin down the tubes, vortex mix slowly, and incubate the mixture for 15 min toallow the LIPOFECTAMINE-DNA complexes to form. Do not vortex mix the tubesafter the incubation period is finished. This will break apart the LIPOFECTAMINE-DNA complexes, decreasing the effectiveness of the transfection.
10. After incubation, add the contents of each Eppendorf tube drop-wise to theappropriate well. Mix the contents of the well by gently shaking or rocking theplate after each addition.

Transactivation and Transrepression Studies 97
97
Tabl
e 1
Con
vers
ion
Tabl
e
Rel
ativ
e su
rfac
e ar
eaP
lati
ngD
NA
dil
utio
nL
F20
00 d
ilut
ion
Typ
e of
pla
te(c
ompa
red
to 2
4-w
ell p
late
)vo
lvo
lvo
l
96-W
ell p
late
0.2
100μ
L25
μL
25μ
L24
-Wel
l pla
te1
500 μ
L50
μL
50μ
L12
-Wel
l pla
te2
1.0
mL
100 μ
L10
0μ
L35
-mm
Pla
te4
2.0
mL
200 μ
L20
0μ
L6-
wel
l pla
te5
2.5
mL
250 μ
L25
0μ
L60
-mm
Pla
te10
5.0
mL
500 μ
L50
0μ
L10
0-m
m P
late
2814
.0 m
L1.
4 m
L1.
4 m
L
Vol
are
per
wel
l or
plat
e to
be
tran
sfec
ted.
Not
e:th
e in
form
atio
n on
thi
s ta
ble
was
ada
pted
fro
m t
he L
IPO
FE
CTA
MIN
E 2
000
data
she
et.
If u
sing
oth
er c
atio
nic
lipo
fect
ion
reag
ents
, ple
ase
refe
r to
dat
a sh
eet p
rovi
ded
wit
h th
e pr
oduc
t.

98 Scian et al.
11. Grow the cells for 24–48 h before harvesting, depending on the cell line trans-fected. It is recommended to check the cells 24 h after transfection, since differ-ent cell lines react differently to the cationic lipofection. If the cells have beennoticeably affected by the transfection and appear to be dying, harvesting thecells after 24 h may be necessary (see Notes 2–6).
3.2. Preparation of Cell Lysates
Please note that the following protocol is for preparing cell lysates aftertransfection of cells growing in 24-well plates. When larger wells or plates areused, adjust the vol accordingly using the vol provided in Table 1.
1. Dilute the 5X Reporter lysis buffer to a 1X concentration using sterile water.2. Aspirate the media from the wells.3. Wash the cells with 300 μL of phosphate-buffered saline solution 2X.4. Add 100 μL of 1X Reporter lysis buffer to each well and incubate for 5 min at
room temperature.5. Scrape the cells from the wells using a rubber policeman or similar device.6. Transfer the lysis buffer and cells to a 1.5-mL Eppendorf tube. Keep the
Eppendorf tubes on ice from this point on.7. Pipet up and down to mix the contents of the tube and aid in the lysis of the cells.
Freeze-thawing once or twice can be done to increase the protein extraction.Quick-freezing the cell lysates in a dry ice–ethanol bath and thawing them inroom temperature water can accomplish this.
8. Once all wells have been harvested, spin the whole cell lysate at 8000–10,000 rcffor 2–5 min at 4°C.
9. Transfer the supernatant to a new tube and discard the pellet.10. Determine the protein concentration of each cell lysate using Protein Assay
Reagent (Bio-Rad, Hercules, CA, USA) or your method of choice. Normalize theamounts of protein in each extract and perform the luciferase assay.
3.3. Calcium Phosphate Precipitation Method
1. Prepare and test the solutions needed for this method prior to use. A “test”transfection using a -galactosidase containing plasmid and performing thesubsequent -galactosidase assay (see Subheading 3.4.) should suffice (seeNotes 7–9).
2. Twenty-four hours prior to transfection, plate the cells at a density of 6 × 10⁶
cells/10-cm plate. The plating cell density may need to be changed depending onthe cell line used.
3. The following day, prior to beginning the transfection procedures, allow the trans-fection solutions to reach room temperature.
4. Two hours before adding the precipitation solution to the plate, remove the mediafrom the plate, and replace it with 9.0 mL of Dulbecco’s modified Eagle medium(DMEM) containing the normal serum needed for the cell line.

Transactivation and Transrepression Studies 99
5. For every plate to be transfected, take out and label appropriately two 1.5-mLEppendorf tubes, one for the DNA and one for the HEBS/PO4 solution.
6. In a 50-mL Falcon tube, mix 100 μL of the 100X PO4 solution for every 9.9 mL ofthe HEBS solution prepared earlier to generate the working HEPES/PO4 solution.
7. Add 500 μL of the working HEBS/PO4 mixture to the first set of Eppendorf tubes.8. To the second set of Eppendorf tubes, add the appropriate amount of DNA (nor-
mally up to 10 μg), and make up the vol to 437.5 μL with sterile water.9. Immediately prior to the subsequent bubbling step, add 62.5 μL of the 2 M CaCl2
solution to the DNA tubes.10. Vortex mix gently, and spin down these tubes.11. Using a pipet-aid, set up a “bubbling apparatus.” Clamp the pipet-aid to a vertical
stand, and tape the blowout button, so that when the tip of a 1-mL pipet is sub-merged into a liquid medium, it produces a slow steady stream of bubbles. Thismay take several attempts. The bubbling step is very important to the outcome ofthe transfection. We have found that a speed of 20 bubbles/10 s gives the bestresults.
12. Add the DNA solution drop-wise to the Eppendorf containing the HEBS/PO4
solution while bubbling from the bottom of the Eppendorf tube using a 1-mLpipet. A fine precipitate will form. Use a new 1-mL sterile pipet for each addition.
13. Let the mixed solutions incubate for 30 min in an undisturbed space.14. After incubating the DNA with the HEBS/PO4, gently mix, and add the contents
(1 mL per plate) of the tubes drop-wise to the appropriate plate. Place the platesat 37°C, being careful not to disturb the precipitate, as this will decrease theefficiency of the transfection.
15. The following day, remove the media, and wash the precipitate from the plates2X using Hank’s balanced salt solution (HBSS). Add fresh complete media tothe plates and return the plates to the incubator.
16. Collect the cells 24 h later, following the appropriate or desired protocol.
3.4. -Galactosidase Assay
1. Transfect the cells following the calcium phosphate precipitation methoddescribed, and allow the cells to grow for 48 h after transfection.
2. Harvest the cells and prepare whole cell lysate as previously described.3. Measure the protein concentration of the whole cell lysate using Bio-Rad’s pro-
tein assay reagent or your method of choice in order to normalize the amounts ofcell lysate to be added.
4. Add appropriate cell lysate amount into a separate tube. The maximum vol of celllysate to be added to the reaction mixture should not exceed 20 μL.
5. Add lysis buffer to the same tube to a final vol of 150 μL.6. Add 150 μL of the 2X-assay buffer prepared earlier to the Eppendorf tube.7. Incubate the mixture at 37°C for 10 min.8. Stop the reaction by adding 1 mL of 0.5 M Na2CO3.9. Measure the OD of the extract using a spectrophotometer with the wavelength set
at 420 nm.

100 Scian et al.
3.5. BES Transfection Method
1. Prepare and test the solutions needed for this method prior to use (see Subhead-ing 2.3.) by transfecting and performing a -galactosidase assay (see Subhead-ing 3.4.).
2. Twenty-four hours prior to transfection, plate the cells at a density of 6 × 10⁶
cells per plate. The cells should be 40–50% confluent on the day of transfection.It may be required to adjust this number depending on the cell line used.
3. Two hours before the transfection, remove the media from the plate, and replaceit with 8.5 mL of complete media. Place the cells to be transfected at 37°C and aCO2 percentage of 2–4% while preparing the reagents.
4. Thaw aliquots of the 2X BES as needed.5. In a 1.5-mL Eppendorf tube, mix 1.35 mL of sterile water and 150 μL of 2.5 M
CaCl2 to make a 0.25 M CaCl2 solution. More can be made if necessary.6. Add 500 μL of the 0.25 M CaCl2 solution to each aliquot of BES and mix well.7. Add up to 10 μg of DNA to each of these tubes, mix well by pipeting up and
down, and let it incubate for 20 min at room temperature.8. Add the DNA cocktail to the cells in a drop-wise fashion. Return the cells to the
2–4% CO2 incubator.9. The cells should be rinsed 2X with HBSS approx 15–18 h after the transfection.
Add complete cell culture media to the plates.10. Check the quality of the precipitate under the microscope, as this is a good indi-
cator of the efficiency of transfection. The precipitate should be moderately fineand evenly distributed. A coarse precipitate indicates a poor transfection; anextremely fine precipitate is also nonoptimal.
11. Optional: after the second wash, add media containing 0.5 mM kynureate. Thisappears to improve cell survival after transfection.
12. Return the cells to the appropriate CO2 percentage for the cells in use. Harvestcells 24–48 h later (see Notes 10 and 11).
4. Notes
1. As with many products and methods, optimization may become necessary,particularly when using a different cell line. The amounts of promoter–luciferaseplasmid needed may vary from cell line to cell line. In such cases, it may benecessary to vary the amount of luciferase plasmid transfected. For example,200 ng of a promoter (p21)–luciferase construct transfected with 10 ng of mutantp53 plasmid will produce a 12-fold induction when transfected into Saos-2 cells.This may not necessarily be the case when transfecting the same amount ofluciferase and plasmid using a different cell line (e.g., H1299).
2. Not all cell lines are readily transfected with LIPOFECTAMINE 2000. Some celllines are more susceptible to the reagent than others. It is, therefore, important tocheck the transfected cells 24 h after transfection for any indication of incompat-

Transactivation and Transrepression Studies 101
ibility. This is generally indicated by a large number of dead cells seen in themedia (“floaters”), with a lesser number of attached cells compared to the previ-ous day. In a case like this, it may be necessary to prepare the whole cell lysatesafter 24 h rather than 48 h after transfection.
3. The protocol given in Subheading 3.1. can be adjusted to accommodate trans-fections in large wells or plates. Use Table 1 as a guide.
4. When studying the transactivation and transrepression properties of WT p53, thefirst step is to determine how the promoter will react to the presence of the WT ormutant protein. Different promoters have WT p53-binding sequences of differentaffinities and may not be transactivated or transrepressed with the same degree;therefore, a transfection gradient is needed. Table 2 provides an example of agradient used in a transactivation experiment using the p21 promoter. A similarsetting can be used for a transrepression study using a promoter that is transcrip-tionally inhibited in the presence of WT p53.Figure 1 shows the results of a gradient study in which the p21 promoter, which isa normal target of WT p53, was used. Here, increasing the amounts of p53 did notincrease the luciferase activity obtained, possibly due to squelching. This indi-cated that low amounts of p53 are adequate. If necessary, the amounts of p53 canbe increased. The same type of arrangement can be used for a transrepression studyand a similar setup can be used to study mutant p53 transactivation properties.Most tumors expressing mutant p53 retain and overexpress the mutant protein(5,25). Therefore, to mimic the elevated levels of mutant p53 in tumor cells, theamounts of tumor-derived p53 mutant used are larger (Table 3 and Fig. 2).In this case, increasing the amount of mutant p53 used in the transfectionincreased the amount of luciferase activity observed, suggesting that this pro-moter is affected in a concentration-dependent manner. Other transfections canbe done to determine the response of the promoter in the presence of amountslower or higher than amounts used in this assay.
5. After determining the amount of WT p53 needed to obtain an optimum responsefrom the desired promoter, it may be necessary to study whether tumor-derivedmutants of p53 will affect the promoter under the same conditions. Table 4 is anexample of such a transfection.Figure 3 shows the results of the transfection described in the above table. Here,transfection with 50 ng of the mutant p53 did not produce a significant responsefrom the p21 promoter, as compared to WT p53. Similar studies can be con-ducted comparing the ability of WT p53 and the various isoforms of p63 and p73to transactivate or transrepress a given promoter. Similarly, the effect of WT ormutant p53 on promoter deletion mutants can also be carried out.
6. When studying promoters of genes affected by tumor-derived mutants of p53, itmay be necessary to use a higher amount of the mutant protein to show signifi-cant transactivation. In this case, adjusting the amounts used in the transfectionprotocol may become necessary. For example, 10 ng of WT p53 DNA will induce

102 Scian et al.
Tabl
e 2
Exam
ple
Setu
p fo
r a
Tran
sact
ivat
ion
Stud
y w
ith
WT
p53
to D
eter
min
eO
ptim
um R
espo
nse
Wel
l no
.1
23
45
6
Pro
mot
er a
mou
nt (
e.g.
, p21
.Luc
)20
0 ng
200
ng20
0 ng
200
ng20
0 ng
200
ngpC
MV
-Bam
10 n
g—
50 n
g—
250
ng—
pCM
V-B
am W
T p
53—
10 n
g—
50 n
g—
250
ngF
ille
r D
NA
(e.
g., p
UC
19)
790
ng79
0 ng
750
ng75
0 ng
550
ng55
0 ng
CM
V, c
ytom
egal
ovir
us.
102

Transactivation and Transrepression Studies 103
Fig. 1. Human osteosarcoma Saos-2 cells were transfected with the expression plas-mid for WT p53 (pCMV Bam WT p53) or vector alone (pCMV-Bam) andp21.Luciferase (p21.Luc) using the LIPOFECTAMINE 2000 reagent as described inTable 2. The cells were harvested 48 h after transfection using Reporter lysis buffer,and luciferase activity was measured using a luminometer from Turner Designs(Sunnyvale, CA, USA). The vector reading was set to 100.
the p21 promoter approx 12- to 16-fold, whereas in the case of the epidermalgrowth factor receptor (EGFR) promoter, 800 ng of p53-D281G will produceapprox a 10-fold induction.
7. Prior to doing any experimental transfections with the calcium phoshpate method,it is recommended to set up and carry out a set of transfections to generate a
-galactosidase standard curve. This can be done by transfecting various amountsof -galactosidase plasmid (e.g., 1, 2, 5 μg, etc.), harvesting the cells after 48 h,and measuring the -galactosidase activity. The number of starting cells and thebubbling rate can also be varied. This will generate a standard curve that can beused to approximate the efficiency of the transfection. The efficiency can onlytruly be known if the transfected cells are sorted, counted, and compared to thetotal number of cells.
8. The bubbling step is a critical step. The bubbling allows for the mixing of theDNA with the HEBS/PO4 solution. As stated earlier, we have found that a bub-bling rate of 20 bubbles/10 s gives the best results. Any deviation from this rateappears to decrease the transfection efficiency.
9. Here is an example of a transfection carried out using the calcium phosphateprecipitation method.Figure 4 shows the results of the transfection described in Table 5. The -galac-tosidase readings were as follows: attempt no. 1, 0.002 and 0.136 for the vectorand -galactosidase transfected cells, respectively; and attempt no. 2, 0.001 (vec-

104 Scian et al.
Tabl
e 3
Exam
ple
Setu
p fo
r a
Tran
sact
ivat
ion
Stud
y w
ith
Mut
ant
p53
to D
eter
min
e O
ptim
umre
spon
se
Wel
l no
.1
23
45
6
Pro
mot
er (
e.g.
, NF
B2.
Luc
)20
0 ng
200
ng20
0 ng
200
ng20
0 ng
200
ngpC
MV
-Bam
200
ng—
400
ng—
800
ng—
pCM
V-B
am p
53-D
281G
—20
0 ng
—40
0 ng
—80
0 ng
Fil
ler
DN
A (
e.g.
, pU
C 1
9)60
0 ng
600
ng40
0 ng
400
ng—
—
104

Transactivation and Transrepression Studies 105
Fig. 2. Human osteosarcoma Saos-2 cells were transfected with pCMV-Bam p53-D281G or vector alone (pCMV-Bam and Nf B2.Luciferase (NF B2.Luc), using theLIPOFECTAMINE 2000 reagent as described in Table 3. The cells were harvested 48 hafter transfection, using Reporter lysis buffer, and luciferase activity was measured.The vector reading was set to 100.
Fig. 3. Human Saos-2 cells were transfected with the expression plasmid for WTp53, p53-V143A, p53-R175H, p53-R273H, p53-D281G, or vector alone (pCMV-Bam)and p21.Luc using the LIPOFECTAMINE 2000 reagent as described in Table 4. Thecells were harvested 48 h after transfection using Reporter lysis buffer, and luciferaseactivity was measured. The vector reading was set to 100.

106 Scian et al.
106
Tabl
e 4
Exam
ple
Setu
p fo
r a
Tran
sact
ivat
ion
Stud
y w
ith
WT
p53
Wel
l no.
12
34
56
Pro
mot
er (
e.g.
, p21
.Luc
)20
0 ng
200
ng20
0 ng
200
ng20
0 ng
200
ngpC
MV
-Bam
50 n
g—
——
——
pCM
V-B
am W
T p
53—
50 n
g—
——
—pC
MV
-Bam
p53
-V14
3A—
—50
ng
——
—pC
MV
-Bam
p53
-R17
5H—
——
50 n
g—
—pC
MV
-Bam
p53
-R27
3H—
——
—50
ng
—pC
MV
-Bam
p53
-D28
1G—
——
——
50 n
gF
ille
r D
NA
(e.
g., p
UC
19)
750
ng75
0 ng
750
ng75
0 ng
750
ng75
0 ng

Transactivation and Transrepression Studies 107
tor) and 0.027 ( -galactosidase). Clearly, the first attempt resulted in a muchbetter transfection. Reagents that produce low results such as this should be dis-carded and prepared again. Therefore, it is recommended to include a -galac-tosidase transfection, which can be compared to the standard curve generatedearlier, to get an idea of the efficacy of the transfection.
10. Unlike the calcium phosphate precipitation method, there is no bubbling stepwhen using the BES method.
11. Here is an example of a transfection using the BES method (Table 6). Saos-2cells were plated at equal densities (3 × 10⁶) 24 h prior to transfection. Cells werethen transfected with 10 μg of DNA using the BES method and allowed to growfor 24 h. The cells were then washed with cold phosphate-buffered saline (PBS),trypsinized, and collected in a 50-mL Falcon tube. Samples were then pelleted,resuspended in 1 mL of PBS containing 0.05 mM phenylmethylsulfonyl fluoride(PMSF), and analyzed by flow cytometry (26) after incubation of the cell pelletwith the p53 antibody DO1 (Oncogene Research Products, Cambridge, MA,USA) and a fluorescein isothiocyanate (FITC)-conjugated secondary antibody.Cells were then stained with propidium iodide. The transfected (T) cells weresorted and compared to untransfected (U) cells in the same plate. Anuntransfected plate was used as a mock (Fig. 5).
Table 5Example of a Transfection Setup by the Calcium PhosphatePrecipitation Method
Plate no. 1 2
Tube set no. 1HEBS/PO4 500 μL 500 μLTube set no. 22 M CaCl2 62.5 μL 62.5 μL (added last)Sterile water to 437.5 μL to 437.5 μLDNA (pCMV Bam) 10 μg —DNA (pCMV -galactosidase) — 10 μg
Table 6Example of a Transfection Setup Done Using the BESMethod
Plate no. 1 (mock) 2
2X BES 500 μL 500 μL0.25 M CaCl2 500 μL 500 μLDNA (pCMV Bam WT p53) — 10 μg

108 Scian et al.
Fig. 4. Human Saos-2 cells were transfected with pCMV -galactosidase or vectoralone (pCMV-Bam), using the calcium phosphate precipitation method. The cells wereharvested 48 h after transfection, using Reporter lysis buffer, and -galactosidaseactivity was measured as described in Table 6. The readings were 0.002 and 0.001 forthe vector transfected cells and 0.136 and 0.027 for the -galactosidase transfected cells.
Fig. 5. Human Saos-2 cells were transfected with pCMV WT p53 or vector alone(pCMV-Bam), using the BES method. The cells were harvested 48 h after transfec-tion, using Reporter lysis buffer, and incubated with a p53 specific antibody (DO 1)for 2 h at 4°C followed by an FITC-conjugated secondary antibody. Transfected cellswere then sorted, and their DNA content was analyzed by flow cytometry. Presentedis a graphical representation of the proportion of the transfected cells (T), compared tountransfected cells (U) from the same plate, found in each phase of the cell cycle. Themock represents an untransfected plate.

Transactivation and Transrepression Studies 109
AcknowledgmentsThe work presented here was supported by grants from the National Insti-
tutes of Health (NIH) to Sumitra Deb (CA70712) and to Swati Palit Deb(CA74172). We thank Arnold Levine and Bert Vogelstein for providing uswith plasmids and cells.
References1. Levine, A. J. (1997) p53, the cellular gatekeeper for growth and division. Cell 88,
323–331.2. Vogelstein, B., Lane, D., and Levine, A. J. (2000) Surfing the p53 network. Nature
408, 307–310.3. Prives, C. and Hall, P. A. (1999) The p53 pathway. J. Pathol. 187, 112–126.4. Lane, D. P. (1994) p53 and human cancers. Br. Med. Bull. 50, 582–599.5. Donehower, L. A. and Bradley, A. (1993) The tumor suppressor p53. Biochim.
Biophys. Acta 1155, 181–205.6. Kern, S. E., Kinzler, K. W., Bruskin, A., et al. (1991) Identification of p53 as a
sequence-specific DNA-binding protein. Science 252, 1708–1711.7. Sun, Y. (2000) Identification and characterization of genes responsive to
apoptosis: application of DNA chip technology and mRNA differential display.Histol. Histopathol. 15, 1271–1284.
8. Okamura, S., Ng, C. C., Koyama, K., Takei, Y., Arakawa, H., Monden, M., andNakamura, Y. (1999) Identification of seven genes regulated by wild-type p53 ina colon cancer cell line carrying a well-controlled wild-type p53 expression sys-tem. Oncol. Res. 11, 281–285.
9. Murphy, M., Hinman, A., and Levine, A. J. (1996) Wild-type p53 negativelyregulates the expression of a microtubule-associated protein. Genes Dev. 10,2971–2980.
10. Farmer, G., Friedlander, P., Colgan, J., Manley, J. L., and Prives, C. (1996) Tran-scriptional repression by p53 involves molecular interactions distinct from thosewith the TATA box binding protein. Nucleic Acids Res. 24, 4281–4288.
11. Rishi, A. K., Hsu, C. K., Li, X. S., Hussain, A., Gerald, T. M., and Fontana, J. A.(1997) Transcriptional repression of the cyclin-dependent kinase inhibitorp21WAF1/CIP1 gene mediated by cis elements present in the 3'-untranslatedregion. Cancer Res. 57, 5129–5136.
12. Yu, C. L., Driggers, P., Barrera-Hernandez, G., Nunez, S. B., Segars, J. H., andCheng, S. (1997) The tumor suppressor p53 is a negative regulator of estrogenreceptor signaling pathways. Biochem. Biophys. Res. Commun. 239, 617–620.
13. Kubicka, S., Kuhnel, F., Zender, L., et al. (1999) p53 represses CAAT enhancer-binding protein (C/EBP)-dependent transcription of the albumin gene. A molecu-lar mechanism involved in viral liver infection with implications forhepatocarcinogenesis. J. Biol. Chem. 274, 32,137–32,144.
14. Krause, K., Wasner, M., Reinhard, W., et al. (2000) The tumour suppressor pro-tein p53 can repress transcription of cyclin B. Nucleic Acids Res. 28, 4410–4418.

110 Scian et al.
15. Johnson, R. A., Ince, T. A., and Scotto, K. W. (2001) Transcriptional repressionby p53 through direct binding to a novel DNA element. J. Biol. Chem. 276,27,716–27,720.
16. De Laurenzi, V. and Melino, G. (2000) Evolution of functions within the p53/p63/p73 family. Ann. NY Acad. Sci. 926, 90–100.
17. Ichimiya, S., Nakagawara, A., Sakuma, Y., et al. (2000) p73: structure and func-tion. Pathol. Int. 50, 589–593.
18. Arrowsmith, C. H. (1999) Structure and function in the p53 family. Cell DeathDiffer. 6, 1169–1173.
19. Levrero, M., De Laurenzi, V., Costanzo, A., Gong, J., Wang, J. Y., and Melino,G. (2000) The p53/p63/p73 family of transcription factors: overlapping and dis-tinct functions. J. Cell Sci. 113, 1661–1670.
20. Levrero, M., De Laurenzi, V., Costanzo, A., Gong, J., Melino, G., and Wang, J.Y. (1999) Structure, function and regulation of p63 and p73. Cell Death Differ. 6,1146–1153.
21. Deb, D., Lanyi, A., Scian, M., et al. (2001) Differential modulation of cellular andviral promoters by p73 and p53. Int. J. Oncol. 18, 401–409.
22. Takagi, S., Ueda, Y., Hijikata, M., and Shimotohno, K. (2001) Overproducedp73alpha activates a minimal promoter through a mechanism independent of itstranscriptional activity. FEBS Lett. 509, 47–52.
23. Diller, L., Kassel, J., Nelson, C. E., et al. (1990) p53 functions as a cell cyclecontrol protein in osteosarcomas. Mol. Cell Biol. 10, 5772–5781.
24. Subler, M. A., Martin, D. W., and Deb, S. (1992) Inhibition of viral and cellularpromoters by human wild-type p53. J. Virol. 66, 4757–4762.
25. Gentile, M., Bergman Jungestrom, M., Olsen, K. E., Soderkvist, P., andWingren, S. (1999) p53 and survival in early onset breast cancer: analysis ofgene mutations, loss of heterozygosity and protein accumulation. Eur. J. Cancer35, 1202–1207.
26. Brown, D. R., Thomas, C. A., and Deb, S. P. (1998) The human oncoproteinMDM2 arrests the cell cycle: elimination of its cell-cycle-inhibitory functioninduces tumorigenesis. EMBO J. 17, 2513–2525.

p53-Transcriptional Repression 111
111
From: Methods in Molecular Biology, vol. 234: p53 ProtocolsEdited by: S. Deb and S. P. Deb © Humana Press Inc., Totowa, NJ
8
Methods to Study p53-Repressed Promoters
Patrick Dumont, Anthony Della Pietra, and Maureen E. Murphy
SummaryThere is substantial evidence in the literature that, in addition to functioning as an activator
of transcription, the p53 tumor suppressor protein can also function as a sequence-specifictranscriptional repressor of a separate set of genes. However, elucidation of the mechanismwhereby p53 functions as a transcriptional repressor has been obscured by the use of artificialassays to measure this activity; these assays include transient transfection analyses, where bothp53 and target promoters are overexpressed. This chapter describes alternative approaches forthe definition of sequence elements that mediate transcriptional repression by p53. Theseinclude the McKay (immunobinding) assay, which measures the in vitro binding of large frag-ments of DNA, as well as chromatin immunoprecipitations (ChIPs), which measure in vivobinding. The use of such assays should better define the mechanism of transcriptional repres-sion by p53 and should aid in the elucidation of the contribution of this activity to p53-depen-dent growth arrest and programmed cell death (apoptosis).
Key Wordsp53, repression, transcription, immunobinding, chromatin immunoprecipitation
1. IntroductionThe p53 tumor suppressor gene continues to hold distinction as the most
frequently mutated gene in human cancer; this gene is mutated in over 50% ofhuman tumors of multiple histological types. Consequently, elucidation of themechanisms whereby p53 suppresses tumor formation has important conse-quences for understanding the development and treatment of many tumor types,including cancers of the brain, breast, bone, colon, liver, lymph, ovary, pros-tate, and stomach.
The p53 protein serves as an integral stress responder in the cell. It is nor-mally inactive in cells, but becomes stabilized and activated as a sequence-

112 Dumont et al.
specific transcription factor by multiple cellular stresses, including, but notlimited to, DNA damage, hypoxia, and oncogene activation. The result of p53activation is either growth arrest or apoptosis, depending upon cell type andenvironmental parameters, but it is currently accepted that it is p53’s ability toinduce apoptosis that underlies the strong selection for mutation of this geneduring tumor development (1,2). Consequently, elucidation of the mechanismwhereby p53 induces cell death has been a primary focus of studies on thistumor suppressor protein.
Although p53 is best characterized as an activator of gene transcription, com-pelling data from several laboratories indicate that other activities of p53 playan essential role in the ability of this protein to efficiently induce programmedcell death. For example, Caelles, Karin, and colleagues reported that, in anendocrine cell line containing wild-type p53, apoptosis could be induced thatwas p53-dependent, but this occurred in the absence of the induction of p53-response genes. Further, this cell death could not be inhibited with chemicalinhibitors of new gene transcription, such as actinomycin D (3). Similarly, astudy by Wagner, Hay, and colleagues (4) indicated that p53-dependentapoptosis, which was induced in the presence of inappropriately high levels ofthe c-myc proto-oncogene, could not be inhibited with cycloheximide, whichinhibits de novo protein translation. Haupt, Oren, and others reported that syn-thetic mutants of p53, which are incapable of binding to DNA or activatingtranscription (5,6), could still induce apoptosis when overexpressed in humantumor cells. The take-home message from these studies was that p53 clearlyhad a transactivation-independent mechanism for apoptosis induction.
That p53 might also be a transcriptional repressor of gene expression wasimplied by early studies showing that this protein could repress the transcrip-tion of several viral and cellular promoters in transient transfection assays (7,8).However, attempts to determine the binding site specificity for p53 in theseassays failed to reveal a promoter sequence required for repression, and theactivity apparently mapped to basal promoter elements. Additionally, p53 wasnot found to occupy a discrete nucleic acid element in these “repressed” pro-moters, indicating an unusual lack of sequence specificity for this activity (8).The finding that inhibitors of apoptosis, such as bcl2, adenovirus E1B-19K,and the Wilms tumor suppressor gene WT1 (9–11) could likewise inhibit tran-scriptional repression implicated this activity in this pathway, but also impliedthat such repression might be a side effect of cell death. Nonetheless, theseearly studies suggested that further study in this area was paramount.
The validity of this field of study was greatly increased when researchersbegan using subtractive hybridization and microarray analyses to reliably iden-tify genes whose endogenous expression was decreased following physiologi-cal induction of wild-type p53. Genes identified in this manner include cyclin

p53-Transcriptional Repression 113
B1, cdc2, cdc25c, -fetoprotein, Map4, MDR1, p14ARF, presenilin 1, siah,stathmin, survivin, topoisomerase IIa, and wee1, among others (12–23). Forsome of these studies, investigators used stable transfections of promoterslinked to reporter genes in cell lines with inducible or endogenous p53 in orderto circumvent problems of “squelching” of transcription associated with moreartificial (transient) assays. Some of these studies also used nuclear run-onassays to show that decreased expression of these genes occurred at the level oftranscriptional initiation (13). Such studies indicated for the first time that notonly were endogenous genes transcriptionally repressed following p53 induc-tion, but also that stably transfected promoters and truncation mutants thereofcould recapitulate this effect reliably. These studies also indicated for the firsttime that sequence-specific binding of p53 to the promoters of these genes wasrequired for transcriptional repression.
Identification of a p53 binding site in p53-repressed promoters required areliable in vitro technique that was easily adaptable to large fragments of DNAand for which no a priori assumptions about the nature or sequence of the p53binding site were made. Such a technique is the McKay, or immunobinding,assay, which relies on the in vitro association of p53 with candidate bindingelements (up to 3 kb), followed by immunoprecipitation (IP) of bound DNAusing p53 antisera (24). A variation of this technique was used to identify thefirst p53 binding sites in p53-activated genes (25). Figure 1 depicts data on thep53-repressed Map4 promoter, which is sufficient to confer negative regula-tion by p53 in stably transfected cells (Fig. 1A) and interacts with p53 in aMcKay assay (Fig. 1B). One disadvantage to immunobinding assays, like otherin vitro promoter occupancy studies, such as electrophoretic mobility shiftassays (EMSA) and DNase I protection (DNA footprinting), is that DNAelements can interact with a protein in vitro that are not necessarily able to, oraccessible, in chromatin. Therefore, such in vitro binding assays are bestsupplemented using more in vivo approaches, such as chromatin immunopre-cipitations (ChIPs). This latter assay uses formaldehyde cross-linking in orderto determine whether a protein binds to a particular DNA fragment in vivo.Figure 2 depicts results from ChIPs for the Map4 promoter. Protocols for bothof these techniques will be presented here.
2. Materials2.1. McKay Assay
1. McKay binding buffer: 10% glycerol, 5 mM ethylenediamine tetraacetic acid(EDTA), 20 mM Tris, pH 7.2, 100 mM NaCl, 0.1% Nonidet®P-40 (NP40).Supplement with protease inhibitors: 1 mM phenylmethylsulfonyl fluoride(PMSF), 1 μg/mL aprotinin, 1 μg/mL pepstatin, 1 μg/mL leupeptin.

114 Dumont et al.
114
Fig
. 1. (
A)
The
Map
4 pr
omot
er is
suf
fici
ent t
o co
nfer
neg
ativ
e re
gula
tion
by
p53
in s
tabl
y tr
ansf
ecte
d ce
lls
cont
aini
ng in
duci
ble
(tem
pera
ture
-sen
siti
ve)
p53.
Nor
ther
n an
alys
is o
f lu
cife
rase
mR
NA
lev
els
in p
oole
d st
ably
tra
nsfe
cted
cel
ls c
onta
inin
g te
mpe
ra-
ture
-sen
siti
ve p
53 (
Val
5 ce
lls:
p53
is
mut
ant
and
inac
tive
at
39°C
, wil
d-ty
pe a
nd a
ctiv
e at
32°
C).
The
luc
ifer
ase
gene
is
link
ed t
oei
ther
the
PH
S-2
(C
OX
2) p
rom
oter
(ne
gati
ve c
ontr
ol)
or th
e M
ap4
prom
oter
. Rat
ios
give
n ar
e th
e av
erag
e le
vels
of
luci
fera
se R
NA
at 3
2°C
com
pare
d to
39 °
C f
rom
thr
ee i
ndep
ende
nt e
xper
imen
ts,
rela
tive
to
the
glyc
eral
dehy
de-3
-pho
spha
te d
ehyd
roge
nase
(GA
PD
H)
load
ing
cont
rol.
( B)
Wil
d-ty
pe (
32°C
), b
ut n
ot m
utan
t (3
9 °C
) p5
3 bi
nds
to t
he M
ap4
prom
oter
in
a M
cKay
ass
ay.
Asp
ecif
ic f
ragm
ent
of t
he M
ap4
prom
oter
is
imm
unop
reci
pita
ted
wit
h p5
3 fr
om w
hole
-cel
l ex
trac
t fr
om V
al5
cell
s gr
own
at 3
2 °C
(wil
d-ty
pe p
53),
but
not
mut
ant p
53 (
39°C
). T
he w
af1
prom
oter
is s
how
n as
a p
osit
ive
cont
rol,
and
the
vect
or f
ragm
ent (
deno
ted)
serv
e as
inte
rnal
neg
ativ
e co
ntro
ls.

p53-Transcriptional Repression 115
2. Protein A Sepharose® (Amersham Pharmacia Biotech, Piscataway, NJ, USA)(50% v/v): place 0.13 g dry beads in 1.5 mL TENN. Allow to swell for 30 min,with occasional vortex mixing. Pellet beads with a 30-s spin at 16,000g and thenaspirate buffer. Wash 2× with 0.6 mL TENN and resuspend in 0.6 mL McKaybinding buffer.
3. TENN: 50 mM Tris-HCl, pH 7.4, 5 mM EDTA, 0.5% NP40, 150 mM NaCl.4. McKay washing buffer: 2% glycerol, 5 mM EDTA, 20 mM Tris-HCl, pH 7.2,
100 mM NaCl, 0.1% NP40.5. McKay DNA loading dye: 10 mM Tris-HCl, pH 7.4, 1 mM EDTA, pH 8.0, 20%
glycerol, 0.05% bromophenol blue, and xylene cyanol.6. poly(dI/dC): 1 μg/μL in McKay binding buffer, then sonicate at 30% power for
3 × 20 s to fragment.
2.2. Chromatin Immunoprecipitations
1. Cell lysis buffer: 5 mM 1,4-piperazinediethanesulfonic acid (PIPES), pH 8.0,85 mM KCL, 0.5% NP40. Supplement with protease inhibitors (see below).
2. Nuclear lysis buffer: 50 mM Tris-HCl, pH 8.1, 10 mM EDTA, 1% sodium dodecylsulfate (SDS). Supplement with protease inhibitors.
3. Immunoprecipitation (IP) dilution buffer: 0.01% SDS, 1.1% Triton® X-100,1.2 mM EDTA, 16.7 mM Tris-HCl, pH 8.1, 167 mM NaCl. Supplement withprotease inhibitors.
4. Dialysis buffer: 2 mM EDTA, 50 mM Tris-HCl, pH 8.0, 0.2 % Sarkosyl.5. IP wash buffer: 100 mM Tris-HCl, pH 8.5, 500 mM LiCl, 1% NP40, 1% deoxy-
cholic acid.6. Elution buffer (make fresh): 50 mM NaHCO3, 1% SDS.7. 5X Proteinase K buffer: 50 mM Tris-HCl, pH 7.5, 25 mM EDTA, 1.25% SDS.
Fig. 2. Wild-type p53 binds to the Map4 promoter in vivo. ChIPs of the Map4promoter in cells with wild-type p53 (32°C) or mutant p53 (39°C) indicate that onlywild-type p53 binds to the Map4 promoter in vivo.
116 Dumont et al.
8. Protease inhibitors: 100 mM PMSF in ethanol, use at 1:100. Aprotinin (10 mg/mL) in 0.01 M 4-(2-hydroxyethyl)-1-piperazineethanesulfonic acid (HEPES), pH8.0, use at 1:1000. Leupeptin (10 mg/mL) in water, use at 1:1000.
3. Methods3.1. Immunobinding (McKay) Assay
3.1.1. Preparation of End-Labeled DNA
1. Digest 10 μg of genomic DNA samples, cloned into a plasmid, with restrictionenzymes that will generate small (100–2000 bp) fragments. Following digestionin a 50 μL reaction, heat-inactivate the restriction enzyme at 65°C for 15 min.
2. Add in a microfuge tube 30 μL of distilled water (dH2O), 10 μL of 5Xdeoxycytidine triphosphate (dCTP) buffer, 1 μL (200 ng) of DNA, 5 μL of 32P-dCTP, and 3 μL of Klenow polymerase (1 U/μL). Incubate 30 min at 37°C,and run on a G-50 column (Amersham Pharmacia Biotech). Count 1 μL. Store at–20°C until ready to use. The radiolabeled vector portion of the digest serves as agood internal negative control.
3.1.2. Preparation of Cell Lysate
1. Harvest one 10-cm plate, each of cells containing wild-type p53 in the inducedand noninduced conditions (e.g., cells +/– a DNA-damaging agent of UV radia-tion). A reliable standard is MCF7 cells treated with 0.5 μg/mL adriamycin for12–24 h). Harvest cells by scraping into 10 mL of phosphate-buffered saline(PBS). Spin cells at 1300g for 8 min.
2. Lyse the cell pellet in 1 mL of McKay binding buffer that has been supplementedwith protease inhibitors. Incubate cell lysates on ice 20 min; then vortex mix 3 ×20 s, and spin at 14,000g for 10 min in a cold room. Collect supernatant.
3.1.3. Binding Reaction, Washes, Elution of Bound DNA
1. Keep samples on ice at all times. Measure the protein concentration of samplesusing a Bradford assay (Bio-Rad, Hercules, CA, USA). Incubate 100 μg of eachextract with 5 × 10⁵ counts per minute (cpm) of labeled DNA and bring up to 100μL with binding buffer. Add 0.5 μg of p53 antisera (either 421, 1620, or DO-1monoclonal antibodies; Calbiochem-Novabiochem, San Diego, CA, USA) toeach sample, then add 12.5 μL poly(dI/dC). Rotate at 4°C for 1 h (see Note 1).
2. Add 30 μL of protein A Sepharose (50% v/v, equilibrated in binding buffer).Incubate at 4°C with rotation for 30 min.
3. Add 750 μL of McKay washing buffer, vortex mix for 60 s, and spin at 14,000gfor 30 s. Being careful to avoid the protein A pellet, aspirate the supernatant.Repeat the wash 2×.
4. To the remaining protein A pellet after the last wash, add 150 μL of Tris-EDTA(TE), then 150 μL of phenol–chloroform, and 1 μL of yeast tRNA (20 μg/μL indH2O; Invitrogen, Carlsbad, CA, USA). Vortex mix for 1 min and spin for 3 minat 14,000g. Carefully pull off the top aqueous layer and remove to a fresh tube.

p53-Transcriptional Repression 117
Add 15 μL of 10 M NH4OAc and 300 μL of ethanol (ETOH). Mix well, incubateat –80°C 15 min, and spin 15 min at 14,000g in the cold. Wash pellet in 70%ETOH and let air-dry 10 min.
5. Resuspend pellet in 10 μL of dH20 by pipeting, and add 10 μL of McKay dye.Load onto a 4% nondenaturing acrylamide gel and run in the cold room in 0.5XTris-borate EDTA (TBE) at 200 V for 2 h. As controls, load 20,000 cpm of eachprobe in 10 μL of McKay buffer. Dry down gel and expose to film overnight.
3.2. Chromatin Immunoprecipitations (ChIPs)
3.2.1. Preparation of Cross-Linked Cell Lysate
1. Use 107 cells for induced and noninduced situations per immunoprecipitation;fix them right on the plate in media by adding 37% formaldehyde to 1%. Incubateat room temperature with shaking for 10 min.
2. Add glycine to 0.125 M, and rock for 5 min at room temperature. Wash cells 2×with PBS and scrape into 10 mL of PBS supplemented with protease inhibitors(see Note 2). Resuspend cell pellet in 7 mL lysis buffer plus protease inhibitors.Keep cells on ice for 10 min and perform 5 strokes with a Dounce B homogenizeron ice. Centrifuge at 3200g for 7 min to pellet nuclei.
3. Resuspend nuclei in 500 μL of nuclear lysis buffer supplemented with proteaseinhibitors. Vortex mix well and incubate on ice 10 min. Sonicate chromatin usinga sonicator 10 × 10 s, 2-mm tip, 60% power, and keeping cells on ice betweensonications. The average length of sonicated chromatin should be about 1000 bp,and this should be worked out for each different cell line and checked on an agarosegel. Microfuge sonicated chromatin at top speed for 15 min (see Note 3).
3.2.2. Immunoprecipitation of Fixed Chromatin
1. Transfer supernatant to a fresh tube and add 80 μL of protein A agarose pre-adsorbed with bovine serum albumin (BSA) and DNA (Upstate Biotechnology,Waltham, MA, USA). Preclear by rocking for 30 min at 4°C. Spin at top speedfor 5 min, and transfer to a fresh tube. Add 100 μL into each IP tube. To each100 μL, add 800 μL of IP dilution buffer, supplemented with protease inhibitors,along with 1 to 2 μg of antisera specific for p53, or normal rabbit sera as a nega-tive control. To a control tube, add dialysis buffer instead of fixed chromatinalong with each antibody. Incubate for 3–12 h at 4°C with rotation (see Note 4).
2. Add 60 μL of protein A agarose to each sample and incubate for 1 to 2 h at 4°C.Spin at 14000g in a microfuge for 3 min, and decant supernatant. Save the super-natant from the “normal rabbit sera” sample and label as “total input chromatin.”
3. Wash pellets 2 × 1 mL dialysis buffer and 4 × 1 mL IP wash buffer, rotatinggently for 3 min between washes. After each wash, spin at 14000g for 3 min, andaspirate supernatant carefully.
4. Add 150 μL IP elution buffer (freshly made), vortex mix 30 s, and rock for15 min at room temperature. Spin at 14000g and transfer supernatant to freshtube. Repeat with another 150 μL elution buffer. Combine supernatants and spin

118 Dumont et al.
at 14000g for 5 min to remove any traces of protein A agarose. Add 2 μL 5 mg/mL RNase A and bring to 0.2 M NaCl. Incubate at 67°C for 4–12 h; this stepreverses cross-links to allow for the polymerase chain reaction (PCR). Add 1 μLof yeast tRNA (20 μg/μL) and 650 μL of 100% ETOH and precipitate at –20°Covernight. Remember to treat “total input chromatin” the same way.
8. Spin samples at 14000g for 20 min, decant ethanol, and air-dry for 10 min. Dis-solve pellet in 100 μL of TE; add 25 μL of 5X proteinase K buffer and 1.5 μL ofpro K (20 μg/μL in dH2O). Incubate at 45°C for 1.5 h.
9. Add 175 μL of TE and extract once with 300 μL of phenol–chloroform and oncewith 300 μL of chloroform. Add 30 μL of 5 M NaCl, 20 μg of yeast tRNA, and750 μL of ETOH to each sample, and precipitate at –20°C for 2–12 h.
10. Spin samples at 14000g for 20 min, and wash pellet in 70% ETOH. Resuspend in100 μL of dH2O; use 1 μL for PCR. For total input chromatin, use 1 μL of a1:1000 dilution.
3.2.3. PCR
1. Add 5 μL of 10X PCR buffer to 5 μL of 10mM dNTPs (10 mM each; AmershamPharmacia Biotech), 1 μL of 20 μM forward primer, 1 μL of 20 μM reverseprimer, and dH2O to 49 μL. Add 1 to 2 μL of Taq DNA polymerase. Mix welland add 1 μL of freshly diluted chromatin from above. PCR at 94 °C for 5 min,and 30–35 cycles of 94°C for 30 s, 55°C for 30 s, 72°C for 30 s, followed by 72°Cfor 10 min and a 4°C soak.
2. Run 10 μL of each PCR on an agarose gel.
4. Notes1. The McKay assay is a relatively straightforward assay with few technical difficul-
ties; high background binding of the vector sequences can be eliminated by titrat-ing to lower protein concentrations or lower antibody concentrations (0.1–0.5 μg).
2. ChIPs are much less straightforward, and often many parameters need to beworked out before this protocol is informative. First, cross-linking times mayneed to be worked out, as over-crosslinking can destroy antigen availability. Simi-larly, while some protocols eliminate the glycine incubation, this eliminatesunreacted formaldehyde, which can interfere with later antibody binding.
3. Some researchers find that sonication of chromatin to very small pieces (100–300 nucleotides) enhances reproducibility and quantitation. Also, some proto-cols incorporate a cesium chloride gradient for the purification of fixed chromatin(26), which can enhance signal by eliminating insoluble contaminants that mightimpede IP.
4. It is important to use multiple different antibodies for the IP, as they can be vari-ably sensitive to the denaturation of proteins with formaldehyde. Typically,polyclonal antisera works better than monoclonal. For p53, rabbit polyclonal an-tisera (p53 FL393; Santa Cruz Biotechnology, Santa Cruz, CA, USA) works well,but monoclonal antibody DO-1 (Ab-6; Oncogene Science) also works well.

p53-Transcriptional Repression 119
References1. Ko, L. J. and Prives, C. (1996) p53: puzzle and paradigm. Genes Dev. 10,
1054–1072.2. Levine, A. J. (1997) p53, the cellular gatekeeper for growth and division. Cell 88,
323–331.3. Caelles, C., Helmberg, A., and Karin, M. (1994) p53-dependent apoptosis in the
absence of transcriptional activation of p53-target gene. Nature 370, 220–223.4. Wagner, A. J., Kokontis, J. M., and Hay, N. (1994) Myc-mediated apoptosis
requires wild type p53 in a manner independent of cell cycle arrest and the abilityof p53 to induce p21waf1/cip1. Genes Dev. 8, 2817–2830.
5. Haupt, Y., Rowan, S., Shaulian, E., Vousden, K. H., and Oren, M. (1995) Induc-tion of apoptosis in HeLa cells by trans-activation-deficient p53. Genes Dev. 9,2170–2183.
6. Haupt, Y., Barak, Y., and Oren, M. (1996) Cell type-specific inhibition of p53-mediated apoptosis by mdm2. EMBO J. 15, 1596–1606.
7. Horikoshi, N., Usheva, A., Chen, J., Levine, A. J., Weinmann, R., and Shenk, T.(1995) Two domains of p53 interact with the TATA-binding protein, and theadenovirus 13S E1A protein disrupts the association, relieving p53-mediated tran-scriptional repression. Mol. Cell. Biol. 15, 227–234.
8. Mack, D. H., Vartikar, J., Pipas, J. M., and Laimins, L. (1993) Specific repressionof TATA-mediated but not initiator-mediated transcription by wild type p53.Nature 363, 281–283.
9. Maheswaran, S., Englert, C., Bennett, P., Heinrich, G., and Haber, D. A. (1995)The WT1 gene product stabilizes p53 and inhibits p53-mediated apoptosis. GenesDev. 9, 2143–2156.
10. Sabbatini, P., Chiou, S-K., Rao, L., and White, E. (1995) Modulation of p53-mediated transcriptional repression and apoptosis by adenovirus E1B 19K pro-tein. Mol. Cell. Biol. 15, 1060–1070.
11. Shen, Y. and Shenk, T. E. (1994) Relief of p53-mediated transcriptional repres-sion by the adenovirus E1B-19K protein or the cellular bcl2 protein. Proc. Natl.Acad. Sci. USA 91, 8940–8944.
12. Amson, R. B., Nemani, M., Roperch, J. P., et al. (1996) Isolation of 10 differen-tially expressed cDNAs in p53-induced apoptosis: activation of the vertebratehomologue of the drosophila seven-in-absentia gene. Proc. Natl. Acad. Sci. USA93, 3953–3957.
13. Murphy, M., Hinman, A., and Levine, A. J. (1996) Wild type p53 negativelyregulates the expression of a microtubule associated protein. Genes Dev. 10,2971–2980.
14. Wang, Q., Zambetti, G. P., and Suttle, D. P. (1997) Inhibition of DNAtopoisomerase II gene expression by the p53 tumor suppressor. Mol. Cell. Biol.17, 389–397.
15. Roperch, J. P., Alvaro, V., Prieur, S., et al. (1998) Inhibition of presenilin 1expression is promoted by p53 and p21WAF1 and results in apoptosis and tumorsuppression. Nature Med. 4, 835–838.

120 Dumont et al.
16. Ahn, J., Murphy, M., Kratowicz, S., Wang, A., Levine, A. J., and George, D. L.(1999) Down-regulation of the stathmin/Op18 and FKBP25 genes following p53induction. Oncogene 18, 5954–5958.
17. Innocente, S. A., Abrahamson, J. L., Cogswell, J. P., and Lee, J. M. (1999) p53regulates a G2 checkpoint through cyclin B1. Proc. Natl. Acad. Sci. USA 96,2147–2152.
18. Lee, K. C, Crowe, A. J., and Craig Barton, M. (1999). p53-mediated repression ofalpha-fetoprotein gene expression by specific DNA binding. Mol. Cell. Biol. 19,1279–1288.
19. Murphy, M., Ahn, J., Walker, K. K., et al. (1999) Transcriptional repression bywild-type p53 utilizes histone deacetylases, mediated by interaction with mSin3a.Genes Dev. 13, 2490–2501.
20. Yun, J., Chae, H. D., Choy, H. E., et al. (1999) p53 negatively regulates cdc2transcription via the CCAAT-binding NF-Y transcription factor. J. Biol. Chem.274, 677–682.
21. Zhao, R., Gish, K., Murphy, M., et al. (2000). Analysis of p53-regulated geneexpression patterns using oligonucleotide arrays. Genes Dev. 14, 981–993.
22. Johnson, R. A., Ince, T. A., and Scotto, K. W. (2001) Transcriptional repression byp53 through direct binding to a novel DNA element. J. Biol. Chem. 276, 716–720.
23. Hoffman, W. H., Biade, S., Zilfou, J. T., Chen, J., and Murphy, M. (2002) Tran-scriptional repression of the anti-apoptotic survivin gene by wild type p53. J. Biol.Chem. 277, 3247–3257.
24. McKay, R. D. (1981) Binding of a simian virus 40 T antigen-related protein toDNA. J. Mol. Biol. 145, 471–488.
25. El-Deiry, W. S., Kern, S. E., Pietenpol, J. A., Kinzler, K. W., and Vogelstein, B.(1992) Definition of a consensus binding site for p53. Nat. Genet. 1, 45–49.
26. Parekh, B. S. and Maniatis, T. (1999) Virus infection leads to localizedhyperacetylation of histones H3 and H4 at the IFN-beta promoter. Mol. Cell 3,125–129.

p53-Interacting Proteins 121
121
From: Methods in Molecular Biology, vol. 234: p53 ProtocolsEdited by: S. Deb and S. P. Deb © Humana Press Inc., Totowa, NJ
9
Interaction of p53 with Cellular Proteins
David M. Keller, Shelya X. Zeng, and Hua Lu
SummaryCellular proteins that interact with p53 play a major role in both positive and negative regu-
lation of this tumor suppressor and can fine-tune its response to specific cellular stresses. As aconsequence, p53 biology will not be complete until these interacting proteins are fully charac-terized. This chapter outlines two methods for identifying and characterizing p53-binding pro-teins: (i) glutathione-S-transferase (GST) protein–protein interaction assay; and (ii)co-immunoprecipitation (co-IP) assay. These two methods are ideal for any laboratory toperform; the assays are short in duration, do not require specialized expertise to establish in thelaboratory, give reliable and reproducible data, and are cost-efficient, because few reagentsare needed. This chapter gives a basic description of these two techniques and provides tipsthat are not found in other protocol manuals on how to achieve the best results.
Key WordsGST pull-down assay, co-immunoprecipitation, protein–protein interaction
1. IntroductionThe p53 tumor suppressor protein cannot function alone. Instead, it needs to
interact with multiple cellular proteins that serve to both enhance and repressp53 function (1,2) (see Table 1). Unlike transcriptional or translational regula-tion, these protein–protein interactions help provide a mechanism for instantregulation of the p53 molecule by either affecting its transactivation activityand/or protein stability, as discussed below.
Many protein–protein interactions play critical roles in p53 transactivation.For example, p53’s amino (N)-terminal transactivation domain directly con-tacts basal transcription factors, such as TBP (3,4) and TAFII31 (5,6), as wellas transcriptional co-activators such as p300/CBP (7,8). Thus, the transcrip-

122 Keller et al.
tional machinery is recruited to promoters to which p53 is bound. Other pro-teins can further stimulate p53’s transcriptional activity in response to certaincell stress stimuli. The redox-sensitive protein Ref-1 binds to p53 and activatesits DNA binding and transactivation function in response to redox stress (9).Several kinases also form stable interactions with p53, resulting in phosphory-lation and activation. For example, the homeodomain interacting proteinkinase-2 (HIPK2) has been recently shown to bind and phosphorylate p53 atSer46 after high doses of ultraviolet (UV) light, resulting in induction of p53-dependent apoptosis (10,11).
Table 1p53-Interacting Proteins
General transcription factors Protein acetylases/deacetylases/TFIID components: hTAFII31 (5,6) deacetylase adaptors
TBP (5,6) HDAC1 (40,41)TFIIH components: XPB (22–24) p300/CBP (7,8)
XPD PCAF (42)p62 Sin3a (43)
Sir2 (44,45)
Protein kinases Ubiquitination and de-ubiquitinationCasein kinase 2 (25) E6-Ap (46)HIPK2 (10,11) HAUSP (47)JNK1 (26) MDM2 (48)
Redox sensitive proteins Replication and repair proteinsHIF-1 (27) RP-A (49–51)Ref-1 (9) TFIIH components: XPB (22–24)
XPDp62
Miscellaneous p53 activators p53 family members14-3-3 (28) p63 (52)53BP1 (29) p73 (52)53BP2 (29)HMG-1 (30)
Viral proteins MDM2 family memberAdE1B55 kD (31,32) MDMX (53)EBV ENBA-5 (33)HBV X protein (34,35)HPV E6 (36,37)SV40 Tag (38,39)

p53-Interacting Proteins 123
Protein stability of p53 is also tightly regulated by protein–protein interac-tions. Most importantly, the oncoprotein MDM2 binds to the N-terminal domainof p53 (12) and negatively regulates its stability. MDM2 is a RING-fingercontaining E3-ubiquitin ligase that ubiquinates lysine residues on p53’s carboxy(C) terminus, thus targeting p53 to the proteosome for degradation (13,14). Thefunctional link between these proteins is clearly shown by knock-out mousemodels, in which MDM2 homozygous null mice are embryonic lethal, thoughdouble-knock-out MDM2-p53 mice survive (15). This striking finding indicatesthat without MDM2 to keep the p53 protein in check, the organism cannot sur-vive p53’s growth suppressive effects. Importantly, the MDM2-p53 interactionis also regulated by cell stress stimuli. For example, UV and irradiation canactivate kinases that phosphorylate p53 on serine residues within the MDM2-binding domain, thereby preventing MDM2 from binding (16–21).
As suggested by the above examples, p53 protein–protein interactions areoften regulated by cellular stress signals. Thus, it is important, when studying aparticular p53-interacting protein, to keep in mind that the interaction may bevery stress-specific and that optimization of binding conditions is required.This will include testing several cellular stress agents and performing timecourses to determine when maximal binding occurs posttreatment.
In this chapter, we describe two commonly used methods for studying p53protein–protein interactions: (i) glutathione-S-transferase (GST) pull-downassays to study interactions in vitro and co-immunoprecipitations (Co-IPs)reactions to study interactions in cells. Briefly, the GST pull-down assay usesrecombinant p53 fused to the GST protein, which can then bind to glutathionecoupled to agarose beads. Mixing GST-p53 with a recombinant protein ofinterest to test for binding or with cell lysates to pull out novel p53-interactingproteins is then done. On the other hand, co-IPs use p53-specific antibodiescoupled to protein A or G Sepharose to pull-down p53 from cell lysates. If aknown protein is being tested for p53 binding activity, then the co-IPs can bevisualized by running on sodium dodecyl sulfate-polyacrylamide gel electro-phoresis (SDS-PAGE) followed by Western blot analysis. Alternatively, toidentify novel p53-interacting proteins, the SDS-PAGE gel can be stained withsilver solution for example, followed by cutting out the novel protein bandsand subjecting them to protein sequencing.
2. Materials2.1. GST Protein–Protein Association Assay
1. LB broth (Fisher Scientific, Pittsburgh, PA, USA; cat. no. BP1426-2).2. Isopropyl- -D-thiogalactoside (IPTG): (Fisher Scientific; cat. no. BP1620-10).
Store in aliquots at –20°C.

124 Keller et al.
3. Phosphate-buffered saline (PBS) buffer 20X: 160 g NaCl, 4 g KCl, 23 gNa2HPO2·7H2O, 4 g KH2PO4. Store at room temperature.
4. PBS 1X: Prepare from 20X stock using water and store at 4°C.5. Glutathione–agarose beads (Sigma, St. Louis, MO, USA; cat. no. G-4510). Swell
the lyophilized powder with deionized water at room temperature for at least30 min (1 g swells to approx 14 mL gel). Wash and store beads in 1X PBS.
6. Protease inhibitors: 1 μg/mL aprotinin, 1 μg/mL leupeptin, 4 μM pepstatin A,0.2 mM phenylmethylsufonyl-fluoride (PMSF) (add fresh just before use).
7. Dithiothreitol (DTT): make 1 M stock in water and store in aliquots at –20°C.Add to buffers just before use to make a final concentration of 1 mM.
8. GST-lysis buffer: 1X PBS, 0.1% Nonidet® P-40 (NP40), 10% glycerol. Store at4°C. Add 1 mM DTT and protease inhibitors just before use.
9. GST-lysis buffer plus 500 mM NaCl: 1X PBS, 0.1% NP40, 10% glycerol, 500 mMNaCl. Store at 4°C. Add 1 mM DTT and protease inhibitors just before use.
10. SDS protein sample buffer 4X: 200 mM Tris-HCl, pH 6.8, 400 mM DTT, 2%SDS, 10% glycerol, 0.1% bromophenol blue, 0.1% xylene cyanol.
2.2. Immunoprecipitation of Cellular Proteins
1. PBS buffer 1X: see Subheading 2.1., item 4 above.2. Lysis buffer: 50 mM Tris-HCl, pH 8.0, 5 mM ethylenediamine tetraacetic acid
(EDTA), 150 mM NaCl, 0.5% NP40. Store at 4°C. Add 1 mM DTT and proteaseinhibitors just before use.
3. SNNTE buffer: 50 mM Tris-HCl, pH 7.4, 5 mM EDTA, 5% sucrose, 1% NP40,0.5 M NaCl. Store at 4°C. Add 1 mM DTT and protease inhibitors just before use.
4. RIPA buffer: 50 mM Tris-HCl, pH 7.4, 150 mM NaCl, 1% Triton® X-100, 0.1%SDS, 1% (w/v) Na Deoxycholate. Store at 4°C. Add 1 mM DTT and proteaseinhibitors just before use.
5. Protein G Sepharose® (Amersham Pharmacia Biotech, Piscataway, NJ, USA;cat. no. 17-0618-01). Store at 4°C.
6. Anti-MDM2 (Ab-3, monoclonal, clone 4B11) (Calbiochem-Novabiochem, SanDiego, CA, USA; cat. no. OP46).
7. Anti-MDM2 (C-18, rabbit polyclonal) (Santa Cruz Biotechnology, Santa Cruz,CA, USA; cat. no. sc-812).
8. Anti-p53 (Ab-1, monoclonal, clone PAb 421) (Calbiochem-Novabiochem; cat.no. OP03).
9. Anti-p53 (Ab-2, monoclonal, clone PAb 1801) (Calbiochem-Novabiochem; cat.no. OP09).
10. Anti-p53 (Ab-4, monoclonal, clone PAb 246) (Calbiochem-Novabiochem; cat.no. OP32).
11. Anti-p53 (FL-393, rabbit polyclonal) (Santa Cruz Biotechnology; cat. no. sc-6243).

p53-Interacting Proteins 125
3. Methods3.1. GST Protein–Protein Association Assay
The following protocol is adapted from refs. 54 and 55, with some modifi-cations (Fig. 1).
3.1.1. Purify GST-Fusion Proteins
1. Inoculate 5-mL starter cultures from single colonies of GST-fusion proteinand GST-0 (control GST empty vector) constructs. Grow overnight with shak-ing at 37°C.
2. Add starter cultures to 500 mL of LB broth and incubate with shaking at 37°Cuntil OD600 is between 0.6–0.8. Then add 500 μL 0.4 M IPTG to the cultures(final is 0.4 mM), and incubate for an additional 2–6 h.
3. Centrifuge cultures for 15 min at 5000g.4. Resuspend cell pellets in 25 mL GST-lysis buffer.5. Lyse cells by passage 2× through a French Press (see Note 1). Centrifuge lysates
for 20 min at 30,000g to pellet insoluble fraction.6. Incubate supernatents with 1 mL glutathione–agarose beads 50% slurry (500 μL
bead bed vol) for 5 min at room temperature.7. Centrifuge for 1 min at 1000g in swinging bucket rotor to pellet agarose beads.8. Wash beads 3× with the following buffers: (i) 25 mL GST-lysis buffer; (ii) 25 mL
GST-lysis plus 500 mM NaCl; and (iii) 25 mL GST-lysis buffer. During eachwash, incubate with rotation at room temperature for 5 min, followed by cen-trifugation for 1 min at 1000g.
9. Check protein expression and purity on SDS-PAGE with Coomassie® brilliantblue staining. Compare the levels of GST-fusion and GST-0 proteins on thestained gel, such that equal amounts are used in the pull-down assay. In addition,these proteins can be run alongside bovine serum albumin (BSA) as a proteinstandard in order to determine the protein concentration of the GST-fusion pro-tein. Titrate BSA in a range between 100 ng to 2 μg.
3.1.2. In Vitro GST-Fusion Protein Pull-Down Assay
This protocol calls for one protein to be immobilized on glutathione–agarosebeads, for example GST-p53, and another protein, for example a candidate p53-binding protein, to be expressed in a soluble form. The soluble protein can beeither in vitro translated (Transcription and translation [TNT]-coupled reticulo-cyte lysate system; Promega, Madison, WI, USA; cat. no. L4610) with 35Smethione (NEN® Life Science Products, Boston, MA, USA; cat no. NEG 709-A), purified by one of several established methods (6X histidine-tagged pro-

126 Keller et al.
teins; Qiagen, Valencia, CA, USA; cat. no. 30210, or intein-fusion proteins; NewEngland Biolabs, Beverly, MA, USA; cat. no. E6900S), or can be from cellnuclear extracts to identify novel p53-interacting proteins (see Note 2).
1. Combine GST-fusion protein (typically 1 μg) immobilized on glutathione–agar-ose beads with soluble protein (typically 5 μg or an excess of GST-fusion pro-tein) in 30 μL final vol of GST-lysis buffer. As a control sample, add only theGST-fusion protein without adding the soluble protein.
2. Incubate 45 min at room temperature with mixing (see Note 3).3. Following the incubation, wash 3× with GST-lysis buffer with light vortex mix-
ing each time (see Note 4). Pellet agarose beads by centrifugation in microfuge at5000g for 15 s.
4. Finally, remove supernatent and add 4X SDS loading buffer to a final of 1Xconcentration. Analyze protein interactions on SDS-PAGE and either stain withCoomassie brilliant blue or transfer to polyvinylidene difluoride (PVDF) mem-brane for Western blotting.
3.2. Immunoprecipitation
When dealing with an uncharacterized p53 binding protein, it is importantto test several antibodies for immunoprecipitation (IP) because: (i) the anti-body may interfere with the protein–protein interaction; and (ii) the p53 post-translational modifications, such as acetylation and phophorylation, maynegatively affect the antibody’s ability to bind. See Note 5 for information onp53 antibodies. For example, the PAb 421 epitope maps to amino acids 371–380,which is a region that is modified by acetylation, phosphorylation, andubiquination in cells after various stress-inducing agents. Though this antibodyworks well for IP, it may only recognize a subset of p53 molecules in the cellthat are unmodified in this region. PAb 246 recognizes p53 in a wild-type con-formation. This antibody also works well for IP, though it may be possible thatsome p53-interacting proteins may affect p53 conformation, such that thisantibody no longer recognizes it. The epitope for PAb 1801 is in the N terminalof p53, amino acids 46–55. Similar to PAb 421, this region is alsoposttranslationally modified after p53-activating agents. Refer to Fig. 1 for thestepwise procedure.
3.2.1. Prepare Cell Lysate
1. Aspirate the medium from the cultured cell plate and wash the cells 2× with cold1X PBS. Finally, add cold 1X PBS to each plate.
2. Scrape the cells from the plate using a plastic policeman. Transfer the suspen-sions to 15-mL tubes by pipet, followed by rewashing the plate with cold 1X PBSto both clean the policeman and to collect leftover cells in the plates. Collectiontubes should be stuck deeply into the ice during the procedure.

p53-Interacting Proteins 127
3. Centrifuge the cells in a swinging bucket rotor for 3–5 min at 3000g and 4°C topellet the cells. Aspirate the PBS, and then the cells are ready for IP or can bestored at –80°C for at least 1 mo.
4. Add 1.0 mL of cold lysis buffer per 107 cells. Resuspend the sample by vortexmixing and leave on ice for 20–30 min with occasional mixing. Transfer the lysateto a 1.5-mL tube and spin in a 4°C microfuge for 5–10 min at maximal speed.Transfer supernatant to a fresh tube and keep on ice.
3.2.2. Preclearing the Lysate
1. Add 30 μL of protein G Sepharose (50%) per 1.0 mL of lysate.2. Rotate at 4°C for 30–60 min. Spin in a 4°C microfuge for 15 s at 5000g.3. Carefully add supernatant to a new 1.5-mL tube or store at –80°C.
3.2.3. IP Reaction
1. Measure the protein concentration of the precleared cell lysate (see Note 6).2. In a 1.5-mL tube, combine at least 300 μg cell lysate with 1 μg antibody of choice
and 20 μL protein G Sepharose (50% slurry).3. Add lysis buffer to bring vol to 500 μL
Fig. 1. Schematic diagram showing GST-pull-down assay. IP is performed in asimilar manner if GST-beads are replaced with immunoaffinity beads. See text for thedetails on both assays.

128 Keller et al.
4. Rotate at 4°C for at least 2 h or overnight.5. Centrifuge samples in room temperature microfuge for 15 s at 5000g.6. Aspirate supernatent and wash beads with the following buffers (see Note 4)
with centrifugation between each time: (i) 1 mL lysis buffer; (ii) 1 mL SNNTEbuffer; (iii) 1 mL SNNTE buffer; and (iv) 1 mL lysis buffer.
7. Finally, aspirate supernatent and quickly spin the sample. Use a pipet to carefullyremove excess supernatent, leaving approx 20 μL total vol in the tube. Add 4XSDS sample buffer to a final of 1X concentration. The samples are now ready tobe boiled and loaded onto SDS-PAGE, followed by Western blotting analysis(see Note 7).
4. Notes1. Bacterial cell lysis can be performed several ways, including French Press, soni-
cation, and freeze-thaw, as described in Current Protocols in Molecular Biology(55). We use a Spectronic Unicon French Pressure System with a 40-K manual-fill cell (FA-031) at an internal pressure of 20,000 psi.
2. To identify novel p53-interacting proteins, one can use either whole cell lysates(see Subheading 3.2.1.) or nuclear extracts. Nuclear extract preparations havebeen described elsewhere (56,57). The lysate or extract should be incubatedas described in Subheading 3.1.2. with beads containing either GST only orGST-p53 fusion protein. Additionally, an unrelated GST-fusion protein can alsobe used as a control. After running the samples on SDS-PAGE and afterCoomassie brilliant blue or silver staining, proteins found only in the GST-p53lane can be cut out of the gel and sent out for peptide sequencing by massspectrometry, for example.
3. We perform mixing of GST-fusion proteins immobilized on glutathione–agarosein Eppendorf® tubes using a vortex mixer with a 3-in. rubber platform attach-ment. We place the Eppendorfs in a Fisherbrand Flat Rack held on by a rubberband while vortex mixing at low speed (Fisher Scientific; cat. no. 05-544-4)or alternatively use an attachable platform head that holds Eppendorf tubes(Fisher Scientific; cat. no. 12-812B).
4. Wash conditions will vary depending on the proteins tested, and so variouswash buffers should be tested in order to maximize binding while minimizingbackground. Many protein–protein interactions are salt-dependent, while otherinteractions are hydrophobic in nature. Thus, using high ionic-strength washesmay be good in some cases, while low ionic-strength washes will be good inothers. For GST pull-down assays, the wash buffers we commonly use are: (i)GST-lysis buffer; (ii) GST-lysis plus 500 mM NaCl, to remove backgroundproteins whose interactions are salt-sensitive; (iii) 1:3 diluted GST-lysis bufferin water, to remove background proteins whose interactions are hydrophobic;and (iv) RIPA buffer, which is a stringent wash good for removing backgroundwhen using in vitro translated proteins with 35S-methione label. For IPs, weuse: (i) Lysis buffer, (ii) SNNTE (high salt); (iii) 1:3 diluted lysis buffer inwater (low salt); and (iv) RIPA.

p53-Interacting Proteins 129
5. There are many antibodies to choose from when performing an IP of p53. Fourare listed in Subheading 2., including PAb 421, PAb 246, PAb 1801, and anti-p53 polyclonal. We typically use the first three for IPs, though there are others aslisted in the Calbiochem-Novabiochem catalog.
6. To determine protein concentrations, we use the 5X protein assay dye from Bio-Rad (Hercules, CA, USA; cat. no. 500-0006) by diluting it in water to 1X con-centration. We add 1 mL of 1X protein dye reagent to a 5-mL tube (Sarstedt,Newton, NC, USA; cat. no. 55.476), add 2 μL of cell lysate, vortex mix briefly,leave it at room temperature 5 min, transfer each solution into a 1-mL plasticcuvette, and then measure the color change by spectrophotometer set to wave-length 595 nm. A standard curve should be made using a purified protein ofknown concentration such as BSA. We have found that as an estimation of pro-tein concentration, the following conversion works well:protein concentration = (20 μL/? μL) × OD595 = [protein] μg/μL where ? equalsthe amount of lysate added to the protein assay reagent. For example, if 2 μL ofcell lysate were added to the reagent, and the OD595 was 0.2, then:protein concentration = (20 μL/2μL) × 0.2 = 2 μg/μL.
7. When the IP reactions are run on SDS-PAGE and analyzed by Western blotting,often the immunoglobulin (IgG) heavy chain signal is very prominent. Dependingupon the molecular weight of your protein of interest, the IgG signal may overlap.This is especially true for p53, which migrates just above the IgG heavy chain.To avoid this problem, it is beneficial to perform the IP with a monoclonal anti-body, e.g., PAb421, followed by Western blot analysis with a polyclonalantibody, e.g., anti-p53 p.c. The opposite is true as well, e.g., using a polyclonalantibody for IP followed by a monoclonal antibody for Western blotting.
Acknowledgments
D. Keller is supported by the National Eye Institute (NEI) predoctoral fel-lowship. This work is supported partly by National Institutes of Health (NIH)R01 and ACS grants to H. Lu.
References
1. Ko, L. J. and Prives, C. (1996) p53: puzzle and paradigm. Genes Dev. 10,1054–1072.
2. Vogelstein, B., Lane, D., and Levine, A. J. (2000) Surfing the p53 network. Nature408, 307–310.
3. Chen, X., Farmer, G., Zhu, H., Prywes, R., and Prives, C. (1993) CooperativeDNA binding of p53 with TFIID (TBP): a possible mechanism for transcriptionalactivation. Genes Dev. 7, 1837–1849.
4. Horikoshi, N., Usheva, A., Chen, J., Levine, A. J., Weinmann, R., and Shenk, T.(1995) Two domains of p53 interact with the TATA-binding protein, and theadenovirus 13S E1A protein disrupts the association, relieving p53- mediated tran-scriptional repression. Mol. Cell. Biol. 15, 227–234.

130 Keller et al.
5. Lu, H. and Levine, A. J. (1995) Human TAFII31 protein is a transcriptionalcoactivator of the p53 protein. Proc. Natl. Acad. Sci. USA 92, 5154–5158.
6. Thut, C. J., Chen, J. L., Klemm, R., and Tjian, R. (1995) p53 transcriptional acti-vation mediated by coactivators TAFII40 and TAFII60. Science 267, 100–104.
7. Gu, W., Shi, X. L., and Roeder, R. G. (1997) Synergistic activation of transcrip-tion by CBP and p53. Nature 387, 819–823.
8. Lill, N. L., Grossman, S. R., Ginsberg, D., DeCaprio, J., and Livingston, D. M.(1997) Binding and modulation of p53 by p300/CBP coactivators. Nature 387,823–827.
9. Jayaraman, L., Murthy, K. G., Zhu, C., Curran, T., Xanthoudakis, S., and Prives,C. (1997) Identification of redox/repair protein Ref-1 as a potent activator of p53.Genes Dev. 11, 558–570.
10. D’Orazi, G., Cecchinelli, B., Bruno, T., et al. (2002) Homeodomain-interactingprotein kinase-2 phosphorylates p53 at Ser 46 and mediates apoptosis. Nat. CellBiol. 4, 11–19.
11. Hofmann, T. G., Moller, A., Sirma, H., et al. (2002) Regulation of p53 activityby its interaction with homeodomain- interacting protein kinase-2. Nat. Cell Biol.4, 1–10.
12. Chen, J., Marechal, V., and Levine, A. J. (1993) Mapping of the p53 and mdm-2interaction domains. Mol. Cell. Biol. 21, 4107–4114.
13. Haupt, Y., Maya, R., Kazaz, A., and Oren, M. (1997) Mdm2 promotes the rapiddegradation of p53. Nature 387, 296–299.
14. Kubbutat, M. H., Jones, S. N., and Vousden, K. H. (1997) Regulation of p53stability by Mdm2. Nature 387, 299–303.
15. de Oca Luna, R. M., Tabor, A. D., Eberspaecher, H., et al. (1996) The organiza-tion and expression of the mdm2 gene. Genomics 33, 352–357.
16. Bell, D. W., Varley, J. M., Szydlo, T. E., et al. (1999) Heterozygous germ linehCHK2 mutations in Li-Fraumeni syndrome. Science 286, 2528–2531.
17. Canman, C. E., Lim, D. S., Cimprich, K. A., et al. (1998) Activation of the ATMkinase by ionizing radiation and phosphorylation of p53. Science 281, 1677–1679.
18. Chehab, N. H., Malikzay, A., Stavridi, E. S., and Halazonetis, T. D. (1999) Phos-phorylation of Ser-20 mediates stabilization of human p53 in response to DNAdamage. Proc. Natl. Acad. Sci. USA 96, 13,777–13,782.
19. Hirao, A., Kong, Y. Y., Matsuoka, S., et al. (2000) DNA damage-induced acti-vation of p53 by the checkpoint kinase Chk2. Science 287, 1824–1827.
20. Shieh, S. Y., Ikeda, M., Taya, Y., and Prives, C. (1997) DNA damage-inducedphosphorylation of p53 alleviates inhibition by MDM2. Cell 91 325–334.
21. Unger, T., Juven-Gershon, T., Moallem, E., et al. (1999) Critical role for Ser20 ofhuman p53 in the negative regulation of p53 by Mdm2. EMBO J. 18, 1805–1814.
22. Leveillard, T., Andera, L., Bissonnette, N., et al. (1996) Functional interactionsbetween p53 and the TFIIH complex are affected by tumour-associated muta-tions. EMBO J. 15, 1615–1624.
23. Wang, X. W., Yeh, H., Schaeffer, L., et al. (1995) p53 modulation of TFIIH-associated nucleotide excision repair activity. Nat. Genet. 10, 188–195.

p53-Interacting Proteins 131
24. Xiao, H., Pearson, A., Coulombe, B., et al. (1994) Binding of basal transcriptionfactor TFIIH to the acidic activation domains of VP16 and p53. Mol. Cell. Biol.14, 7013–7024.
25. Filhol, O., Baudier, J., Delphin, C., Loue-Mackenbach, P., Chambaz, E. M., andCochet, C. (1992) Casein kinase II and the tumor suppressor protein P53 associatein a molecular complex that is negatively regulated upon P53 phosphorylation.J. Biol. Chem. 267, 20,577–20,583.
26. Fuchs, S. Y., Adler, V., Buschmann, T., et al. (1998) JNK targets p53ubiquitination and degradation in nonstressed cells. Genes Dev. 12, 2658–2663.
27. An, W. G., Kanekal, M., Simon, M. C., Maltepe, E., Blagosklonny, M. V., andNeckers, L. M. (1998) Stabilization of wild-type p53 by hypoxia-inducible factor1alpha. Nature 392, 405–408.
28. Waterman, M. J., Stavridi, E. S., Waterman, J. L., and Halazonetis, T. D. (1998)ATM-dependent activation of p53 involves dephosphorylation and associationwith 14-3-3 proteins. Nat. Genet. 19, 175–178.
29. Iwabuchi, K., Bartel, P. L., Li, B., Marraccino, R., and Fields, S. (1994) Twocellular proteins that bind to wild-type but not mutant p53. Proc. Natl. Acad. Sci.USA 91, 6098–6102.
30. Jayaraman, L., Moorthy, N. C., Murthy, K. G., Manley, J. L., Bustin, M., andPrives, C. (1998) High mobility group protein-1 (HMG-1) is a unique activator ofp53. Genes Dev. 12, 462–472.
31. Sarnow, P., Ho, Y. S., Williams, J., and Levine, A. J. (1982) Adenovirus E1b-58kd tumor antigen and SV40 large tumor antigen are physically associated withthe same 54 kd cellular protein in transformed cells. Cell 28, 387–394.
32. Zantema, A., Schrier, P. I., Davis-Olivier, A., van Laar, T., Vaessen, R. T., andvan der, E. A. (1985) Adenovirus serotype determines association and localiza-tion of the large E1B tumor antigen with cellular tumor antigen p53 in trans-formed cells. Mol. Cell. Biol. 5, 3084–3091.
33. Szekely, L., Selivanova, G., Magnusson, K. P., Klein, G., and Wiman, K. G.(1993). EBNA-5, an Epstein-Barr virus-encoded nuclear antigen, binds to the re-tinoblastoma and p53 proteins. Proc. Natl. Acad. Sci. USA 90, 5455–5459.
34. Feitelson, M. A., Zhu, M., Duan, L. X., and London, W. T. (1993) Hepatitis B xantigen and p53 are associated in vitro and in liver tissues from patients withprimary hepatocellular carcinoma. Oncogene 8, 1109–1117.
35. Wang, X. W., Forrester, K., Yeh, H., Feitelson, M. A., Gu, J. R., and Harris, C. C.(1994) Hepatitis B virus X protein inhibits p53 sequence-specific DNA binding,transcriptional activity, and association with transcription factor ERCC3. Proc.Natl. Acad. Sci. USA 91, 2230–2234.
36. Crook, T., Tidy, J. A., and Vousden, K. H. (1991) Degradation of p53 can betargeted by HPV E6 sequences distinct from those required for p53 binding andtrans-activation. Cell 67, 547–556.
37. Werness, B. A., Levine, A. J., and Howley, P. M. (1990) Association of humanpapillomavirus types 16 and 18 E6 proteins with p53. Science 248, 76–79.
38. Lane, D. P. and Crawford, L. V. (1979) T antigen is bound to a host protein inSV40-transformed cells. Nature 278, 261–263.

132 Keller et al.
39. Linzer, D. I. and Levine, A. J. (1979) Characterization of a 54K dalton cellularSV40 tumor antigen present in SV40-transformed cells and uninfected embryonalcarcinoma cells. Cell 17, 43–52.
40. Luo, J., Su, F., Chen, D., Shiloh, A., and Gu, W. (2000) Deacetylation of p53modulates its effect on cell growth and apoptosis. Nature 408, 377–381.
41. Murphy, M., Ahn, J., Walker, K. K., et al. (1999) Transcriptional repression bywild-type p53 utilizes histone deacetylases, mediated by interaction with mSin3a.Genes Dev. 13, 2490–2501.
42. Liu, Y., Colosimo, A., Yang, X., and Liao, D. (2000) Adenovirus E1B 55-kilodalton oncoprotein inhibits p53 acetylation by PCAF. Mol. Cell. Biol. 20,5540–5553.
43. Zilfou, J. T., Hoffman, W. H., Sank, M., George, D. L., and Murphy, M. (2001).The corepressor mSin3a interacts with the proline-rich domain of p53 and pro-tects p53 from proteasome-mediated degradation. Mol. Cell. Biol. 21, 3974–3985.
44. Luo, J., Nikolaev, A., Imai, S., et al. (2001) Negative control of p53 by Sir2 pro-motes cell survival under stress. Cell 107, 137–148.
45. Vaziri, H., Dessain, S., Ng Eaton, E., et al. (2001) hSIR2SIRT1 functions as anNAD-dependent p53 deacetylase. Cell 107, 149–159.
46. Huibregtse, J. M., Scheffner, M., and Howley, P. M. (1993) Cloning and expres-sion of the cDNA for E6-AP, a protein that mediates the interaction of the humanpapillomavirus E6 oncoprotein with p53. Mol. Cell. Biol. 13, 775–784.
47. Li, M., Chen, D., Shiloh, A., et al. (2002) Deubiquitination of p53 by HAUSP isan important pathway for p53 stabilization. Nature 31, 31.
48. Oliner, J. D., Pietenpol, J. A., Thiagalingam, S., Gyuris, J., Kinzler, K. W., andVogelstein, B. (1993). Oncoprotein MDM2 conceals the activation domain oftumour suppressor p53. Nature 362, 857–860.
49. Dutta, A., Ruppert, J. M., Aster, J. C., and Winchester, E. (1993) Inhibition ofDNA replication factor RPA by p53. Nature 365, 79–82.
50. He, Z., Brinton, B. T., Greenblatt, J., Hassell, J. A., and Ingles, C. J. (1993) Thetransactivator proteins VP16 and GAL4 bind replication factor A. Cell 73,1223–1232.
51. Li, R. and Botchan, M. R. (1993) The acidic transcriptional activation domains ofVP16 and p53 bind the cellular replication protein A and stimulate in vitro BPV-1 DNA replication. Cell 73, 1207–1221.
52. Gaiddon, C., Lokshin, M., Ahn, J., Zhang, T., and Prives, C. (2001) A subset oftumor-derived mutant forms of p53 down-regulate p63 and p73 through a directinteraction with the p53 core domain. Mol. Cell. Biol. 21, 1874–1887.
53. Shvarts, A., Steegenga, W. T., Riteco, N., et al. (1996) MDMX: a novel p53-binding protein with some functional properties of MDM2. EMBO J. 15,5349–5357.
54. GST gene fusion system manual, Pharmacia Biotech, Inc., 3rd ed., revision 3, 18-1123-20.
55. Ausubel, F. M., Brent, R., Kingston, R. E., et al. (eds.) (1998) Current Protocolsin Molecular Biology, Vol. 3, Unit 16, John Wiley & Sons, New York.

p53-Interacting Proteins 133
56. Dignam, J. D., Lebovitz, R. M., and Roeder, R. G. (1983) Accurate transcriptioninitiation by RNA polymerase II in a soluble extract from isolated mammaliannuclei. Nucleic Acids Res. 11, 1475–1489.
57. Ausubel, et al. (eds.) (1998) Current Protocols in Molecular Biology, Vol. 2, Unit12. John Wiley & Sons, New York.

p53 and Adenovirus EIB-55 KDa 135
135
From: Methods in Molecular Biology, vol. 234: p53 ProtocolsEdited by: S. Deb and S. P. Deb © Humana Press Inc., Totowa, NJ
10
Interaction of p53with the Adenovirus E1B-55 kDa Protein
Judith Roth and Matthias Dobbelstein
SummaryThe E1B-55 kDa oncoprotein of adenovirus type 5 targets the tumor suppressor protein p53.
This includes four distinct activities: (i) biochemical interaction of E1B-55 kDa with p53; (ii)inhibition of p53-induced transcription; (iii) relocalization of p53 from the nucleus to the cyto-plasm; and (iv) in the simultaneous presence of E1B-55 kDa and the adenovirus E4-34 kDa(E4orf6) protein, extensive destabilization of p53. These activities can be observed experimen-tally, using co-immunoprecipitation of p53 with E1B-55 kDa, luciferase reporter assay of p53activity, immunofluorescence to localize p53 and E1B-55 kDa, and immunoblot analysis ofp53 levels. These experimental systems can be useful when analyzing novel interaction part-ners and modulators of p53, or in deciding whether adenovirus oncoproteins interact with novelgrowth regulatory proteins. Protocols describing the four methods are provided in this chapter.
Key Wordsadenovirus, destabilization, immunoblot, immunofluorescence, immunoprecipitation,
luciferase, oncoprotein, p53, relocalization, reporter assay
1. IntroductionSmall DNA tumor viruses have evolved early gene products that mediate
the transformation of primary cells in vitro and the induction of malignanttumors in animals. Adenovirus type 5 expresses three major transforming pro-teins from its E1 region, and each of them binds and inactivates cellular tumorsuppressor gene products (1). In addition, the E4 region encodes proteins thatcan further contribute to malignant transformation (2).
The oncoprotein E1B-55 kDa of adenovirus type 5 specifically targets thep53 protein. In particular, the following phenomena can be observed as conse-quences of the interaction between the two proteins.
1. A specific complex is formed that contains E1B-55 kDa and p53 (3) (see Notes1–6).

136 Roth and Dobbelstein
2. The N-terminal transactivation domain of p53 is bound by E1B-55 kDa and ren-dered inactive (4). Therefore, p53-mediated transcription is compromized. More-over, E1B-55 kDa contains a transcriptional repression domain that furtherreduces p53 activity when the complex of p53 and E1B-55 kDa binds to a p53-responsive promoter (5) (see Notes 7–15).
3. p53 is relocalized from the nucleus to the cytoplasm, where it co-localizes withE1B-55 kDa in discrete cluster-like structures (6,7) (see Notes 16–23).
4. When the E4-34 kDa protein of adenovirus type 5 (the product of E4 open read-ing frame 6) is present in addition to E1B-55 kDa, this strongly destabilizes p53(8–11) through ubiquitination and proteasome-mediated degradation (12). Thecooperation of E1B-55 kDa and E4orf6 is likely based on their ability to form acomplex (13) that is predominantly localized in the nucleus (14) but capable ofundergoing nucleocytoplasmic shuttling (15). The E1B-55 kDa and E4-34 kDaproteins are part of a larger complex that contains cullin family member Cul5,elongins B and C, and the RING-H2 finger protein Rbx1(ROC1) and mediatesp53 ubiquitination (12) (see Notes 24–30).
These four phenomena can each be addressed experimentally, using the fol-lowing methods:
1. Immunoprecipitation, to detect of a complex containing p53 and E1B-55 kDa(Notes 1–6).
2. Reporter assays, to detect the inhibitory effect of E1B-55 kDa on p53-mediatedtranscription (Notes 7–15).
3. Immunofluorescence, to detect the intracellular relocalization of p53 by E1B-55kDa (Notes 16–23).
4. Immunoblot analysis, to detect the destabilization of p53 by E1B-55 kDa and E4-34 kDa (Notes 24–30).
The reader might use these methods for the following reasons:
1. The E1B-55 kDa protein represents a useful and well-studied example of a nega-tive regulator for p53. Therefore, it can serve as a positive control when analyz-ing a different putative viral or cellular modulator of p53 activity. Such regulatorsinclude the oncoproteins from other DNA tumor viruses, simian virus 40 (SV40)T antigen and papillomavirus E6 proteins, as well as the cellular mdm2 protein(for review, see ref. 16).
2. Vice versa, E1B-55 kDa may target more cellular proteins in addition to p53. Thetechniques outlined below can be followed to investigate the existence of suchadditional interactions. For instance, it was found that, unlike p53, the p53-ho-mologue p73 did not detectably interact with E1B-55 kDa by any of these assays(10,11,17–19) nor did the p63 proteins (11). Failure to interact with E1B-55 kDawas one of the first indications that p53-homologues have different functionsthan p53 itself. Since E1B-55 kDa has evolved to affect cell growth and death,any novel cellular target of it would represent a strong candidate for a cellulargrowth regulatory protein.

p53 and Adenovirus EIB-55 KDa 137
2. Materials2.1. Co-Immunoprecipitation of p53with Adenovirus-E1B-55 kDa (see Notes 1–6)
1. Lysis buffer: 50 mM Tris-HCl, pH 7.5, 150 mM NaCl, 5 mM ethylenediaminetetraacetic acid (EDTA), 0.05% bovine serum albumin, and 0.01% Nonidet®P-40. Store <1 wk at 4°C after adding bovine serum albumin and Nonidet P-40.Can be stored at least 1 yr without these components.
2. 6X Laemmli buffer: 350 mM Tris-HCl, pH 6.8, 30% (v/v) glycerol, 10% (w/v)sodium dodecyl sulfate (SDS), 9.3% (w/v) dithiotreitol (DTT), and 0.012% (w/v)bromophenol blue. Store in aliquots at –20°C (up to 1 yr), but heat to 37°C for10 min after thawing to redissolve SDS and DTT.
3. Human embryonic kidney 293 cells (HEK293 cells) from ATCC (Manassas, VA,USA).
4. Dulbecco’s modified Eagle media (DMEM) (Life Technologies [Rockville, MD,USA] or home-made brands).
5. The monoclonal mouse antibody 2A6 against Ad5 E1B-55 kDa (20), hybridomasupernatant kindly provided by A. J. Levine, Rockefeller University.
6. The plasmid pOS7-p53 to express p53 by transcription and translation in vitrowas obtained from N. Horikoshi and T. Shenk, Princeton. The vector pOS7 con-tains a T7 promoter that is recognized by the corresponding phage RNA poly-merase, followed by an internal ribosomal entry site from echomyocarditis virusand a multiple cloning site. The plasmid contains the ampicillin resistance gene(bla) and the the pBR322 origin of replication, yielding low-to-moderate copynumbers when grown in Escherichia coli.
7. TNT® T7-coupled reticulocyte lysate system (Promega, Madison, WI, USA; cat.no. L4610). L-[35S]methionine (555 Mbq/mL, >37 TBq/mmol; AmershamPharmacia Biotech, Piscataway, NJ, USA; cat. no. AG1094).
8. Protein A Sepharose® (supplied as dry powder; Sigma, St. Louis, MO, USA).
2.2. Reporter Assay to Measure the Inhibition of p53 Activityby E1B-55 kDa (see Notes 7–15)
1. H1299 cells (human adenocarcinoma of the lung; p53 –/–; ATCC).2. The reporter plasmid pGL2-BP100 was generated by cloning the p53-binding
region of the mdm2-promoter, together with a minimal promoter comprisingTATA box and initiator region, into the reporter plasmid pGL2basic (Promega),as described (21).
3. Expression plasmid pCGN-E1B-55 kDa (15). The vector plasmid pCGN,obtained from H. Zhu and R. Prywes, Columbia University, New York, is derivedfrom the vector pCG (22) and contains the cytomegalovirus (CMV) major imme-diate early promoter, a herpes simplex virus (HSV) thymidine kinase 5'untranslated region (UTR), and the coding region of the hemagglutinine (HA)-tag immediately after the start codon. This is followed by a multiple cloning site,an intron from the rabbit -globin gene, and a polyadenylation site. The plasmid

138 Roth and Dobbelstein
contains the ampicillin resistance gene (bla) and the colE1 origin of replication,yielding high copy numbers when grown in E. coli.
4. Expression plasmid pRcCMV-p53 (23); the vector plasmid pRcCMV came fromInvitrogen (Carlsbad, CA, USA). The transfection reagent LIPOFECTAMINE 2000was obtained from Invitrogen Life Technologies.
5. Reporter lysis buffer and luciferase substrate solution (Promega; cat. no. E1501).
2.3. Visualized Intracellular Relocalization of p53by E1B-55 kDa (see Notes 16–23)
1. 4-Well chamber slides for cell culture, with removable gasket (Nalge Nunc Inter-national, Rochester, NY, USA; cat. no. 177437).
2. Phosphate-buffered saline (PBS): 236.9 mM NaCl, 2.7 mM KCl, 8.1 mM Na2HPO4,1.1 mM MgCl2, 1.5 mM KH2PO4, 1.2 mM CaCl2. Store up to 1 yr at 4°C.
3. Fixing solution: 236.9 mM NaCl, 2.7 mM KCl, 8.1 mM Na2HPO4, 1.5 mMKH2PO4, 4% w/v paraformaldehyde. Dissolve paraformaldehyde by briefly heat-ing to approx 70°C under a fume hood, until the solution is no longer turbid, thencool to room temperature. Can be stored at least 1 yr in aliquots at –20°C.
4. Blocking solution: PBS supplemented with 10% (v/v) fetal bovine serum or new-born calf serum.
5. Monoclonal mouse antibody HA.11 against the hemagglutinine HA-tag, rawascites fluid (Berkeley Antibody Company [BabCO], Richmond, CA, USA).
6. Polyclonal rabbit antibody FL-393 against p53 (Santa Cruz Biotechnology, SantaCruz, CA, USA).
7. Monoclonal mouse antibody 2A6 against Ad5 E1B-55 kDa (20), hybridomasupernatant kindly provided by A. J. Levine, Rockefeller University, New York.
8. Alexa 488 coupled anti-mouse immunoglobulin (IgG) and Alexa 594 coupledanti-rabbit IgG secondary antibodies (Molecular Probes, Eugene, OR, USA).
9. Mounting medium: Fluoprep (bioMerieux, Hazlewood, MO, USA) supplementedwith 2.5% (w/v) 1,4-diazabicyclo [2.2.2]octane (DABCO; used as a stabilizer offluorescence). Stir until completely dissolved, then let stand to remove airbubbles. Store in the original Fluoprep flask.
2.4. Destabilization of p53 by E1B-55 kDa and E4-34 kDa,Detected by Immunoblot (see Notes 24–30)
1. RIPA-buffer: 20 mM Tris-HCl, pH 8.0, 150 mM NaCl, 10 mM EDTA, 10 mMiodacetamide, 1% (v/v) Triton®-X-100, 1% (w/v) Desoxycholic acid, 0.1% (w/v)SDS. Store at 4°C, stable at least 1 yr.
2. Milk: PBS supplemented with 5% (w/v) milk powder and 0.05% (v/v) Tween® 20.Make fresh and use within 24 h.
3. Super Signal Ultra (Pierce Chemical, Rockford, IL, USA) chemiluminescent sub-strate for peroxidase.
4. Monoclonal mouse antibody Pab1801 against p53 (Calbiochem-Novabiochem,San Diego, CA, USA).

p53 and Adenovirus EIB-55 KDa 139
5. Expression plasmids as in 2B, in addition the plasmid pCMVE4orf6, obtainedfrom T. Dobner and T. Shenk, Princeton. The vector pCMVneoBam (24) con-tains the CMV major immediate early promoter, followed by an intron from therabbit -globin gene, a BamHI cloning site to accommodate the insert, and apolyadenylation signal. The plasmid contains the ampicillin resistance gene (bla)and the the pBR322 origin of replication, yielding moderate copy numbers whengrown in E. coli.
3. Methods3.1. Co-Immunoprecipitation of p53 with Adenovirus-E1B-55 kDa (seeNotes 1–6)
All quantities are indicated for one sample. A typical experiment will includeseveral samples, such as a positive control (wild-type p53 and HEK cells) andnegative controls (replacing wild-type p53 with the mutant p53L22Q/W23S,which is unable to bind E1B-55 kDa [23] and/or replacing HEK293 cells with,e.g., HeLa cells, which do not contain E1B-55 kDa). The quantities should bescaled up accordingly.
1. Expand HEK293 cells (express E1B-55 kDa) in flasks or dishes; 2 × 10⁶ cells/sample will be needed. Prepare cell lysate for one more sample than required in theexperiment, since some loss will occur during preparation and centrifugation steps.
2. Prepare p53 by in vitro transcription and translation, using the expression plasmidpOS7-p53 and the TNT T7-coupled reticulocyte lysate system, adding 35S-methion-ine, exactly as described in the TNT manual. Ten microliters of programmedreticulocyte lysate will be required per sample.
3. Wash cells once with PBS at room temperature.4. Add 1 mL of PBS and harvest cells by scraping with a rubber policeman.5. Transfer the cell suspension to a 1.5-mL Eppendorf® tube and spin for 5 min at
800g in a tabletop centrifuge (Eppendorf Scientific, Westbury, NY, USA).Remove supernatant.
6. Add 1 mL of PBS to the flask/dish to suspend the remaining cells. Transfer to thesame Eppendorf tube, spin, and remove supernatant as in the previous step.
7. Resuspend cells in 100 μL lysis buffer by pipeting up and down 5×. Combine thelysate from 3–5 samples in one 1.5-mL tube.
8. Pass through an insulin syringe (1-mL syringe; 0.45 × 12 mm needle) back andforth 5×. This is possible without excessive loss, if at least three samples (300 μLtotal) are combined and processed together. Avoid foaming. Avoid spilling, whichcan easily occur, when the fluid is released from the syringe back into the tube.
9. Spin for 5 min at 14,000g in a tabletop centrifuge at 4°C. Transfer supernatant toa new 1.5-mL Eppendorf tube. Discard pellet. Avoid the transfer of any particu-lar material, rather leave some 30 μL back in the first tube, and try not to touchthe wall of the tube with the pipet tip.
10. Repeat the previous step to remove any residual insoluble material.

140 Roth and Dobbelstein
11. Re-aliquot HEK 293 cell lysate into samples of 100 μL (aliquots can be stored at–70°C at least 1 yr if desired; however, any precipitate that may have formedafter thawing should be removed by centrifugation as in step 9). Add 10 μL ofreticulocyte lysate containing radioactively labeled p53. Mix by gentle vortexmixing and incubate at 30°C for 30 min.
12. To each sample, add 660 μL lysis buffer and 100 μL DMEM.13. Swell protein A Sepharose beads in PBS (can be stored at 4°C for 1 wk), then
gently centrifuge (e.g., in a 15-mL conical tube, using a swing-out rotor at 1400gfor 5 min) and remove supernatant. Wash 2× with lysis buffer. Resuspend in lysisbuffer to obtain a suspension containing approx 30% packed vol of beads. Add90 μL of this suspension to each sample. Use a pipet tip that has been “widened”by cutting off the thinnest part, and vortex mix the bead suspension between eachpipeting step to ensure even distribution of the beads.
14. Incubate 20 min at 4°C with gentle agitation (slow-moving rotator) for preclearing.15. Spin for 1 min at 14,000g in a tabletop centrifuge at 4°C. Transfer supernatant to
a new 1.5-mL Eppendorf tube. Discard pellet.16. Add antibody against E1B-55 kDa, 20 μL of a 2A6 hybridoma supernatant.17. Briefly vortex mix, then incubate for 2 h at 4°C with gentle agitation (slow-mov-
ing rotator).18. Add 30 μL of the beads suspension (10 μL packed vol of beads) to each sample,
as described in step 13. It is essential that all samples receive the same amount ofbeads. This can be checked by briefly spinning the tubes and comparing the sizeof the pellets.
19. Briefly vortex mix, then incubate for 2 h at 4°C with gentle agitation (slow-mov-ing rotator).
20. Spin for 1 min at 14,000g in a tabletop centrifuge at 4°C. Discard supernatantinto the radioactive waste, but leave approx 50 μL in tube, and avoid removingany beads. If desired, keep 20 μL for analysis of supernatant.
21. Add 500 μL of lysis buffer. Vortex mix for 1 min. It is preferable to use a devicefor vortex mixing several tubes simultaneously, to ensure equal washing condi-tions for each sample. For example, use an automated Eppendorf mixer, if avail-able. Spin for 1 min at 14,000g in a tabletop centrifuge at 4°C. Discardsupernatant into the radioactive waste, but leave approx 50 μL in tube, and avoidremoving any beads.
22. Repeat the previous washing step.23. Repeat the previous washing step 2×, but use lysis buffer that was supplemented
with 0.5% (instead of 0.05%) (w/v) bovine serum albumin. This will decreasebackground precipitation, conceivably by blocking nonspecific binding sites onthe beads.
24. Repeat the previous washing step 2× using nonsupplemented lysis buffer.25. Remove residual buffer using an insulin syringe (1 mL syringe; 0.45 × 12 mm).
Avoid the removal of any beads by moving slowly and by pressing the needlewith the open end against the wall of the tube.
26. Add 30 μL of 6X Laemmli buffer, mix by gentle vortex mixing and boil at 95°C

p53 and Adenovirus EIB-55 KDa 141
for 3 min. Vortex mix briefly, then spin for 1 min at 1400g in a tabletop centri-fuge at room temperature.
27. Apply 10 μL of the samples to a 10% SDS polyacrylamide gel and run.28. Fix gel for 15 min in 30% methanol/10% acetic acid, then place on 3 layers of
Whatman paper (Whatman, Clifton, NJ, USA) and cover with Saran® wrap. Donot place Saran wrap underneath the gel. Dry under vacuum, and while heating(takes approx 3 h), expose to X-ray film or a BioImager™/PhosphorImager®plate (Molecular Dynamics, Sunnyvale, CA, USA).
3.2. Reporter Assay to Measure the Inhibition of p53 Activityby E1B-55 kDa (see Notes 7–15)
1. The day before transfection, seed four wells in a 6-well dish (one well has adiameter of 3.5 cm) with H1299 cells (105/well).
2. Assemble the following mixtures of plasmids:
a. 100 ng pGL2BP100, 50 ng pRcCMV, 2.2 μg pCGN.b. 100 ng pGL2BP100, 50 ng pRcCMV, 2.2 μg pCGN-E1B-55 kDa.c. 100 ng pGL2BP100, 50 ng pRcCMV-p53, 2.2 μg pCGN.d. 100 ng pGL2BP100, 50 ng pRcCMV-p53, 2.2 μg pCGN-E1B-55 kDa.
3. Transfect each well with one of the mixtures, using LIPOFECTAMINE 2000 exactlyas recommended by the manufacturer. Leave the cells in 2 mL/well of DMEM/10% fetal calf serum (FCS).
4. After 24 h, harvest by scraping off the attached cells into the culture media. Trans-fer 1 mL of the cell suspension to an Eppendorf tube. Spin at 800g for 2 min in atabletop centrifuge. Gently remove supernatant. Transfer the rest of the cell sus-pension to the same tube and repeat centrifugation. Gently remove supernatantand briefly vortex mix the dry pellet. Add 100 μL of reporter lysis buffer andvortex mix briefly. Let stand for 15 min on ice. Vortex mix briefly and centrifugeat 14,000g for 1 min. Transfer supernatant to new tube (can be stored at 4°C forseveral hours or at –20°C indefinitely).
5. Quantitate luciferase activity in a luminometer. Expect little difference between(a) and (b), an approx 100-fold increase comparing (a) and (c), and a 5- to 10-folddecrease when comparing (c) and (d).
3.3. Visualized Intracellular Relocalization of p53by E1B-55 kDa (see Notes 16–23)
1. The day before transfection, seed 5 × 10⁴ H1299 cells in each well of a 4-wellchamber slide.
2. Assemble the following mixtures of plasmids:
a. 50 ng pRcCMV, 500 ng pCGN.b. 50 ng pRcCMV, 500 ng pCGN-E1B-55 kDa.c. 50 ng pRcCMV-p53, 500 ng pCGN.

142 Roth and Dobbelstein
d. 50 ng pRcCMV-p53, 500 ng pCGN-E1B-55 kDa.3. Transfect each well with one of the mixtures, using LIPOFECTAMINE 2000 exactly
as recommended by the manufacturer. Leave the cells in 0.5 mL/well of DMEM/10% FCS.
4. Incubate for 24 h.All steps of the following immunostaining protocol are performed at room tem-perature, except when overnight blocking (step 7) is desired for convenience. Allwashing steps are carried out with 0.5 mL of PBS.
5. Wash cells once, then add fixing solution for 15 min.6. Wash 2×, then add PBS supplemented with 0.2% (v/v) Triton X-100 for 25 min.7. Wash 3×, then add blocking solution for 15 min at room temperature or overnight
at 4°C.8. Dissolve first antibodies as follows in the same aliquot (0.5 mL) of blocking
solution: rabbit anti-p53 1:300 (1.6 μL); mouse anti-HA-tag 1:1000 (0.5 μL).Mix and add 100 μL to each well. Incubate 1 h.
9. Wash 3× and dissolve the secondary antibodies, as follows, in the same aliquot(0.5 mL) of blocking solution: Alexa 488-coupled anti-mouse IgG 1:500 (1 μL)and Alexa 594-coupled anti-rabbit IgG 1:500 (1 μL). Mix and add 100 μL to eachwell. Incubate for 1 h in the dark.
10. Wash 3× and dissolve 4,6-diamidino-2-phenylindole (DAPI) from a 10 mg/mLH2O stock solution 1:5000 in PBS (2 μg/mL final concentration). Add 1 mL toeach well. Incubate for 10 min in the dark.
11. Wash 3× and from now on, work quickly and avoid drying the cell monolayer.Remove the gasket from the slide, and remove any jelly that might still stick tothe slide, using a pair of tweezers. Remove residual PBS with a paper towel fromthe edges of the slide, without touching the monolayer. Put the slide face-up ontoa paper towel. Add one small drop of mounting medium to each well. Gentlyapply a glass cover slip (24 × 50 mm) onto the four wells. Cover with anotherpaper towel and stabilize the cover slip on the slide at the edges, using thumbsand fourth fingers of both hands. Use second fingers to gently press the cover sliponto the slide for approx 10 s. This will allow excess mounting medium to bereleased and soaked up by the towel. Avoid moving the cover slip sidewards,since this may damage the monolayer. Remove towels and allow to dry for 1 h atroom temperature in the dark. Watch with an immunofluorescence microscope.
12. Expect a staining pattern in cytoplasmic clusters for E1B-55 kDa (HA-tagged;green) in (b) and (d), and no staining above background in (a) and (c).
13. Expect an even nuclear staining of p53 (red) in (c), no staining above backgroundin (a) and (b), and a staining pattern in cytoplasmic clusters that co-localize withthe green stain in (d).
3.4. Destabilization of p53 by E1B-55 kDa and E4-34 kDa,Detected by Immunoblot (see Notes 24–30)
1. The day before transfection, seed eight wells in 6-well dishes (one well has adiameter of 3.5 cm) with H1299 cells (105/well).

p53 and Adenovirus EIB-55 KDa 143
2. Assemble the following mixtures of plasmids:
a. 100 ng pRcCMV, 500 ng pCGN, 1.7 μg pCMVneoBam.b. 100 ng pRcCMV, 500 ng pCGN, 1.7 μg pCMV-E4-34 kDa.c. 100 ng pRcCMV, 500 ng pCGN-E1B-55 kDa, 1.7 μg pCMVneoBam.d. 100 ng pRcCMV, 500 ng pCGN-E1B-55 kDa, 1.7 μg pCMV-E4-34 kDa.e. 100 ng pRcCMV-53, 500 ng pCGN, 1.7 μg pCMVneoBam.f. 100 ng pRcCMV-53, 500 ng pCGN, 1.7 μg pCMV-E4-34 kDa.g. 100 ng pRcCMV-53, 500 ng pCGN-E1B-55 kDa, 1.7 μg pCMVneoBam.h. 100 ng pRcCMV-53, 500 ng pCGN-E1B-55 kDa, 1.7 μg pCMV-E4-34 kDa.
3. Transfect each well with one of the mixtures, using LIPOFECTAMINE 2000 exactlyas recommended by the manufacturer. Leave the cells in 2 mL/well of DMEM/10% FCS.
4. After 24 h, harvest by scraping off the attached cells into the culture media. Trans-fer 1 mL of the cell suspension to an Eppendorf tube. Spin at 3000 rpm for 2 minin a tabletop centrifuge. Gently remove supernatant. Transfer the rest of the cellsuspension to the same tube and repeat centrifugation. Gently remove superna-tant and briefly vortex mix the dry pellet. Add 200 μL of RIPA buffer and vortexmix briefly. Add 50 μL of 6X Laemmli buffer, vortex mix, and boil at 95°C for3 min. Shake on an Eppendorf mixer at highest speed for 30 min (this helps toshear genomic DNA and reduce the viscosity of the solution). Spin at 14,000g for10 min in a tabletop centrifuge. Transfer supernatant to new tube (can be storedat 4°C for several h or at –20°C indefinitely).
5. Apply 30 μL of each sample to the pockets of an SDS polyacrylamide gel. Rungel and transfer to a nitrocellulose membrane using standard methods.
6. Briefly rinse membrane in PBS. Incubate in milk for 30 min with gentle agitation.7. Incubate with antibody Pab 1801 to p53, diluted 1:5000 in milk.8. Wash briefly with PBS/0.05% Tween 20. Repeat 2× and wash with milk for 15 min
(gentle agitation).9. Repeat step 8.
10. Incubate with secondary antibody, peroxidase-coupled anti-mouse IgG, diluted1:10000 in milk.
11. Wash briefly with PBS/0.05% Tween 20. Repeat 2× and wash with milk for 15 min(gentle agitation).
12. Repeat step 11 twice. Finally, wash 3× with PBS/0.05% Tween 20.13. Mix 500 μL of each component of Super Signal Ultra peroxidase substrate.14. Place membrane into a translucent plastic seal bag, add substrate, and seal by heat-
ing. Distribute substrate, e.g., by rolling a pipet over the bag. Cut off one corner ofthe bag, and squeeze out excess substrate. Reseal bag. Quickly go to the dark room.
15. Expose X-ray films to the blot, varying the exposure times between 0.5 s andseveral hours.
16. Expect a signal at approx 50 kDa in lanes (e) to (g). The signal will be muchweaker (approx 100-fold less) in (h), reflecting extensive destabilization of p53.No signal should be detected in (a) to (f).

144 Roth and Dobbelstein
4. Notes1. Instead of pOS7-p53, it is possible to use the more widespread pRcCMV-p53
(23) for transcription and translation in vitro, since the latter contains a T7 phagepromoter as well. However, yields will be approx 10-fold lower. Therefore, theuse of an internal ribosomal entry site upstream of the p53 coding sequence isadvisable. Commercially available vector systems with this feature include thepCITE vectors (Novagen, Madison, WI, USA).
2. Radioactive contamination of the gel should be avoided as much as possible. Ifapplying input controls derived from the programmed reticulocyte lysate, or whenanalyzing supernatants, do not use the same gel chamber, but run a second gel,since any free 35S-methionine can diffuse from the loading pockets to the runningbuffer. It will then evenly penetrate the gel, creating considerable background. Incontrast, the immunoprecipitated samples do not contain detectable free 35S-meth-ionine, due to the washing steps. Therefore, when necessary, very long exposuretimes (up to 2 mo) can be chosen without obtaining a background signal. Severallayers of Whatman paper help to avoid contamination with radioactivity that maystick to the dryer.
3. In many institutions, it will be preferable to use nonradioactive systems, and onemight attempt to detect p53 by immunoblot analysis. However, two issues needto be kept in mind when establishing such a system. First, HEK293 cells containhigh amounts of endogenous p53, which becomes stabilized by E1B-55 kDa.This p53 will be detected in Western blots, making it difficult to distinguish itfrom p53 (and mutants) that was created by transcription and translation in vitro.To circumvent this difficulty, one might attempt to use adenovirus-infectedH1299 cells (p53 –/– and easy to infect with adenovirus) or p53 –/– cells, whichwere transfected with an E1B-55 kDa expression plasmid (cf. Subheading 3.4.).Secondly, in SDS polyacrylamide gels, p53 runs very close to the Ig heavy chainof antibodies used for immunoprecipitation. Binding of the secondary antibodyused in the immunoblot to this heavy chain frequently leads to a strong signalthat obscures the detection of p53. This can be avoided using an antibody to p53that is directly coupled to peroxidase (e.g., the monoclonal antibody DO-1coupled to peroxidase, available from Santa Cruz Biotechnology).
4. The only commercially available antibody to E1B-55 kDa (monoclonal antibodyfrom rat, clone 9C10, e.g., from Oncogene Research Products [Cambridge, MA,USA]) works less than antibody 2A6 in our hands. When looking for commer-cially available antibodies, note that E1B-55 kDa is entirely different from themore widely studied E1B-19 kDa protein (a bcl-2-like inhibitor of apoptosis).
5. Unlike p53, the p53-homologues p73 and p63 do not bind detectably to E1B-55kDa (10,11,17–19). We found that swapping only five amino acids between p53(residues 24–28) and p73 (residues 20–24) abolishes the interaction between p53and E1B-55 kDa and enables p73 to bind E1B-55 kDa (10).
6. The interaction between E1B-55 kDa of adenovirus type 5 and p53 is readilydetectable by immunoprecipitation. In contrast, the large E1B gene product fromadenovirus type 12 appears to interact only weakly with p53, making it difficult

p53 and Adenovirus EIB-55 KDa 145
to observe this interaction by immunoprecipitation (11,25). However, adenovi-rus type 12 E1B inhibits p53 activity in reporter assays (see Subheading 3.2.), itrelocalizes p53 to the cytoplasm (see Subheading 3.3.) and it destabilizes p53when co-expressed with an E4orf6 protein (see Subheading 3.4.).
7. It is important to keep the amounts of p53 expression plasmid as low as indi-cated. We found that even very low amounts of p53 (e.g., expressed from 10 ngof plasmid) can induce reporter expression as efficiently as microgram amountsof p53 expression plasmid (26). If p53 is expressed to much higher levels thanrequired to “saturate” transcriptional activity, it becomes difficult to observenegative regulation by E1B-55 kDa or any other p53-antagonist.
8. For expression of E1B-55 kDa, it seems important to keep the 3' UTR of themRNA in the expression plasmid. We have previously worked with constructsthat contained only the coding region, and expression was very poor.
9. Plasmids that contain the E1B-55 kDa coding region, such as pCGN-E1B-55kDa, appear to slow down the growth of commonly used E. coli strains, and theytend to undergo recombination. Special precautions are necessary to prevent thisfrom happening. We routinely grow these plasmids in E. coli of the SURE strain(Stratagene, La Jolla, CA, USA), which lacks many enzymes involved in DNArecombination, and we always grow cultures from freshly transformed singlecolonies directly to the required amounts, avoiding the storage of transformedbacteria at 4°C or as frozen glycerol cultures.
10. It has been suggested that the E4-34 kDa (E4orf6) protein alone is also capable ofinhibiting p53 activity (27). We and others did not observe this, but did find astronger inhibitory effect of E1B-55 kDa and E4-34 kDa together, compared toE1B-55 kDa alone (10,19).
11. Most, if not all, p53-responsive reporter plasmids can be used in this assay.12. An alternative system with good transfection efficiencies consists in the combi-
nation of Saos2 cells (human osteosarcoma, p53 –/–) and the transfection reagentFuGene6 (Roche Molecular Biochemicals, Indianapolis, IN, USA). The advan-tage of this system is that the transfection has very little toxic effect on the cells.However, the overall transfection efficiency is not as good as in the H1299/LIPOFECTAMINE 2000 system. Further, inhibition of p53 activity by E1B-55 kDais less prounced when using Saos2 cells and FuGene6, possibly because a lowerproportion of transfected cells takes up several plasmids simultaneously.
13. The large E1B gene product of adenovirus type 12 works about as well as that ofadenovirus type 5 in this assay.
14. Unlike p53, the p53-homologues p73 and p63 are not inhibited by E1B-55 kDa inthis assay and in similar experiments (10,11,17–19). We found that swappingonly five amino acids between p53 (residues 24–28) and p73 (residues 20–24)abolishes the inhibition of p53 by E1B-55 kDa and enables E1B-55 kDa to inhibitp73 activity (10).
15. It is important to keep the cells free of mycoplasms. Otherwise, the transfectionefficiency will drop extensively. In our hands, mycoplasms were efficientlyremoved and did not reappear after adding tetracyclin (2 μg/mL) and

146 Roth and Dobbelstein
ciprofloxacin (10 μg/mL) to the culture medium. We routinely test our cells forthe presence of mycoplasms, using immunofluorescence (Ridascreen; r-biopharm).
16. The paraformaldehyde solution is made in a buffer very similar to PBS, but lack-ing bivalent cations (Ca2+ and Mg2+). It is possible to prepare the solution inregular PBS, but we found that the paraformaldehyde is then quite difficult todissolve completely.
17. If in need to speed up drying of the mounting medium, it can be carried out at37°C for 15 min.
18. If no epitope tag is available, E1B-55 kDa protein can be detected with a mono-clonal antibody (clone 246 [20]). We use a hybridoma culture supernatant, diluted1:20 in blocking solution. The only commercially available antibody (monoclonalantibody from rat, clone 9C10, e.g., from Oncogene Research Products) worksless well in our hands, but does detect E1B-55 kDa when present in large amounts.When looking for commercially available antibodies, note that E1B-55 kDa isentirely different from the more widely studied E1B-19 kDa protein (a bcl-2-likeinhibitor of apoptosis).
19. When using an anti-E1B-antibody, the protocol can be used to detect E1B-55kDa and p53 in adenovirus-transformed cells, such as HEK 293 cells. However,these cells come off the dish quite easily, and care must be taken to wash themgently. Also, they must be free of mycoplasms (see Note 15) to show an accept-able morphology after staining.
20. If the amount of available antibody is limiting, the protocol can be modified touse less antibody solution. In this case, we spot as much antibody solution asaffordable (we have used down to 10 μL/well) on parafilm and placed the slideupside down onto it. However, this will result in somewhat uneven stainingintensities within the wells.
21. This assay system can also be used to detect the relocalization of E1B-55 kDa bythe E4-34 kDa protein (14). Heterokaryon assays, employing the same stainingtechnique, reveal nucleocytoplasmic shuttling of the complex (15). In the pres-ence of E1B-55 kDa and E4-34 kDa, co-expressed p53 is usually not detectabledue to its rapid degradation (see Subheading 3.4.).
22. In contrast to E1B-55 kDa form adenovirus type 5, the large E1B gene product ofadenovirus type 12 was found mainly in the nuclei of cells that were transformedby this virus (7). However, when strongly expressed by transient transfection,this E1B protein was also found in cytoplasmic clusters, together with p53 (11).
23. Unlike p53, the p53-homologues p73 and p63 are not relocalized by E1B-55 kDain this assay and similar experiments (10,11). We found that swapping only fiveamino acids between p53 (residues 24–28) and p73 (residues 20–24) abolishesthe relocalization of p53 by E1B-55 kDa and leads to the co-localization of E1B-55 kDa and p73 in intranuclear track-like structures (10).
24. The best antibodies for detection of human p53 in our immunoblots were themouse monoclonals Pab1801 und DO-1. The popular antibody Pab421, whichworks very well in immunoprecipitations and electrophoretic mobility shift analy-sis, yields only a weak signal in immunoblots.

p53 and Adenovirus EIB-55 KDa 147
25. The signal may be so strong that <1 s of exposure to the X-ray film is sufficient.This can result in exhausting the substrate and bleaching of the signal. Therefore,it is important to take the first exposures quickly after adding the chemilumines-cent substrate. If bleaching still occurs, reduce the amount of secondary antibody(we sometimes use as little as a 1:100000 dilution).
26. Detection of p53 can be performed simultaneously with reporter assays. In thiscase, lyse the cells from one well in 100 μL of reporter lysis buffer (as describedSubheading 3.2., step 4), remove a portion (e.g., 20%) for luciferase assay, add100 μL of RIPA buffer to the remainder (including the pellet with the nuclei),vortex mix, add 50 μL of 6X Laemmli buffer, and boil. Proceed as in Subhead-ing 3.4., step 4.
27. It is possible to detect E1B-55 kDa and E4-34 kDa in these immunoblots as well.However, they tend to appear in multiple bands of higher molecular weight thanexpected. Some, but not all, of these bands may be due to SUMOylation (28).
28. Since the destabilization of p53 by the adenovirus oncoproteins is mediated bythe ubiquitin–proteasome pathway, p53 should be restabilized by the addition ofa proteasome inhibitor (29). However, the addition of the proteasome inhibitorMG132 only moderately increased the levels of p53 in the presence of E1B-55kDa and E4-34 kDa (our unpublished observations). We do not know why p53degradation seemed to be inhibited incompletely under these circumstances.
29. The homologous proteins from adenovirus type 12 mediate p53 degradation to asimilar extent as those from adenovirus type 5 (11), and even combinations ofoncoproteins across virus types remain capable to destabilizing p53 (our unpub-lished observations).
30. p53 mutants that do not interact with E1B-55 kDa are not degraded in this assay(10,12). However, interaction with E1B-55 kDa is not sufficient for degradation.For instance, a p73 mutant, which carries amino acids 24–28 from p53, effi-ciently binds E1B-55 kDa but remains stable in the presence of E1B-55 kDa andE4-34 kDa (10). The C-terminal portion of p53 is at least partially required fordestabilization (10).
References1. Shenk, T. (1996) Adenoviridae: the viruses and their replication, in Virology, Vol.
2 (Fields, B. N., Knipe, D. M., and Howley, P. M., eds.), Lippincott-Raven, Phila-delphia, pp. 2111–2148.
2. Tauber, B. and Dobner, T. (2001) Adenovirus early E4 genes in viral oncogen-esis. Oncogene 20, 7847–7854.
3. Sarnow, P., Ho, Y. S., Williams, J., and Levine, A. J. (1982) Adenovirus E1b-58kd tumor antigen and SV40 large tumor antigen are physically associated withthe same 54 kd cellular protein in transformed cells. Cell 28, 387–394.
4. Yew, P. R. and Berk, A. J. (1992) Inhibition of p53 transactivation required fortransformation by adenovirus early 1B protein. Nature 357, 82–85.
5. Yew, P. R., Liu, X., and Berk, A. J. (1994) Adenovirus E1B oncoprotein tethers atranscriptional repression domain to p53. Genes Dev. 8, 190–202.

148 Roth and Dobbelstein
6. Zantema, A. Fransen, J. A., Deavis-Oliver, A., et al. (1985) Localization of theE1B proteins of adenovirus 5 in transformed cells, as revealed by interaction withmonoclonal antibodies. Virology 142, 44–58.
7. Zantema, A. Schrier, P. I., Davis-Oliver, A., van Laar, T., Vaessen, R. T., and vander EB, A. J. (1985) Adenovirus serotype determines association and localizationof the large E1B tumor antigen with cellular tumor antigen p53 in transformedcells. Mol. Cell. Biol. 5, 3084–3091.
8. Querido, E., Marcellus, R. C., Lai, A., et al. (1997) Regulation of p53 levels bythe E1B 55-kilodalton protein and E4orf6 in adenovirus-infected cells. J. Virol.71, 3788–3798.
9. Steegenga, W. T., Riteco, N., Jochemsen, A. G., Fallaux, F. J., and Bos, J. L.(1998) The large E1B protein together with the E4orf6 protein target p53 for activedegradation in adenovirus infected cells. Oncogene 16, 349–357.
10. Roth, J., Konig, C., Wienzek, S., Weigel, S., Ritea, S., and Dobbelstein, M. (1998)Inactivation of p53 but not p73 by adenovirus type 5 E1B 55-kilodalton and E434-kilodalton oncoproteins. J. Virol. 72, 8510–8516.
11. Wienzek, S., Roth, J., and Dobbelstein, M. (2000) E1B 55-kilodalton oncoproteinsof adenovirus types 5 and 12 inactivate and relocalize p53, but not p51 or p73, andcooperate with E4orf6 proteins to destabilize p53. J. Virol. 74, 193–202.
12. Querido, E., Morrison, M. R., Chu-Pham-Dang, H., et al. (2001) Identification ofthree functions of the adenovirus e4orf6 protein that mediate p53 degradation bythe E4orf6-E1B55K complex. J. Virol. 75, 699–709.
13. Sarnow, P., Hearing, Pl, Anderson, C. W., Halbert, D. N., Shenk, T., and Levine,A. J. (1984) Adenovirus early region 1B 58,000-dalton tumor antigen is physi-cally associated with an early region 4 25,000-dalton protein in productivelyinfected cells. J. Virol. 49, 692–700.
14. Goodrum, F. D., Shenk, T., and Ornelles, D. A. (1996) Adenovirus early region 434-kilodalton protein directs the nuclear localization of the early region 1B 55-kilodalton protein in primate cells. J. Virol. 70, 6323–6335.
15. Dobbelstein, M., Roth, J., Kimberly, W. T., Levine, A. J., and Shenk, T. (1997)Nuclear export of the E1B 55-kDa and E4 34-kDa adenoviral oncoproteins medi-ated by a rev-like signal sequence. EMBO J. 16, 4276–4284.
16. Levine, A. J. (1997) p53, the cellular gatekeeper for growth and division. Cell 88,323–331.
17. Higashino, F., Pipas, J. M., and Shenk, T. (1998) Adenovirus e4orf6 oncoproteinmodulates the function of the p53-related protein, p73. Proc. Natl. Acad. Sci. USA95, 15,683–15,687.
18. Marin, M.C. Jost, C. A., Irwin, M. S., DeCaprio, J. A., Caput, D., and Kaelin, W.G., Jr. (1998) Viral oncoproteins discriminate between p53 and the p53 homologp73. Mol. Cell. Biol. 18, 6316–6324.
19. Steegenga, W. T., Shvarts, A., Riteco, N., Bos, J. L., and Jochemsen, A. G. (1999)Distinct regulation of p53 and p73 activity by adenovirus E1A, E1B, and e4orf6proteins. Mol. Cell. Biol. 19, 3885–3894.

p53 and Adenovirus EIB-55 KDa 149
20. Sarnow, P., Sullivan, C. A., and Levine, A. J. (1982) A monoclonal antibodydetecting the adenovirus type 5-E1b-58Kd tumor antigen: characterization of theE1b-58Kd tumor antigen in adenovirus- infected and -transformed cells. Virology120, 510–517.
21. Freedman, D. A., Epstein, C. B., Roth, J. C., and Levine, A. J. (1997) A geneticapproach to mapping the p53 binding site in the MDM2 protein. Mol. Med. 3,248–259.
22. Tanaka, M. and Herr, W. (1990) Differential transcriptional activation by Oct-1and Oct-2: interdependent activation domains induce Oct-2 phosphorylation. Cell60, 375–386.
23. Lin, J., Chen, J., Elenbaas, B., and Levine, A. J. (1994) Several hydrophobic aminoacids in the p53 amino-terminal domain are required for transcriptional activa-tion, binding to mdm-2 and the adenovirus 5 E1B 55-kD protein. Genes Dev. 8,1235–1246.
24. Baker, S. J., Markowitz, S., Fearon, E. R., Willson, J. K., and Vogelstein, B.(1990) Suppression of human colorectal carcinoma cell growth by wild-type p53.Science 249, 912–915.
25. van den Heuvel, S. J., van Laar, T., The, I., and van der Eb, A. J. (1993) LargeE1B proteins of adenovirus types 5 and 12 have different effects on p53 and dis-tinct roles in cell transformation. J. Virol. 67, 5226–5234.
26. Roth, J., Koch, P., Contente, A., and Dobbelstein, M. (2000) Tumor-derivedmutations within the DNA-binding domain of p53 that phenotypically resemblethe deletion of the proline-rich domain. Oncogene 19, 1834–1842.
27. Dobner, T., Horikoshi, N., Rubenwolf, S., and Shenk, T. (1996) Blockage byadenovirus E4orf6 of transcriptional activation by the p53 tumor suppressor.Science 272, 1470–1473.
28. Endter, C., Kzhyshkowska, J., Stauber, R., and Dobner, T. (2001) SUMO-1 modi-fication required for transformation by adenovirus type 5 early region 1B 55-kDaoncoprotein. Proc. Natl. Acad. Sci. USA 98, 11,312–11,317.
29. Querido, E., Blanchette, P., Yan, Q., et al. (2001) Degradation of p53 by adenovi-rus E4orf6 and E1B55K proteins occurs via a novel mechanism involving a Cullin-containing complex. Genes Dev. 15, 3104–3117.

Analysis of p53 DNA Binding Ability 151
151
From: Methods in Molecular Biology, vol. 234: p53 ProtocolsEdited by: S. Deb and S. P. Deb © Humana Press Inc., Totowa, NJ
11
In Vivo Footprinting and DNA Affinity Chromatographyfor Analysis of p53 DNA Binding Ability
Maria Patricia Molina, Christine Cain, and Jill Bargonetti
Summaryp53 is a sequence-specific DNA binding protein. The p53 consensus is two copies of 5'-
RRRC(A/T)(T/A)GYYY-3'. The interaction of p53 with specific DNA binding sites (DBS) hasbeen analyzed extensively using electrophoretic mobility shift analysis (EMSA). These studiesdo not address the interaction of p53 with nuclear chromatin or the stability of p53-DBS inter-actions. In vivo footprinting examines the dynamic interactions of p53 protein in nuclear chro-matin. p53 DBS affinity chromatography compares the stability of p53 from different cellularextracts with different DBS. Isogenic strains expressing high p53 levels, and deleted for p53,are required for controlled experiments using both methods. Different systems can be used togenerate sufficient p53 protein (including DNA damage), and this results in the analysis ofdifferent forms of p53. A comparison of different cellular sources of high levels of p53 (in thepresence and absence of DNA damage) vs different p53 DBS is required to appreciate thecomplexity of the regulation. Methods for comparing p53 from three different cellular sourceswith different DBS are presented here. The p53 research community needs to expand this analy-sis to complete the picture of how p53 differentially regulates transcription of target genes innuclear chromatin.
Key Wordsp53, DNA, binding, affinity, in vivo, footprinting, chromatography, chromatin
1. Introductionp53 is a tumor suppressor protein implicated in many human cancers (1).
Key to the ability of p53 to control cell growth is its sequence-specific DNAbinding ability (2,3). The regulation of the p53-DNA interaction is very com-plex (4,5). This interaction is modulated by many different factors (6,7). There

152 Molina et al.
is a great divergence among the natural p53 response elements, with a consen-sus that emerges as a repeat of 5'-RRRC(A/T)(T/A)GYYY-3' (8). So far, 300potential sites have been identified in the human genome (9). The p53 proteinis susceptible to posttranslational modifications, such as phosphorylation andacetylation at multiple sites, and these are believed to modulate p53 DNA bind-ing ability as well as activity (6,10). p53 interacts with many cellular proteins,and these interactions can also regulate the activity of p53 (4,7). Different com-binations of the p53 interactions mentioned above give rise to p53-DNA inter-actions, which may vary in their affinity and stability of DNA binding.
DNA binding techniques measure different aspects of a given protein’s abil-ity to interact with a particular site. The source of the protein being used for thestudy also directs the investigated question. The common gel shift assay, alsoknown as electrophoretic mobility shift analysis (EMSA), has been carried outextensively with purified p53, and more references exist than are sited here(2,11–15). This assay has been used to demonstrate the DNA sites that p53 caninteract with and their relative affinities. The phenomenon of “caging,” in thecase of EMSA, forces association of p53 and DNA, and thus, complexes areessentially trapped upon entering the gel. In general, this assay has not assessedthe instability of p53-DNA complexes. Less frequently, we and others have usedin vitro footprinting to analyze p53-DNA interactions (2,14,16–19). Using thistechnique, an appreciation for the fast on–off rate that exists for p53-DNA inter-actions, when using purified protein, was obtained. The rate of p53 dissociationfrom DNA is very fast and can be observed when comparing the ability to detecta footprint vs the ability to see the protein interact with DNA using the EMSA(14). In addition, p53 protein expressed in bacteria demonstrates more instabil-ity than p53 expressed in insect cells, most likely due to posttranslational modi-fication systems present in eukaryotic cells (14,20). In order to examine howp53 regulates transcription of genes in eukaryotic cells using the endogenousDNA binding sites (DBS), we have carried out in vivo footprinting and com-pared the observations to experiments using p53-DBS affinity chromatography(DNA affinity chromatography with p53 binding sites).
In vivo footprinting using ligation-mediated polymerase chain reaction (LM-PCR) is a standard technique that can demonstrate clear protection of certainDBS by their cognate proteins in the nucleus on chromatin (21–23). There isno other technique that demonstrates the real time interaction of transcriptionfactors with chromatin, as does this technique. However, only a limited num-ber of studies have been published that present p53 footprints on nuclear chro-matin (24–27). The three DBS that have been examined in this way are in thegenes mdm2, p21, and gadd45. The published papers examining the interac-tion of p53 with nuclear chromatin discuss the transient nature of the p53-DNAinteraction in vivo. p53 is a transcription factor that controls the regulation of

Analysis of p53 DNA Binding Ability 153
many genes (28), but demonstrating its interaction with DBS in vivo has pre-sented complications. This is most likely due to the fact that we expect p53 tobehave like other transcription factors that show clear protection of sites invivo, and it does not. The p53 protein differentially coordinates transcriptionto allow for growth arrest or apoptosis and is a central controller for thesephenomena (7). The mechanisms by which it does this are not yet understood.Clear protection of both the p53 DBS in the mdm2 gene and the gadd45 genehave been demonstrated (25–27). However, one report documented little to noprotection of these same sites with either different treatment or assay condi-tions (24). The DNA binding activity of high levels of p53, produced inresponse to DNA damage, is potentially different from high levels of p53 incells that have not undergone DNA damage because of differential phosphory-lation of p53. In addition, DNA damage may affect chromatin configurationthrough events such as the acetylation of histones. Only one report has beenable to document the protection of the mdm2 site in nuclear chromatin, and thiswas using high levels of p53 in the absence of DNA damage (25) (in the reportwhere no protection of mdm2 was seen, DNA damage was used to increase thelevel of p53). The mdm2 gene is paradoxical due to the p53-mdm2 feedbackloop, whereby the MDM2 protein disables p53 activity. The differing ways inwhich high levels of p53 were achieved may account for the one source of p53protein showing protection of the mdm2 site on chromatin, while the other didnot. It has also been seen that the in vitro protection of the gadd45 site is sub-stantially different from the in vivo footprint and that DNA damage does notchange how p53 interacts with this site in nuclear chromatin (26,27). The pro-tocol for in vivo footprinting has the following major steps: (i) isolation ofDNase-treated nuclei from experimental cells; (ii) isolation of nuclei from thenegative control cells; (iii) annealing and extension of the gene-specific oligo-nucleotide no. 1; and (iv) visualization of the Dnase-mediated cleavage sitesby LM-PCR.
p53 DNA binding activity can be modulated in several ways. Its interactionwith other proteins, including members of the general transcription machinery(29), can alter its activity. Posttranslational modification of p53 can have aneffect on DNA binding as well as its ability to transactivate (6). Variations inthe consensus p53 DNA binding site are another factor that influence the bind-ing of p53 to its response element (13). Different cellular conditions can resultin variable combinations of the above-mentioned modulations and may thuslead to different types of p53-DNA interactions with regard to the amount ofp53 bound to the DNA element, the affinity of binding, and the type of p53molecules bound to the DNA sites. The key to understanding p53 function isbeing able to dissect the subtle differences that may result in multiple types ofinteractions with DNA. DNA affinity chromatography has traditionally been

154 Molina et al.
used to purify specific proteins (30). Purification of p53 from cellular extractsusing DNA affinity chromatography with p53 DBS has not been reported; how-ever, a p53 family member has recently been isolated using this method (31).We have used p53 DBS affinity chromatography to analyze the stability of thep53 interaction with specific sequences, as well as demonstrating some of theother proteins that are part of an associated complex (32). The amount of p53present in an extract to be studied does not directly correlate with the amount ofp53 protein bound to different p53 DBS columns (although EMSA data wouldsuggest that p53 binds with high affinity). It appears that each p53 DBS selectsfor a subpopulation of p53 molecules with specific DNA binding characteris-tics (p53 “bindomers”), whose cellular concentration may not be as high in eachgiven experimental condition (Molina, paper in preparation). We have notedthat for the super consensus sequence (SCS), increased purification can beachieved if the cells have been exposed to DNA damage. We suggest that if thestability of a p53-DBS interaction increases, by virtue of particular posttransla-tional modifications due to DNA damage, then the enrichment for p53 in elutedfractions is greater. Because p53-DBS affinity chromatography can enrich forspecific p53 molecules and other associated proteins, it facilitates biochemicalanalysis of these potential bindomers and their complexes. Using the same celllines and DBS sequences for in vivo footprinting p53 in nuclear chromatin asfor enrichment of p53 from DBS affinity chromatography will allow a pictureto emerge that demonstrates what proteins interact with the p53 DBS underdifferent conditions. The p53-DBS affinity chromatography procedure can bedivided in four steps: (i) gel filtration of the nuclear extract intended to elimi-nate the nucleases present in the crude preparation; (ii) preparation of the p53-DBS affinity column, which includes labeling and concatemerizing the specificdeoxyoligonucleotide, ligating the concatemerized DNA to a solid matrix, andfinally, packing and equilibrating the column; (iii) p53-DBS affinity chroma-tography, which involves passing the partially fractionated nuclear extractthrough the column, washing the column to remove the remnant proteinsnonspecifically bound to the DNA, and eluting the p53-DBS-bound protein;and (iv) detection of the eluted proteins by EMSA and/or Western blot.
2. Materials2.1. Cell Lines and Extracts
A limiting factor for the biochemical analysis of p53 protein is its low cellu-lar concentration under nonstressed conditions. To achieve a detectably strongsignal, especially for in vivo footprinting assays, it is advisable to utilize acellular system that overexpresses p53. In addition, investigators should haveat their disposal isogenic strains null for p53 to be used as negative controls.

Analysis of p53 DNA Binding Ability 155
Two sets of cell lines that fulfill these conditions are the TR9-7 cell line (33),which expresses wild-type p53 and its parental line 041, as well as murine 3-4cells (25,34), which express the temperature-sensitive (ts) mutant p53Val135 andits parental line 10-1 (35). Another system that meets these requirements is theinsect cell line Spodoptera frugiperda 21 (Sf21). These cells are easily infectedwith a baculovirus expressing the human p53 gene and are able to overexpressp53 protein without entering apoptosis (see Note 1).
2.1.1. Cell Lines
1. TR9-7 is an isogenic human fibroblast cell line derived from MDAH041. It con-tains a tetracycline-regulated wild-type p53 gene (generously provided by M.Agarwal [33]) .
2. MDAH041 is a human fibroblast cell line lacking functional p53 protein due toframeshift mutation on one p53 allele at codon 184 and loss of the normal p53allele (33).
3. 3-4 (25,34) is an isogenic mouse fibroblast cell line stably expressing p53 and isderived from 10-1 cells (35) by transfection with a plasmid (pLTRp53cGval135)expressing the ts mutant p53Val135 (36).
4. 10-1 is a mouse fibroblast cell line that is null for p53 due to a deletion in the p53gene (35).
5. Sf21 cells are an insect cell line infected with a recombinant baculovirus express-ing wild-type human p53 (37).
2.1.2. Reagents
1. Dulbecco’s modified Eagle medium (DMEM) supplemented with 5 mL of peni-cillin (5000 U)/steptomycin (5000 μg/mL) liquid (Life Technologies, Rockville,MD, USA) per 500 mL of medium. TR9-7 cells are selected by adding G418(600 μg/mL) and hygromycin (50 μg/mL) to the medium. This medium also con-tains tetracycline at 2 μg/mL to keep p53 expression repressed when appropriate.3-4 cells are also kept in selective medium with 1.0 mg/mL G418 (GeminiBioProducts, Calabasas, CA, USA).
2. 10% Fetal bovine serum (FBS), heat-inactivated (Life Technologies).3. 500 mL TC-100 medium, pH 6.2, (Life Technologies) supplemented with 5 mL
penicillin (5000 U)/streptomycin (5000 μg/mL) liquid, 30 μL 2.5 mg/mLamphotericin B, and 50 mL heat-inactivated FBS.
2.1.3. Solutions
1. Lysis stock buffer: 20 mM 4-(2-hydroxyethyl)-1-piperazineethanesulfonic acid(HEPES), pH 7.5, 10 mM NaCl, 1.5 mM MgCl2, 0.2 mM ethylenediaminietetraacetic acid (EDTA), 0.1% Triton® X-100, 20% glycerol, 1 mM dithiothreitol(DTT), 1 mM phenylmethylsulfonyl fluoride (PMSF), 50 μg/mL aprotinin, and50 μM leupeptin.

156 Molina et al.
2. Cowie lysis buffer: 50 mM Tris-HCl, pH 8.0, 150 mM NaCl, 1% Nonidet®(NP40), 0.1% aprotinin, 1 mM DTT, 1% inhibitor cocktail, 0.35 mM PMSF.
3. Inhibitor cocktail: mix 10 μL each of the following reagents in a final vol of 1 mLin distilled water (dH2O): 30 μg/μL leupeptin, 10 mM benzamide, and 1 μg/μLbacitracin.
2.2. In Vivo FootprintIn 1989, a PCR footprinting procedure was developed that enabled in vivo
protein-DNA interactions to be viewed at specific regions of chromatin (21).The technique involves ligation-mediated PCR, and it permits amplification ofan entire sequence ladder of DNA. The protocol that we used was kindly pro-vided by Clifton E. McPherson (23). There are variations to the protocol. Theprocedure provided here uses isolated nuclei treated with DNase I. This DNA isprepared from nuclei extracted from either the 3-4 (murine) or TR9-7 (human)cells described in Subheading 2.1. Negative controls for each are the 10-1 cellsor 041 cells, respectively, that have been treated with DNase I. After isolatingthe DNA, a gene-specific oligonucleotide no. 1 is annealed to denatured DNAand extended with Sequenase® DNA Polymerase. A linker oligonucleotide isthen ligated to the end created by the extension (this allows for the ladder). PCRis then carried out using a second gene- specific oligonucleotide no. 2 and anoligonucleotide complementary to one strand of the linker. The last step is tocarry out linear PCR on these templates using a radiolabeled gene-specific oli-gonucleotide no. 3. The products are subsequently viewed on a sequencinggel. Oligonucleotide no. 3 is also used for Sanger dideoxy sequencing, so thatthe sequence of the ladder is known.
2.2.1. Gene-Specific Primer Sets for Analysis of Specific Sites1. Murine mdm2:
no. 1: 5'-TCGAGGTAGAAATACCAACC-3'no. 2: 5'-CGAAGCTGGAATCTGTGAGG-3'no. 3: 5'-GGAATCTGTGAGGTGCTTGCAGCA-3'
2. Human mdm2:no. 1: 5'-ACAGCACCATCAGTAGGTAC-3'no. 2: 5'-AAGCTACAAGCAAGTCGGTG-3'no. 3: 5'-AAGTCGGTGCTTACCTGGATCAGCAG-3'
3. Human gadd45:no. 1: 5'-CCCTGAAAACATAACTTCCC-3no. 2: 5'-GAAGCTGACTCCTTAATGAGGG-3'no. 3: 5'-TGACTCCTTAATGAGGGGTGAGCCAG-3'
2.2.2. Linker (21)
no. 1: LMP-T1: 5'-GAATTCAGATC-3'no. 2: LMP-B1: 3'-CTTAAGTCTAGAGGGCCCAGTGGCG-5'

Analysis of p53 DNA Binding Ability 157
2.2.3. Reagents
1. DNase I (Worthington Biochemical, Lakewood, NJ, USA).2. Sequenase DNA polymerase, version 2.0 (13 U/μL; USB, Cleveland, OH, USA)3. 32P-ATP (150 μCi/μL).4. T4 Polynucleotide kinase (New England Biolabs, Beverly, MA, USA)5. Taq DNA polymerase (6 U/μL) (Roche Molecular Biochemicals, Indianapolis,
IN, USA).
2.2.4. Solutions
1. RSB: 10 mM Tris-HCl, pH 7.4, 10 mM NaCl, 3 mM MgCl2, pH 7.4, 0.5% NP40,1 mM PMSF or absent (depending on the step).
2. DNase I stop: 2 M NH4OAc, 100 mM EDTA, 0.2% sodium dodecyl sulfate (SDS).3. Sequenase buffer 1 (store at –20°C): 125 mM Tris-HCl, pH 7.5, 400 mM NaCl,
25 mM MgCl2.4. Sequenase buffer 2 (store at –20°C): 40 mM Tris-HCl, pH 7.5, 5 mM MgCl2,
20 mM DTT, 0.1 mM dNTPs.5. Ligase buffer 1 (store at –20°C): 80 mM Tris-HCl, pH 7.5, 180 μg/mL bovine
serum albumin (BSA) 30 mM MgCl2.6. Ligase buffer 2 (store at –20°C): 12 mM ATP, 70 mM DTT.7. Oligonucleotide no.1 mixture: 0.3 pmol/μL in dH2O.8. Oligonucleotide no.2 mixture: 5.0 pmol/μL in dH2O.9. Oligonucleotide no.3 mixture: 25 pmol/μL in dH2O.
10. Linker oligonucleotide solution: 20 pmol/μL each of LMP-T1 and LMP-B1 in asolution of 250 mM Tris-HCl, pH 7.5, 5 mM MgCl2. Heat at 95°C for 5 min, coolat room temperature for 20 min. Aliquot and store at –20°C. Thaw aliquots atroom temperature immediately before use. This may be refrozen.
11. 10X Taq buffer: 650 mM Tris-HCl, pH 8.8, 100 mM -mercaptoethanol, 165 mM(NH4)2SO4.
12. 5X Oligonucleotide kinase buffer: 250 mM Tris-HCl, pH 9.5, 50 mM MgCl2,25% glycerol.
2.3. p53 DBS Affinity Chromatography
2.3.1. p53 Binding Site Oligonucleotides
1. MDM2-P2:Top:5'-GATCCCTGGTCAAGTTGGGACACGTCCGGCGTCGGCTGTCGGAGGAGCTAAGTCCTGACATGTCTCCG-3'Bottom:5'-GATCCGGAGACATGTCAGGACTTACCTCCTCCGACAGCCGACGCCGGACGTGTCCCAACTTGACCAGG-3'
2. SCS:Top:5'-TCGAGCCGGGCATGTCCGGGCATGTCCGGGCATGTC-3'

158 Molina et al.
Bottom:5'-TCGAGACATGCCCGGACATGCCCGGACATGCCCGGC-3'
3. RGC:Top:5'-TCGAGTTGCCTGGACTTGCCTGGCCTTGCCTTTTC-3'Bottom:5'-TCGAGAAAAGGCAAGGCCAGGCAAGTCCAGGCAAC-3'
4. mtRGC:Top:5'- TCGAGTTTAATGGACTTTAATGGCCTTTAATTTTC-3'Bottom:5'-TCGAGAAAATTAAAGGCCATTAAAGTCCATTAAAC-3'
2.3.2. Reagents1. Sephacryl™ S-300 matrix (Amersham Pharmacia Biotech, Piscataway, NJ, USA).2. Glass packing reservoir (2 × 25 cm).3. 10 U/μL T4 polynucleotide kinase (New England Biolabs).4. 1 U/μL T4 DNA ligase (Life Technologies).5. 32P-ATP (10 μCi/μL) (NEN® Life Science Products, Boston, MA, USA).6. 4B Sepharose®, CNBr-activated (Amersham Pharmacia Biotech).7. Glycogen 20 mg/mL (Roche Molecular Biochemicals).8. 1 M Ethanolamine-HCl, pH 8.0.9. Herring sperm DNA (sonicated).
10. p53 DBS affinity column (1 mL of beads).11. Amicon® Centricon 10 or 30 (Millipore, Bedford, MA, USA).
2.3.3. Solutions1. TM+ buffer, comprising 50 mM Tris-HCl, pH 7.9, 1 mM EDTA, pH 8.0, 12.5 mM
MgCl2, 10 mM KCl, 0.1% NP40, 20% glycerol, and 1 mM DTT.2. 10X T4 polynucleotide kinase buffer. 700 mM Tris-HCl, pH 7.6, 100 mM MgCl2,
5 mM DTT.3. 5X T4 DNA ligase buffer: 250 mM Tris-HCl, pH 7.6, 50 mM MgCl2, 5 mM ATP,
5 mM DTT, polyethylene glycol 800, 25% (w/v).4. TBE buffer, pH 7.6: 10.8 g Tris base, 5.5 g boric acid, 20 mL 0.5 M EDTA, pH 8.0.5. 1 M and 10 mM Phosphate buffer, pH 8.0 (see Note 12).6. Column storage buffer: 10 mM Tris-HCl, pH 7.6, 1 mM EDTA, pH 8.0, 0.3 M
NaCl, 0.04% sodium azide (added prior to use).7. Buffer Z: 25 mM HEPES, pH 7.8, 12.5 mM MgCl2, 1 mM DTT, 0.1% NP40 (v/v),
20% glycerol (v/v).8. Column regeneration buffer: 10 mM Tris-HCl, pH 7.8, 1 mM EDTA, 2.5 M NaCl,
and 1% NP40. Store at room temperature. May separate into phases. Mix byswirling just before use.
9. Column storage buffer: 10 mM Tris-HCl, pH 7.6, 1 mM EDTA, 0.3 M NaCl,0.04% sodium azide (w/v) (see Note 15).

Analysis of p53 DNA Binding Ability 159
3. Methods3.1. Cells and Cell Extracts
3.1.1. Cell Growth
1. Grow TR9-7, MDAH041, 3-4, and 10-1 cells on 150-mm plates at 37°C in DMEMuntil 70% confluent. Grow Sf21 cells in suspension at 27°C in TC-100 medium,supplemented with 10% heat-inactivated FBS. Seed the cells onto 150-mm platesat a concentration of 2 to 3 × 10⁷ cells/plate and allow them to attach.
2. At an appropriate time prior to harvesting, express p53.
3.1.2. Expression of p53
Make a curve of p53 expression vs time. It is recommended that initialexperiments with all cell lines include a time course for p53 expression. Thesecurves are essential, because different DBS will most likely show p53 interac-tion kinetics, which are variable.
3.1.2.1. TR9-7 CELLS
1. Replace the growth medium with DMEM (plus 10% fetal calf serum [FCS]) with-out tetracycline. This system is designed to be repressive for p53 expression inthe presence of tetracycline so that growing cells are not privy to the cell cycleeffects of p53. We suggest culturing two sets of TR9-7 cells: one set with DMEMsupplemented with tetracycline as a control (no p53) and another set with tetra-cycline removed 24 h (or at an appropriate time) prior to harvesting to allow forp53 expression.
2. If the effects of DNA damage are also being examined, then damage should beimparted at least 18 h after tetracycline removal when p53 is expressed. We haveimparted damage using 0.1 mM camptothecin 20 h after tetracycline removalwith good results.
3.1.2.2. 3-4 CELLS
1. The cells must be shifted to 32°C to express p53. We perform the temperatureshift 4 h prior to harvesting, but once again, a time course for p53 expression isstrongly recommended.
3.1.2.3. SF21 CELLS
1. Infect cells with a recombinant baculovirus expressing the human p53 gene at amultiplicity of infection (MOI) of 10:1.
2. Incubate cells at 27°C.3. Harvest 48 h later by scraping the plates.

160 Molina et al.
3.1.3. Cells Extracts
3.1.3.1. TR9-7 AND 3-4 CELLS
1. To harvest TR9-7, 3-4 cells, and their negative controls, wash the cells 2× with1X phosphate-bufferd saline (PBS) at 4°C .
2. Harvest by scraping the plates with 1 mL of cytoplasmic lysis buffer per 150-mmplate (prepared by combining 8.8 mL of lysis stock buffer with 6.2 mL of dH2O).
3. Centrifuge the cell suspension at 2300 rpm (600g) for 10 min at 4°C to pelletnuclei.
4. Remove the supernatant and resuspend the pellet in 1 mL of nuclear extractionbuffer (prepared by combining 8.8 mL of lysis stock buffer, 1.47 mL of 5 MNaCl, and 4.7 mL of dH2O).
5. Rock for 1 h at 4°C.6. Centrifuge the nuclear extract at 14,000 rpm (23,425g) for 10 min at 4°C to further
pellet debris and recover the supernatant.7. Determine protein concentration via Bradford Microasssay (Bio-Rad, Hercules,
CA, USA), aliquot the extracts and store at –80°C.
3.1.3.2. SF21 CELLS
1. Centrifuge the suspension at 2000 rpm (478g) for 15 min.2. Resuspend the pellet in 1.6 mL of Cowie lysis buffer per 150-mm plate and allow
to lyse on ice for 30 min.3. Centrifuge the cell extract at 2000 rpm (478g) for 15 min at 4°C to pellet debris
and recover the supernatant.4. Centrifuge the extract at 20,000 rpm (47,807g) for 30 min at 4°C to pellet debris.5. Determine protein concentration via Bradford Microassay, aliquot, and store
at –80°C.
3.2. In Vivo Footprinting of p53 DNA Response Elements
3.2.1. Extraction of Genomic DNA from DNase I Treated Nucleiafter the Expression of p53
Ligation-mediated PCR is the method used to visualize “in vivo” footprintsgenerated after DNase I treatment of cell nuclei. The protocol described here isfor use with cells grown in culture, so purists would prefer to refer to it asintranuclear footprinting, due to the lack of an entire organism (see Notes 1and 2).
1. Grow on 150-mm plates. Use at least 3 plates for each cell line under each set ofconditions. Cells should be at no more than 70% confluent before expression ofp53. Conditions and curves for activating p53 in the human TR9-7 and the murine3-4 line are described in Subheading 3.1. in the section for cells.
2. Wash plates 2X with ice-cold PBS.3. Scrape cells and put into a tube. Add 1X PBS if needed to get all cells off the plate.

Analysis of p53 DNA Binding Ability 161
4. Spin down at low speed at 4°C (2500 rpm [746g] in SS34 rotor) for 10 min.5. Resuspend in 2 mL of RSB with PMSF to extract nuclei (see Note 2).6. Homogenize with 20 strokes using pestle B, and check cells for trypan blue
exclusion (continue to homogenize until all nuclei have been extracted).7. Spin down at 4000 rpm (1912g) at 4°C for 10 min.8. Wash nuclei in 2 mL of RSB without PMSF.9. Resuspend in RSB without PMSF, so cell count is 2.0 × 10⁶ cells/250 μL.
10. Treat with DNase I for 10 min at 32°C using 250 μL of nuclei in RSB with CaCl2
added to a final concentration of 0.1 mM. It is important to perform a curve ofDNase I to titrate the digestion. Use DNase I, 2932 U/mg. The curve shouldinclude at least 0.05, 0.1, and 0.5 μg of DNase I.
11. Add 250 μL of DNase I stop buffer, and then add proteinase K to a final concen-tration of 400 μg/mL. Incubate overnight at 37°C.
12. Extract once with phenol pH 8.0 and 3× with chloroform:isoamyl 24:1.13. Ethanol precipitate using sodium acetate at a final concentration of 0.25 M before
the addition of 2 vol of ice-cold 100% ethanol.14. Resuspend the pellet in TE to a concentration of 1 μg/μL. Store at 4°C, and use
samples as soon as possible (see Notes 2–5).
3.2.2. LM-PCR Protocol to View DNase I Mediated Cleavage Sites
1. Begin with 1 μg of genomic DNA in 1X Sequenase buffer 1 (25 mM Tris-HCl,pH 7.5, 80 mM NaCl, 0.5 mM MgCl2) at a final vol of 15 μL for each sample.
2. Add 1 μL of 0.3 pmol/μL oligonucleotide no. 1. Denature at 95°C for 5 min;anneal at 50°C for 30 min, then chill on ice. Spin down to remove condensationprior to moving on to the next step.
3. Add 9 μL of Sequenase buffer 2 (40 mM Tris-HCl, pH 7.5, 5 mM MgCl2, 20 mMDTT, 0.1 mM dNTPs) and 0.5 μL of Sequenase DNA polymerase, version 2.0(13 U/μL). Mix gently.
4. Incubate at 37°C for 10 min, followed by heat inactivation at 68°C for 10 min.Then place on ice. Spin down to remove condensation prior to moving on to thenext step.
5. With the tubes on ice, ligate by adding 20 μL of each ligase buffer 1 and ligasebuffer 2, 5 μL of linker solution, and 3 μL of T4 DNA ligase (1 Weiss U/μL; LifeTechnologies) to the mixture. Mix gently. Incubate at 20°C overnight, and thenat 68°C to inactivate the enzyme.
6. Place tubes on ice, add 8 μL of 3 M NaOAc, and ethanol precipitate with 2 vol ofice-cold 100% ethanol. Resuspend the pellet in 14.5 μL of dH2O. Transfer thisDNA solution to a 500-μL PCR tube.
7. Add: 16 μL of 2.5 mM dNTP, 2 μL 5 pmol/μL oligonucleotide no. 2, 2 μL5 pmol/μL LMP-T1 oligonucleotide, 1 μL 4 mg/mL BSA, 4 μL of 10X Taqbuffer, and 0.5 μL of Taq DNA polymerase (5 U/μL).
8. In a thermal cycler, perform 20 cycles as follows: 1 min at 94°C to denature,2 min at 65°C to anneal, and 3 min at 74°C to extend. Store samples at –20°C.

162 Molina et al.
9. To visualize the footprints, 15 μL of the PCR from above was transferred to afresh 500-μL PCR tube, and add 1.5 μL of a 32P-radiolabeled oligonucleotide no.3 (1 pmol/μL, as described below in step 14), 0.5 μL of 10X Taq buffer, 3 μL of2.5 mM dNTP, and 0.5 μL of Taq DNA polymerase (see Note 6).
10. In a thermal cycler, perform 7 cycles as follows: 1 min at 94°C to denature, 2 minat 68°C to anneal, and 3 min at 74°C to extend. When cycling is complete, add 24μL of TE, 1 μL of 5 mg/mL tRNA, and 5 μL of 3 M NaOAc.
11. Add 50 μL of CHCl3, vortex mix, and centrifuge to separate phases. Add 2 vol of100% ice-cold ethanol and precipitate.
12. Resuspend the pellet in 12 μL of sequencing loading buffer and resolve the DNAby electrophoresis using a 6% denaturing polyacrylamide gel. Run one-third ofyour sample to determine how to normalize samples for a second gel.
13. Sequence the DNA using 32P-oligonucleotide no. 3 and Sequenase DNA poly-merase, version 2.0.
14. Radiolabeling of oligonucleotide no. 3: use 1–3 μL of oligonucleotide no.3(25 pmol/μL), 5 μL of 5X oligonucleotide kinase buffer, 1.25 μL of 100 mMDTT, 1–3 μL of 32P-ATP at 150 μC/μL, use 1 μL/25 pmol of oligonucleotide.Add dH2O to 25 μL, and then 1 μL of T4 polynucleotide kinase. Place at 37°C for30–60 min, 68°C for 10 min, and use a Sephadex® spin column (AmershamPharmacia Biotech) to remove free nucleotides. Adjust vol to 1 pmol/μL and count10 μL of a 1:100 dilution in a scintillation counter. Store at –20°C (see Note 6).
3.3. p53-DBS Affinity Chromatography
This procedure is divided into three parts: (i) gel filtration of the nuclearextract; (ii) p53-DBS affinity chromatography of the partially fractionatednuclear extract; and (iii) detection of the p53 present in the p53-DBS affinityelution fractions. To protect the integrity of the DNA affinity column, it isadvisable to rid the nuclear extract of nucleases. This can be accomplished bysubjecting the extract to gel filtration prior to loading it onto the DNA affinitycolumn. Sephacryl S-300 is an appropriate matrix for this purpose. After par-tial fractionation of the nuclear extract, the fractions from the gel filtrationcolumn corresponding to the column bed vol can be pooled and concentratedfor further use on the p53-DBS affinity column.
The partially fractionated and pooled nuclear extract is next loaded onto thep53-DBS affinity column. It is important to load as much p53 as possible,because only a fraction of the p53 present in the extract will be competent forbinding to a particular p53 DBS. As much as 10 μg of p53 has been used for thispurpose. The nuclear extract is passed through the affinity column at gravityflow. Because of the fast on–off rate of p53 on its DBS, it is advisable to passthe sample several times through the column (we recommend 10 passes). Thecolumn flow-through should be kept for further use as a control to evaluate theamount of p53 bound to the column. The p53 DBS affinity column is thenwashed, and the protein(s) eluted in 1-mL aliquots with increasing concentra-tions of KCl to sequentially elute p53 species with increased binding affinity.

Analysis of p53 DNA Binding Ability 163
Finally, the eluted p53-DBS affinity fractions can be analyzed using West-ern blot EMSA and to detect p53 and p53 DNA binding activity, as well as tolook for the presence of other cellular proteins co-eluted with p53.
3.3.1. Gel Filtration of Cellular Extract
3.3.1.1. PACKING OF A 25-CM-LONG COLUMN PERFORMED AT 4°C
1. Mount the packing reservoir on a stand.2. Bring 37 mL of Sephacryl S-300 resin to 50 mL with TM+ buffer.3. Using a Buchner funnel, wash the resin 2× with 50 mL of TM+ buffer. Allow the
resin to equilibrate to 4°C.4. Mix the resin well, and in one operation, pour it down the wall of the packing
reservoir with the help of a glass rod.Note: a very thin suspension will lead to poor packing of the column. Very gently,fill the reservoir with TM+ buffer. Assemble buffer reservoir, and connect to pump.
5. Open outlet, and run the pump at 12 μL/s for 2 h or until constant height. At thispoint, change the speed to 20 μL/s and run the pump for 1 h.
6. Equilibrate the column by running 50 mL (2-bed vol) of TM+ buffer at a speed of6 μL/s. Check for even packing of the column by illuminating it from the back.
3.3.1.2. GEL FILTRATION PERFORMED AT 4°C
1. Equilibrate the column by running 50 mL (2-bed vol) of fresh TM+ buffer at aspeed of 100 μL/15s.
2. Drain buffer from above the bed and apply sample.Note: the sample vol should not be more than 4% of the bed vol (1 mL).
3. Run the column until the sample enters the matrix, stop the pump, and fill thepacking reservoir to the top with TM+ buffer.
4. Run the pump at 100 μL/15 s, and collect 25 fractions (1 mL each).5. Discard the 7 first fractions (7 mL), corresponding to 6.5 mL of void vol plus
0.5 mL of tubing vol.6. Pool the remaining 18 fractions. Concentrate the pooled fractions with Centricon,
and keep at –80°C for further use (see Notes 7–9).7. Sanitate the Sephacryl column by running the following solutions at a speed of
100 μL/15 s: 0.3 M NaOH, 30 min of contact time; 50 mL (2-bed vol) TM+buffer, and 75 mL (3-bed vol) 20% ethanol.
8. Store the Sephacryl S300 column in 20% ethanol at 4°C.
3.3.2. Preparation of the p53 DBS Affinity Column
3.3.2.1. DNA PHOSPHORYLATION
1. To hybridize single-stranded oligonucleotides, prepare a reaction mixture as fol-lows: mix 65 μg of top deoxyoligonucleotide and 65 μg of bottomdeoxyoligonucletide in TE buffer for a total vol of 65 μL . Add 12 μL of 10X T4polynucleotide kinase buffer.
2. Hybridize oligonucleotides by heating for 2 min at 88°C, 10 min at 65°C, 10 minat 37°C, and 5 min at room temperature.

164 Molina et al.
3. Add 30 μL of 10 mM ATP, pH 7.0, 0.5 μL of 32P-ATP (10 μCi/μL), 10 μL of T4polynucleotide kinase (10 U/μL), and 2.5 μL of dH2O (total vol equals 120 μL).Note: from this point on, check radioactivity with a hand-held counter at eachstep to track DNA.
4. Incubate at 37°C for 2 h.5. Add 100 μL of 5 M NH4OAc and 30 μL of dH2O to adjust to 2 M NH4OAc and
250 μL final vol.6. Heat at 65°C for 15 min to inactivate the enzyme. Cool down at room tempera-
ture for 10 min.7. Ethanol precipitate the DNA with 3 vol (750 μL) of ice-cold ethanol and 1 μL of
glycogen.8. Resuspend the pellet in 225 μL of TE, pH 7.6.9. Extract the DNA once with 250 μL of 1:1 (v/v) phenol:chloroform and once with
250 μL of 24:1 (v/v) chloroform:isoamyl.10. Adjust NaOAc concentration to 0.3 M with 25 μL of 3 M NaOAc, pH 5.2, and
ethanol precipitate 1× with 3 vol (750 μL) of ice-cold ethanol.11. Resuspend the pellet in 65 μL of dH2O, and keep at –20°C until ligation.
3.3.2.2. LIGATION
1. Prepare a reaction mixture containing the 5'-phosphorylated double-strandedoligonucleotide from step 11 (Subheading 3.3.2.1.) and 40 μL of 5X T4 DNAligase buffer. Vortex mix 1 min to assure that the DNA pellet is resuspended.Add 53.3 μL of 10 mM ATP, pH 7.0, 30 μL of T4 DNA ligase (1 U/μL), and11.7 μL of dH2O for a total vol of 200 μL.Note: save 0.5 μL of this reaction mixture prior to ligation for use as a controlwhen checking the progression of the ligation procedure by agarose gel electro-phoresis.
2. Incubate at 15°C overnight. Monitor the ligation by agarose gel electrophoresisuntil you have enriched for 10-mers of oligonucleotides: 680 bp for mdm2, 350 bpfor RGC, and 250 bp for SCS.
3. Once the ligation is complete, extract the DNA once with phenol, pH 8.0, 200 μLand once with 24:1 (v/v) chloroform:isoamyl alcohol, 200 μL.
4. Adjust salt concentration to 2 M NH4OAc. Precipitate the DNA with an equal volof 2-propanol and glycogen, 1 μL as carrier. Resuspend pellet in 225 μL of TE.
5. Precipitate the DNA 1X using a final concentration of 0.3 M sodium acetate and3 vol of ice-cold ethanol.
6. Wash the pellet 2× with 800 μL of ice-cold 75% ethanol.7. Dry the pellet for 5 min under vacuum. Resuspend in 10 μL of dH2O, and store at
–20°C until further use.
3.3.2.3. PREPARING THE SEPHAROSE MATRIX: 1 ML OF BEADS
1. Add 0.6 g of activated Sepharose 4B and 3 mL of 1 mM HCl. Mix by inversionfor 1 min.

Analysis of p53 DNA Binding Ability 165
2. Transfer to a Buchner funnel and perform the following washes for 15 min each:100 mL 1 mM HCl, 20 mL dH2O, 20 mL 10 mM phosphate buffer, pH 8.0.
3.3.2.4. COUPLING
Note: from this point on, it is necessary to track the binding of ligated oligo-nucleotides to the matrix by monitoring the radioactivity in the washes.
1. Transfer the washed Sepharose matrix to an Eppendorf® tube and add 0.4 mL of10 mM phosphate buffer (pH 8.0) to make a thick slurry.
2. Add 10 μL DNA from Subheading 3.3.2.2., step 7, and incubate on a rotatingwheel at room temperature for 12 h or overnight.
3. In a fume hood, transfer the beads to a Buchner funnel, and wash 2× with 20 mLdH2O, and 1× with 20 mL 1 M ethanolamine-HCl, pH 8.0.
4. To inactivate the CNBr, transfer the beads to a 15-mL falcon tube, and add enough1 M ethanolamine-HCl, pH 8.0, to create a smooth slurry. Incubate 4–6 h on arotating wheel at room temperature.
5. Transfer to a Buchner funnel, and perform the following washes: 2× with 20 mL1 M phosphate buffer, pH 8.0, 20 mL 1 M KCl, and 20 mL column storage buffer.
6. Put the beads coupled to DNA in a plastic column, add 5 mL of column storagebuffer, and store them at 4°C.
7. Before discarding, treat CNBr-contaminated waste and instruments by soakingthem in a 10–20 mg/mL solution of sodium hydroxide and glycine. Let standovernight in a fume hood and then discard.
3.3.3. Affinity Chromatography of Cellular Extract
Normalize the experiments for a given amount of p53 contained in thepartially fractionated cellular extract (see Notes 8–15).
1. Assemble the p53-DBS affinity column on a stand and let it equilibrate at 4°C.2. Equilibrate the beads by running 10 mL of Buffer Z (0.1 M KCl) through the
column at gravity flow (see Note 11).3. To the partially fractionated cellular extract, add herring sperm DNA (competitor)
at 5 ng competitor per 1 μg of total protein. Incubate for 15 min at room tempera-ture. Centrifuge at 13,000 rpm (20,198g) for 10 min to pellet the debris. Recoverthe supernatant and discard the pellet. Put the extract at 4°C (see Note 15).
4. Drain the column buffer from the bottom without allowing the beads to dry.5. Load the cellular extract onto the column and pass it 10× at gravity flow. Collect
the flow-through for further analysis.6. Wash the column 4× with 2 mL Buffer Z (0.1 M KCl). Make sure to rinse the
walls of the plastic reservoir. Collect the washes in 1-mL or 2-mL fractions forfurther analysis.
7. Elute the affinity column by running 1-mL fractions of Buffer Z, with KClconcentrations ranging from 0.2–1.0 M. Collect each fraction independently inEppendorf tubes.

166 Molina et al.
8. Concentrate each fraction to 100 μL, using Centricon 10 or 30 (see Note 7).Aliquot, and keep at –80°C for further use.
3.3.3.1. COLUMN REGENERATION
Work at room temperature.
1. Close the column outlet and add 5 mL of regeneration buffer to the beads.2. Stir the beads in the regeneration buffer with a siliconized glass rod.3. Open the outlet, and allow buffer to run through.4. Repeat steps 1–3.5. Run 5 mL of storage buffer through the column at gravity flow. Repeat 2×.6. Keep the column in column storage buffer and at 4°C.
3.3.4. Analysis of the p53 DBS Affinity Fractions
1. Concentrate each p53 DBS elution fraction independently, using Centricon 10 or30 (see Notes 7 and 8).
2. Use the p53 DBS elution fractions for Western blot, EMSA, or both, according tothe objectives.
4. Notes1. The p53 temperature-sensitive line 3-4, as well as the tetracycline-regulated cell
line TR9-7, have been used to successfully observe p53-dependent changes inDNase I protection. If any other cell line is used, we suggest that you use one ofthese as a positive control. We have begun to work with the cell line p53 A2 thatexpresses very high levels of p53 controlled by the removal of the drug doxycy-cline (a generous gift from Bert Vogelstein) (38). It appears to be a very promis-ing cell line that has an isogenic partner, null for p53, and should be consideredfor future experiments. Sometimes overexpressing lines stop expressing the pro-tein of interest. We have had some trouble with the TR9-7 line and thawed olderfreeze downs when this occurred.
2. It is critical to determine that the nuclear DNA can be extracted from the cellswithout being significantly nicked in the absence of DNase I addition. This canbe analyzed to some extent on an agarose gel, but the best method is to carry outLM-PCR using the primer sets on the extracted genomic DNA prior to beginningthe key experiments. It is then critical to empirically determine the amount ofDNase I required to obtain an even distribution of cutting sites on the region ofinterest. There must be enough cleavage to resolve a given area; however, toomuch cleavage will decrease the region that you are able to resolve.
3. There is a critical window during which p53 DNase I protection can be observed,and it is possible that this window will vary for the different p53 response elements.Therefore, a time curve for mRNA expression from the gene of interest should beanalyzed to determine an early p53 target gene expression time point, which can becompared to one after 24 h of p53 expression. We have seen that, after 4 h of p53expression, a clear footprint on the mdm2 p53 RE can be observed in 3-4 cells at the

Analysis of p53 DNA Binding Ability 167
mdm2 site (25). After DNA damage, shorter time points may be required. Protec-tion of the gadd45 site has been observed after 4 h in ML-1 cells (26).
4. As we mentioned before, the regulation of the p53-DNA association is complex.Analysis with purified proteins does not always reflex this complexity, so werecommend using cellular extracts for comparisons as well.
5. The specific activity of the radioactivity used is very high. You will be using apreparation that is rather crude for this technique.
6. Use at least 10 μg of p53 contained in the cell extract, which corresponds toabout 50 maxiplates (150 mm) of 3–4 cells at 70% confluency. This equals approxto 7–10 mg of total protein.
7. The choice of the Centricon cut-off number depends on your goal. If you want toisolate p53 protein only, it is better to choose the higher cut-off number, Centricon30. This will allow the concentration to proceed faster. If you want to analyzeassociated proteins, it is advisable to use the small cut-off number, Centricon 10.This choice will allow you to retain most of the proteins present in each fraction,but it will retard the filtration procedure.
8. Concentrate the partially fractionated cellular extract to a convenient vol, andachieve a p53 concentration of about 10 μg of p53/mL of extract.
9. Once the Sephacryl S 300 column has been packed at 4°C, do not transfer to anyother temperature, because it can de-equilibrate and incorporate air bubbles intothe column bed.
10. Before loading the sample onto the p53-DBS affinity column, save at least 100 μLof sample for comparative analysis. Also, keep the washes and flow-though for thesame purpose.
11. To prepare Buffer Z of different salt concentrations (0.2–1.0 M) for the affinitycolumn elution, mix the corresponding amounts of Buffer Z (no salt) and BufferZ (1.0 M KCl).
12. Prepare 1 M phosphate buffer by preparing a 1 M KH2PO4 solution and adjustingits pH to 8.0 with a 1 M K2HPO4 solution.
13. Do not concentrate the crude nuclear extract beyond 70 mg/mL. It will be tooviscous and difficult to run through the Sephacryl S 300 column.
14. The p53-DBS affinity column should be operated at gravity flow. Applying otherforces might deform the matrix and hinder the binding of p53 to the DNA.
15. All the buffers containing DTT should be prepared fresh for each use to assure itseffectiveness.
16. All values are based on a Sorvall SS 34 rotor except for step 3 of Subheading3.3.3., which is for a micro-centrifuge.
References1. Nigro, J. M., Baker, S. J., Presinger, C., et al. (1989) Mutations in the p53 gene
occur in diverse human tumor types. Nature 342, 705–708.2. Bargonetti, J., Reynisdottir, I., Friedman, P. N., and Prives, C. (1992) Site-spe-
cific binding of wild-type p53 to cellular DNA is inhibited by SV40 T antigen andmutant p53. Genes Dev. 6, 1886–1898.

168 Molina et al.
3. Pietenpol, J. A., Tokino, T., Thiagalingam, S., el-Dieiry, W. S., Kinzler, K. W.,and Vogelstein, B. (1994) Sequence specific transcriptional activation is essentialfor growth suppression by p53. Proc. Natl. Acad. Sci. USA 91, 1998–2002.
4. Vogelstein, B., Lane, D., and Levine, A. J. (2000) Surfing the p53 network. Nature408, 307–310.
5. Ko, L. J. and Prives, C. (1996) p53: puzzle and paradigm. Genes Dev. 10,1054–1072.
6. Giaccia, A. J. and Kastan, M. B. (1998) The complexity of p53 modulation: emerg-ing patterns from divergent signals. Genes Dev. 12, 2973–2983.
7. Bargonetti, J. and Manfredi, J. J. (2002) Multiple roles of the tumor suppressorp53. Curr. Opin. Oncol. 14, 86–91.
8. el-Deiry, W. S., Kern, S. E., Pietenpol, J. A., Kinzler, K. W., and Vogelstein, B.(1992) Definition of a consensus binding site for p53. Nat. Genet. 1, 45–49.
9. Tokino, T., Thiagalingam, S., el-Deiry, W. S., Waldman, T., Kinzler, K. W., andVogelstein, B. (1994) p53 tagged sites from human genomic DNA. Hum. Mol.Genet. 3, 1537–1542.
10. Gottifredi, V. and Prives, C. (2001) Molecular biology. Getting p53 out of thenucleus. Science 292, 1851–1852.
11. Bargonetti, J., Manfredi, J. J., Chen, X., Marshak, D. R., and Prives, C. (1993) Aproteolytic fragment from the central region of p53 has marked sequence-specificDNA-binding activity when generated from wild-type but not from oncogenicmutant p53 protein. Genes Dev. 7, 2565–2574.
12. Halazonetis, T. D., Davis, L. J., and Kandil, A. N. (1993) Wild-type p53 adopts a‘mutant’-like conformation when bound to DNA. EMBO J. 12, 1021–1028.
13. Martinez, J. D., Craven, M. T., and Pennington, M. E. (1998) Selective bindingof different p53 response elements by p53 containing complexes. Oncogene 16,453–458.
14. Cain, C., Miller, S., Ahn, J., and Prives, C. (2000) The N terminus of p53 regu-lates its dissociation from DNA. J. Biol. Chem. 275, 39,944–39,953.
15. Szak, S. T., Mays, D., and Pietenpol, J. A. (2001) Kinetics of p53 binding topromoter sites in vivo. Mol. Cell. Biol. 21, 3375–3386.
16. Bargonetti, J., Friedman, P. N., Kern, S. E., Vogelstein, B., and Prives, C. (1991)Wild-type but not mutant p53 immunopurified proteins bind to sequences adja-cent to the SV40 origin of replication. Cell 65, 1083–1091.
17. Zambetti, G. P., Bargonetti, J., Walker, K., Prives, C., and Levine, A. J. (1992)Wild-type p53 mediates positive regulation of gene expression through a specificDNA sequence element. Genes Dev. 6, 1143–1152.
18. Bargonetti, J., Chicas, A., White, D., and Prives, C. (1997) p53 represses Sp1DNA binding and HIV-LTR directed transcription. Cell. Mol. Biol. 43, 935–949.
19. Jayaraman, L., Murthy, K. G., Zhu, C., Curran, T., Xanthoudakis, S., and Prives,C. (1997) Identification of redox/repair protein Ref-1 as a potent activator of p53.Genes Dev. 11, 558–570.

Analysis of p53 DNA Binding Ability 169
20. Hupp, T. R., Meek, D. W., Midgley, C. A., and Lane, D. P. (1992) Regulation ofthe specific DNA binding function of p53. Cell 71, 875–886.
21. Mueller, P. R. and Wold, B. (1989) In vivo footprinting of a muscle specificenhancer by ligation mediated PCR. Science 246, 780–786.
22. Rigaud, G., Roux, J., Pictec, R., and Grange, T. (1991) In vivo footprinting of therat TAT gene: dynamic interplay between the glucocorticoid receptor and a liver-specific factor. Cell 67, 977–986.
23. McPherson, C. E., Shim, E., Friedman, D. S., and Zaret, K. S. (1993) An activetissue-specific enhancer and bound transcription factors existing in a preciselypositioned nucleosomal array. Cell 75, 387–398.
24. Chin, P. L., Momand, J., and Pfeifer, G. P. (1997) In vivo evidence for binding ofp53 to consensus binding sites in the p21 and GADD45 genes in response to ion-izing radiation. Oncogene 15, 87–99.
25. Xiao, G., White, D., and Bargonetti, J. (1998) p53 binds to a constitutivelynucleosome free region of the mdm2 gene. Oncogene 16, 1171–1181.
26. Graunke, D. M., Fornace, A. J., Jr., and Pieper, R. O. (1999) Presetting of chro-matin structure and transcription factor binding poise the human GADD45 genefor rapid transcriptional up-regulation. Nucleic Acids Res. 27, 3881–3890.
27. Xiao, G., Chicas, A., Olivier, M., Taya, Y., Tyagi, S., Kramer, F. R., andBargonetti, J. (2000) A DNA damage signal is required for p53 to activate gadd45.Cancer Res. 60, 1711–1719.
28. Zhao, R., Gish, K., Murphy, M., et al. (2000) Analysis of p53-regulated geneexpression patterns using oligonucleotide arrays. Genes Dev. 14, 981–993.
29. Prives, C. and Hall, P. A. (1999) The p53 pathway. J. Pathol. 187, 112–126.30. Kadonaga, J. T. (1991) Purification of sequence-specific DNA binding proteins
by DNA affinity chromatography. Methods Enzymol. 208, 10–23.31. Tan, M., Bian, J., Guan, K., and Sun, Y. (2001) p53CP is p51/p63, the third mem-
ber of the p53 gene family: partial purification and characterization. Carcinogen-esis 22, 295–300.
32. Chicas, A., Molina, P., and Bargonetti, J. (2000) Mutant p53 forms a complexwith Sp1 on HIV-LTR DNA. Biochem. Biophys. Res. Commun. 279, 383–390.
33. Agarwal, M. L., Agarwal, A., Taylor, W. R., and Stark, G. R. (1995) p53 controlsboth the G2/M and G1 cell cycle checkpoints and mediates reversible growtharrest in human fibroblasts. Proc. Natl. Acad. Sci. USA 92, 8493–8497.
34. Chen, X., Bargonetti, J., and Prives, C. (1995) p53, through p21(WafI/CIP1),induces cyclin D1 synthesis. Cancer Res. 55, 4257–4263.
35. Harvey, D. and Levine, A. J. (1991) p53 alteration is a common event in thespontaneous immortalization of primary BALB/c murine embryo fibroblasts.Genes Dev. 5, 2375–2385.
36. Michalovitz, D., Halevy, O., and Oren, M. (1990) Conditional inhibition of trans-formation and of cell proliferation by a temperature-sensitive mutant of p53. Cell62, 671–680.

170 Molina et al.
37. O’Reilly, D. R. and Miller, L. K. (1988). Expression and complex formation ofsimian virus 40 large T antigen and mouse p53 in insect cells. J. Virol. 62,3109–3119.
38. Yu, J., Zhang, L., Hwang, P. M., Rago, C., Kinzler, K. W., and Vogelstein, B.(1999). Identification and classification of p53-regulated genes. Proc. Natl. Acad.Sci. USA 96, 14,517–14,522.

p53 Phospho-Specific Antibodies 171
171
From: Methods in Molecular Biology, vol. 234: p53 ProtocolsEdited by: S. Deb and S. P. Deb © Humana Press Inc., Totowa, NJ
12
Signaling to p53
The Use of Phospho-SpecificAntibodies to Probe for In Vivo Kinase Activation
Ashley L. Craig, Susan E. Bray, Lee E. Finlan, Neil M. Kernohan,and Ted R. Hupp
SummaryPhospho-specific antibody technology has been recently adopted to study p53 phosphoryla-
tion both in vivo and in vitro. We have developed and carefully characterized p53 phospho-specific reagents directed to major amino- and carboxy-terminal regulatory sites. Thespecificities of both polyclonal and monoclonal reagents targeting the same phospho-epitopeare discussed. We have defined the major chemical binding determinants for specific mono-clonal reagents by determining the relative contribution of charge and sequence to epitoperecognition. Remarkably, we have found that the utility of these reagents in different assaysystems is not universal and depends both on epitope conformation and affinity. This is reflectedin the striking differences in their ability to detect endogenous p53 and recombinant protein.Therefore, we conclude that this novel class of reagents is not generally applicable, but that theutility of each reagent must be determined empirically.
Key Wordsantibody, phosphate, phospho-specific, polyclonal, monoclonal, kinase, signaling,
noninvasive, ELISA, immunoblotting, bandshift
1. Introduction1.1. p53 Regulation by Phosphorylation
p53 function as a tumor suppressor is linked to its function as a sequence-specific DNA-binding protein and stress-activated transcription factor that con-trols the expression of a large panel of gene products implicated in normal growthcontrol, cell-cycle arrest, and apoptosis (1). The central core domain of p53 con-

172 Craig et al.
tains the sequence-specific DNA-binding domain and an oligomerization domainthat is required to assemble p53 into its tetrameric structure (Fig. 1). Regulatorydomains at the amino and carboxy termini of p53 modulate protein–proteininteractions and DNA–protein interactions that affect the rate of p53-dependenttranscription (Fig. 1) (2). The C terminus of p53 contains a negative regulatorydomain (3) whose phosphorylation at Ser392 by CK2 (4) or Ser315 by cyclin-dependent kinases (5,6), as well as acetylation at multiple lysine residues byp300 and PCAF (7,8), stimulates the DNA-binding function of p53. The N-ter-minal regulatory domain of p53 contains the highly conserved BOX-1 sequence(amino acids 13–27) that directs the binding of p53 to proteins, including thepositive effector p300 (9) and the inhibitor MDM2 (10), the balance of whichregulates the tumor suppressor activity of p53. Phosphorylation of BOX-1domain sites, including Ser15, Thr18, and Ser20, can either reduce MDM2 binding(11) or stabilize the p53-p300 transcription complex (12), resulting in a net acti-vation of p53 function. Thus, the concerted activation of the sequence-specificDNA binding function of p53 by posttranslational modification of its C-terminaldomain and the kinase-dependent stabilization of the p53-p300 complex pro-vides a working model to explain the basic mechanism of how p53-dependentgene expression can be activated. Understanding the regulation of the enzymesthat target these sites of covalent modification on p53 is clearly necessary fordissecting the upstream regulation of p53 activity, and a variety of methods havebeen used to identify and measure changes in p53 phosphorylation.
1.2. Methods for Measuring Protein Phosphorylation
Commonly utilized methods for studying protein phosphorylation includephosphopeptide mapping and protein mobility shift by sodium dodecyl sul-fate polyacrylamide gel electrophoresis (SDS-PAGE). Identification of site-specific protein phosphorylation involves the metabolic labeling of culturedcells with radioactive precursors such as 32P-orthophosphate. The protein ofinterest is immunoprecipitated, digested with proteolytic enzymes, and the
Fig. 1. Sites of posttranslational modification on human p53. Phosphorylation sitesand acetylation sites mapped on p53 using conventional radiolabeling methods,phospho-specific antibodies, or mass spectrometry.

p53 Phospho-Specific Antibodies 173
resulting peptide fragments are resolved by two-dimensional electrophoresis.Peptide migration is compared to control phosphopeptides to identifyphosphorylation sites. However, radionuclide exposure can activate stressresponse pathways, resulting in growth arrest and changes in the basal p53-phosphorylation state (13,14), thereby rendering conventional radiolabelingapproaches unsuitable for studying kinase pathways that affect the physiologi-cal regulation of stress-response proteins. Mass spectrometry-coupled identifi-cation of phosphorylation sites complements the use of radiolabeling methodsand has the important advantage of being noninvasive, in that cells are notlabeled with a damaging precursor prior to cell harvesting. Several p53 proteinphosphorylation and acetylation sites have been mapped using this method,and although certain known phosphorylation sites predominate (15), otherknown sites are not detected using this method, possibly due to low yields ofphosphopeptide following sample processing.
More recently, phospho-specific antibodies have been developed and usedas noninvasive probes for studying site-specific protein phosphorylation invivo. A clear advantage of this technology is that it permits the relatively inex-pensive development of reagents to both known and putative phosphorylationsites, with minimal sample processing resulting in improved signal retention.The combination of specificity and sensitivity of phospho-specific antibodytechnology has caused it to be widely adopted for studying phosphorylation ofa range of cellular proteins, including cytoskeletal proteins, components of sig-naling pathways (including receptor kinases and transcription factors), neu-ronal proteins, and cell cycle regulatory proteins.
Initial studies revealed that phosphorylated proteins are not good antigens,as they are rapidly dephosphorylated by endogenous phosphatases in thebloodstream of laboratory animals. Furthermore, phosphorylation sites are notalways within immunodominant regions of the protein. Therefore, thepreferred immunogens are synthetic 10–12 amino acid peptides, consisting ofthe sequence surrounding the phosphorylation site to be studied. Initially, thesepeptides had to be phosphorylated following synthesis, thereby restricting theutility of this technique to studying the regulation of sites phosphorylated byknown kinases. However, improvements in chemical synthesis technologynow enable phosphate to be added during synthesis using an arylthio groupthat protects the peptide from dephosphorylation in vivo. Both polyclonal andmonoclonal antibodies (MAbs) can be generated using phosphopeptides, andthere are advantages to each approach. High titer polyclonal antibodies can berelatively easily and cheaply produced, but require affinity purification toremove nonspecific antibodies from antisera. However, although more costlyand technically demanding to generate, MAbs have the advantage of beingintrinsically more reproducible and additionally can be produced at high titrein ascites fluid.

174 Craig et al.
The epitope of a phospho-specific antibody generally comprises two recog-nition determinants: (i) a specific amino acid sequence; and (ii) phosphate at aspecific site, within this region. However, there is a useful class of phospho-specific reagents which detect phospho-tyrosine(Tyr), phospho-threonine(Thr), and phospho-serine(Ser) that do not have a specific epitope sequencecontext. These are widely used to detect phosphorylation of specific proteinsfollowing immunoprecipitation. However, despite their clear potential, severalfactors have to be considered before using these novel reagents. First, carefulcharacterization is required to prevent the selection of reagents that cross-detectphosphate at different sites within the same sequence. Further, for reagentstargeting consensus amino acid sequences phosphorylated by abundant kinases,there is a possibility of cross-reactivity with other cellular proteins in someassays.
1.3. Development of Immunochemical Methodsfor Studying p53 Phosphorylation
Polyclonal reagents targeting several p53 phospho-epitopes have now beengenerated, including many sites within N- and C-terminal regulatory domains.More recently, this technology has been adapted to include acetylated epitopessuch as Lys320 and Lys382 (see Fig. 1). However, although several researchgroups have now generated anti-p53 phospho-specific and acetyl-specific anti-bodies targeting key residues, the binding specificities of all of the reagentshave not all been published (see Note 1).
We generated p53 site-specific antibodies to study the regulation of p53function by posttranslational modification at major sites that regulate either theDNA-binding activity or the p300-binding activity of p53. Reagents designedto specifically target both N-terminal (Ser15, Thr18, and Ser20) and C-terminal(Ser315 and Ser392) sites have been developed and used to assess signalingchanges to p53. A comprehensive study using these reagents has shown thatphosphorylation patterns on p53 protein are damage-regulated (4,6,16,17) andvary strikingly in normal human fibroblasts, depending on the type of damageor signal used to perturb cells (18). Increases in site-specific phosphorylationof p53 in normal human cells implicate kinase signaling in the regulation ofp53 function. However, an observed decrease in the level of basal phosphory-lation at constitutive sites indicates that phosphatases as well as kinases mayalso play a role in modulating specific protein–protein or protein–DNA inter-actions of p53 (18).
This review will first describe immunochemical assays used to characterizeand measure the specificity or promiscuity of phospho-specific antibodies tothe N-terminal BOX-1 domain of p53 and will highlight the difficulties inacquiring reliable phospho-specific reagents. Significant differences in speci-ficity between similar phospho-specific MAbs may be understood by deter-

p53 Phospho-Specific Antibodies 175
mining their respective chemical mechanisms of epitope binding, and wedescribe methods for determining key binding residues within a phospho-epitope. The second part contains more sophisticated assays that measure: (i)the specificity of phospho-specific MAbs to the C-terminal regulatory domainof p53 using phage–peptide display; and (ii) the stoichiometry of p53 phospho-rylation using native (i.e., non-denaturing) gel electophoresis. We discuss theutility of well-characterized monoclonal phospho-specific antibodies in study-ing the regulation of p53 site-specific phosphorylation in cell lines or in clini-cal material in order to ascertain whether kinase pathways target p53 inphysiological situations. Lastly, the utility of a monoclonal phospho-specificantibody in the development of cell-free site-specific kinase assay–phosphataseassay opens the door to develop high-throughout inhibitor screening from crudelysates that preserves complex regulatory conditions not always optimizedusing highly pure kinases.
2. Materials
All reagents were supplied by Sigma (St. Louis, MO, USA), unless other-wise stated.
1. Keyhole Limpet Hemocyanin (KLH) (Sigma; cat. no. H2133) is prepared at10 mg/mL in H2O and stored at –20°C.
2. Phosphopeptides are synthesized by standard methods (19) and contain a C-ter-minal amino acid with a free primary amine to facilitate glutaraldehyde cross-linking to carrier protein prior to immunization. These are dissolved at 4 mg/mLin H2O and stored at –20°C.
3. Glutaraldehyde is stored as a 70% solution at –20°C.4. Protein G beads (suspension in 50% ethanol) for immunoglobulin (IgG) purifica-
tion are from Amersham Pharmacia Biotech (Piscataway, NJ, USA).5. Antibody elution buffer: 0.1 M glycine, pH 2.5.6. Phosphate-buffered saline (PBS) buffer: 140 mM NaCl, 2.6 mM KCl, 10 mM
Na2HPO4, 1.7 mM KH2PO4.7. NaF is prepared as a 1 M stock solution and stored at room temperature. The
working concentration is 50 mM (see Note 2).8. Reacti-gel (6X) is obtained from Pierce Chemical (Rockford, IL, USA; cat. no.
20259).9. Colorless enzyme-linked immunosorbent assay (ELISA) plates (Falcon®) are
from Becton Dickinson (Franklin Lakes, NJ, USA; cat no. 3912) and opaqueELISA plates are Microlite 2 (DYNEX Technologies, Chantilly, VA, USA).
10. Streptavidin is stored as a 10 mg/mL stock solution at –20°C.11. Biotinylated phosphopeptides are dissolved at 5 mg/mL in dimethyl sulfoxide
(DMSO) and stored at –20°C.12. ELISA coating buffer: 0.1 M sodium borate (B4O7), pH 9.0.13. PBS-T: PBS containing 0.1% (v/v) Tween®-20.

176 Craig et al.
14. 3BPBST: PBS containing 3% (w/v) bovine serum albumin (BSA).15. 5MPBST: PBS containing 5% (w/v) fat-free milk powder.16. Fat-free milk powder used is Marvel.17. 1 M -glycerophosphate ( GP) is stored at 4°C. The working concentration is
10 mM (see Note 2).18. Okadaic acid (OA) (O-7760; Sigma; cat. no. 0-7760, sodium salt) is stored at
–20°C as a 120 μM stock solution in ethanol. The working concentration is12 nM (see Note 2).
19. Phospho-p53 (Ser20) and phospho-p53 (Ser15) polyclonal antibodies are fromNew England Biolabs (Beverly, MA, USA).
20. Horseradish peroxidase (HRP)-conjugated secondary antibodies to mouse or-rabbit IgG are supplied by Dako (Glostrup, Denmark).
21. Electrochemiluminescence (ECL)™-chemiluminescence solutions and Hyperfilm™are obtained from Amersham Pharmacia Biotech.
22. TMB Liquid Substrate system for developing the ELISA is from Sigma (cat. no.T-8540).
23. The ELISA plate reader used is a Model 4000 (DYNEX Technologies), and thefluorimeter is a Flouroscan Ascent FL (Labsystems Affinity Sensors, Franklin,MA, USA).
24. Two sensor SA chips (Biacore, Piscataway, NJ, USA).25. Biacore 2000 upgrade (Biacore).26. Priming buffer: 1 M NaCl, 40 mM NaOH.27. HBS buffer: 10 mM 4-(2-hydroxyethyl)-1-pipetrazineethanesulfonic acid
(HEPES), pH 7.4, 150 mM NaCl, 3.4 mM ethylenediamine tetraacetic acid(EDTA), 0.05% Biacore Surfactant P20.
28. Stripping buffer: 10 mM glycine, pH 2.0.29. Phage-peptide display kits (12-mer and cyclic 7-mer libraries) were obtained
from New England Biolabs.30. p53 polygrip oligomers: 5381 5'-TTT TTT TTT TAG ACA TGC CTA GAC
ATG CCT-3'; 5382 5'-TTT TTT TTT TAG GCA TGT CTA GGC ATG TCT-3'.Stock oligomer concentration is 2 mg/mL in Tris-EDTA (TE) buffer.
31. Chroma-spin-10 columns were supplied by Clontech Laboratories (Palo Alto,CA, USA).
32. TE: 20 mM Tris-HCl, pH 7.5, 1 mM EDTA.33. Cyclin-dependent kinase (CDK) buffer: 10% glycerol, 25 mM HEPES-KOH,
pH 7.5, 50 mM KCl, 0.5 mg/mL BSA, 5 mM MgCl2, 1 mM dithiothreitol (DTT).34. DB buffer: 25 mM HEPES, pH 7.6, 15% glycerol, 50 mM KCl, 0.02% Triton®
X-100, 1 mM MgCl2, 1 mg/mL BSA. Add 5 mM DTT and 1 mM benzamidinedirectly before use.
35. Nondenaturing gel contains 4% polyacrylamide (29:1), 1X Tris-borate (TB)buffer, 0.1% Triton X-100, 0.1% ammonium persulfate, 0.1% N,N, N',N'-tetramethylethylene diamine (TEMED).
36. TB buffer: 45 mM Tris base and 44 mM H3BO3.37. Nondenaturing gel tank buffer: 0.625X TB and 0.1% Triton X-100.38. Tissue culture plates are from Nalge Nunc International (Rochester, NY, USA).

p53 Phospho-Specific Antibodies 177
39. Urea lysis buffer: 7.0 M urea, 0.1 M DTT, 0.05% Triton X-100, 25 mM NaCl, 50 mM NaF, 0.02 M HEPES (pH 7.6).
40. Bradford assay reagent is from Bio-Rad (Hercules, CA, USA).41. Laemmli buffer: 2% SDS, 25 mM Tris-HCl, pH 6.8, 10% glycerol, 0.02% bro-
mophenol blue.42. SDS-polyacrylamide gels (10%) are made as indicated (20).43. SDS-PAGE buffer: 25 mM Tris, 190 mM glycine, 0.1% SDS.44. Blotting buffer: 150 mM glycine, 20 mM Tris, 0.1% SDS (w/v) and 20% metha-
nol, pH 8.3.45. Nitrocellulose membrane (HyBond® C) is from Amersham Pharmacia Biotech.46. Avidin and biotin solutions are from Vector Laboratories (Burlingame, CA, USA).47. The ABC Elite biotin-streptavidin immunoperoxidase kit is supplied by Vector
Laboratories.48. Diaminobenzidine (DAB) in 0.03% hydrogen peroxide is from Dako.49. DPX mountant is from Diachem International Ltd.50. 50X Low salt buffer (LSB): 0.5 M HEPES, pH 7.4, 1.25 M KCl, 0.5 M NaCl,
55 mM MgCl2, 5 mM EDTA. This is stored at 4°C.51. Low salt extract (LSE) buffer: 1X LSB, pH 7.2, 0.1 M DTT, 1X PIM plus NaF.
This is made fresh before use. PIM is 10X protease inhibitor mixture (PIM)(10 mM pefabloc, 0.1 mg/mL leupeptin, 5 μg/mL aprotinin, 10 μg/mL pepstatin,50 μg/mL trypsin inhibitor, 5 mM benzamidine, 8 mM ethyene glycol bis( -aminoethyl ether) N,N,N',N',-tetraacetic acid (EGTA), 5 mM EDTA, and250 mM NaF.
52. High salt extract (HSE) buffer: 5 M NaCl, 10 mM MgCl2, 10 mM DTT. This isstored at –20°C.
53. Salt wash buffer (SWB): 1X LSB, 0.5 M NaCl, 10 mM MgCl2, 1 mM DTT. Thisis stored at –20°C.
54. LM-HK buffer: 50 mM HEPES, pH 7.5, 50 mM KCl. This is stored at –20°C.55. LM-10XMED: 10 mM MgCl2, 0.2 mM EDTA, 1 mM DTT. This is stored at –20°C.56. 10 mM ATP, pH 7.5, is stored at –70°C.57. 400 ng/μL tetrameric bacterially expressed p53 is stored at –70°C.58. HiTrap MonoQ (5/5) column is obtained from Amersham Pharmacia Biotech.59. Buffer A: 15% glycerol, 25 mM HEPES pH 8.0, 0.02% Triton X-100, 5 mM
DTT, 1 mM benzamidine, 50 mM NaF.60. 0.22 μM Amicon® Filters are from Millipore (Bedford, MA, USA).
3. Methods3.1. Immunization with Phosphopeptides and Antibody Generation
For the generation of p53 BOX-1 phosphospecific polyclonal sera, syntheticphosphopeptides based on the p53 BOX-1 sequence (13PLSQETFSDLWKLLP27), with single phosphates at Thr18 or Ser20, were C-terminally coupled tothe hapten KLH and used to immunize rabbits using standard techniques (21).Panels of hybridomas were generated against similar p53 BOX-1 phospho-

178 Craig et al.
peptide antigens containing single phosphates at Ser15, Thr18, or Ser20, usingconventional technology (21,22).
1. Incubate 0.5 mL of peptide and 0.5 mL of KLH with glutaraldehyde at a finalconcentration of 0.1%, and cross-link at 37°C for 1 h.
2. Neutralize the glutaraldehyde by adding 0.1 mL of 1.5 M Tris-HCl, pH 8.0.3. Inject the peptide–KLH conjugate antigen into mice (50 μg) for MAb generation
or into rabbits (500 μg) for polyclonal antibody generation as described (22) (seeNote 3).
4. Purify the MAbs from hybridoma serum supernatant or from ascites tumors usingprotein G beads (manufacturer’s protocol), and dialyze the purified IgG againstPBS to stabilize the MAbs for storage at –20°C.
5. Purify the IgG in the rabbit serum (25 mL) by applying the serum (containing50 mM NaF phosphatase inhibitor) to a phosphopeptide column equilibrated inPBS (0.1 mg of peptide coupled to 0.1 mL of Reacti-Gel (6X) resin, according tomanufacturer’s suggestions). Wash the column with PBS, elute the IgG bound tothe phosphopeptide using 0.5 mL of antibody elution buffer, and dialyze thepurified IgG against PBS to stabilize the affinity purified polyclonal antibody forstorage at –20°C.
3.2. Use of ELISA to Characterize p53 BOX-1Phospho-Specific Antibodies
Streptavidin-capture peptide–ELISA was used to determine the specificityof the p53 BOX-1 phospho-specific polyclonal sera and monoclonal antibod-ies for a panel of N terminally biotinylated synthetic peptides (Table 1).
1. Coat microtiter wells with 5 μg/mL streptavidin in 50 μL H2O, and incubate at37°C overnight.
2. Block nonspecific binding sites on streptavidin using 200 μL/well 3BPBST.3. Add 25 ng/well biotinylated p53 peptides in 50 μL 5MPBST/ GP/OA, and incu-
bate for 1 h (see Note 4).4. For phospho-Ser15 MAbs, KLH-coupled p53 peptides were directly coated onto
microtiter wells at 2 μg/mL in ELISA coating buffer and incubated at 4°Covernight.
Table 1N Terminally Biotinylated Synthetic Peptides
BOX-1 peptide Sequence
Nonphos. Biotin - SGSG - 10VEPPLSQETFSDLWKLL26
Ser15-P Biotin - SGSG - 13PLS(PO4)QETFSDLWKLLP27
Thr18-P Biotin - SGSG - 13PLSQET(PO4)FSDLWKLLP27
Ser20-P Biotin - SGSG - 13PLSQETFS(PO4)DLWKLLP27

p53 Phospho-Specific Antibodies 179
5. Wash wells with 3 × 200 μL PBS-T, then block nonspecific binding to the peptideby adding 200 μL/well 5MPBST/ GP/OA and incubate for 1 h.
6. Dilute primary antibodies in 5MPBST/ GP and add 50 μL/well and incubatefor 1 h.
7. Antibody binding was detected by incubating with 1/1000 dilution either anti-mouse IgG-HRP (for MAbs) or anti-rabbit IgG-HRP (for polyclonal serum) in5MPBST/ GP, which permits luminometric detection using 50 μL/well ECL.For colorimetric detection, develop using 50 μL/well TMB complete substrate.The color reaction is stopped by the addition of 50 μL/well 0.5 M H2SO4, and read atO.D.450 nm using a microplate reader.
All incubations following the coating step are for 1 h at room temperature in ahumidified container, and wells are washed between steps with 3 × 200μL PBST.
3.2.1. Characterization of p53 BOX-1 Phospho-Specific PolyclonalSera: An Example of the IgG Complexity in Polyclonal Serum and theRelative Importance of Developing MAbs to Phosphorylation Sites
Binding of IgG from crude phospho-Thr18 antiserum to nonphosphorylatedpeptide and also to peptides with phosphate substitutions at either positions Thr18
or Ser20 was examined (Fig. 2; dark bars). Removal of phospho-insensitive anti-bodies from crude serum by absorption with nonphosphorylated BOX-1 peptideresulted in a reduced affinity of the polyclonal serum for the nonphosphorylatedsequence, but maintained binding to both phosphopeptides (Fig. 2; white bars).Purification of anti-phospho-Ser20 antisera by absorption with nonphosphorylatedpeptide was also insufficient to achieve complete phospho-specificity (data notshown). Thus, the purified anti-phospho-Thr18 IgG (Fig. 2) did not display strictphospho-specific epitope binding, and if this IgG were used to study the level of“Thr18 phosphorylation” of p53, then misleading results would be obtained. Thesedata indicate that the immune response to phosphopeptide antigens involves thegeneration of a mixture of B cell clones with either phospho-insensitive epitopesor with phosphate-dominant recognition determinants, as well as those with spe-cific reactivity towards the challenging antigen (see Note 1). Due to these diffi-culties in working with polyclonal mixtures and further unreliability in acquiringreproducible preparations in different rabbits, we sought to generate phospho-specific MAbs to produce a permanent resource.
3.2.2. Examples of Specificity of p53 BOX-1 Phospho-Specific MAbs
MAbs have an obvious advantage over polyclonal antisera for phospho-spe-cific reagent generation, as single clones can be selected that have the requiredspecificity. Selected clones were characterized for their specificity for site-

180 Craig et al.
specific phosphorylation using a panel of p53-derived BOX-1 N-terminallybiotinylated peptides (Table 1). The phospho-Ser20-sensitive MAb DO-1 wasincluded as a control (Fig. 3A).
3.2.2.1. DIFFERENTIAL SPECIFICITY OF PHOSPHO-THR18 MABS
Four clones generated were selected by dot-blot from a panel of hybridomasgenerated against the phospho-Thr18 peptide, and the specific binding ofsecreted antibodies to synthetic BOX-1 peptides was assessed using the pep-tide-ELISA (see Table 2). Two of the clones (FPT18 3.1 and FPT18 6D7)were insensitive to phosphate substitution (data not shown) and bound equallywell to all four BOX-1 peptides. A third clone had a similar specificity to MAbDO-1, binding efficiently to all peptides except phospho-Ser20. However, thefourth clone (FPT18) was specific for phosphate at Thr18 (Fig. 3B). This anti-body has been most useful for detecting Thr18 phosphorylation of p53 in clini-cal samples (11) and for in vitro kinase assays (data not shown).
Fig. 2. Characterization of polyclonal anti-sera raised against p53 BOX-1phosphopeptides. Specificities of crude (shaded bars) and purified (white bars)
-phospho-Thr18 polyclonal anti-sera for synthetic p53 BOX-1 N terminallybiotinylated peptides (unphos, nonphosphorylated; T18-P, phospho-Thr18; and S20-P,phospho-Ser20) determined by peptide–ELISA.
Fig. 3. Characterization of p53 BOX-1 phospho-specific MAbs. The specificities ofthe indicated MAbs to the indicated phosphopeptides were determined by ELISA: (A)DO-1; (B) FPT18; (C) FPS20a; and (D) FPS15-1. (E) Phospho-specific MAbs wereexamined for tolerance to adjacent phosphorylation. The effect of dual-site Thr18/Ser20
phosphate on the binding of MAbs FPT18 (top), FPS20a (middle), and FPS20b (bot-tom) to synthetic p53 BOX-1 N terminally biotinylated peptides (DP, diphospho-Thr18/Ser20; T18-P, phospho-Thr18; and S20-P, phospho-Ser20; unphos, nonphosphorylated)was determined using peptide-ELISA.

p53 Phospho-Specific Antibodies 181

182 Craig et al.

p53 Phospho-Specific Antibodies 183
3.2.2.2. SPECIFICITY OF PHOSPHO-SER20 MABS
The specific binding of two clones (FPS20a and FPS20b), selected from apanel of hybridomas generated towards the phospho-Ser20, to synthetic BOX-1peptides was assessed. Both clones had identical specificities for the phospho-Ser20 peptide and did not bind to phospho-Ser15, phospho-Thr18, orunphosphorylated peptides (one clone shown in Fig. 3C). These IgGs have avery low affinity for Ser20-phosphorylated p53 protein and have not been use-ful for immunoblotting p53 from clinical material or cell lines. However, theseIgG are useful for in vitro kinase assays in a cell-free system (see Subheading3.9.). For immunoblotting, DO-1 epitope masking as a probe for Ser20 phos-phorylation has been developed (16).
3.2.2.3. SPECIFICITY OF PHOSPHO-SER15 MABS
Following the primary screening of hybridomas generated towards thephospho-Ser15 peptide, four clones were selected. However, despite MAb rec-ognition of the C-terminally KLH-coupled phospho-Ser15 peptide, there was nodetectable binding to any of the N-terminally biotinylated BOX-1 peptides (datanot shown). The proximity of the N-terminally coupled biotin moiety stericallyoccluded antibody access to the phospho-Ser15 site. Therefore, to characterizethese antibodies, a panel of free BOX-1 peptides (i.e., with no biotinylation) wascoupled to BSA. Following direct capture of the BSA-coupled peptides to ELISAwells, phospho-Ser15 MAb binding could be measured. Using this approach,three MAbs (one clone is shown; FPS15-1) out of four selected clones exhibitedspecific binding to only the phospho-Ser15 peptide (Fig. 3D).
3.3. Fine Mapping of Phospho-Specific EpitopesUsing More Sophisticated ELISA Techniques
The p53 BOX-1 domain contains three phospho-acceptor residues within asix-amino acid sequence and, therefore, has the potential to be phosphorylatedat multiple sites in vivo. In support of this, Chk2 has been shown to phospho-
Table 2Specific Binding of MAbs ot BOX-1 Peptides
MAb Nonphos Ser15-P Thr18-P Ser20-P Specificity
FPT18 — — *** — T18-P specificPT18 3.1 *** *** *** *** NonspecificPT18 C12 *** *** *** — DO1-likePT18 6D7 *** *** *** *** Nonspecific
***, strong binding to the peptide.—, no binding.

184 Craig et al.
rylate both Ser15 and Ser20 residues in vitro (23). Firstly, we tested the possi-bility that dual site phosphorylation could preclude binding of the phospho-Thr18 and phospho-Ser20 reagents using a doubly phosphorylatedphospho-Thr18/Ser20 peptide. Secondly, the relative contribution of charge andsequence context towards the recognition elements of individual MAbs wasdefined using panels of aspartate-substituted or alanine-scanned peptides. Wehave used these analyses to define the epitopes of two FPS20 MAbs (11) andthe only commercial phospho-p53 (Ser20) polyclonal antibody available (23)and to rationalize the observed restricted applicability of these reagents.
3.3.1. Examples of Steric Hindrance by Adjacent Phosphate
Peptide-ELISA data showed that an adjacent peptide at Ser20 caused only aslight reduction in FPT18 binding compared to a single phosphate at Thr18
(Fig. 3E, top). However, double-site Thr18/Ser20 phosphorylation severelyimpaired the ability of both FPS20a and FPS20b to recognize their epitopes. Inthe presence of an additional phosphate at Thr18, FPS20a binding to phospho-Ser20 was reduced by 82% (Fig. 3E, middle), and FPS20b binding was almostcompletely blocked (Fig. 3E, bottom). These data indicate that lack of reactiv-ity of phospho-specific IgG to phospho-Ser20 site can be explained by eitherdephosphorylation of p53 at Ser20, or a double-site phosphorylation at Thr18/Ser20. Apparent increases in Ser20 phosphorylation observed with the Ser20
phospho-specific IgG may actually result from dephosphorylation at Thr18 andconstitutive maintenance of the Ser20-phosphate. As such, studies where phos-phorylation changes at Ser20 on endogenous p53 may actually reflect changesin Thr18 phosphorylation have been published.
3.3.2. Aspartate Cannot Mimic a Phospho-Serfor all Phospho-Ser20 Antibodies
The addition of a phosphate moiety to a protein confers a bulky negativecharge, which may classically and theoretically be mimicked by an aspartate orglutamate residue. We synthesized a panel of peptides based on the p53 BOX-1sequence with single or double aspartate substitutions at the Ser15 (S15D), Thr18
(T18D), and Ser20 (S20D) positions and tested the ability of two FPS20 MAbsand a commercial phospho-Ser20 polyclonal antibody to bind these peptides.The phospho-Ser20-specific MAb FPS20a, surprisingly, bound to the mutantpeptides T18D and S20D, but not to the S15D peptide (Fig. 4A, top). Enhancedbinding to the double T18D/S20D peptide was observed, suggesting that thisantibody recognizes a broad negative charge distribution. In contrast, neitherMAb FPS20b (Fig. 4A, middle) nor commercial phospho-p53 (Ser20)polyclonal antibody (Fig. 4A, bottom) could detect any of the mutant pep-tides, indicating that aspartate could not mimic phospho-Ser for these antibod-

p53 Phospho-Specific Antibodies 185

186 Craig et al.
Fig. 4. The effect of mutant residues on the binding of phospho-Ser20-specificantibodies to synthetic p53 BOX-1 N-terminally biotinylated peptides. (A) Aspartatesubstitution of the BOX-1 domain using FPS20a (top), FPS20b (middle), and commer-cial polyclonal anti-phospho-Ser20 sera (bottom). (B) Alanine substitution of the BOX-1domain using FPS20a (top), FPS20b (middle), and commercial polyclonal anti-phospho-Ser20 sera (bottom).

p53 Phospho-Specific Antibodies 187
ies, possibly due to an insufficient negative charge or shape parameters. How-ever, the phospho-specific Ser20 polyclonal antibody displayed some affinityfor the nonphosphorylated epitope (Fig. 4A, bottom), and its use to detectSer20 phosphorylation is therefore questionable.
3.3.3. Alanine-Scanned Phosphopeptides Can Define MAb Epitopes
The sequence requirements for binding of the three phospho-Ser20 anti-bodies were determined using a set of alanine-scanned peptides based on thep53 BOX-1 phospho-Ser20 sequence with single alanine substitutions at everyresidue. Mutation of Lys22 or Trp23 strikingly reduced MAb FPS20a binding(Fig. 4B, top), indicating that the epitope was very short, consisting of aminoacids 20S(P)XLW23. In contrast, mutation of residues Gln16, Glu17, Phe19,Asp21, and Leu26 reduced binding moderately, and mutations at Thr18, Leu22,and Leu25 severely decreased binding of FPS20b to the phosphopeptide (Fig.4B, middle). The marked requirement of this antibody for Thr18 can explainthe inhibitory effect of phospho-Thr18 found with the double Thr18/Ser20
phosphopeptide (Fig. 4B, bottom). Also, neutralizing the positively chargedLys24 increased binding to this antibody. It is clear that FPS20b has a relativelybroad epitope and is sensitive to the size of the negative charge. Finally, thecommercially available phospho-p53 (Ser20) polyclonal antibody (23) appearedto consist of a dominant clone with the narrow epitope 20S(P) DL22 (Fig. 4B,bottom). This is consistent with the relative scarcity of specific clones inpolyclonal sera (see Subheading 3.2.1.).
3.4. Use of BIAcore to Characterize p53 BOX-1 Phospho-Specific MAbs
An analysis of the real-time kinetics of antibody–antigen interactions forphospho-specific reagents is possible using surface plasmon resonance (SPR)technology. Briefly, this assay can detect changes in mass caused by transientprotein–protein interactions at the surface of a metal chip by measuring changesin the angle of light reflected from the chip. By chemically attaching singlepeptides to the metal surface, and allowing antibodies to flow over the surfaceof the chip, transient interactions can be recorded as a shift in angle of reflectedlight. Thus, SPR allows a sensitive and direct measurement of real-timebiospecific interactions, without the need for labeling strategies. For the char-acterization, synthetic biotinylated peptides were individually captured ontostreptavidin chips, and the real-time kinetics of association and dissociation ofthe phospho-specific antibodies to individual peptides was measured. The datacaptured for all four peptides was combined in a single graph for each anti-body, with the Y-axis representing resonance units (RU) of antibody binding,and the X-axis representing time in seconds.

188 Craig et al.
1. Dock two sensor SA chips into a 2000 upgrade and prime with 200 μL primingbuffer using a flow rate of 20 μL/min.
2. Dilute MAbs in HBS to a final concentration of 100 nM and inject consecutivelyover the primed flow cells at 5 μL/min to determine nonspecific binding. Regen-erate flow cells between MAbs using 20 μL stripping buffer.
3. Dilute four biotinylated p53 BOX-1 peptides to 500 ng/mL in HBS and inject50 μL/flow cell using a flow rate of 20 μL/min. This procedure binds the pep-tides individually to the streptavidin surface of each of four flow cells on the twosensor SA chips, resulting in a baseline shift of approx 500 resonance units (RUs)(1000 RU 1 ng).
4. Pass MAbs consecutively over each flow cell as before, regenerating the flowcells between antibodies using stripping buffer. Analyze individual peptide bind-ing data using the dedicated software package (Biacore) to generate compositegraphs for each MAb.
As an example, the kinetics of the Ser20 phospho-specific reagents were sub-ject to analysis. For FPS20a, high levels of antibody bound the phospho-Ser20
peptide, and there was no dissociation within 350 s (Fig. 5A). However, somesignificant binding to both phospho-Ser15 and phospho-Thr18 peptides didoccur, although the off-rates were rapid. No binding to the nonphosphorylatedsequence was detected. The FPS20b MAb reagent bound only to the phospho-Ser20 peptide, and there was no dissociation within 350 s (Fig. 5B). In thiscase, no binding to the remaining three peptides occurred. In general, there-fore, N-terminal phospho-specific MAbs can be characterized for specificityand affinity using peptides coupled to a solid phase which places significantconfidence in their use as reagents to study signaling to p53.
3.5. Phage–Peptide Display to Define MAb Epitopes
In contrast to the N-terminal antibodies, the C-terminal MAbs towards Ser315
and Ser392 were characterized by phage display experiments in order to pro-vide an alternate example of how to characterize the specificity of phospho-specific MAbs. Two phospho-antibodies specific for phospho-Ser315 (FPS315)or phospho-Ser392 (FPS392) were raised against either the KLH-conjugatedphosphopeptide NNTSSSPO4PQPKKKPLDG325 (corresponding to aminoacids containing the CDK site on human p53) or phosphopeptide376STSRJKKLMFKTEGPDSPO4 D393 (corresponding to amino acids contain-ing the CK2 site on human p53), respectively, and their use in a Cdk2/Cdc2kinase or CK2 kinase assay has been reported (24). Purification of the MAbfrom hybridoma tissue culture supernatants using Protein-G sepharose (Sub-heading 3.1.) was required to obtain pure IgG devoid of contaminating phos-phatases found in serum supernatant, and this highly purified IgG was used inthe in vitro assays described below. Phage–peptide display libraries were usedto define the essential residues within the FPS315 and FPS392 epitopes.

p53 Phospho-Specific Antibodies 189
Fig. 5. Determination of real-time kinetics of peptide–antibody interactions usingsurface plasmon resonance. For the measurement of peptide–MAb interactions,nonphosphorylated or singly phosphorylated synthetic N terminally biotinylated p53BOX-1 peptides (unphos, nonphosphorylated; S15-P, phospho-Ser15; T18-P, phospho-Thr18; and S20-P, phospho-Ser20) were attached to individual streptavidin chips, andMAbs were passed over the chip surfaces. Binding data for two different phospho-Ser20-specific clones is shown: one has a high on-rate for any phospho-peptide (A) anda second has complete phospho-Ser20 specificity (B).

190 Craig et al.
1. Coat protein G affinity-purified MAbs onto microtitre wells at a concentration of5 μg/mL in 50 μL of ELISA coating buffer, and incubate at 37°C overnight.
2. Block nonspecific binding sites on MAbs with 200 μL/well 3BPBST.3. Select bacteriophage from libraries containing random peptides inserted within
the phage III coat protein according to the manufacturer’s protocol. Two separatelibraries were screened: PhD12 contains random linear 12-mer peptides; C7Ccontains 7-mer cyclic peptides, the structure of which is constrained by a disul-fide bridge between two cysteine residues at either end of the insert peptide. Aftertwo cycles of selection and amplification, individual phage clones were screenedfor antibody binding by ELISA, and the inserts of strongly positive clones weresequenced.
3.5.1. Phage–Peptide Display of FPS315
Since the peptide library was not phosphorylated prior to its use, it was notobvious that phage–peptide display would select peptides representing anepitope for a phospho-specific antibody, which has an absolute requirementfor the phosphate. However, positive peptide–phage clones were selected bytwo rounds of biopanning that bound to the MAb FPS315, and all contained aninvariant PQP motif corresponding to Pro316Gln317Pro318 on human p53 of313SSSPQPKKK321 (6). However, differences were observed in amino acidsflanking the PQP motif, depending upon the combinatorial library utilized. Thelinear 12-mer peptide library gave rise to a predominant set of clones with astabilizing glutamate (negatively charged phosphate mimetic) at the Ser315
position and two other clones with a glycine or serine at the Ser315 position(data not shown). In contrast, the cyclic 7-mer peptide library selected cloneswithout the expected stabilizing aspartate at the Ser315 position, but yielded astabilizing lysine at position 320, which was not observed using the linear com-binatorial library. Although the differences in the affinity between each of thesepeptide–epitope clones are not known, these experiments demonstrate that animportant recognition feature of the MAb FPS315 involves its specificity foramino acids flanking the Ser315 phosphorylation site of p53 and that this anti-body is therefore not just detecting a phospho-serine moiety. This antibody canbe used uniquely to measure the stoichiometry of phosphorylation on the p53tetramer (see Subheading 3.6.1.).
3.5.2. Phage–Peptide Display of FPS392
Phage-peptide display was also used to define the FPS392 consensus epitope.ELISA wells were coated with purified FPS392 and used to select bacterioph-age from libraries containing random peptides inserted within the phage III coatprotein. After two cycles of amplification, antibody-specific peptide–phagewere identified by ELISA, and the inserts were sequenced. Although two dif-

p53 Phospho-Specific Antibodies 191
ferent libraries were screened (a cyclic 7-mer and a linear 12-mer), only the12-mer peptide library selected peptide–phage populations, which expressedepitopes with detectable affinity for FPS392 (17). A general peptide consensusof Phe-His-x-x-Trp-Pro was observed, which exhibited homology to the C-ter-minal region of human p53 protein that was used as the original antigen(385FKTEGPDSD393; Phe385-x-x-x-x-Pro390). FPS392 can also be used to studyPKR/CK2-site signaling to the CK2/PKR site of p53 protein in species otherthan human, suggesting that the conserved amino acids F-x-x-x-GPDSPO3D arecritical in the recognition of denatured antigen by this MAb.
3.6. Electrophoretic Mobility Shift Assay (EMSA)
p53 protein is tetrameric, thus raising the relatively unique issue ofdetermining the number of monomers modified by a particular enzyme. Mostimmunoblotting data do not address the stoichiometry of p53 modificationin vivo, which is an important milestone in determining the significance of anenzyme pathway interacting with p53 in cells. p53 protein bound to DNAcan be supershifted by an MAb, such as DO-1, to produce four discreteIgG:p53:DNA complexes that represent integers of the number of IgG boundper monomer (25). Of all the phospho-specific MAbs described in this review,only FPS315 (recognizing the phospho-CDK site) can be used to determine thestoichiometry of modification (6).
1. Prepare polygrip consensus p53 dsDNA radiolabeled probe. Add 2 μg of eacholigomers 5381 and 5382 to 0.7 μL of 10X Klenow buffer (Promega, Madison,WI, USA), 5 μL 32P- -ATP and 0.5 μL T4 kinase (Promega). Make up the vol to10 μL with H2O, and incubate at the following temperatures: 37°C for 45 min;80°C for 3 min; 65°C for 5 min; 37°C for 15 min; then allow to come to roomtemperature over 20 min. Purify labeled double-stranded (ds)DNA probe using achroma-spin-10 column and adjust the final concentration to 10 ng/μL in TE (seeNote 5).
2. Preparation of p53 samples. CyclinB/CDK2-phosphorylated bacteriallyexpressed recombinant p53 (see Fig. 6A) and endogenous p53 from UV-C irra-diated tumor cells (see Fig. 6C) were analyzed for Ser315 phosphorylation (6)(see Note 6).
3. DNA-p53 binding reaction: incubate 10 μL DNA-binding (DB) buffer, 2 ng 32PDNA probe, 100 ng sheared salmon sperm competitor DNA, 1 μL FPS315, and1–5 μL kinase reaction products (see Note 7) or 5 μg nuclear lysate on ice for15 min.
4. Load 15 μL samples onto a 4% polyacrylamide nondenaturing gel and electro-phorese at 200 V for 2 h at an ambient temperature of 4°C, using prechilled appa-ratus and running non-denaturing gel buffer.
5. Dry gel at 80°C for 1 h, and expose to photographic film at –70°C for autorad-iography.

192 Craig et al.
Fig. 6. In vivo Ser315 phosphorylation detected using the FPS315 MAb. p53 phos-phorylation was analyzed by: (A) immunoblotting after phosphorylation with cyclin-cdk2 kinase in vitro: lane 1, no kinase; lane 2, cyclinA-cdk2; lane 3, casein kinase 2.The top panel is immunoblotting with FPS315 after immunoprecipitation of total p53,and the bottom panel is the total p53 protein levels. Asterisks mark the position of p53.(B) Shifting native p53-DNA complexes in a DNA binding reaction without or withFPS315 added (as indicated) to determine stoichiometry of in vitro cdk2-phosphory-lated p53 (lane 1, no kinase; lane 2, with kinase phosphorylation at t = 0; lane 3, nokinase; lane 4, with kinase phosphorylation at t = 30 min). (C) Immunoblotting afterimmunoprecipitation of total p53 protein from crude lysates with FPS315: lane 1, noIgG; lane 2, nonirradiated MCF7 cells; lane 3, irradiated MCF7 cells. The top panel isblotted with DO-1, and the bottom panel is blotted with FPS315. Asterisks mark theposition of p53. (D) Shifting native p53-DNA complexes in a DNA-binding reactionto determine stoichiometry of in vivo phosphorylated p53 (lane 1, irradiated MCF7cells without FPS315; and lane 2, irradiated MCF7 cells with FPS315).

p53 Phospho-Specific Antibodies 193
3.6.1. Native Gel Electrophoresis Using Phospho-Specific AntibodiesCan Define PhosphoStoichiometry of the Tetrameric p53
The phosphorylation of p53 by CDK2 results in the progressive supershiftingof the phospho-p53 by the FPS315 IgG until the maximum phosphorylationof the tetramer where no unmodified p53 protein remains (Fig. 6B, lane 4vs lane 1). When p53 protein from irradiated MCF7 cells is phosphorylated(Fig. 6C), the majority of p53 protein is similarly shifted (Fig. 6D), indicatingthat more than 50% of the tetramers are modified more than twice in vivo afterdamage (6).
3.7. Immunoblotting
The utility of immunoblotting with phospho-specific MAbs to demonstratechanges in damaged-induced phosphorylation of p53 or differential phospho-rylation in breast cancers is discussed in this section (see Note 8).
1. For tissue culture cells, prepare extracts from cells seeded in 10-cm diameterpetri dishes. Scrape cells into ice-cold PBS, pellet by centrifugation, and snap-freeze in liquid nitrogen. For tumor samples, prepare extracts from small tissuechips taken from snap-frozen tumor samples, stored at –70°C.
2. Add 2 to 3 vol of urea lysis buffer to tissue chips or cell pellets. Tissue chipsare lysed using a microtube pestle, and cells are lysed by pipeting. Incubate for15 min on ice.
3. Clarify the lysates by centrifugation at 11,000g for 10 min at 4°C.4. Determine the protein concentration by Bradford assay, using a BSA titration
curve. Boil equivalent amounts (see Note 9) in Laemmli buffer before loadingonto a 10% SDS-polyacrylamide gel.
5. Transfer the protein to nitrocellulose following electrophoresis, and block themembranes in 5MPBST containing 10 mM -GP for 1 h at room temperature(see Note 3).
6. Probe the blots with the affinity-purified primary antibody diluted 1/1000 in5MPBST containing 10 mM -GP.
7. Detect the antigen using HRP-conjugated secondary antibody, and visualizeusing ECL.
3.7.1. Phosphorylation of p53 Derived from Breast Cancersat Ser15 and Thr18
The use of polyclonal antibody reagents to measure damage-dependentchanges in p53 phosphorylation at Ser15 and Ser20 has been reported previ-ously (26). However, the specificity of many of these reagents is unproven,

194 Craig et al.
and their sensitivity to nearby phosphates has not been published. It is mostlikely that polyclonal preparations of phospho-specific IgG are not mono-spe-cific, and we have focused on using MAbs in their place. However, this placessignificant limitation on a comprehensive study of signaling to p53, as it hasbecome evident that each phospho-specific MAb can only be used for a subsetof assays that are summarized in this text. The phospho-specific MAbs spe-cific for Ser15 (data not shown) and Thr18 (Fig. 7) can be used in clinical mate-rial to show phosphorylation of stabilized p53 protein at these two sites,suggesting their importance in modulating p53 activity, especially since phos-phorylation at these sites can either block MDM2-binding or promote p300binding to p53.
3.7.2. Phosphorylation of p53 Derived from Breast Cancers at Ser20
The phospho-specific Ser20 MAb and the only commercially availablepolyclonal antibody both have a very low affinity for Ser20-phopshorylatedp53 and are best used for in vitro kinase assays (see Subheading 3.9.). Further,the anti-phospho-Ser20 polyclonal was originally described in coupled immu-noprecipitation–immunoblotting assays. However, since DO-1 antibody is spe-cifically blocked by Ser20 phosphorylation, this assay is a more reliable measureof Ser20 phosphorylation via epitope masking when normalized to total p53using DO-12 (or other antibodies that are not sensitive to posttranslation modi-fication) (14,16).
3.7.3. Phosphorylation at the CDK2 Site at Ser315
Denaturing immunoblots of human recombinant p53 protein demonstratethat FPS315 only recognizes p53 phosphorylated at Ser315 (Fig. 6A, top panel,
Fig. 7. Thr18 phosphorylation on p53 in breast cancers in vivo detected using MAb.FPT18 p53 phosphorylation was analyzed by immunoblotting lysates for: p53 protein(top panel, DO-12) or p53 phosphorylation at Thr18 (bottom panel) FPT18. Manypatients displayed different levels of total p53 protein comparative to Thr18 phospho-rylation. Since all the samples have mutant p53 (data not shown), these data suggestthere are significant differences in the activity of the Thr18 kinase in different breastcancers.

p53 Phospho-Specific Antibodies 195
lane 2), but does not recognize nonphosphorylated p53 (Fig. 6A, top panel,lane 1) or Ser392 phosphorylated p53 (Fig. 6A, top panel, lane 3) (6,24). Aduplicate immunoblot probed with antibody DO12 shows that p53 protein lev-els are equal in all three lanes (Fig. 6A, bottom panel). However, the FPS315antibody, though specific, has a relatively low affinity for its epitope and can-not always be used to detect endogenous p53 protein phosphorylation fromcell lysates by direct immunoblotting.
3.7.4. Phosphorylation at the CK2 Site at Ser392
Immunochemical blotting can be used to demonstrate that FPS392 binds spe-cifically to human p53 protein in denaturing immunoblots only after in vitroSer392 phosphorylation of p53 by CK2 (17). In addition, lysates from normalcells demonstrate an increase in steady-state phosphorylation at Ser392 ofendogenous p53 after exposure to UV or ionizing radiation (17,18). Further,FPS392 can be used in clinical material to define the levels of Ser392 site phos-phorylation in formalin-fixed sections when p53 protein is denatured (see Sub-heading 3.8.2.). As FPS392 is one of the few phospho-specific antibodies wehave developed that can be used on either human or mouse p53 (discussed inSubheading 3.5.2.), it has been possible to demonstrate an increase in CK2-sitephosphorylation of p53, coincident with elevated p53 protein levels, in both thespleen and thymus of animals exposed to whole body ionizing radiation (27).FPS392 has also been a valuable probe to examine the p53-activation mecha-nism by combined drug treatment. A375 cells exposed to X-irradiation producea stabilized p53 protein of low specific activity. The addition of the kinaseinhibitor roscovitine to X-irradiated cells can reactivate the p53 response, andthis results in hyper-phosphorylation at the Ser392 site that is not seen withX-irradiation or drug treatment alone (17). Thus, recruitment of the CK2 kinasepathway may play an important role in p53 activation after damage.
3.8. Immunohistochemical Applicationsto Study Kinase Activity In Vivo
1. Dry 4-μm-thick formalin-fixed and paraffin-embedded tissue sections onto glassslides and take down to water, using standard methodology.
2. Block endogenous peroxidase activity by incubating in 1.5% hydrogen peroxidefor 10 min. Wash in running tap water for 5 min.
3. Perform antigen retrieval as required using a microwave-based technique.4. Block slides with 10% normal goat serum containing 2.5% avidin for 5 min.5. Incubate with primary antibody diluted in PBS containing 2.5% biotin overnight
at 4°C in a humidified chamber. Primary antibody dilutions are: 1/50000 forCMI antiserum; 1/100 for DO-1 tissue culture supernatant; 1/2000 for protein

196 Craig et al.
G-purified FP392; 1/200 for anti-phospho-p53 Ser15 polyclonal. Wash sectionsin PBS for 5 min.
6. For antigen detection, use a biotin–streptavidin immunoperoxidase kit and DABin 0.03% hydrogen peroxide as a chromogenic agent. Incubate slides with 1/66dilution anti-mouse IgG-biotin (for MAbs) or anti-rabbit IgG-biotin (forpolyclonal serum) antibody in PBS for 30 min at room temperature. Wash in PBSfor 5 min.
7. Incubate with ABC solution for 30 min at room temperature. Wash in PBS for 5 min.8. Incubate with DAB for 5 min. Wash in PBS for 5 min.9. Counterstain slides with Mayer’s hematoxylin. Wash briefly in water and dehy-
drate through graded alcohols before clearing with Histoclear. Mount slides usingDPX mountant.
Controls: sections known to stain positively in each batch replace the pri-mary antibody with PBS for negative controls.
3.8.1. Ser386 (CK2 Site) Phosphorylation on Murine p53 Increasesafter X-Irradiation In Vivo
Although original studies have shown that ionizing radiation does not inducephosphorylation of p53 at the CK2 site (28,29) using polyclonal antibodiesgenerated to the phospho-CK2 epitope (Ser392 on human p53 or Ser386 onmurine p53) (28,29), the CK2 site has been shown to be targeted by ionizingradiation in cell lines and in murine tissue using the phospho-Ser392-specificMAb characterized above (17,27). Methods have been developed for demon-strating strain differences in the activation of the CK2 pathway in vivo provid-ing a model to measure how the CK2 pathway is regulated (27). However, theMAbs are not very useful for staining murine tissue, since a very high back-ground is often obtained due to cross-reactivity of mouse blood in tissue withthe second antibody to murine IgG. Also, direct cross-linking of the MAbs toperoxidase to counteract this problem usually inactivates the IgG (data notshown).
3.8.2. Differential Ser15 and Ser392 Phosphorylation in Clinical Material
For cell and tissue staining, the strict requirement for high specificity andhigh affinity of the IgG generally rules out the use of this first generation ofphospho-specific MAbs reported in this review for staining clinical material.Two notable exceptions include the commercially available polyclonalantibody to phospho-Ser15 and MAb FPS392 (Fig. 8). UV-damaged humanskin can show induction of p53 protein using the polyclonal antibody CM1 orthe MAb DO-1, as well as phosphorylation of p53 at Ser15 or Ser392 (Fig. 8A–D).

p53 Phospho-Specific Antibodies 197
Fig. 8. IHC of p53 phosphorylation on UV-treated human skin. UV-irradiated skinarchive was processed for IHC, and p53 levels or phosphorylation were examined using:(A) CM1; (B) DO-1; (C) FPS392; and (D) anti-phospho-Ser15 polyclonal antisera.
Interestingly, the Ser15 phosphorylation shows cytoplasmic staining (Fig. 8D),consistent with the cytoplasmic localization of ATM family members. How-ever, the drawback of immunohistochemistry (IHC) is that the stoichiometry isunclear, and the possibility that staining comes from cross-reaction cannot beruled out.
3.9. Detection of Site-Specific Kinase Activity In Vitro
Despite problems in the detection of endogenous modified p53, our phospho-specific MAb reagents have proven exceptional in enabling the developmentof immunochemical assays for studying the regulation of the physiological

198 Craig et al.
kinases that target p53 BOX-1 sites in vivo. Kinases from lysates were incu-bated with p53 protein substrate in the presence of ATP, and site-specific phos-phorylation is detected by immunoblotting. Immunochemical assays have aclear advantage over standard radioactive kinase assays, which rely on theincorporation of 32P-orthophosphate into a peptide substrate, usually mutatedto contain only one phospho-acceptor to measure specific kinase activity. Non-radioactive assays are relatively unaffected by the presence of contaminatingkinases, enabling the activities of several different kinases targeting distinctsites within the p53 molecule to be assayed from a single crude extract prepa-ration. Additionally, the use of a native wild-type p53 substrate facilitates thedevelopment of assays for kinases (e.g., the Ser20 kinase assays described inthe following example) that cannot phosphorylate a peptide containing the tar-get site due to the necessity for other distal docking-site sequences, as has beenreported for cyclinA-CDK2 on p53 (24). These small molecules permit thedevelopment of specific kinase inhibitor as a first step in drug development.
The site-specific in vitro kinase assay is based on the method of Achari andLees-Miller (30).
Fig. 9. In vitro kinase assays. (A) Full-length purified p53 was incubated either aloneat the 0°C (lane 1) or at 30°C in the absence (lane 2) or presence of 50 U of purifiedDNA-PK (lane 3), or with 10 μg A375 HSE prepared from untreated cells (lane 4) orfrom cells treated with 2 J/m2 (lane 5), 5 J/m2 (lane 6), or 10 J/m2 UV-C (lane 7), 33 μLdimethylformamide (DMF) (lane 8), or cisplatin at 5 μg/mL (lane 9), or 25 μg/mL(lane 10). Ser20 site-specific phosphorylation of p53 was detected by immunoblottingof reaction products with FPS20. (B) Lysates from A375 cells were fractionated on ananion exchange column using a 0–0.5 M KCl gradient. Fractions containing p53 Ser20
site-specific kinase activity were detected by immunoblotting reaction products withFPS20. The peak of Ser20 kinase activity eluted at 0.35–0.40 M KCl.

p53 Phospho-Specific Antibodies 199
1. Treat cells as required and harvest according to Subheading 3.7.1. Add 100 μLLSE buffer to each frozen cell pellet and lyse cells by pipeting. Incubate on icefor 5 min and snap-freeze in liquid nitrogen. After at least 15 min, thaw frozenextracts on ice, and add 11 μL HSE buffer per 100 μL cell extract. Incubate onice for 5 min.
2. Spin these high salt extracts (HSEs) at 10,000g for 3 min at 4°C, and remove thesupernatant. Add 50 μL SWB to the pellet, mix, and centrifuge as above. Add thesecond supernatant to the first, snap-freeze, and store at –70°C in 20-μL aliquots.
3. Add 100 ng bacterially expressed p53 tetramers to 10 μL HK, 2 μL 10X MED,100 μM ATP, and either 2 μg A375 HSE or 1 μL A375 Q-Sepharose fraction ina final vol of 20 μL (see Notes 2 and 10).
4. Incubate reactions at 30°C for 30 min, then stop by the adding 30 μL SDS-SB.Resolve 10-μL samples (containing 20 ng p53) by 10% SDS-PAGE, and immunoblotwith the phospho-specific antibodies to determine site-specific phosphorylation. p53protein levels are normalized by reprobing blots with MAb DO-12.
3.9.1. Phospho-Specific MAbs Can Be Used to Assay Site-SpecificKinase Activity in Crude Extracts
HSEs prepared from a melanoma cell line treated with low dose UV-C non-ionizing radiation or the DNA cross-linker cisplatin were assayed for Ser20
kinase activity (Fig. 9A). Low dose UV-C (2 J/m2) inhibits S20K activity (mea-sured using FPS20a reactivity following immunoblotting of the kinase reactionproducts), and this effect is reduced with increasing doses of UV-C (Fig. 9A,lanes 5–7). Similarly, high dose cisplatin inhibits S20K activity (Fig. 9A, lanes8–10). The specificity of FPS20a on p53 protein (as opposed to p53 BOX-1peptides, as described in Subheading 3.2.3.) is demonstrated by its inabilityto detect DNA-PK-treated p53 (Fig. 9A, lane 3) that targets residues Ser15
and Ser37.
3.9.2 Purification of Site-Specific Kinase Using Phospho-Specific MAbs
It is possible to use this methodology to purify physiological p53 kinases bycolumn chromatography. Four milligrams of undamaged A375 HSE was filtered(0.22 μM) and fractionated on a MonoQ anion exchange column using a 0–0.5 MKCl gradient in Buffer A. The site-specific kinase assay was used to showelution of the major S20K activity in (Fig. 9B) from 0.3–0.5 M KCl. In thisway, column chromatography can be used to purify site-specific p53 kinases tosufficient homogeneity to allow their identification by mass spectroscopy.
4. Notes1. It is important to point out that several studies have used polyclonal phospho-
specific sera that are uncharacterized with respect to specificity, and therefore,conclusions based on the use of these reagents may be unreliable.

200 Craig et al.
2. The general phosphatase inhibitors, NaF and GP, block phosphatase functionby competing for binding with phosphoprotein substrates to the phosphataseenzyme, i.e., they are competitive inhibitors. Although they are interchangeablein most assays, NaF may also be toxic to some enzymes. For this reason, GP isthe preferred inhibitor used in kinase assays. Okadaic acid is a marine toxin pro-duced by dinoflagellates and is a potent inhibitor of types 1 and 2A protein phos-phatases.
3. Primary screening of secreted MAbs by dot blotting with BSA-coupled peptidesfacilitated the selection of individual clones that bound to the antigenic peptideand eliminated KLH-specific clones.
4. All blocking buffers contain GP to inhibit potential phosphatases present inBSA or fat-free milk powder.
5. Labeled probe can be stored at –20°C and used for up to 4 wk.6. CDK kinase assay: incubate 100 ng full-length bacterially expressed p53 protein
with 1 μL baculovirus co-expressed recombinant cyclin B and CDK2 with 250 μMATP in 15 μL total vol CDK kinase buffer at 30°C for 30 min. Process immedi-ately or snap-freeze in liquid nitrogen and store at –70°C (see Note 10).
7. Kinase reaction products must be titrated into the DNA binding reaction, as theefficiency of p53 phosphorylation will vary with each batch of cyclinB/CDK2and p53 preparations.
8. Despite their specificity, the N-terminal p53 MAbs generated in our laboratoryhave not generally proven useful for detecting endogenous p53 in cell lines. Thisis presumably due to their low affinity for p53 protein.
9. The amount of lysate required to achieve a good signal will vary depending oncell type and antibody affinity, but use 10 μg per sample to start.
10. The addition of phosphatase inhibitors when assaying for kinase activity usingwhole cell extracts is optional, as some kinases are activated by dephosphorylation.
References1. Vogelstein, B., Lane, D. P., and Levine, A. J. (2000) Surfing the p53 network.
Nature 408, 307–310.2. Hupp, T. R., Lane, D. P., and Ball, K. L. (2000) Strategies for manipulating the
p53 pathway in the treatment of human cancer. Biochem. J. 352, 1–17.3. Hupp, T. R., Sparks, A., and Lane, D. P. (1995) Small peptides activate the latent
sequence-specific DNA binding function of p53. Cell 83, 237–245.4. Blaydes, J. P. and Hupp, T. R. (1998) DNA damage triggers DRB-resistant phos-
phorylation of human p53 at the CK2 site. Oncogene 17, 1045–1052.5. Wang, Y. and Prives, C. (1995) Increased and altered DNA binding of human p53
by S and G2/M but not G1 cyclin-dependent kinases. Nature 376, 88–91.6. Blaydes, J. P., Luciani, M. G., Pospisilova, S., Ball, H. M., Vojtesek, B., and
Hupp, T. R. (2001) Stoichiometric phosphorylation of human p53 at Ser315 stimu-lates p53-dependent transcription. J. Biol. Chem. 276, 4699–4708.
7. Gu, W. and Roeder, R. G. (1997) Activation of p53 sequence-specific DNA bind-ing by acetylation of the p53 C-terminal domain. Cell 90, 595–606.

p53 Phospho-Specific Antibodies 201
8. Sakaguchi, K., Herrera, J. E., Saito, S., et al. (1998) DNA damage activates p53through a phosphorylation-acetylation cascade. Genes Dev. 12, 2831–2841.
9. Avantaggiati, M. L., Ogryzko, V., Gardner, K., Giordano, A., Levine, A. S., andKelly, K. (1997) Recruitment of p300/CBP in p53-dependent signal pathways.Cell 89, 1175–1184.
10. Momand, J., Zambetti, G. P., Olson, D. C., George, D., and Levine, A. J. (1992)The mdm-2 oncogene product forms a complex with the p53 protein and inhibitsp53-mediated transactivation. Cell 69, 1237–1245.
11. Craig, A. L., Burch, L., Vojtesek, B., Mikutowska, J., Thompson, A., and Hupp,T. R. (1999) Novel phosphorylation sites of human tumour suppressor proteinp53 at Ser20 and Thr18 that disrupt the binding of mdm2 (mouse double minute2) protein are modified in human cancers. Biochem. J. 342, 133–141.
12. Dornan, D., and Hupp, T. R. (2001) Inhibition of p53-dependent transcription byBOX-1 phospho-peptide mimetics that bind to p300. EMBO Rep. 2, 139–144.
13. Yeargin, J. and Haas, M. (1995) Elevated levels of wild-type p53 induced byradiolabeling of cells leads to apoptosis or sustained growth arrest. Curr. Biol. 5,423–431.
14. Bond, J. A., Webley, K., Wyllie, F. S., Jones, C. J., Craig, A., Hupp, T., andWynford-Thomas, D. (1999) p53-Dependent growth arrest and altered p53-immunoreactivity following metabolic labelling with 32P ortho-phosphate inhuman fibroblasts. Oncogene 18, 3788–3792.
15. Abraham, J., Spaner, D., and Benchimol, S. (1999) Phosphorylation of p53 pro-tein in response to ionizing radiation occurs at multiple sites in both normal andDNA-PK deficient cells. Oncogene 18, 1521–1527.
16. Craig, A. L., Blaydes, J. P., Burch, L. R., Thompson, A. M., and Hupp, T. R.(1999) Dephosphorylation of p53 at Ser20 after cellular exposure to low levels ofnon-ionizing radiation. Oncogene 18, 6305–6312.
17. Blaydes, J. P., Craig, A. L., Wallace, M., et al. (2000) Synergistic activation ofp53-dependent transcription by two cooperating damage recognition pathways.Oncogene 19, 3829–3839.
18. Webley, K., Bond, J. A., Jones, C. J., Blaydes, J. P., Craig, A., Hupp, T., andWynford-Thomas, D. (2000) Posttranslational modifications of p53 in replicativesenescence overlapping but distinct from those induced by DNA damage. Mol.Cell. Biol. 20, 2803–2808.
19. Atherton, E., Bridgen, J., and Sheppard, R. C. (1976) A polyamide support forsolid-phase protein sequencing. FEBS Lett. 64, 173–175.
20. Khalkhali-Ellis, Z. (1995) An improved SDS-polyacrylamide gel electrophoresisfor resolution of peptides in the range of 3.5-200kDa. Prep. Biochem. 25, 1–9.
21. Harlow, E. and Lane, D. P. (1988) Antibodies: A laboratory manual. Cold SpringHarbor Laboratory Press, Cold Spring Harbor, NY.
22. Kohler, G., Howe, S. C., and Milstein, C. (1976) Fusion between immunoglobu-lin-secreting and nonsecreting myeloma cell lines. Eur. J. Immunol. 6, 292–295.
23. Shieh, S. Y., Ahn, J., Tamai, K., Taya, Y., and Prives, C. (2000) The humanhomologs of checkpoint kinases Chk1 and Cds1 (Chk2) phosphorylate p53 at mul-tiple DNA damage-inducible sites. Genes Dev. 14, 289–300.

202 Craig et al.
24. Luciani, M. G., Hutchins, J. R., Zheleva, D., and Hupp, T. R. (2000) The C-termi-nal regulatory domain of p53 contains a functional docking site for cyclin A.J. Mol. Biol. 300, 503–518.
25. Hupp, T. R. and Lane, D. P. (1994) Allosteric activation of latent p53 tetramers.Curr. Biol. 4, 865–875.
26. Shieh, S. Y., Taya, Y., and Prives, C. (1999) DNA damage-inducible phosphory-lation of p53 at N-terminal sites including a novel site, Ser20, requirestetramerization. EMBO J. 18, 1815–1823.
27. Wallace, M., Coates, P. J., Wright, E. G., and Ball, K. L. (2001) Differential post-translational modification of the tumour suppressor proteins Rb and p53 modulatethe rates of radiation-induced apoptosis in vivo. Oncogene 20, 3597–3608.
28. Kapoor, M., and Lozano, G. (1998) Functional activation of p53 via phosphoryla-tion following DNA damage by UV but not gamma radiation. Proc. Natl. Acad.Sci. USA 95, 2834–2837.
29. Lu, H., Taya, Y., Ikeda, M., and Levine, A. J. (1998) Ultraviolet radiation, butnot gamma radiation or etoposide-induced DNA damage, results in the phos-phorylation of the murine p53 protein at serine-389. Proc. Natl. Acad. Sci. USA95, 6399–6402.
30. Achari, Y. and Lees-Miller, S. P. (2000) Detection of DNA-dependent proteinkinase in extracts from human and rodent cells. Methods Mol. Biol. 99, 85–97.

Mitochondrial Localization of p53 203
203
From: Methods in Molecular Biology, vol. 234: p53 ProtocolsEdited by: S. Deb and S. P. Deb © Humana Press Inc., Totowa, NJ
13
Detection of Mitochondrial Localization of p53
Motohiro Mihara and Ute M. Moll
Summaryp53 is a master regulator of cell death pathways and has transcription-dependent and tran-
scription-independent modes of action. Mitochondria are major signal transducers in apoptosisand are critical for p53-dependent cell death. Recently, we discovered that a fraction of stress-induced wild-type p53 protein rapidly translocates to mitochondria during p53-dependentapoptosis. Suborganellar localization by various methods shows that p53 predominantly local-izes to the surface of mitochondria. Moreover, bypassing the nucleus by targeting p53 to mito-chondria is sufficient to induce apoptosis in p53-null cells, without requiring further DNAdamage. Here, we describe subcellular fractionation as a classic technique for detecting mito-chondrial p53 in cell extracts. It consists of cell homogenization by hypo-osmotic swelling,removal of nuclear components by low-speed centrifugation, and mitochondrial isolation by adiscontinuous sucrose density gradient. p53 and other mitochondrial proteins can then bedetected by standard immunoblotting procedures. The quality of mitochondrial isolates can beverified for purity and intactness.
Key Wordsapoptosis, p53, mitochondria, p53 localization, mitochondrial targeting, stressed cell, mito-
chondrial fractionation
1. Introductionp53 kills tumor cells by transcriptionally activating gene products that have
various roles in the cell death pathway. However, it has long been observedthat p53 has a transcription-independent way of killing cells, although nomechanism was known (1–3). Mitochondria are major signal transducers inapoptosis and are critical for p53-dependent cell death. Mitochondria can trig-ger cell death by releasing cytochrome c and other potent apoptosis activatorsstored in their intermembraneous space that, once released, activate effector

204 Mihara and Moll
caspases and break down nuclear chromatin (4,5). We recently discovered thata fraction of stress-induced wild-type p53 protein rapidly translocates to mito-chondria during p53-dependent apoptosis induced by, e.g., -irradiation (IR),topoisomerase inhibitors, and hypoxia. This phenomenon is widespread andoccurs in human and mouse cultured cells (6–8) (see Note 1). The transloca-tion of p53 to mitochondria is rapid (within 1 h after p53 activation) and pre-cedes changes in mitochondrial membrane potential, cytochrome c release, andprocaspase-3 activation. In contrast, p53 does not translocate during p53-inde-pendent apoptosis or p53-mediated cell cycle arrest. Suborganellar localiza-tion by various methods shows that the predominant amount of p53 is locatedat the surface of mitochondria. This association can be reproduced in vitro withpurified baculoviral p53 and isolated mitochondria. Importantly, bypassing thenucleus by targeting p53 to mitochondria is sufficient to induce apoptosis inp53-null cells without further DNA damage. Similar results were seen withvarious p53 mutants, including the transcriptionally inactive hotspot mutantR175H. This indicates that p53 protein is sufficient to launch apoptosis directlyfrom the mitochondria.
Subcellular fractionation for mitochondrial enrichment is a major analyticaltool for studying this event. While this method can also be adapted to isolatemitochondria from rat or mouse liver (9,10), bovine heart, skeletal muscle (11),or yeast (12), we focus here on cultured tumor cells, because they are easy togrow and respond well to various treatments with drugs, IR, UV, hypoxia, ortransfection. The protocol for isolation of mitochondria is a discontinuoussucrose gradient and follows largely the method described by Bogenhagen andClayton (13) and others (14,15).
2. Materials1. Confluent suspension or adherent cultured cells, treated or untreated with drugs,
IR, hypoxia, and/or transfection.2. TD washing buffer: 135 mM NaCl, 5 mM KCl, 25 mM Tris-HCl, pH 7.6, ice-
cold. To make a 10X solution: 39.15 g NaCl, 1.85 g KCl, 15.15 g Tris-HCl,3.485 g Tris-base, 0.5 g Na2HPO4. Add water up to 500 mL. Store at 4°C.
3. CaRSB buffer: 10 mM NaCl, 1.5 mM CaCl2, 10 mM Tris-HCl, pH 7.5, ice-cold.Mix together 1 mL 5 M NaCl, 750 μL 1 M CaCl2, 5 mL 1 M Tris-HCl, pH 7.5.Add water up to 500 mL.
4. MS buffer: 210 mM mannitol, 70 mM sucrose, 5 mM ethylenediamine tetraaceticacid (EDTA), 5 mM Tris, pH 7.6, ice-cold. To make a 2.5X solution: 38.26 gmannitol, 23.96 g sucrose, 5 mL 1 M Tris-HCl, pH 7.6, 20 mL 0.25 M EDTA,pH 7.4. Add water up to 400 mL. Store at 4°C.
5. Sucrose buffer: 1 M or 1.5 M sucrose, 2 mM dithiothreitol (DTT), 5 mM EDTA,10 mM Tris, pH 7.6. Mix together 34.24 or 51.34 g sucrose, 200 μL 1 M DTT, 2 mL0.25 M EDTA, 1 mL 1 M Tris-HCl, pH 7.6. Add water up to 100 mL. Store at 4°C.

Mitochondrial Localization of p53 205
6. Protease inhibitors (Roche Molecular Biochemicals, Indianapolis, IN, USA).Should be made fresh and added to each solution. Store as recommended bycompany.
7. Glass Dounce homogenizer (Kimble/Kontes, Vineland, NJ, USA), fit A.8. Low-speed centrifuge with swinging bucket rotor.9. Ultracentrifuge with swinging bucket rotor (e.g., Rotor type SW41; Beckman
Coulter, Fullerton, CA, USA: cat. no. L8-80M).10. 10% sodium dodecyl sulfate (SDS) acrylamide gel.11. Tris-buffered saline with Tween® 20 (TBST) buffer. For 8 L of stock solution:
80 mL 1 M Tris-HCl, pH 8.0, 20.4 g NaCl, 4 mL 20% Tween 20. Add distilledwater (dH2O) up to 8 L. Store at room temperature.
3. Methods3.1. Isolation of Mitochondria
3.1.1. Suspension Culture Cells
3.1.1.1. PREPARE CELLS
1. Pellet suspension cells by spinning for 5 min at 1000–3000g at 4°C in low-speedcentrifuge with swinging rotor (see Note 2).
2. Aspirate media completely.3. Resuspend cells from 100-mL culture into 50 mL 1X TD buffer, ice-cold (see
Note 3).4. Pellet cells by spinning for 5 min at 1000–3000g at 4°C.
3.1.1.2. HOMOGENIZE CELLS
1. Discard supernatant completely and resuspend cells into CaRSB buffer contain-ing protease inhibitors. Use approx 10X vol of packed cells.
2. Leave on ice for 10 min to let cells swell; monitor swelling under microscope.3. Transfer cells to ice-cold glass Dounce homogenizer and homogenize on ice with
frequent monitoring under microscope (see Note 4).4. Quickly add 2 mL of 2.5X MS buffer containing protease inhibitor per 3 mL
homogenate. Transfer an aliquot to another tube for Western blotting to check fornuclear contamination. Another aliquot is used for protein determination (seeNote 5).
5. Transfer the rest of the homogenate to centrifuge tubes and spin down nuclei for5 min at 1000–3000g at 4°C. Decant supernatant into new clean tube and repeatagain (see Note 6).
3.1.1.3. ISOLATE MITOCHONDRIA
1. Make a discontinuous sucrose gradient in a ultracentrifuge tube (Polyallomertubes; Beckman Coulter; cat. no. 331372) by carefully layering 3 mL of 1 Msucrose buffer on top of 3 mL of 1.5 M sucrose buffer (each containing proteaseinhibitors) (see Note 7).

206 Mihara and Moll
2. After spinning, take supernatant of homogenate (from Subheading 3.1.1.2.,step 5) and apply carefully on top of the sucrose gradient.
3. Ultracentrifuge the gradient in a SW41 swinging bucket rotor for 35 min at26,000 rpm (85,000g) at 4°C.
4. Mitochondria will collect at the 1–1.5 M interphase of the sucrose gradient andappear as a clearly visible white band. Carefully aspirate the band with an 18-Gneedle using a 3-mL syringe. Be careful not to suck off buffer. Mix with 4× thevol of 1X MS buffer containing protease inhibitors (see Note 8).
5. Aliquot into microcentrifuge tubes and spin them for 10–15 min at 16,000g at4°C in high-speed Eppendorf® microcentrifuge.
6. Aspirate supernatant and pool all pellets in 100 μL of 1X MS (with proteaseinhibitors) and spin again (see Note 9).
7. Resuspend in a final 200 μL of 1X MS buffer (with protease inhibitors). Thissample will be used for all subsequent assays (see Note 10).
8. Measure protein concentration. Add SDS/ -mercapto-ethanol sample buffer forelectrophoresis.
3.1.2 Adherent Cells
3.1.2.1. PREPARE CELLS
1. Aspirate media completely and rinse quickly once with phosphate-bufferedsaline (PBS).
2. Scrape cells into PBS, and pellet for 5 min at 1000–3000g at 4°C.3. Aspirate media completely. Resuspend cells into 50 mL of 1X TD buffer,
ice-cold.4. Pellet cells for 5 min at 1000–3000g at 4°C.5. Follow the steps in Subheading 3.1.1.1., steps 1–4, Subheading 3.1.2.2., steps
1–5, and Subheading 3.1.1.3., steps 1–8.
3.2. Western Blot Analysis
1. Prepare a 10% SDS polyacrylamide gel.2. The same amount of mitochondrial and crude lysates are run (1–10 μg protein
per lane).3. Transfer proteins to nitrocellulose membrane with semi-dry transfer apparatus at
200 mA for 17 min (depends on area of membrane).4. Block in 50 mL 5% nonfat dry milk in TBST for at least 20 min at room tem-
perature.5. Incubate for 2 h at room temperature with a cocktail of anti-p53 antibody, anti-
proliferating cell nuclear antigen (PCNA) antibody (nuclear contaminationmarker), and anti-mitochondrial (mt) heat-shock protein (hsp)70 antibody (mito-chondrial enrichment marker) properly diluted in blocking buffer (see Note 11).
6. Wash with TBST 3X for 15 min.7. Incubate for 1 h at room temperature with secondary antibody.8. Wash with TBST 3X for 15 min.

Mitochondrial Localization of p53 207
9. Develop with enhanced chemiluminescence reagent (Luminol Reagent; PierceChemical, Rockford, IL, USA).
4. Notes1. A death stimulus is required to induce endogenous wild-type p53 to translocate
to mitochondria. Mitochondria from unstimulated cells have undetectable levelsof mitochondrial p53. -IR, DNA damaging agents (e.g., 5 μM camptothecin for6 h) or hypoxia (125 μM desferoxamine for 5 h or GasPak pouches; BectonDickinson, Franklin Lakes, NJ, USA) induce mitochondrial p53 (6,7). Cancercell lines with mutant p53 exhibit mitochondrial p53 constitutively without priorDNA damage (8). When mitochondrially targeted p53 fusion protein is trans-fected (the LFp53wt plasmid used in ref. 6), mitochondrial p53 is clearly detect-able by immunofluorescence analysis.
2. First resuspend pellet in about 5 mL of CaRSB buffer by pipeting up and down,then add the rest of the buffer. For some cell types, it is difficult to ascertainwhether they undergo swelling within 10 min. In that case, it is acceptable tokeep cells in TD buffer or in growth medium and only remove small aliquots totry out the proper swelling time. Compare with cell shape prior to swelling andobserve enlargement under the microscope. ML-1 cells (human chronic myelog-enous leukemia line) are the standard cell line for verifying swelling.
3. How many strokes are needed? It really depends on the type of cells. Homog-enize to the point where ideally 70–90% of the cells are broken, but the nuclei arestill intact (they appear as smooth round small spheres under the phase opticmicroscope). The nuclei of some cell line are very fragile. Some cell lines needs100 strokes, others need only 10. To determine the proper number of strokes,visually monitor after every 5 strokes.
4. Usually 100 μL of crude cell extract is enough.5. To avoid nuclear contamination, the second centrifugation is critical. A third spin
is even recommended if the second spin still produces a significant nuclear pel-let. Although 5 min is enough for centrifugation, it can be extended until 15 min.Do not disturb the pellet when removing the supernatant. Decanting is better thanpipeting. Although pure mitochondria will be isolated with the following sucrosegradient, washing the nuclear pellet to obtain a higher yield of mitochondria isnot recommended, because some cell lines have very fragile nuclei that may re-lease nuclear proteins.
6. In preparation for the experiments, the rotor and rotor buckets should be placedat 4°C and –20°C, respectively.
7. Do not disturb the mitochondrial shelf. Another white ring on top of the sucrosegradient contains smaller organelles (e.g., lysosomes, peroxisomes).
8. Pipet very gently up and down as to not break the mitochondria.9. After this step, the mitochondria can also be resuspended in cell lysis buffer for
subsequent co-immunoprecipitation experiments.10. An example of the antibody combination is given in Table 1. To verify the
absence of nuclear contamination, we found that PCNA is a highly sensitive

208 Mihara and Moll
Tabl
e 1
Ant
ibod
y C
ombi
nati
ons
Nam
eO
rigi
nD
ilut
ion
Com
pany
anti
-p53
DO
-1 (
Ab-
6)m
ouse
IgG
2a1:
1000
Onc
ogen
e R
esea
rch
Pro
duct
s(C
ambr
idge
, MA
, US
A)
anti
-PC
NA
PC
NA
(P
C10
)m
ouse
IgG
2a1:
1000
San
ta C
ruz
Bio
tech
nolo
gy(S
anta
Cru
z, C
A, U
SA
)an
ti-m
t hsp
70m
itoc
hond
rial
hea
t-m
ouse
IgG
31:
1000
Aff
init
ysh
ock
prot
ein
70B
iore
agen
ts(G
olde
n, C
O, U
SA
)an
ti-m
t hsp
60m
itoc
hond
rial
hea
t-m
ouse
IgG
2a1:
1000
Aff
init
ysh
ock
prot
ein
60B
iore
agen
ts
Ig, i
mm
unog
lobu
lins
.
208

Mitochondrial Localization of p53 209
marker. PCNA is a very abundant small soluble nuclear protein, and excellentantibodies exist for its detection. As an anti-mitochondrial protein, we routinelyuse anti-mt hsp70 or anti-mt hsp60 (matrix proteins). Other combinations can bemade as needed.
11. For all the antibodies described in Table 1, we use sheep anti-mouse immuno-globulin (Ig)G (peroxidase-linked, species-specific whole antibody) (AmershamPharmacia Biotech, Piscataway, NJ, USA) Use 1:2000 dilution in blocking buffer.
References1. Levine, A. J. (1997) p53, the cellular gatekeeper for growth and division. Cell 88,
323–331.2. Harris, C. C. (1996) Structure and function of the p53 tumor suppressor gene: clues
for rational cancer therapeutic strategies. J. Natl. Cancer Inst. 88, 1442–1455.3. Gottlieb, T. M. (1998) p53 and apoptosis. Semin. Cancer Biol. 8, 359–368.4. Brenner, C. and Kroemer, G. (2000) Mitochondria—the death signal integrators.
Science 289, 1150–1151.5. Moll, U. M. and Zaika, A. (2001) Nuclear and mitochondrial apoptotic pathways
of p53. FEBS Lett. 493, 65–69.6. Marchenko, N. D., Zaika, A., and Moll, U. M. (2000) Death signal-induced local-
ization of p53 protein to mitochondria. J. Biol. Chem. 275, 16,202–16,212.7. Sansome, C., Zaika, A., Marchenko, N. D., and Moll, U. M. (2001) Hypoxia death
stimulus induced translocation of p53 protein to mitochondria. FEBS Lett. 488,110–115.
8. Mihara, M., Erster, S., Zaika, A., et al. (2003) p53 has a direct apoptogenic role atthe mitochondria. Mol. Cell DOI 10.1016/S1097276503000509.
9. Vamecq, J. and Van Hoof, F. (1984) Implication of a peroxisomal enzyme in thecatabolism of glutaryl-CoA. Biochem. J. 221, 203–211.
10. Diczfalusy, U. and Alexson, S.E.H. (1998) Peroxisomal chain shortening of pros-taglandin F2. J. Lipid Res. 29, 1629–1636.
11. Bhattacharya, S. K., Thakar, J. H., Johnson, P. L., and Shanklin, D. R. (1991)Isolation of skeletal muscle mitochondria from hamsters using an ionic mediumcontaining EDTA and nagarse. Anal. Biochem. 192, 344–349.
12. Beauvoit, B., Rigoulet, M., Guerin, B., and Canioni, P. (1989) Polyphosphates, asource of high energy phosphate in yeast mitochondria: a31P NMR study. FEBSLett. 252, 17–21.
13. Bogenhagen, D. and Clayton, D. A. (1974) The number of mitochondrial deoxyri-bonucleic acid genomes in mouse L and human HeLa cells. Quantitative isolationof mitochondrial deoxyribonucleic acid. J. Biol. Chem. 249, 7991–7995.
14. Smith, A. L. (1967) Preparation and conditions for assay of mitochondria: slaugh-terhouse material small scale. Methods Enzymol. 10, 81–86.
15. Rice, J. E. and Lindsay, J. G. (1997) Subcellular fractionation of mitochondria, inSubcellular Fractionation: A Practical Approach (Graham J. M. and Rickwood,D., eds.), IRL Press, Oxford, pp. 107–142.

Analysis of Stress-Related p53 Degradation 211
211
From: Methods in Molecular Biology, vol. 234: p53 ProtocolsEdited by: S. Deb and S. P. Deb © Humana Press Inc., Totowa, NJ
14
Analysis of Nuclear and Cytoplasmic Degradationof p53 in Cells after Stress
Troy W. Joseph and Ute M. Moll
SummaryUntil recently, the accepted model held that p53 degradation occurs exclusively on cyto-
plasmic proteasomes and, hence, has an absolute requirement for nuclear export of p53 via theCRM1 pathway. However, proteasomes are abundant in both cytosol and nucleus. We recentlyanalyzed HDM2-mediated degradation of endogenous p53 in the presence of various CRM1blockers. We found that significant HDM2-mediated degradation takes place despite nuclearexport blockade, indicating that endogenous p53 degradation occurs locally in the nucleus, inparallel to cytoplasmic degradation.
Here, we describe how subcellular fractionation can be used to monitor nuclear and cyto-plasmic degradation of endogenous wild-type p53 during the recovery phase after a stress stimu-lus. The fractions are then analyzed by immunoblotting in a time-dependent fashion. Vimentinand lamin A proteins are used to monitor the purity of the cytosolic and nuclear fractions,respectively, and to control for equal loading.
Key Wordsp53, HDM2, ubiquitination, proteasomes, degradation, cytoplasm, nucleus
1. IntroductionThe principal negative regulator of p53 stability and function is the HDM2
protein, which functions as an E3 ubiquitin ligase for p53 in vivo (1–5). (Themouse homolog is named Mdm2.) The E3 ligase activity of HDM2/Mdm2maps to a cysteine and histidine rich Zinc-coordinated RING finger motif atthe C terminus, which ubiquitinates p53 on multiple lysine residues throughoutits C terminus (5). p53 and HDM2 are linked through an autoregulatory feed-back loop, in which activated p53 stimulates HDM2 transcription, whileinduced HDM2 in turn inhibits p53 function (6). The significance of this auto-

212 Joseph and Moll
regulatory feedback loop becomes dramatically apparent in MDM2-deficientmice, which die early in embryogenesis due to unchecked p53 activity (7,8).Simultaneous ablation of p53 in MDM2–/– p53–/– double null mice, however,fully rescues embryonic lethality. Thus, HDM2 is responsible both for the lowsteady-state levels of p53 in unstressed cells and for switching off a p53 stressresponse after cell damage is repaired. Consistent with p53 inactivation byHDM2, the HDM2 gene is amplified or overexpressed in the absence of p53mutations in some human tumors including sarcomas, leukemias, and lympho-mas (9,10).
The principal regulator of p53 stability is HDM2, which is an E3 ligase thatmediates p53 degradation via the ubiquitin-26S proteasome pathway.Proteasomes are abundant in both cytosol and nucleus. We have recently shownthat p53 degradation occurs in the nucleus and the cytoplasm during down-regulation of the p53 response after DNA damage (11). The fraction of p53 thatundergoes cytoplasmic degradation is subject to nuclear export of p53 via theCRM1 pathway, utilizing the p53 nuclear export signal (NES) in the C terminus(12). HDM2 also can undergo nuclear export via its NES signal. One can utilizeLeptomycin B (LMB), a noncompetitive nuclear CRM1 inhibitor to prevent theexport of p53. Due to the presence of a nuclear export blockade, we can deter-mine the ability of HDM2 to degrade endogenous p53 in the nucleus. CRM1/exportin 1 is a karyopherin essential and specific for nuclear export of NES-containing proteins of the human immunodeficiency virus (HIV)-1 Rev type,such as p53 and HDM2 (13–19). CRM1 binds directly to their leucine-rich NES(13), in addition to binding to Ran-GTP and nucleoporins (18). CRM1 is thecellular target of LMB in vitro (20), and CRM1 is the only protein detectable tobind to LMB in vivo at nanomolar concentrations (21). LMB is a fast actingnoncompetitive and highly specific inhibitor of CRM1 (15,17,20) that actswithin 10–30 min (22). It abolishes association of CRM1 with NES by directbinding to CRM1, thereby inhibiting nuclear export of NES proteins (14,15,17).LMB covalently binds to the sulfhydryl group of cysteine 529 in the centralconserved region of CRM1 via its , -unsaturated -lactone group (21). Itdoes not significantly interfere with general mRNA nuclear export (15). Of par-ticular importance for our studies, LMB does not nonspecifically interfere withproteasome activity, as demonstrated by undisturbed degradation of -catenin,which is a prototype for cytoplasmic proteasomal degradation (23). Also, LMBdoes not nonspecifically affect steady state levels of export-independent pro-teins, such as proliferating cell nuclear antigen (PCNA) or UsnRNP Sm (24),nor does it induce gross morphologic changes (11). Therefore, LMB has beenan important tool in studying nuclear export requirements of Rev-like proteins.
Studies on compartmental degradation of p53 and HDM2 also use cyclo-heximide, which is a protein synthesis inhibitor. The addition of a protein syn-

Analysis of Stress-Related p53 Degradation 213
thesis inhibitor is important, since its usage prevents new p53 from being made,while the degradation and/or stabilization of p53 and HDM2 are being studied.Experiments can be done to monitor the kinetics of p53 degradation and/or itsstabilization in the nucleus and or cytosol. This chapter describes a rapid andreliable protocol for cleanly separating the nucleus from the cytoplasm and forobserving under what physiological circumstances p53 and HDM2 degrada-tion might occur in both compartments. The analysis is done by immunoblots.Vimentin is used as a cytosolic marker, and lamin A is used as a nuclear markerto check for the purity of the fractionation procedure.
2. Materials2.1. Cell Preparation
1. Cultured mammalian cells.2. 60-mm plates.
2.2. Harvesting the Cells
1. Gloves.2. Blanked Dulbecco’s modified Eagle medium (DMEM).3. Cell scraper.4. Protease inhibitors cocktail (Calbiochem-Novabiochem, San Diego, CA, USA).5. 1.5-mL Eppendorf® tubes.6. Microcentrifuge.
2.3. Testing the Purity of Cytoplasmic and Nuclear Purification
1. p53 antibody (clone DO-1; Santa Cruz Biotechnology, Santa Cruz, CA, USA).2. HDM2 antibody (clone IF-2; Chemicon International, Temecula, CA, USA).3. Vimentin antibody (Chemicon International).4. Lamin A antibody (Chemicon International).5. Mouse secondary antibody (Amersham Pharmacia Biotech, Piscataway, NJ,
USA).6. Nuclear and cytoplasmic extraction kit (Pierce Chemical, Rockford, IL, USA;
cat. no. 78833). The kit contains 2 cytoplasmic and 1 nuclear extraction buffers:CER1, CER2, and NER.
3. Methods3.1. Cytoplasmic and Nuclear Extraction Protocol
1. Grow cells in 60-mm plates to 70–90% confluency (e.g., human U2OS or RKOcells) (see Note 1).
2. Treat cells with DNA damaging drug to induce p53 response (e.g., camptothecin,5 μM for 2.5 h).
3. Aspirate media that contains DNA damaging drug. Wash cells with new media.4. Allow cells to recover for 4 h in fresh media (3 mL for a 60-mm plate).

214 Joseph and Moll
5. Treat cells with LMB, 20 nM (Sigma, St. Louis, MO, USA) for 1 h.6. Treat cells with cycloheximide (10 mg/mL) for 15 h.7. Aspirate off media completely and add 100 μL of ice-cold CER1 lysis buffer
to cells.8. Scrape cells carefully in the CER1 buffer to one edge of the plate.9. Place cells and CER1 buffer in 1.5-mL Eppendorf tube and vortex mix vigor-
ously on the highest setting for 15 s.10. Incubate the tube on ice for 10 min.11. Add 5.5 μL of ice-cold CER2 to the tube and vortex mix for 5 s on the highest
setting (see Note 2).12. Incubate the tube on ice for 1 min.13. Vortex mix for 5 s on the highest setting. Centrifuge the tube for 5 min in a cold
microcentrifuge (16,000g) (see Notes 2–4).14. Immediately transfer the supernatant (cytoplasmic extract) to a clean prechilled
1.5-mL Eppendorf tube. Place the tube on ice.15. Resuspend the insoluble pellet fraction produced in step 11, which contains nu-
clei, in 100 μL of ice-cold NER (see Notes 5 and 6).16. Vortex mix on the highest setting for 15 s. Return the sample to ice and continue
vortex mixing every 10 min, for a total of 40 min (see Note 7).17. Centrifuge the tube at full speed (16,000g) in a cold microcentrifuge for 10 min.18. Immediately transfer the supernatant (nuclear extract) (see Note 3) fraction to a
clean prechilled tube. Place on ice (see Note 8).19. Store all extracts at –80°C until needed.
3.2. Cytoplasmic and Nuclear Fractionation Verification Protocolby Immunoblot
1. Measure protein concentrations of the cytoplasmic and nuclear fractions.2. Load equal amounts of protein from the cytoplasmic and the nuclear fraction on
two 8% acrylamide gels and transfer to membranes.3. Blot one membrane with vimentin antibody as a marker for cytosolic proteins.4. Reblot this membrane with lamin A antibody as a marker for nuclear proteins.5. Blot the other membrane first with DO-1 antibody for p53 detection, followed by
IF-2 antibody for HDM2 detection (see Note 9).6. A pictorial representation of how the experiment should be done is outlined in
Fig. 1, followed by some actual results from U2OS cells (human osteosarcoma cellline harboring wild-type p53) (T. W. Joseph and U. M. Moll, unpublished results).
4. Notes1. A 60-mm plate of cells should yield about 150–200 μg of proteins in the cyto-
plasmic fraction and 20–30 μg of proteins in the nuclear fraction.2. If there is low cytoplasmic yield, increase the amount of CER2 buffer (e.g., 1.5–2×
as much).3. Cytoplasmic and nuclear extracts are now ready for use in other downstream
assays. If large vol are required in subsequent applications or if problems occur

Analysis of Stress-Related p53 Degradation 215
with functional downstream assays, the nuclear extract can be dialyzed prior touse to remove salts and detergents.
4. If proteins are not properly compartmentalized, carefully remove all cytoplasmicextract prior to nuclear lysis.
5. The detergent in NER buffer is not dialyzable, however. For dialysis, the Slide-A-Lyser MINI dialysis unit (Pierce Chemical) is recommended.
6. If more concentrated nuclear extracts are desired, the vol of NER used in theextractions can be decreased two- to four-fold with no adverse effects on proteinrecovery or compartmentalization.
7. If nuclear proteins are low, vortex mix more thoroughly.8. If there is low protein activity, do all work at 4°C. Use fresh protease inhibitors.9. A good starting concentration for primary antibodies is 1:1000. The mouse
secondary can be used at 1:3000–10,000 (Femto Chemiluminescence devel-oper; Pierce Chemical). If there is too much background, decrease the concen-tration of the primary antibody to 1:3000. Always wash nitrocellulosemembrane thoroughly and dilute all antibodies in 5% skim milk–phosphate-buffered saline (PBS).
Fig. 1. Cytoplasmic and nuclear fractionation verification immunoblots.

216 Joseph and Moll
References1. Haupt, Y., Maya, R., Kazaz, A., and Oren, M. (1997) Mdm2 promotes the rapid
degradation of p53. Nature 387, 296–299.2. Kubbutat, M. H., Jones, S. N., and Vousden, K. H. (1997) Regulation of p53
stability by Mdm2. Nature 387, 299–303.3. Honda, R., Tanaka, H., and Yasuda, H. (1997) Oncoprotein MDM2 is a ubiquitin
ligase E3 for tumor suppressor p53. FEBS Lett. 420, 25–27.4. Fuchs, S. Y., Adler, V., Buschmann, T., Wu, X., and Ronai, Z. (1998) Mdm2
association with p53 targets its ubiquitination. Oncogene 17, 2543–2547.5. Fang, S., Jensen, J. P., Ludwig, R. L., Vousden, K. H., and Weissman, A. M.
(2000) Mdm2 is a RING finger-dependent ubiquitin protein ligase for itself andp53. J. Biol. Chem. 275, 8945–8951.
6. Wu, X., Bayle, J. H., Olson, D., and Levine, A. J. (1993) The p53-mdm-2 auto-regulatory feedback loop. Genes Dev. 7, 1126–1132.
7. Montes de Oca Luna, R., Wagner, D. S., and Lozano, G. (1995) Rescue of earlyembryonic lethality in mdm2-deficient mice by deletion of p53. Nature 378,203–206.
8. Jones, S. N., Roe, A. E, Donehower, L. A., and Bradley, A. (1995) Rescue ofembryonic lethality in Mdm2-deficient mice by absence of p53. Nature 378,206–208.
9. Oliner, J. D., Kinzler, K. W., Meltzer, P. S., George, D. L., and Vogelstein, B.(1992) Amplification of a gene encoding a p53-associated protein in human sar-comas. Nature 358, 80–83.
10. Watanabe, T., Ichikawa, A., Saito, H., and Hotta, T. (1996) Overexpression of theMDM2 oncogene in leukemia and lymphoma. Leuk. Lymphoma 21, 391–397.
11. Shirangi, T. R., Zaika, A., and Moll, U. M. (2002) Nuclear degradation of p53occurs during down-regulation of the p53 response after DNA damage. FASEB J.16, 420–422.
12. Stommel, J. M., Marchenko, N. D., Jimenez, G. S., Moll, U. M., Hope, T. J., andWahl, G. M. (1999) A leucine-rich nuclear export signal in the p53 tetramerizationdomain: regulation of subcellular localization and p53 activity by NES masking.EMBO J. 18, 1660–1672.
13. Wolff, B., Sanglier, J. J., and Wang, Y. (1997) Leptomycin B is an inhibitor ofnuclear export: inhibition of nucleo-cytoplasmic translocation of the human im-munodeficiency virus type 1 (HIV-1) Rev protein and Rev-dependent mRNA.Chem. Biol. 4, 139–147.
14. Fukuda M, Asano S, Nakamura T, et al. (1997) CRM1 is responsible for intracel-lular transport mediated by the nuclear export signal. Nature 390, 308–311.
15. Fornerod, M., Ohno, M., Yoshida, M., and Mattaj, I. W. (1997) Crm1 is an exportreceptor for leucine rich nuclear export signals. Cell 90, 1051–1060.
16. Stade, K., Ford, C. S., Guthrie, C., and Weis, K. (1997) Exportin 1 (Crm1p) is anessential nuclear export factor. Cell 90, 1041–1050.
17. Ossareh-Nazari, B., Bachelerie F., and Dargemont, C. (1997) Evidence for a roleof CRM1 in signal-mediated nuclear protein export. Science 278, 141–144.

Analysis of Stress-Related p53 Degradation 217
18. Floer, M. and Blobel, G. (1999) Putative reaction intermediates in Crm1-medi-ated nuclear protein export. J. Biol. Chem. 274, 16,279–16,286.
19. Henderson, B. R. (2000) Nuclear-cytoplasmic shuttling of APC regulates beta-catenin subcellular localization and turnover. Nat. Cell. Biol. 2, 653–660.
20. Nishi, K., Yoshida, M., Fujiwara, D., Nishikawa, M., Horinouchi, S., and Beppu,T. (1994) Leptomycin B targets a regulatory cascade of crm1, a fission yeastnuclear protein, involved in control of higher order chromosome structure andgene expression. J. Biol. Chem. 269, 6320–6324.
21. Kudo, N., Matsumori, N., Taoka, H., et al. (1999) Leptomycin B inactivatesCRM1/exportin 1 by covalent modification at a cysteine residue in the centralconserved region. Proc. Natl. Acad. Sci. USA 96, 9112–9117.
22. Carlotti, F., Dower, S. K., and Qwarnstrom, E. E. (2000) Dynamic shuttling ofnuclear factor kappa B between the nucleus and cytoplasm as a consequence ofinhibitor dissociation. J. Biol. Chem. 275, 41,028–41,034.
23. Freedman, D. A. and Levine, A. J. (1998) Nuclear export is requird for degrada-tion of endogenous p53 by MDM2 and human papilloma virus E6. Mol. Cell Biol.18, 7288–7293.
24. Lain, S., Midgle, C., Sparks, A., Lane, E. B., and Lane, D. P. (1999) An inhibitorof nuclear export activates the p53 response and induces the localization of HDM2and p53 to U1A-positive nuclear bodies associated with the PODs. Exp. Cell. Res.248, 457–472.

Mutational Analysis of p53 219
219
From: Methods in Molecular Biology, vol. 234: p53 ProtocolsEdited by: S. Deb and S. P. Deb © Humana Press Inc., Totowa, NJ
15
Mutational Analysis of p53 in Human Tumors
Direct DNA Sequencing and SSCP
Susan Erster, Neda Slade, and Ute M. Moll
SummaryThis chapter describes the techniques necessary to identify p53 genomic mutations in either
frozen or paraffin-embedded tumor samples. DNA is extracted from the tumor samples andthen used as a template to amplify the p53 coding sequences by polymerase chain reaction(PCR). The PCR products are characterized by agarose gel electrophoresis. Subsequently,mutations can be detected by direct DNA sequencing of the PCR products, followed byacrylamide gel electrophoresis and autoradiography. Alternatively, PCR products containingmutations can be identified by their aberrant mobility on denaturing acrylamide gels, usingsingle-stranded conformation polymorphism (SSCP).
Key Wordsp53, tumors, mutations, PCR, SSCP, DNA sequencing
1. Introduction1.1. PCR Amplification and DNA Sequencing
Apoptosis (1), or programmed cell death, is an essential cellular response tostresses, such as DNA damage, hypoxia, and oncogene deregulation (reviewedin refs. 2,3). The p53 protein mediates the apoptotic response, and loss of p53function is implicated in tumor progression. Not surprisingly, the p53 gene iseither lost or mutated in greater than 50% of human tumors (4,5). To determinewhether a tumor has undergone mutation of the p53 gene, one can extractgenomic DNA from a fixed or frozen tumor specimen, amplify the p53 codingsequences by polymerase chain reaction (PCR), and subject the PCR productsto DNA sequencing. The DNA from archived samples is often highly degraded,

220 Erster et al.
but should be adequate for short-length PCR amplification. The PCR productsare then the templates for the sequencing reaction. They can be recovered andpurified by extraction from low-melt agarose gels or through commerciallyavailable PCR clean-up kits. In many cases, adequate template can be preparedsimply by nucleolytic digestion of the PCR. The PCR products are sequenced,and the sequence is compared with that of wild-type p53 to identify mutations.
Another method to study p53 missense mutations is single-stranded confor-mational polymorphism (SSCP) analysis. This method detects DNA sequencechanges as a shift in electrophoretic motility (6). DNA is amplified by PCR,denatured followed by rapid chilling, and run on polyacrylamide electrophore-sis gels under nondenaturating conditions. Under such conditions, single-stranded DNA takes on a folded conformation that is stabilized by intrastrandinteractions. The radioactive amplicons can be detected by phosphoimageranalysis or by exposing the dried gels to X-ray film. This simple, rapid, andsensitive method enables us to detect even single-base changes or point muta-tions, which represent the overwhelming majority of p53 mutations in tumors.
2. Materials2.1. Extraction of DNA from Frozenor Paraffin-Embedded Tumor Specimens
1. Proteinase K. Dissolve powder at 20 mg/mL in 50 mM Tris, pH 8.0, aliquot, andstore at –20°C.
2. Phenol–chloroform–isoamylalcohol (25:24:1). Liquefy phenol (work in fumehood, as phenol is toxic) and add an equal vol of 0.5 M Tris-HCl, pH 8.0. Mixwell and allow the phases to separate. Test pH of phenol phase with pH paper andrepeat equilibration if pH is still below 7.8. Store equilibrated phenol under Trisoverlay at 4°C in a dark bottle. For 100 mL phenol–chloroform–isoamyl alcohol,combine 50 mL phenol, 46 mL chloroform, and 4 mL isoamyl alcohol. This solu-tion should also be stored in a dark bottle at 4°C.
3. 95% Ethanol.
2.1.1. Paraffin Samples Only
1. Xylene (work in fume hood, as xylene is toxic).2. Isopropanol.
2.1.2. Frozen Samples Only
1. Lysis buffer (SNET): 20 mM Tris-HCl, pH 8.0, 5 mM ethylenediamine tetraaceticacid (EDTA), 400 mM NaCl, 1% sodium dodecyl sulfate (SDS). Filter-sterilizeand store at room temperature.
2. 3 M sodium acetate, pH 5.2.3. TE, pH 8.0: 10 mM Tris-HCl, pH 8.0, 1 mM Na2 EDTA.

Mutational Analysis of p53 221
2.2. PCR Amplification of p53 Coding Sequences
1. Polymerase (i.e., Taq) plus 10X PCR buffer.2. 25 mM MgCl2 (often included in 10X buffer or supplied separately).3. dNTP mixture. 10 mM for each nucleotide in PCR-grade water (filter-sterilized).
Store frozen in small aliquots and avoid repeated freeze-thawing.4. p53-Specific exon primers for exons 5–8 and the size of the expected product are
given below. Primers need not be purified for PCR, but should be purified by high-performance liquid chromatography (HPLC) or electrophoresis for sequencing.5F: 5'-ctcttcctgcagtactcccctgc-3', 5R: 5'-gccccagctgctcaccatcgcta-3', productlength: 211 bp.6F: 5'-gattgctcttaggtctggcccctc-3', 6R: 5'-ggccactgacaaccacccttaacc-3', productlength: 185 bp.7F: 5'-gtgttgtctcctaggttggctctg-3', 7R: 5'-caagtggctcctgacctggagtc-3', productlength: 139 bp.8F: 5'-acctgatttccttactgcctctggc-3', 8R: 5'-gtcctgcttgcttacctcgcttagt-3', productlength: 200 bp.
2.3. Analysis and Purification of PCR Products
1. Agarose (preparative grade, low-melt if desired).2. Agarose gel electrophoresis buffer.3. TBE (10X): 890 mM Tris-borate, 20 mM EDTA, pH 8.0.4. Ethidium bromide (10 mg/mL in water). Handle carefully, as this is carcinogenic.
Store at 4°C, wrapped in aluminum foil.5. Agarose gel 6X sample buffer (e.g., 30% glycerol, 0.25% each bromophenol blue
and xylene cyanol) (for additional recipes see refs. 7,8).6. Low molecular weight (i.e., less than 1 kb) DNA size ladder.7. Exonuclease 1.8. Shrimp alkaline phosphatase.
2.4. Dideoxy-Sequencing
2.4.1. Sequenase Protocol with -35S dATP
1. Sequenase® (version 2) enzyme (USB, Cleveland, OH, USA).2. dNTPs and ddNTPs stock solutions are at 0.5 mM in water, stored in small
aliquots at –20°C.3. 5X Labeling mixture: 7.5 mM each dCTP, dGTP, dTTP.4. Extension-termination mixture: 160 μM of each dNTP, and 160 μM of either
ddATP, ddGTP, ddCTP, or ddTTP.5. -35S dATP (1000 Ci/mmol, 10 mCi/mL) Caution: this is a radiation hazard.6. These buffers are typically supplied with Sequenase enzyme: sequenase dilution
buffer: 10 mM Tris-HCl, pH 7.5, 5 mM dithiothreitol (DTT), 500 μg/mL bovineserum albumin (BSA).Sequenase reaction buffer: 200 mM Tris-HCl, pH 7.5, 100 mM MgCl2, 125 mMNaCl.

222 Erster et al.
2.4.2. Sequenase Protocol with End-Labeled Primersor Cycle-Sequencing Protocol
1. -32P ATP, or -33P ATP (radiation hazard) (10 mCi/mL, 5000 Ci/mmol).2. T4 polynucleotide kinase.3. Ammonium acetate (10 M). Filter-sterilize. Do not autoclave.4. ddNTP mixtures: 20 μM each of all four dNTPs plus either ddATP (600 μm),
ddCTP (400 μM), ddGTP (200 μM), or ddTTP (800 μM) in TE, pH 8.0. Store insmall aliquots at –20°C.
5. Taq CS or other thermostable polymerase.6. 5X Cycle-sequencing buffer: 200 mM Tris-HCl, pH 8.8, 25 mM MgCl2.
2.4.3. Denaturing Acrylamide Gel of Sequencing Products
1. 45% Acrylamide: bis-acrylamide (neurotoxin) solution: dissolve 434 g ofacrylamide and 16 g of N,N-methylene bisacrylamide in approx 600 mL water byheating on stir plate to about 37°C. Adjust vol to 1 L, filter-sterilize, and store atroom temperature in dark bottle.
2. Urea.3. Ammonium persulfate (APS): 10% in water, store at 4°C, prepare weekly.4. N,N,N',N'-Tetramethylethylene diamineTEMED (this is toxic).5. Formamide (this is toxic) loading dye buffer: 95% formamide, 10 mM EDTA,
0.2% xylene cyanol, and bromophenol blue.
2.4.4. Fixation
1. Fix solution: 10% acetic acid, 10% methanol (this is toxic) in water.
2.4.5. SSCP of Human p53
1. PCR device.2. Primer sense, primer antisense.3. dCTP 32P, 10 μCi/μL.4. dNTP, 10 mM.5. PCR buffer: 100 mM Tris-HCl, pH 8.8, 500 mM KCl, 15 mM MgCl2, 1% non-
ionic detergent Triton® X-100.6. Taq DNA polymerase.7. Chloroform–water saturated.8. 0.1% SDS, 10 mM EDTA, pH 8.0. Store at room temperature.9. Stop solution for SSCP: formamide 80%, TBE 0.5X , xylene cyanol 0.5%, bro-
mophenol blue 0.5%, water up to 1 mL.10. Polyacrylamide gel electrophoresis (PAGE) device.11. 6% Polyacrylamide gel, 0.35-mm thick: 6 mL acryl–bis acrylamide (40%
solution: 38 g acrylamide plus 2 g bisacrylamide up to 100 mL), 1 mL 20X TBE,33 mL water, 40 μL TEMED, 160 μL 25% APS.

Mutational Analysis of p53 223
3. Methods3.1. Extraction of DNA from Frozen Tumor Specimens (see Note 1)
1. Place tissue in lysis buffer. Typically, 10 mL of lysis buffer is sufficient for 1 g oftissue. Add proteinase K to 500 μg/mL.
2. Incubate at 55°C overnight with gentle constant mixing. An end-over-end rotatoris ideal, but excellent lysis can also be achieved if tubes are placed horizontallyin a shaker or on a rocking platform.
3. Add an equal vol of phenol–chloroform–isoamyl alcohol to the lysate. Ensurethat the tubes are sealed tightly and begin mixing. Mixing should be gentle, butsufficient to form an emulsion between the organic and aqueous phases. Allowthe sample to incubate at room temperature for 10–30 min with either constant orintermittent gentle mixing. Excessive vortex mixing will shear high molecularweight DNA and is not recommended.
4. Centrifuge at room temperature for 5 min. Small samples can be spun in amicrofuge at full speed. Larger samples can be spun in a table-top centrifuge atapprox 1000g.
5. Carefully remove the upper aqueous phase to a fresh tube. Try to avoid disturb-ing the interface.
6. Add an equal vol of isopropanol and centrifuge at maximum speed (approx13,000g) for 15 min.
7. Remove isopropanol carefully, without dislodging the pellet. Wash the pellet bygently vortex mixing in a small vol of 70% ethanol, and centrifuge again.
8. Remove the 70% wash and semidry the pellet in a lyophilizer. Do not dry com-pletely, as pellet will be extremely difficult to resuspend.
9. Redissolve DNA in TE, pH 8.0. Dissolution may require overnight incubation,with gentle agitation, at 4°C or a brief incubation at room temperature.
10. If desired, DNA may be further purified by re-extraction with phenol–chloro-form. Precipitate the DNA by adjusting the aqueous phase to 0.3 M Na-acetate,pH 5.2, and then adding 2.5 vol 95% ethanol. Mix by inverting the tube severaltimes and then store at –20°C for at least 30 min. Centrifuge, wash, dry, andresuspend as above. This additional extraction helps remove residual SDS andother tissue contaminants, which may inhibit subsequent enzymatic reactions.
3.1.1. Paraffin Blocks
1. Transfer a portion of the paraffin block to a microfuge tube and add approx 100 μLof xylene, followed by 100 μL of ethanol.
2. Mix well, and pellet tissue by centrifuging at full speed for 10 min at room tem-perature.
3. Remove xylene–ethanol, and dry briefly.4. Resuspend pellet in 250 μL Tris, pH 8.3, containing 200 μg/mL proteinase K.5. Incubate overnight at 37°C.

224 Erster et al.
6. Transfer tubes to boiling water bath for 5–10 min, then to an ice bath until com-pletely chilled.
7. Store at 4°C.
3.2. PCR Amplification of p53 Coding Sequences (see Note 2)
1. Prepare a reaction mixture containing all reagents (except template): 10X PCRbuffer, 2 mM MgCl2 (only if PCR buffer does not contain Mg), dNTPs (usually100–200 μM each), primers (10–20 pmol each), Taq DNA polymerase (1 U), andwater.
2. Dispense aliquots into reaction tubes on ice. Add template (10–50 ng) to eachtube, overlay with mineral oil if required, mix, and place in thermal cycler.
3. Cycle as follows: (i) 95°C for 1 min; (ii) 35 cycles of 95°C for 1 min, 55–60°Cfor 1 min, 72°C for 1 min; (iii) 72°C for 7 min; and (iv) 4°C hold.
3.3. Analysis and Purification of PCR Products
1. Prepare a 1.8–2.0% agarose gel in either 1X TAE or TBE buffer. Add agarose tobuffer in microwave-safe flask, dissolve agarose in microwave, and allow to cool.
2. Add ethidium bromide (this is a carcinogen) to 1 μg/100 mL.3. Pour gel in horizontal electrophoresis apparatus and add comb.4. Mix approx 10% of PCR sample with one-fifth vol sample buffer.5. Load in wells and apply current. Also load molecular weight markers (100–1000
bp ladder is ideal).6. View and photograph gel. If a distinct band of the appropriate size is observed,
treat the remainder of the PCR as follows. If no product is available, see Note 3.7. Add exonuclease 1 and shrimp alkaline phosphatase (as per unit definition pro-
vided by manufacturer).8. Incubate at 37°C for 15–30 min.9. Incubate at 80°C for 15 min.
10. Store at –20°C or proceed to sequencing.
3.4. Dideoxy-Sequencing (see Note 4)
A number of sequencing protocols are available, offering options regardingtemplate preparation, incorporation of radioactive label, and polymerase. Fordetection of mutations in relatively short templates, accurate unambiguous datais crucial. The most straightforward approach is to follow the Sequenase proto-col. Sequenase is a modified T7 polymerase, which lacks 3'-5' exonucleaseactivity. This protocol can accommodate kinase-labeled primers and coldnucleotides or unlabeled primers and labeled dATP. A cycle sequencing proto-col using end-labeled primers is also presented.
3.4.1. Sequenase Protocol
1. Anneal template and primer: combine in a 500 μL reaction tube: template(100 ng–1 μg), primer (2.5 ng), 5X Sequenase buffer, and water to 10 μL.

Mutational Analysis of p53 225
2. Incubate at 65–70°C in a water bath for 2 min. Remove the tubes to room tem-perature to slow-cool. Ideally, stand the tubes in a small beaker containing waterfrom the water bath. It should take approx 30 min to cool to room temperature.
3. Add one of each of the four ddNTP mixes to an appropriately labeled (A, C, G, orT) microfuge tube. Dispense the aliquot at the upper wall of the tube. Prewarm totubes to 37 °C.
4. Dilute 5X labeling mixture in ice cold water and store on ice.5. Dilute Sequenase to approx 3 U/2 μL in ice-cold Sequenase dilution buffer, and
store on ice.6. Add to annealed template primer: 2 μL of diluted labeling mixture, 1 μL of
100 mM DTT, 0.5 μL of radiolabeled dATP (this is a radiation hazard), and 2 μLof diluted Sequenase. Mix by tapping gently.
7. Incubate at room temperature for 2–5 min.8. Add 3.5 μL of labeling reaction to each of the ddNTP-containing tubes, quickly
spin in a microfuge, and return to 37°C for 3–5 min.9. Stop reaction by adding 4 μL of formamide loading buffer. At this point the
reaction may be stored at –20°C. Alternatively, it may be denatured by placingthe tubes in a boiling water bath for 2 to 3 min, then quick-chilling on ice.
3.4.2. Cycle Sequencing with End-Labeled Primer
End-label primers (same as PCR primers described in Subheading 2.2.)as follows:
1. Mix: primer (10 pmol), 10X T4 polynucleotide kinase buffer, 32P ATP(10 pmol), T4 polynucleotide kinase (1 μL = 10 U), and water to vol (typically20–25 μL).
2. Incubate at 37°C for 1 h.3. Heat-inactivate kinase at 65°C for 10 min.4. Add ammonium acetate to 2.5 M (from 10 M stock) and 2.5 vol ethanol.5. Incubate at –20°C at least 30 min.6. Recover pellet by centrifugation in microfuge at maximum speed for at least 15 min.7. Remove supernatant carefully. (This is a radiation hazard.) Wash pellet 2× with
70% ethanol.8. Dry slightly, dissolve in 10 μL of TE, pH 7.6, and store at –20°C or continue with
sequencing.9. To PCR tubes labeled A, C, G, and T, add 4 μL of the appropriate ddNTP mixture.
10. Prepare a mixture containing: double-stranded template DNA (i.e., PCR product)10–100 fmol, 1 μL of -ATP-labeled primer (at 1.5 pmol/μL), 2 μL of 5X cyclesequencing buffer, and water to 5 μL.
11. Add 5 μL to each of the 4 tubes.12. Add 1 μL of AmpliTaq® CS (Applied Biosystems, Foster City, CA, USA) (or
any other cycle-sequencing polymerase), diluted to 1 U/μL.13. Mix, spin in microfuge, place in thermal cycler, and amplify as follows: denature
at 95°C for 1 min; 30 cycles at 95°C for 30 s, 55°C for 30 s, 72°C for 60 s; then4°C hold.

226 Erster et al.
14. Add 5 μL of formamide loading buffer per tube, store at –20°C, or proceed toelectrophoresis.
3.4.3. Denaturing Polyacrylamide Gel Electrophoresis
1. Clean and dry gel plates.2. If desired, treat one plate with siliconizing solution such as Sigmacote (Sigma,
St. Louis, MO, USA), following the manufacturer’s instructions.3. Assemble gel plates with spacers, seal with electric tape, and clamp tightly with
binder clips.4. Mix in a side armed flask:17.8 mL of acrylamide solution, 10 mL of 10X TBE
buffer, 42 g of urea, and 36.9 mL of water.5. Heat to 55°C, with swirling, to dissolve urea.6. Cool to room temperature.7. Attach to vacuum line, apply vacuum to degas. Swirl gently and continue until
bubbling ceases (1 to 2 min).8. Add 0.5 mL of 10% APS.9. Add 50 μL of TEMED. Swirl gently.
10. Position gel plates at a slight elevation, i.e., by positioning a 2- to 3-in. object(pipet tip rack, Eppendorf® tube rack, “lead pig,” etc.) under the top of the platesandwich.
11. Draw the gel mixture into a 60-mL syringe, position the syringe in one of theupper corners, and gently but steadily apply pressure, so that gel mixture streamsbetween plates. As the gel mixture enters, it gradually lift plates, so that trappedair rises. When the gel mixture reaches the top, lay the plates down again, andinsert a comb. Clamp comb in place with binder clips.
12. Let polymerize for 15–30 min.13. Remove tape from bottom with razor blade, position in vertical gel apparatus,
and proceed with electrophoresis.14. Electrophoresis until bromophenol blue is about 1 to 2 in. from the bottom.15. Remove tape from sides, lay sandwich, such that nonsiliconized plate is on the
bottom, and separate plates by wedging spatula in one corner and lifting. Gelshould stick to nonsiliconized plate.
16. Immerse gel (on plate) in fix solution (10% methanol, 10% acetic acid in water)for 15 min.
17. Remove from fix, lay on bench, press Whatman paper (Whatman, Clifton, NJ,USA) over gel, press hard, and begin lifting at one corner. Gel should stickto paper.
18. Cover with plastic wrap. Dry briefly on gel-dryer, or proceed directly to autorad-iography.
3.5. SSCP of Human p53 (see Note 5)
The sequence which has to be analyzed should be amplified and labeled byPCR using labeled nucleotide. The generated fragments should be denatured

Mutational Analysis of p53 227
and analyzed by polyacrylamide gel electrophoresis. The DNA strands arevisualized by autoradiography (9).
1. Prepare the reaction as follows: 1 μL DNA (0.5 μg/μL), 16.7 μL water, 1.5 μLprimer I (20 pmol), 1.5 μL primer II (20 pmol), 2.5 μL buffer 10X, 0.5 μL 10 mMdNTP, 0.8 μL (8 μCi) dCTP–32P, 10 mCi/mL, and 0.5 μL Taq DNA polymerasefor a total of 25 μL.Run the 35 cycles of PCR as follows: predenaturation at 94°C for 3 min, dena-turation at 92°C for 1 min, annealing at 55°C for 1 min, and extension at 72°C for1 min plus 2 s extension per round. Elongation at the end at 72°C for 10 min.
2. After run, take out 25 μL, and add 100 μL of chloroform–water saturated.3. Spin down for 2 min at maximum speed.4. Take off aqueous supernatant and load 2 μL for agarose gel to visualize the
products.Take 4 μL of supernatant and add 40 μL of 0.1% SDS, 10 mM EDTA, pH 8.0.
5. Take out 4μL of this mixture and add 7 μL Stop solution. Boil for 10 min at 95°Cand chill on ice.
6. Run on 6% polyacrylamide gel at 30 W, constant power (let bromophenol bluerun to bottom except for exon 7: only three-fourths).
7. Expose autoradiograph overnight at –80°C.
4. Notes
1. DNA extraction. The lysis buffer used to extract DNA from frozen samples con-tains SDS, which lyses cells and nuclei, and proteinase K, which degrades pro-teins. The EDTA chelates Mg ions, reducing nuclease activity. DNA is thenrecovered by phenol extraction, followed by alcohol precipitation. DNA can berecovered from paraffin blocks using commercially available kits, or various pro-tocols which involve: (i) dewaxing, to remove paraffin; (ii) proteinase K diges-tion, with or without SDS and EDTA; and (iii) inactivation of proteinase K, whichcan be achieved either by boiling or by phenol extraction, followed by ethanolprecipitation. An excellent side-by-side comparison of these methods is presentedin (10). The DNA will be sheared and degraded, but should be suitable for PCRanalysis, particularly if the PCR primers are designed to amplify relatively smallproducts (<500 bp).
2. PCR amplification. Mutations in the p53 gene can be characterized by PCRamplification, followed by DNA sequencing. In this approach, PCR primersanneal to the intron sequences immediately upstream and downstream of eachexon. As most inactivating mutations occur within the DNA binding domain,researchers typically limit their analyses to the exons encoding that region of theprotein, which would include exons 5 through 8 (aa 110–307) (11). Primersdesigned to amplify each of these exons were at one time commercially available(Clontech Laboratories, Palo Alto, CA, USA), but the kit has been discontinued.The primer sequences and PCR product sizes are included above.

228 Erster et al.
All PCRs must include a “no template” control, to ensure that your solutions,plasticware, pipetmen, etc., are not contaminated with DNA that may serve as atemplate.
3. Characterization and purification of PCR products. After completion of the reac-tion, remove an aliquot (typically 5–10%) for electrophoresis. Store the remain-der of the reaction at 4°C, as –20°C will freeze the sample and inactivate thepolymerase. If there is little to no product, allow the reaction to proceed for anadditional 3–5 cycles. Be sure to reamplify your no template control as well. (APCR product generated from purified template DNA is only valid if there is noproduct in the no template control.) If the reaction must be stored frozen prior toreamplification, fresh polymerase must be added to the reaction tubes. If there isstill no product after 40 cycles, repeat the PCR using more (i.e., 100 ng) template.Additional positive clones would include human genomic DNA (25–100 ng) orcloned p53 fragments, if available in your laboratory. Exercise caution whenusing cloned p53 as a template, as the resulting amplicons are an ideal source ofcontamination of future reactions. Use only 1–5 ng and avoid contaminatinggloves, etc., with PCR products. If PCR products are observed in positive con-trols, but not your tumor-derived sample, then the tumor sample may containcompounds which are inhibiting Taq DNA polymerase. Dilute the DNA in TE,pH 8.0, re-extract with phenol–chloroform–isoamyl alcohol, and precipitate withone-tenth vol 3 M Na-acetate and 2.5 vol 95% ethanol. If DNA concentration islow, add carrier (i.e., glycogen) to facilitate precipitation.If there is a product in the no template control, consider the multiple possibleways template may have been accidentally introduced into your reaction. This isextremely important if you routinely generate amplicons using a given primerpair and/or work with plasmid clones containing these sequences. To avoid fu-ture contamination, always wear gloves, use barrier pipet tips, autoclave allplasticware, dissolve primers, nucleotides, etc. in PCR-grade (sterilized, filtered)water. Many investigators set up PCRs in a hood, using designated pipetmen andsolutions. Regardless, it is good practice to avoid handling pre- and post-PCRssimultaneously.Prior to sequence analysis, the PCR products must then be recovered free fromthe PCR primers, as these primers could compete with the sequencing primer,resulting in multiple simultaneous sequencing reactions, and a thoroughlyambiguous gel. The PCR products may be purified by commercially availablePCR cleanup kits, and/or digestion with exonuclease I and shrimp alkaline phos-phatase, which digest single-stranded DNA (i.e., primers and incomplete PCRproducts) and unconsumed dNTPs. Alternatively, PCR products may be purifiedby extraction from a low-melt agarose gel. Protocols for recovering DNA fromagarose gels are presented in (5,6) This approach is recommended if the PCRcontains either more than one readily visible PCR product or if there is a singleband with significant “smearing.”
4. Sequencing. The sequencing protocols are straightforward and optimized to avoidmany of the major artifacts associated with sequencing. The p53 coding

Mutational Analysis of p53 229
sequences are devoid of troublesome regions, such as tandem repeats and GCrich regions. In addition, the templates are fairly small (<300 bp), so they shouldbe resolved on a single gel. They can also be sequenced in both directions (i.e.,with forward and reverse primers) to resolve any ambiguities.As loss of heterozygosity (LOH)/loss and/or mutation of p53 is common intumors, a tumor may contain two normal alleles, one normal allele and one mutantallele, two alleles bearing different mutations, or only one mutant allele. Ideally,a known wild-type sequence should be run alongside the tumor samples for com-parison. In a true heterozygote, there should be two bands of roughly equal inten-sity at the same position. If the band corresponding to the wild-type nucleotide issubstantially weaker then the mutant, it could be due to residual normal (stromal)tissue within the tumor.
5. SSCP of human p53. For SSCP, the primers need to be as stringent as possible.The calculated melting point for SSCP primes (for all primers) should be at least60°C, and average 64°C (use 21- to 24-mers). PCR primers should be adjusted toa final concentration of 20 μM (20 pmoles/μL).Optimum fragment length for best resolution is about 150 bp. The longer theyare, the less optimal the resolution is.Some PCR products have to be run on PAGE under specific conditions. p53 exon5 should be run at room temperature with a fan blowing at the plate to dissipatethe heat, with 6% glycerol added into PAGE. p53 exons 6, 7, and 8 should be runin the cold room with 2 fans blowing at the plate from both sides.Controls that can be used for p53 SSCP include nondenatured DNA (2 μL/25 μLwithout stop solution to get nondenatured band) and human cell lines with muta-tions for p53, specifically exon 8: SW 480 colon carcinoma at codon 273, exon 7:S 164 at codon 245, exon 7: ATCC HT-3 cervical carcinoma at codon 245, exon6: ATCC T 47 D/ HT 13 133 ductal breast CA at codon 194, and exon 5: ATCCHOS TE 85 at codon 156.
References1. Kerr, J. F., Wylie, A. H., and Currie, A. R. (1972) Apoptosis: a basic biological
phenomenon with wide-ranging implications in tissue kinetics. Br. J. Cancer 26,239–257.
2. Vousden, K. H. (2000) p53: death star. Cell 103, 691–694.3. Moll, U. M. and Zaika, A. (2001) Nuclear and mitochondrial apoptotic pathways
of p53. FEBS Lett. 493, 65–69.4. Hollstein, M., Hergenhahn, M., Yang, Q., Bartsch, H., Wang, Z. Q., and Hainaut,
P. (1999) New approaches to understanding p53 gene tumor mutation spectra.Mutat. Res. 431, 199–209.
5. Hainaut, P. and Hollstein, M. (2000) p53 and human cancer: the first thousandmutations. Adv. Cancer Res. 77, 81–137.
6. Orita, M., Suzuki, Y., Sekiya T., and Hayashi K. (1989) Rapid and sensitivemethod of point mutation and DNA polymorphisms using polymerase chain reac-tion. Genomics 5, 874–879.

230 Erster et al.
7. Sambrook, J. and Russell, D. W. (eds.) (2001) Molecular Cloning. A LaboroatoryManual. CSH Laboratory Press, Cold Spring Harbor, NY.
8. Ausubel, F. M. (1999) Current Protocols in Molecular Biology. Wiley, New York.9. Lu, X., Park, S. H., Thompson, T. C., and Lane, D. P. (1992) ras-induced hyper-
plasia occurs with mutation of p53, but activated ras and myc together can inducecarcinoma without p53 mutation. Cell 70, 153–161.
10. Frank, T. S, Svoboda-Newman, S. M., and Hsi, E. D. (1996) Comparison of meth-ods for extracting DNA from formalin-fixed paraffin sections for nonisotopicPCR. Diagn. Mol. Pathol. 5, 220–224.
11. Hollstein, M., Sidransky, D., Vogelstein, B., and Harris, C. C. (1991) p53 muta-tions in human cancers. Science 253, 49–53.

Immunocytochemistry and p53 Analysis 231
231
From: Methods in Molecular Biology, vol. 234: p53 ProtocolsEdited by: S. Deb and S. P. Deb © Humana Press Inc., Totowa, NJ
16
Mutational Analysis of p53 in Human Tumors
Immunocytochemistry
Neda Slade and Ute M. Moll
SummaryMutations of the p53 gene are the most common genetic changes in human malignancies;
therefore their detection is of practical importance. In contrast to wild-type p53 in resting nor-mal cells, mutant p53 proteins are easily detectable by immunocytochemical methods due totheir abnormally extended half-life. Several methods of immunocytochemistry can be used toanalyze the presence and localization of p53 protein in cells or tissues. The most important isimmunocytochemical p53 staining of sections from paraffin embedded tissues. This method isused as a relatively reliable surrogate marker for p53 mutations and has the advantage of beingeasy, fast, and suitable for mass screening of large archival tissue banks. Frozen sections canalso be used to detect and localize the p53 proteins. p53 can also be detected in tissue culturecells. p53 can be detected in situ through a secondary antibody coupled to a fluorescent dye oran enzymatic activity that reacts with certain chromogens.
Key Wordsp53 mutation, immunoperoxidase staining, immunofluorescence, frozen sections,
paraffin sections, cytological specimens
1. IntroductionImmunocytochemistry is a method that enables the identification of a tissue
constituent in situ by means of a specific antigen–antibody interaction with alabeled antibody. With this simple, cheap, and rapid method, it is possible todemonstrate both the presence and location of a particular molecule of interest(1,2). In addition, a semiquantitative estimate about the relative amount ofantigen can be made (undetectable, weak, moderate, strong), and the antigen

232 Slade and Moll
content from cell to cell and among different cell types within a tissue can becompared.
Missense mutations of the p53 gene are the most common genetic change inhuman malignancies (3). The DNA binding region of p53 is targeted in 90% ofall cases. Biochemically, p53 can act as a transcription factor that controls keygenes involved in cell death and cell cycle regulation. p53 mutations result in aloss of tumor suppressor functions.
Normal wild-type p53 protein has such a short half-life (30 min) that it isundetectable by immunocytochemical methods. In contrast, mutant p53 pro-teins frequently have greatly extended half-lives (up to 9 h), leading to stablenuclear accumulation in all cells that carry the mutation. Hence, their easydetectability provides a practical surrogate marker for the presence of mis-sense mutations. While this formula is true for a wide variety of tumor types,including those from bladder, colon, breast, brain, and lung, it is important tobe aware of a distinct subset of human cancer types that harbor nuclear p53overexpression without genetic alteration. These include testicular cancers (4–8), head and neck tumors (9), childhood liver tumors (10), the usual type ofendometrial carcinoma (11), uterine papillary serous carcinoma (12), primaryperitoneal carcinoma (13), and acute myelogenous leukemia (14). Similarly, insome breast and colon cancers and most undifferentiated neuroblastomas,abnormally stable wild-type p53 protein (due to HDM2-resistence) ishyperactively exported from the nucleus and, thus, accumulates in the cyto-plasm, causing an impaired nuclear function (15,16). These wild-type but func-tionally impaired nuclear or cytoplasmic p53 phenotypes can also be detectedby immunocytochmistry in cancer tissues.
In normal unstressed cells, p53 is a short-lived protein (a half-life of20–30 min), which is maintained at very low levels through continuous degra-dation. Conversely, a hallmark of all cellular stress pathways that signal to p53is the rapid stabilization of p53 via a block in its degradation. HDM2, throughits complex with p53, is the principal regulator that destabilizes p53 proteinlevels (17,18) and promotes p53 degradation through a ubiquitin-dependentpathway on nuclear and cytoplasmic 26S proteasomes (19,20). HDM2 harborsa p53-specific E3 ubiquitin ligase activity (21), housed at the C-terminal RINGfinger domain (22,23), which transfers multiple ubiquitin tags onto lysine resi-dues, mainly in the C terminus of p53. Biochemical evidence exists that mdm2-mediated p53 ubiquitination takes place in the nucleus in a complex with thelarge p300/CBP protein, possibly serving as a scaffolding (24). Thus, HDM2 islargely responsible for the rapid p53 turnover in undamaged cells (25). By thesame token, mutant p53 proteins in tumor cells are stable, because they aredeficient in transactivating HDM2; hence, they have a defective negative feed-back loop.

Immunocytochemistry and p53 Analysis 233
The very low levels of wild-type p53 in unstressed cells and tissues renderthem undetectable by immunocytochemical methods. However, when cellswith functional p53 undergo DNA damage, a short-lived physiological dam-age response is evoked, leading to transient (up to 48 h) nuclear p53 stabiliza-tion that can be detected by immunocytochemistry (26). Increased amounts ofactive p53 lead to either G1 arrest or apoptosis, thereby protecting the affectedcells from proliferating without repairing their damaged DNA and, thus, pre-serving genetic stability (reviewed in ref. 27). Importantly though, the p53overexpression pattern in tissues under such circumstances is transient andheterogenous in both proportion and intensity, due to the stochastic nature ofthe DNA damage event and a possible dependence of the p53 response on cellcycle stage (26,28).
To analyze the presence and localization of p53 protein in cells or tissues,several methods of immunocytochemisty are used. The anti-immunoglobulinantibodies labeled with fluorescent dye are widely used in immunofluorescenceto detect the p53 protein in tissue culture cells grown on cover slips. Instead offluorescent dye, the antigen can also be detected through a secondary antibodycoupled to an enzymatic activity. The most common enzymes that have beenused in immunocytochemistry are horseradish peroxidase (HRP) and alkalinephosphatase. For each enzyme, a permanent, water-insoluble chromogenic sub-strate exists that identify the antigen in situ.
2. Materials2.1. Immunostaining of Paraffin Sections
2.1.1. Immunoperoxidase Staining
1. Gloves.2. Forceps.3. Staining racks and dishes for solution incubation.4. Xylene.5. Absolute ethanol.6. 95% Ethanol.7. 70% Ethanol.8. Microwave oven.9. Plastic coplin jar for microwave.
10. 1% Zinc sulfate–water or citric acid buffer (0.01 M citric acid in distilled water[dH2O], pH 6.0)
11. Phosphate-buffered saline (PBS) (see Note 1).12. Humid chamber–level tray.13. 30% H2O2.14. 10% Normal serum from the species in which the secondary antibody was gener-
ated (usually goat serum; Zymed Laboratories, South San Francisco, CA, USA).

234 Slade and Moll
15. Bovine serum albumin (BSA), prepare 2% BSA in PBS.16. Primary p53 antibody (see Table 1).17. Histostain SP kit: SA System kit for immunohistological staining for mouse anti-
bodies (Zymed Laboratories; cat. no. 95-6543B) or biotinylated secondary anti-body and streptavidin–HRP diluted in PBS.
18. 3',3'Diaminobenzidinetetrachloride (DAB) (Sigma, St. Louis, MO, USA): 0.06%DAB in 0.05 M Tris buffer, pH 7.6 (see Note 2).
19. Hematoxylin.20. Mounting medium.21. Cover slips.22. Light microscope.
2.1.2. Alkaline Phosphatase Labeling for Immunocytochemistry
1. As for Subheading 2.1.1., steps 1–12, 14–16, 19, and 22.2. Streptavidin–alkaline phosphatase concentrate (BioGenex Laboratories, San
Ramon, CA, USA; cat. no. HK 321-UK) use as a 1:20 dilution (supersensitivecategory).
3. 0.05% Triton® X-100 (0.5 mL/1 L PBS).4. Substrate Pack kit (BioGenex Laboratories; cat. no. HK-182-5K) contains Fast
Red tablets and Naphtol Tris dilution buffer.5. Lavamazole (inhibitor of all other alkaline phosphatase, but not intestinal alka-
line phosphatase), 6 mL stock solution (30 mg/mL PBS), use 2 drops/5 mL ofbuffer (BioGenex Labortories; cat. no. HK-113-5K).
6. Crystalmount (30 mL) (Fisher Scientific, Pittsburgh, PA, USA; cat. no. BM-MO2).
2.2. Immunostaining of Frozen Sections
2.2.1. Tissue Preparation for Frozen Sections
1. Gloves.2. Metal pan.3. Aluminum foil.4. Forceps.5. 2-Methylbutane (Fisher Scientific).6. Styrofoam bucket.7. Liquid nitrogen.8. Embedding media: optimal cutting temperature (OCT) or TISSUE TECH.9. Poly-L-lysine (Sigma) (see Note 3).
10. Superfrost slides.11. Acetone.
2.2.2. Immunoperoxidase of Frozen Sections
1. Humid chamber.2. PBS (see Note 1).

Immunocytochemistry and p53 Analysis 235
Tabl
e 1
Rec
omm
ende
d p5
3-Sp
ecif
ic A
ntib
odie
s fo
r A
naly
sis
of H
uman
Tum
or T
issu
es
Spe
cies
nam
eW
orki
ng d
ilut
ion
Wor
king
dil
utio
nS
ourc
eR
efer
ence
froz
enpa
raff
in
mou
se P
AB
180
10.
5–1 μ
g/m
L0.
5 μ
g/m
LS
anta
Cru
z B
iote
chno
logy
29,3
0ne
eds
Ag-
retr
ieva
l(S
anta
Cru
z, C
A, U
SA
)
mou
se D
O-1
0.5 μ
g/m
L0.
5 μ
g/m
LS
anta
Cru
z B
iote
chno
logy
31ne
eds
Ag-
retr
ieva
l
mou
se D
O-7
1:10
0–1:
200
1:10
0–1:
200
Vec
tor
Lab
orat
orie
s31
(B
urli
ngam
e, C
A, U
SA
)
rabb
it C
M-1
no1:
1000
–1:1
500
Vec
tor
Lab
orat
orie
s32
See
Not
e 11
.
235

236 Slade and Moll
3. 10% Normal serum from the species in which the secondary antibody was gener-ated (usually goat serum).
4. BSA, prepare 2% BSA in PBS.5. Primary p53 antibody (see Table 1).6. Histostain SP kit: SA System kit for Immunohistological staining for mouse an-
tibodies or biotinylated secondary antibody and streptavidin–HRP diluted in PBS.7. DAB: 0.06% DAB in 0.05 M Tris buffer, pH 7.6 (see Note 2).8. Hematoxylin.9. Xylene, absolute ethanol, 95% ethanol.
10. Mounting medium.11. Cover slips.12. Light microscope.
2.3. Immunostaining of Cytological Specimens2.3.1. Immunofluorescence
1. Gloves.2. Falcon® Culture Slide (8 chamber slide; Becton Dickinson Labware, Bedford,
MA, USA; cat. no. 354108) or cover slips coated with poly-L-lysine (see Note 3)and 6-well plate.
3. PBS (see Note 1).4. BSA, prepare 2% BSA in PBS.5. Methanol:acetone (1:1), ice-cold, keep at –20°C.6. 10% Normal serum from the species in which the secondary antibody was gener-
ated (usually goat serum).7. Primary p53 antibody (see Table 1) diluted in 2% BSA/PBS.8. Secondary antibody, fluorescein isothiocyanate (FITC)-labeled, diluted in 2%
BSA/PBS.9. Slow Fade Light Antifade kit (Molecular Probes, Eugene, OR, USA; cat. no.
S-7461).10. Fluorescence microscope.
2.3.2. Immunoperoxidase Staining1. Gloves.2. PBS (see Note 1).3. BSA, prepare 2% BSA in PBS.4. Methanol:acetone (1:1), ice-cold, keep at –20°C.5. 10% Normal serum from the species in which the secondary antibody was gener-
ated (usually goat serum).6. Primary p53 antibody (see Table 1).7. Histostain SP kit: SA System kit for immunohistological staining for mouse anti-
bodies or biotinylated secondary antibody and streptavidin–HRP diluted in PBS.9. DAB: 0.06% DAB in 0.05 M Tris buffer, pH 7.6 (see Note 2).
10. Hematoxylin.11. Mounting medium.

Immunocytochemistry and p53 Analysis 237
12. Cover slips.13. Light microscope.
3. MethodsImportant: never let cells or sections dry out! This will lead to a very strong
background, preventing interpretation of the staining result. Always use con-trols (see Note 4).
3.1. Immunoperoxidase Staining on Paraffin Section
The use of immunocytochemical methods is the most important in theexaminations of tissues. Since the paraffin-embedded tissue architecture andcell morphology remains well-preserved and the tissues are accessible forretrospective studies, they are preferred for immunohistochemical analysis. Thetissue should be properly fixed and embedded into paraffin as soon as possibleto be maximally preserved.
1. 5 μm Paraffin sections on Plus slides, dry at 37°C on hot plate (do not bake at57°C).
2. Deparaffinize, then rehydrate slides up to water (see Note 5).3. Antigen retrieval (see Note 6): microwave 2× for 5 min in 1% zinc sulfate or
citric acid buffer. Let cool down in the solution.4. Wash 2× in PBS for 5 min.5. Quench endogenous peroxidase in 1% H2O2 in PBS for 15 min.Wash 3× in PBS
for 5 min.6. Block with 10% normal serum for 20 min (from the same species in which
biotinylated secondary antibody is produced, usually goat).7. Drain slides, but do not wash.8. Overlay the tissue with primary p53 antibody (see Table 1), (50–100 μL/slide)
diluted in 2% BSA/PBS, and incubate for 1 to 2 h at room temperature or at 4°Covernight (see Note 7).
9. Drain, quick rinse in PBS, then wash 3× for 5 min in PBS.10. Apply biotinylated secondary antibody for 45 min at room temperature.11. Drain, quick rinse in PBS, then wash 3× for 5 min in PBS.12. Overlay the tissue with streptavidin–HRP in PBS for 15 min.13. Wash 3× for 5 min in PBS. Hold in PBS until ready for chromogen.14. Overlay the sections with chromogen (DAB plus H2O2) (see Note 2).15. Stop the reaction at endpoint of 8–10 min by washing under tap water for 5–10 min.16. Counterstain with weak hematoxylin, if desired.17. Run through dehydration chain (see Note 8), embed in mounting media, cover
slip, and blot on paper towel.
3.2. Alkaline Phosphatase Labeling for Immunocytochemistry
1. Repeat steps 1–4 from Subheading 3.1. (Never ever quench with H2O2).2. Repeats steps 6–9 from Subheading 3.1.

238 Slade and Moll
3. Apply alkaline phosphatase-conjugated streptavidin, diluted 1:20 in PBS, incu-bate for 30 min at room temperature.
4. Wash 3× in PBS containing 0.05% Triton X-100 (0.5 mL/1 L PBS).5. Substrate preparation: dissolve 1 tablet Fast Red in 5 mL Substrate Dilution
Buffer containing 2 drops of Lavamazole stock. Vortex mix for 2 min until dis-solved. Filter. Use within 2 h.
6. Incubate for 10 min at 37°C.7. Wash under tap water for 3–5 min.8. Counterstain with weak hematoxylin, if desired.9. Embed in Crystalmount. Bake for 10 min at 50°C. No cover slip. (Never go
through dehydration chain.)
3.3. Snap-Freezing of Freshly Harvested Tissuefor Immunocytochemistry
This is a general snap-freezing protocol and works very well.Sections of snap-frozen tissue can be used to detect the antigens that are
destroyed during tissue fixation and processing of paraffin embedding.
1. Cut a slice of freshly harvested tissue (only about 10 x 10 x 5 mm, because biggerpieces do not freeze properly). Line a little metal pan with aluminum foil (avoidfolds).Optional: fill with embedding media (OCT or TISSUE TECH) to 1 to 2 mm andpush flat face of tissue gently down with forceps (optional: cover tissue withmore embedding media).
2. Pour 40 mL of 2-methylbutane into thick-walled beaker and dip it into bucket(styrofoam) containing liquid nitrogen (N2 level should be lower than beaker).When butane stops foaming and splattering, dip OCT-embedded tissue intochilled butane and submerse for 8–10 s while moving up and down (always sub-mersed). OCT will freeze and appear white. The tissue should be stored at –20°or –80°C (ship on plenty of dry ice). The purpose of using butane as a directfreezing medium rather than liquid N2 is that it cools only to –140°C, whichavoids freezing artifacts and the tissue freezes more evenly.
3.4. Frozen Sectioning and Fixation for Immunocytochemistry
1. Cut 5 μm sections of snap-frozen tissue on cryostat, collect them on poly-L-lysine-coated Superfrost slides, and label with pencil (see Note 3).
2. Air-dry for 20 min and desiccate overnight at room temperature (all the moisturehas to be out).
3. Fix for 10 min in 100% acetone (can be reused many times).4. Air-dry for 40 min.5. Wrap and label each slide in aluminum foil. Store at –80°C until needed. Before
staining, let slides air-dry at room temperature for 30 min.

Immunocytochemistry and p53 Analysis 239
3.5. Immunoperoxidase Staining on Frozen Section
1. Take fixed slides from –80°C and let them equilibrate to room temperature beforeunwrapping.
2. Wash 3× for 3 min in PBS.3. Repeat steps 6–17 from Subheading 3.1.
3.6. p53 Immunofluorescence Protocol
The technique of immunofluorescence is used for frozen tissue sections or,more commonly, for tissue culture cells grown on cover slips or culture cham-bers. It provides a sensitive method for the detection and localization of spe-cific antigens. Flouorescent molecules (fluorocromes) can be directly bound toprimary p53 antibody (see Table 1) or indirectly to a secondary antibody. Thefluorochromes most widely used are FITC (apple green emitting), rhodamine,and cyanines (Cy™3 and Cy5), red emitting.
1. Grow cells on Falcon culture slides. Cell density is crucial and should be about50%. Too high density impedes with staining. An alternative is to grow cells onsterilized poly-L-lysine-coated glass cover slips in 6-well plates (see Note 3).
2. Rinse slides carefully (check cells to see if they are washing off) and quicklywith PBS and fix in ice-cold solution of methanol:acetone (1:1) for 3 min. Air-dry well for 10 min (see Note 9).
3. Wash 3× for 3 min in PBS.4. Overlay each well (or cover slip) with 50 μL of 10% goat serum to block, and
arrange in humidified chamber. Incubate for 20 min at room temperature.5. Quick rinse with PBS.6. Overlay each well with 50 μL of primary p53 antibody (see Table 1) (diluted
with in 2% BSA) in a humidified chamber. Incubate for 2 h at room temperature.7. Wash 3× for 3 min in PBS.8. Add 50 μL of anti-mouse secondary antibody FITC-labeled and incubate for
45 min at room temperature in the dark (see Note 10).9. Wash 3× for 3 min in PBS.
10. Remove chamber seal and cover slip with Slow Fade Light Antifade kit. Forcover slips: flip onto a drop of Antifade Kit on a glass slide.
11. Examine on the fluorescent microscope using appropriate filter.
3.7. Immunoperoxidase Staining of Tissue Culture Cells
1. Prepare the cells the same way as for immunofluorescence Subheading 3.6.,steps 1–7).
2. Incubate in biotinylated secondary antibody for 45 min at room temperature.3. Wash 3× for 3 min in PBS.4. Incubate with streptavidin–HRP in PBS for 15 min at room temperature.

240 Slade and Moll
5. Wash 3× for 3 min in PBS.6. DAB staining for 5–10 min (depends on the cell system) (see Note 2).7. Wash gently under tap water for 5 min.8. Remove chamber.9. Counterstain with weak hematoxylin, if desired.
10. Dehydrate all the way up to xylene (see Note 8), remove silicone gasket withforceps, and embed in mounting media, cover slip, and blot on paper towel.
4. Notes1. Preparation PBS: prepare stock 1, 455 μM Na2HPO4 (64.6 g/L); and stock 2,
85 μM NaH2PO4 (11.7 g/L). Take 200 mL of each stock and 87.7 g of NaCl andadd dH2O up to 10 L.
2. Preparation of DAB solution: dissolve one 10-mg tablet in 16 mL of 0.05 M Trisbuffer (pH 7.6) to get 0.06% DAB. Filter through Whatman paper. Freeze inaliquots at –20°C; no longer use when brown. To use, thaw in warm water in alight-protected place, and add 30% H2O2 (2 mL DAB plus 1.5 μL H2O2) and mix.Immediately use to overlay sections and observe reaction. DAB is a potentialcarcinogen, so it is necessary to handle with extreme precautions. The contami-nated dishes should be cleaned up with 30% bleach. DAB is available in tabletswhat is better to reduce contact with chromogen.
3. Poly-L-lysine coating of glass slides: use precleaned slides or clean with 1% HClin 70% ethanol. Allow diluted poly-L-lysine to come to room temperature beforeuse. Place racks of clean slides into solution for 5 min. Drain slides and dry in60°C oven for 1 h or at room temperature overnight. Working solution: dilutepoly-L-lysine 1:10 with double-distilled water (ddH2O). Filter after use and storeat 4°C. Stable for at least 3 mo. Alternatively, the slides could be coated withsilane, or “Plus” slides can be used. They are negatively charged glass slides thatdo not require coating with poly-L-lysine or silanization.
4. It is very important to use controls to be sure that the reaction is specific. Controlslides of known reactivity should be run in each experiment, as well as the nega-tive control. Possible negative controls are: (i) substitute primary antibody bymouse or rabbit normal immunoglobulin (IgG) at same concentration; (ii) substi-tute primary antibody by blocking (normal) serum (1:10 in 2% BSA in PBS); (iii)substitute primary antibody or secondary antibody or streptavidin–HRP by 2%BSA in PBS; and (iv) primary antibody pre-incubated with excess purified Ag topreabsorb.
5. Deparaffinize 3× for 3 min with xylene. Rehydrate 2× with absolute ethanol(1 min and 3 min, respectively), once with 95% ethanol for 1 min and then with70% ethanol for 1 min.
6. Some antigens are altered, destroyed, or masked during the process of fixationand embedding of tissue, which may influence their detection. To increase thesensitivity, sometimes the pretreatment is necessary. Heat-induced epitoperetrieval is the most effective in paraffin-section immunohystochemisty. Themost popular retrieval buffers are 1% zinc sulfate and citric acid buffer (0.01 Mcitric acid in dH2O, pH 6.0).

Immunocytochemistry and p53 Analysis 241
7. Drying danger during long incubation with primary antibody.8. Dehydratation process: dip the slides 2× for 1 min into 95% ethanol, 2× for 1 min
into absolute ethanol, and 3× for 3 min in xylene.9. At this point, you can mail them with the cover on. Please pack them well in their
original trays, because the chambers come off easily.10. If primary antibody is made in rabbit, use anti-rabbit secondary. The secondary can
be labeled with another fluorocrome, such as rodamine or cyanine to get red color.11. Although some have suggested to use mouse monoclonal PAB 240 as an anti-
body that is capable of detecting mutant p53 “pan-mutant” antibody, it does notwork reliably in tissue. Potentially use only in immunoprecipitations.
References1. Mao, S.-Y., Javois, L. C., and Kent, U. M. (1999) Overview of antibody use in
immunocytochemistry, in Methods in Molecular Medicine, vol 115: Immunocy-tochemical Methods and Protocols (Javois, J. C., ed), Humana Press, Totowa,pp. 3–10.
2. Sternberger, L. A. (1979) Immunocytochemistry, 2nd ed. Wiley, New York.3. Greenblatt, M. S., Bennett, W. P., Hollstein, M., and Harris, C. C. (1994) Muta-
tions in the p53 tumor suppressor gene: clues to cancer etiology and molecularpathogenesis. Cancer Res. 54, 4855–4878.
4. Lutzker, S. G. and Levine, A. J. (1996) A functionally inactive p53 protein interatocarcinoma cells is activated by either DNA damage or cellular differentia-tion. Nat. Med. 2, 804–810.
5. Riou, G., Barrois, M., Prost, S., Terrier, M. J., Theodore, C., and Levine, A. J.(1995) The p53 and mdm-2 genes in human testicular germ-cell tumors. Mol.Carcinog. 12, 124–131,
6. Murty, V. V., Bosl, G. J., Houldsworth, J., et al. (1994) Allelic loss and somaticdifferentiation in human male germ cell tumors. Oncogene 9, 2245–2251.
7. Peng, H. Q., Hogg, D., Malkin, D., et al. (1993) Mutations of the p53 gene do notoccur in testis cancer. Cancer Res. 53, 3574–3578.
8. Schenkman, N. S., Sesterhenn, I. A., Washington, L., et al. (1995) Increased p53protein does not correlate with mutations in microdissected human testicular germcell tumors. J. Urol. 154, 617–621.
9. Xu, L., Chen, Y. T., Huvos, A. G., et al. (1994) Overexpression of p53 in squa-mous cell carcinomas of head and neck without apparent gene mutations. Diagn.Mol. Pathol. 3, 83–92.
10. Kennedy, S. M., MacGeogh, C., Jaffe, R., and Spurr, N. K. (1994) Overexpressionof the oncoprotein p53 in primary hepatic tumor of childhood does not correlatewith the gene mutations. Hum. Pathol. 25, 438–442.
11. Ambros, R. A., Ross, J. F., Kallakury, B. V. S., et al. (1995) p53 gene status inendometrial carcinomas showing diffuse positivity for p53 protein by immuno-histochemical analysis. Mod. Pathol. 8, 441–445.
12. King, S. A., Adas, A. A., LiVolsi, V. A., et al. (1995) Expression and mutationanalysis of the p53 gene in uterine papillary serous carcinoma. Cancer 75,2700–2705.

242 Slade and Moll
13. Marchenko, N. D. and Moll, U. M. (1997) Nuclear overexpression of p53 proteindoes not correlate with gene mutation in primary peritoneal carcinoma. Hum.Pathol. 28, 1002–1006.
14. Zhang, W., Hu, G., Estey, E., Hester, J., and Deisseroth, A. (1992) Altered con-formation of the p53 protein in myeloid leukemia cells and mitogen-stimulatednormal blood cells. Oncogene 7, 1645–1647.
15. Moll, U. M., LaQuaglia, M., Benard, J., and Riou, G. (1995) Wild-type p53 pro-tein undergoes cytoplasmic sequestration in undifferentiated neuroblastomas butnot in differentiated tumors. Proc. Natl. Acad. Sci. USA 92, 4407–4711.
16. Stommel, J. M., Marchenko, N. D., Jimenez, G. S., Mol, U. M., Hope, T. J., andWahl, G. M. (1999) A leucine-rich nuclear export signal in the p53 tetramerizationdomain: regulation of subcellular localization and p53 activity by NES masking.EMBO J. 18, 1660–1672.
17. Haupt, Y., Maya, R., Kazaz, A., and Oren, M. (1997) Mdm2 promotes the rapiddegradation of p53. Nature 387, 296–299.
18. Kubbutat, M. H., Jones, S. N., and Vousden, K. H. (1997) Regulation of p53stability by Mdm2. Nature 387, 299–303.
19. Maki, C. G., Huibregtse, J. M., and Howley, P. M. (1996) In vivo ubiquitinationand proteasome-mediated degradation of p53. Cancer Res. 56, 2649–2654.
20. Shirangi, T. R., Zaika, A., and Moll, U. M. (2002) Nuclear degradation of p53occurs during down-regulation of the p53 response after DNA damage. FASEB J.16, 420–422.
21. Honda, R., Tanaka, H., and Yasuda, H. (1997) Oncoprotein MDM2 is a ubiquitinligase E3 for tumor suppressor p53. FEBS Lett. 420, 25–27.
22. Kubbutat, M. H., Ludwig, R. L., Levine, A. J., and Vousden, K. H. (1999) Analy-sis of the degradation function of Mdm2. Cell Growth Differ. 10, 87–92.
23. Fang, S., Jensen, J. P., Ludwig, R. L., Vousden, K. H., and Weissman, A. M.(2000) Mdm2 is a RING finger-dependent ubiquitin protein ligase for itself andp53. J. Biol. Chem. 275, 8945–8951.
24. Grossman, S. R., Perez, M., Kung, A. L., et al. (1998) p300/MDM2 complexesparticipate in MDM2-mediated p53 degradation. Mol. Cell 2, 405–415.
25. Bottger, A., Bottger, V., Garcia-Echeverria, C., et al. (1997) Molecular character-ization of the hdm2-p53 interaction. J. Mol. Biol. 269, 744–756.
26. Fritsche, M., Haessler, C., and Brandner, G. (1993) Induction of nuclear accumu-lation of the tumor suppressor protein p53 by DNA-damaging agents. Oncogene8, 307–318.
27. Ko, L. and Prives, C. (1996) p53: puzzle and paradigm. Genes Dev. 10, 1054–1072.28. Waggoner, S. E., Anderson, S. M., Luce, M. C., Takahashi, H., and Boyd, J. (1996)
p53 protein expression and gene analysis in clear cell adenocarcinoma of the va-gina and cervix. Gynecol. Oncol. 60, 339–344.
29. Yewdell, J. W., Gannon, J. V., and Lane, D. P. (1986) Monoclonal antibody analy-sis of p53 expression in normal and transformed cells. J. Virol. 59, 444–452.
30. Banks, L., Matlashewski, G., and Crawford, L. (1986) Isolation of human p53specific monoclonal antibodies and their use in human p53 expression. Eur. J.Biochem. 159, 529–534.

Immunocytochemistry and p53 Analysis 243
31. Vojtesek, B., Bartek, J., Midgley, C. A., and Lane, D. P. (1992) An immunochemi-cal analysis of the human nuclear phosphoprotein p53: new monoclonal antibod-ies and epitope mapping using recombinant p53. J. Immunol. Methods 151,237–244.
32. Midgley, C. A., Fisher, C. J., Bartek, J., Vojtesek, B., Lane, D., and Barnes, D. M.(1992) Analysis of p53 expression in human tumours: an antibody raised againstp53 expressed in Escherichia coli. J. Cell Sci. 101, 183–189.

p53-Induced Apoptosis 245
245
From: Methods in Molecular Biology, vol. 234: p53 ProtocolsEdited by: S. Deb and S. P. Deb © Humana Press Inc., Totowa, NJ
17
Flow Cytometric Analysis of p53-Induced Apoptosis
Michael Berger and Ygal Haupt
SummaryThe p53 protein is a key player in the cellular response to stress conditions. Activation of
p53 induces growth inhibition in the form of cell growth arrest or apoptosis. The latter plays animportant role in the tumor suppression function of p53. It is therefore of great interest tounderstand in detail the mechanisms by which p53 induces apoptosis. In this chapter, wedescribe a flow cytometric assay for the measurement of p53 apoptotic activity. This assay isapplicable for exogenously expressed p53 by transfection as well as for endogenous p53. Thep53 protein is detected by intra-cellular fluorescent staining of p53 or by tagging p53 withGFP. The extent of apoptosis in cells expressing p53 is determined by cell cycle distributionusing flow cytometry. The protocol described here can be employed to study the regulation ofp53-medaited apoptosis and can be broadly applied to other apoptotic proteins.
Key Wordsapoptosis, p53, sub-G1, flow cytometry (FACS), GFP
1. IntroductionThe p53 tumor suppressor protein is a transcription factor that plays a key
role in the prevention of cancer development. In response to various stresssignals, p53 is accumulated and activated to induce cell cycle arrest, therebypreventing the replication of damaged DNA. Under certain stress conditions,or in response to oncogenic events, p53 induces programmed cell death(apoptosis). These growth inhibitory activities are pivotal to tumor suppres-sion by p53. The promotion of cell growth arrest permits the repair of the dam-aged DNA, whereas the induction of apoptosis ensures the elimination of cellswith a potential to become cancerous. Intensive research over the past decadevastly improved our understanding of how p53 exerts these activities. In thischapter, we will describe a flow cytometric assay for studying p53-mediated

246 Berger and Haupt
apoptosis. We will discuss various approaches for performing this assay andwill outline the pros and cons of this assay.
1.1. Measurements of p53-Mediated ApoptosisApoptosis is a suicide program that occurs naturally in multicellular
organisms in response to physiological signals. The apoptotic process isessential for many different processes, as varied as the maintenance of theimmune response, to proper embryonal development. The apoptotic activityof p53 is essential for the elimination of defective and potentially carcino-genic cells. p53 induces apoptosis by multiple mechanisms involving bothtranscription-dependent and -independent pathways. These include the gen-eration of reactive oxygen species, depolarization of the mitochondrial mem-brane, and the activation of caspase cascades (1).
The apoptotic processes is characterized by morphological and biochemicalfeatures. These include blebbing of the plasma membrane, exposure ofphosphatidylserine on the outer plasma membrane, condensation of the chro-matin, and internucleosomal DNA fragmentation. We take advantage of thelast two features in order to detect apoptotic cells in the assay described here.The DNA content in arrested diploid cells is 2N. During S (Synthesis) phase,the amount of DNA increases from 2N to 4N and remains 4N until mitosis,when the DNA content is divided to 2N for each daughter cell. A decrease inthe total DNA content in apoptotic cells results from a number of events: (i)fragmented DNA leaves the apoptotic cells by diffusion; (ii) chromatic con-densation reduces the accessibility of the DNA dye to the DNA; and (iii) someof the apoptotic cells fragment into apoptotic bodies, most of which containless than the total DNA content. Cells with DNA content of less than 2N,referred to as sub-G1 DNA content, are dead cells and have been previouslyauthenticated as apoptotic cells using other markers of apoptosis (e.g., 2).
The assay for the apoptotic activity of p53 described here is based on thetransient transfection of cells using expression plasmids for p53. Cells arestained for p53 using a fluorescent marker, and the successfully transfectedsubpopulation is identified according to their fluorescent intensity. The trans-fected and nontransfected subpopulations are discriminated, and the cell cycledistribution of each is analyzed separately. This assay provides a measurementof the apoptotic fraction in each population. The detection of p53 and stainingof DNA requires the prior permeabilization of the cells by fixation. This hastwo purposes: (i) to allow the entrance of antibodies and the DNA dye,propidium iodide (PI), into the cell and into the nucleus; and (ii) to allow thefragmented DNA to exit the apoptotic cells, a process that is essential for thedetection of DNA loss. As discussed below, the type of fixation is importantand can be critical for carrying out this protocol successfully.

p53-Induced Apoptosis 247
2. Materials
Caution must be taken when using PI, which is a potentially mutagenic sub-stance that can be absorbed through the skin or by inhalation. It is recommendedto wear suitable protective clothing, including gloves and eye protection, whenhandling PI. The following materials are required for the assay.
1. Cells and suitable medium, serum, and other relevant supplements (depending onthe cell type under study).
2. Tissue culture grade dishes (92 mm).3. Trypsin solution (0.02% ethylenediamine tetraacetic acid [EDTA], 0.25%
trypsin) for lifting adherent cells from the plates. Store the solution at 4°C andwarm up to 37°C before use.
4. Polystyrene conic centrifuge tubes (15 mL) for centrifugation and 5-mLpolystyerene round-bottom tubes (12 × 75 mm style) for the use in the flowcytometer.
5. Phosphate-buffered saline (PBS).6. PI (5 μg/mL final), stored at 4°C at 5 mg/mL stock. Lyophilized PI should be
dissolved in double-distilled water.7. RNase I solution stored at 4°C as 10 mg/mL stock solution. Inactivate DNases by
boiling for 15 min.8. Nylon mesh (100 μM).9. Analytical grade methanol (100%) and cool to –20°C before use.
10. Anti-p53 antibodies, either directly conjugated to fluorescein isothiocyante(FITC) or nonconjugated. The antibody can be purified from ascetic fluid or asupernatant from hybridoma. For detecting human p53, we recommend using amixture of two monolocal anti-p53 antibodies: DO1 and PAb 1801. For detectingmouse p53, we recommend using CM5 polyclonal antibody or PAb 421 mono-clonal antibody. Other antibodies work well for both human and mouse p53.
11. A FITC-conjugated anti-mouse secondary antibody is required if the primaryanti-p53 antibody is not directly conjugated to fluorescent marker.
12. Flow cytometer (e.g., FACScalibur™, FACScan™, FACSort, and FACS® Van-tage), computer, and appropriate software (e.g., CellQuest or LYSYS™ II).
3. Methods
p53-transfected cells can be detected by intracellular staining of p53, usinganti-p53 antibodies, or by using a tag, such as green fluorescent protein (GFP),either fused to p53 or co-expressed along with p53. In the following sections, wedescribe the three different options for detecting p53 in the transfected cells. Ineach subheading, the pros and cons of each approach will be outlined. While theprotocol describes a transient transfection assay, it can easily be adapted fornontransfection experiments assessing the apoptotic activity of endogenous p53.

248 Berger and Haupt
3.1. Apoptotic Assay for Transiently Transfected p53: Nontagged
The transient transfection apoptotic assay has several advantages over thestable transfection approach. First, as the name implies, the assay is short(between 1–3 d). Second, the assay is versatile and adjustable, allowing theassessment of various combinations of proteins at different ratios between theproteins assayed and under different experimental conditions. Third, there isno clonal selection of cells for certain growth or survival characteristics. Hence,the results represent the response of a heterogenous population. The major pit-fall of transient transfection is that the transfected proteins are oftenoverexpressed. This problem can be addressed in two ways: (i) the DNA maybe introduced via a retroviral delivery system, which often results in a lowerexpression level of the recombinant protein, closer to the range of physiologi-cal expression levels; (ii) a weak promoter to drive p53 expression may beemployed. In the analysis stage, region 1 (R1) may be adjusted to include onlycells with lower p53 expression (see Note 1).
1. Plate out cells at semiconfluent density, 24 h before transfection.2. Transfect cells with p53 expression plasmid (between 0.1–5 μg/sample; see Note
2) alone or together with an expression vector(s) encoding a desired protein(s).Calcium phosphate method or other transfection reagents, which do not causemuch cell death and yet achieve high efficiency, are suitable. The use ofelectropotation, for example, is not suitable because of the high levels of celldeath inflicted by the transfection itself (see Note 3).
3. At 24–72 h posttransfection, harvest the cells (see Note 2). In the case of adher-ent cells, collect the cells by combining the floating cells from the medium withthe adherent cells. Adherent cells are lifted by trypsinization and are combinedwith the floating cells in the same tube. The dish is washed once with PBS, andthe washed cells are added to the same tube. It is important to collect the floatingcells, since these are often dying cells.
4. Wash cells by spinning at 1200 rpm (340g) in a tabletop centrifuge for 5 min at 4°C.5. Discard the supernatant and resuspend cells in 300 mL of cold PBS. It is very
important to bring the cells into a single-cell suspension before the next step offixation. Any clumps of two or more cells will be fixed as such and can causeblockage in the flow cytomteric tubing during acquisition.
6. Fix the cells by adding 5 mL of cold (–20°C) methanol (see Note 4) in a drop-wise manner, while the tube of cells are vortex mixed at medium speed. The slowaddition of the fixative during agitation is done in order to fix single cells andavoid the fixation of cell clumps (see Note 5).
7. Incubate the sample at –20°C overnight. Methanol fixation permeates the cellmembrane, and the long incubation in methanol allows for sufficient time for thefragmented DNA to leave the cells. This step facilitates the detection of cells withsub-G1 DNA content. The samples can be stored for longer periods (up to several

p53-Induced Apoptosis 249
weeks) given that the sample does not dry out. This provides a convenient step forcombining samples from kinetic studies having multiple harvest time points.
8. Following fixation, wash the cells by spinning at 2000 rpm (960g) in a tabletopcentrifuge for 5 min at 4°C. Resuspend the cells in 1 mL of cold PBS. Leave thecells for 30 min at 4°C to allow for rehydration. Cells can be kept at 4°C at thisstage for a longer period (up to several days).
9. Spin the cells as in step 8. Resuspend cells in 100 μL of antibody solution. In thecase of purified antibody, whether directly conjugated to FITC or not, usebetween 2–10 μg/mL of antibody. The optimal concentration of the antibodymust be determined empirically in advance. If the source of the antibody is froma hybridoma supernatant, resuspend the cells in 100 μL of undiluted supernatant.
10. Incubate the cells at room temperature for 1 h with occasional gentle mixing ofthe cells.
11. Rinse the cells by adding 5 mL of PBS and spin as in step 8.12. If a nonconjugated primary antibody is used, resuspend the cells in PBS solution
containing FITC-conjugated anti-mouse secondary antibody. As in the case ofthe primary antibody, the concentration should be determined in advance using aknown concentration of primary antibody. Incubate in the dark for 30 min atroom temperature with occasional mixing.Note: from this stage, keep the samples in the dark as much as possible.
13. Rinse the cells by adding 5 mL of PBS, and spin as in step 8.14. Resuspend the cells in PBS (to achieve 1 × 10⁶ cells/mL) (see Note 6).15. Add RNase A to a final concentration of 50 μg/mL and incubate at room tem-
perature for 20 min in the dark. RNase is used to degrade the RNA in the cells,which otherwise contributes to the overall staining by the PI.
16. Filter the sample through a nylon mesh (100 nm) to remove cell clumps and anydebris in the sample.
17. Add PI to a final concentration of 5 μg/mL and acquire data in the fluorescence-activated cell sorter (FACS) (see Subheading 4).
3.2. Apoptotic Assay for Transiently Transfected GFP-p53or Co-Expressed GFP
An alternative method for detecting p53-transfected cells is by using a tag.A variety of tags are available (3); however, most of the tags require a specificantibody to recognize them. Hence, the main advantage in using such a tagover direct detection of p53 is when there is a need to distinguish betweenexogenous p53 from the endogenous protein. The use of naturally fluorescentproteins, such as the GFP, provides an attractive alternative. There are twomajor advantages in using GFP to detect transfected cells over the direct stain-ing of p53. First, fixed cells can be analyzed directly, bypassing the stainingprocedure, which saves time and expensive reagents. Second, it avoids thepotential problem of background staining. Two approaches for the use of GFPas a marker can be used: (i) use a GFP-p53 fusion protein (e.g., 4) and detect

250 Berger and Haupt
p53 according to the GFP fluorescence, since every GFP positive cell also ex-presses p53; and (ii) co-express p53 together with an expression plasmid forGFP. This alternative can be problematic, since there is a selection for cellsexpressing GFP alone, which presumably proliferate normally, whereas cellsexpressing both GFP and p53 either enter growth arrest or apoptosis. The longerthe experiment is carried out, the greater the effect of the selection becomes. Inorder to minimize this selection, the ratio of expression plasmids for p53 andGFP should be 1:10, respectively. An additional problem with using co-trans-fected free GFP is the small size of the GFP protein (29 kDa), which tends toleave the cells following methanol fixation. For this purpose, a modified GFPconstruct, which can be anchored to the cell (e.g., 5) should be used. Regard-less of whether the GFP is free or fused to p53, its effect on apoptosis in theexperimental system under study should be determined. Hence, a negative con-trol sample of GFP alone must be added to these apoptotic assays.
1. Follow steps 1–8 from Subheading 3.1.1.2. Spin cells at 2000 rpm (960g) in a tabletop centrifuge for 5 min at 4°C.3. Continue from step 14 in Subheading 3.1.1.
3.3. Apoptotic Assay for Endogenous p53
The analysis of p53-mediated apoptosis in cells expressing endogenous p53,wild-type or mutant, does not require staining for p53, unless the expressionlevel is heterogeneous among the population. In this case, follow the basicprotocol in Subheading 3.1.1., with the exception that transfection is not rel-evant, and the comparison is not within a sample, but rather between treated vsnontreated cells.
1. Plate out cells at a semiconfluent density 24 h before transfection.2. At the desired time after treatment, collect cells by combining floating and adher-
ent cells as described in Subheading 3.1.1., step 3).3. Follow steps 4–8 as described in the basic protocol (Subheading 3.1.1.).4. Spin cells at 2000 rpm (1660g) in a tabletop centrifuge for 5 min at 4°C.5. Continue from step 14 of Subheading 3.1.1.
3.4. Acquisition of DataThe apoptotic activity of p53 is analyzed by flow cytometry. The transfected
cells are identified according to their p53 fluorescent intensity or according totheir GFP fluorescent intensity, when appropriate. Each sample is viewed in adot plot of forward scatter (which measures cell size) vs fluorescent intensity(of FL1) on a logarithmic scale (FL1 = FITC or GFP fluorescence) (Fig. 1A).Cells with high fluorescent intensity (in FL1) represent the subpopulation ofsuccessfully transfected cells, shown as black dots in Fig. 1A. The

p53-Induced Apoptosis 251
nontransfected subpopulation, which represents cells with low fluorescentintensity, is shown as grey dots (Fig. 1A). A region is drawn around the trans-fected subpopulation and is defined as R1 in Fig. 1A (see Note 7). Note thatthe lower line of the region has a slope, which parallels the natural slope of thepopulation relative to the y-axis. The nontransfected population is defined asall the cells except those belonging to R1 (not R1).
To eliminate doublets and larger aggregates of cells, a second region (R2) isdefined. This discrimination (doublet discrimination module [DDM]) is basedon PI staining of the cells. This discrimination is based on a comparison of twointegral values of the electronic signal, the area and the width of the pulse, foreach cell analyzed. Plot the FL3 area (FL3-A) vs the FL3 width (FL3-W), bothon a linear scale. This plot provides a characteristic pattern of cell cycle distri-bution reflecting the DNA content of cells in different phases of the cell cycle.Events with excessively high FL3-A or FL3-W fluorescence represent thestaining of two or more cell aggregates. A region is defined around the majorpopulation, excluding cell aggregates (R2 in Fig. 1B). It is crucial to includeevents with low fluorescent intensity, since these represent dead cells (markedas sub-G1 in Fig. 1B). Only cells falling within the R2 region will be collected.Now, the R1 and R2 regions are used to define the desired subpopulations foracquisition. These are as follows:
1. Transfected population equals R2 and R1 (cells falling within R1 and within R2).2. Nontransfected population equals R2 and (not R1) (cells falling within R2, but
outside R1). Equal number of cells (a minimum of 5000 cells) from each sub-population is collected separately. The cell cycle distribution of each subpopula-tion is determined by profiling their DNA content. A histogram plot of Fl2, whichmeasures the fluorescent intensity of PI on a linear scale, is used for this purpose.The cell cycle distribution, according to the DNA content of a diploid cell popu-lation, is marked in Fig. 1C. Cells falling into the sub-G1 region represent therelative fraction of apoptotic cells in the population (see Note 7).
3.5. Analysis of Data
The transfected and nontransfected subpopulations from each sample areanalyzed (see Fig. 2). Calculate the percentage of cells with a sub-G1 DNAcontent by placing a marker encompassing the sub-G1 region (Fig. 2B). Themarker should begin from the end of the left slope of the G1 peak to 50 chan-nels to the right of the Y-axis. It is important not to draw the marker on theaxis, because it will include electronic noise. To avoid this potential problem,choose the FL2 as the threshold, and set the channel value for 50. For eachacquisition data, obtain statistical analysis for the number of events in the sub-G1 region (use the stat function in the application CellQuest or LYSYS II).

252 Berger and Haupt
252
Fig.
1. F
low
cyt
omet
ric
anal
ysis
of
tran
sien
tly
tran
sfec
ted
cell
s. S
aos-
2 lu
ng a
deno
carc
inom
a ce
lls
(lac
king
p53
exp
ress
ion)
wer
etr
ansf
ecte
d w
ith
3 μ
g of
exp
ress
ion
plas
mid
for
wil
d-ty
pe h
uman
p53
. Sev
enty
hou
rs p
ostt
rans
fect
ion,
cel
ls w
ere
harv
este
d, f
ixed
,an
d st
aine
d w
ith
a m
ixtu
re o
f an
ti-p
53 a
ntib
odie
s, P
Ab
1801
and
DO
1, a
s de
scri
bed
in th
e ba
sic
prot
ocol
(Su
bhea
ding
3.1
.1.)
. Cel
lsw
ere
then
sta
ined
with
FIT
C-c
onju
gate
d go
at a
nti-
mou
se s
econ
dary
ant
ibod
y an
d si
mul
tane
ousl
y st
aine
d fo
r D
NA
usi
ng P
I (5
μg/
mL
).C
ells
wer
e an
alyz
ed in
the
flow
cyt
omet
er (
4-co
lor
FAC
Scal
ibur
) w
ith r
espe
ct to
thei
r p5
3 fl
uore
scen
t int
ensi
ty in
ord
er to
sep
arat
e th
ebr
ight
ly s
tain
ed c
ells
from
the
rest
of t
he p
opul
atio
n. T
he fl
uore
scen
t int
ensi
ty o
f the
FL
1 is
init
iall
y ca
libr
ated
by
mea
suri
ng th
e no
n-tr
ansf
ecte
d ce
lls.
Pan
el A
show
s a
plot
of p
53 fl
uore
scen
ce (F
L1
on lo
gari
thm
ic s
cale
) vs
forw
ard
scat
ter (
x-ax
is).
(Con
tinu
ed o
n ne
xtpa
ge)

p53-Induced Apoptosis 253
The overall proportion of the apoptotic activity of p53 is calculated as the per-centage of sub-G1 cells in the transfected population (Fig. 2D) minus the per-centage of sub-G1 cells in the nontransfected population (Fig. 2F). In theexample shown in Fig. 2, the transfected population had 21% apoptosis, whilethe nontransfected population had 5% apoptosis, hence p53-mediated in thissample was calculated to be 16%.
4. Notes1. Certain proteins that regulate p53 activity, such as Mdm2 and HPV-E6, also pro-
mote its degradation through the proteasome (1). It is difficult to weigh the relativecontribution of p53 degradation to the overall down-regulation of p53 by theseinhibitors. The use of the assay described here allows us to measure the effect of ap53 inhibitor on p53 apoptotic activity in a manner independent of protein degra-dation. We compare equal numbers of cells, falling into the defined R1 region,from a sample of cells transfected with p53 alone to that of p53 plus an inhibitor.This approach has been used previously to show the effect of Mdm2 on p53apoptotic activity independent of p53 degradation (e.g., see refs. 7 and 8). Further,it is sometime desirable to study the activity of p53 with relation to its expressionlevels. The selection of different p53 expression levels can be achieved by defin-ing the R1 region around cells with high, medium, or low fluorescent intensity.
2. p53-mediated apoptosis is time- and dose-dependent. For any given experimen-tal system, it is essential to calibrate both parameters. Kinetics studies using vary-ing concentrations of p53 expression plasmids should be performed. The timewindow for p53-induced death in transient transfection is between 18 to approx90 h, depending on the expression levels and the cell type. Kinetics experimentsare facilitated by the ability to store the cells at the fixation step, and then con-tinue the experiment at a convenient time. In such studies, it is expected to see adecrease in the transfection efficiency, as measured by the percentage of fluores-
Fig. 1 (continued from page 8) The region R1 was drawn in such as away as to includethe brightly stained cells. Cells falling within R1 (black dots) represent the p53-trans-fected cells, while the cells outside R1 are the nontransfected subpopulation (grey dots).Panel B demonstrates the use of the DDM to discriminate cell aggregates. A dot plot ofFL3-A vs FL3-W is used to measure the DNA content of the population according to thePI staining. R2 is drawn around the single cells in this population. Cells outside thisregion are doublets or higher aggregates. R1 and R2 are now used to define the trans-fected and nontransfected populations as described in Fig. 2. The cell cycle distributionwas determined by a histogram plot of FL2 measuring the DNA content according to PIfluorescence. Panel C shows the cell cycle distribution of the total population. Theposition of the G1, S, and G2/M peaks and the corresponding 2N–4N DNA content aremarked. Cells with DNA content of less than 2N appear in the sub-G1 region to the leftof the G1 peak. Cells falling in this region represent dead cells.

254 Berger and Haupt
Fig. 2. Flow cytometric analysis of p53-mediated apoptosis. An analysis of the Saos-2 cells transfected with wild-type hp53 as described in the legend to Fig. 1. Althoughnot shown here, the cells analyzed here fell within R2 as described in Fig. 1. (A) p53fluorescent intensity of the total population. (B) The cell cycle distribution of the totalpopulation in panel A. The sub-G1 region is marked by bar. (C) Cells with high p53fluorescence (R1) represent the transfected population (shown in black dots). (D) Thecell cycle distribution of p53-transfected cells. The proportion of cells falling in thesub-G1 region is a percentage. (E) Cells with low fluorescent intensity representthe nontransfected population (shown in light grey). (F) Cell cycle distribution of thenontransfected population, with a percentage of cells with sub-G1 DNA content. Theextent of p53-mediated apoptosis in Saos-2 cells in this sample is calculated bysubstracting the percentage of apoptosis in the nontransfected population from the trans-fected population (G).

p53-Induced Apoptosis 255
cent positive cells, with longer incubation time and with increasing concentra-tion of p53 expression plasmid. An important control for this apoptotic assay isan inactive p53 mutant, for instance hp53Gln179 (6).
3. Some cell types are very sensitive to the transfection procedure. It is thus recom-mended to change the transfection reagents or to use retroviral infection instead.In the case of adherent cells, the medium can be changed 24 h posttransfection inorder to remove cells that died primarily due to the transfection procedure. Keepin mind that this change may also remove cells that were killed by p53 activity.Therefore, the extent of this loss can be estimated by comparing the percentageof cell death among the transfected vs the nontransfected cells. In the case ofmassive cell death due to the transfection procedure, e.g., by GFP alone, it wouldimply that this particular cell line is not suitable for this apoptotic assay.
4. In the protocol described here, methanol was used for fixation. The choice offixative is influenced by the combinations of antibodies and antigens and is aimedto optimize accessibility of the antigen to the antibody. The assay described hereis based on the exclusion of fragmented DNA from the apoptotic cells. Fixatives,such as formaldehyde, do not permeabilize the cells and, moreover, cause mas-sive cross-linking within the cell. The combined effect is that the fragmentedDNA remains within the apoptotic cells, hence the total amount of DNA in thecells does not decrease even if the DNA is fragmented. Therefore, it is stronglyrecommended to fix the cells with cold methanol. In our experience, all the anti-p53 antibodies tested work very well after this fixation.
5. During the procedure, caution should be taken at several steps. First, before fixa-tion, cells must be brought into a single cell suspension with no visible clumps.This should be followed immediately by the fixation step, where cells are keptapart by constant vortex mixing. Excessive clumping is often problematic duringacquisition. Second, following fixation, cells become more buoyant, hence,higher centrifugation speed is required in order to sediment the cells.
6. Although PI is in excess, the overall scale of the fluorescent intensity depends onthe total amount of DNA in the sample. It is, therefore, important to adjust the volof PBS in the final step before acquisition (Subheading 3.1.1., step 14) to achieveapproximately equal numbers of cells between the different samples.
7. It is important to keep in mind that not all the events that fall into the sub-G1 regionrepresent intact cells. In fact, many of these events represent fragments of cells(apoptotic bodies). Therefore, the sub-G1 fraction represents a relative apoptoticactivity rather than an absolute percentage of apoptotic cells in a population.
Acknowledgments
We are grateful to Sue Haupt for critical comments. Work in the authors’laboratory is supported by the Research Career Development Award from theIsrael Cancer Research Fund, by the Israel Science Foundation, by the IsraelCancer Association, and, in part, by the research grant No. 1-FY01-177 fromthe March of Dimes Birth Defects Foundation.

256 Berger and Haupt
References1. Vogt Sionov, R., Hayon, L. I., and Haupt, Y. (2001) The regulation of p53 growth
suppression, in Cell Cycle Checkpoints and Cancer (Blagosklonny, M. V., ed.),Landes Bioscience, Austin, TX pp. 106–125.
2. Haupt, Y. and Oren, M. (1996) p53-mediated apoptosis: mechanisms and regula-tion. Behring Inst. Mitt. 97, 32–59.
3. Jarvik, J. W. and Telmer, C. A. (1998) Epitope tagging. Annu. Rev. Genet. 32,601–618.
4. Stommel, J. M., Marchenko, N. D., Jimenez, G. S., et al. (1999) A leucine-richnuclear export signal in the p53 tetramerization domain: regulation of subcellularlocalization and p53 activity by NES masking. EMBO J. 18, 1660–1672.
5. Jiang, W. and Hunter, T. (1998) Analysis of cell-cycle profiles in transfected cellsusing a membrane-targeted GFP. BioTechniques 24, 348–354.
6. Haupt, Y., Rowan, S., Shaulian, E., Vousden, K. H., and Oren, M. (1995) Induc-tion of apoptosis in HeLa cells by tranactivation-deficient p53. Genes Dev. 9,2170–2183.
7. Berger, M., Vogt Sionov, R., Levine, A. J., and Haupt, Y. (2001) A role for thepolyproline domain of p53 in its regulation by Mdm2. J. Biol. Chem. 276,3785–3790.
8. Haupt, Y., Barak, Y., and Oren, M. (1996) Cell-type specific inhibition of p53-mediated apoptosis by mdm2. EMBO J. 15, 1596–1606.

MDM2-Mediated Growth Arrest 257
257
From: Methods in Molecular Biology, vol. 234: p53 ProtocolsEdited by: S. Deb and S. P. Deb © Humana Press Inc., Totowa, NJ
18
Flow Cytometric Analysisof MDM2-Mediated Growth Arrest
Rebecca Frum and Swati Palit Deb
SummaryAlthough MDM2, the product of mouse double minute-2 (mdm2) gene, or its human homo-
logue possesses the potential to confer tumorigenic properties, it induces G1/S arrest innontransformed cells. Flow cytometry provides a way to determine the effects of MDM2 on thecell cycle by expressing the protein ectopically, immunostaining cells expressing MDM2 andanalyzing their DNA content. The DNA histograms of MDM2-transfected and untransfectedcells can then be used to visualize the effect of ectopically expressed MDM2 on the cell cycle.Fluorescence-activated cell sorter (FACS) analysis following bromodeoxyuridine (BrdU)incorporation can be used to determine whether MDM2-expressing cells are synthesizing DNA.Incorporation of BrdU during DNA synthesis or repair can be detected in partially denaturedDNA with a BrdU-specific fluorescent antibody. Subsequent staining of transfected MDM2with a different fluorochrome provides information about whether transfected cells make sig-nificant progression through S phase. Further analysis of the growth-regulatory properties ofMDM2 will elucidate both its normal function and the ways in which its deregulation leads totumorigenesis.
Key WordsMDM2, flow cytometry, cell cycle, bromodeoxyuridine, FACS
1. IntroductionThe protein (hMDM2) coded by the human homologue of mouse double
minute-2 (mdm2) gene frequently overexpresses in malignant human breastand other tumors (1–7). Artificial amplification of mouse mdm2 gene derivedfrom a transformed murine cell line enhances tumorigenic potential of murinecells (8,9). These evidences suggest oncogenic properties of human or mouseMDM2. The tumorigenic property of MDM2 is not unexpected, as MDM2

258 Frum and Deb
interacts with several cell cycle regulatory proteins, the inactivation of whichmay contribute to its tumorigenic ability (10–18). Human or mouse MDM2can inactivate several functions of the tumor suppressor p53 (19–21).
In view of all the oncogenic functions of MDM2, one would expect thatoverexpression of MDM2 would confer growth advantage in cultured cells. Incontrast, MDM2 can only be stably expressed in cells harboring genetic defects.Overexpression of full-length MDM2 from its cDNA does not facilitate cellgrowth. Instead, it arrests the G1 to S phase transition of normal human ormurine cells. Elimination of the growth inhibitory domains of the oncoproteinenhances the tumorigenic potential of NIH3T3 cells (22). Some cancer-derivedcell lines are partially insensitive to MDM2-mediated growth arrest (22). Nor-mal cells can induce MDM2 in response to oncogenic challenges, such as UVirradiation or estrogen treatment (23–29). It is possible that normal cells inducefull-length MDM2 in response to oncogenic challenges to protect against pre-mature cell cycle progression. If the cells are insensitive to MDM2-mediatedgrowth arrest or if the oncoprotein is defective in growth arrest, prematureprogression of the cell cycle may lead to tumorigenesis. Since MDM2 seems tobe a key member of cell growth regulation and possibly functions downstreamof the p53 tumor suppressor, elucidation of its mechanism of action becomesessential.
The growth-inhibitory property of MDM2 poses restriction in exploringthe growth-regulatory properties of MDM2 in normal cells, as the protein canonly be expressed transiently. Also, it becomes essential to determine conse-quences of short-term MDM2 expression in nontransformed cells. SinceMDM2 overexpresses in cancer cells and can be stably overexpressed intumor-derived cells for several generations, nonspecific MDM2-mediatedtoxicity seems to be unlikely. To determine the growth regulatory function ofMDM2 in normal cells, MDM2 needs to be expressed at a level detectable byWestern analysis and immunofluorescence. Using different promoters andmanipulating the amounts of expression plasmids levels of expression can bemodulated if desired. However, while greater inhibition can be achievedthrough higher expression of MDM2 in tumor-derived cells, the growth-regu-latory functions of MDM2 in normal cells do not seem to alter by increasingthe levels of expression (22).
The basic protocol for flow cytometric analysis of MDM2-mediated growthregulation is similar to the flow cytometric analysis of p53-mediated growthregulation described in Chapter 17 of this text (Berger and Haupt). In this chap-ter, we will address some specific problems that we encountered in the case ofMDM2. The basic strategy in this analysis is to express MDM2 in cells at adetectable level, separate or gate MDM2-expressing cells, and analyze theDNA content of the cells after staining.

MDM2-Mediated Growth Arrest 259
To ensure that we are analyzing MDM2-expressing cells, we prefer to stainMDM2 directly for detection. Co-expression or tagging with other proteins,such as green fluorescent protein (GFP), perhaps can be used if the epitope-tagged protein is not functionally compromised. In the case of co-transfection,the cells that express GFP should express MDM2. If a significant portion of theGFP-expressing cells does not express MDM2, the inhibitory effect of MDM2will be masked in the mixed population. Expression of MDM2 in GFP-expressing cells should be tested by isolating GFP-expressing and untransfectedcells in a cell sorter and analyzing comparative MDM2 expression in thesesorted cells by Western analysis. In our hands, co-transfected cell populationswere a mixture of singly and doubly transfected cells with a higher populationof singly transfected cells. We, therefore, recommend direct staining using anantibody against MDM2.
In this chapter, we will be assaying for presence of replicating cells bybromodeoxyuridine (BrdU) incorporation and suggesting methods for identifi-cation of MDM2-mediated G1 arrest by staining DNA to determine cell cyclecompartments.
2. Materials
1. Phosphate-buffered saline (PBS) without calcium or magnesium. Use and storeat 4°C (see Note 1).
2. Dulbecco’s phosphate-buffered saline (DPBS) without calcium or magnesium.Use at room temperature. Store at 4°C (see Note 1).
3. Trypsin 10X. Store at 4°C.4. DPBS plus 10% heat-inactivated fetal bovine serum (FBS). Use at room tem-
perature. Store at 4°C.5. Absolute ethanol (ETOH). Use and store at –20°C.6. PBS plus 0.5% bovine serum albumin (BSA). Use at room temperature. Store
at 4°C.7. For analysis involving BrdU incorporation, the following three items will be
needed:a. 1 mM BrdU: dissolve in sterile PBS. Aliquot in the amount that will be needed
per experiment. Store at –80°C in the dark. Do not thaw and refreeze.b. 2 N HCl.c. 0.1 M Sodium borate, pH 8.5. pH can be adjusted with HCl. Store at room
temperature.8. PBS plus 0.5% BSA plus 0.5% Tween(r) 20. Use at room temperature. Store
at 4°C.9. Syringes (3 mL) and needles (21-gauge)
10. Antibodies: to determine BrdU labeling in MDM2-expressing cells, two antibod-ies will be needed: one to detect MDM2 expression and the other to detect BrdU.For labeling with two different antibodies, we prefer antibodies directly coupled

260 Frum and Deb
to fluorescent dyes instead of indirectly labeling with dye-labeled secondaryantibodies. Secondary antibodies could recognize both the primary antibodieswithout discrimination and yield high background. For this protocol, we used afluorescein isothiocyanate (FITC)-labeled anti-BrdU antibody and an MDM2antibody directly coupled to phycoerythrin (PE). Dye-coupled antibodies may beavailable commercially or can be prepared. Removal of uncoupled dye is veryimportant to reduce background staining. If only staining with one antibody, aprimary antibody and a FITC-labeled secondary antibody can be used.
11. 7-Aminoactinomycin D (7AAD) or propidium iodide (PI).a. 7AAD (1 mg/mL): 1 mg 7AAD. Add 50 μL absolute methanol. Mix well.
Add 950 μL PBS. Mix. Store at 4°C in the dark (can be used for 1 mo).b. PI staining solution: sodium citrate (0.1%), Nonidet® P-40 (NP40) (0.1%), PI
(50 μg/mL), DNase-free RNase A (100 μg/mL). The solution should be madefresh from stock solutions.
12. Sodium citrate (2%): filter and store at room temperature.13. NP40 (2%): filter and store at room temperature.14. PI (1 mg/mL): light sensitive. Store in dark at 4°C.15. RNase A (10 mg/mL, heat-treated to inactivate DNase activity): store at –20°C.16. Falcon(r) or Corning tubes (50 mL).
3. Methods (see Note 2)3.1. Transfect Cells Using Calcium Phosphate Method
Cells should be seeded 20–24 h before transfection. Primary cells or celllines can be used. Proper cell density is important to detect growth inhibitoryeffect of MDM2. Since the cells are seeded a day before transfection and areharvested 48 h after transfection, care should be taken so that the cells are notdense enough to show contact inhibition at the time of harvesting. The numberof cells seeded may vary depending on the cell types. We seed 3 × 10⁵ cells forNIH3T3 and 5 × 10⁵ cells in the case of WI38 or MRC5 cells in a 10-cm dish.
Delivery of MDM2 by transfection of expression plasmids is comparativelyinefficient to delivery by viral vectors such as adeno- or retroviral vectors.However, it is important to test whether the proteins coded by the viral vectorsor the interaction of the viral membrane proteins with cellular receptors altersthe growth regulatory properties of MDM2. For example, the adenoviral vec-tor harboring MDM2 expresses a truncated form of MDM2 at a much higherlevel than the full-length protein. Thus, at present, transfection of the expres-sion plasmids seems to be the method of choice, as this is less likely to gener-ate secondary effects.
Transfected plates can be labeled with BrdU and/or harvested for MDM2staining by trypsinization about 40 h after transfection, and the cells should befixed. Methanol or ethanol fixation incurs some cell loss during the stainingprocess, which can be circumvented by the use of BSA.

MDM2-Mediated Growth Arrest 261
3.2. BrdU Labeling of Cells
1. After cells have been transiently transfected, remove old media.2. Add 4 mL of normal media and allow to reach 37°C in cell culture incubator.3. Add BrdU to each plate to a final concentration of 10 μM.4. Incubate for 40 min, tilting approx every 15 min.
3.3. Harvest Cells
1. Wash plates 2× in 8 mL DPBS.2. Harvest cells by trypsinization and collect cells in DPBS plus 10% FBS.3. Place cells in a 50-mL sterile plastic tube (see Note 3).4. Take a small aliquot to count.
3.4. Fixation
1. Spin in 50-mL tubes at 400g for 11 min at 4°C. Aspirate.2. For less than 107 cells, add 1.5 mL PBS. For more than 107 cells, add 3.0 mL PBS.3. Suspend cells in PBS by vortex mixing.4. Pass through a 21-gauge needle 5× (or until cells are suspended) to break up
clumps.5. While vortex mixing vigorously, add absolute ETOH that has been stored at –20°C
drop-wise (see Notes 4 and 5): for less than 107 cells, add 3.5 mL of absoluteETOH, and for more than 107 cells, add 7 mL of absolute ETOH.
6. Store at 4°C for at least 18 h (see Note 6).
3.5. Wash
1. Spin cells at 2615g for 6 min at room temperature (see Note 7). Aspirate.2. Resuspend pellet in 1 mL of PBS plus 0.5% BSA and transfer to microfuge tube
(see Note 8).3. Spin tube at 2615g for 6 min at room temperature. Aspirate.4. Wash 2× in 1 mL of PBS plus 0.5% BSA. The washes remove extra ETOH and
prevent clumping during the following steps. If necessary, break up clumps bypassing through a 21-gauge needle.
3.6. Acid–Base Treatment for the Detection of BrdU Incorporation
1. After aspirating the final wash, incubate in 400 μL of 2 N HCl for 20 min at roomtemperature. Vortex mix well to break up clumps or pass through a 21-gaugeneedle (see Note 9).
2. Add 800 μL of PBS plus 0.5% BSA. Vortex mix.3. Centrifuge at 2615g for 6 min at room temperature. Aspirate.4. Incubate in 400 μL of 0.1 M sodium borate, pH 8.5, for 2 min at room tempera-
ture. Do not treat more than 5 tubes with sodium borate at the same time, due tothe short incubation period.
5. Add 800 μL of PBS plus 0.5% BSA. Vortex mix.

262 Frum and Deb
6. Centrifuge at 2615gfor 6 min at room temperature. Aspirate.7. Wash 1× with 1 mL of PBS plus 0.5% BSA. Aspirate.
3.7. Staining for MDM2 and BrdU
1. Suspend the cells in PBS plus 0.5% BSA plus 0.5% Tween 20 and incubate withthe FITC-coupled anti-BrdU antibody. The concentration of antibody for opti-mum staining should be determined experimentally. Excess antibody oruncoupled dye increases background staining and quenches detection of otherstaining (see Notes 10–14).
2. Incubate for 1 h at room temperature in the dark with tilting.3. Spin at 2615g for 6 min at room temperature. Aspirate.4. Wash the cells 1× with 1 mL of PBS plus 0.5% BSA.5. Suspend the cells in PBS plus 0.5% BSA plus 0.5% Tween 20 and incubate with
the PE-coupled MDM2 antibody.6. Incubate for 2 h at room temperature in the dark with tilting.7. Spin at 2615g for 6 min at room temperature. Aspirate.8. Wash 1× with 1 mL of PBS plus 0.5% BSA. Aspirate. If necessary, the pellet can
be stored on ice at 4°C in dark overnight and stained with 7AAD the next day.
3.8. 7AAD Staining (see Notes 15 and 16)
1. Add 7AAD at a concentration of 0.02 mg/mL.2. Let cells incubate on ice for 90 min in the dark.3. Spin at 2615g for 6 min at 4°C. Aspirate.4. Dilute to 2 × 10⁶ cells/mL in PBS plus 0.5% BSA to avoid clogging during analy-
sis. It is best to analyze the same day, but if necessary, cells can be analyzed aftermore than 24 h.
3.9. Staining of MDM2 in Non-BrdU Labeled Cells
After transfection, follow the steps from Subheadings 3.3., 3.4., and 3.5.exactly. Then stain as follows.
1. Suspend cells in PBS plus 0.5% BSA plus 0.5% Tween 20. Vortex mix to suspend.2. Add titrated amount of MDM2 primary antibody. Vortex mix lightly.3. Incubate for 2 h at room temperature with tilting.4. Spin at 2615g for 6 min at room temperature. Aspirate.5. Wash 2× in 1 mL of PBS plus 0.5% BSA.6. Suspend cells in PBS plus 0.5% BSA plus 0.5% Tween 20.7. Add titrated amount of FITC-labeled secondary antibody against the primary
antibody.8. Cover the tubes in aluminum foil and incubate for 2 h at room temperature with
tilting.9. Spin at 2615g for 6 min at room temperature. Aspirate.
10. Wash 2× in 1 mL of PBS plus 0.5% BSA.11. PI staining: if necessary, pellet can be stored on ice at 4°C in the dark overnight

MDM2-Mediated Growth Arrest 263
and stained with PI the next day. Add 1 mL of PI staining solution for every 2 ×10⁶ cells. Vortex mix. Let cells incubate in dark for at least 30 min. Analyze thesame day (see Notes 15 and 16).
A representative result of an experiment to analyze cell growth regulatoryproperty of MDM2 using the described method is shown in Fig. 1 and Table 1.As evident from Fig. 1D, transfected NIH3T3 cells show 1.6 to 60-foldincreased expression of MDM2, whereas most of the cells showed 10-foldoverexpression. However, BrdU incorporation was inhibited at low or highlevels (Fig. 1D, less number of BrdU-labeled cells in the upper right quadrant.)Comparison of the DNA histograms of PE-labeled (transfected, dotted line)and unlabeled (untransfected, bold line) cells suggests that the cellsoverexpressing MDM2 induced G1 arrest, reducing the number of cycling cells.
4. Notes1. The time frame of this protocol consists of 6 d from start to finish: 1 d to plate
cells, 2 d for transient transfection, 1 d to harvest and fix, 1 d to stain, and usuallyan additional 1 d for DNA staining and analysis.
2. Calcium and magnesium cause cells to clump; therefore, it is important to usebuffers without calcium or magnesium for flow cytometry.
3. After harvesting, place cells in a 50-mL conical tube rather than a smaller one foreasier fixation and to prevent clumping.
4. During fixation, the cells should be vortex mixed, and the ETOH should be addeddrop-wise to prevent the cells from being fixed together and causing subsequentclumping.
5. Precipitation by fixation with alcohols, such as ETOH and methanol, dehydratesthe cells and permeabilizes the membrane. ETOH or methanol fixation is pre-
Table 1Comparison of Incorporating BrdU in MDM2 Expression PlasmidTransfected and Untransfected Populations
Quadrant Percent of Percent of cellsgated incorporating Brduevents
MDM2+ MDM2-
Upper left (MDM2+, BrdU–) 14.46 — —Upper right (MDM2+, Brdu+ 0.87 5.6 —Lower left (MDM2–,BrdU–) 61.79 — —Lower right (MDM2–, BrdU+) 22.88 — 27
The table compares percentage of cells incorporating BrdU in MDM2 expressionplasmid transfected and untransfected population as shown in Fig. 1D. Transfectedcells are labeled as MDM2+, and untransfected cells are labeled as MDM2–.

264 Frum and Deb
264
Fig
. 1.
Dot
plo
t an
alys
is o
f B
rdU
-lab
eled
(or
unl
abel
ed)
NIH
3T3
cell
s tr
ansf
ecte
d w
ith
MD
M2
expr
essi
on p
lasm
id.
Moc
ktr
ansf
ecte
d or
MD
M2
expr
essi
on p
lasm
id tr
ansf
ecte
d ce
lls
wer
e fi
xed
and
stai
ned
wit
h P
E-l
abel
ed M
DM
2 an
tibo
dy, F
ITC
-lab
eled
anti
-Brd
U a
ntib
ody,
and
7A
AD
. (A
) F
orw
ard
scat
ter
(FS
) vs
sid
e sc
atte
r (S
S)
plot
, gat
ed e
vent
s (R
1) a
re s
how
n. ( B
) A
rea
vs w
idth
plot
use
d fo
r do
uble
t dis
crim
inat
ion.
Gat
ed e
vent
s (R
2) a
re s
how
n. (
C)
FIT
C v
s P
E p
lot o
f m
ock
tran
sfec
ted,
Brd
U u
nlab
eled
cel
lsst
aine
d w
ith
PE
-lab
eled
MD
M2
anti
body
, FIT
C-l
abel
ed a
nti-
Brd
U a
ntib
ody,
and
7A
AD
. The
plo
t has
bee
n us
ed to
det
erm
ine
the
back
grou
nd s
tain
ing.
(D
) F
ITC
vs
PE
plo
t of
MD
M2
expr
essi
on p
lasm
id tr
ansf
ecte
d, B
rdU
-lab
eled
cel
ls s
tain
ed w
ith
PE
-lab
eled
MD
M2
anti
body
, FIT
C-l
abel
ed a
nti-
Brd
U a
ntib
ody,
and
7A
AD
. (E
) DN
A h
isto
gram
of t
rans
fect
ed (d
otte
d li
ne) a
nd u
ntra
nsfe
cted
(bol
d) c
ells
sor
ted
from
MD
M2
expr
essi
on p
lasm
id t
rans
fect
ed c
ell
popu
lati
on.
Sin
gle
colo
r st
aini
ng w
ith
PE
-lab
eled
MD
M2
anti
body
, FIT
C-l
abel
ed a
nti-
Brd
U a
ntib
ody,
and
7A
AD
are
not
sho
wn.

MDM2-Mediated Growth Arrest 265
ferred over paraformaldehyde, which fixes through cross-linking. Cross-linkingof the DNA results in low a quality DNA histogram with either PI or 7AAD.
6. After fixation, cells should be stored in ETOH for >18 h for better resolution.7. Higher centrifugation speeds are required after fixation, because the fixation step
causes the cells to become more bouyant.8. BSA blocks nonspecific binding of the antibodies and also prevents loss of cells.9. Treatment with HCl causes single-stranded nicks in the DNA and is necessary
because the anti-BrdU antibody can only recognize BrdU in single-strandedDNA. Following the treatment of HCl with a treatment of sodium borate neutral-izes the acid so that the DNA is only partially denatured.
10. Although ETOH fixation permeabilizes the cell membrane to allow the antibod-ies and dyes for staining DNA to have access within the cell, the addition ofTween 20 may help with this process during the incubation steps.
11. The amounts of antibodies used were determined through standardization. ExcessPE- and FITC-coupled antibodies or uncoupled stains can cause quenching,which can be reduced by lowering the amounts of both antibodies.
12. The PI and 7AAD dyes and the PE and FITC antibodies are light-sensitive, soafter their addition, the cells should be kept in the dark.
13. During staining with the antibodies, if the vol is small, it is better to manuallymix the tube every 15 min by lightly vortex mixing instead of putting the tube ona tilter. Alternatively, the vol can be increased while keeping the same concentra-tion, so that it is conducive to use with a tilter.
14. When staining with two antibodies in the same sample, it is necessary to havecontrols stained with only one of each antibody for setting up the flow cytometer.
15. ETOH-fixed cells that are treated with HCl do not stain well with PI. Conversely,7AAD staining is more efficient for cells treated with HCl.
16. Cells stained with PE should only be stained with 7AAD because PE and PIoverlap.
AcknowledgmentsThis work was supported by grants from National Institutes of Health (NIH)
to Swati Palit Deb (CA74172) and Sumitra Deb (CA70712). We thank CharlesA. Thomas at the University of Texas Health Science Center San Antonio forflow cytometric analysis and Julie Dudro for help with detectingbromodeoxyuridine incorporation in cells.
References1. Deb, S. P. (2002) Function and dysfunction of the human oncoprotein MDM2.
Front. Bioscience 7, d235–d243.2. Juven-Gershon, T. and Oren, M. (1999) Mdm2: the ups and downs. Mol. Med. 5,
71–83.3. Lozano, G. and de Oca Luna, R. M. (1998) MDM2 function. Biochim. Biophys.
Acta 1377, M55–M59.

266 Frum and Deb
4. Prives, C. (1998) Signaling to p53: breaking the MDM2-p53 circuit. Cell 95, 5–8.5. Piette, J., Neel, H., and Marechal, V. (1997) Mdm2: keeping p53 under control.
Oncogene 15, 1001–1010.6. Momand, J. and Zambetti, G. P. (1997) Mdm-2: “big brother” of p53. J. Cell.
Biochem. 64, 343–352.7. Meltzer, P. S. (1994) MDM2 and p53: a question of balance. J. Natl. Cancer Inst.
86, 1265–1266.8. Fakharzadeh, S. S., Trusko, S. P., and George D. L. (1991) Tumorigenic potential
associated with enhanced expression of a gene that is amplified in a mouse tumorcell line. EMBO J. 10, 1565–1569.
9. Finlay, C. A. (1993) The mdm-2 oncogene can overcome wild-type p53 suppres-sion of transformed cell growth. Mol. Cell. Biol. 13, 301–306.
10. Xiao, Z. X., Chen, J., Levine, A. J., et al. (1995) Interaction between the retino-blastoma protein and the oncoprotein MDM2. Nature 375, 694–698.
11. Pomerantz, J., Schreiber-Agus, N., Liegeois, N. J., et al. (1998) The Ink4a tumorsuppressor gene product, p19Arf, interacts with MDM2 and neutralizes MDM2’sinhibition of p53. Cell 92, 713–723.
12. Kamijo, T., Weber, J. D., Zambetti, G., Zindy, F., Roussel, M. F., and Sherr, C. J.(1998) Functional and physical interactions of the ARF tumor suppressor withp53 and Mdm2. Proc. Natl. Acad. Sci USA 95, 8292–8297.
13. Oliner, J. D., Kinzler, K. W., Meltzer, P. S., George, D. L., and Vogelstein, B.(1992) Amplification of a gene encoding a p53-associated protein in human sar-comas. Nature 358, 80–83.
14. Momand, J., Zambetti, G. P., Olson, D. C., George, D., and Levine, A. J. (1992)The mdm-2 oncogene product forms a complex with the p53 protein and inhibitsp53-mediated transactivation. Cell 69, 1237–1245.
15. Brown, D. R., Deb, S., Munoz, R. M., Subler, M. A., and Deb, S. P. (1993) Thetumor suppressor p53 and the oncoprotein simian virus 40 T antigen bind to over-lapping domains on the MDM2 protein. Mol. Cell. Biol. 13, 6849–6857.
16. Chen, J., Marechal, V., and Levine, A. J. (1993) Mapping of the p53 and mdm-2interaction domains. Mol. Cell. Biol. 13, 4107–4114.
17. Leng, P., Brown, D. R., Shivakumar, C. V., Deb, S., and Deb, S. P. (1995)N-terminal 130 amino acids of MDM2 are sufficient to inhibit p53-mediated tran-scriptional activation. Oncogene 10, 1275–1282.
18. Oliner, J. D., Pietenpol, J. A., Thiagalingam, S., Gyuris, J., Kinzler, K. W., andVogelstein, B. (1993) Oncoprotein MDM2 conceals the activation domain oftumour suppressor p53. Nature 362, 857–860.
19. Chen, J., Wu, X., Lin J., and Levine, A. J. (1996) mdm-2 inhibits the G1 arrestand apoptosis functions of the p53 tumor suppressor protein. Mol. Cell. Biol. 16,2445–2452.
20. Chen, C. Y., Oliner, J. D., Zhan, Q., Fornace, A. J., Jr., Vogelstein, B., and Kastan,M. B. (1994) Interactions between p53 and MDM2 in a mammalian cell cyclecheckpoint pathway. Proc. Natl. Acad. Sci. USA 91, 2684–2688.
21. Haupt, Y., Barak Y., and Oren, M. (1996) Cell type-specific inhibition ofp53-mediated apoptosis by mdm2. EMBO J. 15, 1596–1606.

MDM2-Mediated Growth Arrest 267
22. Brown, D. R., Thomas, C. A., and Deb, S. P. (1998) The human oncoproteinMDM2 arrests the cell cycle: elimination of its cell-cycle-inhibitory functioninduces tumorigenesis. EMBO J. 17, 2513–2525.
23. Baunoch, D., Watkins, L., Tewari, A., et al. (1996) MDM2 overexpression inbenign and malignant lesions of the human breast. Int. J. Oncol. 8, 895–899.
24. Gudas, J., Nguyen, H., Klein, R., Katayose, D., Seth, P., and Cowan, K. (1995)Differential expression of multiple MDM2 messenger RNAs and proteins in nor-mal and tumorigenic breast epithelial cells. Clin. Cancer Res. 1, 71–80.
25. Sheikh, M. S., Shao, Z. M., Hussain, A., and Fontana, J. A. (1993) The p53-bind-ing protein MDM2 gene is differentially expressed in human breast carcinoma.Cancer Res. 53, 3226–3228.
26. Bae, I., Smith, M. L., and Fornace, A. J., Jr. (1995) Induction of p53-, MDM2-,and WAF1/CIP1-like molecules in insect cells by DNA-damaging agents. Exp.Cell Res. 217, 541–545.
27. Perry, M. E., Piette, J., Zawadzki, J. A., Harvey, D., and Levine, A. J. (1993) Themdm-2 gene is induced in response to UV light in a p53-dependent manner. Proc.Natl. Acad. Sci. USA 90, 11,623–11,627.
28. Price, B. D. and Park S. J. (1994) DNA damage increases the levels of MDM2messenger RNA in wtp53 human cells. Cancer Res. 54, 896–899.
29. Ries, S., Biederer, C., Woods, D., et al. (2000) Opposing Effects of Ras on p53:Transcriptioanl Activation of mdm2 and Induction of p19ARF. Cell 103, 321–330.
30. Ferbeyre, G., de Stanchina, E., Lin, A. W., et al. (2002) Oncogenic ras and p53Cooperate to Induce Cellular Senescence. Mol. Cell. Biol. 22, 3497–3508.

Index 269
269
Index
A
Adenovirus E1B, see E1B-55 kDaoncoprotein
Adenovirus-expressed p53,bacterial transformation and
recombination,plasmid purification, 7plasmid verification and
preparation for transfection,7, 8
transfer plasmid preparation, 4,5, 14
transformation,BJ5183 cells, 5, 6, 14XL-1 Blue cells, 7
cesium chloride gradients, 10dialysis, 11, 15gene deletions, 1harvesting of cells, 9, 14infection,
H1299 cells, 75HEK293 cells, 9
materials, 2, 3overview, 1, 2packaging capacity, 1, 2plaque isolation, 8, 9precipitation of virus with
polyethylene glycol, 10quantification of virus,
agar overlay, 12neutral red agar overlay, 12, 13serial dilutions, 11, 12, 15spectrophotometry, 13titering, 11, 13, 15
research applications, 1solutions, 3, 4
transfection into HEK293 cells, 8washing of cell pellet, 9, 10Western blot analysis, 13
Apoptosis,assay, see Flow cytometryDNA content changes, 246mitochondrial activation
mechanisms, 203, 204morphological features, 246p53 role, 17, 18, 51, 52, 58, 59,
111, 112, 245Asparagine synthetase, p53
transcriptional regulation,see Quantitative polymerasechain reaction
B
Baculovirus-Sf9 cell system,expression of p53,
electrophoretic mobility shiftassay,
complementary strandannealing, 24, 25
DNA-binding reaction, 26gel electrophoresis, 26principles, 24radiolabeling of double-stranded
oligonucleotide, 25–27infection for virus production,
19, 20infection of Sf9 cells, 21materials,
buffers, 19, 26commercial products, 18, 26
optimization of post-virusinfection time, 21, 26, 27

270 Index
plaque assay, 20purification,
anion-exchangechromatography, 23
cell harvesting and lysis, 22, 27concentrating of p53, 23gel filtration chromatography,
23, 24nuclear lysate preparation,
22, 27titer calculation, 20
BES transfection, see Transfection,p53
BrDU, see BromodeoxyuridineBromodeoxyuridine (BrDU),
acid-base treatment for detection,261, 262, 265
cell labeling, 261staining, 262, 265
C
Calcium phosphate transfection, seeTransfection, p53
Cationic lipofection, seeTransfection, p53
ChIP, see Chromatinimmunoprecipitation
Chromatin immunoprecipitation(ChIP),
cross-linked lysate preparation,117, 118
immunoprecipitation, 117, 118materials, 115, 116, 118p53 transcriptional repression
targets and mechanisms,112, 113
polymerase chain reaction, 118principles, 113
Co-immunoprecipitation assay,antibodies, 126, 129
cell lysate preparation, 126, 127E1B-55 kDa oncoprotein-p53
interactions,antibodies, 144controls, 139gel electrophoresis, 141incubation and washing
conditions, 140in vitro transcription and
translation, 139lysate preparation, 139materials, 137nonradioactive systems, 144plasmids, 144
immunoprecipitation reaction,127–129
materials, 124principles, 123Western blot analysis, 129CRM1leptomycin B inhibition, 212nuclear export of proteins, 212
D
Degradation, p53,assay of cytoplasmic and nuclear
degradation,cell preparation, 213, 214extraction, 213–215materials, 213Western blot verification of
fractionation, 214, 215cyclohexamide utility in studies,
212, 213cytoplasmic degradation, 212E1B-55 kDa oncoprotein
interactions anddestabilization, see E1B-55kDa oncoprotein
half-life, 232

Index 271
MDM2 role, see MDM2Differential display, see Fluorescent
differential displayDNA-binding site affinity
chromatography, p53,affinity column preparation,
coupling of Sepharose andDNA, 165
ligation, 164phosphorylation of DNA, 163,
164Sepharose matrix preparation,
164, 165analysis of fractions, 166cell growth, 159concentrating of fractions, 166, 167equilibration of column, 165, 167extract preparation, 160gel filtration of cellular extract,
163, 167loading and elution of column,
165–167materials,
binding site oligonucleotides,157, 158
cell lines, 154, 155reagents, 155, 158solutions, 155, 156, 158, 167
overview, 153, 154, 162, 163p53 expression, 159regeneration of column, 166
DNA footprinting,cell growth, 159controls, 156extract preparation, 160genomic DNA extraction from
DNase I-treated nuclei, 160,161, 166, 167
ligation-mediated polymerasechain reaction, 161, 162, 167
materials,cell lines, 154, 155linkers, 156primers, 156reagents, 155, 157solutions, 155–157
overview, 156p53 expression, 159
DNA microarray, see GeneChipDNA sequencing, p53 mutations,
amplification productelectrophoresis andpurification, 221, 224, 228
dideoxy sequencing,cycle-sequencing protocol,
222, 225, 226gel electrophoresis, 222, 226overview, 224, 228, 229Sequenase protocol, 221, 224,
225DNA extraction from tumor
specimens,frozen specimens, 220,
223, 227paraffin-embedded specimens,
220, 223, 224materials, 220–222overview, 219, 220polymerase chain reaction,
219–221, 224, 227, 228
E
E1B-55 kDa oncoprotein,co-immunoprecipitation assay of
p53 interactions,antibodies, 144controls, 139gel electrophoresis, 141in vitro transcription and
translation, 139

272 Index
incubation and washingconditions, 140
lysate preparation, 139materials, 137nonradioactive systems, 144plasmids, 144
consequences of p53 interactions,135, 136
immunofluorescence localizationof p53 complex,
antibody staining, 142, 146fixation, 146materials, 138microscopy, 142plasmids, 141, 142subcellular location, 146transfection, 142
p53 homolog non-interactions,136, 144, 145, 147
transcriptional repression of p53using reporter assay,
expression levels, 145luciferase assay, 141lysate preparation, 141materials, 137, 138mycoplasm contamination,
145, 146plasmids, 141, 145transfection, 141
Western blot of p53destabilization,
antibodies, 143, 146gel electrophoresis and
blotting, 143materials, 138, 139plasmids and transfection, 143proteasome inhibitors, 147staining, 143
Electrophoretic mobility shift assay(EMSA), p53,
caging, 152complementary strand annealing,
24, 25DNA-binding reaction, 26gel electrophoresis, 26principles, 24radiolabeling of double-stranded
oligonucleotide, 25–27stoichiometry of p53
phosphorylationimmunoassay, 191, 193, 200
E3 ligase, MDM2 activity, 211, 212,232
ELISA, see Enzyme-linkedimmunosorbent assay
Embryonic stem cell, see Transgenicmice, p53 mutants
EMSA, see Electrophoretic mobilityshift assay
Enzyme-linked immunosorbentassay (ELISA), p53 BOX-1phospho-specific antibodies,
alanine-scanning mutagenesisstudies of phosphopeptides,187
aspartate replacement forphosphoserine effects, 184,187
biotinylated synthetic peptides,178
enzyme-linked immunosorbentassay, 178, 179, 200
fine mapping of epitopes, 183,184, 187
phospho-Ser15 monoclonalantibodies, 183
phospho-Ser20 monoclonalantibodies, 183
phospho-Thr18 monoclonalantibodies, 180

Index 273
polyclonal sera characterization,179
steric hindrance by adjacentphosphate, 184
F
FDD, see Fluorescent differentialdisplay
Flow cytometry,MDM2 assay of cell growth
regulation,7AAD staining, 262, 265bromodeoxyuridine,
acid-base treatment fordetection, 261, 262, 265
labeling, 261staining, 262, 265
calcium phosphatetransfection, 260, 263
cell harvesting, 261, 263data analysis, 263fixation, 261, 263, 265immunostaining of MDM2,
bromodeoxyuridine-labeledcells, 262, 265
non-bromodeoxyuridine-labeled cells, 262, 263
materials, 259, 260, 263overview, 258, 259washing, 261, 265
p53-mediated apoptosis assay,data acquisition, 250, 251, 255data analysis, 251, 253endogenous p53 assay, 250materials, 247principles, 246transient transfection GFP-p53
assay, 249, 250transient transfection
nontagged p53 assay, 248,
249, 253, 255Fluorescence-activated cell sorting,
see Flow cytometryFluorescent differential display
(FDD),advantages, 52applications, 59, 60cDNA band purification and
reamplification, 57, 58Northern blot,
confirmation of different geneexpression, 58
materials, 55polymerase chain reaction and gel
electrophoresis,amplification, 57electrophoresis, 57materials, 54, 55, 61, 62
principles, 52–54rationale for p53 target gene
identification, 51, 52reverse transcription, 54–56, 61RNA isolation,
acid-phenol extraction of cellcultures, 55
DNase I treatment, 56materials, 54
sequencing and cloning ofamplification products, 58
5-Fluorouracil, aging assessmentof p53 mutant transgenicmice, 42
Footprinting, see DNA footprinting
G
GeneChip,double-stranded cDNA synthesis
from RNA,clean-up, 68, 69first strand, 68

274 Index
second strand, 68fragmentation of cRNA, 70in vitro transcription labeling,
purification, 69, 70quantitative analysis, 69, 70reaction, 69
materials, 66p53 applications, 65, 76principles, 65, 66RNA isolation, 67, 70, 75
Glutathione S-transferase (GST)pull-down assay,
formats, 125, 126fusion protein purification, 125, 128gel electrophoresis, 126identification of p53-binding
proteins, 126, 128incubation and washing, 126, 128materials, 123, 124principles, 123
GST pull-down assay, seeGlutathione S-transferasepull-down assay
H
HDM2, see MDM2
I
Immunobinding assay, see McKayassay
Immunocytochemistry,mutated p53 in tumor specimens,
advantages, 231, 232antibodies, 235controls, 237, 240cytological specimen
immunostaining,immunofluorescence, 239,
241immunoperoxidase staining,
239–241
materials, 236, 237, 240frozen section immunostaining,
fixation, 238immunoperoxidase staining,
239materials, 234, 236, 240sectioning, 238, 240snap-freezing, 238
overview, 231–233paraffin section
immunostaining,alkaline phosphatase
labeling, 237, 238immunoperoxidase staining,
237, 240, 241materials, 233, 234, 240
p53 phosphoproteins,differential phosphorylation in
clinical material, 196, 197incubation and detection, 195,
198overview, 95X-irradiation induction of
Ser386 phosphorylation, 196Immunofluorescence,
localization of E1B-55 kDaoncoprotein-p53 complex,
antibody staining, 142, 146fixation, 146materials, 138microscopy, 142plasmids, 141, 142subcellular location, 146transfection, 142
p53 in tumor specimens, 239, 241
L
Leptomycin B (LMB), CRM1inhibition, 212
Lipofection, see Transfection, p53LMB, see Leptomycin B

Index 275
M
McKay assay,binding reaction and washing,
116, 118cell lysate preparation, 116DNA end-labeling, 116elution of bound DNA, 116, 117gel electrophoresis, 117limitations, 113materials, 113, 115p53 transcriptional repression
targets and mechanisms,112, 113
principles, 113MDM2,
cell growth effects, 258E3 ligase activity, 211, 212, 232flow cytometry assay of cell
growth regulation,7AAD staining, 262, 265bromodeoxyuridine,
acid-base treatment fordetection, 261, 262, 265
labeling, 261staining, 262, 265
calcium phosphatetransfection, 260, 263
cell harvesting, 261, 263data analysis, 263fixation, 261, 263, 265immunostaining of MDM2,
bromodeoxyuridine-labeledcells, 262, 265
non-bromodeoxyuridine-labeled cells, 262, 263
materials, 259, 260, 263overview, 258, 259washing, 261, 265
human protein HDM2, 211, 232knockout mouse phenotype, 123,
212
overexpression in tumors, 257p53,
regulation of transcription, 59,153, 211, 212, 232
stability regulation, 123, 211,232
Messenger RNA differentialdisplay, see Fluorescentdifferential display
Mitochondrial localization, p53,apoptosis activation mechanisms,
203, 204characteristics, 204death stimuli, 204, 207subcellular fractionation for
detection,antibody combinations, 207–209materials, 204, 205mitochondrial isolation,
adherent cells, 206suspended cells, 205–207
Western blot analysis, 206,207, 209
N
Northern blot, fluorescentdifferential display,
confirmation of different geneexpression, 58
materials, 55
O
Oncoprotein, see E1B-55 kDaoncoprotein
P
p21WAF/CIP, transcriptionalregulation by p53, 59
p53,apoptosis induction, see
Apoptosis

276 Index
degradation, see Degradation, p53DNA binding,
assays, see DNA-binding siteaffinity chromatography,p53; DNA footprinting;Electrophoretic mobilityshift assay
interaction site, 93modulation, 151, 152transient nature, 152
domains, 59functional overview, 17, 18, 51,
52, 58, 59, 111, 112mutant mice, see transgenic mice,
p53 mutantsmutational analysis, see DNA
sequencing, p53 mutations;Immunocytochemistry;Single-strandedconformation polymorphism
overexpression in tumors, 232phosphorylation, see
Phosphorylation, p53protein-protein interactions,
assays, see Co-immunoprecipitation assay;Glutathione S-transferasepull-down assay
E1B, see E1B-55 kDaoncoprotein
MDM2, see MDM2table of interacting proteins, 122transactivation roles, 121, 122
recombinant proteins, seeAdenovirus-expressed p53;Baculovirus-Sf9 cell system,expression of p53
subcellular localization, seeImmunofluorescence;Mitochondrial localization,
p53target gene analysis, see
Fluorescent differentialdisplay; GeneChip;Quantitative polymerasechain reaction; Transfection,p53
transcriptional repression, seeChromatinimmunoprecipitation;McKay assay,
p63,p53 homology, 94splice variants, 94p73,p53 homology, 94splice variants, 94
PCR, see Polymerase chain reactionPhage display, p53 phosphopeptide
epitopes,display protocol, 188, 190FPS315, 190FPS392, 190, 191
Phosphorylation, p53,functions, 172immunoassays,
advantages, 173enzyme-linked immunosorbent
assay of p53 BOX-1phospho-specific antibodies,alanine-scanning
mutagenesis studies ofphosphopeptides, 187
aspartate replacement forphosphoserine effects,184, 187
biotinylated syntheticpeptides, 178
enzyme-linkedimmunosorbent assay,

Index 277
178, 179, 200fine mapping of epitopes,
183, 184, 187phospho-Ser15 monoclonal
antibodies, 183phospho-Ser20 monoclonal
antibodies, 183phospho-Thr18 monoclonal
antibodies, 180polyclonal sera
characterization, 179steric hindrance by adjacent
phosphate, 184epitopes, 173, 174generation of antibodies, 174,
177, 178, 200immunohistochemistry,
differential phosphorylationin clinical material, 196,197
incubation and detection,195, 198
overview, 95X-irradiation induction of
Ser386 phosphorylation, 196materials, 175–177, 200monoclonal versus polyclonal
antibodies, 173, 179, 180phage display of epitopes,
display protocol, 188, 190FPS315, 190FPS392, 190, 191
site-specific kinase detectionand purification, 197–200
specificity of antibodies, 174,199
stoichiometry of modificationusing electrophoreticmobility shift assay, 191,193, 200
surface plasmon resonancecharacterization of p53BOX-1 phospho-specificmonoclonal antibodies,187, 188
Western blot analysis of breastcancer proteins,electrophoresis and blotting,
193, 200Ser15 phosphorylation, 193,
194Ser20 phosphorylation, 194Ser315 phosphorylation, 194,
195Ser392 phosphorylation, 195Thr18 phosphorylation, 193,
194phosphopeptide mapping,
172, 173sites, 171, 172
Polymerase chain reaction (PCR),chromatin immunoprecipitation,
118differential display, see
Fluorescent differentialdisplay
DNA footprinting of p53-bindingsites, 161, 162, 167
DNA sequencing of p53mutations, 219–221, 224,227, 228
genotyping of p53 mutanttransgenic mice, 44, 45
real-time analysis of p53-modulated transcripts, seeQuantitative polymerasechain reaction
single-stranded conformationpolymorphism, 220, 221,224, 226–228

278 Index
Q
QPCR, see Quantitative polymerasechain reaction
Quantitative polymerase chainreaction (QPCR),
advantages in p53-regulated genestudies, 73, 74, 90
asparagine synthetase,non-normalized gene
expression, 89, 90normalization of expression,
Brome mosaic virus, 86, 87GAPDH, 86, 88, 89
response to p53 wild-type andmutant proteins, 74
cDNA synthesis,quality control template, 77, 90storage, 77, 78ThermoScript system, 77verification, 77
materials, 74, 75primers,
design, 78, 79, 86, 89optimization, 80, 82, 83standard curve construction by
serial dilution, 83synthesis, 79, 80
RNA preparation,adenoviral infection, 75DNase treatment, 76extraction, 75, 76microarray analysis, 76RiboGreen quantification, 76, 77
SYBR Green I polymerase chainreaction,
homemade mixture, 85product verification by melting
curve analysis and agarosegel electrophoresis, 86
reaction conditions, 85
R
RiboGreen, RNA quantification, 76,77
S
Signaling, see Phosphorylation, p53Single-stranded conformation
polymorphism (SSCP),DNA extraction from tumor
specimens,frozen specimens, 220, 223, 227paraffin-embedded specimens,
220, 223, 224gel electrophoresis, 227, 229materials, 220–222overview, 220polymerase chain reaction, 220,
221, 224, 226–228primers, 229
Southern blot, genotyping of p53mutant transgenic mice,45, 46
SPR, see Surface plasmon resonanceSSCP, see Single-stranded
conformation polymorphismSurface plasmon resonance (SPR),
characterization of p53BOX-1 phospho-specificmonoclonal antibodies,187, 188
SYBR Green I, see Quantitativepolymerase chain reaction
T
Transfection, p53,BES transfection,
cell harvesting, 100cell plating, 100example, 107incubation conditions, 100

Index 279
materials, 95media replacement, 100
calcium phosphate transfection,bubbling step, 99, 103cell harvesting, 99cell plating, 98
-galactosidase reporter assay,95, 99
incubation conditions, 99materials, 95MDM2, 260, 263media replacement, 98test transfections, 98, 103,
107cationic lipofection,
cell growth and harvesting, 98,100–103
cell plating, 96, 100DNA dilution, 96incubation conditions, 96materials, 94media replacement, 96microtiter plate volume
conversion table, 97transfection gradient, 101, 103
lysate preparation, 94, 98target gene promoter response
studies, 94Transgenic mice, p53 mutants,
characterization,aging, 41, 52lethality, 39reproductive capacity, 39tumor development, 39–41
chimeric mouse generation, 38Cre-LoxP system, 30embryonic stem cells,
electroporation, 35, 37, 43maintenance and propagation,
35, 43
microinjection and blastocysttransfer to mouse, 37, 38, 43
pluripotency, 33positive cell selection, 37screening of resistant clones,
37, 43Flp recombinase system, 30genotyping,
coat color manipulation, 38genomic DNA preparation,
embryonic stem cells, 43, 44mouse tails, 44polymerase chain reaction,
44, 45Southern blot, 45, 46
materials, 32overview of production, 33, 36research applications, 29selection markers, 32targeting vectors, 33, 42tetracycline transcriptional
activation system, 31types of mutants, 30
W
Western blot,adenovirus-expressed p53, 13breast cancer phosphorylated p53
proteins,electrophoresis and blotting,
193, 200Ser15 phosphorylation, 193, 194Ser20 phosphorylation, 194Ser315 phosphorylation, 194, 195Ser392 phosphorylation, 195Thr18 phosphorylation, 193, 194
co-immunoprecipitation assay, 129E1B-55 kDa oncoprotein
destabilization of p53,antibodies, 143, 146

280 Index
gel electrophoresis andblotting, 143
materials, 138, 139plasmids and transfection, 143proteasome inhibitors, 147staining, 143
mitochondrial p53 analysis, 206,207, 209
p53 cytoplasmic and nucleardegradation assay,214, 215
site-specific p53 kinase detection,197–200
Wound healing, aging assessmentof p53 mutant transgenicmice, 42