P51 A CLIMATOLOGICAL HISTORY OF TORNADOES IN NORTHWEST …€¦ · Weather Bureau from 1916 to...
15
P51 A CLIMATOLOGICAL HISTORY OF TORNADOES IN NORTHWEST OREGON AND SOUTHWEST WASHINGTON David Elson NOAA/NWSFO, Portland, OR 1. INTRODUCTION Compared to much of the rest of the continental United States, tornadoes are a relative rarity in the Pacific Northwest. In Southwest Washington and Northwest Oregon there is, however, an extensive enough record of tornadoes to warrant a better historical compilation of the storms than currently exists. The record adds to a better understanding of the conditions under which they occur. The focus of this study is to look at tornadoes that occurred in the National Weather Service (NWS) Portland Forecast Office’s area of responsibility (AOR). While the vast majority of these tornadoes are weak and pose a minimal threat to the local inhabitants, there are a few that have caused substantial property damage and taken several lives. An examination of the conditions under which these tornadoes formed reveals several common environmental characteristics that may help in anticipating future tornadoes. 2. A HISTORY OF TORNADOES IN NORTHWEST OREGON AND SOUTHWEST WASHINGTON The attached table (Table 1 and 2) is a compilation of 99 known tornadoes in the Corresponding author address: David B. Elson, National Weather Service, 5241 NE 122 nd Ave., Portland OR 97230; email [email protected] Portland OAR between October 1876 and December 2015. Storm Data (U.S. Dept. of Commerce, 1959-1973), (NOAA, 1974-2015), augmented by the Storm Events Database (NOAA, 1950-2015) accounted for 72 tornadoes in the NWS Portland’s AOR. This makes Storm Data the most complete, publically available compilation of tornadoes in the Pacific Northwest. All but one of the tornadoes in Storm Data has been rated by the National Weather Service using the Fujita Scale (Fujita 1971), or the Enhanced Fujita Scale (Marshall 2004). These are the only ones in the compilation assigned an intensity. Storm Data and the Storm Events Database were found to contain inconsistent information on some storms. In compiling this collection, all available sources were considered in determining the date, location and time of touchdown. Other resources consulted for this study included local National Weather Service documents stored in the Portland office (2016, unpublished data), a previously online compilation by the former Oregon Climate Service (2007), and a compilation by retired National Weather Service employee George Miller (2010, unpublished data). Publications consulted and found to contain relevant information include Monthly Weather Review (U.S. War Dept. 1885), (U.S. Dept. of Agriculture 1926-1927), Climate and Crops (U.S. Dept. of Agriculture 1897-1904), Climatological Data (U.S. Dept. of Agriculture 1918-1940), (U.S. Dept. of Commerce, 1950-1953), Report of the
Transcript of P51 A CLIMATOLOGICAL HISTORY OF TORNADOES IN NORTHWEST …€¦ · Weather Bureau from 1916 to...

P51 A CLIMATOLOGICAL HISTORY OF TORNADOES IN NORTHWEST OREGON AND
SOUTHWEST WASHINGTON
David Elson
NOAA/NWSFO, Portland, OR
1. INTRODUCTION
Compared to much of the rest of the
continental United States, tornadoes are a
relative rarity in the Pacific Northwest. In
Southwest Washington and Northwest Oregon
there is, however, an extensive enough record
of tornadoes to warrant a better historical
compilation of the storms than currently exists.
The record adds to a better understanding of
the conditions under which they occur. The
focus of this study is to look at tornadoes that
occurred in the National Weather Service (NWS)
Portland Forecast Office’s area of responsibility
(AOR).
While the vast majority of these tornadoes are
weak and pose a minimal threat to the local
inhabitants, there are a few that have caused
substantial property damage and taken several
lives. An examination of the conditions under
which these tornadoes formed reveals several
common environmental characteristics that
may help in anticipating future tornadoes.
2. A HISTORY OF TORNADOES IN
NORTHWEST OREGON AND SOUTHWEST
WASHINGTON
The attached table (Table 1 and 2) is a
compilation of 99 known tornadoes in the
Corresponding author address: David B. Elson,
National Weather Service, 5241 NE 122nd Ave.,
Portland OR 97230; email [email protected]
Portland OAR between October 1876 and
December 2015. Storm Data (U.S. Dept. of
Commerce, 1959-1973), (NOAA, 1974-2015),
augmented by the Storm Events Database
(NOAA, 1950-2015) accounted for 72 tornadoes
in the NWS Portland’s AOR. This makes Storm
Data the most complete, publically available
compilation of tornadoes in the Pacific
Northwest. All but one of the tornadoes in
Storm Data has been rated by the National
Weather Service using the Fujita Scale (Fujita
1971), or the Enhanced Fujita Scale (Marshall
2004). These are the only ones in the
compilation assigned an intensity. Storm Data
and the Storm Events Database were found to
contain inconsistent information on some
storms. In compiling this collection, all available
sources were considered in determining the
date, location and time of touchdown.
Other resources consulted for this study
included local National Weather Service
documents stored in the Portland office (2016,
unpublished data), a previously online
compilation by the former Oregon Climate
Service (2007), and a compilation by retired
National Weather Service employee George
Miller (2010, unpublished data). Publications
consulted and found to contain relevant
information include Monthly Weather Review
(U.S. War Dept. 1885), (U.S. Dept. of Agriculture
1926-1927), Climate and Crops (U.S. Dept. of
Agriculture 1897-1904), Climatological Data
(U.S. Dept. of Agriculture 1918-1940), (U.S.
Dept. of Commerce, 1950-1953), Report of the

Table 1. NWS Portland AOR Tornadoes 1876-2015, part 1. CCOS=Climate and Crops Oregon Section.
CD=Climate Data. MWR=Monthly Weather Review. RCWB=Report of the Chief of the Weather Bureau.
SED=Storm Events Database. N1=Canby Herald. N2=Daily Astorian. N3=Daily Morning Astorian.
N4=Eugene City Guard. N5=Eugene Register Guard. N6=McMinnville Telephone Register. N7=Oregon
City Enterprise. N8=Oregon Journal. N9=Oregonian. N10=Statesman Journal. N11=Yaquina Bay News.

Table 2. NWS Portland AOR Tornadoes 1876-2015, part 2. CCOS=Climate and Crops Oregon Section.
CD=Climate Data. MWR=Monthly Weather Review. RCWB=Report of the Chief of the Weather Bureau.
SED=Storm Events Database. N1=Canby Herald. N2=Daily Astorian. N3=Daily Morning Astorian.
N4=Eugene City Guard. N5=Eugene Register Guard. N6=McMinnville Telephone Register. N7=Oregon
City Enterprise. N8=Oregon Journal. N9=Oregonian. N10=Statesman Journal. N11=Yaquina Bay News.
Chief of the Weather Bureau (U.S. Dept. of
Agriculture 1925-1926), as well as various
newspaper accounts. Only tornadoes with
documentation found in either formal
publications or contemporary accounts were
included.

In one instance the Storm Data published date
of a tornado required correction. Storm Data
originally reported this tornado as having
occurred on 20 August 1978 in Scappoose WA.
Articles appearing in the Oregonian on 18
August and 19 August indicated the correct
date of the tornado is 16 August. The
incorrectly attributed date calls into question
another tornado reported on the 20th, in Amity
Oregon. No news articles or other original
documentation were found for this storm
however, so its’ recorded date remains 20
August.
The best estimate of latitude and longitude, to
the nearest minute, for each touchdown is
included. While generally the Storm Data
location (NOAA 2016) was used when possible,
there were a number of tornadoes whose
latitude and/or longitude required correction.
The corrections were based upon descriptions
provided in either Storm Data or other
supporting documents. As an example, the
Clackamas County Oregon tornado of April 12,
1957 was reported to have touched down near
45.38N, 122.27W. The original description of
the storm (Fig. 1) reads “In the farm areas just a
short distance east of Sandy a small tornado
approximately 35 to 40 yards in diameter
struck…” Instead of showing the tornado east of
Sandy, the map provided online by the Storm
Events Database (Fig. 2) using the published
latitude and longitude, incorrectly plots the
touchdown location just south of Sandy. In all,
30 corrections to the Storm Data
latitude/longitude defined locations are
offered.
Fig 1. Oregon State Climatologist report of the
Sandy Oregon tornado of 12 April 1957. NWS
Portland unpublished records.
Fig 2. Storm Events Database map showing
incorrectly located tornado touchdown location
for the Sandy Oregon tornado of 12 April 1957.
Evidence for another five tornadoes between
1951 and 1973 was uncovered. Supporting
documentation for these tornadoes included
newspaper accounts in the Oregonian and the
Statesman Journal, as well as the Climatological
Data publications for Oregon and Washington.
George Miller (2010, unpublished data) brought
attention to a tornado near Butteville Oregon
on 22 March 1967 (Canby Herald). The article
speculates on a connection between the
tornado and an automobile fatality that
occurred approximately 10 minutes prior along
the interstate highway about 5.5 km to the
south of the known damage path. While it is a
possibility that the tornado played some role in
the young woman’s death, a lack of any
eyewitness reports or other direct evidence
that the tornado touched down any closer to
the accident scene makes it impossible to say

with any certainty that the fatality was directly
caused by a tornado.
Prior to 1950, United States Weather Bureau
annual publications Report of the Chief of the
Weather Bureau from 1916 to 1934, and United
States Meteorological Yearbook from 1935 to
1942 included the Weather Bureau’s annual
compilation of tornado reports nationwide (U.S.
Dept. of Commerce, 1942). The lists for the area
of interest in southwest Washington and
northwest Oregon during this time period
however, were quite short with just four
tornadoes reported. All four of these reports
were made in 1925 to 1926.
Monthly Weather Review also regularly
published reports of tornadoes nationwide prior
to 1950. Research uncovered two additional
tornadoes recorded in this publication, one
occurring in Astoria Oregon in 1885 (U.S. War
Dept., 1885), the other in Long Beach
Washington in 1949 (U.S. Dept. of Commerce,
1949). The government publication Climate and
Crops contained information on one additional
tornado on 14 June 1897, in Bay City Oregon
(U.S. Dept. of Agriculture, 1897-1904).
The remaining 12 tornadoes listed are
documented solely with newspaper accounts.
In recent years, online newspaper search
engines have greatly streamlined the process of
searching newspaper archives for information.
Those consulted in this study included
webpages hosted by the University of Oregon
Libraries (2015), the University of Washington
Libraries (2016), the Washington State Library
(2016), Google (2016), the Multnomah County
Library (2016), and the Library of Congress
(2016).
Documentation for 23 tornadoes was
uncovered prior to 1950. Contemporary
newspaper accounts verified 19 of these
storms. Government and professional
publications listed above were used to verify
the other four tornadoes. The earliest report of
a tornado in the NWS Portland’s AOR was on 18
October 1876, in Barlow Oregon (Oregonian).
Early reports of tornadoes over Southwest
Washington were much scarcer. The earliest
reliable report of a tornado in Southwest
Washington didn’t occur until 4 May 1926 (U.S.
Dept. of Agriculture, 1925-1926b).
While outside the primary area of interest of
this study, reports of a couple of other
forgotten but notable tornadoes in present-day
Washington were brought to light. The earliest
report of a tornado in the Washington Territory
came from a news article (Vancouver Register),
regarding a July 8th 1867 tornado that struck
Cowlitz Landing in Lewis County. The town in
the article is referred to as Cowlitz, but no such
present-day town exists in the area. It is
assumed that the name refers to a settlement
near the historic Cowlitz Landing, about a mile
downstream of Toledo on the Cowlitz River,
near 46°28' North latitude, and 122°52' West
longitude (Laseke, 1988), (American Road
Magazine, 2008).
The earliest report of a tornado fatality in the
state of Washington came around midnight on
22 February 1904. The initial report of the
tornado and two victims who are known to
have ultimately died, were made in the Morning
Oregonian of 24 February 1904 (Oregonian).
The victims, David and Mary Kerr (Port
Townsend Leader), were guests at a local hotel.
A third individual was said to be “badly injured
and it is doubtful whether he will live.”
Unfortunately, no follow-up information

confirmed whether his injuries were ultimately
fatal or not. The tornado struck what was
referred to as “the Agency” on the Quinault
Reservation, which a year later was named the
town of Taholah. With the damage reports
concentrated on 1st Avenue, the location of the
tornado touchdown can be determined to be
near 47°22' North latitude, and 124°17' West
longitude.
Only one of the tornadoes in the NWS Portland
AOR is known to have caused any fatalities, an
F3 that struck Vancouver Washington on 5
April, 1972 (U.S. Dept. of Commerce, 1959-
1973). Six people were killed during the event,
making it the deadliest tornado in Pacific
Northwest history. The Vancouver tornado of
1972 is also the strongest tornado on record for
the NWS Portland AOR, and the only known F3.
A significant majority of the tornadoes that
were rated on the Fujita (Fujita, T.T., 1971) or
Enhanced Fujita (Marshall 2004) scale were
weak, classified as F0 or EF0. Forty-nine of the
71 (69%) classified tornadoes were rated as F0
or EF0. Nineteen (27%) were rated as F1 or EF1,
two (3%) as F2 or EF2, and one (1%) as F3 or
EF3.
3. CLIMATOLOGY OF THE TORNADO
DATABASE
3.1 Geographic Distribution
The geographic distribution of tornadoes in
Northwest Oregon and Southwest Washington
(Fig. 3) favors two regions. The first is the main
north-south oriented inland valley
encompassing the Willamette Valley and the
Lower Columbia between Portland Oregon and
Kelso Washington. The second area is the coast.
When compared with the population centers
per the 2010 U.S. census (Fig. 4), it is seen that
the tornadoes show a strong tendency to be
reported in and around urban centers. Using
2000 census data, 48 percent of the tornadoes
occurred in an urban area (U.S. Census Bureau,
2016), and 77 percent occurred within three
miles of an urban area.
Fig. 3. Plot of all known tornado touchdown
locations in the NWS Portland AOR of
Southwest Washington and Northwest Oregon
between 1876 and 2015.

Fig. 4. Census places designations using the
2010 census. Courtesy USDA Economic Research
Service.
While population density likely plays a role on
where tornadoes are reported in Northwest
Oregon and Southwest Washington, the terrain
itself likely plays a major role. The north to
south orientation of the primary mountain
ranges and valleys can enhance low level
helicity. This is especially common at times
when the free air wind has a westerly
component, and the surface winds are backed
by terrain to a more favored southerly
direction. A wind rose (Fig. 5) for Salem Oregon,
located in the Central Willamette Valley,
illustrates just how constricted the prevailing
winds can be in the Willamette Valley.
Fig. 5. Wind rose for Salem Oregon airport
(KSLE) 1973 to 2004.
3.2 Temporal Distributions
The times of initial touchdown have been
reported whenever there was sufficient
information to make a reasonable estimate. At
first glance it would seem that the time of
occurrence would be a straightforward piece of
information. However, rarely in the historic
accounts when the time is reported, does the
account mention the time zone and whether or
not daylight saving time is in effect. The history
of standard time in time zones, and the use of
daylight saving time is complex. Not until 1966
was there any permanent measure of
standardization provided nationally, for when
daylight saving time would be implemented
(U.S. Naval Observatory, 2015). Additionally,
Storm Data in its original publication was
intended to be reported in local standard time.
The Storm Events Database defaults to Central
Standard Time (CST). There were several
occasions where inconsistencies in time were
noted between the two Storm Data listings, as

well as occasions where newspaper accounts
suggested that the time listed was more likely
given in daylight saving time, but not noted as
such. With deference generally given to the
more organic reports, all storms since 1949
were assigned a time in Pacific Standard Time
(PST) with the exception of one, where there
was insufficient information available. For
storms prior to 1949, the time of occurrence
when available was assumed to be in whatever
local time (LT) was in use at the time. For a
majority of these tornadoes, PST was likely in
effect, but could not be determined with any
measure of certainty.
A plot of all tornadoes by the local hour of the
day (Fig. 6) shows a distinctly diurnal
distribution. The most likely time of day is in the
afternoon, with the peak hour from 3 pm to 4
pm PST. Only one tornado, occurring on the
Oregon coast in December, was noted to occur
after dark.
Fig. 6. Total number of reported tornadoes in
Southwest Washington and Northwest Oregon
by the hours of the day between 1876 and 2015.
Tornadoes in Northwest Oregon and Southwest
Washington have occurred in all months of the
year. A bimodal distribution is apparent (Fig. 7),
with a distinct peak in activity occurring during
fall. A secondary peak occurs in the spring.
Fig. 7. Total number of reported tornadoes in
Southwest Washington and Northwest Oregon
by the month between 1876 and 2015.
A general increase in the total number of
tornado reports is evident when tornadoes are
totaled by decade (Fig. 8). Much of the increase
in reported tornado frequency can be
accounted for by the increase in population
(National Centers for Environmental
Information,2016). A graph showing the growth
of Oregon since 1870 (Fig. 9) , used as a proxy
for the region’s population growth, provides
some comparison on the rate of population
growth to compare with the increase in
tornadoes reported.
Fig. 8. Total number of reported tornadoes in
Southwest Washington and Northwest Oregon
by the decade from 1876 to 2015.
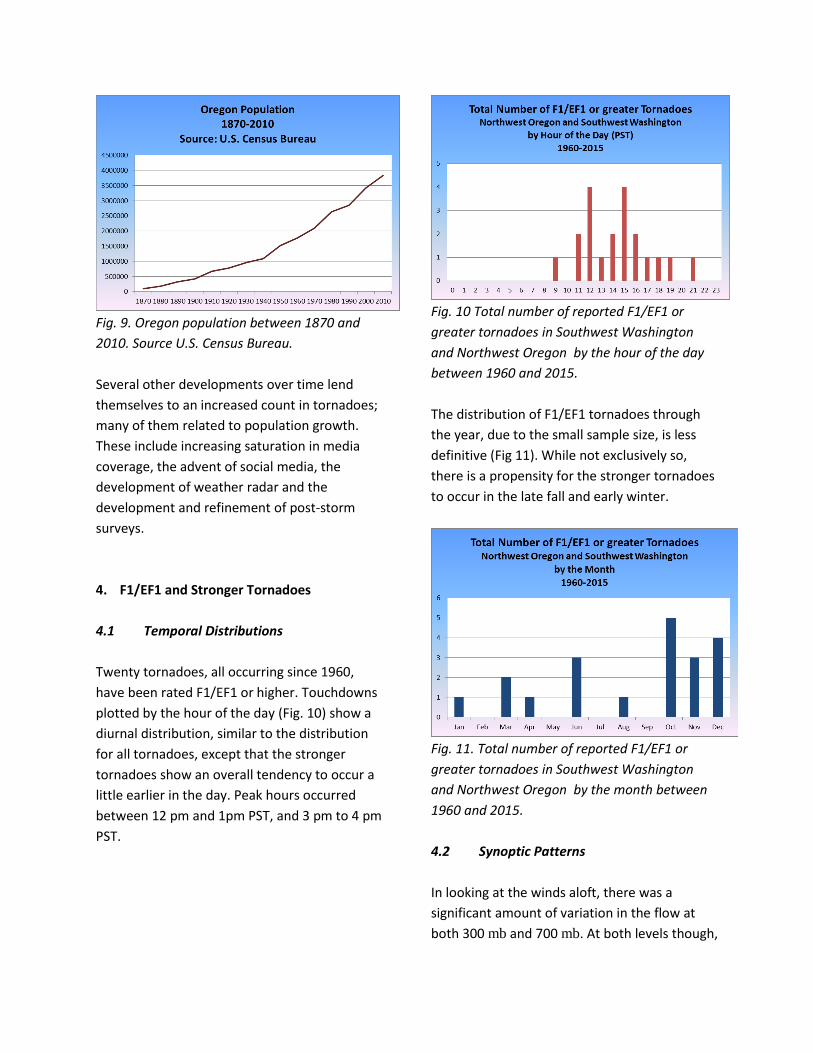
Fig. 9. Oregon population between 1870 and
2010. Source U.S. Census Bureau.
Several other developments over time lend
themselves to an increased count in tornadoes;
many of them related to population growth.
These include increasing saturation in media
coverage, the advent of social media, the
development of weather radar and the
development and refinement of post-storm
surveys.
4. F1/EF1 and Stronger Tornadoes
4.1 Temporal Distributions
Twenty tornadoes, all occurring since 1960,
have been rated F1/EF1 or higher. Touchdowns
plotted by the hour of the day (Fig. 10) show a
diurnal distribution, similar to the distribution
for all tornadoes, except that the stronger
tornadoes show an overall tendency to occur a
little earlier in the day. Peak hours occurred
between 12 pm and 1pm PST, and 3 pm to 4 pm
PST.
Fig. 10 Total number of reported F1/EF1 or
greater tornadoes in Southwest Washington
and Northwest Oregon by the hour of the day
between 1960 and 2015.
The distribution of F1/EF1 tornadoes through
the year, due to the small sample size, is less
definitive (Fig 11). While not exclusively so,
there is a propensity for the stronger tornadoes
to occur in the late fall and early winter.
Fig. 11. Total number of reported F1/EF1 or
greater tornadoes in Southwest Washington
and Northwest Oregon by the month between
1960 and 2015.
4.2 Synoptic Patterns
In looking at the winds aloft, there was a
significant amount of variation in the flow at
both 300 mb and 700 mb. At both levels though,
a composite mean for all F1/EF1 and stronger
tornadoes (Fig. 12 and Fig. 13) shows an open
trough just off the coast. The 300 mb composite
shows a jet core located at the base of the
trough with average wind speed in excess of 36
m s-1. In each of the F1/EF1 and stronger cases
the tornado occurred either under the core of a
300 mb jet, or to the left of a jet axis. The
average distance to the left of the jet axis was
275 km, with a maximum value of 900 km. In
eighteen of the twenty cases (90%) the tornado
occurred with 500 km of the jet axis.
Fig. 12. North American Reanalysis Data
Composite for 300 mb wind speed (color fill) and
direction (arrows) for the twenty F1/EF1 and
greater events.
Fig. 13. North American Reanalysis Data
Composite for 700 mb wind speed (color fill) and
direction (arrows) for the twenty F1/EF1 and
greater events.
The composite mean surface pressure pattern
for all the F1/EF1 and above cases (Fig. 14) was
not dissimilar from the upper air. A north-south
oriented trough extended down off the
Washington and Oregon coast. Such an
orientation maximizes the surface pressure
gradients both along the coast, as well as up the
lower Columbia and Willamette Valleys
between Kelso Washington and Eugene Oregon.
Of the 19 F1/EF1 tornado events where a wind
was recorded by the Salem (KSLE) sounding at
the surface, 16 occurred with a south wind that
ranged from 160 degrees to 230 degrees.
Backing of near-surface winds, forced by terrain
features to a southerly direction, increases low-
level shear.
Fig. 14. North American Reanalysis Data
Composite for Sea Level Pressure) for the twenty
F1/EF1 and greater events.
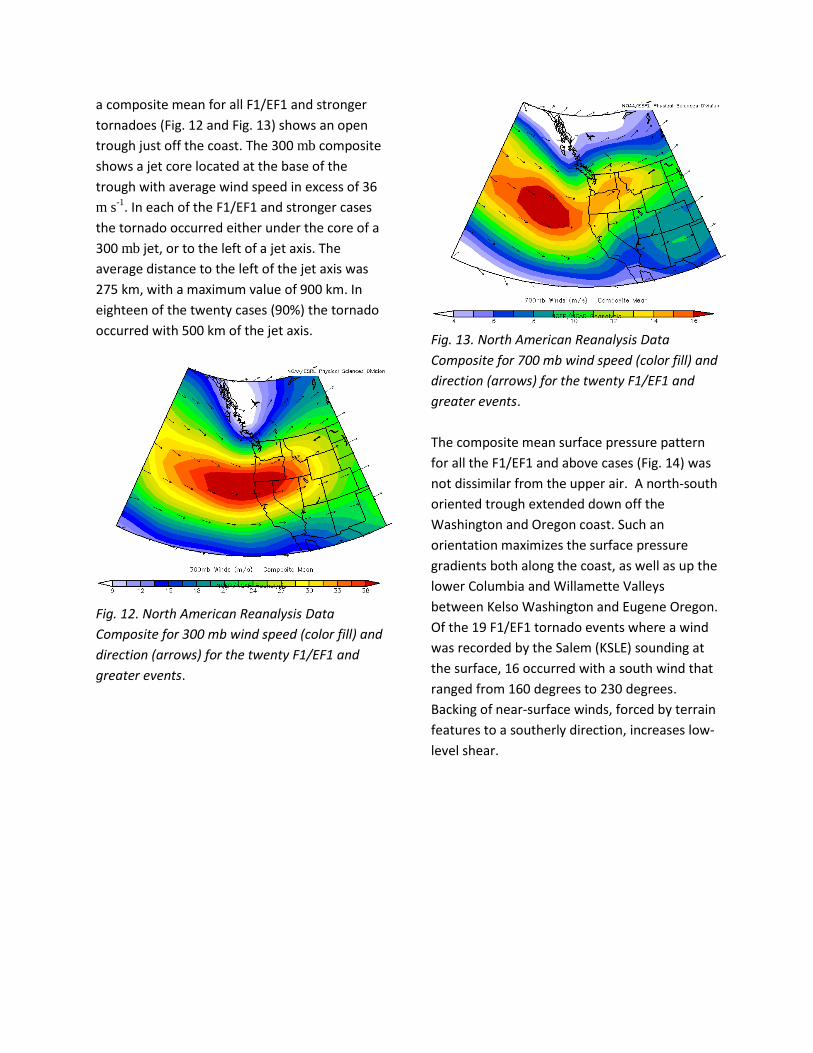
4.3 Salem Upper Air Soundings
Salem upper air soundings (KSLE), representing
the nearest observed upper air information
available, were examined for each of the F1/EF1
or greater events. The most representative
measurements were selected subjectively from
the two soundings closest in time to the event.
For some events, 00 UTC soundings were used,
for others, 12 UTC soundings. This can result at
times in un-even comparisons between events.
The mean KSLE thermal profile for F1/EF1 and
greater tornadoes below 500 mb (Fig. 15)
indicates on average, just a marginally unstable
air mass mainly below 700 mb. Surface
pressures for these soundings ranged from 992
mb to 1015 mb, with a mean value of 1003 mb.
It is notable that the three lowest surface
pressures were associated with the three
strongest tornadoes, two F2/EF2s and the one
F3. These ranged from 992 mb to 996 mb.
Fig. 15. Mean observed KSLE thermal sounding
to 500 mb for the F1/EF1 and greater events.
Mean surface temperatures for the soundings
ranged from 1.8O Celsius (C) to 15.6O C, for an
average of 10.4O C. Interestingly, when the 00
UTC soundings were separated from the 12 UTC
soundings, the mean temperatures varied by
just over 1O C, with the 12 UTC soundings
averaging 11.1O C, and the 00 UTC soundings
averaging 10.0 O C. Surface dew points averaged
8.6 O C, ranging from a minimum of -0.4 O C to a
maximum of 13.9 O C.
Buoyancy values in the soundings were
generally quite modest. Measured values of
Convective Available Potential Energy (CAPE) at
KSLE averaged 82 J kg-1 for all of the F1/EF1 and
greater tornadoes. When just the F2/EF2 and F3
tornadoes are considered, the mean value
increases to 107 J kg-1. Even the largest
measured value for the twenty events was just
216 J kg-1.
Equilibrium levels similarly suggest small storms
spawned most of these tornadoes. The mean
Equilibrium Level (EL) was 690 mb. For just the
F2/EF2 and F3’s the mean EL is even lower, at
736 mb. While the lower EL of the stronger
tornadoes may at first seem an oddity, when
coupled with the higher CAPE values it suggests
on average a more vigorous potential updraft
than the F1/EF1s, albeit through a shallower
layer.
Lazarus and Droegemeier (1990) found that
limited thermodynamics could be overcome in a
strongly sheared environment, as appears to be
the case in many of these F1/EF1 and above
tornadoes. The maximum measured 0-3 km
helicity values in the SLE soundings for all
F1/EF1 and stronger tornado occurrences
averaged 252 m2 s
-2. When just the F2/EF2 and
greater tornadoes were considered, the values
jump to 383 m2 s
-2. These numbers compare
favorably with values found for F2 and F3
tornadoes by Daviess and Johns [1993]. Mean
surface winds for the most representative KSLE
soundings for the F1/EF1 and greater cases was
8 kt, for F2/EF2 and greater cases was 11 kt.
Aloft at 850 mb, mean speeds were 31 kt and
43 kt respectively while at 700 mb mean speeds
were 38 kt and 59 kt respectively.
5. AUMSVILLE AND VANCOUVER TORNADOES
Whether it be a coincidence or somehow
related to terrain is unknown, but it is notable
that of the twenty F1/EF1 or greater tornadoes
that have been recorded, two of them have
each occurred in the cities of Aumsville Oregon
and Vancouver Washington. A side by side
comparison of the observed KSLE soundings for
the Aumsville tornadoes (Fig. 16) shows as close
to what might considered identical conditions
as is reasonably possible to expect from two
separate soundings; little apparent CAPE in a
shallow, marginally unstable air mass, with
southerly surface winds quickly increasing to a
strong west-southwest flow above 850 mb.
The KSLE soundings for the Vancouver
tornadoes (Fig. 17) show many similarities as
well. The F3 tornado of 5 April 1972 lacked the
more distinct directional low level shear of the
10 January 2008 case, as well as the Aumsville
tornadoes. Strong low level speed shear though
accounted for the helicity value of 428.
Research into Pacific Northwest tornadoes has
been scarce. Hales (Hales, J.E., 1994), in
researching the 5 April 1972 Vancouver
tornado, concluded that high helicity was a
prerequisite for West Coast tornadoes as a
result of marginal thermodynamic potential due
to the lack of an adjacent warm water body.
Hales also found that topographical influences
played a critical role in the development of the
tornado, due to backing boundary layer winds
influenced by the Columbia River Gorge just to
the east of Vancouver. Similarly, Elson et al
(2008) found the local topography, in the case
of the 10 January 2008 Vancouver tornado,
helped to both enhance the shear profile and to
intensify existing storm circulation through
channeled low level flow.
6. SUMMARY
Government records including Storm Data, have
been augmented with newspaper accounts, to
compile a list of 99 tornadoes in northwest
Oregon and southwest Washington during the
140 year period from 1876 to 2015. While the
majority of these tornadoes were weak, rated
as a F0 or EF0, 20 tornadoes since 1960 were
classified as F1/EF1 or stronger. Stronger
tornadoes, rated F2/EF2 to F3 were quite rare,
accounting for just three tornadoes. The only F3
tornado, in Vancouver WA in 1972, has been
the only tornado to produce fatalities in the 140
years of records for the NWS Portland AOR.

Tornadoes in the region exhibit a strong
tendency to occur during daylight hours.
Tornadoes have occurred in all months
throughout the year, but a distinct peak in
activity occurs during the fall, with October
recording the most tornado touchdowns.
Topography likely plays a significant role in
where tornadoes tend to occur. Geographically,
the Willamette Valley and the Lower Columbia
Valley between Portland OR and Kelso WA
appear to be the most prone to tornadoes, with
a secondary preference for tornadoes along the
coast.
An analysis of F1/EF1 and stronger tornadoes
revealed a strong tendency for the tornadoes to
occur under a strong upper level trough, in an
area along or within 500 km west of a 300 mb
jet axis. KSLE upper air soundings almost
exclusively indicated a strongly sheared vertical
wind profile, with weak buoyancy over a
relatively shallow layer.
7. ACKNOWLEDGEMENTS
Many of my coworkers at NWS Portland
contributed in ways they might not have
known, but were still quite helpful and greatly
appreciated. In particular I’d like to thank
Treena Jensen for her help and enthusiasm, and
Colby Neuman and my wife Kirsten Elson for
their support and editorial review.
8. REFERENCES
American Road Magazine, 2008: Cowlitz
Landing Discovered/Pacific Highway Linked.
Accessed 27 October 2016. [Available online at
http://americanroadmagazine.com/forum/inde
x.php?showtopic=976].
Canby Herald: March Twister Damages; Did it
Kill, too? Date unknown 1967.
Daily Astorian: Tornado at Gervais. 5 February
1881, p. 3.
Daily Morning Astorian: Various articles. 16
September 1885, p3. 17 July 1894, p. 1.
Davies, J. M., and R. H. Johns, 1993: Some wind
and instability parameters associated with
strong and violent tornadoes. Part I: Wind shear
and helicity. The tornado: Its Structure,
Dynamics, Prediction, and Hazards, Geophys.
Monogr., No. 79, Amer. Geophys. Union, 573-
582.
Eugene City Guard: Cyclone in Lane County. 22
January 1887, p. 4.
Eugene Register Guard: Various articles. 12
November 1925, pp1-2. 26 July 1937, pp. 1-2.
Fujita, T.T., 1971: Proposed characterization of tornadoes and hurricanes by area and intensity. Satellite and Mesometeorology Research Project Report 91, the University of Chicago, 42 pp.
Google, 2016: All Newspapers. Accessed 28
October 2016. [Available online at
https://news.google.com/newspapers].
Hales, J.E., 1994: The Vancouver WA tornado on
April 5, 1972 as a benchmark for West Coast
significant tornado episodes. Preprints, Sixth
Conf. on Mesoscale Processes, Portland,
Oregon, Amer. Meteor. Soc., 134-137.

Laseke, G., 1988: The Early History of Toledo
Washington. City of Toledo Washington.
Accessed 27 October 2016. [Available online at
http://www.toledowa.us/history.html].
Lazarus, S.M. and K.K. Droegemeier, 1990: The
influence of helicity on the stability and
morphology of numerically simulated storms.
Preprint, 16th Conf. on Severe Local Storms,
Kananaskis Park, Alberta, Amer. Meteor. Soc.,
269-274.
Library of Congress, 2016: Chronicling America
Historic American Newspapers. Accessed 28
October 2016. [Available online at
http://chroniclingamerica.loc.gov/].
Marshall, T. P., 2004: The enhanced Fujita (EF)
scale. Preprints, 22d Conf. on Severe Local
Storms, Hyannis, MA, Amer. Meteor. Soc., CD-
ROM, 3B.2.
McMinnville Telephone Register: 5 March 1926.
Multnomah County Library, 2016: The Historical
Oregonian (1861-1987). Accessed 28 October
2016. [Available online at
https://multcolib.org/resource/historical-
oregonian-1861-1987].
National Centers for Environmental
Information, 2016: U.S. Tornado Climatology,
Historical Records and Trends. Accessed 31
October 2016. [Available online at
https://www.ncdc.noaa.gov/climate-
information/extreme-events/us-tornado-
climatology/trends].
NOAA, 1950-2015: Storm Events Database. Accessed 27 October 2016. [Available online at https://www.ncdc.noaa.gov/stormevents/].
NOAA, 1974 -2015: Storm Data and Unusual Weather Phenomena. National Climatic Data Center, Asheville, N.C. NOAA, 2016: Storm Data FAQ Page. Accessed 28 October 2016. [Available online at http://www.ncdc.noaa.gov/stormevents/faq.jsp].
Oregon City Enterprise: Twister will find Reflex
in the Tax Books of County. 31 March 1916,
p. 1.
Oregon Climate Service, 2007: Oregon Tornadoes 1887-1995. Accessed 9 August 2016. [Available online at https://web.archive.org/web/20070810194337/http:/www.ocs.orst.edu/pub_ftp/reports/book/Tornado_table.html].
Oregonian: Various articles. Detailed references
available upon request.
Oregon Journal: Various articles. 12 October
1934. 2 October 1940, p. 1.
Port Townsend Leader: Kerr Estate in Western
Jefferson is Valuable. 30 July 1904, p. 3.
Statesman Journal: 6 November 1962.
U.S. Census Bureau, 2016: Census 2000 Urban
and Rural classification. Accessed 1 November
2016. [Available online at
https://www.census.gov/geo/reference/ua/urb
an-rural-2000.html].
U.S. Dept. of Agriculture, 1897-1904: Climate and Crops: Oregon Section. Weather Bureau. U.S. Dept. of Agriculture, 1918-1940: Climatological Data, Oregon. Weather Bureau.

U.S. Dept. of Agriculture, 1925-1926a: Report of the Chief of the Weather Bureau. Weather Bureau, Washington D.C. U.S. Dept. of Agriculture, 1925-1926b: Mon. Wea. Rev., 53-54. U.S. Dept. of Agriculture, 1951: Climatological Data, Washington. Weather Bureau. U.S. Dept. of Commerce, 1940-1953: Climatological Data, Oregon. Weather Bureau. U.S. Dept. of Commerce, 1942: United States Meteorological Yearbook 1942. Weather Bureau, Washington D.C. U.S. Dept. of Commerce, 1949: Severe Storms for December 1949. Mon. Wea. Rev., 77, pp359-360. U.S. Dept. of Commerce, 1959-1973: Storm Data. Environmental Data Service, Asheville, N.C. U.S. Naval Observatory, 2015: U.S. Time Zones. Accessed 31 October 2016. [Available online at http://aa.usno.navy.mil/faq/docs/us_tzones.php].
U.S. War Dept., 1885: Winds. Mon. Wea. Rev.,
XIII, 230-231.
Univ. of Oregon Libraries, 2015: Historic Oregon
Newspapers. Accessed 28 October 2016.
[Available online at
http://oregonnews.uoregon.edu/].
Univ. of Washington Libraries, 2016: Digital
Collections. Accessed 31 October 2016.
[Available online at
http://digitalcollections.lib.washington.edu/cd
m/].
Vancouver Register: A Tornado. 13 July 1867.
Washington State Library, 2016: Historic
Newspapers. Accessed 28 October 2016.
[Available online at
https://www.sos.wa.gov//library/newspapers/n
ewspapers.aspx].
Yaquina Bay News: 28 November 1918.