P103d - Annex-Policy on Estimating Measurement Uncertainty ... measurement uncertainty for...
25
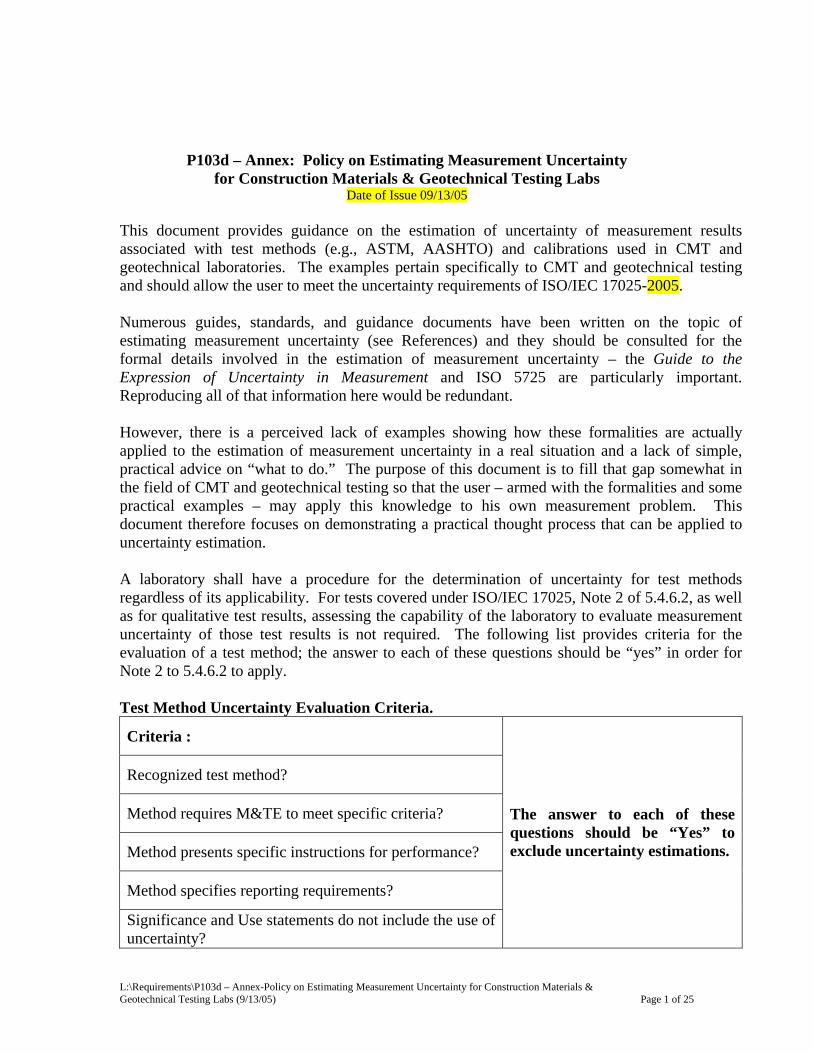
L:\Requirements\P103d – Annex-Policy on Estimating Measurement Uncertainty for Construction Materials & Geotechnical Testing Labs (9/13/05) Page 1 of 25 P103d – Annex: Policy on Estimating Measurement Uncertainty for Construction Materials & Geotechnical Testing Labs Date of Issue 09/13/05 This document provides guidance on the estimation of uncertainty of measurement results associated with test methods (e.g., ASTM, AASHTO) and calibrations used in CMT and geotechnical laboratories. The examples pertain specifically to CMT and geotechnical testing and should allow the user to meet the uncertainty requirements of ISO/IEC 17025-2005. Numerous guides, standards, and guidance documents have been written on the topic of estimating measurement uncertainty (see References) and they should be consulted for the formal details involved in the estimation of measurement uncertainty – the Guide to the Expression of Uncertainty in Measurement and ISO 5725 are particularly important. Reproducing all of that information here would be redundant. However, there is a perceived lack of examples showing how these formalities are actually applied to the estimation of measurement uncertainty in a real situation and a lack of simple, practical advice on “what to do.” The purpose of this document is to fill that gap somewhat in the field of CMT and geotechnical testing so that the user – armed with the formalities and some practical examples – may apply this knowledge to his own measurement problem. This document therefore focuses on demonstrating a practical thought process that can be applied to uncertainty estimation. A laboratory shall have a procedure for the determination of uncertainty for test methods regardless of its applicability. For tests covered under ISO/IEC 17025, Note 2 of 5.4.6.2, as well as for qualitative test results, assessing the capability of the laboratory to evaluate measurement uncertainty of those test results is not required. The following list provides criteria for the evaluation of a test method; the answer to each of these questions should be “yes” in order for Note 2 to 5.4.6.2 to apply. Test Method Uncertainty Evaluation Criteria. Criteria : Recognized test method? Method requires M&TE to meet specific criteria? Method presents specific instructions for performance? Method specifies reporting requirements? Significance and Use statements do not include the use of uncertainty? The answer to each of these questions should be “Yes” to exclude uncertainty estimations.
Transcript of P103d - Annex-Policy on Estimating Measurement Uncertainty ... measurement uncertainty for...
L:\Requirements\P103d – Annex-Policy on Estimating Measurement Uncertainty for Construction Materials & Geotechnical Testing Labs (9/13/05) Page 1 of 25
P103d – Annex: Policy on Estimating Measurement Uncertainty for Construction Materials & Geotechnical Testing Labs
Date of Issue 09/13/05
This document provides guidance on the estimation of uncertainty of measurement results associated with test methods (e.g., ASTM, AASHTO) and calibrations used in CMT and geotechnical laboratories. The examples pertain specifically to CMT and geotechnical testing and should allow the user to meet the uncertainty requirements of ISO/IEC 17025-2005. Numerous guides, standards, and guidance documents have been written on the topic of estimating measurement uncertainty (see References) and they should be consulted for the formal details involved in the estimation of measurement uncertainty – the Guide to the Expression of Uncertainty in Measurement and ISO 5725 are particularly important. Reproducing all of that information here would be redundant. However, there is a perceived lack of examples showing how these formalities are actually applied to the estimation of measurement uncertainty in a real situation and a lack of simple, practical advice on “what to do.” The purpose of this document is to fill that gap somewhat in the field of CMT and geotechnical testing so that the user – armed with the formalities and some practical examples – may apply this knowledge to his own measurement problem. This document therefore focuses on demonstrating a practical thought process that can be applied to uncertainty estimation. A laboratory shall have a procedure for the determination of uncertainty for test methods regardless of its applicability. For tests covered under ISO/IEC 17025, Note 2 of 5.4.6.2, as well as for qualitative test results, assessing the capability of the laboratory to evaluate measurement uncertainty of those test results is not required. The following list provides criteria for the evaluation of a test method; the answer to each of these questions should be “yes” in order for Note 2 to 5.4.6.2 to apply. Test Method Uncertainty Evaluation Criteria.
Criteria :
Recognized test method?
Method requires M&TE to meet specific criteria?
Method presents specific instructions for performance?
Method specifies reporting requirements?
Significance and Use statements do not include the use of uncertainty?
The answer to each of these questions should be “Yes” to exclude uncertainty estimations.

L:\Requirements\P103d – Annex-Policy on Estimating Measurement Uncertainty for Construction Materials & Geotechnical Testing Labs (9/13/05) Page 2 of 25
Interpretations of the terms used in Note 2 of 5.4.6.2 are as follow: “Well-recognized” test methods (or procedures) include those listed in section 5.4.2 of ISO/IEC 17025, second paragraph. That is, they are those test methods published in international, regional, or national standards, or by reputable technical organizations, or in relevant scientific texts or journals. They may also be test methods specified in a governing code, law, regulation, or specification applying to the item under evaluation. Certain test methods specified by manufacturers of testing equipment may also be considered to be “well-recognized”. However, sufficient evidence must be provided by the laboratory in order to demonstrate that these test methods are valid, and are well-accepted within the discipline. “Major sources of uncertainty” are those uncertainty sources that, in combination, contribute at least 95 % of the combined standard uncertainty. Alternatively, sources that are one-fourth or less of the largest source may be considered to be negligible. If any one or more of the following is specified in the test method, or if the test method refers to another document which specifies any of the following, then the requirement that the test method “specifies the form of presentation of calculated results” is considered to be satisfied:
1) the number of significant figures to be used to report the result; 2) the way the reported results are to be used or interpreted; 3) the method for calculating the reported results limits the significant figures.
These three conditions are fulfilled by the majority of CMT and geotechnical tests and so there is no need for any uncertainty estimate in most cases. This method evaluation of CMT tests implies that by specification of equipment accuracy, reporting criteria, and procedure definition, the uncertainty has been considered in the method when declaration of conformance or nonconformance to a specification is the outcome of the measurement. However, there are some tests that do not fulfill these conditions, or a customer may request an uncertainty estimate for a test result obtained using a method that satisfies the conditions of Note 2. In these cases, the laboratory will have to be able to make a reasonable estimate of measurement uncertainty. When an uncertainty estimate is required, the degree of rigor and the method for estimating measurement uncertainty should be determined by the laboratory in accordance with the principle stated in Note 1 to section 5.4.6.2 which states:
“The degree of rigor needed in an estimation of uncertainty of measurement depends on factors such as: • the requirements of the test method; • the requirements of the client; • the existence of narrow limits on which decisions on conformance to a specification are based.”
If less rigor is exercised in evaluating measurement uncertainty, the estimated measurement uncertainty value should normally be larger than an estimate obtained from a more rigorous

L:\Requirements\P103d – Annex-Policy on Estimating Measurement Uncertainty for Construction Materials & Geotechnical Testing Labs (9/13/05) Page 3 of 25
approach. Therefore, when performing contract review, it is necessary for the laboratory to ensure that the uncertainty requirements of the customer are understood and can be satisfied. The degree of rigor required in a measurement uncertainty estimate should be related to the purpose of the measurement and/or the requirement of the client and/or the risks involved. Tests and measurements that evaluate safety or identify the potential for substantial property or financial risk require a relatively comprehensive estimation of uncertainty in order to evaluate properly the risks. Critical measurements such as the characterization of reference materials will also generally require a high degree of rigor. Tests and measurements that evaluate properties where the associated uncertainty has a minor effect on the “fitness for purpose”, or where a compliance decision is clear, require a less comprehensive uncertainty estimate. Other factors to consider may include: the cost effectiveness of the approach adopted; the need to comply with good practice in a particular sector; the need to employ a harmonized approach in order to provide clients with an accurate indication of a lab’s measurement capability; or the possibility that a rigorous uncertainty estimate may provide some significant benefit. Definitions measurand particular quantity subject to measurement EXAMPLE: Compressive strength of a concrete cylinder. NOTE: The specification of a measurand may require statements about quantities such as time, temperature, pressure, and physical condition. accuracy of measurement closeness of the agreement between the result of a measurement and a true value of the measurand NOTES:
1) “Accuracy” is a qualitative concept. 2) The term precision should not be used for "accuracy".
tolerance extreme value of an error permitted by specifications for a measuring instrument NOTE: The term “limits of permissible errors” is also used. The tolerance is the maximum error limit allowed for a measuring device. The error limit may be expressed as a percentage of the reading or full range of the measuring instrument. The accuracy can be much better than the tolerance or very near the tolerance depending on the quality of the measuring device.

L:\Requirements\P103d – Annex-Policy on Estimating Measurement Uncertainty for Construction Materials & Geotechnical Testing Labs (9/13/05) Page 4 of 25
readability/resolution (of a displaying device) smallest difference between indications of a displaying device that can be meaningfully distinguished NOTES:
1) For a digital displaying device, this is the change in the indication when the least significant digit changes by one step.
2) This concept applies also to a recording device. 3) Readability is the smallest difference in measuring units that can be read on a measuring
device. On an analog instrument it may be possible to estimate between the smallest divisions on a scale. On a digital instrument the readability is the resolution in most cases. In this procedure resolution is defined as the smallest division that can be read or estimated on a measuring instrument.
uncertainty (of measurement) parameter, associated with the result of a measurement, that characterizes the dispersion of the values that could reasonably be attributed to the measurand NOTES: The parameter may be, for example, a standard deviation (or a given multiple of it), or the half-width of an interval having a stated level of confidence. Uncertainty of measurement comprises, in general, many components. Some of these components may be evaluated from the statistical distribution of the results of series of measurements and can be characterized by experimental standard deviations. The other components, which can also be characterized by standard deviations, are evaluated from assumed probability distributions based on experience or other information.
1) It is understood that the result of the measurement is the best estimate of the value of the measurand, and that all components of uncertainty, including those arising from systematic effects, such as components associated with corrections and reference standards, contribute to the dispersion.
2) This definition is that of the "Guide to the Expression of Uncertainty in Measurement" in which its rationale is detailed (see, in particular, 2.2.4 and annex D).
An expression of the result of a measurement concerned with calibration or testing can include a statement of the associated uncertainty of that measurement result. The uncertainty of a measurement result is a parameter that characterizes the spread of values that could reasonably be attributed to the measurand within a stated “level of confidence”.
Error is the measurement result minus the true value, but because the true value is never known exactly, corrections are always approximate and residual error remains. The measurement result itself is an estimate of the true value and the uncertainty is an estimate of the range of values, at a given level of confidence, which could contain the true value.

L:\Requirements\P103d – Annex-Policy on Estimating Measurement Uncertainty for Construction Materials & Geotechnical Testing Labs (9/13/05) Page 5 of 25
Uncertainty estimates can be obtained in one of two ways:
1) Type A uncertainty estimates are obtained by the statistical analysis of data – for example, repeatability may be estimated as the standard deviation of a set of repeated measurements;
2) Type B uncertainty estimates are obtained by other means, such as finding the uncertainty of a calibration result on a calibration certificate, or the uncertainty in the value of a reference material from the material certification. In some cases, uncertainty estimates can be based on one’s knowledge and experience, or on the laws of physics or from knowledge about how a measuring instrument behaves.
Summary procedure for determining uncertainty
1. Determine what you are measuring. 2. Determine units of measure, (e.g., ft⋅lb, %, etc.). 3. Obtain uncertainty of calibration standard or equipment used for test. 4. Evaluate repeatability. 5. Evaluate resolution/readability of all instrumentation. 6. Identify and evaluate other sources of uncertainty. 7. Prepare budget documentation. 8. Evaluate reasonability of budget. 9. Determine combined standard uncertainty. 10. Determine expanded uncertainty at 95 % level of confidence.
Some sources of uncertainty and other considerations The sources of uncertainty listed below are merely typical sources of uncertainty for some common test or calibration processes. All measurements must be examined closely in order to discover the appropriate sources of uncertainty. Sample variability Sample variability is perhaps the most significant contributor to the uncertainty of a test result. Compared to sample variability, the contribution of the instrumentation, the environment or other factors is generally small in most CMT tests. The calculation of measurement uncertainty thus becomes an attempt to quantify sample variability. Units of measure and decimal places Determined or estimated uncertainties should be calculated and expressed in the same units of measure. Make sure the units are the same throughout this process (i.e., milligrams, pounds, etc.). In some cases, especially where calibration may consist of many readings over a range, (e.g., a pressure gauge), it may be better to work in percentages. Be aware that some calibration procedures specify the unit of measure (e.g., ASTM E74 specifies force units for load cells). Be sure to establish and use a reasonable number of decimal places for numbers used in your calculations. The readability/resolution of the instrument should be considered when establishing the decimal places. Typically, uncertainty estimates are given to no more than two

L:\Requirements\P103d – Annex-Policy on Estimating Measurement Uncertainty for Construction Materials & Geotechnical Testing Labs (9/13/05) Page 6 of 25
significant figures, but enough significant figures should be retained in intermediate calculations to minimize rounding errors. Uncertainty due to the calibration standard or test instrument As a first step, obtain the calibration data from the calibration certificate on the calibration standard or test instrument that will be utilized for calibrations or testing and record the tolerance or, if given, the uncertainty of the standard or test equipment. If the uncertainty is given, it should be used. Typically, uncertainties given on calibration certificates will be “expanded uncertainties” usually using a “coverage factor of k = 2.” An “expanded uncertainty” is a standard deviation (or “standard uncertainty”) which has been multiplied by a number called the “coverage factor”. For example, in Figure 1 we see the “normal distribution” (or Gaussian distribution, or bell curve). This curve could represent the frequency with which a particular measurement result occurs in a repeated series of measurements. In this case, the average measurement result is zero (x = 0). If we calculated the standard deviation of the measurement result, we would get a number which we’ll designate as s. If we find the area under the curve between -1s and 1s, we would find that this area accounts for about 68 % of the entire area under the curve; in other words, about 68 % of all measurement results lie within 1 standard deviation of the mean. The area between the limits -2s and 2s is about 95 %, i.e., about 95 % of all measurement results will lie between the limits ±2s. Figure 1. The normal distribution showing 1 and 2 standard deviations (s).
-2 s 2s -1s 1sx = 0

L:\Requirements\P103d – Annex-Policy on Estimating Measurement Uncertainty for Construction Materials & Geotechnical Testing Labs (9/13/05) Page 7 of 25
Another way of looking at this is to say that the “true value” has a 68 % chance of being within one standard uncertainty of the measurement result and a 95 % chance of being within two standard uncertainties of the measurement result. If uncertainty is not given on the certificate then the tolerance or accuracy of the instrument can be used in the uncertainty budget. You will divide each calibration standard tolerance or accuracy value used by the square root of three (1/√3 ≈ 0.6 so you could also multiply the tolerance by 0.6). In most cases 0.6 is the proper value to be used if the distribution is unknown. Accuracy values chosen should be the maximum error obtained when the calibration was performed.
Examples:
1) Measurement uncertainty is given on the calibration certificate for a micrometer as ±50 μin. The certificate states that this is “an expanded uncertainty expressed at approximately the 95 % level of confidence using a coverage factor of k = 2.” The standard uncertainty as used in the budget you are creating is: (±50 μin)/2 = ±25 μin. In other words, divide the expanded uncertainty by the coverage factor (2 in this case) to get the “standard uncertainty”. When the level of confidence given on the certificate is stated as 95 % then the coverage factor is most likely 2.
2) Measurement uncertainty is not given on the certificate, but the certificate states that the micrometer is “in tolerance”. Checking the manufacturer’s manual we find that the device has a tolerance of ±100 μin, i.e., the true value is within ±100 μin of the indicated value. In this case, since we have no other information, we divide the tolerance by the square root of three to obtain a standard uncertainty of ±60 μin.
Repeatability To determine uncertainty for a measurement process it is necessary to conduct a repeatability study. The uncertainty obtained from this study is an important contributor to the determination of total uncertainty. A standard deviation must be obtained from a study of the repeatability of the calibration or test measurement process (a normal distribution is assumed). It can be difficult to design a repeatability study because all contributing variables must be isolated such that the study is valid for the uncertainty of the measurement process in question. For example, a valid uncertainty estimate of a length measurement with a micrometer may include a repeatability study where a similar article was measured 10 times in a manner similar to the actual measurement and the standard deviation calculated of the 10 measurements. Resolution Digital instrumentation by its nature, sampling rate, etc., provides a discrete number, but the true value could lie within the range ±0.5R, where R is the resolution of the display. This fact needs to be taken into account when we evaluate uncertainties. To convert the resolution of a display to a standard uncertainty, we simply divide half the resolution by the square root of three, which is the same as multiplying by 0.3:
Standard uncertainty due to limited resolution = ± 0.5R/√3 = ± 0.3R.

L:\Requirements\P103d – Annex-Policy on Estimating Measurement Uncertainty for Construction Materials & Geotechnical Testing Labs (9/13/05) Page 8 of 25
It is sometimes the case when doing repeatability studies with digital instrumentation that the standard deviation of the results of repeated measurements may be zero (i.e., the display gives the same indication every time the measurement is repeated because the resolution is not fine enough to pick up on small variations), or else the repeatability standard deviation is small compared to the resolution. If this occurs then the uncertainty due to limited resolution should be used instead of the repeatability standard deviation. The resolution or readability of an analog scale is an estimated value which depends upon how well a laboratory can resolve between scale markings. Many labs have a rule of dividing an analog scale into no more than four segments (i.e., estimation to no better than one-fourth of a scale division) although using magnification it may be possible to estimate even smaller divisions between adjacent scale markings. In such cases, the standard uncertainty due to limited resolution is that fraction of a scale division which can be distinguished. Examples:
1) The resolution of a digital temperature display is 1 °C. The standard uncertainty due to limited resolution of the display is (0.3) × (1 °C) = 0.3 °C.
2) Using a magnifying glass, a laboratory can accurately interpolate between the scale markings on a liquid-in-glass thermometer to within one-tenth of a scale division. In this case, the standard uncertainty due to limited resolution is one-tenth of a scale division.
Other sources of uncertainty Next determine any other sources of uncertainty. Some of these uncertainties may have to be estimated; for example, temperature may have some effect on the measurement. The uncertainty of these measurements is generally calculated by taking the known or estimated value in the proper units and dividing by the square root of three (again we use square root of three because the distribution is unknown and we assume rectangular). Record each one of these uncertainties with some appropriate label. Examples of these types of uncertainties are: temperature, voltage drift, air buoyancy, local gravity affects, geometric misalignment, parallax, thermal expansion, resolution, or resistance. As a general rule not many uncertainties can be discovered in this manner in routine calibration or tests in typical agencies outside of metrology laboratories. Estimates of uncertainties may be made in order to present more conservative results. For example, for calibrations being performed on a length measuring device in a field office where the temperature varies by ten degrees above the recommended temperature for calibration, an estimated uncertainty associated because of the temperature (thermal expansion, flow, density) is appropriate. Combined and expanded uncertainty We can now calculate the combined uncertainty by squaring each one of the uncertainties calculated or estimated in the above steps and adding these values to one another and taking the square root of this sum (Root-Sum-Square, or RSS). Multiplying this by the appropriate

L:\Requirements\P103d – Annex-Policy on Estimating Measurement Uncertainty for Construction Materials & Geotechnical Testing Labs (9/13/05) Page 9 of 25
coverage factor, we obtain the expanded uncertainty. The terms we are RSSing must have the same units.
( ) ( ) ( ) ( ) ( )other3other2otherRepeatCert 22222++++ = Combined Standard Uncertainty
In this equation, the calibration standard (cert), repeatability (repeat), and other uncertainties were used. Combined uncertainties could involve several additional contributors or fewer contributors depending on the calibration or test method and the desired degree of rigor of the estimate. The Expanded Uncertainty is the Combined Uncertainty multiplied by a coverage factor. In many cases, the coverage factor may be 2 which is typically used to approximate a 95 % level of confidence. It should be noted that other coverage factors are possible. For example, a coverage factor larger than 2 may be used when the uncertainty estimate is based on a small number of repeated measurements. The references should be consulted to ascertain methods of how to determine other coverage factors; here we merely present a shortcut that is applicable to many cases likely to be encountered in the CMT/geotechnical laboratory. The most common case is that an uncertainty estimate is dominated by a single large Type A uncertainty estimate (e.g., repeatability) obtained from a small number of repeat measurements. In cases like this, using a coverage factor of k = 2 can significantly underestimate the expanded uncertainty of the measurement. To account for this, we choose a coverage factor based on the number of measurements used to obtain the type A uncertainty estimate. If the number of measurements is n, then we say that the “degrees of freedom” of the estimate is ν and ν = n – 1. We then use the coverage factor from Table 1 (below) corresponding to this number of degrees of freedom. This approximation works well if the type A uncertainty is 2 or more times larger than the next largest uncertainty contributor. Another common case is when the combined standard uncertainty estimate uc is dominated by two contributors: a type A uncertainty estimate uA based on a small number of measurements, and another source of uncertainty obtained from a type B estimate that is larger than one-third of the type A estimate. In this case, if the degrees of freedom of the type A estimate isνA, we can estimate the degrees of freedom ν of the combined standard uncertainty estimate by
ν = νA(uc/uA)4 (1) and choose the appropriate coverage factor from Table 1. These two cases account for the majority of cases likely to be encountered in the CMT or geotechnical laboratory and we will use this convention in the examples that follow.

L:\Requirements\P103d – Annex-Policy on Estimating Measurement Uncertainty for Construction Materials & Geotechnical Testing Labs (9/13/05) Page 10 of 25
Table 1. Coverage factors for degrees of freedom ν. Degrees of freedom
For 95 % level of confidence, multiply by
1 12.71 2 4.30 3 3.18 4 2.78 5 2.57 6 2.45 7 2.36 8 2.31 9 2.26 10 2.23 15 2.13
20 + 2.00 Use of repeatability, reproducibility, trueness estimates and control
charts in uncertainty estimates (The following paragraphs are from the “A2LA Guide for the Estimation of Measurement Uncertainty in Testing” by Thomas Adams. They are presented because the methods proposed and discussed may be appropriate for the CMT laboratory to consider when estimation of uncertainty is necessary.) In this section we will focus on two measures of precision, repeatability and reproducibility, and measures of trueness to show a simple method for basing uncertainty estimates on these measures. This method has the great advantages that most testing labs are already acquainted with repeatability and reproducibility experiments and that a suitably devised reproducibility experiment will include the effects of all of the major uncertainty contributors. For complete details, the reader is urged to consult ISO 5725, in particular part 2, “Accuracy (trueness and precision) of measurement methods and results – Basic method for the determination of repeatability and reproducibility of a standard measurement method”. In addition, a draft technical standard is being prepared by ISO designated as ISO/DTS 21748. This document will be an excellent guide to the use of repeatability, reproducibility and trueness estimates in estimation of measurement uncertainty. Also, this section briefly discusses the use of control charts as the basis for uncertainty estimates. For details on control charts, the reader is referred to, for example, ISO 8258, “Shewhart control charts”. In what follows, we assume that the reader is already familiar with control charting. Control charts Recalling that:

L:\Requirements\P103d – Annex-Policy on Estimating Measurement Uncertainty for Construction Materials & Geotechnical Testing Labs (9/13/05) Page 11 of 25
1) measurement uncertainty is defined as a “parameter, associated with the result of a measurement, that characterizes the dispersion of the values that could reasonably be attributed to the measurand”;
2) this parameter is a standard deviation, or a multiple of a standard deviation, that can be derived from the statistical analysis of experimental data;
3) upper and lower action limits are established on control charts so that approximately 997 measurements out of 1000 are within the action limits for a measurement process in statistical control;
4) upper and lower warning limits are established on control charts so that approximately 950 measurements out of 1000 are within the warning limits for a measurement process in statistical control,
we can see immediately that the action limits provide an estimate of measurement uncertainty at approximately the 99.7 % level of confidence (“3 sigma”) and that the warning limits will provide estimates of uncertainty at approximately the 95 % level of confidence (“2 sigma”). There are a few caveats associated with estimating measurement uncertainty based on control chart data:
1) The control test sample should have a certified or otherwise known or accepted value. This way, bias in the measurement process may be identified and corrected for in the calculation of measurement results, or else eliminated. There will be some uncertainty associated with bias corrections so it may be necessary to identify and quantify this uncertainty and root-sum-square it with the standard deviation associated with the control limits.
2) The value of the measurand represented by the control sample should be close to the value of the measurand actually obtained during routine testing since, in general, the uncertainty of a measurement will be some function of the “level of the test”, or value of the measurand. For example, the uncertainty associated with melt flow rate determinations will depend on the value of the melt flow rate: uncertainties associated with very low flow rates will in general be different from uncertainties associated with very high melt flow rates. Consequently, it may be necessary to track several control samples at different levels of the measurand in order to properly assess the measurement uncertainty for the various levels of the measurand encountered in a testing laboratory.
3) The measurement process for control samples should be the same as for routine samples, including subsampling and sample preparation. If it is not, then additional uncertainty components may have to be considered (c.f. section 3 for the general method of doing this).
4) The measurement process must be in statistical control as demonstrated by the control chart. This means that a sufficient number of data points must be collected before a judgment can be made as to whether or not the process is in control and also to ensure that the estimate of the population standard deviation is reasonably accurate. There are no universally applicable rules here, but normally 20 – 25 subgroups of 4 or 5 are considered adequate for providing preliminary estimates. Measurement processes that are not in statistical control must be brought into control before the control chart can be properly constructed.
L:\Requirements\P103d – Annex-Policy on Estimating Measurement Uncertainty for Construction Materials & Geotechnical Testing Labs (9/13/05) Page 12 of 25
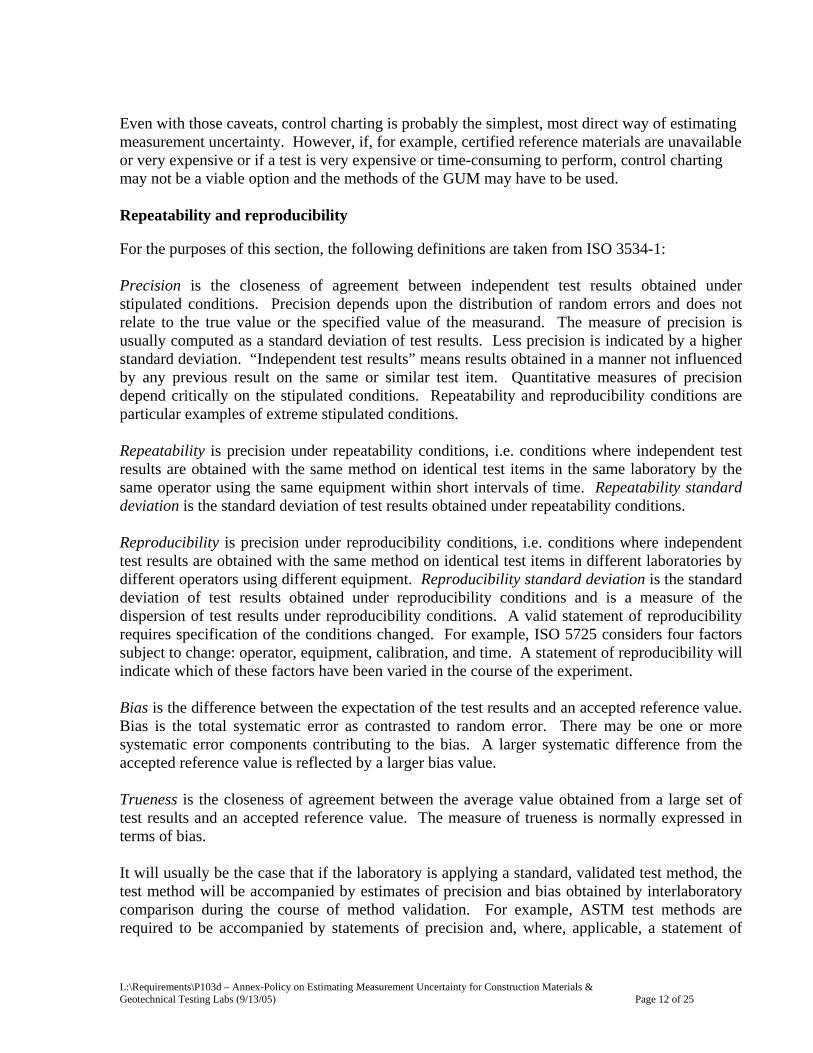
Even with those caveats, control charting is probably the simplest, most direct way of estimating measurement uncertainty. However, if, for example, certified reference materials are unavailable or very expensive or if a test is very expensive or time-consuming to perform, control charting may not be a viable option and the methods of the GUM may have to be used. Repeatability and reproducibility For the purposes of this section, the following definitions are taken from ISO 3534-1: Precision is the closeness of agreement between independent test results obtained under stipulated conditions. Precision depends upon the distribution of random errors and does not relate to the true value or the specified value of the measurand. The measure of precision is usually computed as a standard deviation of test results. Less precision is indicated by a higher standard deviation. “Independent test results” means results obtained in a manner not influenced by any previous result on the same or similar test item. Quantitative measures of precision depend critically on the stipulated conditions. Repeatability and reproducibility conditions are particular examples of extreme stipulated conditions. Repeatability is precision under repeatability conditions, i.e. conditions where independent test results are obtained with the same method on identical test items in the same laboratory by the same operator using the same equipment within short intervals of time. Repeatability standard deviation is the standard deviation of test results obtained under repeatability conditions. Reproducibility is precision under reproducibility conditions, i.e. conditions where independent test results are obtained with the same method on identical test items in different laboratories by different operators using different equipment. Reproducibility standard deviation is the standard deviation of test results obtained under reproducibility conditions and is a measure of the dispersion of test results under reproducibility conditions. A valid statement of reproducibility requires specification of the conditions changed. For example, ISO 5725 considers four factors subject to change: operator, equipment, calibration, and time. A statement of reproducibility will indicate which of these factors have been varied in the course of the experiment. Bias is the difference between the expectation of the test results and an accepted reference value. Bias is the total systematic error as contrasted to random error. There may be one or more systematic error components contributing to the bias. A larger systematic difference from the accepted reference value is reflected by a larger bias value. Trueness is the closeness of agreement between the average value obtained from a large set of test results and an accepted reference value. The measure of trueness is normally expressed in terms of bias. It will usually be the case that if the laboratory is applying a standard, validated test method, the test method will be accompanied by estimates of precision and bias obtained by interlaboratory comparison during the course of method validation. For example, ASTM test methods are required to be accompanied by statements of precision and, where, applicable, a statement of

L:\Requirements\P103d – Annex-Policy on Estimating Measurement Uncertainty for Construction Materials & Geotechnical Testing Labs (9/13/05) Page 13 of 25
bias. In the case of ASTM test methods, the statement of precision will include an expression of the within-laboratory standard deviation (Sr) and the between-laboratory standard deviation (SR). With all of this in mind, we can see that a laboratory will be able to establish reasonable uncertainty estimates if
1) it can establish that its bias when applying the measurement method is within the bias stated in the test method, and
2) it can establish that the precision (i.e., reproducibility with several factors varied) obtained during application of the test method is within the between-laboratory standard deviation stated in the test method, and
3) it can identify any influence quantities that may not have been adequately studied during the interlaboratory comparison, and quantify the influence quantities, associated uncertainties and sensitivity coefficients (c.f. section 3.4).
If these conditions are satisfied, then the laboratory can estimate its measurement uncertainty by combining the uncertainty associated with bias corrections, its reproducibility, and the uncertainties of any influence quantities identified in (3) above via the “root-sum-square” method given below in section 3.5. To establish that these conditions are fulfilled, the laboratory may proceed as follows: Control of bias The laboratory may demonstrate that its measurement bias is within the limits expected by proper application of the test method by either of the following methods:
1) Using a certified reference material
Using an appropriate reference standard or material, the laboratory should perform replicate measurements to form an estimate of its bias, which is the difference between the mean of its test results and the certified value of the standard or material. If the absolute value of this bias is less than twice the reproducibility standard deviation given in the precision statement in the test method, then the laboratory may consider that its bias is under control.
2) Interlaboratory comparison
Laboratories participating in proficiency testing schemes will have available to them data from a large number of laboratories which they can use to estimate the bias of their measurement results. Comparison of the lab mean to the grand mean or other assigned value in such programs, for example, will allow them to demonstrate that their bias is under adequate control.
Control of precision To verify control of precision, the laboratory may perform a number of replicate measurements under repeatability conditions and compare its repeatability standard deviation sl to the

L:\Requirements\P103d – Annex-Policy on Estimating Measurement Uncertainty for Construction Materials & Geotechnical Testing Labs (9/13/05) Page 14 of 25
repeatability standard deviation sr given in the precision statement in the test method. Comparing sl to sr using an F-test, for example, to test for significant difference, will allow the laboratory to demonstrate control of precision. If sl differs significantly from sr, then the laboratory should use sl in its estimate of uncertainty, otherwise it can use sr. Once the laboratory has demonstrated control of precision and bias, it is free to use the estimates of these quantities given in the test method as the basis for its estimate of measurement uncertainty. However, it must demonstrate on an on-going basis that precision and bias continue to be under adequate control. This is accomplished, for example, by proper measurement assurance techniques including control charting. Further, as mentioned above, the reference materials or standards used in these verifications must be relevant to the levels of the test encountered by the laboratory in its routine testing. Once these conditions are fulfilled and satisfied on an on-going basis, the laboratory has all of the information it needs to estimate its measurement uncertainty. Appropriateness of uncertainty estimation for calibrations Uncertainty determination for calibrations ISO/IEC 17025 requires the determination of uncertainty for all in-house calibrations. However, calibrated equipment used in test methods that do not specify tolerances for the calibrated equipment do not need estimation of uncertainty. The estimation of the uncertainty of the listed CMT equipment in Table 2 provides the test laboratory with a useful evaluation of the measurement capabilities of the equipment used for general dimensional or test measurement. CMT Equipment that is not contained in this Table by their absence do not need uncertainties. Table 2 cannot be all-exclusive. The reader should evaluate similar equipment as needing or not needing uncertainty budgets for calibration. It should also be noted that if the applicable equipment is calibrated by an outside agency uncertainty is also required. Table 2 – CMT Equipment Calibrations Requiring Uncertainty.
Type of Instrument Comments1
Force Measurement Instrumentation Should include readout devices.
Calipers, Micrometers, (Length) Dimensional
Scales and Balances
Dial Gauges, Digital Indicators, LVDTs When a tolerance is specified. Not required when “readability” is the only criteria.
Thermometers Primary standards only, and not including field thermometers.
Pressure Transducers
1 The comments listed below represent the consensus of the CMAC at the Summer 2003 meeting.

L:\Requirements\P103d – Annex-Policy on Estimating Measurement Uncertainty for Construction Materials & Geotechnical Testing Labs (9/13/05) Page 15 of 25
Table 3 presents some equipment that does not require uncertainty. As with Table 2, this list cannot be all-inclusive. Table 3 – CMT Equipment Calibrations Not Requiring Uncertainty.
Type of Instrument Comments
Compression Machine – Platens Verify planeness, somewhat visual –Go/No Go
Strain rate of loading devices Broad tolerance
Steel rules, tapes Quality machine tools should be used. Current industry practice precludes calibration.
Straight edges Visual check appears satisfactory possibly with Go – No/Go.
Nuclear Density Gauges (May or may not apply)
Depending on procedure, uncertainty may or may not apply. Use of density blocks makes it difficult to do uncertainty.
Sieves Visual or opening sizing.
Liquid manometers Similar to rulers, can be high tolerance measurements.
Timing devices High tolerance measurements.
Weights – such as hanger weights on balances and scales Calibrated as part and with scale or balance.
Liquid Limit Apparatus Visual test
Speedy Moisture Device High tolerance measurements.
Consolidometer (stone deformations)

L:\Requirements\P103d – Annex-Policy on Estimating Measurement Uncertainty for Construction Materials & Geotechnical Testing Labs (9/13/05) Page 16 of 25
pH Meter Use standard materials; one point validation.
Ovens and Water Baths
Example uncertainty budgets Example 1. Uncertainty budget for compressive test on soil. In this example, the following equipment was used:
1) A 1000 lb load cell and digital readout with resolution of 1 lb. 2) A dial indicator and a caliper, both with resolution of 0.001 in.
Source of Uncertainty Value (%) Distribution Type Divisor Standard
Uncertainty ± (%)
Load Cell Certificate 0.75 Rectangular B 3 0.43
Dial Indicator Certificate 0.75 Rectangular B 3 0.43
Caliper Certificate 0.20 Rectangular B 3 0.12
Diameter Repeatability (standard deviation of 10 readings)
0.03 Normal A 1 0.03
Length Repeatability (standard deviation of 10 readings)
0.06 Normal A 1 0.06
Load Repeatability (standard deviation of 5 readings)
2.50 Normal A 1 2.50
Geometric Misalignment 0.10 Rectangular B 3 0.06
Combined Standard Uncertainty (RSS) = ± 2.58 %
Coverage Factor k = 2.78 (See note 7.)
Expanded Uncertainty = 2.78 × 2.58 % = 7.17 % which we round to ± 7 %.
Notes:
1) The sample size is nominally 3 in diameter by 6 in long. 2) Most of the uncertainty appears to be due to sample variability, as evidenced by the load
repeatability.

L:\Requirements\P103d – Annex-Policy on Estimating Measurement Uncertainty for Construction Materials & Geotechnical Testing Labs (9/13/05) Page 17 of 25
3) Certificate uncertainties are from the maximum error in percent of reading (accuracy) from certificate because uncertainty is not given. Therefore we divide by the square root of three.
4) Diameter and length repeatability is the standard deviation of ten measurements as a percent of a nominal length and diameter.
5) Load repeatability is the standard deviation of five specimens with load taken at 15 % deflection. The average load was 150 lb and the standard deviation was 3.75 lb. Dividing the standard deviation of 3.75 lb by the average load of 150 lb gives the standard deviation as a percentage of the load, 2.5%. The reading of the dial gauge (resolution) is considered included with the load repeatability. Since we took 5 readings, the degrees of freedom of this type A estimate is 4.
6) Geometric misalignment was estimated from a measurement study where the offset load was divided by 150 lb.
7) Resolution of the load cell (1 lb) was considered in this budget and compared to the repeatability uncertainty at 150 lb which was 3.75 lb. Since the repeatability is so much larger than the resolution, we will not include resolution in the budget. In fact, sample variability is so large that we could have neglected every other uncertainty contributor. This is a case where the combined uncertainty estimate is dominated by a single type A uncertainty estimate with 4 degrees of freedom, so we choose the coverage factor for 4 degrees of freedom in Table 1, which is 2.78.
Example 2. Uncertainty budget for load cell calibration. This example is for a 1000 lb load cell with a digital display with 1 lb resolution. The uncertainty for the load cell was given on the calibration certificate as 0.2 lb, which was an expanded uncertainty using a coverage factor of k = 2.43 according to the calibration method of ASTM E4.
Source of Uncertainty Value (lb) Distribution Type Divisor Standard
Uncertainty ± (lb)
Load Cell Certificate 0.2 Normal B 2.43 0.082
Load Repeatability 0.4 Normal A 1 0.40
Geometric Alignment 0.1 Rectangular B 3 0.06
Resolution of Load Cell 1.0 Rectangular B 2 3 0.29
Combined Standard Uncertainty (RSS) = ± 0.50 lb
Coverage Factor, k = 2.78 (See Note 3.) Expanded Uncertainty = 2.78 × 0.50 lb = ± 1.4 lb.

L:\Requirements\P103d – Annex-Policy on Estimating Measurement Uncertainty for Construction Materials & Geotechnical Testing Labs (9/13/05) Page 18 of 25
Notes: 1) Load repeatability was taken from calibration data by taking the standard deviation of
three readings at each load and using the maximum standard deviation for all loads, which was found to be 0.4 lb. Since we took 3 readings, the degrees of freedom of this type A estimate is νA = 2.
2) To determine if this load cell has an acceptable uncertainty we look at the cell accuracy error to ensure that it is ≤ 1 % of any calibration reading and we determine from the data that this is so. The largest source of uncertainty is the resolution of the display. But even if we could, hypothetically, somehow reduce the resolution to zero, the lowest uncertainty we could achieve would be about 0.83 % so the uncertainty of this load cell is dominated by the relatively poor repeatability of the system. Therefore, depending upon the needs of the laboratory, a new load cell system may be required.
3) This is a case where the largest uncertainty contributor is the type B estimate of resolution, and this estimate is larger than the type A estimate of repeatability. To find the coverage factor we use equation 1:
ν = νA(uc/uA)4 = 2(0.5/0.4)4 = 4.88 ≈ 4.
When estimating degrees of freedom with this equation, it is best to round down to the nearest integer. From table 1, we see that the coverage factor for 4 degrees of freedom is 2.78.
Example 3. Uncertainty Budget Grain Size Analysis Test Method. This test method was performed using a balance readable to 0.01 g.
Source of Uncertainty Value (%) Distribution Type Divisor Standard
Uncertainty ± (%)
Balance Certificate 0.001 N B Insignificant
Balance Repeatability 0.01 N A 1 0.01
Sieve Set Repeatability 2.00 N A 1 2.00
Sieve Shaker Insignificant
Time of Shake Same for all samples
Sieve Cleaning Process (or lack of) 0.5 R B 3 0.289
Combined Standard Uncertainty (RSS) = ± 2.02
L:\Requirements\P103d – Annex-Policy on Estimating Measurement Uncertainty for Construction Materials & Geotechnical Testing Labs (9/13/05) Page 19 of 25
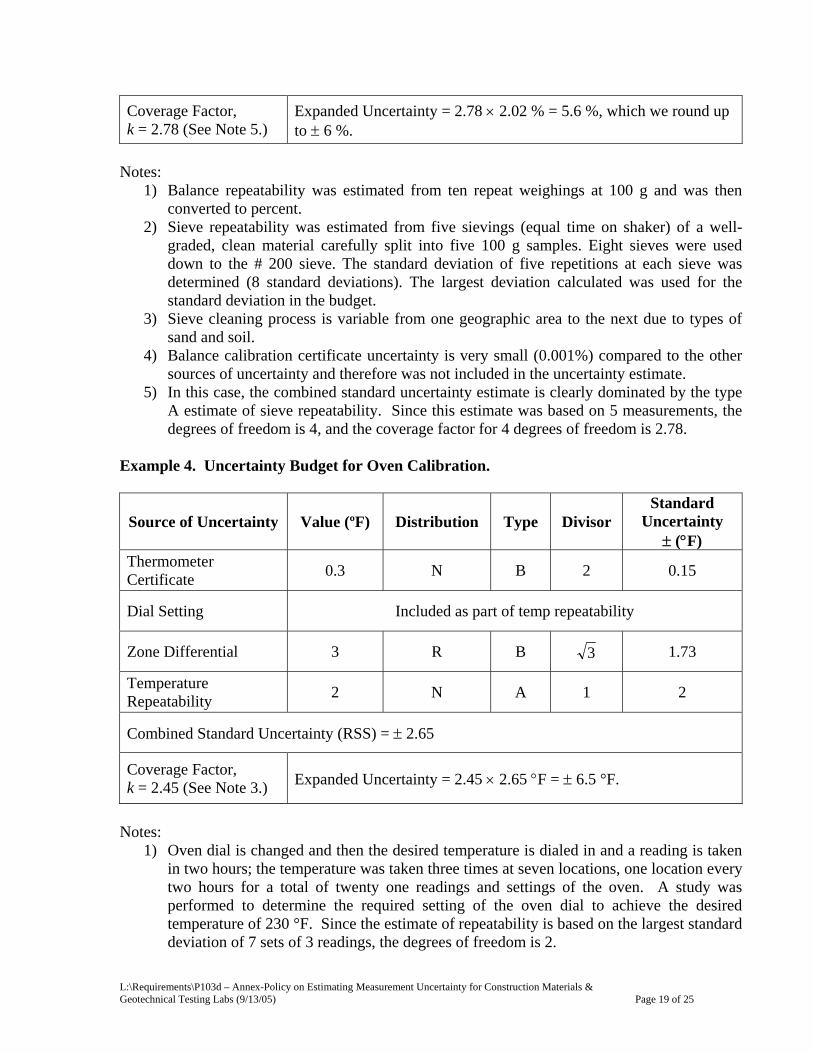
Coverage Factor, k = 2.78 (See Note 5.)
Expanded Uncertainty = 2.78 × 2.02 % = 5.6 %, which we round up to ± 6 %.
Notes:
1) Balance repeatability was estimated from ten repeat weighings at 100 g and was then converted to percent.
2) Sieve repeatability was estimated from five sievings (equal time on shaker) of a well-graded, clean material carefully split into five 100 g samples. Eight sieves were used down to the # 200 sieve. The standard deviation of five repetitions at each sieve was determined (8 standard deviations). The largest deviation calculated was used for the standard deviation in the budget.
3) Sieve cleaning process is variable from one geographic area to the next due to types of sand and soil.
4) Balance calibration certificate uncertainty is very small (0.001%) compared to the other sources of uncertainty and therefore was not included in the uncertainty estimate.
5) In this case, the combined standard uncertainty estimate is clearly dominated by the type A estimate of sieve repeatability. Since this estimate was based on 5 measurements, the degrees of freedom is 4, and the coverage factor for 4 degrees of freedom is 2.78.
Example 4. Uncertainty Budget for Oven Calibration.
Source of Uncertainty Value (ºF) Distribution Type Divisor Standard
Uncertainty ± (°F)
Thermometer Certificate 0.3 N B 2 0.15
Dial Setting Included as part of temp repeatability
Zone Differential 3 R B 3 1.73
Temperature Repeatability 2 N A 1 2
Combined Standard Uncertainty (RSS) = ± 2.65
Coverage Factor, k = 2.45 (See Note 3.) Expanded Uncertainty = 2.45 × 2.65 °F = ± 6.5 °F.
Notes:
1) Oven dial is changed and then the desired temperature is dialed in and a reading is taken in two hours; the temperature was taken three times at seven locations, one location every two hours for a total of twenty one readings and settings of the oven. A study was performed to determine the required setting of the oven dial to achieve the desired temperature of 230 °F. Since the estimate of repeatability is based on the largest standard deviation of 7 sets of 3 readings, the degrees of freedom is 2.

L:\Requirements\P103d – Annex-Policy on Estimating Measurement Uncertainty for Construction Materials & Geotechnical Testing Labs (9/13/05) Page 20 of 25
2) The Zone Differential was obtained by taking the highest and the lowest temperature recorded during the calibration and dividing the difference by 2. In this example the differential was 6 °F which is high and some maintenance on the oven may be necessary.
3) This is a case where the combined standard uncertainty estimate is dominated by a type A estimate and a type B estimate of nearly equal magnitude. To estimate the degrees of freedom of the combined standard uncertainty estimate we again use equation 1:
ν = νA(uc/uA)4 = 2(2.65/2)4 ≈ 6.
From table 1, the coverage factor for 6 degrees of freedom is 2.45.
Example 5. Uncertainty Budget for Specific Gravity Test of Soils.
Source of Uncertainty Value (SG) Distribution Type Divisor Standard
Uncertainty ± (SG)
Balance certificate 0.001 N B 2 0.0005
Meniscus Repeatability 0.02 N A 1 0.02
Trapped air removal 0.05 N A 1 0.05
Balance Repeatability 0.001 N A 1 0.001
Combined Standard Uncertainty (RSS) = ± 0.054
Coverage Factor, k = 2.57 (See Note 3.)
Expanded Uncertainty = 2.57 × 0.054 = 0.139 which we round to ± 0.14.
Notes:
1) Units are Specific Gravity units, conversion by incremental change of the unit (i.e. grams) on the SG value. For example, the balance certificate was given as 0.01 grams and it would be converted to 0.001 SG units.
2) Note that the biggest source of uncertainty is lack of trapped air removal which is not really a measurement but is attributable to sample variability and preparation.
3) Repeatability was based on five repetitions each of meniscus, trapped air, and balance repeatability. The combined standard uncertainty estimate is clearly dominated by the type A estimate of the effect of trapped air removal, so to estimate the degrees of freedom of the combined standard uncertainty estimate we again use equation 1:
ν = νA(uc/uA)4 = 4(0.054/0.05)4 ≈ 5.
From table 1, the coverage factor for 5 degrees of freedom is 2.57.

L:\Requirements\P103d – Annex-Policy on Estimating Measurement Uncertainty for Construction Materials & Geotechnical Testing Labs (9/13/05) Page 21 of 25
Example 6. Uncertainty budget for the calibration of a LVDT.
Source of Uncertainty Value (μin) Distribution Type Divisor
Standard Uncertainty
± (μin)
Gage Block Certificate 5 N B 2 2.5
Resolution 100 R B 2 3 29
Repeatability 290 N A 1 290
Combined Standard Uncertainty (RSS) = ± 292 μin
Coverage Factor, k = 2.78 (See note 1.) Expanded Uncertainty = 2.78 × 292 μin ≅ ± 800.
Note:
1) Repeatability was estimated by selecting the largest standard deviation from five repetitions each of ten calibration points throughout the range of the LVDT. The degrees of freedom is 4, and the corresponding coverage factor from Table 1 is 2.78.
Example 7. Uncertainty budget for the calibration of a digital indicator.
Source of Uncertainty Value in (μin) Distribution Type Divisor
Standard Uncertainty
± (μin)
Gage Block Certificate 5 N B 2 2.5
Resolution 100 R B 2 3 29
Repeatability 230 N A 1 230
Coefficient of Thermal Expansion 20 R B 3 12
Combined Standard Uncertainty (RSS) = ± 232
Coverage Factor, k = 2.78 (See note 2.) Expanded Uncertainty = 2.78 × 232 μin ≅ ± 650 μin.
Notes:
1) Coefficient of thermal expansion is considered due to large temperature operating range (50 °F to 90 °F). Note that coefficient of thermal expansion is a type B uncertainty

L:\Requirements\P103d – Annex-Policy on Estimating Measurement Uncertainty for Construction Materials & Geotechnical Testing Labs (9/13/05) Page 22 of 25
estimate and is assumed to be described by a rectangular distribution. See Reference 5 for more information about handling temperature effects in dimensional calibration.
2) Repeatability was estimated from five repetitions each of five calibration points (0.1, 0.3, 0.5, 0.8, 1.00 inches). The largest SD was the five repetitions at 0.8 inches as given above. This gives 4 degrees of freedom and the coverage factor is 2.78.
Example 8. Uncertainty budget for scale calibration. The device to be calibrated is a digital scale with a 10 kg capacity and resolution of 0.1 g.
Source of Uncertainty Value (g) Distribution Type Divisor
Standard Uncertainty
± (g)
Repeatability 0.25 N A 1 0.25
Standard Weights 0.15 N B 2 0.075
Resolution 0.1 R B 2 3 0.0289
Combined Standard Uncertainty (RSS) = ± 0.263
Coverage Factor, k = 2.78 Expanded Uncertainty = 2.78 × 0.263 g = 0.73 g.
Note:
1) For repeatability five repetitions were done at four weights on the scale, and the coverage factor for 4 degrees of freedom is 2.78. The largest standard deviation was at 10 kg (0.25 g). Class F mass standards were used.
Example 9. Uncertainty budget for the calibration of a liquid-in-glass thermometer. The device to be calibrated is a liquid-in-glass thermometer with a maximum reading of 110 °C and scale markings of 0.05 °C. The user of the thermometer is able to interpolate between half of a scale division (i.e., to 0.025 °C). This thermometer is compared to a digital thermometer with a resolution of 0.02 °C.
Source of Uncertainty Value (°C) Distribution Type Divisor
Standard Uncertainty
± (°C)
Temperature Standard 0.02 N B 2 0.01
Repeatability 0.04 N A 1 0.04

L:\Requirements\P103d – Annex-Policy on Estimating Measurement Uncertainty for Construction Materials & Geotechnical Testing Labs (9/13/05) Page 23 of 25
Resolution 0.025 - B 1 0.025
Combined Standard Uncertainty (RSS) = ± 0.048 °C
Coverage Factor, k = 2.31 (See note 1.) Expanded Uncertainty = 2.31 × 0.048 °C = 0.11 °C.
Note:
1) Repeatability was determined at 50 °C as a matter of convention; five repetitions were made and the standard deviation was determined. To estimate the degrees of freedom of the combined standard uncertainty estimate we again use equation 1:
ν = νA(uc/uA)4 = 4(0.048/0.04)4 ≈ 8.
From table 1, the coverage factor for 8 degrees of freedom is 2.31.
Example 10. Uncertainty budget for the calibration of a pressure transducer. The device to be calibrated is a pressure transducer with digital signal conditioning, resolution of 0.01 psi and 100 psi maximum pressure. The pressure standard is a deadweight tester.
Source of Uncertainty Value (psi) Distribution Type Divisor
Standard Uncertainty
± (psi)
Pressure Standard 0.01 N B 2 0.005
Repeatability 0.0089 N A 1 0.0089
Resolution 0.01 R B 2 3 0.00289
Combined Standard Uncertainty (RSS) = ± 0.01 psi
Coverage Factor, k = 2.26 (See Note 1.) Expanded Uncertainty = 2.26 × 0.01 psi = ± 0.023 psi.
Note:
1) Repeatability was determined by taking ten readings at the reading with the greatest difference between the calibration standard and the transducer being calibrated (which was at 50.00 psi). In this case the degrees of freedom is 9 and the coverage factor is 2.26.
Example 11. Uncertainty budget for the calibration of an X/Y recorder.

L:\Requirements\P103d – Annex-Policy on Estimating Measurement Uncertainty for Construction Materials & Geotechnical Testing Labs (9/13/05) Page 24 of 25
The device to be calibrated is an X/Y recorder with input ranges/division = 1 mV to 5 V DC in 6 ranges.
Source of Uncertainty Value (Divisions) Distribution Type Divisor
Standard Uncertainty ± (Divisions)
Voltage source (standard) 0.01 N B 2 0.005
Readability 0.2 R B 2 3 0.0578
Repeatability 0.1 N A 1 0.10
Hysteresis effects 0.1 R B 3 0.0578
Noise 0.05 R B 3 0.0289
Combined Standard Uncertainty (RSS) = ± 0.13
Coverage Factor, k = 2.23 (See Note 1.) Expanded Uncertainty = 2.23 × 0.13 = ± 0.29 Div.
Note:
1) Repeatability was determined by taking 5 repeat readings in the middle of 5 ranges for a total of 25 readings. To estimate the degrees of freedom of the combined standard uncertainty estimate we again use equation 1:
ν = νA(uc/uA)4 = 4(0.13/0.1)4 ≈ 11.
From table 1, the coverage factor for 11 degrees of freedom is 2.23.
© 2005 by A2LA All rights reserved. No part of this document may be reproduced in any form or by any means without the prior written permission of A2LA.

L:\Requirements\P103d – Annex-Policy on Estimating Measurement Uncertainty for Construction Materials & Geotechnical Testing Labs (9/13/05) Page 25 of 25
References
1) International Organization for Standardization (ISO), Guide to the Expression of Uncertainty in Measurement, Geneva, Switzerland, 1995 (GUM).
2) Singapore Institute of Standards and Industrial Research, Guidelines on the Evaluation and Expression of the Measurement Uncertainty, SINGLAS Technical Guide 1, July1995.
3) ANSI/NCSL Z540-2, US Guide to the Expression of Uncertainty in Measurement, NCSL, Boulder CO, 1998.
4) Adams, T.M., A2LA Guide for the Estimation of Measurement Uncertainty in Testing, July 2002.
5) A2LA Guide for the Estimation of the Uncertainty of Dimensional Calibration and Testing Results, July 2002.
6) UKAS, LAB 21, Calibration and Measurement Traceability for Construction Materials Testing Equipment, Edition 2, October 2000.
7) UKAS, LAB 12, The Expression of Uncertainty in Testing, Edition 1, October 2000. 8) NIST Technical Note 1297, B.N.Taylor and C.E. Kuyatt, Guidelines for Evaluating and
Expressing the Uncertainty of NIST Measurement Results, NIST, Gaithersburg MD.