p QJ:vth:>'L This paper not to be cited without prior ... · from 1.45 to 1.39 mm and 1.44 to 1.38...
28
Ø p L'• QJ:vth:>'L This paper not to be cited without prior reference to the author. International Council for the Exploration of the Sea. C.M., 1981/G:77 Environmental Quality Committee .. VERTICAL DISTRIBUTION OF PELAGIC FISH EGGS IN RELATION TO SPECIES, SPAWNING BEHAVIOUR AND WIND CONDITIONS ABSTRACT by Per Solemdal and Svein Sundby Institute of Marine Research, Bergen, Norway. l. The mean reduction of egg diameter from March to April is from 1.45 to 1.39 mm and 1.44 to 1.38 mm for artificially and naturally spawned eggs of cod, respec- tively. This means a reduction of volume of about 11%. 2. The neutral buoyancy of cod eggs ranges from 29.5-33.0°/oo salinity. Eggs of captive fish show a tendency of higher specific gravity. 3. The neutral buoyancy of the cod eggs is'not correlated to egg size, but to the weight of the eggshel1u 4. Computed ascending velocities in the natural environment -1 l of Lofoten range from 0.2 mm s to 1.7 mm s , and show an approximately Gaussian distribution with a mean/ascending -l speed of l mm s 5. Since the spawning of Arcto-Norwegian cod is strictly connected to the thermoc1ine at temperatures of 4-6°C, spawning can occur both pelagically and close to the bot tom. 6. Norway pout and other gadoids are also spawning in Lofoten, and occasionally their eggs are found in majority. Their vertical distribution have maxima in deeper water, indica- ting a higher specific gravity than for cod eggs.
Transcript of p QJ:vth:>'L This paper not to be cited without prior ... · from 1.45 to 1.39 mm and 1.44 to 1.38...

Ø p L'• QJ:vth:>'L
This paper not to be cited without prior reference to the author.
International Council for the
Exploration of the Sea.
C.M., 1981/G:77
Environmental Quality
Committee ..
VERTICAL DISTRIBUTION OF PELAGIC FISH EGGS
IN RELATION TO SPECIES, SPAWNING BEHAVIOUR
AND WIND CONDITIONS
ABSTRACT
by
Per Solemdal and Svein Sundby
Institute of Marine Research,
Bergen, Norway.
l. The mean reduction of egg diameter from March to April is
from 1.45 to 1.39 mm and 1.44 to 1.38 mm for artificially
and naturally spawned eggs of ~rcto-Norwegian cod, respec
tively. This means a reduction of volume of about 11%.
2. The neutral buoyancy of cod eggs ranges from 29.5-33.0°/oo
salinity. Eggs of captive fish show a tendency of higher
specific gravity.
3. The neutral buoyancy of the cod eggs is'not correlated to
egg size, but to the weight of the eggshel1u
4. Computed ascending velocities in the natural environment -1 l of Lofoten range from 0.2 mm s to 1.7 mm s , and show an
approximately Gaussian distribution with a mean/ascending -l
speed of l mm s
5. Since the spawning of Arcto-Norwegian cod is strictly
connected to the thermoc1ine at temperatures of 4-6°C,
spawning can occur both pelagically and close to the
bot tom.
6. Norway pout and other gadoids are also spawning in Lofoten,
and occasionally their eggs are found in majority. Their
vertical distribution have maxima in deeper water, indica
ting a higher specific gravity than for cod eggs.
7. During calm wind conditions the concentration of cod eggs
increases rapidly towards the sea surface~ Large variation
in the upper centimeters of the sea is found during such
conditionsm Increasing wind rapid1y mixes down the eggs in
the upper meters As the wind speed maintains, larger
parts of the water column are influenced by the wind
mixing. At south-westerly wind of 10 ms 1 and at 24 hours
durat·ion more than 50% of the eggs are found below 30 m
deptho
l. INTRODUCrriON
The vertical distribution of pe1agic fish eggs is influenced by
several factors:
l. The spawning behaviour of the fishu differing from species
to species (depth! spawning period, diurnal cycle etc.).
2. The physical characteristics of the egg (density and
size) e
3. The physical conditions in the sea (wind effects, currents
and density structure).
The data on physical properties of cod eggs'were collected in
Lofoten during the years 1968-72 (Solerndal 1970). The other
aspects were studied during an investigation on monitoring the
cod spawning and drift of the eggs in Lofoten during the years
1975-81 (Ellertsen et al_ in press, a, .Ellertsen et al. 1981,
Furnes and Sundby 1981). This is a part of a project dealing
with growth, survival and drift of the larvae of Arcto-Norwe
gian cod (Ellertsen et al __ in press, a, b, Ellertsen ~t al.
1980, Tilseth and Ellertsen, 1981)
The mechanisms of how egg size and specific gravity adapt to
the salinity environment have been studied both in ·the labo
ratory and in the field (Solemdal, 1967, 1971, 1973, Coombs,
1981 a, b! Alderdice and Forrester 1971) ø The effects of the

- 3
physical conditions on the vertical distribution are demonstra-
ted by Pommeranz (1973) on plaice eggs the southern North
Sea, and Iversen (1973) on mackerel eggs in the Skagerrak and
the northern North Sea. Theoretical contribution to the dynamics
of particle movements in water are given by Hutchinson (1967)
and Smayda (1970) o
The present investigation was carried out
l) To obtain better knowledge of mechanisms governing the
drift and spreading of eggsø
2) To evaluate the significance of wave action on egg morta
lity as proposed by (Rollefsen 1930)
3) To increase our knowledge on the spawning behaviour of
Arcto-Norwegian cod and its influence on the distribution
of the eggse
2. MATERIAL AND METHODS
During the years 1968 72 the fish eggs were collected by Zaitzev
surface sampler, Clarke-Bumpus planktonsampler and a small
Juday net, O.l m2 surface and 180~ mesh size.
Eggs were collected with electrical pumps in 1980 and 1981. A
system for plankton profiling based on a Flygt 2051, a centri
fugal pump with capacity about 350 l/mine, is described in
Tilseth and Ellertsen (1981). The water is filtered on deck.
For sampling the upper centimetres the pump was connected to a
styropor floater (fige 1). At depths between 0.5 and 4 m the
pump was connected to a surface floating buoy. At greater depth
the pump was connected directly to the winch on deck. The other
pump system is based on a fluid filled electric propeller pump,
Pleuger, with a capacity of 2950 l/mine The water is filtered
in situ through a small Juday ne·t fitted to the pump, fig. 2.
When filtration is finished, the system is hauled on deck, the
net washed and the sample collected as from an ordinary Juday
net haul. (Solemdal 1981) o

- 4 =
Running cod females were collect.ed from Danish seine and purse
seine catches in Lofoten. Only a few cod females, 4 5%, will
have runn ing eggs when investiga ted i.nrmedia after capture,
even during the peak of spawning This phenomenon may be attri-
buted to the handling during More likely, it is a
combination of ·the portion spawning and maximurn spawning during
the night
The cod eggs were fertilized irmnediately in a sperm suspension
in surface seawatere Measurements on neutral buoyancy were
performed on the 2-4 cell stage, in waterbath of 4-6°C according
to Solemdal (1971) The measure error is in the order of + o 0.5 /oo Sø
Diameter measurements were made with a Watson-Image-Shearing
Eyepieceø The eggs are grouped in developmental stages on live
eggs in seawa-'cer of 4-6°C, wii:h O o 003 mm accuracy described in
Ellertsen et alo (198l)o
The dry-weights of the eggs were determined by heating to 105°C
until constant weight after washing the eggs in distilled
water. During cooling the sarnples were placed in a dessicater.
The weight of dried eggshells (chorions) was determined by
squeezing the eggs, washing them thoroughly with distilled
water and heating to 105°C to constant weightti In addition to
ship measurement of wind and sea state, wind data from the
meteorological station Skrova have been usedo
3 .. RESULTS
A. Physical properties of eggs from Arcto-Norwegian cod.
During the years 1969-72 cod eggs were sampled in the central
spawning area in Lofoten, usually on HØlla outside Svolvær. The
eggs were sampled during calm and c lose t.o the surface.
The measurements of egg diameters from the 4 years are shown in
fig. 3, with the measurements from March and April separated.
The figure demonstrate the general reduction of egg size with
time during the spawning season
- 5
Reduction in egg size during the spawning season is also
demonstrated on artificially fertilized eggs from cod females
caught at different times during the season, fig. 4.
About 60 eggs from each of ·the 161 females are measured and
the figure shows the frequency of the mean egg diameters.
Values of diameter, standard deviation, diameter range and
numbers for March and April, 1969-1972 are given in table l ..
The extreme values of cod eggs are l 19 nun and l. 62 rrun for
artificially fer·tilized eggs, and l 20-1., 62 mm on naturally
spawned eggso However, the size range within a egg batch from a
single cod female is normally only about Oo06 mm.
Neutral buoyancy from artificially fertilized eggs in Lofoten,
March-April 1969-72, table 2 is larger in April than in March
for all years except for 1969. This year the cod females used
for artificial fertilization were kept upto 14 days in a well
boat. Only the difference in 1972 is statistically significant
on the 0.05 level
In Fig. 5 the neutral buoyancy is plotted against the weight of
the eggshell as % of the total eggweight, measured as dry
weights. The material used is part of the artificially ferti
lized egg material from Lofoten 1970-72.
In fig. 6 the eggsize and corresponding neutral buoyancy of
artificially fertilized eggs from Lofoten in the years 1970-72
are given. The material from 1969 is omitted due to artificial
conditions in the well-boat
Given the salinity of the natural environment, the neutral
buoyancy and the diameter of the eggsJascending speed may be
computed. At the spawning sites in Lofoten the salinity of the
upper 50 m layer, above the halocline, is homogeneous and
rather constant from year to year during the spawning period
(compared to the variations of the neutral buoyancy measurement
of the eggs). Table 3 shows the mean salinity and standard
deviation through the water colomn for the mean year 1936-1977
for March and Aprile

- 6 -
Comparing the neutral buoyancy rneasurements with the mean
salinity of the environment gives a rnean density difference . 3
0.0017g/cm ,.
The ascending speed may be computed by using the so called
Stoke equation when the Reynolds nurnber Re= Ved <0 .. 5 (V is the 11
speed, d the linear dimension of the eggv and J.l the molecular 2 l viscosity)" In this regime speed is proportional to d and 11-.
When Reynolds number exceeds 0,5, viscous forces becorne less
important and the turbulent forces increase In this regime
ascending speed is proportional to d and 11- 1 / 30
Fig. 7 shows the frequency distribution of cornputed ascending
speeds in "na·tural environment n, e "g. the spawning sites in
Lofoten for the rnean year, based on the buoyancy and diameter
measurements presented in fig 6. Mean ascending speed from
this is 0.96rnm/sec However, the standard deviation is rather
large, 0.38mm/sec,.
B Spawning Behaviour
In fig. 8 the temperature profile and vertical distribution of
cod eggs are given, from HØlla, Lofoten, 26 March 1968. There
was dense pelagic shoals of spawning cod in depths of 50-70
metres. Total depth was 120 metres. During the period 23-25
March the wind was easterly 0-3m/sec , increasing on 26 March
to east 6-lOm/secø The figure clearly shows the spawning at 50-
70 metres, the developrnent stages of the eggs being exclusively
2-4 cells, which is a few hours after fertilization
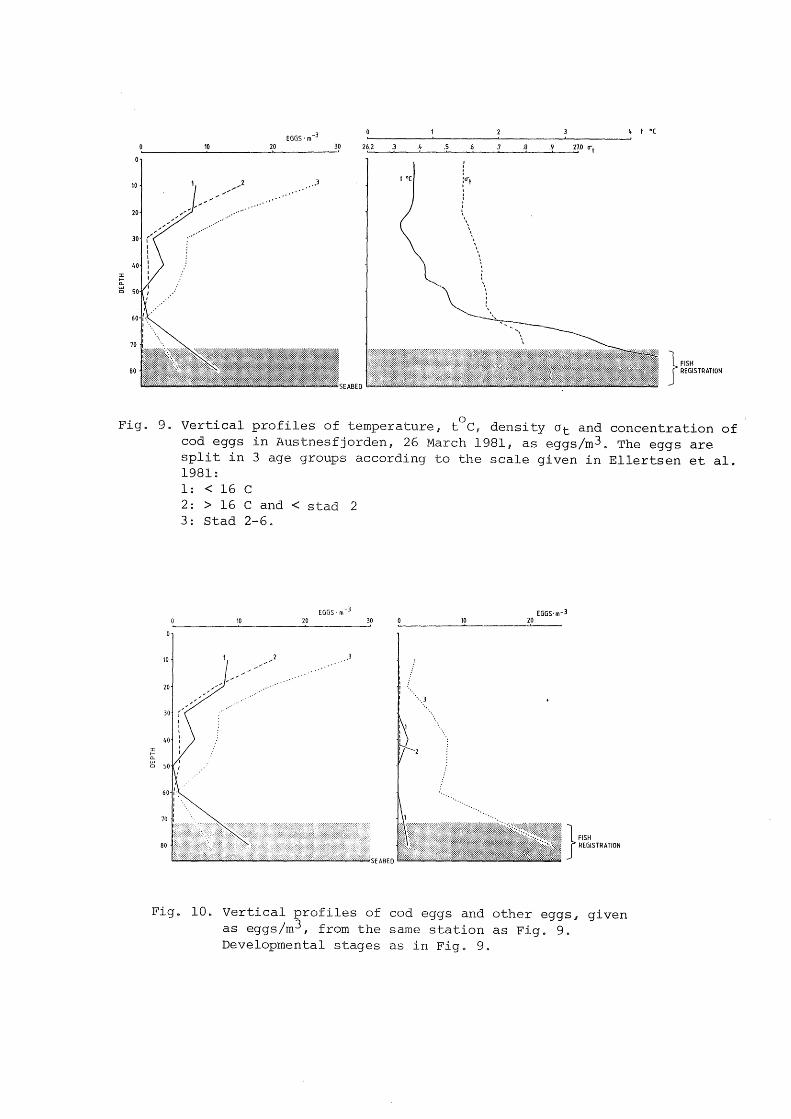
Fig. 9 shows a similar situation with respect to spawning in
Austnesfjorden 27 March 1981 .. There were calm wind conditions
at this time. The vertical profi1e of cod eggs is separated in
3 stages showing high density of newly spawned eggs close to
the bottom where the fish are registeredø The ternperature
profile shows concentrations of cod in the transition layer, 4-
50C, as also shown in fig. 8. The distribution of older cod

- 7 -
eggs is different in the upper layer in Fig. 8 and 9. Fig. 8
show a complicated variation towards sea surface while Fig. 9
show increasing values the sea. face
c. Species differences
Pelagic eggs o·ther than cod are common in the spawning area of
the Arcto-Norwegian cod in Lofoten. most numerous of them
are other gadoids, Norway pout saithe
(Pollachius virens , haddock and whiting
(Merlangus m~rlangus) eggs which are
difficult to separate, and routinous only cod eggs are
identified The amount of "other 11 eggs is more pronounced in
the beginning and at the end of the spawning season of the cod,
which is maximal during last half of March=beginning of April.
Their vertical distribution is different from cod eggs. This is
demonstra·ted in table 4, wh.ich shows -.Juday=net samples from 30-
0 and 100-30, HØlla, Lofoten during 12 27 March 19810 Eggs
other than cod eggs amount to 45% and have a ignificantly
deeper distribution
In fig. 10 the same vertical distribution of cod eggs as shown
in fig. 9. is given together with the vertical distribution of
"other" eggs It is clearly shown that the deve1opment stages
are very differentø The cod eggs are newly spawned c1ose to the
bottom. The 11 other" eggs have advanced distributed near
the bottom, showing that no ascending has occurredQ
According to the analysis of egg samples with a sensitive
electrophoritic method (isoelectric focusing) the majority of
"other" eggs in Austnesfjorden aJc this time, 26-27 March, were
Norway pout. (Jarle Mork, unpub1ished observations)
D. Wind effects
·Wind speed and direction in March 1981 from Skrova, Lofoten are
given in fig. 11 From this figure same stations are selected
to show the effect of wind stress and wave action on the

- 8 -
vertical distribution of cod eggs.
In fig. 12 the vertical distribution on a calm day on HØ11a,
Lofoten, 27 March 1981 is shown, together with density and
temperature profileso The sea surface at this point of time was
slick and very high concentration of cod eggs was measured on
the upper 7 cm of the sea~ However, only two hours later the
concentration in the upper 7 cm has droppped Except for the
surface value the two profiles are rather equal with a rapid
decrease of the egg concentration towards depth. This situation
is simi1ar to that shown in Fig 9o
Fig. 13 shows a profi1e near Henningsvær, Lofoten 28 March
1981. Wind d~rection at this point of time was north-easterly,
and the speed had been increasing to 9 m s-10 The cod eggs are
more or less evenly mixed down to about 30 m deptho This situa
tion is similar to that shown in figs 8c
An indication of how increasing wind speed gradually increased
the vertical mixing is shown in figø 14 This figure is based
on separate Juday net hau1s during the spawning seasons in 1976
and 1977. The abscissa shows the frequen~y of cod eggs older
than 2 days in the deep Juday net hau1s (1oq-3o m). The ordinate
shows the mean wind velocity for the previous 24 hours. Only
situation with south westerly wind has been used to get equal
wave effect.
DISCUSSION
l. The methodso
The method of measuring neutral buoyancy (Solemdal 1971) is
rather roughf with measure error of about ± Ow5°/oo salinity,
as also given by Sundnes et ale (1965) The tests were carried
out on batches of several hundred eggs artificially fertilized,
from individual cod fema1es. Within an egg batch there is a
range of neutral buoyancy of about 1-2 per mille salinity. The
neutral buoyancy is defined as the salinity where no eggs are
floating, but a large fractibn of the eggs are found in the

9
water column after 30 minntes will a.lso a fraction of
live eggs on the bottom of the columna The neutral buoyancy
values are therefore mean
Using artificial fertili
is disputed (Coo~JS 198l}u
eggs to determine neutral buoyancy
that the physiological
stress will alter the of the eggs. Changes in specific
gravity will occur when running females are in water of
different salinities, due t,o osmotic in the ovary
(Solemdal 1967 1971, 1973). After lization the specific
gravity of the eggs is not influenced the external (Solemdal
1973). High specific gravity of cod eggs is also recorded from
cod females kept in normal salin in a well-boat for 14 days
in 1969 (Solemdal 1970). Neutral of more than 34°/oo
from this year are shown in table However, fertilizing eggs
immediately after capture with u soft '1 gears as Danish seine and
purse seine are unlikely to effect the neutral buoyancy of the
eggs. As shown in fig 3 and 4 the size distribution of artifi
cially fertilized and naturally spawned eggs is similar, indica
ting that the artificially fertilized eggs are normal in this
character. Neutral buoyancy tests on naturally spawned eggs
were not carried out due to the rough method and the larger
range in specific gravity of naturally egg batches.
2. Neutral buoyancy0
Fig. 6 does not indicate any correlation between egg size and
neutral buoyancy There seems to be a small increase in neutral
buoyancy from March to April for all except 1969, when
the cod females were kept in a l
The main factor determining the specific gravity of fish eggs
is the thickness of the eggshells (chorion) (LØnning & Solemdal
1972, Solemdal 1973), but the relations of egg size and thick
ness of the eggshells within the cod population are unknown.
Davenport et a~ (in press) values of 65-9~ for the
eggshell in a cod population in Northern Norway, but no data on
egg size are given

10 =
In the present material the weight of eggshells as % of
total dry weight of the egg fig 5 ates a correlation
with neutral buoyancy, but not with egg size Sirnilar values
are found for plaice (Solemdal 1970 b) neutral buoyancy is
not influenced by pressure shown by Sundnes et ale 1965.
The computed ascending speedsv fig 7, are made with the
spawning sites of Lofoten as a reference This is, however, one
of the low salinity areas on coast of Northern Norway.
Other spawning areas of the Arcto-Norwegian Cod have 0.5-1.0 0 /oo higher salinities of the surface waters This will increase
the ascending speed on the average about 20%, while the eggs
with the highest density will have their ascending speed in
creased by more than 100%
3. Egg sizeø
The reduction of egg size during the spawning period is decided
for a number of species (Hiemstra 1962) 0 This is clearly demon
strated both for naturally spawned and artificially fertilized
eggs of Arcto-Norwegian cod in the paper, figs 3 and 4
and table l. The reduction in mean egg volume of the total
material between March and April is the same for artificially
fertilized and naturally spawned eggs 0.18 oon3 or about 11°/o .
The reduction in egg diameter is smallest for artificially
fertilized eggs in 1969 As stated earlier, material for artifi
cial fertilization this year were stripped from cod females
kept in a well-boat, with temperature significanly below the
normal spawning temperatureo As also shown for neutral buoyancy
the values for 1969 are effected by the stressed situation,
table 2o
The reason for the reduced egg size as the spawning proceed is
caused by the portion spawning of the coda Running eggs from
the first spawned portions being the best vascularized and thus
the largest (Mayenne 1941)
In captivity cod female was found to 9 egg portions
during 6 weeks and the e99 diarne·ter was reduced from l o 42 to
1.27 mm (Solerndal et al~ 1977)

- 11
The effect of age and size of the cod
to be small (Solemdal 1970) ~
An increase of the diameter of
on egg size seems
egg l 2 mm (lower
limit) til 1,6 mm (upper limit) wi l the ascending
speed of about 60 , while an in net buoyancy
from OøOOOS g/cm3
(lower limit) to 0.003 g/cm3 (upper limit)
wi11 increase ascending speed of 3 times
4. Spawning behavioure
Echo recordings of pelagic shoals of spawning cod was first
recorded by echo sounding at BØlla, Lofoten in 1934 (Sund
1935) "
The spawning shoa1s of cod are concentrated in the thermoc1ine
4.5-6°C, which fluctuates vertically both annual1y (Eggvin
1932) and during short periods (Ellertsen e~ al~ 1981, Furnes
and Sundby, 1981) The location of the therrnoc1ine therefore
deterrnine both the horizontal and vertical distribution of the
spawning cod in Lofoten In figure 8 the cod are found pe1agi
ca11y at HØ11a during intensive spawning in 50-70 meters depth,
corresponding to the thermoc1ine@ Fig 9 gives a vertica1
profile of the cod eggs temperature and den~i·ty from Austnes
fjorden, a shal1ower small fjord inside Vestfjorden, in March
1981. The thermocline has just moved into Austnesfjorden, and
the cod is found spawning close to the bottorna
The intense spawning will affect the vertical profiles as shown
both in figs. 8 and 9&
4. Species differencesø
During the investigations in March 1981, the fraction of eggs,
other than cod was considerable, table 4 In the deeper part of
HØ1la, the cod eggs wer~ in minority
A vertica1 profile from Austnesfjorden shows a simi1ar distri
bution of eggs other than cod, mostly Norway pout, fig 10. The
deep vertical distribution of the old egg stages indicates a
higher specific gravi than cod eggs. The high concentration

12
of cod eggs close to the bottom in f D 10 is due to the eggs
being just spawned and rising to the . In Vestfjorden
saithe eggs were also in 1
5 .. Wind effects.
While high concentrations of eggs occur in the uppermost
centimeters of the sea during calm , these eggs will
rapidly be mixed down to greater depths wind starts blowing.
As the wind continues or increased larger of the water
column are influenced by the s The time varia-
tions of the concentration of the uppe:.c centimeters seem to be
much larger than the varia·tions at depths This is
probably caused by surface effects such as convergence and
divergence at small scales
Rollefsen (1930) has sugge sted ·that wave action may cause large
egg mortality This is unlikely to occur firs·t because there
is only a relatively small part in the upper meter of the sea
even in calm weather, and second because the eggs rapidly will
be mixed down when the wind starts This is also conclu-
ded by Pommeranz (1973) on plaice eggs in t.he North Sea ..

REFERENCES
ALDERDICE, D.F. and FORRESTER, C.R. (1971): Effects of salinity
and temperature on embryonic development of the
petrale sole, Eopsetta iordani. J. Fish. Res. Bd. Canada,
28: 727-744.
COOMBS, S.H. (1981): A density-gradient column for determining
the spesific gravity of fish eggs, with particular
reference to eggs of the mackerel, Scomber scombrus.
Mar. Biol., 63: 101-106.
COOMBS, S.H., HARDING, D., NICHOLS, J.H. and FOSH, C.A. (1981):
The vertical distribution and buoyancy of eggs of
plaice, Pluronectes platessa L., in the southern
North Sea. ICES CM 1981/G:84. 7 pp. [Mimeo.]
EGGVIN, J. (1932): Vannlagene på fiskefeltene [Hydrographic
conditions on the fishing banks]. Arsberetn. Norg. Fisk.
~932 ~: 90-95 (In norwegian).
ELLERTSEN, B., SOLEMDAL, P., STRØMME, T., TILSETH, S. and
WESTGARD, T. (1980): Same biological aspects of cod
larvae, Gadus morhua L .. Fisk.Dir. Skr. Ser. HavUnders.,
17: 29-47.
ELLERTSEN, B., SOLEMDAL, P., STRØMME, T., SUNDBY, S., TILSETH,
S., WESTGARD, T. and ØIESTAD, V. (In press): Spawning
period, transport and dispersal of eggs from the
spawning area of Arcto-Norwegian Cod, Gadus morhua
L .. Proc. from the Early Life History of Fish Symposium,
Woods Hole USA 2-5 April 1978. (In press)
ELLERTSEN, B., MOKSNESS, E., SOLEMDAL, P., TILSETH, S., WESTGARD,
T. and ØIESTAD, V. (In press): Growth and survival
of cod larvae in an enclosure. Experiments and a
mathematical model. Proc. from the Early Life History of
Fish Symposium, Woods Hole USA 2-5 April 1978. (In
press)

2 -
ELLERTSEN, B., FURNES, G Kø, SOLEMDAL, P. and SUNDBY, S. (1981):
Inf1uence of wind induced currents on the distribution
of cod eggs and zooplankton in Vestfjorden. Proc. from
the Norwegian Coastal Current Symposium, Geilo, Norway,
9-12 Sep 1980 Vol II University of Bergen: 604-628.
FURNES, G .. K. and SUNDBY, S (1981): Upwelling and wind induced
circu1ation iri Vestfjorden. Proc. from the Norwegian
Coastal Current Symposium, Geilo, Norway 9-12 Sep 1980.
Vol Il Universit~ Bergen: 152-177.
HIEMSTRA, W.Hø (1962)~ A correlatidn ta.ble as an aid for
identifying pelagic fish eggs in plankton samp1es.
J. Cons. perm. into Explor@ Mer, 31 (2): 170-195.
HUTCHINSON, G.Eø (1967): A Treatise on Limnology Vol. 2
~ohn Wiley and Sans Inc. New York: 1115 pp.
IVERSEN, S.A. (1973): Utbredelse og mengde av makrellegg
(Scomber scombrus og zoop1ankton i Skagerrak og
nordlige del av NordsjØen i årene 1968 - 1972.
[Distribution and abundance of mackere1 eggs (Scomber
scombrus) and zooplankton in the Skagerrak and
northern parts of the North Sea duTing the year
1968 - 1972.] Candareal. thesis. University of Bergen.
71 pp (In norwegian)
LØNNING, S. and SOLEMDAL, P (1972): The relation between
thickness of chorion and spesific gravity of eggs
from Norwegian and Baltic flatfish populations.
FiskoDire Skre Ser. HavUnders .. , 16: 77-88.
MAYENNE, VøAe, 1940. Uber die Ursachen der Schwankungen in der
Eigrøsse bei den Knochenfischen. Compt. Rend. Dok.
Akada Sei. U SaSoRo 28 (7)

3 -
POMMERANZ, T .. (1973): Das Vorkornmen von Fischeiern, in besonders
von Eiern der Scholle Pleuronectes L .. ), in
den oberfl~chennahen Wasserschichten der slidlichen
Nordsee. Ber .. dta wiss .. 22: 427-
444 ..
ROLLEFSEN, G. (1930): Torskeegg med deformerte fostre ~Cod
eggs with deformed embryos]. Arsberetno vedk. Norg. fisk.,
2: 1-12. (In norwegian)
SMAYDA, I.S. (1970): The suspension and sinking of phytoplankton
in the sea.. o Mar .. Biol 8: 353-
414 ..
SOLEMDAL, P. (1967): The effect of salinity on buoyancy, size
and development of flounder eggse Sarsia, 29: 431-
442.
SOLEMDAL! P. (1970a): Intraspecific variations in size, buoyancy
and growth of eggs and early larvae of Arcto-Norwegian
cod, Gadus morhua L , due to parental and environmental
effectso ICES CM 197 :28. 11 pp [Mimeo.]
SOLEMDAL, P. (1970b): Variations in physical properties of
pelagic eggs in different populations - genetic
aspects. ICES CM 197 :29. 5 ppø [Mimeo.]
SOLEMDAL, P. (1971): Prespawning flounders transferred to
different salinities and the effects on their eggs.
Vie et milieu l, ~uppl. 22: 409-423.
SOLEMDAL, P. (1973): Transfer of Baltic flatfish to a marine
environment and the lang term effects on reproduction.
OIKOS Supp1. 15) 268-276e
SOLEMDAL, P. (1981): Sampling fish 1arvae with large pumpsu
ICES Working_Group on larval fish eco1ogy, Lowestoft,
1-3 July 1981 ..
- 4
SOLEMDAL, P., TILSETH, S., ØIESTAD, Vo, ELLERTSENv B., SUNDBY,
S., WESTGARD, T and STRØMMEP Tø (1977): Torskelarvens
første næringsopptak [First feeding of cod larvae].
~rsrapp. til NFFR 1977o 108 pp (In norwegian)
SUND, O. (1935): Echo sounding in fishery research. Nature
135: P 953u
SUNDNES, G , LEIVESTAD, H and IVERSENv Oø (1965): Buoyancy
determination of eggs from cod, Gadus morhua L.,
Je Cons. permo intø EXQ1or. Mer., 29: 245-252.
TILSETH, S. and ELLERTSEN, B (1981) The detection of larval
fish food particles by an in si~u particle counter,
and monitoring of the particle density and distribution
of first feeding areas. ICES CM 198 :15. 17 ppa
[Mimeo ]

Fig. l. Pump arrangement for sampling eggs from the top centimeters of the sea. l) Styropor floater. 2) Flygt pump.
Fig. 2. The submersible Pleuger pump and the arrangement of filtrating water through a small Juday net in situ.

120
BO
40
o
40
o
(j) 40 t6 w o o o u 40 LL o a:: o w en 2 :::J 160 z
120
80
40
o
240
200
160
120
80
40
1969
1971
1972
1969-72
1969-72
O MARCH IITJ APRIL
DMARCH lE APRIL
OMARCH EI APRIL
DMARCH Ø APRIL
O MARCH æ APRIL.
Neggs = 2017
o~~~~~~~~~~~~-~~~~~~~~ 1.20 1.24 1.28 1.32 1.36 1.40 1M 1.48 1.52 1.56 1.60
EGG DIAMETER(MM)
Fig. 3. Egg diameter of cod eggs sampled close to the surface in Lofoten during March and April 1969-1972.

8
6
4 2
1969 O MARCH ID APRIL
04---------~~~~~~~~~~~~~----------------
2 OMARCH 1970 mJAPRIL
o+-~~-B~~~~m-~UL~~~~~~~--~------~~--~
6
4 2
1971 O MARCH IJAPRIL
04-------~~~~--~~~~~~_w~~~~--~-----------
6
4 2
OMARCH 1972 æ APRIL
0~---&~--~~~~W---~~wu~~L-------------------
tf)
w _, ~ ::2: .w 16 LL
o 14
8 12
~ 10
0::: 8 w co 6 s 4 z
2
0 MARCH 1969-1972 f!1 APRIL
o~~-Æ~~~~~~~~~~~~~~~~~~-----------
24
22 20
18
16
1 4
12
10
8 6 4 2
1969-1972
N egg= 1003 8
Nw = 161
o~~~~~~r-Y-~~~-Y-Y~~~~~~~~-----------
1.25 1.29 1.33 1.37 1.41 1.45 149 1.53 157 EGG DIAMETER (MM)
Fig. 4. Egg diameter of artificially fertilized cod eggs from Arcto-Norwegian cod females caught in Lofoten during March and April 1969-72. About 60 eggs were measured from each of the 161

35
34
1-:c l!:)
w 3: >-0:: Cl ...J <( l-
30
~ 25 lL o
'fl. ...J • ...J l.U :c Vl l!:) l!:) 1.1..1
~ 20 1-:c l!:)
w 3:
30
X X X
X
NEUTRAL BUOYANCY %oS
Fig. 5. Neutral buoyancy of artificially fertilized eggs of Arcto-Norwe4ian cod with corresponding weights of their eggshell, expressed as % dry weight of eggshell to the total dry weight of the egg.
o Fig. 6. Neutral buoyancy, expressed as /oo salinity, and volume of artificially
fertilized eggs of Arcto--Norwegian cod in Lofoten from the years 1970-72.

1
N = 62
mm·
Fig. 7. Distribution of computed ascending speeds in the natural environment (Lofoten).
TEMPERA TURE, o C 2 3 4 5
0+-~L-~L-~--~---L--~--~--~--~------6 7 8 9 10 11 12
10 20 30 40 50 60 70 80 90
100 11 o 120 130 140 150
o
{A)
NUMBER OF COD EGGS/M3 25 50 75 100 125 150 175 200 225 250 275
o~--~~L--J~~--~--~--~--~--~--~---
10 20 ;
30 40 50 60
:L ' 70 ~ 80 fu 90 o 100
110 120
(8)
Fig. 8. Vertical profiles of temperature and concentrations of cod eggs the 26 March 1968 on BØlla, Lofoten. The dense fish registrations at 50-70 metres depth are not shown on the figure. Dotted line represents cod eggs at 2-4 cell stage, the unbroken line is the total egg concentration.
:I: fa. Cl
10 20 30 26.2 .3 .4 .5
4 t •c
.6 .O .9 27.0 ert
}
FISH REGISTRATION
Fig. 9. Vertical profiles of temperature, t°C, density Ot and concentration of cod eggs in Austnesfjorden, 26 March 1981, as eggs/m3. The eggs are split in 3 age groups according to the scale given in Ellertsen et al. 1981:
:I: fn. Cl
l: < 16 c 2 : > 16 C and < stad 2 3: Stad 2-6.
EGGS·m- 3
10 20 30 10 EGGS· m-3
20
}
FISH REGISTRATION
Fig. 10. Vertical profiles of cod eggs and other eggs, given as eggs/m3, from the same station as Fig. 9. Developmental stages as in Fig~ 9.

N l
200
150
~ 100 E
24 15 26
SI\ROVA FYR
27 28
MARCH i9B·J
29 30
f\j\\\l\\\\\\\1 NE - N W
Ot~E
31
Fig. 11. u2 (where U is the wind speed) at meteoro1ogica1
station Skrova, Lofoten for the period 24-31 March 1980. Different shading indicate wind direction.
Eggs/m3 26.30 26.40 2 6.50 26.60 26.70 26.80 26.90
O O 100 200 300 L,OO 500 600 4700 4BOO
=r--==t~ o cr't
+---------~--------~---------3~.0 toe o 1.0 2.0
l l
1630 HOURS t 0( :()t
10 l
10
l 20 \
' \ l
30
40
50
Eggs/ m3
01o ___ 1~9o ___ 2~p_o __ 3~2~o __ w~,_o __ _
~ 1 ~ 1915 HOURS
~2 "' o
Fig. 12. Vertica1 distribution of cod eggs, number/m3
temperature, t°C, and density, o, at HØ11a 27 March 1981 1630-1930 hours during a ca1m period (s~e Fig. 11).

Eggs/ m3 26.30 26.40 26.50 26.60 26.70 26.80
00 20 40 60 80 100 o 05 i i o <Y't
&-Ad. 0-' ----,-__j_ \°C
------""
l l
/ t 0( lo-t
j l 10
\ 10 l
20 20 A
l 30 30 E / _c~
15. l
~40
l 40 'l
l
\ l
50 l
50 .... l
Fig. 13. Vertical distribution of cod eggs, number/m3
, temperature, t°C, and density, Ot at Henningsvær 28 March 1981 1630 hours after 3-4 hours duration of north-easterly wind of 9 ms-l. (See Fig. 11).
u L.U I.l)
15
10
5
• • •
•
Fig. 14. Frequency egg number (2 days and older) in the deep Juday net hawl (100-30 m) compared to the total egg number (100~0 m) at BØlla as a function of the mean wind speed for the previous 24 hours at meteorological station Skrova. All events inc1ude south
westerly wind direction.

Table l. Data on egg diameter from natura1 spawned eggs (N) and artificially fertilized eggs (A) from March and April 1969-72, Lofoten.
Artificially Year ferti1ized March April
(A) il
Natural1y Di am. Rangel, /mm
Nos. Nos. Diam. Nos. Nos. SD SD Range, mm
spawned (N) mm eggs mm eggs
1969 A 1.43 +0.04 L. 33-l. 53 4239 37 1.41 +0.05 1.33-1.53 2759 26 - -N 1.45 +O. 05 1.35-1.58 148 - 1 .. 39 +0.05 1.25-1.57 714 -
1970 A 1.44 +0.06 1.31-1.51 856 lO 1.36 +0.07 1.25-1.55 564 23
N 1.40 +0~05 1.26-1.53 264 - 1.36 +0.07 1.20-1.52 146 -
1971 A 1 .. 49 +0.05 1.41-1.59 629 23 1.37 +0.05 1.31-1 .. 43 276 12
N 1.46 +O o 05 1.35-1.63 218 - 1.39 +0.04 1.34-1.50 117 -
1972 A 1.44 +0.05 1.37-1.51 348 15 1.38 +0.06 1.27-1.47 367 15 -N 1o43 +0.05 1.26-1.55 213 - 1.38 +0.06 1.25-1.53 194 - -
Mean A 1.45 +0.05 1.31-1.59 6072 85 1.39 +0.06 1.25-1.55 3966 76 - -1969-72
N 1.44 +0.05 1.26-1.63 843 - 1.38 +0.06 1.20-1.57 1171

Table 2. Neutral buoyancy from batches of artificially fertilized eggs of 52 Arcto-Norwegian cod females from March and April 1969-72.
1969 o
/oo S
SD(n)
Range
1970 o
/oo S
SD(n)
Range
1971 o
/oo S
SD(n)
Range
1972 o
/oo S
SD(n)
Range
The mean values are calculated on the basis of the 1970-72 material.
March
31,47
+ 1.212(20)
29.48-34.20
30.52
.±_0.488(5)
29.73-31.01
31.81
+0.482(6)
30.97-32.53
30.60
+0.679(12)
29.43-31.57
April
31,06
.±_0.669(33)
29.70-32.75
30.89
.±_0.650(11)
29.86-31.97
32.12
+1.056(6)
31.03-33.06
31.26
.±_0.709(12)
29.86-32.15
Mean 1970-72 o
/oo S
Range
30 90
29.43-32.53(23)
31.30
29.86-33.06(29)
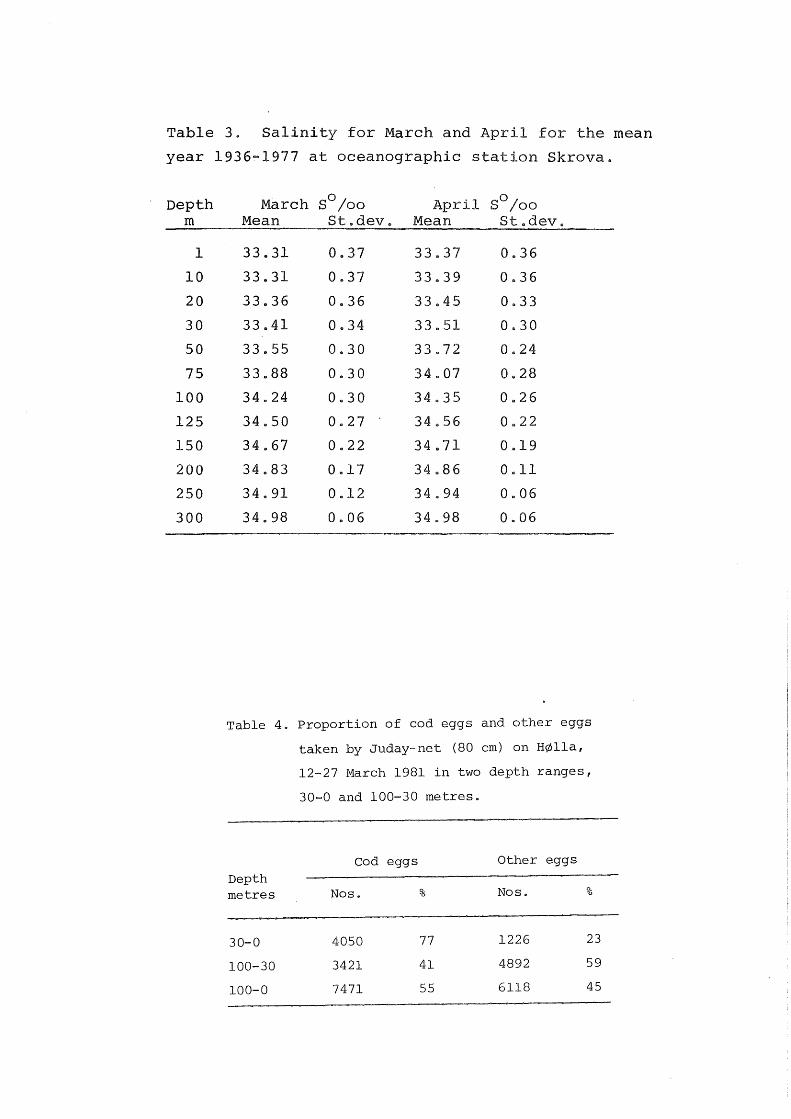
Tab le 3. Salinity for March and April for the mean
year 1936-1977 at oceanographic stat ion Skrova.
Depth m
l
lO
20
30
50
75
100
125
150
200
250
300
March o S /oo April o S /oo
Mean St.dev. Mean St.dev.
33.31 0.37 33a37 0.36
33.31 0.37 33 .. 39 0.36
33.36 0 .. 36 33 .. 45 0.33
33.41 0.34 33 .. 51 0.30
33 .. 55 0.30 33.72 0.24
33.88 0.30 34.07 0 .. 28
34 .. 24 0.30 34.35 0.26
34.50 0 .. 27 34.56 Oe22
34.67 0.22 34.71 0.19
34.83 0.17 34 .. 86 0.11
34.91 0 .. 12 34 .. 94 0.06
34.98 0.06 34 .. 98 0.06
Table 4. Proportion of cod eggs and other eggs
taken by Juday-net (80 cm) on BØlla,
12-27 March 1981 in two depth ranges,
30-0 and 100-30 metres.
C od eggs Other eggs
Depth metres Nos. % Nos. %
30-0 4050 77 1226 23
100-30 3421 41 4892 59
100-0 7471 55 6118 45

1
1
1
1
1
1
1
1
1
1
1
1
1
1
1
1
1
1
1
1
1
1
1
1
1
1
1
1
1
1
1
1
1
1
1
1
1
1
1
1
1
1
1
1
1
1
1
1
1
1
1
1
1
1
1
1
1
1
1
1
1
1
1
1
1
1
1
1
1
1
1
1
1