P. H. Glatfelter Company · Total current assets 547,018 502,690 Plant, ... P. H. Glatfelter...
36
UNITED STATES SECURITIES AND EXCHANGE COMMISSION WASHINGTON, D.C. 20549 FORM 10-Q or For the quarterly period ended June 30, 2011 Commission file number 1-3560 P. H. Glatfelter Company (Exact name of registrant as specified in its charter) N/A (Former name or former address, if changed since last report) Indicate by check mark whether the registrant (1) has filed all reports required to be filed by Section 13 or 15(d) of the Securities Exchange Act of 1934 during the preceding 12 months (or for such shorter period that the registrant was required to file such reports), and (2) has been subject to such filing requirements for at least the past 90 days. Yes No . Indicate by check mark whether the registrant has submitted electronically and posted on its corporate Web site, if any, every Interactive Data File required to be submitted and posted pursuant to Rule 405 of Regulation S-T (§232.405 of this chapter) during the preceding 12 months (or for such shorter period that the registrant was required to submit and post such files). Yes No . Indicate by check mark whether the registrant is a large accelerated filer, an accelerated filer, or a non-accelerated filer. See definition of “accelerated filer and large accelerated filer” in Rule 12b-2 of the Exchange Act. Indicate by check mark whether the registrant is a shell company (as defined in Rule 12b-2 of the Exchange Act) Yes No . As of July 31, 2011, P. H. Glatfelter Company had 45,715,354 shares of common stock outstanding. QUARTERLY REPORT PURSUANT TO SECTION 13 OR 15(d) OF THE SECURITIES EXCHANGE ACT OF 1934 TRANSITION REPORT PURSUANT TO SECTION 13 or 15(d) OF THE SECURITIES EXCHANGE ACT OF 1934 FOR THE TRANSITION PERIOD from ______ to ______ Pennsylvania (State or other jurisdiction 23-0628360 of incorporation or organization) (IRS Employer Identification No.) 96 South George Street, Suite 500 York, Pennsylvania 17401 (717) 225-4711 (Address of principal executive offices) (Registrant’s telephone number, including area code) Large accelerated filer Accelerated filer Non-accelerated filer (Do not check if a smaller reporting company) Smaller reporting company
Transcript of P. H. Glatfelter Company · Total current assets 547,018 502,690 Plant, ... P. H. Glatfelter...

UNITED STATES SECURITIES AND EXCHANGE COMMISSION
WASHINGTON, D.C. 20549
FORM 10-Q
or
For the quarterly period ended June 30, 2011
Commission file number 1-3560
P. H. Glatfelter Company (Exact name of registrant as specified in its charter)
N/A (Former name or former address, if changed since last report)
Indicate by check mark whether the registrant (1) has filed all reports required to be filed by Section 13 or 15(d) of the Securities Exchange Act of 1934 during the preceding 12 months (or for such shorter period that the registrant was required to file such reports), and (2) has been subject to such filing requirements for at least the past 90 days. Yes � No � .
Indicate by check mark whether the registrant has submitted electronically and posted on its corporate Web site, if any, every Interactive Data File required to be submitted and posted pursuant to Rule 405 of Regulation S-T (§232.405 of this chapter) during the preceding 12 months (or for such shorter period that the registrant was required to submit and post such files). Yes � No �.
Indicate by check mark whether the registrant is a large accelerated filer, an accelerated filer, or a non-accelerated filer. See definition of “accelerated filer and large accelerated filer” in Rule 12b-2 of the Exchange Act.
Indicate by check mark whether the registrant is a shell company (as defined in Rule 12b-2 of the Exchange Act) Yes � No � .
As of July 31, 2011, P. H. Glatfelter Company had 45,715,354 shares of common stock outstanding.
� QUARTERLY REPORT PURSUANT TO SECTION 13 OR 15(d) OF THE SECURITIES EXCHANGE ACT OF 1934
� TRANSITION REPORT PURSUANT TO SECTION 13 or 15(d) OF THE SECURITIES EXCHANGE ACT OF 1934 FOR THE TRANSITION PERIOD from ______ to ______
Pennsylvania
(State or other jurisdiction 23-0628360of incorporation or organization) (IRS Employer Identification No.)
96 South George Street, Suite 500
York, Pennsylvania 17401 (717) 225-4711(Address of principal executive offices) (Registrant’s telephone number, including area code)
Large accelerated filer �
Accelerated filer � Non-accelerated filer �
(Do not check if a smaller reporting company) Smaller reporting company �

P. H. GLATFELTER COMPANY AND SUBSIDIARIES REPORT ON FORM 10-Q
For the QUARTERLY PERIOD ENDED
JUNE 30, 2011
Table of Contents Page
PART I — FINANCIAL INFORMATION
Item 1 Financial Statements
Condensed Consolidated Statements of Income for the three months and six months ended June 30, 2011 and
2010 (unaudited) 2 Condensed Consolidated Balance Sheets as of June 30, 2011 and December 31, 2010 (unaudited) 3 Condensed Consolidated Statements of Cash Flows for the six months ended June 30, 2011 and 2010 (unaudited) 4 Notes to Condensed Consolidated Financial Statements (unaudited) 5
Item 2 Management’s Discussion and Analysis of Financial Condition and Results of Operations 23
Item 3 Quantitative and Qualitative Disclosures About Market Risks 32
Item 4 Controls and Procedures 32 PART II — OTHER INFORMATION
Item 6 Exhibits 33 SIGNATURES 33
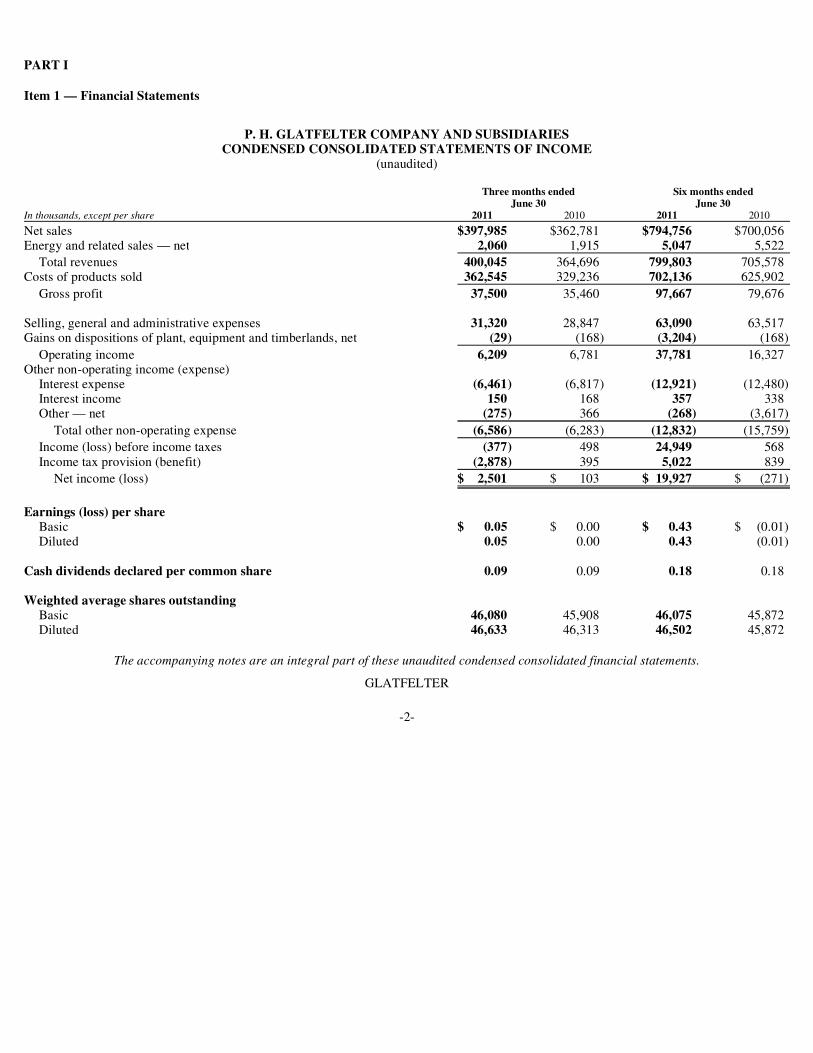
PART I
Item 1 — Financial Statements
P. H. GLATFELTER COMPANY AND SUBSIDIARIES CONDENSED CONSOLIDATED STATEMENTS OF INCOME
(unaudited)
The accompanying notes are an integral part of these unaudited condensed consolidated financial statements.
GLATFELTER
-2-
Three months ended
June 30 Six months ended
June 30In thousands, except per share 2011 2010 2011 2010
Net sales $397,985 $362,781 $794,756 $700,056Energy and related sales — net 2,060 1,915 5,047 5,522
Total revenues 400,045 364,696 799,803 705,578Costs of products sold 362,545 329,236 702,136 625,902
Gross profit 37,500 35,460 97,667 79,676 Selling, general and administrative expenses 31,320 28,847 63,090 63,517Gains on dispositions of plant, equipment and timberlands, net (29) (168) (3,204) (168)
Operating income 6,209 6,781 37,781 16,327Other non-operating income (expense)
Interest expense (6,461) (6,817) (12,921) (12,480)Interest income 150 168 357 338Other — net (275) 366 (268) (3,617)
Total other non-operating expense (6,586) (6,283) (12,832) (15,759)
Income (loss) before income taxes (377) 498 24,949 568Income tax provision (benefit) (2,878) 395 5,022 839
Net income (loss) $ 2,501 $ 103 $ 19,927 $ (271)
Earnings (loss) per share
Basic $ 0.05 $ 0.00 $ 0.43 $ (0.01)Diluted 0.05 0.00 0.43 (0.01)
Cash dividends declared per common share 0.09 0.09 0.18 0.18 Weighted average shares outstanding
Basic 46,080 45,908 46,075 45,872Diluted 46,633 46,313 46,502 45,872

P. H. GLATFELTER COMPANY AND SUBSIDIARIES CONDENSED CONSOLIDATED BALANCE SHEETS
(unaudited)
The accompanying notes are an integral part of these unaudited condensed consolidated financial statements.
GLATFELTER
-3-
June 30 December 31In thousands 2011 2010
Assets Current assets Cash and cash equivalents $ 108,296 $ 95,788Accounts receivable — net 162,268 141,208Inventories 221,661 201,077Prepaid expenses and other current assets 54,793 64,617
Total current assets 547,018 502,690 Plant, equipment and timberlands — net 623,798 608,170 Other assets 229,772 230,887
Total assets $1,400,588 $1,341,747
Liabilities and Shareholders’ Equity
Current liabilities Short-term debt $ — $ 798Accounts payable 120,684 98,594Dividends payable 4,180 4,190Environmental liabilities 250 248Other current liabilities 105,658 109,316
Total current liabilities 230,772 213,146 Long-term debt 332,565 332,224 Deferred income taxes 108,766 94,918 Other long-term liabilities 143,263 149,017
Total liabilities 815,366 789,305 Commitments and contingencies — — Shareholders’ equity Common stock 544 544Capital in excess of par value 49,694 48,145Retained earnings 760,992 749,453Accumulated other comprehensive loss (98,288) (121,247)
712,942 676,895Less cost of common stock in treasury (127,720) (124,453)
Total shareholders’ equity 585,222 552,442
Total liabilities and shareholders’ equity $1,400,588 $1,341,747

P. H. GLATFELTER COMPANY AND SUBSIDIARIES CONDENSED CONSOLIDATED STATEMENTS OF CASH FLOWS
(unaudited)
The accompanying notes are an integral part of these unaudited condensed consolidated financial statements.
GLATFELTER
-4-
Six months ended June 30In thousands 2011 2010
Operating activities Net income (loss) $ 19,927 $ (271)Adjustments to reconcile to net cash provided by operations:
Depreciation, depletion and amortization 34,257 32,166Amortization of debt issue costs and original issue discount 1,331 1,438Pension expense, net of unfunded benefits paid 3,733 4,397Deferred income tax provision (benefit) 9,916 (5,776)Gains on dispositions of plant, equipment and timberlands, net (3,204) (168)Share-based compensation 2,860 2,963Cellulosic biofuel and alternative fuel mixture credits 17,833 54,880
Change in operating assets and liabilities Accounts receivable (18,426) (17,522)Inventories (16,647) (343)Prepaid and other current assets (8,685) (5,492)Accounts payable 18,263 27,988Accruals and other current liabilities (4,928) (12,559)Other (7,917) 974
Net cash provided by operating activities 48,313 82,675 Investing activities Expenditures for purchases of plant, equipment and timberlands (27,877) (15,445)Proceeds from disposals of plant, equipment and timberlands, net 3,440 182Acquisition of Concert Industries Corp., net of cash acquired — (229,080)
Net cash used by investing activities (24,437) (244,343) Financing activities Proceeds from $100 million 71/8% note offering, net of original issue discount — 95,000Payments of note offering and credit facility costs — (4,530)Net borrowings of revolving credit facility — —Net borrowings (repayments) of short term debt (798) 2,016Repayment of 2011 Term Loan — (14,000)Payments of dividends (8,396) (8,360)Repurchase of common stock (4,369) —Proceeds from stock options exercised and other 117 110
Net cash provided (used) by financing activities (13,446) 70,236
Effect of exchange rate changes on cash 2,078 (1,361)
Net increase (decrease) in cash and cash equivalents 12,508 (92,793)Cash and cash equivalents at the beginning of period 95,788 135,420
Cash and cash equivalents at the end of period $108,296 $ 42,627
Supplemental cash flow information Cash paid (received) for
Interest $ 11,551 $ 11,530Income taxes (10,906) (45,509)

P. H. GLATFELTER COMPANY AND SUBSIDIARIES NOTES TO CONDENSED CONSOLIDATED FINANCIAL STATEMENTS
(unaudited)
GLATFELTER
-5-
1. ORGANIZATION
P. H. Glatfelter Company and subsidiaries (“Glatfelter”) is a manufacturer of specialty papers and fiber-based engineered materials. Headquartered in York, Pennsylvania, our manufacturing facilities are located in Spring Grove, Pennsylvania; Chillicothe and Freemont, Ohio; Gatineau, Quebec, Canada; Gloucestershire (Lydney), England; Caerphilly, Wales, Gernsbach and Falkenhagen, Germany; Scaër, France; and the Philippines. Our products are marketed worldwide, either through wholesale merchants, brokers and agents or directly to customers.
2. ACCOUNTING POLICIES
Basis of Presentation The unaudited condensed consolidated financial statements (“financial statements”) include the accounts of Glatfelter and its wholly owned subsidiaries. All intercompany balances and transactions have been eliminated.
We prepared these financial statements in accordance with accounting principles generally accepted in the United States of America (“generally accepted accounting principles” or “GAAP”). In our opinion, the financial statements reflect all normal, recurring adjustments needed to present fairly our results for the interim periods. When preparing these financial statements, we have assumed that you have read the audited consolidated financial statements included in our 2010 Annual Report on Form 10-K (“2010 Form 10-K”).
Accounting Estimates The preparation of financial statements in conformity with GAAP requires management to make estimates and assumptions that affect the reported amounts of assets and liabilities and disclosures of contingencies as of the balance sheet date and the reported amounts of revenues and expenses during the reporting period. Management believes the estimates and assumptions used in the preparation of these financial statements are reasonable, based upon currently available facts and known circumstances, but recognizes that actual results may differ from those estimates and assumptions.
Financial Derivatives and Hedging Activities We use financial derivatives to manage exposure to changes in foreign currencies. In accordance with Financial Accounting Standards Board Accounting Standards Codification 815 Derivatives and Hedging (“ASC 815”), we record all derivatives on the balance sheet at fair
value. The accounting for changes in the fair value of derivatives depends on the intended use of the derivative, whether we have elected to designate a derivative in a hedging relationship and apply hedge accounting, and whether the hedging relationship has satisfied the criteria necessary to apply hedge accounting.
Cash Flow Hedges The effective portion of the gain or loss on derivative instruments designated and qualifying as a hedge of the exposure to variability in expected future cash flows related to forecasted transactions is deferred and reported as a component of accumulated other comprehensive income (loss). Deferred gains or losses are reclassified to our results of operations at the time the hedged forecasted transaction is recorded in our results of operations. The effectiveness of cash flow hedges is assessed at inception and quarterly thereafter. If the instrument becomes ineffective or it becomes probable that the originally-forecasted transaction will not occur, the related change in fair value of the derivative instrument is also reclassified from accumulated other comprehensive income (loss) and recognized in earnings.
3. ACQUISITION
On February 12, 2010, we completed the acquisition of all the issued and outstanding stock of Concert Industries Corp. (“Concert”), a manufacturer of highly absorbent cellulose based airlaid non-woven materials, for cash totaling $231.1 million based on the currency exchange rates on the closing date, and net of post-closing working capital adjustments. Concert has operations located in Gatineau, Quebec, Canada and Falkenhagen, Brandenburg, Germany. Annual revenues totaled $203.0 million in 2009.
Concert manufactures highly absorbent cellulose based airlaid non-woven materials used in products such as feminine hygiene and adult incontinence products, pre-moistened cleaning wipes, food pads, napkins and tablecloths, and baby wipes. The acquisition of Concert affords us the opportunity to grow with our customers who are the industry leaders in feminine hygiene and adult incontinence products. We believe that our acquisition of Concert provides us with an industry-leading global business that sells highly specialized, engineered fiber-based materials to niche markets with substantial barriers to entry.
GLATFELTER
-6-
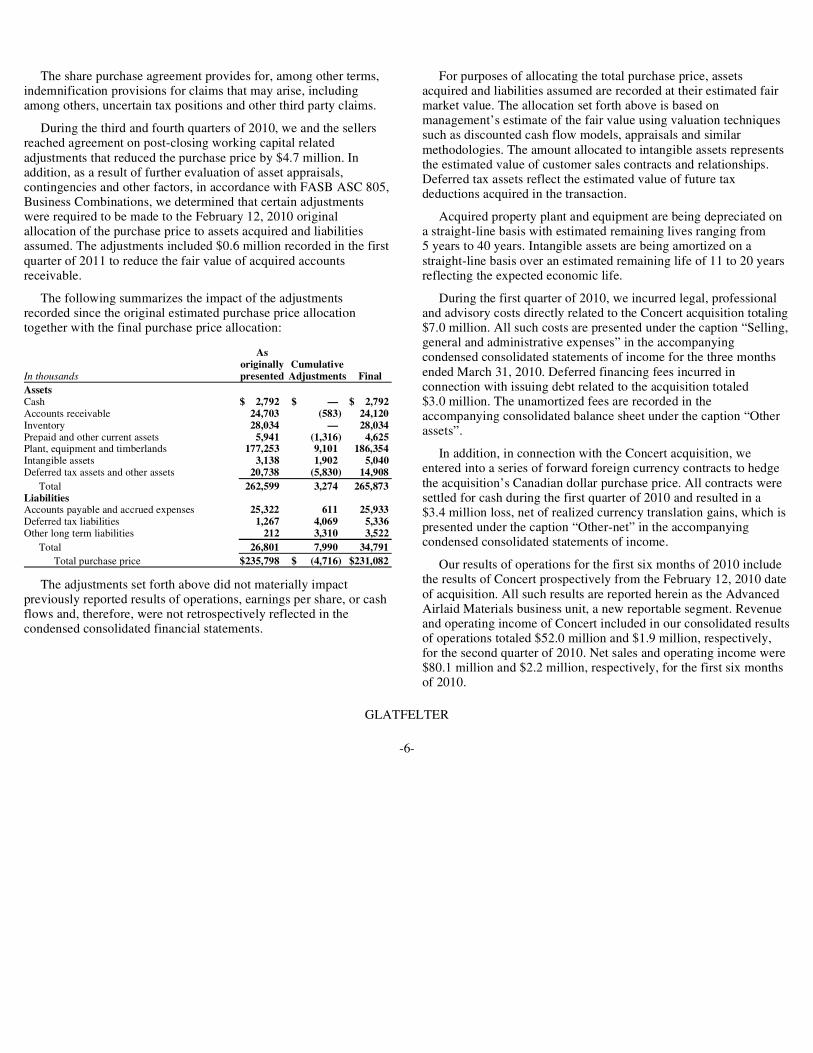
The share purchase agreement provides for, among other terms, indemnification provisions for claims that may arise, including among others, uncertain tax positions and other third party claims.
During the third and fourth quarters of 2010, we and the sellers reached agreement on post-closing working capital related adjustments that reduced the purchase price by $4.7 million. In addition, as a result of further evaluation of asset appraisals, contingencies and other factors, in accordance with FASB ASC 805, Business Combinations, we determined that certain adjustments were required to be made to the February 12, 2010 original allocation of the purchase price to assets acquired and liabilities assumed. The adjustments included $0.6 million recorded in the first quarter of 2011 to reduce the fair value of acquired accounts receivable.
The following summarizes the impact of the adjustments recorded since the original estimated purchase price allocation together with the final purchase price allocation:
The adjustments set forth above did not materially impact previously reported results of operations, earnings per share, or cash flows and, therefore, were not retrospectively reflected in the condensed consolidated financial statements.
As originally Cumulative In thousands presented Adjustments Final
Assets Cash $ 2,792 $ — $ 2,792Accounts receivable 24,703 (583) 24,120Inventory 28,034 — 28,034Prepaid and other current assets 5,941 (1,316) 4,625Plant, equipment and timberlands 177,253 9,101 186,354 Intangible assets 3,138 1,902 5,040 Deferred tax assets and other assets 20,738 (5,830) 14,908
Total 262,599 3,274 265,873Liabilities Accounts payable and accrued expenses 25,322 611 25,933 Deferred tax liabilities 1,267 4,069 5,336 Other long term liabilities 212 3,310 3,522
Total 26,801 7,990 34,791
Total purchase price $235,798 $ (4,716) $231,082
For purposes of allocating the total purchase price, assets acquired and liabilities assumed are recorded at their estimated fair market value. The allocation set forth above is based on management’s estimate of the fair value using valuation techniques such as discounted cash flow models, appraisals and similar methodologies. The amount allocated to intangible assets represents the estimated value of customer sales contracts and relationships. Deferred tax assets reflect the estimated value of future tax deductions acquired in the transaction.
Acquired property plant and equipment are being depreciated on a straight-line basis with estimated remaining lives ranging from 5 years to 40 years. Intangible assets are being amortized on a straight-line basis over an estimated remaining life of 11 to 20 years reflecting the expected economic life.
During the first quarter of 2010, we incurred legal, professional and advisory costs directly related to the Concert acquisition totaling $7.0 million. All such costs are presented under the caption “Selling, general and administrative expenses” in the accompanying condensed consolidated statements of income for the three months ended March 31, 2010. Deferred financing fees incurred in connection with issuing debt related to the acquisition totaled $3.0 million. The unamortized fees are recorded in the accompanying consolidated balance sheet under the caption “Other assets”.
In addition, in connection with the Concert acquisition, we entered into a series of forward foreign currency contracts to hedge the acquisition’s Canadian dollar purchase price. All contracts were settled for cash during the first quarter of 2010 and resulted in a $3.4 million loss, net of realized currency translation gains, which is presented under the caption “Other-net” in the accompanying condensed consolidated statements of income.
Our results of operations for the first six months of 2010 include the results of Concert prospectively from the February 12, 2010 date of acquisition. All such results are reported herein as the Advanced Airlaid Materials business unit, a new reportable segment. Revenue and operating income of Concert included in our consolidated results of operations totaled $52.0 million and $1.9 million, respectively, for the second quarter of 2010. Net sales and operating income were $80.1 million and $2.2 million, respectively, for the first six months of 2010.
GLATFELTER
-7-
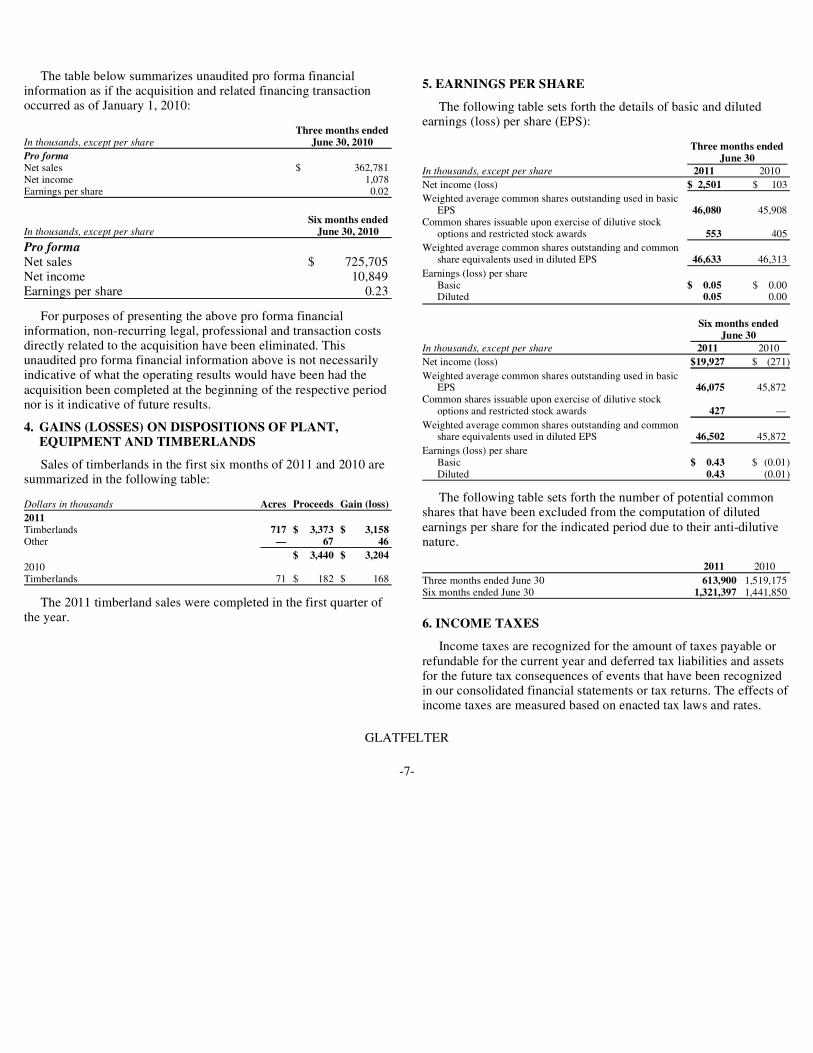
The table below summarizes unaudited pro forma financial information as if the acquisition and related financing transaction occurred as of January 1, 2010:
For purposes of presenting the above pro forma financial information, non-recurring legal, professional and transaction costs directly related to the acquisition have been eliminated. This unaudited pro forma financial information above is not necessarily indicative of what the operating results would have been had the acquisition been completed at the beginning of the respective period nor is it indicative of future results.
Sales of timberlands in the first six months of 2011 and 2010 are summarized in the following table:
The 2011 timberland sales were completed in the first quarter of the year.
Three months endedIn thousands, except per share June 30, 2010
Pro forma Net sales $ 362,781Net income 1,078Earnings per share 0.02
Six months endedIn thousands, except per share June 30, 2010
Pro forma Net sales $ 725,705Net income 10,849Earnings per share 0.23
4. GAINS (LOSSES) ON DISPOSITIONS OF PLANT, EQUIPMENT AND TIMBERLANDS
Dollars in thousands Acres Proceeds Gain (loss)
2011 Timberlands 717 $ 3,373 $ 3,158Other — 67 46
$ 3,440 $ 3,204 2010 Timberlands 71 $ 182 $ 168
5. EARNINGS PER SHARE
The following table sets forth the details of basic and diluted earnings (loss) per share (EPS):
The following table sets forth the number of potential common shares that have been excluded from the computation of diluted earnings per share for the indicated period due to their anti-dilutive nature.
6. INCOME TAXES
Income taxes are recognized for the amount of taxes payable or refundable for the current year and deferred tax liabilities and assets for the future tax consequences of events that have been recognized in our consolidated financial statements or tax returns. The effects of income taxes are measured based on enacted tax laws and rates.
Three months endedJune 30
In thousands, except per share 2011 2010
Net income (loss) $ 2,501 $ 103
Weighted average common shares outstanding used in basic EPS 46,080 45,908
Common shares issuable upon exercise of dilutive stock options and restricted stock awards 553 405
Weighted average common shares outstanding and common share equivalents used in diluted EPS 46,633 46,313
Earnings (loss) per shareBasic $ 0.05 $ 0.00Diluted 0.05 0.00
Six months endedJune 30
In thousands, except per share 2011 2010
Net income (loss) $19,927 $ (271)
Weighted average common shares outstanding used in basic EPS 46,075 45,872
Common shares issuable upon exercise of dilutive stock options and restricted stock awards 427 —
Weighted average common shares outstanding and common share equivalents used in diluted EPS 46,502 45,872
Earnings (loss) per shareBasic $ 0.43 $ (0.01)Diluted 0.43 (0.01)
2011 2010
Three months ended June 30 613,900 1,519,175Six months ended June 30 1,321,397 1,441,850

GLATFELTER
-8-
As of June 30, 2011 and December 31, 2010, we had $33.5 million and $38.7 million, respectively, of gross unrecognized tax benefits. As of June 30, 2011, if such benefits were to be recognized, approximately $33.5 million would be recorded as a component of income tax expense, thereby affecting our effective tax rate. The majority of the reduction in unrecognized tax benefits is due to benefits recorded in connection with the favorable resolution of a German tax audit.
We, or one of our subsidiaries, file income tax returns with the United States Internal Revenue Service, as well as various state and foreign authorities. The following table summarizes, by major jurisdiction, tax years that remain subject to examination:
The amount of income taxes we pay is subject to ongoing audits by federal, state and foreign tax authorities, which often result in proposed assessments. Management performs a comprehensive review of its global tax positions on a quarterly basis and accrues amounts for uncertain tax positions. Based on these reviews and the result of discussions and resolutions of matters with certain tax authorities and the closure of tax years subject to tax audit, reserves are adjusted as necessary. However, future results may include favorable or unfavorable adjustments to our estimated tax liabilities in the period the assessments are determined or resolved or as such statutes are closed. Due to potential for resolution of federal, state and foreign examinations, and the expiration of various statutes of limitation, it is reasonably possible our gross unrecognized tax benefits balance may decrease within the next twelve months by a range of zero to $3.6 million. Substantially all of this range relates to tax positions taken in the U.S. and in the United Kingdom.
We recognize interest and penalties related to uncertain tax positions as income tax expense. During the first half of the year, we recognized a net reduction of interest expense of $2.0 million. For the second quarter of 2011, we recognized a net reduction of interest expense of $2.3 million, the majority of which was in connection with the favorable settlement of a German tax audit. For the second quarter of 2010, we recognized $0.4 million of interest
Open Tax Years Examinations not Examination inJurisdiction yet initiated progress
United States Federal 2007-2010 N/AState 2005-2010 2004 & 2006-2008
Canada (1) 2006-2010 2006 - 2009Germany (1) 2007-2010 2004 - 2009France 2007-2010 N/AUnited Kingdom 2007-2010 N/APhilippines 2010 2009
(1) — includes provincial or similar local jurisdictions, as applicable
expense. As of June 30, 2011, accrued interest payable was $1.8 million, and as of December 31, 2010, accrued interest payable was $3.8 million. We did not record any penalties associated with uncertain tax positions during the second quarters of 2011 or 2010.
7. STOCK-BASED COMPENSATION
The P. H. Glatfelter Amended and Restated Long Term Incentive Plan (the “LTIP”) provides for the issuance of up to 5,500,000 shares of Glatfelter common stock to eligible participants in the form of restricted stock units, restricted stock awards, non-qualified stock options, performance shares, incentive stock options and performance units.
Restricted Stock Units (“RSU”) and Performance Share Awards (“PSAs”) Awards of RSU and PSA are made under our LTIP. The RSUs vest based solely on the passage of time, generally on a graded scale over a three, four, and five-year period. PSAs were issued in March 2011 to members of senior management and cliff vest December 31, 2013, assuming the achievement of predetermined, three-year cumulative performance targets. The performance measures include a minimum, target and maximum performance level providing the grantees an opportunity to receive more or less shares than target depending on actual financial performance. For both RSUs and PSAs, the grant date fair value of the awards is used to determine the amount of expense to be recognized over the applicable service period. Settlement of RSUs and PSAs will be made in shares of our common stock. The following table summarizes RSU activity during the first six months of the indicated periods:
The 2011 grant includes 96,410 PSAs. The following table sets forth aggregate RSU and PSA compensation expense for the periods indicated:
Stock Only Stock Appreciation Rights (SOSARs) Under terms of the SOSAR, the recipients receive the right to a payment in the form of shares of common stock equal to the difference, if any, in the fair market value of one share of common stock at the time of exercising the SOSAR and the strike price. The SOSARs vest ratably over a three year period and have a term of ten years.
Units 2011 2010
Beginning balance 579,801 564,037Granted 244,754 198,259 Forfeited (12,539) (8,820)Restriction lapsed/shares delivered (14,490) (31,323)
Ending balance 797,526 722,153
June 30 In thousands 2011 2010
Three months ended $ 541 $432Six months ended 1,007 837

GLATFELTER
-9-
The following table sets forth information related to outstanding SOSARS.
The following table sets forth SOSAR compensation expense for the periods indicated:
The following table provides information with respect to the net periodic costs of our pension and post retirement medical benefit plans.
2011 2010 Wtd Avg Wtd Avg Exercise ExerciseSOSARS Shares Price Shares Price
Outstanding at Jan. 1, 2,061,877 $ 12.28 1,762,020 $ 11.84Granted 345,290 12.56 423,450 13.95Exercised — — Canceled/forfeited (102,970) 12.55 (64,420) 11.71Outstanding at Jun 30, 2,304,197 $ 12.31 2,121,050 $ 12.27
SOSAR Grants Weighted average grant date fair
value per share $ 4.09 $ 4.72 Aggregate grant date fair value (in
thousands) $ 1,412 $ 1,998 Black-Scholes Assumptions
Dividend yield 2.87% 2.58% Risk free rate of return 2.55% 2.54% Volatility 41.91% 42.31% Expected life 6 yrs 6 yrs
June 30In thousands 2011 2010
Three months ended $411 $ 576 Six months ended 880 1,185
8. RETIREMENT PLANS AND OTHER POST-RETIREMENT BENEFITS
Three months ended June 30In thousands 2011 2010
Pension Benefits Service cost $ 2,338 $ 2,270Interest cost 6,033 6,045Expected return on plan assets (10,449) (10,083)Amortization of prior service cost 637 614Amortization of unrecognized loss 3,082 3,505
Net periodic benefit cost $ 1,641 $ 2,351
Other Benefits Service cost $ 693 $ 698Interest cost 691 805Expected return on plan assets (130) (134)Amortization of prior service cost (306) (306)Amortization of unrecognized loss 183 316
Net periodic benefit cost $ 1,131 $ 1,379
Six months ended June 30 In thousands 2011 2010
Pension BenefitsService cost $ 4,943 $ 4,692 Interest cost 12,097 12,053 Expected return on plan assets (20,914) (20,143)Amortization of prior service cost 1,283 1,231Amortization of unrecognized loss 6,626 6,904
Net periodic benefit cost $ 4,035 $ 4,737
Other BenefitsService cost $ 1,453 $ 1,459Interest cost 1,408 1,685Expected return on plan assets (260) (269)Amortization of prior service cost (611) (612)Amortization of unrecognized loss 441 769
Net periodic benefit cost $ 2,431 $ 3,032
In millionsJune 30,
2011Dec. 31,
2010
Pension Plan AssetsFair value of plan assets at end of period $ 541.0 $ 526.4

GLATFELTER
-10-
9. COMPREHENSIVE INCOME
The following table sets forth comprehensive income and its components:
10. INVENTORIES
Inventories, net of reserves, were as follows:
11. LONG-TERM DEBT
Long-term debt is summarized as follows:
Our revolving credit facility is a four-year, $225 million, multi-currency, agreement with a consortium of banks. The agreement matures May 31, 2014 and replaced and terminated our old revolving credit agreement which was due to mature April 2011.
For all US dollar denominated borrowings under the new agreement, the interest rate is either, at our option,
Three months ended June 30In thousands 2011 2010
Net income (loss) $ 2,501 $ 103Foreign currency translation adjustments 3,791 (15,276)Deferred gains on cash flow hedges, net of tax 16 —Amortization of unrecognized retirement obligations, net of
tax 2,167 2,488
Comprehensive income (loss) $ 8,475 $(12,685)
Six months ended June 30In thousands 2011 2010
Net income (loss) $19,927 $ (271)Foreign currency translation adjustments 18,268 (34,809)Deferred gains on cash flow hedges, net of tax 16 —Amortization of unrecognized retirement obligations, net of
tax 4,675 5,087
Comprehensive income (loss) $42,886 $(29,993)
June 30, Dec. 31,In thousands 2011 2010
Raw materials $ 61,546 $ 52,538In-process and finished 102,450 94,118Supplies 57,665 54,421
Total $221,661 $201,077
June 30, Dec. 31,In thousands 2011 2010
Revolving credit facility, due May 2014 $ — $ —7⅛% Notes, due May 2016 200,000 200,0007⅛% Notes, due May 2016 - net of original issue discount 95,870 95,529Term Loan, due January 2013 36,695 36,695
Total long-term debt 332,565 332,224Less current portion — —
Long-term debt, net of current portion $332,565 $332,224
(a) the bank’s base rate plus an applicable margin (the base rate is the greater of the bank’s prime rate, the federal funds rate plus 50 basis points, or the daily LIBOR rate plus 100 basis points); or (b) daily LIBOR rate plus an applicable margin ranging from 175 basis points to 275 basis points according to our corporate credit rating determined by S&P and Moody’s. For non-US dollar denominated borrowings, interest is based on (b) above.
The credit agreement contains a number of customary covenants for financings of this type that, among other things, restrict our ability to dispose of or create liens on assets, incur additional indebtedness, repay other indebtedness, enter into certain intercompany financing arrangements, make acquisitions and engage in mergers or consolidations. We are also required to comply with specified financial tests and ratios, each as defined in the credit agreement, including: i) maximum net debt to earnings before interest, taxes, depreciation and amortization (“EBITDA”) ratio; and ii) a consolidated EBITDA to interest expense ratio. A breach of these requirements would give rise to certain remedies under the credit agreement, among which are the termination of the agreement and accelerated repayment of the outstanding borrowings plus accrued and unpaid interest under the credit facility.
On April 28, 2006 we completed an offering of $200.0 million aggregate principal amount of our 7⅛% Senior Notes due 2016 (“7⅛% Notes”). Net proceeds from this offering totaled approximately $196.4 million, after deducting the commissions and other fees and expenses relating to the offering. The proceeds were primarily used to redeem $150.0 million aggregate principal amount of our then outstanding 6⅞% notes due July 2007, plus the payment of applicable redemption premium and accrued interest.
On February 5, 2010, we issued an additional $100 million in aggregate principal amount of 7⅛% Notes due 2016 (together with the April 28, 2006 offering, the “Senior Notes”). The notes were issued at 95.0% of the principal amount. Net proceeds from this offering after deducting offering fees and expenses, were used to fund, in part, the Concert acquisition. The original issue discount is being accreted as a charge to income on the effective interest method.
Interest on the Senior Notes accrues at the rate of 7⅛% per annum and is payable semiannually in arrears on May 1 and November 1.
The Senior Notes contain cross default provisions that could result in all such notes becoming due and payable in the event of a failure to repay debt outstanding under the credit agreement at maturity or a default under

GLATFELTER
-11-
the credit agreement that accelerates the debt outstanding thereunder. As of June 30, 2011, we were not aware of any violations of our debt covenants.
In November 2007, we sold approximately 26,000 acres of timberland. In connection with that transaction, we formed GPW Virginia Timberlands LLC (“GPW Virginia”) as an indirect, wholly owned and bankruptcy-remote subsidiary of ours. GPW Virginia received as consideration for the timberland sold in that transaction a $43.2 million, interest-bearing note that matures in 2027 from the buyer, Glawson Investments Corp. (“Glawson”), a Georgia corporation, and GIC Investments LLC, a Delaware limited liability company owned by Glawson. The Glawson note receivable is fully secured by a letter of credit issued by The Royal Bank of Scotland plc. In January 2008, GPW Virginia monetized the Glawson note receivable by entering into a $36.7 million term loan agreement (the “2008 Term Loan”) with a financial institution. The 2008 Term Loan is secured by all of the assets of GPW Virginia, including the Glawson note receivable, the related letter of credit and additional notes with an aggregate principal amount of $9.2 million that we issued in favor of GPW Virginia (the “Company Note”). The 2008 Term Loan bears interest at a six month reserve adjusted LIBOR rate plus a margin rate of 1.20% per annum. Interest on the 2008 Term Loan is payable semiannually. The principal amount of the 2008 Term Loan is due on January 15, 2013, but GPW Virginia may prepay the 2008 Term Loan at any time, in whole or in part, without premium or penalty. During the six months ended June 30, 2011, GPW Virginia received aggregate interest income of $0.5 million under the Glawson note receivable and the Company Note and, in turn, incurred interest expense of $0.4 million under the 2008 Term Loan.
Under terms of the above transaction, minimum credit ratings must be maintained by the bank issuing the letter of credit. If not, an “event of default” is deemed to have occurred under the debt instrument governing the Note Payable unless actions are taken to cure such default within 60 days from the date such credit rating falls below the specified minimum. Potential remedial actions include: (i) amending the terms of the applicable debt instrument; (ii) replacement of the letter of credit with an appropriately rated institution; or (iii) repaying the Note Payable.
The following schedule sets forth the maturity of our long-term debt during the indicated year.
P. H. Glatfelter Company guarantees all debt obligations of its subsidiaries. All such obligations are recorded in these consolidated financial statements.
As of June 30, 2011 and December 31, 2010, we had $4.6 million and $5.4 million, respectively, of letters of credit issued to us by certain financial institutions. Such letters of credit reduce amounts available under our revolving credit facility. The letters of credit primarily provide financial assurances for the benefit of certain state workers compensation insurance agencies in conjunction with our self-insurance program. We bear the credit risk on this amount to the extent that we do not comply with the provisions of certain agreements. No amounts are outstanding under the letters of credit.
12. ASSET RETIREMENT OBLIGATION
During 2008, we recorded $11.5 million representing the estimated fair value of asset retirement obligations related to the legal requirement to close several lagoons at the Spring Grove, PA facility. Historically, the lagoons were used to dispose of residual waste material. Closure of the lagoons will be accomplished by filling the lagoons, and installing a non-permeable liner which will be covered with soil to construct the required cap over the lagoons. The amount referred to above, in addition to the upward revision in 2009, was accrued with a corresponding increase in the carrying value of the property, equipment and timberlands caption on the consolidated balance sheet. The amount capitalized is being amortized as a charge to operations on the straight-line basis over the expected closure period. Following is a summary of activity recorded during the first six months of 2011 and 2010:
Of the total liability at June 30, 2011, $1.5 million is recorded in the accompanying consolidated balance sheet, under the caption “Other current liabilities” and $8.0 million is recorded under the caption “Other long-term liabilities.”
In thousands
2011 $ —2012 —2013 36,6952014 —2015 —Thereafter 300,000
In thousands 2011 2010
Balance at January 1, $9,717 $11,292Accretion 265 311Payments (518) (511)
Balance at June 30, $9,464 $11,092
GLATFELTER
-12-
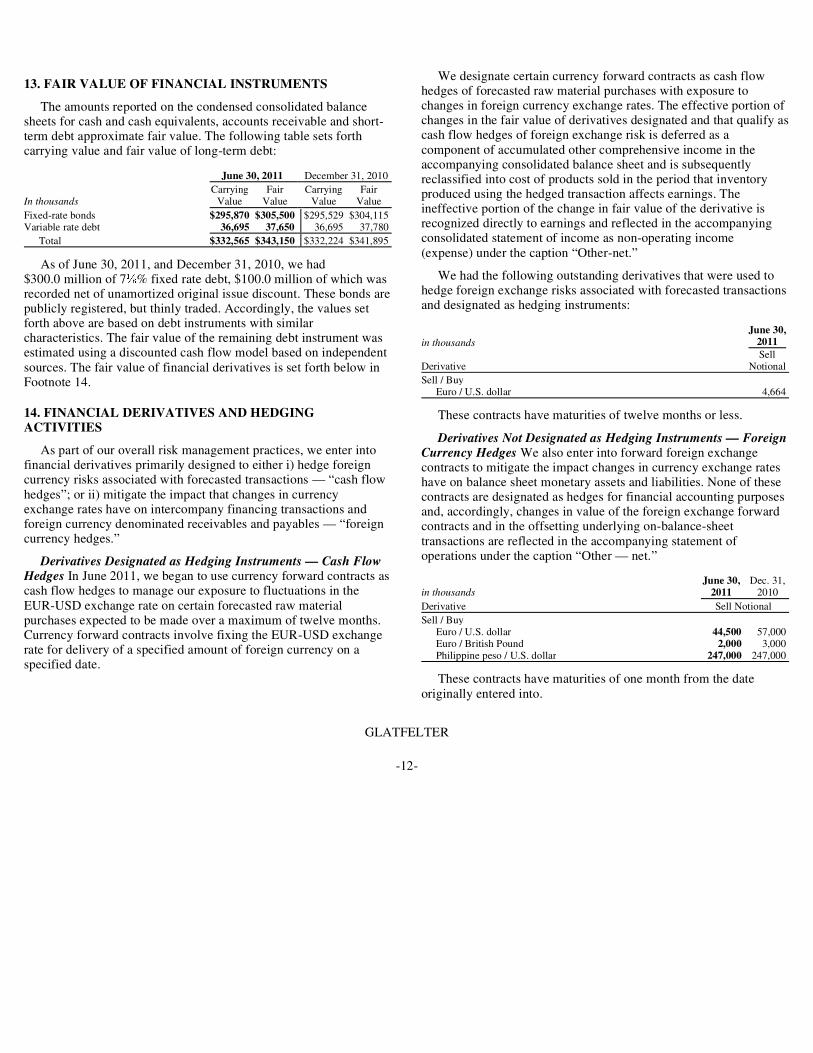
13. FAIR VALUE OF FINANCIAL INSTRUMENTS
The amounts reported on the condensed consolidated balance sheets for cash and cash equivalents, accounts receivable and short-term debt approximate fair value. The following table sets forth carrying value and fair value of long-term debt:
As of June 30, 2011, and December 31, 2010, we had $300.0 million of 7⅛% fixed rate debt, $100.0 million of which was recorded net of unamortized original issue discount. These bonds are publicly registered, but thinly traded. Accordingly, the values set forth above are based on debt instruments with similar characteristics. The fair value of the remaining debt instrument was estimated using a discounted cash flow model based on independent sources. The fair value of financial derivatives is set forth below in Footnote 14.
14. FINANCIAL DERIVATIVES AND HEDGING ACTIVITIES
As part of our overall risk management practices, we enter into financial derivatives primarily designed to either i) hedge foreign currency risks associated with forecasted transactions — “cash flow hedges”; or ii) mitigate the impact that changes in currency exchange rates have on intercompany financing transactions and foreign currency denominated receivables and payables — “foreign currency hedges.”
Derivatives Designated as Hedging Instruments — Cash Flow Hedges In June 2011, we began to use currency forward contracts as cash flow hedges to manage our exposure to fluctuations in the EUR-USD exchange rate on certain forecasted raw material purchases expected to be made over a maximum of twelve months. Currency forward contracts involve fixing the EUR-USD exchange rate for delivery of a specified amount of foreign currency on a specified date.
June 30, 2011 December 31, 2010
Carrying Fair Carrying Fair In thousands Value Value Value Value
Fixed-rate bonds $295,870 $305,500 $295,529 $304,115Variable rate debt 36,695 37,650 36,695 37,780
Total $332,565 $343,150 $332,224 $341,895
We designate certain currency forward contracts as cash flow hedges of forecasted raw material purchases with exposure to changes in foreign currency exchange rates. The effective portion of changes in the fair value of derivatives designated and that qualify as cash flow hedges of foreign exchange risk is deferred as a component of accumulated other comprehensive income in the accompanying consolidated balance sheet and is subsequently reclassified into cost of products sold in the period that inventory produced using the hedged transaction affects earnings. The ineffective portion of the change in fair value of the derivative is recognized directly to earnings and reflected in the accompanying consolidated statement of income as non-operating income (expense) under the caption “Other-net.”
We had the following outstanding derivatives that were used to hedge foreign exchange risks associated with forecasted transactions and designated as hedging instruments:
These contracts have maturities of twelve months or less.
Derivatives Not Designated as Hedging Instruments — Foreign Currency Hedges We also enter into forward foreign exchange contracts to mitigate the impact changes in currency exchange rates have on balance sheet monetary assets and liabilities. None of these contracts are designated as hedges for financial accounting purposes and, accordingly, changes in value of the foreign exchange forward contracts and in the offsetting underlying on-balance-sheet transactions are reflected in the accompanying statement of operations under the caption “Other — net.”
These contracts have maturities of one month from the date originally entered into.
June 30,in thousands 2011
SellDerivative Notional
Sell / BuyEuro / U.S. dollar 4,664
June 30, Dec. 31, in thousands 2011 2010
Derivative Sell Notional
Sell / BuyEuro / U.S. dollar 44,500 57,000Euro / British Pound 2,000 3,000Philippine peso / U.S. dollar 247,000 247,000

GLATFELTER
-13-
Fair Value Measurements
The following table summarizes the fair values of derivative instruments as of the periods indicated and the line items in the accompanying consolidated balance sheet where the instruments are recorded:
The amounts set forth in the table above represent the net asset or liability with each counterparty giving effect to rights of offset.
The following table summarizes the amount of income or loss from derivative instruments recognized in our results of operations for the periods indicated and the line items in the accompanying consolidated income statement where the results are recorded:
The impact of activity not designated as hedging was substantially all offset by the remeasurement of the underlying on-balance sheet item.
The fair value hierarchy consists of three broad levels, which gives the highest priority to unadjusted quoted prices in active markets for identical assets or liabilities (Level 1) and the lowest priority to unobservable inputs (Level 3). The three levels of the fair value hierarchy are described below:
Level 1 — Unadjusted quoted prices in active markets that are accessible at the measurement date for identical, unrestricted assets or liabilities.
Level 2 — Inputs other than quoted prices included within Level 1 that are observable for the asset or
June 30, Dec. 31, June 30, Dec. 31,In thousands 2011 2010 2011 2010
Prepaid and Other Other Current Balance sheet caption Current Assets LiabilitiesDesignated as hedging: Forward foreign currency exchange
contracts $ 24 $ — $ 2 $ — Not designated as hedging: Forward foreign currency exchange
contracts $ 27 $ — $ 728 $ 581
Three months ended Six months ended June 30 June 30
In thousands 2011 2010 2011 2010
Designated as hedging: Forward foreign currency exchange
contracts: Effective portion — cost of products
sold $ — $ — $ — $ —Ineffective portion — other — net 1 — 1 —
Not designated as hedging: Forward foreign currency exchange
contracts: Other — net $(1,496) $7,068 $(5,842) $3,961
liability, either directly or indirectly, including quoted prices for similar assets or liabilities in active markets; quoted prices for identical or similar assets or liabilities in markets that are not active; inputs other than quoted prices that are observable for the asset or liability (e.g., interest rates); and inputs that are derived principally from or corroborated by observable market data by correlation or other means.
Level 3 — Inputs that are both significant to the fair value measurement and unobservable.
The fair values of the foreign exchange forward contracts are considered to be Level 2. Foreign currency forward contracts are valued using foreign currency forward and interest rate curves. The fair value of each contract is determined by comparing the contract rate to the forward rate and discounting to present value. Contracts in a gain position are recorded in the consolidated balance sheet under the caption “Prepaid and other current assets” and the value of contracts in a loss position is recorded under the caption “Other current liabilities.”
A rollforward of fair value amounts recorded as a component of accumulated other comprehensive income is as follows:
We expect substantially all of the amounts recorded as a component of accumulated other comprehensive income will be realized in results of operations within the next twelve months and the amount will vary depending on market rates.
Credit risk related to derivative activity arises in the event a counterparty fails to meet its obligations to us. This exposure is generally limited to the amounts, if any, by which the counterparty’s obligations exceed our obligation to them. Our policy is to enter into contracts only with financial institutions which meet certain minimum credit ratings.
15. SHARE REPURCHASES
In April 2011, our Board of Directors authorized a share repurchase program for up to $50.0 million of our outstanding common stock. We intend to make these repurchases over the next 12 months in accordance with applicable securities regulations. The timing and actual number of shares repurchased, if any, will depend on a variety of factors including the market price of the company’s common stock, regulatory, legal and
In thousands 2011
Balance at January 1, $ —Deferred gains on cash flow hedges 22 Reclassified to earnings —
Balance at June 30, $ 22

GLATFELTER
-14-
contractual requirements, and other market factors. The program, which does not obligate us to repurchase any particular amount of common stock, may be modified or suspended at any time at the Board’s discretion. The following table summarizes share repurchases made under this program:
16. COMMITMENTS, CONTINGENCIES AND LEGAL PROCEEDINGS
Fox River — Neenah, Wisconsin
Background We have significant uncertainties associated with environmental claims arising out of the presence of polychlorinated biphenyls (“PCBs”) in sediments in the lower Fox River and in the Bay of Green Bay Wisconsin (“Site”). As part of our 1979 acquisition of the Bergstrom Paper Company, we acquired a facility located at the Site (the “Neenah Facility”). The Neenah Facility used wastepaper as a source of fiber. Discharges to the lower Fox River from the Neenah Facility that may have contained PCBs from wastepaper may have occurred from 1954 to the late 1970s. We believe that any PCBs that the Neenah Facility may have discharged into the lower Fox River resulted from the presence of PCBs in NCR®-brand carbonless copy paper in the wastepaper that was recycled at the Neenah Facility. We closed the Neenah Facility in June 2006.
The United States, the State of Wisconsin and various state and federal governmental agencies (collectively, the “Governments”), as well as other entities (including local Native American tribes), have found PCBs in sediments in the bed of the Fox River, apparently from a number of sources at municipal and industrial facilities along the upstream and downstream portions of the Site. The Governments have identified manufacturing and recycling of NCR®-brand carbonless copy paper as the principal source of that contamination.
The United States Environmental Protection Agency (“EPA”) has divided the lower Fox River and the Bay of Green Bay site into five “operable units” (the “OUs”), including the most upstream (“OU1”) and four downstream reaches of the river and bay (“OU2-5”). OU1 extends from primarily Lake Winnebago to the dam at Appleton, and is comprised of Little Lake Butte des Morts. The Neenah Facility discharged its wastewater into OU1.
Our liabilities, if any, for this contamination primarily arise under the federal Comprehensive
shares (thousands)
Authorized amount — $ 50,000Repurchases 318,608 (4,682)
Remaining authorization $ 45,318
Environmental, Response, Compensation and Liability Act (“CERCLA” or “Superfund”), pursuant to which the Governments have sought to recover “response actions” or “response costs,” which are the costs of studying and cleaning up contamination. Other agencies and natural resource trustee agencies (collectively, the “Trustees”) have sought to recover natural resource damages (“NRDs”), including natural resource damage assessment costs.
We are one of eight entities that have been formally notified that they are potentially responsible parties (“PRPs”) under CERCLA for response costs or NRDs. Others, including the United States and the State of Wisconsin, may also be liable for some or all of the costs of NRD at this Site.
We are engaged in litigation to allocate costs and NRDs among the parties responsible for this site. The Governments have sought to recover response actions, response costs, and NRDs from us through three principal enforcement actions.
OU1 CD. On October 1, 2003, the United States and the State of Wisconsin commenced an action captioned United States v. P.H. Glatfelter Co. against us and WTM I Co. in the United States District Court for the Eastern District of Wisconsin and simultaneously lodged a consent decree (“OU1 CD”) that the court entered on April 12, 2004. Under that OU1 CD, and an amendment dated August 2008, we and WTM I, with a limited fixed contribution from Menasha Corp. and funds provided by the United States from an agreement with others, have implemented the remedy for OU1. We have also resolved claims for all Governmental response costs in OU1 after July 2003 and made a payment on NRDs. That remedy is complete. We have continuing operation and maintenance obligations that we expect to fund from contributions we and WTM I have already made to an escrow account for OU1 under the OU1 CD.
OU2-5 UAO. In November 2007, the United States Environmental Protection Agency (“EPA”) issued an administrative order for remedial action (“UAO”) to Appleton Papers Inc. (“API”), CBC Coating, Inc. (formerly known as Riverside Paper Corporation), Georgia-Pacific Consumer Products, L.P. (formerly known as Fort James Operating Company), Menasha Corporation, NCR Corporation, Glatfelter, U.S. Paper Mills Corp., and WTM I Company (“WTM”) directing those respondents to implement the remedy in OU2-5. Shortly following issuance of the UAO, API and NCR commenced litigation against us and others, as described below. Accordingly, we have no vehicle for complying with the UAO’s overall requirements other than answering a judgment in the litigation, and we have so informed EPA, but, to minimize disruptions, have paid certain de minimis amounts to EPA for oversight costs under the UAO.

GLATFELTER
-15-
Government Action. On October 14, 2010, the United States and the State of Wisconsin filed an action in the United States District Court for the Eastern District of Wisconsin captioned United States v. NCR Corp. (the “Government Action”) against 12 parties, including us. The Government Action seeks to recover from each of the defendants, jointly and severally, all of the governments’ past costs of response, which approximates $17 million to date, a declaration as to liability for all of the governments’ future costs of response, and compensation for natural resource damages, as well as a declaration as to liability for compliance with the UAO for OU2-5. On March 29, 2011, the United States filed a motion for a preliminary injunction against NCR and API to require NCR and API to implement work in 2011 at a rate described as “full-scale sediment remediation.” On July 5, 2011, that motion was denied; in the course of that ruling, the court found that the governments were not likely to show that API was liable under CERCLA at all. The governments have since filed a renewed motion against NCR alone.
Whiting Litigation. On January 7, 2008, NCR and API commenced litigation in the United States District Court for the Eastern District of Wisconsin captioned Appleton Papers Inc. v. George A. Whiting Paper Co., seeking to reallocate costs and damages allegedly incurred or paid or to be incurred or paid by NCR or API (the “Whiting Litigation”). The case involves allocation claims among the two plaintiffs and 28 defendants including us. We and other defendants counterclaimed against NCR and API. Some of the claims have since been resolved as described below.
Claims against governments. The Whiting Litigation involves claims by certain parties against federal agencies who are responsible parties for this site. In the Government Action many defendants, including us, asserted counterclaims against the United States and the State of Wisconsin.
Settlements. Certain parties have resolved their liability to the United States affording them contribution protection. These settlements are embodied in consent decrees. Notably, we entered into the OU1 CD. Also, in a case captioned United States v. George A. Whiting Paper Co., the district court entered two consent decrees under which 13 de minimis defendants in the Whiting Litigation settled with the United States and Wisconsin. The Court of Appeals for the Seventh Circuit denied an appeal by NCR and API on May 4, 2011. Further, Georgia-Pacific Consumer Products LP, has entered into a consent decree resolving its liability for NRDs and a separate consent
decree in the Government Action that resolves all of its liabilities except for the downstream portion of the OU4 remedy. Finally, the United States has lodged a consent decree that would resolve the liability of itself and two municipalities and has moved for entry of that decree. We oppose entry of that consent decree, which the district court must approve.
Cleanup Decisions. The extent of our exposure depends, in large part, on the decisions made by EPA and the Wisconsin Department of Natural Resources (“WDNR”) as to how the Site will be cleaned up and the costs and timing of those response actions. The nature of the response actions has been highly controversial. Between 2002 and 2008, the EPA issued records of decision (“RODs”) regarding required remedial actions for the OUs. Some of those RODs have been amended. We contend that the remedy for OU2-5 is arbitrary and capricious. We and others may litigate that issue in the Government Action. If we were to be successful in modifying any existing selected remedy, our exposure could be reduced materially.
NRD Assessment. We are engaged in disputes as to (i) whether various documents prepared by the Trustees taken together constitute a sufficient NRD assessment under applicable regulations; and (ii)on a number of legal grounds, whether the Trustees may recover from us on the specific NRD claims they have made.
Past Cost Demand. We are also disputing a demand by EPA that we and six other parties reimburse EPA for approximately $17 million in costs that EPA claims it incurred.
Cost estimates. Estimates of the Site remediation change over time as we, or others, gain additional data and experience at the Site. In addition, disagreement exists over the likely costs for some of this work. Based upon estimates made by the Governments and independent estimates commissioned by various potentially responsible parties, we have no reason to disagree with the Governments’ assertion that total past and future costs and NRDs at this site may exceed $1 billion and that $1.5 billion is a reasonable “outside estimate.”
NRDs. Of that amount, the Trustees’ assessment documents claimed that we are jointly and severally responsible for NRDs with a value between $176 million and $333 million. They now claim that this range should be inflated to 2009 dollars and then certain unreimbursed past assessment costs should be added, so that the range of their claim would be $287 million to $423 million. We deny liability for most of these NRDs and believe that even if anyone is liable, that we are not jointly and severally liable for the full amount. Moreover, we believe
GLATFELTER
-16-
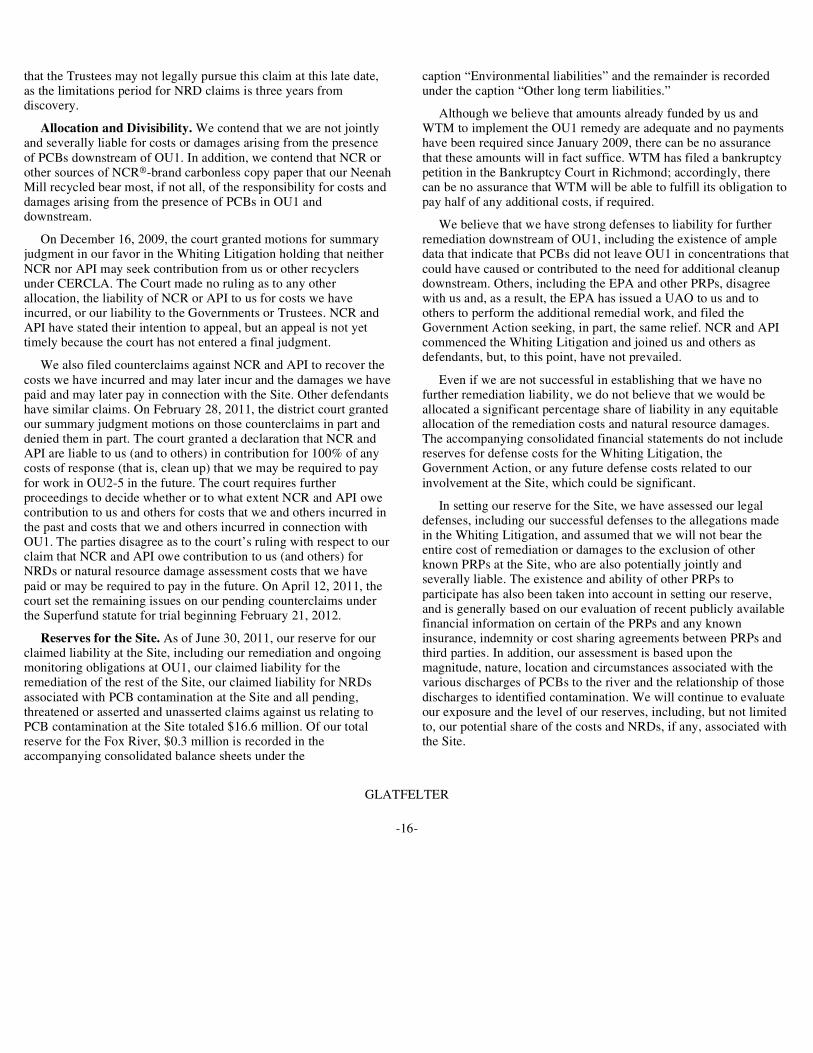
that the Trustees may not legally pursue this claim at this late date, as the limitations period for NRD claims is three years from discovery.
Allocation and Divisibility. We contend that we are not jointly and severally liable for costs or damages arising from the presence of PCBs downstream of OU1. In addition, we contend that NCR or other sources of NCR®-brand carbonless copy paper that our Neenah Mill recycled bear most, if not all, of the responsibility for costs and damages arising from the presence of PCBs in OU1 and downstream.
On December 16, 2009, the court granted motions for summary judgment in our favor in the Whiting Litigation holding that neither NCR nor API may seek contribution from us or other recyclers under CERCLA. The Court made no ruling as to any other allocation, the liability of NCR or API to us for costs we have incurred, or our liability to the Governments or Trustees. NCR and API have stated their intention to appeal, but an appeal is not yet timely because the court has not entered a final judgment.
We also filed counterclaims against NCR and API to recover the costs we have incurred and may later incur and the damages we have paid and may later pay in connection with the Site. Other defendants have similar claims. On February 28, 2011, the district court granted our summary judgment motions on those counterclaims in part and denied them in part. The court granted a declaration that NCR and API are liable to us (and to others) in contribution for 100% of any costs of response (that is, clean up) that we may be required to pay for work in OU2-5 in the future. The court requires further proceedings to decide whether or to what extent NCR and API owe contribution to us and others for costs that we and others incurred in the past and costs that we and others incurred in connection with OU1. The parties disagree as to the court’s ruling with respect to our claim that NCR and API owe contribution to us (and others) for NRDs or natural resource damage assessment costs that we have paid or may be required to pay in the future. On April 12, 2011, the court set the remaining issues on our pending counterclaims under the Superfund statute for trial beginning February 21, 2012.
Reserves for the Site. As of June 30, 2011, our reserve for our claimed liability at the Site, including our remediation and ongoing monitoring obligations at OU1, our claimed liability for the remediation of the rest of the Site, our claimed liability for NRDs associated with PCB contamination at the Site and all pending, threatened or asserted and unasserted claims against us relating to PCB contamination at the Site totaled $16.6 million. Of our total reserve for the Fox River, $0.3 million is recorded in the accompanying consolidated balance sheets under the
caption “Environmental liabilities” and the remainder is recorded under the caption “Other long term liabilities.”
Although we believe that amounts already funded by us and WTM to implement the OU1 remedy are adequate and no payments have been required since January 2009, there can be no assurance that these amounts will in fact suffice. WTM has filed a bankruptcy petition in the Bankruptcy Court in Richmond; accordingly, there can be no assurance that WTM will be able to fulfill its obligation to pay half of any additional costs, if required.
We believe that we have strong defenses to liability for further remediation downstream of OU1, including the existence of ample data that indicate that PCBs did not leave OU1 in concentrations that could have caused or contributed to the need for additional cleanup downstream. Others, including the EPA and other PRPs, disagree with us and, as a result, the EPA has issued a UAO to us and to others to perform the additional remedial work, and filed the Government Action seeking, in part, the same relief. NCR and API commenced the Whiting Litigation and joined us and others as defendants, but, to this point, have not prevailed.
Even if we are not successful in establishing that we have no further remediation liability, we do not believe that we would be allocated a significant percentage share of liability in any equitable allocation of the remediation costs and natural resource damages. The accompanying consolidated financial statements do not include reserves for defense costs for the Whiting Litigation, the Government Action, or any future defense costs related to our involvement at the Site, which could be significant.
In setting our reserve for the Site, we have assessed our legal defenses, including our successful defenses to the allegations made in the Whiting Litigation, and assumed that we will not bear the entire cost of remediation or damages to the exclusion of other known PRPs at the Site, who are also potentially jointly and severally liable. The existence and ability of other PRPs to participate has also been taken into account in setting our reserve, and is generally based on our evaluation of recent publicly available financial information on certain of the PRPs and any known insurance, indemnity or cost sharing agreements between PRPs and third parties. In addition, our assessment is based upon the magnitude, nature, location and circumstances associated with the various discharges of PCBs to the river and the relationship of those discharges to identified contamination. We will continue to evaluate our exposure and the level of our reserves, including, but not limited to, our potential share of the costs and NRDs, if any, associated with the Site.

GLATFELTER
-17-
The amount and timing of future expenditures for environmental compliance, cleanup, remediation and personal injury, NRDs and property damage liabilities cannot be ascertained with any certainty due to, among other things, the unknown extent and nature of any contamination, the response actions that may ultimately be required, the availability of remediation equipment, and landfill space, and the number and financial resources of any other PRPs.
Other Information. The Governments have published studies estimating the amount of PCBs discharged by each identified PRP’s facility to the lower Fox River and Green Bay. These reports estimate the Neenah Facility’s share of the mass of PCBs discharged to be as high as 27%. We do not believe the discharge mass estimates used in these studies are accurate because (a) the studies themselves disclose that they are not accurate and (b) the PCB mass estimates contained in the studies are based on assumptions that are unsupported by existing data on the Site. We believe that the Neenah Facility’s volumetric contribution of PCB mass is significantly lower than the estimates set forth in these studies.
In any event, based upon the court’s December 16, 2009, and February 28, 2011, rulings in the Whiting Litigation, as well as certain other procedural orders, we continue to believe that an allocation in proportion to mass of PCBs discharged would not constitute an equitable allocation of the potential liability for the contamination at the Fox River. We contend that other factors, such as the location of contamination, the location of discharge, and a party’s role in causing discharge, must be considered in order for the allocation to be equitable.
We previously entered into interim cost-sharing agreements with six of the other PRPs, which provided for those PRPs to share certain costs relating to scientific studies of PCBs discharged at the Site (“Interim Cost Sharing Agreements”). These Interim Cost Sharing Agreements do not establish the final allocation of remediation costs incurred at the Site. Based upon our evaluation of the Court’s December 16, 2009, and February 28, 2011 rulings in the Whiting Litigation as well as the volume, nature and location of the various discharges of PCBs at the Site and the relationship of those discharges to identified contamination, we believe our allocable share of liability at the Site is less than our share of costs under the Interim Cost Sharing Agreements.
Range of Reasonably Possible Outcomes. Our analysis of the range of reasonably possible outcomes is derived from all available information, including but not limited to official documents such as RODs, discussions with the United States and other PRPs, as well as legal counsel and engineering consultants. Based on our analysis of the current RODs and cost estimates for work to be performed at the Site, we believe that it is reasonably possible that our costs associated with the Fox River matter may exceed our cost estimates and the aggregate amounts accrued for the Fox River matter by amounts that are insignificant or that could range up to $265 million over an undeterminable period that could range beyond 15 years. We believe that the likelihood of an outcome in the upper end of the monetary range is significantly less than other possible outcomes within the range and that the possibility of an outcome in excess of the upper end of the monetary range is remote. The two summary judgments in our favor in the Whiting Litigation, if sustained on appeal, suggest that outcomes in the upper end of the monetary range have become somewhat less probable, while increases in cost estimates for some of the work may make an outcome in the upper end of the range more likely.
Summary. Our current assessment is that we will be able to manage this environmental matter without a long-term, material adverse impact on the Company. This matter could, however, at any particular time or for any particular year or years, have a material adverse effect on our consolidated financial position, liquidity and/or results of operations or could result in a default under our debt covenants. Moreover, there can be no assurance that our reserves will be adequate to provide for future obligations related to this matter, that our share of costs and/or damages will not exceed our available resources, or that such obligations will not have a long-term, material adverse effect on our consolidated financial position, liquidity or results of operations. Should a court grant the United States or the State of Wisconsin relief which requires us either to perform directly or to contribute significant amounts towards remedial action downstream of OU1 or to natural resource damages, those developments could have a material adverse effect on our consolidated financial position, liquidity and results of operations and might result in a default under our loan covenants.

17. SEGMENT INFORMATION
The following table sets forth financial and other information by business unit for the periods indicated:
The mathematical accuracy of certain amounts set forth above may be impacted by the rounding of the individual line items.
Three months ended June 30 Advanced Airlaid Other and In millions Specialty Papers Composite Fibers Materials Unallocated Total 2011 2010 2011 2010 2011 2010 2011 2010 2011 2010
Net sales $216.7 $208.7 $116.4 $102.0 $ 64.9 $52.0 $ — $ — $398.0 $362.8Energy and related sales, net 2.1 1.9 — — — — — — 2.1 1.9
Total revenue 218.8 210.6 116.4 102.0 64.9 52.0 — — 400.0 364.7Cost of products sold 206.5 194.9 97.6 84.1 58.3 48.5 0.1 1.8 362.5 329.2
Gross profit 12.2 15.7 18.8 17.9 6.6 3.6 (0.1) (1.8) 37.5 35.5SG&A 12.3 13.0 9.6 9.0 2.8 1.6 6.6 5.2 31.3 28.8Gains on dispositions of plant,
equipment and timberlands, net — — — — — — — (0.2) — (0.2)
Total operating income (loss) (0.1) 2.7 9.3 8.9 3.7 1.9 (6.7) (6.8) 6.2 6.8Other non-operating income
(expense) — — — — — — (6.6) (6.3) (6.6) (6.3)
Income (loss) before income taxes $ (0.1) $ 2.7 $ 9.3 $ 8.9 $ 3.7 $ 1.9 $(13.3) $(13.1) $ (0.4) $ 0.5
Supplementary Data Net tons sold 191.8 187.8 22.9 23.0 22.3 20.1 — — 237.0 230.9Depreciation, depletion and
amortization $ 8.9 $ 8.7 $ 6.4 $ 5.8 $ 2.1 $ 1.9 $ — $ — $ 17.4 $ 16.4Capital expenditures 9.4 5.7 6.6 1.7 3.7 1.9 — — 19.8 9.3
Six months ended June 30 Advanced Airlaid Other and In millions Specialty Papers Composite Fibers Materials Unallocated Total 2011 2010 2011 2010 2011 2010 2011 2010 2011 2010
Net sales $437.2 $416.4 $231.6 $203.5 $126.0 $80.1 $ — $ — $794.8 $700.1Energy and related sales, net 5.0 5.5 — — — — — — 5.0 5.5
Total revenue 442.2 422.0 231.6 203.5 126.0 80.1 — — 799.8 705.6Cost of products sold 393.9 376.6 190.6 170.2 115.0 75.4 2.6 3.8 702.1 625.9
Gross profit 48.3 45.4 41.0 33.3 11.0 4.7 (2.6) (3.8) 97.7 79.7SG&A 26.2 26.7 19.4 18.1 5.5 2.6 12.0 16.1 63.1 63.5Gains on dispositions of plant,
equipment and timberlands, net — — — — — — (3.2) (0.2) (3.2) (0.2)
Total operating income (loss) 22.1 18.7 21.6 15.2 5.5 2.2 (11.5) (19.7) 37.8 16.3Other non-operating income
(expense) — — — — — — (12.8) (15.8) (12.9) (15.8)
Income (loss) before income taxes $ 22.1 $ 18.7 $ 21.6 $ 15.2 $ 5.5 $ 2.2 $(24.3) $(35.5) $ 24.9 $ 0.6
Supplementary Data Net tons sold 390.5 381.0 45.8 44.3 43.8 31.2 — — 480.2 456.5Depreciation, depletion and
amortization $ 17.5 $ 17.3 $ 12.5 $ 11.9 $ 4.3 $ 3.0 $ — $ — $ 34.3 $ 32.2Capital expenditures 13.3 8.7 10.5 3.2 4.1 3.5 — — 27.9 15.4
Results of individual business units are presented based on our management accounting practices and management structure. There is no comprehensive, authoritative body of guidance for management accounting equivalent to accounting principles generally accepted in the United States of America; therefore, the financial results of individual business units are not necessarily comparable with similar information for any other company. The management accounting process uses assumptions and allocations to measure performance of the business units. Methodologies are refined from time to time as management accounting practices are enhanced and businesses change. The costs incurred by support areas not directly aligned with the business unit are allocated primarily based on an estimated utilization of support area services.
Management evaluates results of operations of the business units before pension income or expense (other than service costs), alternative fuel mixture credits, charges related to the Fox River environmental reserves, acquisition and integration related costs, restructuring related charges, unusual items, certain corporate level costs, and the effects of asset dispositions. Management believes that this is a more meaningful representation of the operating performance of its core businesses, the profitability of business units and the extent of cash flow generated from these core operations. Such amounts are presented under the caption “Other and Unallocated.” This presentation is aligned with the management and operating structure of our company. It is also on this basis that our performance is evaluated internally and by the Company’s Board of

GLATFELTER
-18-
Directors.

18. GUARANTOR FINANCIAL STATEMENTS
Our 7⅛% Notes have been fully and unconditionally guaranteed, on a joint and several basis, by certain of our 100%-owned domestic subsidiaries: PHG Tea Leaves, Inc., Mollanvick, Inc., The Glatfelter Pulp Wood Company, and Glatfelter Holdings, LLC.
The following presents our condensed consolidating statements of income and cash flow, and our condensed consolidating balance sheets. These financial statements reflect P. H. Glatfelter Company (the parent), the guarantor subsidiaries (on a combined basis), the non-guarantor subsidiaries (on a combined basis) and elimination entries necessary to combine such entities on a consolidated basis. We have reclassified certain interest income amounts for the three- and six-months ended June 30, 2010 of $0.2 million and $0.3 million, respectively, in total from “Other — net”, to “Interest expense, net”, to conform to the 2011 presentation. This reclassification had no effect on the reported amounts of Interest income, Interest expense, or Other — net for any period presented in our accompanying condensed consolidated statement of operations.
Condensed Consolidating Statement of Income for the three months ended June 30, 2011
Condensed Consolidating Statement of Income for the three months ended June 30, 2010
GLATFELTER
-19-
Parent Non Adjustments/In thousand Company Guarantors Guarantors Eliminations Consolidated
Net sales $216,708 $ 11,986 $181,277 $ (11,986) $ 397,985 Energy and related sales — net 2,060 — — — 2,060
Total revenues 218,768 11,986 181,277 (11,986) 400,045Costs of products sold 208,575 11,271 154,753 (12,054) 362,545
Gross profit 10,193 715 26,524 68 37,500Selling, general and administrative expenses 17,293 688 13,339 — 31,320Gains on dispositions of plant, equipment and
timberlands, net (29) — — — (29)
Operating income (7,071) 27 13,185 68 6,209Other non-operating income (expense)
Interest expense (6,242) — (219) — (6,461)Other income (expense) — net 12,497 2,026 (1,576) (13,072) (125)
Total other non-operating income (expense) 6,255 2,026 (1,795) (13,072) (6,586)
Income (loss) before income taxes (816) 2,053 11,390 (13,004) (377)Income tax provision (benefit) (3,317) 676 (257) 20 (2,878)
Net income (loss) $ 2,501 $ 1,377 $ 11,647 $ (13,024) $ 2,501
Parent Non Adjustments/In thousand Company Guarantors Guarantors Eliminations Consolidated
Net sales $208,740 $ 11,750 $154,041 $ (11,750) $ 362,781Energy and related sales — net 1,915 — — — 1,915
Total revenues 210,655 11,750 154,041 (11,750) 364,696Costs of products sold 198,062 10,283 132,620 (11,729) 329,236
Gross profit 12,593 1,467 21,421 (21) 35,460Selling, general and administrative expenses 17,034 627 11,186 — 28,847Gains on dispositions of plant, equipment and
timberlands, net — (168) — — (168)
Operating income (4,441) 1,008 10,235 (21) 6,781Other non-operating income (expense)
Interest expense (6,474) — (343) — (6,817)Other income (expense) — net 7,844 1,094 (27) (8,377) 534
Total other non-operating income (expense) 1,370 1,094 (370) (8,377) (6,283)
Income (loss) before income taxes (3,071) 2,102 9,865 (8,398) 498Income tax provision (benefit) (3,174) 390 3,187 (8) 395
Net income (loss) $ 103 $ 1,712 $ 6,678 $ (8,390) $ 103

Condensed Consolidating Statement of Income for the six months ended June 30, 2011
Condensed Consolidating Statement of Income for the six months ended June 30, 2010
GLATFELTER
-20-
Parent Non Adjustments/In thousand Company Guarantors Guarantors Eliminations Consolidated
Net sales $437,162 $ 24,818 $357,594 $ (24,818) $ 794,756Energy and related sales — net 5,047 — — — 5,047
Total revenues 442,209 24,818 357,594 (24,818) 799,803Costs of products sold 399,537 22,742 304,855 (24,998) 702,136
Gross profit 42,672 2,076 52,739 180 97,667Selling, general and administrative expenses 36,011 1,247 25,832 — 63,090Gains on dispositions of plant, equipment and
timberlands, net (42) (3,158) (4) — (3,204)
Operating income 6,703 3,987 26,911 180 37,781Non-operating income (expense)
Interest expense (12,481) — (440) — (12,921)Other income (expense) — net 25,933 3,993 (2,938) (26,899) 89
Total other income (expense) 13,452 3,993 (3,378) (26,899) (12,832)
Income (loss) before income taxes 20,155 7,980 23,533 (26,719) 24,949Income tax provision (benefit) 228 3,132 2,836 (1,174) 5,022
Net income (loss) $ 19,927 $ 4,848 $ 20,697 $ (25,545) $ 19,927
Parent Non Adjustments/ In thousand Company Guarantors Guarantors Eliminations Consolidated
Net sales $416,443 $ 24,353 $283,613 $ (24,353) $ 700,056Energy and related sales — net 5,522 — — — 5,522
Total revenues 421,965 24,353 283,613 (24,353) 705,578Costs of products sold 383,690 20,693 245,711 (24,192) 625,902
Gross profit 38,275 3,660 37,902 (161) 79,676Selling, general and administrative expenses 39,582 1,168 22,767 — 63,517Gains on dispositions of plant, equipment and
timberlands, net — (168) — — (168)
Operating income (1,307) 2,660 15,135 (161) 16,327Non-operating income (expense)
Interest expense (11,805) — (675) — (12,480)Other income (expense) — net 6,948 2,103 1,155 (13,485) (3,279)
Total other income (expense) (4,857) 2,103 480 (13,485) (15,759)
Income (loss) before income taxes (6,164) 4,763 15,615 (13,646) 568Income tax provision (benefit) (5,893) 1,554 5,359 (181) 839
Net income (loss) $ (271) $ 3,209 $ 10,256 $ (13,465) $ (271)

Condensed Consolidating Balance Sheet as of June 30, 2011
Condensed Consolidating Balance Sheet as of December 31, 2010
GLATFELTER
-21-
Parent Non Adjustments/In thousand Company Guarantors Guarantors Eliminations Consolidated
Assets Current assets Cash and cash equivalents $ 84,571 $ 961 $ 22,764 $ — $ 108,296Other current assets 247,111 417,534 243,085 (469,008) 438,722Plant, equipment and timberlands — net 241,933 6,815 375,050 — 623,798Other assets 816,150 175,361 101,953 (863,692) 229,772
Total assets $1,389,765 $600,671 $742,852 $(1,332,700) $1,400,588
Liabilities and Shareholders’ Equity
Current liabilities $ 316,532 $ 31,483 $352,332 $ (469,575) $ 230,772Long-term debt 295,870 — 36,695 — 332,565Deferred income taxes 76,464 19,494 44,675 (31,867) 108,766Other long-term liabilities 115,677 13,363 10,689 3,534 143,263
Total liabilities 804,543 64,340 444,391 (497,908) 815,366Shareholders’ equity 585,222 536,331 298,461 (834,792) 585,222
Total liabilities and shareholders’ equity $1,389,765 $600,671 $742,852 $(1,332,700) $1,400,588
Parent Non Adjustments/In thousand Company Guarantors Guarantors Eliminations Consolidated
Assets Current assets Cash and cash equivalents $ 61,953 $ 91 $ 33,744 $ — $ 95,788Other current assets 230,957 380,986 203,048 (408,089) 406,902Plant, equipment and timberlands — net 244,157 7,161 356,836 16 608,170Other assets 773,254 167,877 103,250 (813,494) 230,887
Total assets $1,310,321 $556,115 $696,878 $(1,221,567) $1,341,747
Liabilities and Shareholders’ Equity
Current liabilities $ 277,343 $ 3,672 $336,679 $ (404,548) $ 213,146Long-term debt 295,529 — 36,695 — 332,224Deferred income taxes 70,575 14,836 42,204 (32,697) 94,918Other long-term liabilities 114,432 13,210 9,999 11,376 149,017
Total liabilities 757,879 31,718 425,577 (425,869) 789,305Shareholders’ equity 552,442 524,397 271,301 (795,698) 552,442
Total liabilities and shareholders’ equity $1,310,321 $556,115 $696,878 $(1,221,567) $1,341,747

Condensed Consolidating Statement of Cash Flows for the six months ended June 30, 2011
Condensed Consolidating Statement of Cash Flows for the six months ended June 30, 2010
GLATFELTER
-22-
Parent Non Adjustments/In thousand Company Guarantors Guarantors Eliminations Consolidated
Net cash provided (used) by Operating activities $ 38,587 $ 2,969 $ 10,057 $ (3,300) $ 48,313Investing activities
Purchase of plant, equipment and timberlands (13,284) (16) (14,577) — (27,877)Proceeds from disposal plant, equipment and
timberlands 49 3,373 18 — 3,440Repayments from (advances of) intercompany
loans, net (3,586) (2,156) — 5,742 —
Total investing activities (16,821) 1,201 (14,559) 5,742 (24,437)Financing activities
Net (repayments of) proceeds from indebtedness — — (798) — (798)Payment of dividends to shareholders (8,396) — — — (8,396)Repurchases of common stock (4,369) — — — (4,369)(Repayments) borrowings of intercompany loans,
net 13,500 — (7,758) (5,742) —Payment of intercompany dividends — (3,300) — 3,300 —Proceeds from stock options exercised 117 — — — 117
Total financing activities 852 (3,300) (8,556) (2,442) (13,446)Effect of exchange rate on cash — — 2,078 — 2,078
Net increase (decrease) in cash 22,618 870 (10,980) — 12,508Cash at the beginning of period 61,953 91 33,744 — 95,788
Cash at the end of period $ 84,571 $ 961 $ 22,764 $ — $ 108,296
Parent Non Adjustments/ In thousand Company Guarantors Guarantors Eliminations Consolidated
Net cash provided (used) by Operating activities $(90,129) $ 132,713 $ 40,391 $ (300) $ 82,675Investing activities
Purchase of plant, equipment and timberlands (8,404) (301) (6,740) (15,445)Proceeds from disposals of plant, equipment and
timberlands — 182 — — 182Acquisition of Concert Industries Corp., net of
cash acquired — — (229,080) — (229,080)Repayments from (advances of) intercompany
loans, net (1,676) (132,507) 4,806 129,377 —
Total investing activities (10,080) (132,626) (231,014) 129,377 (244,343)Financing activities
Net (repayments of) proceeds from indebtedness 76,470 — 2,016 — 78,486Payment of dividends to shareholders (8,360) — — — (8,360)(Repayments) borrowings of intercompany loans,
net (24,628) — 154,205 (129,577) —Payment of intercompany dividends — (500) — 500 —Proceeds from stock options exercised and other 110 — — — 110
Total financing activities 43,592 (500) 156,221 (129,077) 70,236 Effect of exchange rate on cash — — (1,361) — (1,361)
Net increase (decrease) in cash (56,617) (413) (35,763) — (92,793)Cash at the beginning of period 76,970 985 57,465 — 135,420
Cash at the end of period $ 20,353 $ 572 $ 21,702 $ — $ 42,627

GLATFELTER
-23-
ITEM 2. MANAGEMENT’S DISCUSSION AND ANALYSIS OF FINANCIAL CONDITION AND RESULTS OF OPERATIONS
The following discussion should be read in conjunction with the information in the unaudited condensed consolidated financial statements and notes thereto included herein and Glatfelter’s Financial Statements and Management’s Discussion and Analysis of Financial Condition and Results of Operations included in our 2010 Annual Report on Form 10-K.
Forward-Looking Statements This Quarterly Report on Form 10-Q includes forward-looking statements within the meaning of the Private Securities Litigation Reform Act of 1995. All statements other than statements of historical fact, including statements regarding industry prospects and future consolidated financial position or results of operations, made in this Report on Form 10-Q are forward looking. We use words such as “anticipates”, “believes”, “expects”, “future”, “intends” and similar expressions to identify forward-looking statements. Forward-looking statements reflect management’s current expectations and are inherently uncertain. Our actual results may differ significantly from such expectations. The following discussion includes forward-looking statements regarding expectations of, among others, non-cash pension expense, environmental costs, capital expenditures and liquidity, all of which are inherently difficult to predict. Although we make such statements based on assumptions that we believe to be reasonable, there can be no assurance that actual results will not differ materially from our expectations. Accordingly, we identify the following important factors, among others, which could cause our results to differ from any results that might be projected, forecasted or estimated in any such forward-looking statements:
i. variations in demand for our products including the impact of any unplanned market-related downtime, or variations in product pricing;
ii. changes in the cost or availability of raw materials we use, in particular pulpwood, market pulp, pulp substitutes, caustic soda and abaca fiber;
iii. changes in energy-related costs and commodity raw materials with an energy component;
iv. our ability to develop new, high value-added products;
v. the impact of exposure to volatile market-based pricing for sales of excess electricity;
vi. the impact of competition, changes in industry production capacity, including the construction of new mills, the closing of mills and incremental changes due to capital expenditures or productivity increases;
Introduction We manufacture, both domestically and internationally, a wide array of specialty papers and fiber-based engineered materials. We manage our company along three business units:
vii. the gain or loss of significant customers and/or on-going viability of such customers;
viii. cost and other effects of environmental compliance, cleanup, damages, remediation or restoration, or personal injury or property damages related thereto, such as the costs of natural resource restoration or damages related to the presence of polychlorinated biphenyls (“PCBs”) in the lower Fox River on which our former Neenah mill was located;
ix. risks associated with our international operations, including local economic and political environments and fluctuations in currency exchange rates;
x. geopolitical events, including war and terrorism;
xi. possible disruptions in our business as a result of natural disasters in and around Japan;
xii. disruptions in production and/or increased costs due to labor disputes;
xiii. the impact of unfavorable outcomes of audits by various state, federal or international tax authorities;
xiv. enactment of adverse state, federal or foreign tax or other legislation or changes in government policy or regulation;
xv. adverse results in litigation; and
xvi. our ability to finance, consummate and integrate acquisitions.
i) Specialty Papers with revenues earned from the sale of carbonless papers and forms, book publishing, envelope & converting, and engineered products;
ii) Composite Fibers with revenue from the sale of food & beverage filtration papers, metallized papers, composite laminates used for decorative furniture and flooring applications, and technical specialties; and
iii) Advanced Airlaid Materials with revenue from the sale of airlaid non-woven fabric like materials used in feminine hygiene products, adult incontinence products, cleaning pads and wipes, food pads, napkins and tablecloths, and baby wipes.

Business Units
The mathematical accuracy of certain amounts set forth above may be impacted by the rounding of the individual line items.
GLATFELTER
-24-
Six months ended June 30 Advanced Airlaid Other and In millions Specialty Papers Composite Fibers Materials Unallocated Total 2011 2010 2011 2010 2011 2010 2011 2010 2011 2010
Net sales $ 437.2 $ 416.4 $ 231.6 $ 203.5 $ 126.0 $ 80.1 $ — $ — $ 794.8 $ 700.1Energy and related sales, net 5.0 5.5 — — — — — — 5.0 5.5
Total revenue 442.2 422.0 231.6 203.5 126.0 80.1 — — 799.8 705.6Cost of products sold 393.9 376.6 190.6 170.2 115.0 75.4 2.6 3.8 702.1 625.9
Gross profit 48.3 45.4 41.0 33.3 11.0 4.7 (2.6) (3.8) 97.7 79.7 SG&A 26.2 26.7 19.4 18.1 5.5 2.6 12.0 16.1 63.1 63.5 Gains on dispositions of plant, equipment
and timberlands, net — — — — — — (3.2) (0.2) (3.2) (0.2)
Total operating income (loss) 22.1 18.7 21.6 15.2 5.5 2.2 (11.5) (19.7) 37.8 16.3Other non-operating income (expense) — — — — — — (12.8) (15.8) (12.9) (15.8)
Income (loss) before income taxes $ 22.1 $ 18.7 $ 21.6 $ 15.2 $ 5.5 $ 2.2 $ (24.3) $ (35.5) $ 24.9 $ 0.6
Supplementary Data Net tons sold 390.5 381.0 45.8 44.3 43.8 31.2 — — 480.2 456.5Depreciation, depletion and amortization $ 17.5 $ 17.3 $ 12.5 $ 11.9 $ 4.3 $ 3.0 $ — $ — $ 34.3 $ 32.2Capital expenditures 13.3 8.7 10.5 3.2 4.1 3.5 — — 27.9 15.4
RESULTS OF OPERATIONS
Six months ended June 30, 2011 versus the Six months ended June 30, 2010
Overview Net income in the first six months of 2011 totaled $19.9 million, or $0.43 per diluted share compared with a net loss of $0.3 million or $0.01 per diluted share for the first six months of 2010. The results of operations for the first half of 2010 include, on an after-tax basis, $10.0 million of expenses directly related to the Concert Industries acquisition completed on February 12, 2010.
The results of operations from our businesses improved significantly in the period over period comparison. Operating income from our three business units increased, on a pre-tax basis, $13.3 million, or 36.7%, reflecting higher selling prices, stronger demand and efficiency gains. In addition, the 2011 year to date results include a full period of Concert Industries (now operated as the Advanced Airlaid Materials business unit). The favorable market conditions were partially offset by the adverse impact of higher input costs, primarily related to woodpulps, various purchased pulps and energy, as well as costs related to operating difficulties at two facilitities.
The following table sets forth summarized results of operations:
The consolidated results of operations for the six months ended June 30, 2011 and 2010 include the following significant items:
The above items increased earnings by $0.9 million, or $0.02 per diluted share, in the first six months of 2011 and reduced earnings by $10.0 million, or $0.22 per diluted share, in the first six months of 2010.
Six months ended June 30
In thousands, except per share 2011 2010
Net sales $ 794,756 $ 700,056Gross profit 97,667 79,676Operating income 37,781 16,327Net income (loss) 19,927 (271)Earnings (loss) per share 0.43 (0.01)
After-tax
In thousands, except per share Gain (loss) Diluted EPS
2011 Gains on sale of timberlands $ 1,650 $ 0.04Acquisition and integration costs (793) (0.02)
2010 Acquisition and integration costs $ (8,321) $ (0.18)Foreign currency hedge on acquisition price (1,673) (0.04)

GLATFELTER
-25-
Business Units Results of individual business units are presented based on our management accounting practices and management structure. There is no comprehensive, authoritative body of guidance for management accounting equivalent to accounting principles generally accepted in the United States of America; therefore, the financial results of individual business units are not necessarily comparable with similar information for any other company. The management accounting process uses assumptions and allocations to measure performance of the business units. Methodologies are refined from time to time as management accounting practices are enhanced and businesses change. The costs incurred by support areas not directly aligned with the business unit are allocated primarily based on an estimated utilization of support area services.
Management evaluates results of operations of the business units before pension income or expense (other than service costs), alternative fuel mixture credits, charges related to the Fox River environmental reserves, acquisition and integration related costs, restructuring related charges, unusual items, certain corporate level costs, and the effects of asset dispositions. Management believes that this is a more meaningful representation of the operating performance of its core businesses, the profitability of business units and the extent of cash flow generated from these core operations. Such amounts are presented under the caption “Other and Unallocated.” This presentation is aligned with the management and operating structure of our company. It is also on this basis that our performance is evaluated internally and by the Company’s Board of Directors.
Sales and Costs of Products Sold
The following table sets forth the contribution to consolidated net sales by each business unit:
Six months ended June 30 In thousands 2011 2010 Change
Net sales $794,756 $700,056 $94,700Energy and related sales — net 5,047 5,522 (475)
Total revenues 799,803 705,578 94,225Costs of products sold 702,136 625,902 76,234
Gross profit $ 97,667 $ 79,676 $17,991
Gross profit as a percent of Net sales 12.3% 11.4%
Six months ended June 30Percent of Total 2011 2010
Business Unit Specialty Papers 55.0% 59.5%Composite Fibers 29.1 29.1Advanced Airlaid Material 15.9 11.4
Total 100.0% 100.0%
Net sales for the first six months of 2011 were $794.8 million, a 13.5% increase compared with the same period of 2010, reflecting higher selling prices, improved demand and a full six months for our Advanced Airlaid Materials business unit.
In the Specialty Papers business unit, net sales increased $20.7 million due to a $17.9 million benefit from higher selling prices, together with a 2.5% increase in shipping volumes.
Specialty Papers’ operating income increased $3.4 million primarily reflecting the benefits of higher selling prices, a $1.6 million insurance recovery related to a third-quarter 2010 press roll failure and operating efficiencies. These factors more than offset a $13.5 million adverse impact from higher raw material and energy costs and higher maintenance costs associated with the annual mill outages.
We sell excess power generated by the Spring Grove, PA facility. In addition, two of our facilities are registered generators of renewable energy credits (“RECs”). The following table summarizes this activity for the first six months of 2011 and 2010:
Prior to March 31, 2010, all energy sales were made pursuant to a long-term contract that expired at the end of the first quarter 2010. We continue to sell power but at market rates, which have been significantly below the expired contract rate.
Renewable energy credits (“RECs”) represent sales of certified credits earned related to burning renewable sources of energy such as black liquor and wood waste. We sell RECs into an emerging and illiquid market. The extent and value of future revenues from REC sales is dependent on many factors outside of management’s control. Therefore, we may not be able to generate consistent additional sales of RECs in future periods.
In thousands 2011 2010 Change
Energy sales $ 5,816 $ 7,670 $(1,854)Costs to produce (4,956) (5,261) 305
Net 860 2,409 (1,549)Renewable energy credits 4,187 3,113 1,074
Total $ 5,047 $ 5,522 $ (475)

GLATFELTER
-26-
In Composite Fibers, net sales in the first half of 2011 were $231.6 million, an increase of $28.1 million, or 13.8%, from the same period a year ago. The increase reflects a $7.5 million benefit from higher selling prices and a 3.6% increase in shipping volumes. The translation of foreign currencies favorably impacted net sales by $10.7 million. The improvement in Composite Fibers’ net sales reflects strengthening demand in most of its product lines.
Composite Fibers’ operating income increased by $6.4 million, or 42.4%, in the period to period comparison. The improvement was driven by higher selling prices as well as improved operating rates, efficiency gains related to continuous improvement initiatives and the impact of increased shipping volumes. The combination of these factors more than offset the $8.5 million negative impact of higher input costs, primarily related to woodpulp and synthetic fibers. Foreign currency translation unfavorably impacted operating income by $0.5 million.
In Advanced Airlaid Materials, net sales were $126.0 million, an increase of $45.9 million, largely due to including a full period’s results in 2011. The results for 2010 were included prospectively from the February 12, 2010 acquisition date. Higher selling prices benefited the comparison by $8.5 million but were substantially offset by higher input costs. Operating income increased $3.3 million primarily due to higher volumes shipped, improved operating efficiencies and a benefit in the comparison of a non-recurring $1.4 million charge in 2010 to cost of products sold for the write up of acquired inventory to fair value. Foreign currency translation unfavorably impacted operating income by $0.2 million.
Pension Expense The following table summarizes the amounts of pension expense recognized for the periods indicated: Six months ended June 30 In thousands 2011 2010 Change
Recorded as: Costs of products sold $3,264 $3,591 $ (327)SG&A expense 771 1,146 (375)
Total $4,035 $4,737 $ (702)
The amount of pension expense or income recognized each year is determined using various actuarial assumptions and certain other factors.
Other and Unallocated The amount of net expenses not allocated to a business unit and reported as “Other and Unallocated” in our table of Business Unit Performance totaled $11.5 million in the first six months of 2011 compared with net expenses of $19.7 million in the year earlier period. The change was primarily due to $10.0 million of acquisition and integration costs included in 2010 associated with the February 2010 Concert Industries acquisition (now Advanced Airlaid Materials) and $3.2 million of gains on dispositions of plant, equipment and timberlands in the first six months of 2011. Excluding these items, other and unallocated net operating expenses increased $5.0 million primarily due to higher professional services fees. Gains on dispositions of plant, equipment and timberlands were primarily related to the sale of timberlands, from which cash proceeds totaled $3.4 million.
Non-operating income (expense) as presented in the Business Unit Performance table includes $12.8 million of interest expense for the first half of 2011, an increase of $0.4 million in the comparison primarily due to the $100.0 million in bonds issued in February 2010 being outstanding for full six months in 2011 compared with five months in the first half of 2010.
In the first six months of 2010, non-operating income (expense) included a $3.4 million loss associated with forward foreign currency contracts that hedged the Canadian dollar purchase price of the Concert Industries acquisition.

GLATFELTER
-27-
Income taxes For the first six months of 2011, we recorded a provision for income taxes of $5.0 million on $24.9 million of pretax income. The provision for taxes includes a net $2.9 million income tax benefit realized with the resolution of certain foreign tax audits, partially offset by adjustments to the carrying value of deferred taxes in connection with changes in state tax laws. In 2010, we recorded a provision for income taxes of $0.8 million on $0.6 million of pretax income. The lower tax provision in 2010 was primarily due to $13.8 million of acquisition and integration costs incurred in the first half of 2010.
Foreign Currency We own and operate facilities in Canada, Germany, France, the United Kingdom and the Philippines. The functional currency of our Canadian operations is the U.S. dollar. However, in Germany and France it is the Euro, in the UK it is the British Pound Sterling, and in the Philippines the currency is the Peso. During the first six months of 2011, Euro functional currency operations generated approximately 28.9% of our sales and 27.2% of operating expenses and British Pound Sterling operations represented 7.9% of net sales and 7.6% of operating expenses. The translation of the results from these international operations into U.S. dollars is subject to changes in foreign currency exchange rates.
The table below summarizes the effect from foreign currency translation on the first six months of 2011 reported results compared to the first six months 2010:
The above table only presents the financial reporting impact of foreign currency translations. It does not present the impact of certain competitive advantages or disadvantages of operating or competing in multi-currency markets.
Six monthsIn thousands ended June 30
Favorable(unfavorable)
Net sales $ 14,559Costs of products sold (13,769)SG&A expenses (1,300)Income taxes and other (262)
Net income $ (772)
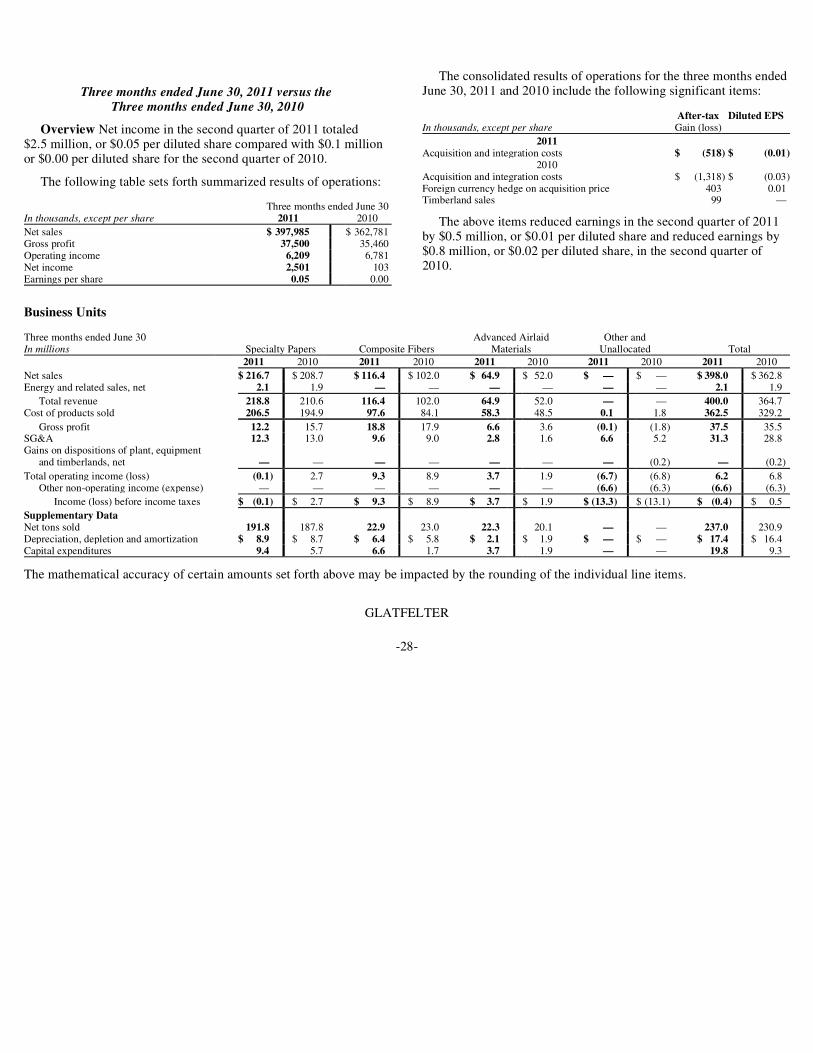
Business Units
The mathematical accuracy of certain amounts set forth above may be impacted by the rounding of the individual line items.
GLATFELTER
-28-
Three months ended June 30 Advanced Airlaid Other and In millions Specialty Papers Composite Fibers Materials Unallocated Total 2011 2010 2011 2010 2011 2010 2011 2010 2011 2010
Net sales $ 216.7 $ 208.7 $ 116.4 $ 102.0 $ 64.9 $ 52.0 $ — $ — $ 398.0 $ 362.8Energy and related sales, net 2.1 1.9 — — — — — — 2.1 1.9
Total revenue 218.8 210.6 116.4 102.0 64.9 52.0 — — 400.0 364.7 Cost of products sold 206.5 194.9 97.6 84.1 58.3 48.5 0.1 1.8 362.5 329.2
Gross profit 12.2 15.7 18.8 17.9 6.6 3.6 (0.1) (1.8) 37.5 35.5SG&A 12.3 13.0 9.6 9.0 2.8 1.6 6.6 5.2 31.3 28.8 Gains on dispositions of plant, equipment
and timberlands, net — — — — — — — (0.2) — (0.2)
Total operating income (loss) (0.1) 2.7 9.3 8.9 3.7 1.9 (6.7) (6.8) 6.2 6.8Other non-operating income (expense) — — — — — — (6.6) (6.3) (6.6) (6.3)
Income (loss) before income taxes $ (0.1) $ 2.7 $ 9.3 $ 8.9 $ 3.7 $ 1.9 $ (13.3) $ (13.1) $ (0.4) $ 0.5
Supplementary Data Net tons sold 191.8 187.8 22.9 23.0 22.3 20.1 — — 237.0 230.9Depreciation, depletion and amortization $ 8.9 $ 8.7 $ 6.4 $ 5.8 $ 2.1 $ 1.9 $ — $ — $ 17.4 $ 16.4Capital expenditures 9.4 5.7 6.6 1.7 3.7 1.9 — — 19.8 9.3
Three months ended June 30, 2011 versus the Three months ended June 30, 2010
Overview Net income in the second quarter of 2011 totaled $2.5 million, or $0.05 per diluted share compared with $0.1 million or $0.00 per diluted share for the second quarter of 2010.
The following table sets forth summarized results of operations: Three months ended June 30In thousands, except per share 2011 2010
Net sales $ 397,985 $ 362,781 Gross profit 37,500 35,460 Operating income 6,209 6,781Net income 2,501 103Earnings per share 0.05 0.00
The consolidated results of operations for the three months ended June 30, 2011 and 2010 include the following significant items:
The above items reduced earnings in the second quarter of 2011 by $0.5 million, or $0.01 per diluted share and reduced earnings by $0.8 million, or $0.02 per diluted share, in the second quarter of 2010.
After-tax Diluted EPS
In thousands, except per share Gain (loss)
2011 Acquisition and integration costs $ (518) $ (0.01)
2010 Acquisition and integration costs $ (1,318) $ (0.03)Foreign currency hedge on acquisition price 403 0.01Timberland sales 99 —
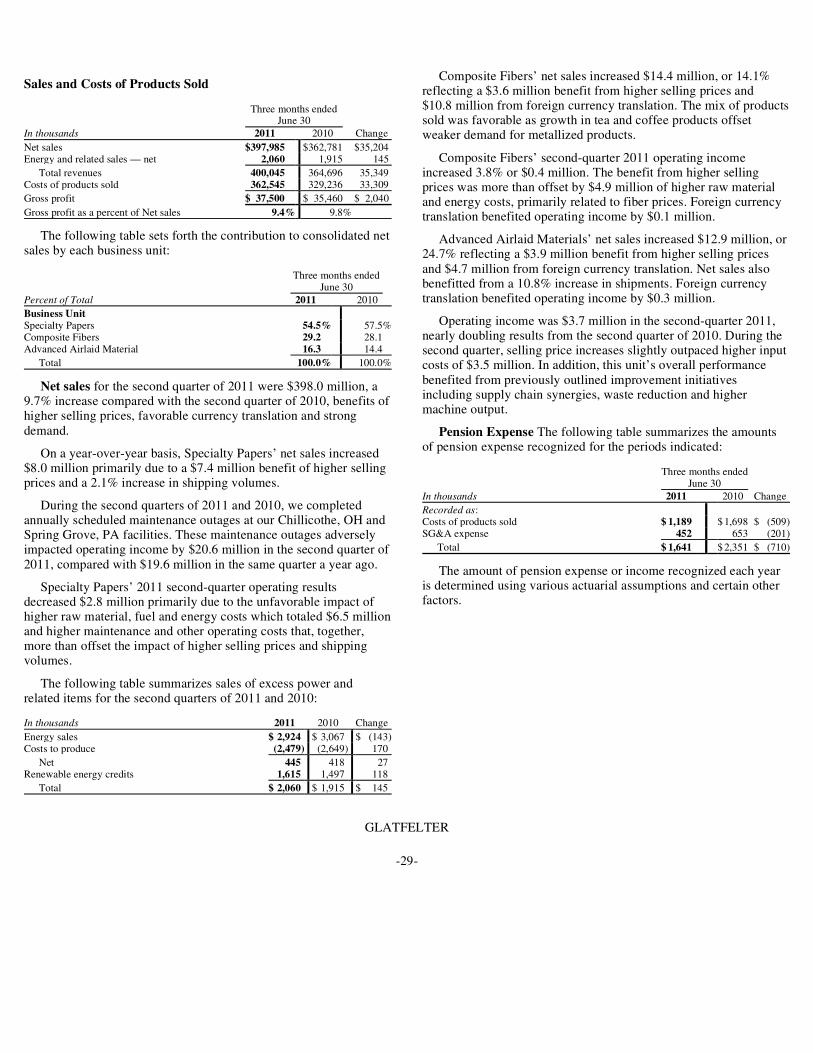
GLATFELTER
-29-
Sales and Costs of Products Sold
The following table sets forth the contribution to consolidated net sales by each business unit:
Net sales for the second quarter of 2011 were $398.0 million, a 9.7% increase compared with the second quarter of 2010, benefits of higher selling prices, favorable currency translation and strong demand.
On a year-over-year basis, Specialty Papers’ net sales increased $8.0 million primarily due to a $7.4 million benefit of higher selling prices and a 2.1% increase in shipping volumes.
During the second quarters of 2011 and 2010, we completed annually scheduled maintenance outages at our Chillicothe, OH and Spring Grove, PA facilities. These maintenance outages adversely impacted operating income by $20.6 million in the second quarter of 2011, compared with $19.6 million in the same quarter a year ago.
Specialty Papers’ 2011 second-quarter operating results decreased $2.8 million primarily due to the unfavorable impact of higher raw material, fuel and energy costs which totaled $6.5 million and higher maintenance and other operating costs that, together, more than offset the impact of higher selling prices and shipping volumes.
The following table summarizes sales of excess power and related items for the second quarters of 2011 and 2010:
Three months ended June 30 In thousands 2011 2010 Change
Net sales $397,985 $362,781 $35,204Energy and related sales — net 2,060 1,915 145
Total revenues 400,045 364,696 35,349Costs of products sold 362,545 329,236 33,309
Gross profit $ 37,500 $ 35,460 $ 2,040
Gross profit as a percent of Net sales 9.4% 9.8%
Three months ended June 30Percent of Total 2011 2010
Business Unit Specialty Papers 54.5% 57.5%Composite Fibers 29.2 28.1Advanced Airlaid Material 16.3 14.4
Total 100.0% 100.0%
In thousands 2011 2010 Change
Energy sales $ 2,924 $ 3,067 $ (143)Costs to produce (2,479) (2,649) 170
Net 445 418 27Renewable energy credits 1,615 1,497 118
Total $ 2,060 $ 1,915 $ 145
Composite Fibers’ net sales increased $14.4 million, or 14.1% reflecting a $3.6 million benefit from higher selling prices and $10.8 million from foreign currency translation. The mix of products sold was favorable as growth in tea and coffee products offset weaker demand for metallized products.
Composite Fibers’ second-quarter 2011 operating income increased 3.8% or $0.4 million. The benefit from higher selling prices was more than offset by $4.9 million of higher raw material and energy costs, primarily related to fiber prices. Foreign currency translation benefited operating income by $0.1 million.
Advanced Airlaid Materials’ net sales increased $12.9 million, or 24.7% reflecting a $3.9 million benefit from higher selling prices and $4.7 million from foreign currency translation. Net sales also benefitted from a 10.8% increase in shipments. Foreign currency translation benefited operating income by $0.3 million.
Operating income was $3.7 million in the second-quarter 2011, nearly doubling results from the second quarter of 2010. During the second quarter, selling price increases slightly outpaced higher input costs of $3.5 million. In addition, this unit’s overall performance benefited from previously outlined improvement initiatives including supply chain synergies, waste reduction and higher machine output.
Pension Expense The following table summarizes the amounts of pension expense recognized for the periods indicated:
The amount of pension expense or income recognized each year is determined using various actuarial assumptions and certain other factors.
Three months ended June 30
In thousands 2011 2010 Change
Recorded as: Costs of products sold $ 1,189 $ 1,698 $ (509)SG&A expense 452 653 (201)
Total $ 1,641 $ 2,351 $ (710)
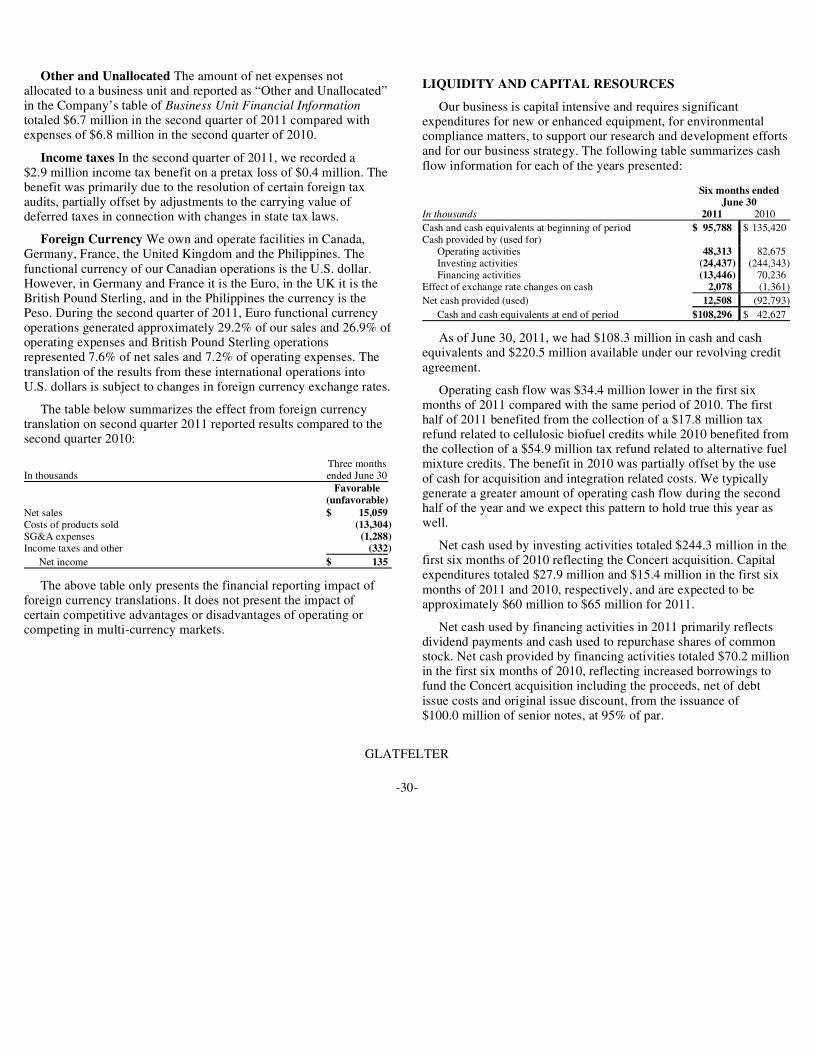
GLATFELTER
-30-
Other and Unallocated The amount of net expenses not allocated to a business unit and reported as “Other and Unallocated” in the Company’s table of Business Unit Financial Information totaled $6.7 million in the second quarter of 2011 compared with expenses of $6.8 million in the second quarter of 2010.
Income taxes In the second quarter of 2011, we recorded a $2.9 million income tax benefit on a pretax loss of $0.4 million. The benefit was primarily due to the resolution of certain foreign tax audits, partially offset by adjustments to the carrying value of deferred taxes in connection with changes in state tax laws.
Foreign Currency We own and operate facilities in Canada, Germany, France, the United Kingdom and the Philippines. The functional currency of our Canadian operations is the U.S. dollar. However, in Germany and France it is the Euro, in the UK it is the British Pound Sterling, and in the Philippines the currency is the Peso. During the second quarter of 2011, Euro functional currency operations generated approximately 29.2% of our sales and 26.9% of operating expenses and British Pound Sterling operations represented 7.6% of net sales and 7.2% of operating expenses. The translation of the results from these international operations into U.S. dollars is subject to changes in foreign currency exchange rates.
The table below summarizes the effect from foreign currency translation on second quarter 2011 reported results compared to the second quarter 2010:
The above table only presents the financial reporting impact of foreign currency translations. It does not present the impact of certain competitive advantages or disadvantages of operating or competing in multi-currency markets.
Three monthsIn thousands ended June 30 Favorable (unfavorable)
Net sales $ 15,059Costs of products sold (13,304)SG&A expenses (1,288)Income taxes and other (332)
Net income $ 135
LIQUIDITY AND CAPITAL RESOURCES
Our business is capital intensive and requires significant expenditures for new or enhanced equipment, for environmental compliance matters, to support our research and development efforts and for our business strategy. The following table summarizes cash flow information for each of the years presented:
As of June 30, 2011, we had $108.3 million in cash and cash equivalents and $220.5 million available under our revolving credit agreement.
Operating cash flow was $34.4 million lower in the first six months of 2011 compared with the same period of 2010. The first half of 2011 benefited from the collection of a $17.8 million tax refund related to cellulosic biofuel credits while 2010 benefited from the collection of a $54.9 million tax refund related to alternative fuel mixture credits. The benefit in 2010 was partially offset by the use of cash for acquisition and integration related costs. We typically generate a greater amount of operating cash flow during the second half of the year and we expect this pattern to hold true this year as well.
Net cash used by investing activities totaled $244.3 million in the first six months of 2010 reflecting the Concert acquisition. Capital expenditures totaled $27.9 million and $15.4 million in the first six months of 2011 and 2010, respectively, and are expected to be approximately $60 million to $65 million for 2011.
Net cash used by financing activities in 2011 primarily reflects dividend payments and cash used to repurchase shares of common stock. Net cash provided by financing activities totaled $70.2 million in the first six months of 2010, reflecting increased borrowings to fund the Concert acquisition including the proceeds, net of debt issue costs and original issue discount, from the issuance of $100.0 million of senior notes, at 95% of par.
Six months ended
June 30In thousands 2011 2010
Cash and cash equivalents at beginning of period $ 95,788 $ 135,420 Cash provided by (used for)
Operating activities 48,313 82,675Investing activities (24,437) (244,343)Financing activities (13,446) 70,236
Effect of exchange rate changes on cash 2,078 (1,361)
Net cash provided (used) 12,508 (92,793)
Cash and cash equivalents at end of period $108,296 $ 42,627
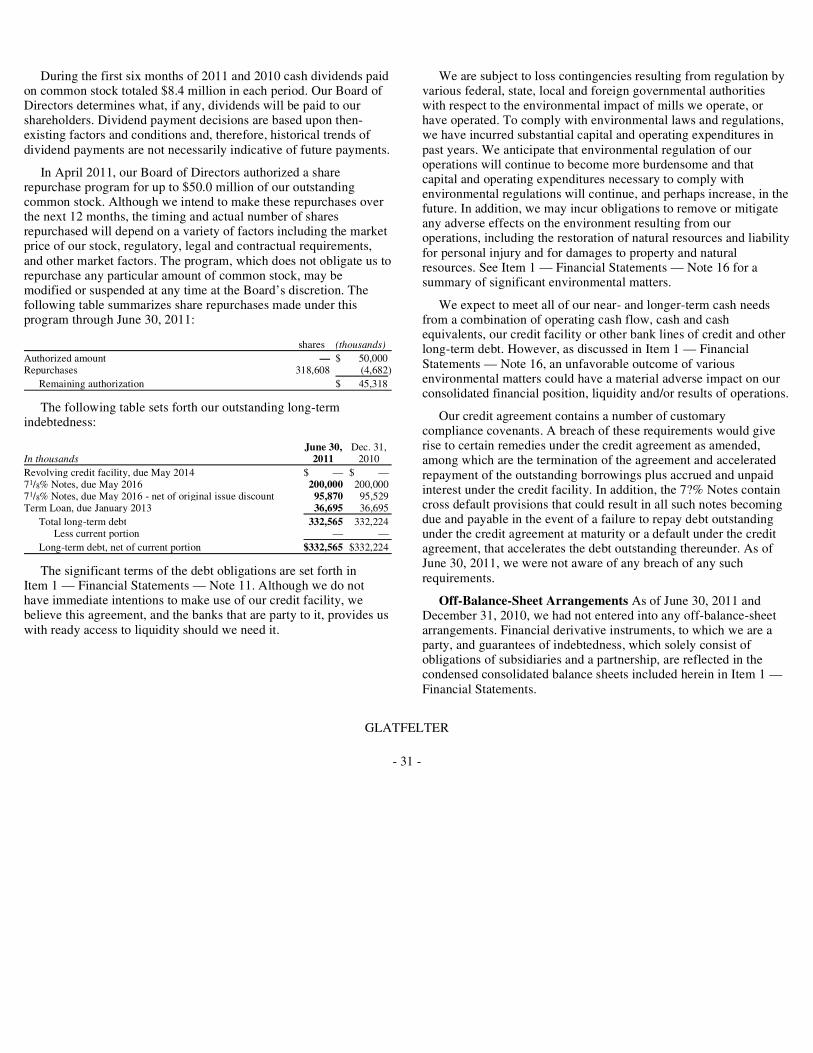
GLATFELTER
- 31 -
During the first six months of 2011 and 2010 cash dividends paid on common stock totaled $8.4 million in each period. Our Board of Directors determines what, if any, dividends will be paid to our shareholders. Dividend payment decisions are based upon then-existing factors and conditions and, therefore, historical trends of dividend payments are not necessarily indicative of future payments.
In April 2011, our Board of Directors authorized a share repurchase program for up to $50.0 million of our outstanding common stock. Although we intend to make these repurchases over the next 12 months, the timing and actual number of shares repurchased will depend on a variety of factors including the market price of our stock, regulatory, legal and contractual requirements, and other market factors. The program, which does not obligate us to repurchase any particular amount of common stock, may be modified or suspended at any time at the Board’s discretion. The following table summarizes share repurchases made under this program through June 30, 2011:
The following table sets forth our outstanding long-term indebtedness:
The significant terms of the debt obligations are set forth in Item 1 — Financial Statements — Note 11. Although we do not have immediate intentions to make use of our credit facility, we believe this agreement, and the banks that are party to it, provides us with ready access to liquidity should we need it.
shares (thousands)
Authorized amount — $ 50,000Repurchases 318,608 (4,682)
Remaining authorization $ 45,318
June 30, Dec. 31,In thousands 2011 2010
Revolving credit facility, due May 2014 $ — $ —71/8% Notes, due May 2016 200,000 200,00071/8% Notes, due May 2016 - net of original issue discount 95,870 95,529Term Loan, due January 2013 36,695 36,695
Total long-term debt 332,565 332,224Less current portion — —
Long-term debt, net of current portion $332,565 $332,224
We are subject to loss contingencies resulting from regulation by various federal, state, local and foreign governmental authorities with respect to the environmental impact of mills we operate, or have operated. To comply with environmental laws and regulations, we have incurred substantial capital and operating expenditures in past years. We anticipate that environmental regulation of our operations will continue to become more burdensome and that capital and operating expenditures necessary to comply with environmental regulations will continue, and perhaps increase, in the future. In addition, we may incur obligations to remove or mitigate any adverse effects on the environment resulting from our operations, including the restoration of natural resources and liability for personal injury and for damages to property and natural resources. See Item 1 — Financial Statements — Note 16 for a summary of significant environmental matters.
We expect to meet all of our near- and longer-term cash needs from a combination of operating cash flow, cash and cash equivalents, our credit facility or other bank lines of credit and other long-term debt. However, as discussed in Item 1 — Financial Statements — Note 16, an unfavorable outcome of various environmental matters could have a material adverse impact on our consolidated financial position, liquidity and/or results of operations.
Our credit agreement contains a number of customary compliance covenants. A breach of these requirements would give rise to certain remedies under the credit agreement as amended, among which are the termination of the agreement and accelerated repayment of the outstanding borrowings plus accrued and unpaid interest under the credit facility. In addition, the 7?% Notes contain cross default provisions that could result in all such notes becoming due and payable in the event of a failure to repay debt outstanding under the credit agreement at maturity or a default under the credit agreement, that accelerates the debt outstanding thereunder. As of June 30, 2011, we were not aware of any breach of any such requirements.
Off-Balance-Sheet Arrangements As of June 30, 2011 and December 31, 2010, we had not entered into any off-balance-sheet arrangements. Financial derivative instruments, to which we are a party, and guarantees of indebtedness, which solely consist of obligations of subsidiaries and a partnership, are reflected in the condensed consolidated balance sheets included herein in Item 1 — Financial Statements.

ITEM 3. QUANTITATIVE AND QUALITATIVE DISCLOSURES ABOUT MARKET RISKS
The amounts represent average face amount of bonds outstanding. Such amounts include $100.0 million of bonds issued at a 5% original issue discount resulting in an 8.16% yield. The carrying value set forth above is net of unamortized original issue discount.
GLATFELTER
-32-
Year Ended December 31 At June 30, 2011Dollars in thousands 2011 2012 2013 2014 2015 Carrying Value Fair Value
Long-term debt Average principal outstanding
At fixed interest rates — Bond (1) $ 300,000 $ 300,000 $ 300,000 $ 300,000 $ 300,000 $ 295,870 $ 305,500At variable interest rates 36,695 36,695 1,407 — — 36,695 37,650
$ 332,565 $ 343,150
Weighted-average interest rate On fixed rate debt — Bond 7.13% 7.13% 7.13% 7.13% 7.13% On variable rate debt 1.66 1.66 1.66
Outlook For Specialty Papers, we expect shipping volumes in the third quarter of 2011 to be approximately 5% ahead of the second quarter of 2011 levels and selling prices are expected to increase at a faster pace than input costs. During the second quarter the business completed its annual maintenance outages at a cost of $20.6 million and during the current quarter the business will complete normal third quarter maintenance outages with an estimated cost of $2.5 million.
For Composite Fibers, we anticipate shipping volumes to be approximately five percent higher than the second quarter including shipments of tea and coffee products increasing approximately ten percent. Selling prices for the third quarter are expected to be in-line with the second quarter with input costs rising moderately.
Shipping volumes for the Advanced Airlaid Materials business unit in the third quarter of 2011 are expected to increase by approximately 5% compared with the second quarter. Selling prices and input costs are expected to be largely in-line with the second quarter levels.
During the third quarter of 2011, we will record a $2.0 million one-time settlement charge on a pre-tax basis related to a non-qualified pension plan.
The table above presents average principal outstanding of our long-term debt and related interest rates for the next five years. The amounts set forth above for fixed rate bonds represent the coupon rate. Such amounts include $100.0 million of bonds issued at a 5% original issue discount resulting in an 8.16% yield. Fair values included herein have been determined based upon rates currently available to us for debt with similar terms and remaining maturities. Our market risk exposure primarily results from changes in interest rates and currency exchange rates. At June 30, 2011, we had long-term debt outstanding of $332.6 million, of which $36.7 million or 11.0% was at variable interest rates.
Variable-rate debt outstanding represents a cash collateralized borrowing incurred in connection with the 2007 installment timberland sale that accrues interest based on six month LIBOR plus a margin. At June 30, 2011, the weighted average interest rate paid on variable rate debt was 1.66%. A hypothetical 100 basis point increase or decrease in the interest rate on variable rate debt would increase or decrease annual interest expense by $0.4 million.
We are subject to certain risks associated with changes in foreign currency exchange rates to the extent our operations are conducted in currencies other than the U.S. Dollar. During the first six months of 2011, Euro
functional currency operations generated approximately 28.9% of our sales and 27.2% of operating expenses and British Pound Sterling operations represented 7.9% of net sales and 7.6% of operating expenses.
ITEM 4. CONTROLS AND PROCEDURES
Evaluation of Disclosure Controls and Procedures Our chief executive officer and our principal financial officer, after evaluating the effectiveness of our disclosure controls and procedures (as defined in Exchange Act Rules 13a-15(e) and 15d-15(e)) as of June 30, 2011, have concluded that, as of the evaluation date, our disclosure controls and procedures are effective.
Changes in Internal Controls There were no changes in our internal control over financial reporting during the three months ended June 30, 2011, that have materially affected or are reasonably likely to materially affect our internal control over financial reporting.

PART II
ITEM 6. EXHIBITS
The following exhibits are filed herewith or incorporated by reference as indicated.
SIGNATURES
Pursuant to the requirements of Section 13 or 15(d) of the Securities Exchange Act of 1934, the Registrant has duly caused this report to be signed on its behalf by the undersigned, thereunto duly authorized.
GLATFELTER
-33-
31.1
Certification of Dante C. Parrini, Chairman and Chief Executive Officer of Glatfelter, pursuant to Section 302(a) of the Sarbanes-Oxley Act of 2002.
31.2
Certification of John P. Jacunski, Senior Vice President and Chief Financial Officer of Glatfelter, pursuant to Section 302(a) of the Sarbanes-Oxley Act of 2002.
32.1
Certification of Dante C. Parrini, Chairman and Chief Executive Officer of Glatfelter, pursuant to Section 906 of the Sarbanes-Oxley Act of 2002, 18 U.S.C. Section 1350.
32.2
Certification of John P. Jacunski, Senior Vice President and Chief Financial Officer of Glatfelter, pursuant to Section 906 of the Sarbanes-Oxley Act of 2002, 18 U.S.C. Section 1350.
101.INS XBRL Instance Document * 101.SCH XBRL Taxonomy Extension Schema * 101.CAL XBRL Extension Calculation Linkbase * 101.LAB XBRL Extension Label Linkbase * 101.PRE XBRL Extension Presentation Linkbase *
* Furnished herewith.
P. H. GLATFELTER COMPANY
(Registrant)
August 5, 2011 By /s/ David C. Elder David C. Elder Vice President and Corporate Controller

EXHIBIT INDEX
GLATFELTER
-34-
Exhibit Number Description
31.1
Certification of Dante C. Parrini, Chairman and Chief Executive Officer of Glatfelter, pursuant to Section 302(a) of the Sarbanes-Oxley Act of 2002, 18 U.S.C. Section 1350 — Chief Executive Officer, filed herewith.
31.2
Certification of John P. Jacunski, Senior Vice President and Chief Financial Officer of Glatfelter, pursuant to Section 302(a) of the Sarbanes-Oxley Act of 2002 — Chief Financial Officer, filed herewith.
32.1
Certification of Dante C. Parrini, Chairman and Chief Executive Officer of Glatfelter, pursuant to Section 906 of the Sarbanes-Oxley Act of 2002 — Chief Executive Officer, filed herewith.
32.2
Certification of John P. Jacunski, Senior Vice President and Chief Financial Officer of Glatfelter, pursuant to Section 906 of the Sarbanes-Oxley Act of 2002, 18 U.S.C. Section 1350 — Chief Financial Officer, filed herewith.
101.INS XBRL Instance Document * 101.SCH XBRL Taxonomy Extension Schema * 101.CAL XBRL Extension Calculation Linkbase * 101.LAB XBRL Extension Label Linkbase * 101.PRE XBRL Extension Presentation Linkbase *
* Furnished herewith.