Ozone smog in surface air: Background contributions and ...
13
SIPA ESP MPA Program LDEO, Palisades, NY July 1, 2013 83520601 Arlene M. Fiore www.ldeo.columbia.edu/~amfiore Ozone smog in surface air: Background contributions and climate connections Haze over Boston, MA http://www.airnow.gov/index.cfm?action=particle_health.page1#3
Transcript of Ozone smog in surface air: Background contributions and ...

SIPA ESP MPA Program
LDEO, Palisades, NY July 1, 2013 83520601
Arlene M. Fiore www.ldeo.columbia.edu/~amfiore
Ozone smog in surface air: Background contributions and climate connections
Haze over Boston, MA http://www.airnow.gov/index.cfm?action=particle_health.page1#3

Exceeds standard (24% of sites)
The U.S. ozone smog problem is spatially widespread, affecting ~108 million people [U.S. EPA, 2012]
http://www.epa.gov/airtrends/2011/index.html
4th highest maximum daily 8-hr average (MDA8) O3 in 2010
High-O3 events typically occur in -- densely populated areas (local sources) -- summer (favorable meteorological conditions)
Future?
à Lower threshold would greatly expand non-attainment regions

Tropospheric O3 formation & “Background” contributions
Continent!
NMVOCs!CO!
NOx +
O3
Fires!Biosphere!Human!activity! Ocean !
METHANE (CH4)!
stratosphere!
lightning!
“Background” ozone !
Natural !sources!
Continent!
X X
intercontinental transport!!
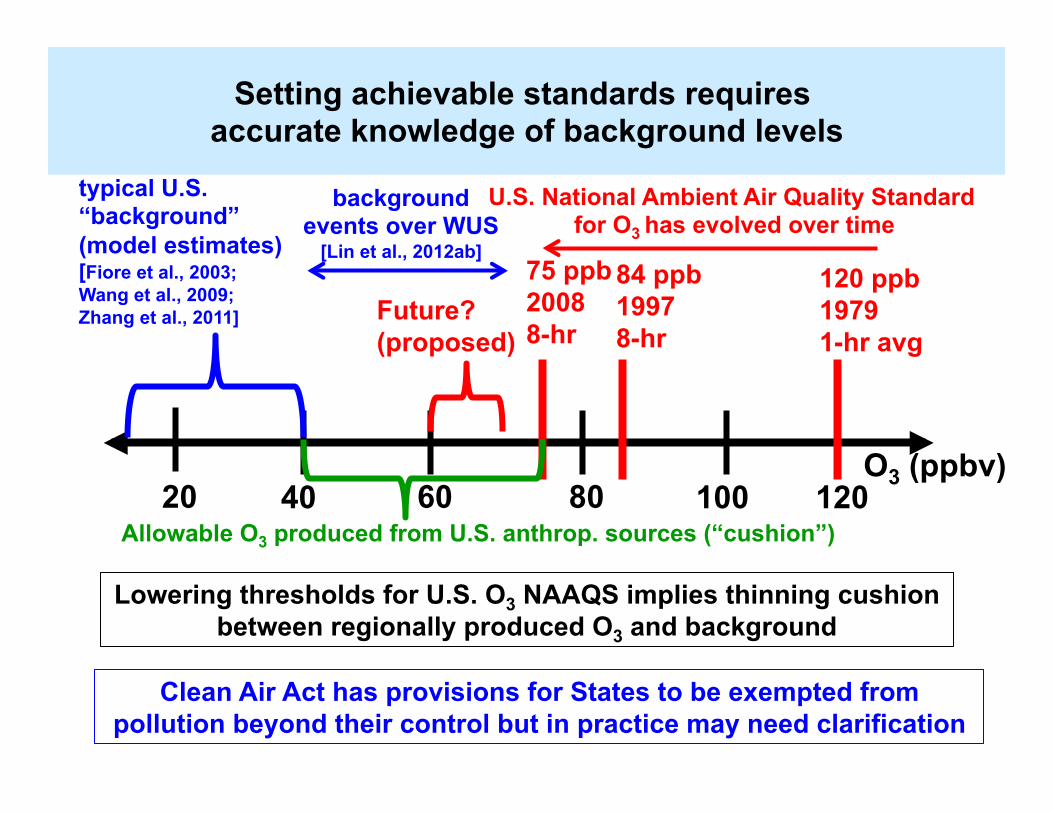
Setting achievable standards requires accurate knowledge of background levels
120 ppb 1979 1-hr avg
84 ppb 1997 8-hr
75 ppb 2008 8-hr
40 60 80 100 120 O3 (ppbv)
20
U.S. National Ambient Air Quality Standard for O3 has evolved over time
Future? (proposed)
typical U.S. “background” (model estimates) [Fiore et al., 2003; Wang et al., 2009; Zhang et al., 2011]
Allowable O3 produced from U.S. anthrop. sources (“cushion”)
Lowering thresholds for U.S. O3 NAAQS implies thinning cushion between regionally produced O3 and background
background events over WUS
[Lin et al., 2012ab]
Clean Air Act has provisions for States to be exempted from pollution beyond their control but in practice may need clarification

Some challenges for WUS O3 air quality management
Asia! Pacific!
stratosphere! lightning!
Wildfire, biogenic !
Western USA!
Rising Asian emissions [e.g., Jacob et al., 1999; Richter et al., 2005; Cooper et al., 2010]
Natural events e.g., stratospheric [Langford et al [2009]; fires [Jaffe & Wigder, 2012]
Warming climate +in polluted regions [Jacob & Winner, 2009 review] + natural sources [recent reviews: Isaksen et al., 2009; Fiore et al., 2012] ? Transport pathways
Need process-level understanding on daily to multi-decadal time scales
X
methane!
“Background Ozone” intercontinental!!transport!

Estimates of Asian and stratospheric influence on WUS surface ozone in spring
TOOL: GFDL AM3 chemistry-climate model [Donner et al., J. Clim. 2011] • ~50x50 km2 Jan-Jun 2010 – overlaps period of intensive field measurements (CalNex) • Nudged to GFS (“real”) winds – allows direct comparison with snapshot observations • Fully coupled chemistry in the stratosphere and troposphere within a climate model
Do they influence high-O3 events in populated regions?
Mean MDA8 O3 in surface air Asian: May-June 2010
0 2 6 4 8 O3 (ppb)
Base Simulation – Zero Asian anth. emissions
[Lin et al., JGR, 2012a]
O3 (ppb)
Stratospheric (O3S): April-June 2010
Tagged above e90 tropopause [Prather et al., 2011] + subjected to same loss processes as tropospheric O3.
[Lin et al., JGR, 2012b]

Stratosphere-to-troposphere (STT) O3 transport influence on WUS high-O3 events
à Ongoing work exploring development of space-based indicators
AIRS, May 25-29
Alti
tude
(km
a.s
.l.)
North à South
Sonde O3, May 28
300 hPa PV
Total column O3 [DU]
[ppb] 30 60 90 150 120
Would STT confound attainment of tighter standards in WUS?
Are exceptional events accurately identified?
Surface MDA8 O3, May 29
TH RY
PS
SN JT
SH
15 25 35 45 55 [ppb]
M. Lin et al., JGR, 2012b
Model (AM3): stratospheric O3
Observed Total O3

Asian O3 pollution over S. CA: Trans-pacific transport + subsidence to lower troposphere
à We find these events sometimes contribute to ‘pushing’ O3 in surface air above thresholds of 60 and 70 ppb [Lin et al., JGR, 2012a]
Satellite CO columns (AIRS)
May 8
May 6
May 4
[1018 molecules cm-2]
θ [K] Alti
tude
(km
a.s
.l.)
Latitude (Nà S) along CA [ppb]
10 20 0 30
GFDL AM3 Model Asian O3
Consistent with sonde and aircraft [Lin et al., JGR, 2012a]
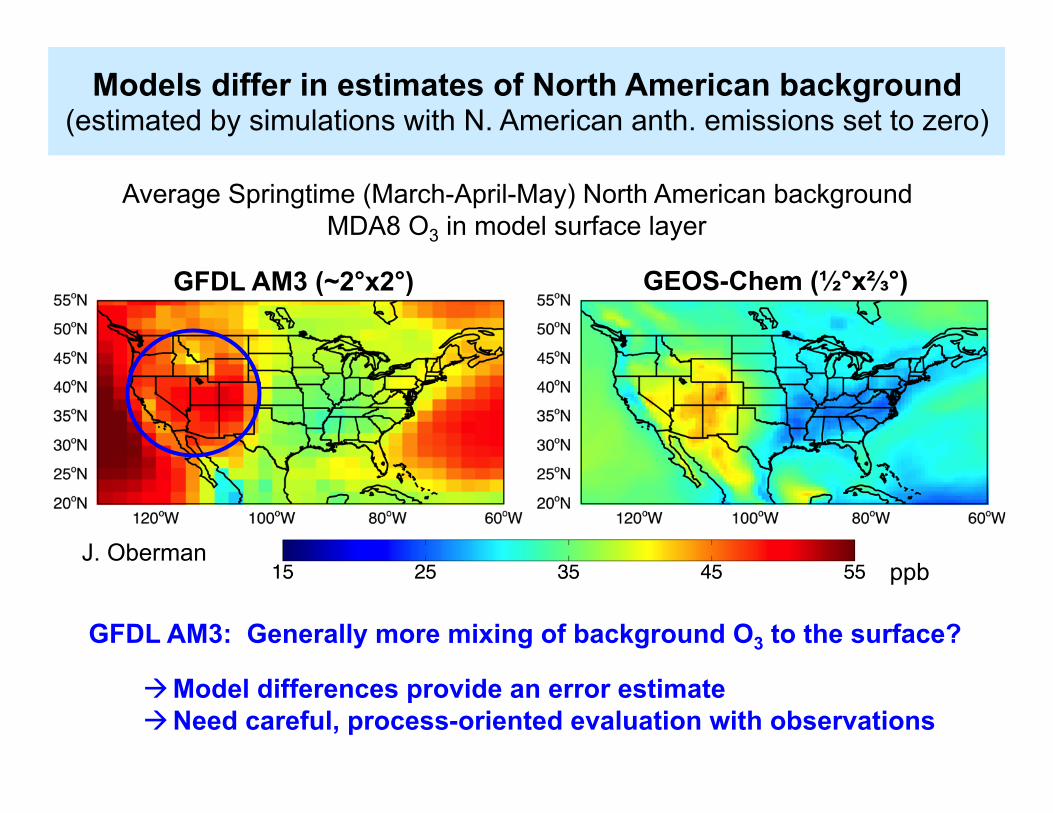
GFDL AM3 (~2°x2°)
GEOS-Chem (½°x⅔°)
Average Springtime (March-April-May) North American background MDA8 O3 in model surface layer
GFDL AM3: Generally more mixing of background O3 to the surface?
J. Oberman ppb
Models differ in estimates of North American background (estimated by simulations with N. American anth. emissions set to zero)
à Model differences provide an error estimate à Need careful, process-oriented evaluation with observations

Air pollution-climate connection via methane
à Possible at cost-savings / low-cost [West & Fiore 2005; West et al.,2012]
à $1.4 billion (agriculture, forestry, non-mortality health) within U.S. alone [West and Fiore, 2005]
à 7700-400,000 annual avoided cardiopulmonary premature mortalities in the N. Hemisphere uncertainty in concentration-response relationship only [Anenberg et al., ES&T, 2009]
Range over 18 models
Global mean avoided warming in
2050 (°C) [WMO/UNEP, 2011]
CLIMATE OZONE AIR QUALITY
N. America Europe East Asia South Asia [Fiore et al., JGR, 2009; TF HTAP, 2007, 2010; Wild et al., ACP, 2012]
Benefits of ~25% decrease in global anthrop. methane emissions

Models estimate ‘climate change penalty’ on surface O3 over wide U.S. regions but often disagree in sign regionally
à Uncertain regional climate responses to global warming à Gap in analysis over much of mountainous West à How will background change? (e.g., frequency of fires, strat. intrusions)
Modeled changes in summer mean of daily max 8-hour O3 (ppb; future – present)
NE MW WC GC SE
Weaver et al., BAMS, 2009
Increases (2 to 8 ppb) in all models over large U.S. regions

Ozone smog in surface air: background and climate connections- Summary and intersections with public policy
http://science.house.gov/hearing/subcommittee-environment-background-check-achievability-new-ozone-standards
Background generally well below NAAQS thresholds in populated regions
High-altitude western U.S. is susceptible to natural events (stratospheric O3 intrusions; wildfires) and international pollutant transport
à formulation of standard (4th highest, 3 year average) allows some room à ‘Exceptional event’ and ‘international transport’ provisions in Clean Air Act but implementation needs clarification à Ongoing review (every 5 years) of science supporting O3 NAAQS; related Congressional hearing June 12, 2013
NASA Air Quality Applied Sciences Team (www.aqast.org): Earth Science Serving Air Quality Management Needs
Climate warming expected to alter pollutant levels à increase O3 in already polluted regions (‘climate penalty’) à alter natural sources (wildfires, stratospheric, biogenic emissions) à occur in context of future global and regional emission changes
Methane controls: ‘win-win’ for near-term climate, air quality; also economic à Climate and Clean Air Coalition (http://www.unep.org/ccac/)

à Implies that changes in climate will influence air quality
Observations at U.S. EPA CASTNet site Penn State, PA 41N, 78W, 378m
July mean MDA8 O3 (ppb)
Strong correlations between surface temperature and O3 measurements on daily to inter-annual time scales in polluted regions [e.g., Bloomer et al., 2009;
Camalier et al., 2007; Cardelino and Chameides, 1990; Clark and Karl, 1982; Korsog and Wolff, 1991]
T NOx OH
PAN H2O VOCs
Deposition
2. Feedbacks (Emis, Chem, Dep)
10am
-5pm
avg
pollutant sources
Degree of mixing
1. Meteorology (e.g., air stagnation) What drives the observed O3-Temperature correlation?