OzFuel Pre-Phase A Study - inspace.anu.edu.au
46
OzFuel Pre-Phase A Study Australian Forest Fuel Monitoring from Space
Transcript of OzFuel Pre-Phase A Study - inspace.anu.edu.au

OzFuel Pre-Phase A Study Australian Forest Fuel Monitoring from Space

OzFuel Pre-Phase A Study: Australian Forest Fuel Monitoring From Space
Published by the ANU Institute for Space, August 2021.
For enquiries about this study, please contact:
Professor Anna Moore, Director
ANU Institute for Space
121 Marcus Clarke Street
Canberra, ACT 2601
Citation: ANU Institute for Space (2021), OzFuel Pre-Phase A Study: Australian Forest Fuel Monitoring
From Space, August 2021; available at: inspace.anu.edu.au/activity/missions/ozfuel
The Australian National University
CRICOS Provider No. 00120C

1
Executive Summary This document presents the results of a Pre-Phase A study for the OzFuel bushfire fuel monitoring
mission in accordance with NASA system engineering standards.
The OzFuel Pre-Phase A Study (Australian Forest Fuel Monitoring from Space) report was developed
by the Australian National University (ANU) Institute for Space for Geoscience Australia (GA) and
CSIRO in support of their contribution to Australia’s Satellite Cross-Calibration Radiometer (SCR) and
AquaWatch missions (UNSW Canberra Space, 2021).
The OzFuel study conceptualises a multispectral bushfire fuel monitoring satellite mission to fulfil
two major goals:
To launch a dedicated science and research mission to mitigate the risk of future
catastrophic bushfires; and
To deliver an Australian designed and built pathfinder mission to de-risk the SCR program.
Key outcomes of the OzFuel mission are:
Australian capability enables the forward-looking development of a fully operational satellite
constellation for bushfire prevention, mitigation and resilience.
ANU expertise in global fuel hazard spatial data augments international commercial and
government fire detection initiatives.
Space-proven Australian detector technology becomes available for national and
commercial small satellite missions.
This report comprises two parts:
Part 1: OzFuel Mission Requirements developed by Nicolas Younes and Marta Yebra from
the ANU Fenner School of Environment & Society. The report introduces the OzFuel mission,
the need for a dedicated fuel monitoring mission, and the remote sensing requirements for
a pathfinder mission.
Part 2: OzFuel Technical Overview developed by Rob Sharp from the ANU Advanced
Instrumentation & Technology Centre. The overview outlines the technical design and
payload options for the OzFuel-1mission.
The climate crisis over the past decade culminated in the unprecedented 2019/2020 Australian
bushfire conditions that were more catastrophic than expected or modelled. The risk of larger and
more frequent mega-fires is only going to increase in future years. Allocating further ground
resources to suppress fires is extremely costly and dangerous, and needs to be augmented with
more effective prediction, prevention and mitigation strategies before an unforeseen ignition event
burns out of control.
One of the most crucial aspects of fire prevention is understanding vegetative fuel state. The 2020
Royal Commission into National Natural Disasters highlights the need for whole-of-continent
visibility of vegetative fuel state – how much fuel there is and how dry it is. Australia relies on foreign
satellite data which is not optimised for measuring our unique bush landscape. The growing need for

2
sovereign satellites to remotely sense Australia’s unique vegetation has been supported by
recommendations from government, agencies, industry and research institutions.
Royal Commission into National Natural Disasters
Recommendation 17.3 Classification, recording and sharing of fuel load data
Australian state and territory governments should develop consistent processes for the classification,
recording and sharing of fuel load data.
The OzFuel mission aims to monitor fuel conditions via satellite remote sensing to deliver whole-of-
continent fuel spatial data at the optimum spatial, temporal and spectral resolution. Conceptualised
as a pathfinder to a national environmental monitoring constellation, the mission will provide critical
bushfire Earth observation data to support government, frontline organisations and communities for
enhanced bushfire situational awareness and preparedness.
OzFuel is being developed in parallel with the CHICO mission, a dual-use hyperspectral imager for
water quality monitoring (ANU and partners). While each pathfinder has unique user requirements,
both serve as a staged series of development missions to de-risk critical sovereign capabilities and
enable larger, fully operational national satellite missions.
Figure 1. ANU small satellite mission roadmap in support of an Australian multi-mission small satellite launch
program for Earth observation (Deloitte Access Economics, 2021). OzFuel and CHICO are Earth observation
missions under development at the ANU. SCR refers to the Satellite Cross-Calibration Radiometer feasibility
study undertaken by UNSW Canberra Space (2021).

3
Recommendations following this study include:
Fieldwork to verify and validate the preliminary requirements identified for remote sensing
of fuel conditions during the upcoming 2021/22 fire season.
A follow-on Phase A concurrent engineering study and mission analysis for the OzFuel-1
pathfinder;
Market analysis for OzFuel shortwave infrared data and potential distribution channels.
The results of this study will inform the Australian Space Agency Earth Observation from Space
Technology Roadmap (“the Roadmap”) being developed by The Agency, in close partnership with
the Bureau of Meteorology, CSIRO, the Department of Defence, Geoscience Australia and the
Australian Earth observation community.
Acknowledgements This study was undertaken by the following study participants:

4
Contents Acknowledgements .................................................................................................................................................................. 3
Part I: OzFuel Mission Requirements ................................................................................................................................. 7
1 Introduction ........................................................................................................................................................................ 7
1.1 Background and Justification ........................................................................................................................... 7
1.2 What is OzFuel ....................................................................................................................................................... 9
1.3 Purpose of the OzFuel mission ......................................................................................................................10
1.4 Scope of the document ....................................................................................................................................10
2 Mission requirements ...................................................................................................................................................11
2.1 Revisit frequency .................................................................................................................................................11
2.2 Time of observation ...........................................................................................................................................11
2.3 Ground Sampling Distance .............................................................................................................................11
2.4 Swath width ...........................................................................................................................................................13
2.5 Suggested solar irradiance model ................................................................................................................13
2.6 Albedo .....................................................................................................................................................................15
2.7 Spectral characteristics of the OzFuel sensor ..........................................................................................15
2.7.1 Atmospheric absorption features .......................................................................................................16
2.7.2 Vegetation absorption features ..........................................................................................................16
2.7.3 Proposed spectral bands .......................................................................................................................19
2.8 Radiometric resolution......................................................................................................................................20
2.9 Signal-to-noise ratio ..........................................................................................................................................21
2.10 Geographical coverage .....................................................................................................................................21
2.11 Mission specifications summary ...................................................................................................................21
3 Data products ..................................................................................................................................................................22
Part 2: OzFuel Technical Overview ....................................................................................................................................24
4. Introduction ................................................................................................................................................................24

5
5. OzFuel sensor overview .........................................................................................................................................25
5.1. Mission risk profile and key technology development stages ..........................................................26
6. OzFuel capabilities & sub-systems considerations ....................................................................................27
6.1. High ground resolution ....................................................................................................................................27
6.1.1. The diffraction limits ................................................................................................................................27
6.1.2. Forward motion compensation ...........................................................................................................28
6.1.3. OzFuel GSD .................................................................................................................................................29
6.2. Swath width ...........................................................................................................................................................29
6.2.1. Sensor opening angle .............................................................................................................................29
6.2.2. Focal plane array .......................................................................................................................................30
6.2.3. OzFuel Swath width and field of view ..............................................................................................32
6.3. Satellite bus integration ...................................................................................................................................32
6.4. Cooling systems...................................................................................................................................................34
6.5. Focal plane array detectors and control systems ...................................................................................35
6.6. Optics .......................................................................................................................................................................36
6.7. Calibration ..............................................................................................................................................................37
7. ROM COSTS................................................................................................................................................................38
8. Recommendations ...................................................................................................................................................38
References ..................................................................................................................................................................................39
Acronyms and abbreviations ..............................................................................................................................................42
Appendix A: Relevant documentation ............................................................................................................................44

6
List of Tables Table 1: Expected swath width given a GSD ..................................................................................................................13
Table 2: Proposed bands for the OzFuel sensor ............................................................................................................19
Table 3: Summary of user requirements for the OzFuel mission. ...........................................................................21
Table 4: Comparison between Sentinel-2 and Landsat 8 sensors. .........................................................................23
Table 5: SmallSat sensor multi-mission specification .................................................................................................25
Table 6: Technology developments mitigated with each generation of OzFuel. ...............................................26
Table 7: Fundamental diffraction limited resolution (from 600 km Low Earth Orbit). ...................................28
List of Figures Figure 1. ANU small satellite mission roadmap. ............................................................................................................. 2
Figure 2. Australian Flammability Monitoring System public website. ................................................................... 9
Figure 3: Fuel Moisture Content (FMC) represented at 25 m, 50 m, 70 m, 100 m, 250 m, and 500 m per
pixel for an area in the Canberra (ACT) region. ............................................................................................................13
Figure 4: Spectral irradiance produced by the SMARTS model ................................................................................14
Figure 5: SMARTS transmittance of absorption gases.................................................................................................15
Figure 6: Solar irradiance derived from SMARTS ..........................................................................................................16
Figure 7: Location of the spectral bands of 25 Earth Observation satellites in the 400-2500 nm range. 17
Figure 8: Leaf spectra with varying amounts of water, mass. ..................................................................................18
Figure 9: Spectral bands associated with leaf cellulose and lignin in the 1000-2500 nm range. ...............19
Figure 10: Spectral bands proposed for the OzFuel mission. ....................................................................................20
Figure 11: A representation of the OzFuel focal plane ...............................................................................................25
Figure 12: Focal plane array of the Gemini Observatory GeMS instrument. ......................................................31
Figure 13: Wide swath width as a design driver for the ESA Sentinel-2 mission. .............................................32
Figure 14: CAD rendering of the Skykraft ATM satellite platform is shown hosting the OzFuel SWIR
multi-spectral sensor...............................................................................................................................................................33
Figure 15: An example of the Skykraft ATM satellite platform with stowed solar panel assembly. ...........33
Figure 16: A CAD rendering of The MSL TheMIS system. ..........................................................................................35
Figure 17: The Thales LSD9997 Stirling cycle cooler at MSL. ...................................................................................35
7
Part I: OzFuel Mission Requirements CONTRIBUTING AUTHORS
Dr Nicolas Younes
Associate Professor Marta Yebra
Professor Robert Sharp
Dr Jia-Urnn Lee
Mr Dale Hughes
RECOMMENDED CITATION
Younes, N.1, Yebra, M.1*, Sharp, R.1, Lee, J.1, Hughes, D.1 2021. OzFuel Mission Requirements version
3.3. OzFuel Pre-Phase A Study: Australian Forest Fuel Monitoring from Space. Australian National
University, Canberra, ACT.
1Australian National University
*Corresponding author.
Email address: [email protected]
Associate Professor Marta Yebra
Fenner School of Environment & Society, Senior Lecturer Research School of Aerospace, Mechanical and Environmental Engineering, Senior Lecturer ANU Institute for Space, Mission Specialist ANU Bushfire Initiative, Director
Optus-ANU Bushfire Research Centre of Excellence, Research Leader
1 Introduction
1.1 Background and Justification
Across Australia, bushfires consume millions of hectares of forests every year. They can cause
millions of dollars in damage to infrastructure and can kill people and animals. Once ignition occurs,
locating the fire, estimating its area and potential routes of spread are vital steps to ensure
communities are safe and damage is kept to a minimum. Comprehensive fuel characterisation is a
critical ‘pre-fire’ element for assessing bushfire risk, predicting fire behaviour, informing suppression
efforts, and planning prescribed burns. A key determinant of successful fire ignition and spread is the
amount of fuel that is dry enough to burn (i.e. fuel load).
Fuel Moisture Content (FMC) is a measure of the amount of water in the fuel available to a fire, and it
is expressed as a per cent of the dry weight of that specific fuel (Equation 1). When the FMC is high,
the energy required for a plant to burn is too high. The fuel will not ignite readily or at all (Yebra et
al., 2018, 2013). In contrast, if the vegetation has low FMC, it can be easily ignited, making it more
flammable and combustible. Knowing how much fuel there is in a given area allows us to estimate

Part I: OzFuel Mission Requirements
8
the potential severity and sustainability of a bushfire. In general, if there is more fuel, flames can be
larger, the fire becomes more intense, and it can burn for longer (Jolly et al., 2014; Jolly and Johnson,
2018).
𝐹𝑀𝐶 =𝐸𝑊𝑇
𝐷𝑀𝐶= (
𝑊𝑓 − 𝑊𝑑
𝐴𝑊𝑑
𝐴
) = 𝑊𝑓 − 𝑊𝑑
𝑊𝑑
Equation 1: Fuel Moisture Content formula, and its relationship with the Equivalent Water Thickness (EWT) and
Dry Matter Content (DMC) (Yebra et al 2013). Wf, Wd, and A represent the fresh weight, dry weight, and area of
the leaf samples, respectively.
Australian fuel conditions are currently tracked and quantified largely via ground assessments,
broad-scale proxies (e.g. weather indices or time since fire), and occasional satellite data at regional
and state levels. Imagery from the Sentinel 2, MODIS (Moderate Resolution Imaging
Spectroradiometer), and Himawari 8 satellites, is increasingly being used to monitor fuel attributes
such as FMC (Yebra et al., 2019, 2018), but some limitations remain. For example, the Australian
Flammability Monitoring System (http://anuwald.science/afms, Figure 2) uses MODIS imagery to
estimate FMC across Australia. Despite being a useful tool, the resolution of MODIS imagery (i.e.
500m) is too coarse for accurate field operations planning. Also, MODIS has already exceeded the
expected lifetime and, at some point in the not-too-distant future, will become inoperative. Likewise,
the Himawari 8 satellite provides satellite imagery of Australia every 10 minutes with the drawback
that its pixel size is 2 km, making it even coarser than MODIS imagery. An alternative to MODIS and
Himawari 8 satellites comes in the form of the Sentinel 2A and 2B satellites. With a pixel size
between 10m – 20m, and a revisit time of ~5 days, the Sentinels provide exceptional spatial detail for
operations planning, however the spectral bands are too wide to capture FMC variations in eucalypt
forests. There is thus a critical scientific and technological gap in bushfire management that can be
filled with a dedicated fuel monitoring mission.
Recently, the New South Wales Bushfire Enquiry, highlighted several limitations of the remote
sensing tools used during the 2019-2020 bushfire season. These limitations included: (1) the lack of
data regarding the characteristics and conditions of the fuel, (2) the low spatial resolution of the
imagery available, and (3) untimely acquisition of high-resolution satellite imagery to inform and
update firefighting efforts (NSW Government, 2021). Some of these limitations were also registered
by the Australian Space Agency’s Bushfire Earth Observation Taskforce report (ASA, 2021). The
Taskforce concluded that one way in which Australia can overcome these limitations was by
”consider[ing] the development of its own capability […] focused on supporting bushfire activities”.
The OzFuel mission is the first step in the creation of an EO early warning system, with high revisit,
high spatial and spectral resolutions. This mission is unique as it will measure fuel properties as
opposed to fire detection. By targeting the specific wavelengths related to dry matter and water
content of eucalypts, OzFuel will provide a comprehensive characterisation of fuel loads at a
continental scale. Its fire prevention function will be the first of its kind in the world, complementing
an array of commercial and government initiatives for active fire detection.

Part I: OzFuel Mission Requirements
9
Figure 2. Screenshots of the Australian Flammability Monitoring System public website (AFMS,
(http://anuwald.science/afms ). The AFMS is the first website in Australia that uses satellite data to collect
information on live fuel moisture content (LFMC). It displays this information on an interactive map, which helps
fire managers schedule and plan their prescribed burning efforts and preposition firefighting resources based
on the flammability of the landscape. The bottom image displays the LFMC map during the Orroral Valley fire in
the Canberra region on 25 January 2020. It reveals very dry fuel continuity on the fire ground. The black areas
represent the total burned extent reported by the emergency authorities at the time and the red flames
represent active fires. Dark blue stripes on areas in the east coast of the map represent artifacts due to thick
smoke and poor quality reflectance data.
1.2 What is OzFuel
OzFuel is a satellite mission specifically designed to monitor fuel loads across Australia.
Eucalypt trees are known to be more flammable than other species. Considering that in Australia,
approximately 77% of forested areas are comprised of eucalypts, it is important to constantly
monitor these forests to detect the signs of imminent bushfires. OzFuel is specifically designed to

Part I: OzFuel Mission Requirements
10
monitor the moisture content and fuel load of eucalypts, and it’s the first of an envisioned
constellation that aims to address the challenges of fuel load monitoring, bushfire hazard mapping,
and resource allocation.
This proof-of-concept mission uses the Short-Wave Infrared (SWIR) region of the electromagnetic
spectrum to monitor changes in fuel moisture and fuel load, thereby highlighting areas vulnerable to
bushfires. OzFuel data will enhance existing flammability modelling and monitoring capabilities such
as the Australian Flammability Monitoring System.
The long-term vision for OzFuel is to have one (or more) hyperspectral satellite(s) that provide(s)
very detailed information on the flammability and fuel condition of eucalypt forests across Australia.
This can be achieved through a staged approach. Here the user needs are defined for the first
OzFuel-1 multispectral imager that will de-risk the development of later generation hyperspectral
satellites.
1.3 Purpose of the OzFuel mission
The Australian National University (ANU) proposes a program of work beginning with the OzFuel
demonstrator mission. The mission will deliver a bespoke sensor system to achieve high ground
resolution, low-noise images, in a suite of pass bands dedicated to monitoring fuel moisture content
and fuel load of Eucalypt trees.
The OzFuel mission was conceived to fulfil three important purposes:
1. Address the need for more efficient national monitoring of fuel conditions and bushfire
prevention across the Australian mainland and Tasmania,
2. Deliver critical data to boots-on-ground resources as a proactive approach to reducing the
likelihood of out-of-control bushfires, and
3. Promote the growth of the space industry while demonstrating Australia’s capabilities to
design and operate a satellite mission.
The expected outcomes of the OzFuel mission are:
Demonstrated Australian capability to develop a fully operational satellite (or satellite
constellation) for bushfire prevention, mitigation and resilience,
Increased and demonstrated expertise of ANU for global fuel hazard monitoring and
assessments,
Contribution of geospatial data to national and international fuel characterisation and fire
detection initiatives, and
Availability of space-proven Australian detector technology for national and commercial
small satellite missions.
1.4 Scope of the document
This document presents the Mission Requirements of the OzFuel mission. The current version of the
document focuses solely on the pathfinder OzFuel mission and does not intend to describe or
specify the requirements of the hyperspectral sensors.
Here we describe the user requirements and technological limitations that have been identified by
potential users in terms of geographical coverage, revisit frequency and spectral sampling. We
present them as specific, quantifiable, and traceable characteristics of the mission.

Part I: OzFuel Mission Requirements
11
This is a living document and will be used in subsequent derivations of the mission requirements and
for the mission implementation.
2 Mission requirements
2.1 Revisit frequency
The revisit frequency refers to the temporal resolution of the satellite. It refers to the time between
when a satellite acquires data over a point on the Earth’s surface and when it returns to that point
again. This frequency does not consider cloud cover or other potential obstructions that impede the
actual observation of a site or place.
Fuel loads in eucalypt forests are not expected to change suddenly (i.e. from one day to the next) but
gradually (i.e. over a period of days or weeks). Therefore, end users would need updated Dry Fuel
Load products and Fuel Moisture Content products on a weekly basis (approximately). For a single
satellite, a temporal resolution of 6-8 days is acceptable. An ideal repeat coverage should be higher
than that for Landsat sensors (i.e. every 16 days) and similar to that of the combined Sentinel 2A and
2B satellites (i.e. every three to five days). This may be accomplished with a constellation of two or
more satellites.
For a single satellite, an imaging frequency of 6-8 days is acceptable.
2.2 Time of observation
The time of observation is the time of day at which an image is captured by the satellite. As a general
principle, the design team should ensure that the time of observation is such that illumination and
viewing directions remain identical (or similar) through time. The aim should be to maximise the
number of images with identical or similar observation configurations.
Considering that FMC changes seasonally and throughout the day (Cheng et al., 2014; Nolan et al.,
2020), it would be desirable to acquire data in the early hours of the afternoon, when vegetation is
more stressed and can be more easily ignited. Images should be acquired, preferably, between
12h00 and 14h00. This schedule will depend on other factors such as cloud prevalence, potential ‘hot
spots’ in images, and other considerations that could complicate image analysis.
2.3 Ground Sampling Distance
The Ground Sampling Distance (GSD) is the distance between the centre points of two consecutive
pixels measured on the ground.
To determine an acceptable GSD for the mission, we performed an experiment whereby we used a
Sentinel 2 image from the Canberra (ACT) region and resampled it to simulate different GSDs. We
used the satellite image (captured on 25-01-2020) to compute FMC with an adapted version of the
Yebra et al. (2018) algorithm. Importantly, we assumed that (1) the GSD of the Sentinel image was
the same as the resampled pixel size of the image (i.e. 25 m), and (2) that the GSD did not vary over
the study area. In Figure 3 we show the FMC at GSD = 25 m with resampled images at 50 m, 70 m,
100 m, 250 m, and 500 m (e.g. MODIS resolution). Visually, images with 25 m and 50 m pixels

Part I: OzFuel Mission Requirements
12
provide a similar amount of information and allow easy identification of ridges, valleys, and places
where potential soft containment lines (e.g. wetter patches of vegetation) could be located (Figure
3B/C). Additionally, studies suggest that some algorithms for species discrimination and phenology
have similar accuracies when pixel sizes ranging between 20m and 60m are used (Roth et al., 2015;
Younes et al., 2021).
Resolutions between 25-70 m provide superior quality information on the FMC gradients in the
landscape at various levels of detail. Considering that FMC maps may be used for prescribed
burning, firefighting efforts, and other fuel management activities, GSDs of 100 m or greater are too
blurred and less informative, especially in terrains with high heterogeneity (Figure 3E/F/G).
As a result, a GSD greater or equal to 100 m is undesirable, but an acceptable GSD for the OzFuel
sensor would be between 20 and 60 m. Keeping in mind that OzFuel’s aim is to deliver critical data
to boots-on-ground (see Section 1.3), a GSD of 50 m would provide enough information for
decision-making while reducing the size of the file and accommodating for a larger swath width
(Section 2.4).

Part I: OzFuel Mission Requirements
13
Figure 3: Fuel Moisture Content (FMC) represented at 25 m, 50 m, 70 m, 100 m, 250 m, and 500 m per pixel for
an area in the Canberra (ACT) region in panels B-G respectively. Panel A) shows a false colour composite (SWIR,
NIR, Red) Sentinel 2A/B image of the study area.
2.4 Swath width
For satellite sensors, the swath width is the strip of the surface of the Earth where data is captured.
For operational purposes, a larger swath width is better, if the spatial resolution of the imagery is not
compromised.
A swath width between 100 km and 150 km, would be desirable. However, given the constraints of the currently
available sensor (i.e. 320 spatial pixels), achieving this swath width would compromise the GSD. The expected
swath widths for different GSD, using the currently available sensor, are shown in
Table 1. A swath width of 16 km - 19.2 km is acceptable for the first generation OzFuel-1. Future
versions of OzFuel should have larger swath widths without compromising the GSD.
Table 1: Expected swath width given a GSD
GSD (m)
No. of
Pixels
Nominal swath
width (m)
20 320 6,400
30 320 9,600
40 320 12,800
50 320 16,000
60 320 19,200
2.5 Suggested solar irradiance model
Solar irradiance refers to the amount of electromagnetic radiation emitted by the sun. It plays a
significant role in the energy and flux changes between the atmosphere and the Earth’s surface.
Therefore, accurate measurements are essential (Huang et al., 2019). Solar irradiance can be
measured by space-borne and land-based sensors, or it can be estimated numerically through
modelling. Measurements of solar irradiance can have coarse spatial resolution (1-20km) in the case
of satellites, or can be sparsely distributed in the case of land-based sensors. In contrast, numerical
modelling can recreate different atmospheric conditions over wide areas with ease.
One of such numerical models, the Simple Model of the Atmospheric Radiative Transfer of Sunshine
(SMARTS) model, is widely used and can be a starting point for the design of the OzFuel sensor. For
example, the American Society for Testing and Materials (ASTM) adopted the reference spectra from
a previous version of SMARTS (v 2.9.2) for two of their standards (G172-03, and G177-03), and the
International Electrotechnical Commission (IEC) has also used SMARTS in their standard (IEC 60904-
3:2016) for photovoltaic systems.
SMARTS was developed by Gueymard (1995), and it was recently updated to version 2.9.8 by
Gueymard (2019). The model has a spectral range between 200-4000 nm, with 2002 spectral bands,

Part I: OzFuel Mission Requirements
14
and estimates the irradiance at the surface of the Earth at 1361.10 W/m2. The model can be
downloaded from the NREL website (https://www.nrel.gov/grid/solar-resource/smarts.html), and is
available for computers running Windows and Mac operating systems. The user manual is only
available for version 2.9.5 and can be attained on the same website (https://www.nrel.gov/grid/solar-
resource/smarts-files.html), free of charge. The model can provide simulations for: “Direct normal
irradiance”, “Diffuse tilted irradiance”, “Global tilted irradiance”, “Beam normal + circumsolar”,
“Diffuse horizontal-circumsolar”, “Zonal ground reflectance”, some of which are shown in Figure 4
(see Gueymard (2019) for details).
Figure 4: Spectral irradiance produced by the SMARTS model using the conditions established under U.S.
standard ASTM G173 in the 300-1800 nm range. Source: Solar Consulting Services
(https://solarconsultingservices.com/smarts.php)
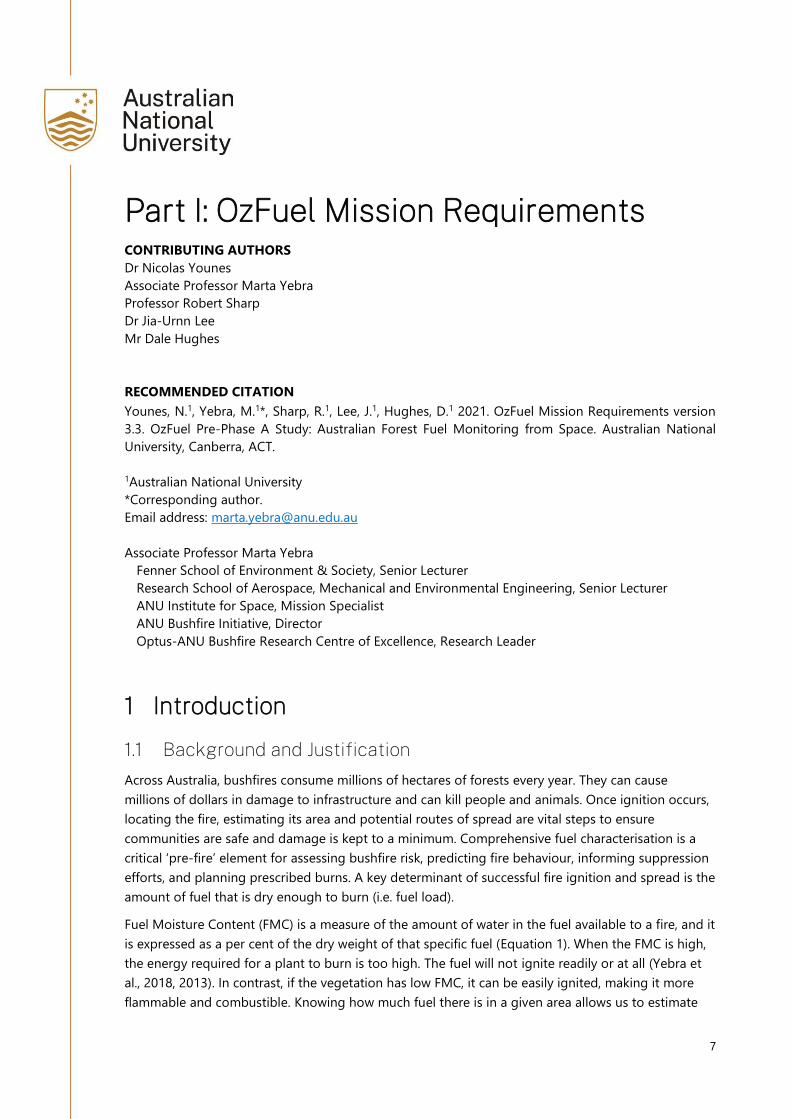
According to Gueymard (2019), the latest version of the model includes an updated carbon dioxide
concentration in the atmosphere (~410 ppm), as well as the ability to specify local conditions for
water vapour, ozone and carbon dioxide, three major absorption gases (Figure 5). The ability to
specify the local conditions of the atmosphere could be useful for the OzFuel project, where the
‘local conditions’ can refer to the atmospheric composition of the Australian continent or, more
narrowly, to the average conditions of south-eastern Australia. Input parameters for the SMARTS
model include pressure (mb), ground altitude (km), height above ground (km), relative humidity (%),
precipitable water (cm), ozone (atm-cm), aerosol optical depth, and visibility (km).
Part I: OzFuel Mission Requirements
15
Figure 5: SMARTS transmittance of absorption gases. The figure shows the ozone absorption (Top), water
vapour absorption (Middle), and the absorption of other gases (bottom) in the 300-2000 nm range. Source
Gueymard (2019).
2.6 Albedo
Albedo varies with forest structure, canopy cover, tree height, and other biophysical and
environmental parameters (Hovi et al., 2019). Albedo values for forested areas range between 10-
20%, with eucalypt forests on the lower end of the range (Sharma, 1984).
The SMARTS model includes 66 albedo references for different vegetation types (e.g. conifers, oak),
human-made materials (e.g. concrete, plywood), water, soils and rocks (e.g. clay, gravel) that can be
used as a starting point for the OzFuel project.
In addition, albedo measurements can be obtained from the MODIS (Moderate Resolution Imaging
Spectroradiometer) MCD43A3 Version 6 Albedo Model dataset (Schaaf and Wang, 2015). This
dataset provides both Black-sky and White-sky albedo at a 500m resolution for the visible-NIR (460,
555, 659, and 865 nm) and in SWIR bands (1240, 1640 and 2130 nm).
2.7 Spectral characteristics of the OzFuel sensor
In this section, we describe the desired spectral characteristics of the OzFuel sensor, the regions of
the spectrum that should be avoided, and the ones most useful to monitor changes in fuel moisture
content.

Part I: OzFuel Mission Requirements
16
2.7.1 Atmospheric absorption features
Experiments have found around 30 absorption features associated with atmospheric gases between
the 500-2500 nm range (Cui et al., 2015). In wavelengths between 1000 – 2500 nm, there are three
main regions where the incidental energy from the sun is absorbed by the atmosphere, mainly
related to the presence of water (H2O) and carbon dioxide (CO2) (Figure 5). The absorption features
of other gases (e.g. O2, O3) in this range of wavelengths (i.e. 1000 – 2500 nm) can be ignored for
now.
Broadly, atmospheric absorptions features should be avoided by the OzFuel sensor to ensure
enough light reaches the sensors and information can be gathered. Therefore, the following regions
of the spectrum should be avoided: 1100-1162 nm, 1336-1492 nm, and 1742-2075 nm.
Figure 6: Solar irradiance derived from SMARTS v. 2.9.2 (red line). Atmospheric absorption features (shaded
areas). Source: https://www.nrel.gov/grid/solar-resource/spectra-am1.5.html
2.7.2 Vegetation absorption features
Figure 7 shows how vegetation interacts with sunlight and how it is captured by a satellite sensor.
The horizontal axis shows the wavelengths of light, and the vertical axis shows the amount of light
reflected back to the sensor by the vegetation between 400 – 2500 nm. In the SWIR region (1100-
2500 nm), healthy (i.e. hydrated) vegetation will display four troughs related to the amount of water
in the leaves (Curran et al., 2001). The location and magnitude of these troughs vary with the health
of the vegetation and the species. Some of these features seem to coincide (at least in part) with the
location of the spectral bands of different existing satellites (Figure 8).
In Figure 8, we present the spectral signature of a eucalypt leaf, and the location of the spectral
bands of 24 satellites that are commonly used for vegetation monitoring. These satellites were
chosen as a source of comparison because they have spectral bands in the visible, NIR and SWIR
regions of the spectrum. The OzFuel mission focuses specifically on the Short-Wave Infrared (SWIR)
0.00
0.20
0.40
0.60
0.80
1.00
1.20
1.40
1.60
405 505 605 705 805 905 1005 1105 1205 1305 1405 1505 1605 1720
Spectr
al Ir
radia
nce
Wavelength (nm)

Part I: OzFuel Mission Requirements
17
region (1100-2500 nm) of the electromagnetic spectrum because that is the region where moisture,
lignin, and cellulose content are more easily detected. Cellulose and lignin are the two main
components of dry matter content (DMC, Equation 1) of leaves. Estimating the DMC is important
because the mass of the leaves is related to their flammability. The more mass in the leaves, the
more fuel there is to burn, and the longer a fire will last.
Figure 7: Location of the spectral bands of 25 Earth Observation satellites in the 400-2500 nm range (horizontal
bars). The grey line represents the spectra of a leaf simulated in PROSPECT. Blue shaded regions represent water
absorption bands.
In the SWIR region, water content in the leaves is what determines how much sunlight is absorbed,
and how much sunlight is reflected back to the sensor. Here, the Equivalent Water Thickness (EWT,
Equation 1) provides useful insights into the amount of water in the vegetation. Healthy vegetation
will hold more water in their leaves and will reflect less SWIR radiation back to the sensor (e.g.
EWT=0.05 in Figure 8. In contrast, dry vegetation will hold less water, and will reflect more SWIR
radiation to the satellite (e.g. EWT=0.02 in Figure 8). This is important for monitoring bushfire risk
because there is a higher risk of bushfires when the vegetation is dry (i.e. has low water content in
the leaves). To provide an accurate characterization of the fuel loads, OzFuel will provide estimates of
the amount of water (i.e. EWT), and the dry matter content (DMC, Equation 1) in eucalypt leaves.

Part I: OzFuel Mission Requirements
18
Figure 8: Leaf spectra with varying amounts of water (EWT, purple lines), and mass (DMC, brown lines). Spectra
simulated in PROSPECT (http://opticleaf.ipgp.fr/index.php?page=prospect).
The chemical composition of leaves also plays a role in the reflectance in the SWIR region. For
example, organic compounds such as cellulose, lignin, and waxes absorb and reflect energy in this
region of the spectrum. However, these features may be weak and can be easily masked by the
water content in the leaves (Varshney and Arora, 2004). To inform the state of vegetation and, thus,
bushfire risk across Australia, OzFuel will focus on examining changes in the cellulose and lignin
contents of live vegetation. More mass in the leaves means there is more combustible material (i.e.
fuel). For example, leaves with higher DMC (DMC=0.020 in Figure 8) reflect light differently to leaves
with low DMC (DMC=0.009 in Figure 8). Dry matter content is expressed as the ratio of the leaf’s dry
weight to its area (𝐷𝑀𝐶 = 𝑊𝑑
𝐴) (Féret et al., 2019).
From Figure 8 it is clear that changes in EWT and DMC alter the spectral signature of leaves. The
spectral bands for OzFuel should cover the wavelengths where these differences are greatest, but at
the same time, in wavelengths that are specific for the three main target compounds: water, lignin,
and cellulose.
Studies have found that the following wavelengths are useful for detecting lignin and cellulose in dry
or dead vegetation: 2180 – 2222 nm, 2310-2380 nm, 2000–2050, 2080–2130, and 2190-2240 Am
(Daughtry, 2001; Daughtry et al., 2001; Nagler et al., 2003). In Figure 9 there is a summary of the
wavelengths that have been identified as important for detecting changes in lignin and cellulose.

Part I: OzFuel Mission Requirements
19
Figure 9: Spectral bands associated with leaf cellulose and lignin in the 1000-2500 nm range. Grey lines
represent leaf spectra simulated in PROSPECT. Brown likes represent the spectral bands related to lignin and
cellulose. Sources: (Curran et al., 2001; Daughtry et al., 2001; Jin et al., 2017; Nagler et al., 2003; Soukupova et al.,
2002; Terdwongworakul et al., 2005; Thulin et al., 2014; Wessman et al., 1988).
2.7.3 Proposed spectral bands
For the first iteration of the OzFuel sensor, we propose the four spectral bands (Table 2). Because
OzFuel aims to detect changes in FMC, it is important to target the wavelengths that provide
information related to vegetation water content (EWT) and DMC.
In this case, we have selected four spectral bands linked to water, cellulose, and lignin. This data is
the basic input for the proposed products (Section 3), and it is crucial for ‘pre fire’ management
activities and for the characterisation of fuel loads across Australia. In addition, we propose very
narrow spectral bands (10 nm) to specifically target FMC in eucalypt forests.
Table 2: proposed bands for the OzFuel sensor. Initial estimation of band centres and band widths
No. Band Centre (nm) Band width at
FWHM (nm)
1 1205 10
2 1660 10
3 2100 10
4 2260 10

Part I: OzFuel Mission Requirements
20
Later iterations of the OzFuel mission will include more spectral bands, with the potential for making
OzFuel a multi-satellite hyperspectral mission.
The proposed bands are subject to change, depending on the results from field and laboratory
experiments that we are currently performing to characterise the spectra signature of Eucalypt
species in detail.
As shown in Figure 10 the selected spectral bands for OzFuel allow for good separability of leaves
with varying moisture (i.e. Effective Water Thickness – EWT), and dry matter content (DMC). Here, we
assume that EWT and DMC are proxies for Fuel Moisture Content and Dry Matter Content,
respectively.
Figure 10: Spectral bands proposed for the OzFuel mission (green). Grey lines represent leaf spectra simulated in
PROSPECT.
2.8 Radiometric resolution
The radiometric resolution of a sensor refers to its ability to discriminate changes in the incoming
energy. Higher radiometric resolution means that the sensor can discriminate smaller changes in the
energy that reaches the sensor, resulting in more information being captured. For the OzFuel sensor,
a high radiometric resolution is desired to detect slight changes in FMC (EWT and DMC) in eucalypt
forests.
To ensure proper sampling of the dry and wet properties of the vegetation, between 12 and 16 bits
of radiometric resolution are needed.

Part I: OzFuel Mission Requirements
21
2.9 Signal-to-noise ratio
The signal-to-noise ratio (SNR) refers to the relationship between the pixel values of the target
feature (i.e. radiance), with the pixel values of the target feature plus elements that contribute to
uncertainty in the signal level (Fiete and Tantalo, 2001). Some of the elements that cause noise
include atmospheric scattering, fluctuations in the rate of arrival of photons to the sensor, variations
in the voltage of the instrument (i.e. dark noise), and others. Importantly, (1) the are several ways of
calculating the SNR (Fiete and Tantalo, 2001), making the comparison of SNR between sensors a
complicated task, and (2) SNR varies between regions of the electromagnetic spectrum (Varshney
and Arora, 2004).
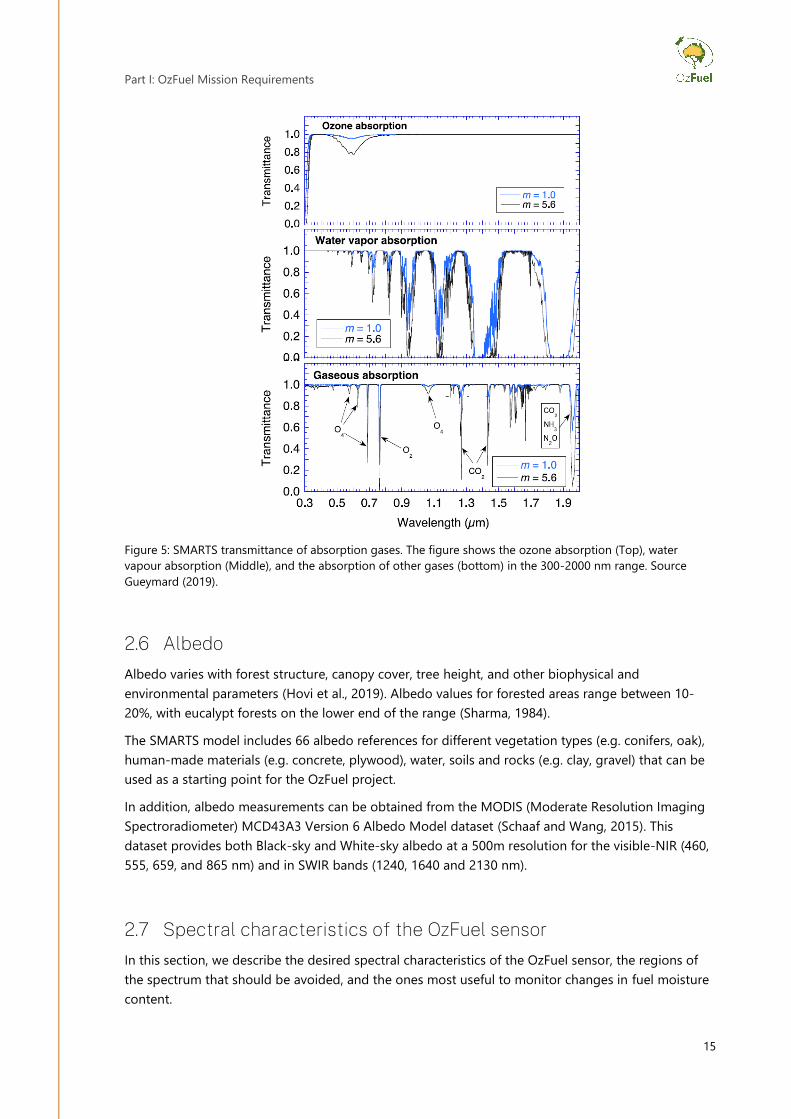
For the purposes of this document, we will assume the same SNR as the Sentinel-2 to facilitate the
comparability between OzFuel, Sentinel-2, and Landsat 8 sensors. In the 900-2500 nm wavelength
range, SNR values for the Sentinel-2 MSI instrument are as shown in Table 4. These values do not
necessarily coincide with the proposed spectral bands presented in section 2.7.3, however they serve
as a reference point. Whenever possible, SNR values should be 100:1 or higher.
2.10 Geographical coverage
OzFuel aims to image all the Australian mainland and Tasmania.
2.11 Mission specifications summary
The contents of Part 1 of this report are subject to change depending on the field and laboratory
experiments which are due to begin Q3/4 2021. We shall update the information of this document
when new information is available. A summary of the remote sensing end user requirements from
section 2 is provided below.
Table 3: Summary of user requirements for the OzFuel mission.
Characteristic User requirement
Revisit time (temporal
resolution):
6-8 days
Time of observation: Diurnal observations, preferably between 12h00 and 14h00
Ground sampling distance: 50m
Swath width: At least 16 km
Albedo 10-20% for eucalypt forests
Spectral range: 1200 – 2300 nm
Spectral band centre:
1205 nm
1660 nm
2100 nm
2260 nm
Number of Spectral bands: 3 – 4 bands
Radiometric resolution: 12 to 16 bit
Signal-to-Noise ratio: 100:1 or better
Geographical coverage: Australian mainland and Tasmania

Part I: OzFuel Mission Requirements
22
3 Data products The following products are intended to be generated from OzFuel:
Level 0 products: Raw data at full space/time resolution with all supplementary information (i.e.
metadata) to be used for subsequent processing (e.g. orbital data, time conversion, state of the
sensor, etc). Level 0 data will be time-tagged for ease of use.
Level 1A products: Level 0 product with the necessary geometric and radiometric corrections
applied. Level 1A products annotated with satellite position and consists of Top of Atmosphere
(TOA) radiance (W × m-2 × sr-1 × µm-1) data. Level 1A products are not quality-controlled.
Level 1B products: Level 1B product orthorectified, re-sampled to a specific grid and geo-located.
Re-sampling can be performed using several methods including bi-cubic convolution interpolation
or nearest neighbour.
Level 2 product: product 1B with atmospheric corrections. Level 2A product consists of surface
reflectance (unitless) data.
Level 3 product: maps of Fuel Moisture Content and dry fuel loads. Level 3 products should be
updated frequently to provide information to end users.
23
Table 4: Comparison between Sentinel-2 and Landsat 8 sensors. Source: (ESA and Agency, 2015; USGS, 2019).
Sensor Central
wavelength /
wavelength
range
(nm)
Bandwidth
(nm)
Reference
radiance - Lref
(W m−2 sr−1
μm−1)
SNR @
Lref
Reported
SNR
GSD
(m)
Radiometri
c
resolution
Swath
width
(Km)
Sentinel 2 945 20 9 114 60 12 Bit 290
Sentinel 2 1375 30 6 50 60 12 Bit 290
Sentinel 2 1610 90 5 100 20 12 Bit 290
Sentinel 2 2190 180 1.5 100 20 12 Bit 290
Landsat 8 1363 - 1384 165 30 12 Bit 190
Landsat 8 1566 - 1651 265 30 12 Bit 190
Landsat 8 2107 - 2294 334 30 12 Bit 190

24
Part 2: OzFuel Technical Overview CONTRIBUTING AUTHORS
Prof Robert Sharp
Dr James Gilbert
Mr Alexey Grigoriev
Dr Joice Mathew
Dr Douglas Griffin
Dr Simon Barraclough
Dr Jia-Urnn Lee
Sharp, R.*1, Gilbert, J.1, Grigoriev, A.1, Mathew, J.1, Griffin, D.2, Barraclough, S.3, Lee, J.1 2021. OzFuel
Technical Overview. OzFuel Pre-Phase A Study: Australian Forest Fuel Monitoring from Space.
Australian National University, Canberra, ACT.
1Australian National University 2Skykraft 3University of Melbourne
*Corresponding author.
Email address: [email protected]
Professor Rob Sharp
Research School of Astronomy and Astrophysics
Advanced Instrumentation and Technology Centre
4. Introduction
OzFuel is being developed in parallel with the CHICO mission, a dual-use hyperspectral imager (ANU
and partners). While each pathfinder has unique user requirements, both serve as a staged series of
development missions to de-risk critical sovereign capabilities to enable larger, fully-operational
national satellite missions (Figure 1).
This section identifies a staged development pathway focusing on delivery of high-value
intermediate data products (relevant to bushfire hazard mitigation and the wider industry) while
securing a future capability by de-risking technical development. The ideal OzFuel mission requires a
challenging combination of high ground resolution, a wide field, and (cloud free) repeat imaging
cadence that will be hard to deliver with a first-generation micro/smallSat mission. Indeed, a modest
constellation of satellites will likely be required. However, a staged series of development missions
will deliver key end-user value-added data products while demonstrating high Technology
Readiness level (TRL9) for the critical components with an acceptable risk profile for each
development stage.

Part II: OzFuel Technical Overview
25
5. OzFuel sensor overview
The OzFuel mission represents part of a staged solution to Low Earth Orbit (LEO) bushfire fuel and
environmental monitoring. The OzFuel-1 sensor is a small form-factor multispectral imager
operating at short-wave infrared (SWIR) wavelengths (λ = 1-2.5 μm). A representative focal plane
format is shown in Figure 11. It shares many operational design characteristics with the CHICO
hyperspectral visible light satellite development also underway at ANU. CHICO, funded by the
Defence Materials Technology Centre (DMTC) as part of the High Altitude Sensor System (HASS)
program, is a partnership with CSIRO and Canberra-based space systems operator Skykraft. While
the CHICO concept will operate at visible light wavelengths using silicon CMOS detectors, the CHICO
project presents a logical conceptual evolution for future phases of the OzFuel mission to deploy
shortwave infrared (SWIR) hyperspectral sensing. The details of the current OzFuel-1 specification are
presented in Table 5 alongside those of the CHICO sensor system for reference.
Figure 11: A representation of the OzFuel focal plane is shown alongside a reference (visible light) aerial
photography image. The image to the left shows the hypothetical footprint of the OzFuel-1 sensor (single
exposure) overlayed on Lake Burly Griffin (Canberra, ACT). The swath width and indicative direction of flight are
show. The right-hand image shows the OzFuel sensor focal plane, represented with independent SWIR filters
(three are shown; OzFuel-1 will likely deploy four). Arrayed along the satellite line of flight, each filter sees part
of a common swath and produces a long contiguous image track as the satellite passes over the scene.
Table 5: SmallSat sensor multi-mission specification
Requirement OzFuel-1
Target
specification
CHICO parallel
mission
Spatial
Spatial resolution –
GSD
Across-track (nadir) 50 m 20 m 20 m
Along-track (nadir) 50 m
Swath width (nadir) 16 km 20 km 20 km
Spectral Spectral range Multispectral Hyperspectral Hyperspectral
Part II: OzFuel Technical Overview
26
1 < λ < 2.5 μm 1 < λ < 2.5 μm 0.4 < λ < 0.82 μm
Parallel glint
channel
0.84 < λ < 0.9 μm
Number of bands 4 300 85
Spectral resolution 15 nm 5nm 3-8 nm
Spectral calibration
accuracy (nm)
1 nm 0.5 nm 0.1 nm
Radiometric
Dynamic range 16 bit ADC 12 bit ADC 16 bit ADC
Signal-to-noise ratio
Day ~250 300
Night > 10 n.a. n.a.
Other
Orbit
Type LEO SSO LEO
Altitude 600 km 705 km 600 km
Image Acquisition and
data handling
Frame rate 150 Hz 325 Hz 325 Hz
Data compression n.a. AI assisted value
added data
preprocessing
n.a.
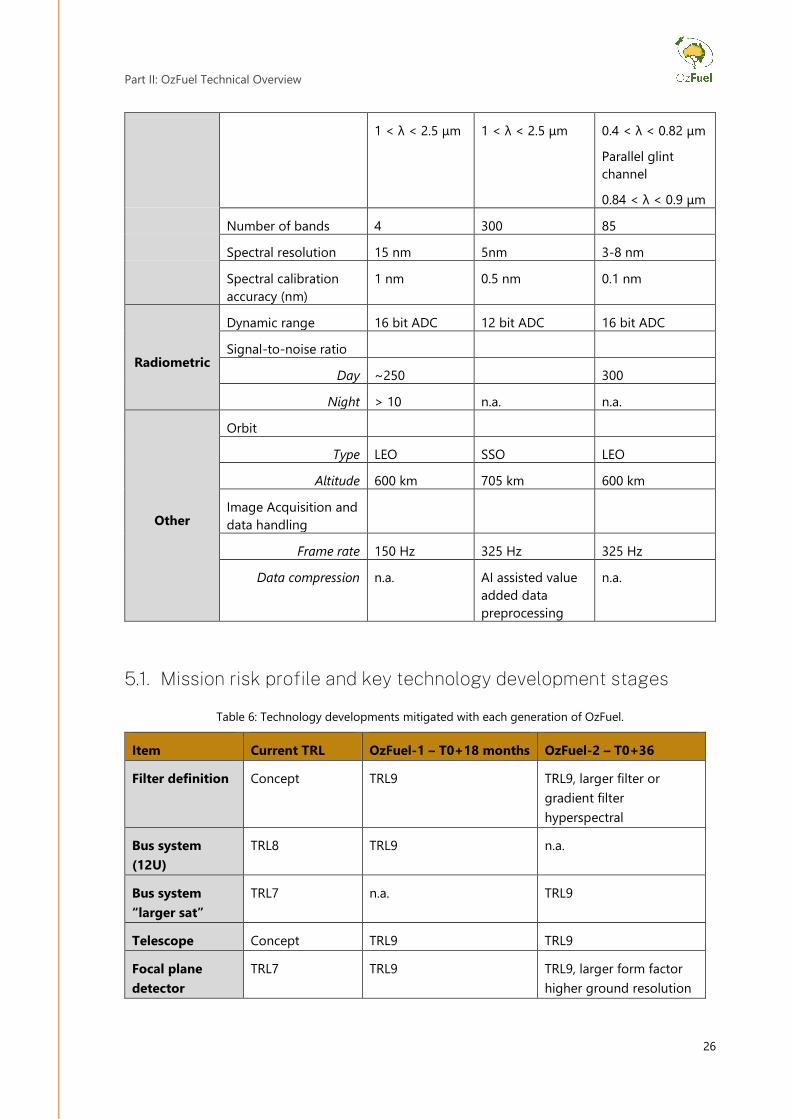
5.1. Mission risk profile and key technology development stages
Table 6: Technology developments mitigated with each generation of OzFuel.
Item Current TRL OzFuel-1 – T0+18 months OzFuel-2 – T0+36
Filter definition Concept TRL9 TRL9, larger filter or
gradient filter
hyperspectral
Bus system
(12U)
TRL8 TRL9 n.a.
Bus system
“larger sat”
TRL7 n.a. TRL9
Telescope Concept TRL9 TRL9
Focal plane
detector
TRL7 TRL9 TRL9, larger form factor
higher ground resolution
Part II: OzFuel Technical Overview
27
Controller TRL4 TRL9 TRL9 higher performance
modes enabled
AI TRL5-9
(depending on
application and
configuration)
TRL6 (lab testing only) TRL9
6. OzFuel capabilities & sub-systems considerations
6.1. High ground resolution Ground resolution is a central element of any remote sensing system. There are two critical aspects
of mission design that dictate achievable ground resolutions: i) the diffraction limit of the optical
system; and ii) the relative motion of the satellite platform with respect to the ground.
6.1.1. The diffraction limits
High ground resolution generates a number of program challenges. At shortwave infrared
wavelengths, a small telescope system can become diffraction limited such that the fundamental
ground resolution achievable is dictated by the diameter of the sensors’ primary optics and the
wavelength of observation. This follows the Airey diffraction limit:
𝐷𝑖𝑓𝑓𝑟𝑎𝑐𝑡𝑖𝑜𝑛 𝑙𝑖𝑚𝑖𝑡𝑒𝑑 𝑎𝑛𝑔𝑙𝑒, 𝜃(𝑟𝑎𝑑) = 1.22 ×𝜆𝑜𝑏𝑠
𝐷𝑇𝑒𝑙
The implication for a range of observational wavelengths and sensor sizes is presented for a range of
representative systems properties in Table 7. For a remote sensing system in a Low Earth Orbit
altitude of around 600 km, a 50 m ground resolution can be delivered with a telescope of 85 mm
diameter at a wavelength of 2.5 μm (OZFUEL-REQ-INST-0002; relevant documentation in Appendix
A). This scales linearly with wavelength and hence at 1 μm the same sensor could in principle deliver
imagery at a ground resolution of 20 m. Fundamental physics dictates that a larger telescope
diameter is necessary for finer ground scale regardless of whether such light gathering power is
required for sensitivity.

Part II: OzFuel Technical Overview
28
Table 7: Fundamental diffraction limited resolution (from 600 km Low Earth Orbit) - Airy disk Full Width at Half
Maximum (FWHM). Many missions operate below the fundamental limit with a Ground Sampling Distance (GSD)
limited by pixel sampling scale.
Fundamental
Limiting GSD
(m) from 600
km
Telescope effective diameter (m)
OzFuel-1,
CHICO
AquaWatch,
Sentinel-2
(15 mm)
Hubble
Space
Telescope
Wavelength (m) 0.1 0.2 0.3 0.5 1.0 2.5
0.4 2.9 1.5 1.0 0.6 0.3 0.1
0.6 4.4 2.2 1.5 0.9 0.4 0.2
0.8 5.9 2.9 2.0 1.2 0.6 0.2
1.0 7.3 3.7 2.4 1.5 0.7 0.3
1.5 11.0 5.5 3.7 2.2 1.1 0.4
2.2 16.1 8.1 5.4 3.2 1.6 0.6
2.5 18.3 9.2 6.1 3.7 1.8 0.7
3.0 22.0 11.0 7.3 4.4 2.2 0.9
5.0 36.6 18.3 12.2 7.3 3.7 1.5
10.0 73.2 36.6 24.4 14.6 7.3 2.9
6.1.2. Forward motion compensation
The second challenge for ground resolution is the relative ground motion of the satellite platform.
For orbital altitudes of order 600 km, the relative ground speed for an overpassing satellite is of
order 10 km s-1. For a simple satellite imaging system, observing at nadir, this means the pixel
crossing time (the time taken for any point on the ground to be blurred across one pixel in the
image) is ~1.3 msec for 10 m (6.6 msec for 50 m; OZFUEL-SCI-OCD-0001; refer to Appendix A).
At the highest resolutions, pointing stability during an exposure will be a limiting factor for ultimate
image resolution. However, for the resolution relevant to OzFuel (10–50 m), the most significant
problem is platform forward motion relative to the ground. Counter rotation of the satellite platform
as it passes over a region of interest, known as forward motion compensation, can reduce this
effective transit speed, but this comes at the expense (technically and financially) of a much more
challenging satellite attitude control system. Typically, the only method for providing the tracking
control signal is a suite of star trackers with high astrometric precision and sensitivity. Once the
pointing signal is generated by the star trackers, reaction wheels are typically needed to provide the
torque required for platform motion control. Desaturation of the reaction wheels then typically
requires a magnetorquer or similar to provide an efficient correction for the one-sided build-up of
angular momentum. These systems all require power, take up payload volume, require controls, and
add mission mass and system complexity (including single point failure or added system redundancy
requirements).

Part II: OzFuel Technical Overview
29
A more appealing solution at first glance is to simply freeze-out this relative motion by reading the
sensor system at a frame rate matched to the pixel crossing time of the ground resolution element.
This will ensure that images are blurred only to the intrinsic pixelation limit of the sensor. This
approach, related to the more general concept of Time-Delay Integration (TDI) imaging, trades
demands on the bus systems pointing stability for complexity in the sensor system data rate, data
volume, and frame to frame noise and integration time properties (OzFuel radiometry analysis and
Operational Concept, OZFUEL-SENG-RANA-0001, OZFUEL-SCI-OCD-0001; refer to Appendix A). The
challenge of TDI-like operations is that the necessary exposure rates (750 Hz for GSD = 10 m, 150 Hz
for GSD = 50 m) generate large data volumes. This volume can be reduced by realising that not
every image needs to be recorded (OZFUEL-SENG-RANA-0001), or through the use of onboard data
processing and value-added data product generation with Artificial Intelligence (AI) which can
reduce the volume of data that must be routinely downlinked.
6.1.3. OzFuel GSD
These issues considered together lead us to propose an 85 mm square telescope aperture for
OzFuel-1. It delivers sufficient ground resolution (<50 m at all SWIR wavelengths) while also
providing adequate image sensitivity. Furthermore, it conforms to the industry convention “1U” cross
sectional form factor, as well as a “3U” length scale with the necessary effective focal length without
the need for high-risk fast optical systems. This system will be well matched to performance
specifications of a high-grade SWIR focal plane detector driven by a dedicated high-speed
electronics package (such as the SAPHIRA eAPD detector from Leonardo UK coupled with the ANU
Rosella controller; see Section 3.5).
6.2. Swath width
The swath width is the angular width of the field of view perpendicular to the direction of motion of
the satellite sensor system. Maximizing the swath width provides the widest possible areal coverage
on each satellite pass. This in turn increases the repeat observation rate achievable for any given
point on the Earth’s surface for any given mission orbital profile. However, wide swath width imposes
two important technical difficulties on any sensor system.
6.2.1. Sensor opening angle
The field of view of any imaging system is restricted to the range of angles over which the sensor
system can accept incoming light. For a remote sensing platform operating at a LEO altitude of ~600
km, a projected ground swath width of 10 km requires a range of acceptance angles for the
telescope system of 1 (likely implemented as 0.5 around the optical axis). This remains relatively
linear out to ~30 (as 15) for ~300 km swath width.
However, large opening angles are challenging for optical design. A common rule of thumb for an
imaging system that is required to retain high image quality (i.e., one whose intrinsic resolution is
dictated simply by pixelation from the chosen focal plane format and not be internal aberrations and
distortions) should restrict the optical acceptance angle to 2-5, with the range dictated by
restrictions on the number of optical elements that can be employed, and the design risk considered
acceptable in the adopted surface figures. Wider fields will suffer significant optical aberration unless
complex aspherical surface figures, exotic glass chooses, and large numbers of powered surfaces
Part II: OzFuel Technical Overview
30
(adding weight & volume while reducing transmission) can be tolerated in the design. In many cases,
deployment of multiple sensors with narrower fields of view will provide a more satisfactory data
outcome.
Wide field imaging systems present additional optical challenges at the focal plane. Trivially, a wider
field of view requires a larger focal plan than a narrower one (assuming a common detector pixel-
pitch and GSD). This larger focal plane must all remain “flat” with respect to the depth of focus
tolerance for the optical system. There will also be significant optical design tension between
preserving a flat focal plane (simple designs usually generate focal surfaces with unacceptable
curvature leading to defocus at flat detectors) and retaining a (telecentric) optical design in which
light-rays arrive perpendicular to the detector array. Camera designs without this telecentricity are
viable but lead to image aberration and sensitivity variation due to the depth of photon penetration
into the detector surface.
Furthermore, a wide field of view sensor by design observes a ground scene over a wide range of
illumination and observation angles due to the variable geometry across a wide area. This dictates an
increased complexity of image analysis to account for the variable atmospheric absorption path
lengths, surface glint (particularly for aquatic systems) and shadowing. The angular variation may
also introduce a considerable ground sampled variation due to foreshortening.
6.2.2. Focal plane array
Array size limitations
Wide swath width requires a large focal plane pixel array unless a very large GSD is to be tolerated
(trivially, a 10 km swath width, sampled at a GSD of 10 m pixel size requires a 1,000-pixel detector
width). Large format detector systems are routinely available; however there are limitations. High-
performance devices have historically been available with modest form factors (1k1k; 2k2k; 2k4k;
4k4k). More recently, large format devices of order 10k10k have emerged (OZFUEL-OZFUEL-TRS-
0003; refer to Appendix A). However, the major detector vendors are largely restricted to the
maximum possible size by availability of large format, high-quality silicon wafers. The industry
standard is 200 mm (8 inches), meaning at 10 m pixel-pitch, a 20k20k device represents a
maximum size. Such a device will also be costly due to the exposure of the device to a single point
failure rendering the whole processed silicon wafer invalid. This is seen in the relative cost of devices
such as the Teledyne H2RG SWIR detector series with 10 m, 15 m and 18 m pixel pitches, with
the smaller pitch devices delivering higher viable device yield per wafer due to the smaller footprint
allowing more devices per processed wafer.
A larger pixel count can be achieved with a focal plane detector mosaic. A single detector focal plane
array is preferable when possible as it provides the simplest solution with minimal overhead for
control electronics and support systems such as cooling.
Focal plane array mosaics
When monolithic detectors of the required format cannot be sourced, a focal plane detector mosaic
becomes the only solution (see Figure 12). Mosaic fabrication introduces additional optomechanical
design challenges:
The focal plane mosaic array must be flat with respect to the optical focal plane to avoid
defocus.
Part II: OzFuel Technical Overview
31
Independent detectors should be aligned to produce a common Cartesian pixel grid across
the mosaic. This can be challenging as the pixel structure is typically not well aligned with
the outer die of the detector.
Each detector will require independent control electronics and will require an independent
calibration solution to remove image artefacts. A sensitivity artefact that leads to a
calibration requirement can be seen in the mosaic in Figure 12, with one of the mosaic
elements showing a clear spectral response variation to reflected light in the photograph.
Inter-detector mosaic gaps are unavoidable. Three/four-side buttable detectors are
available, but an inter-detector gap corresponding to 4-10 pixel (20-200 m depending on
pixel pitch) is usually unavoidable. While there are strategies for ensuring complete coverage
(see the Sentinel-2 VNIR array, Figure 13), most introduce data processing complexity and
are susceptible to variable illumination/observation angle changes between the non-
simultaneous observation regions.
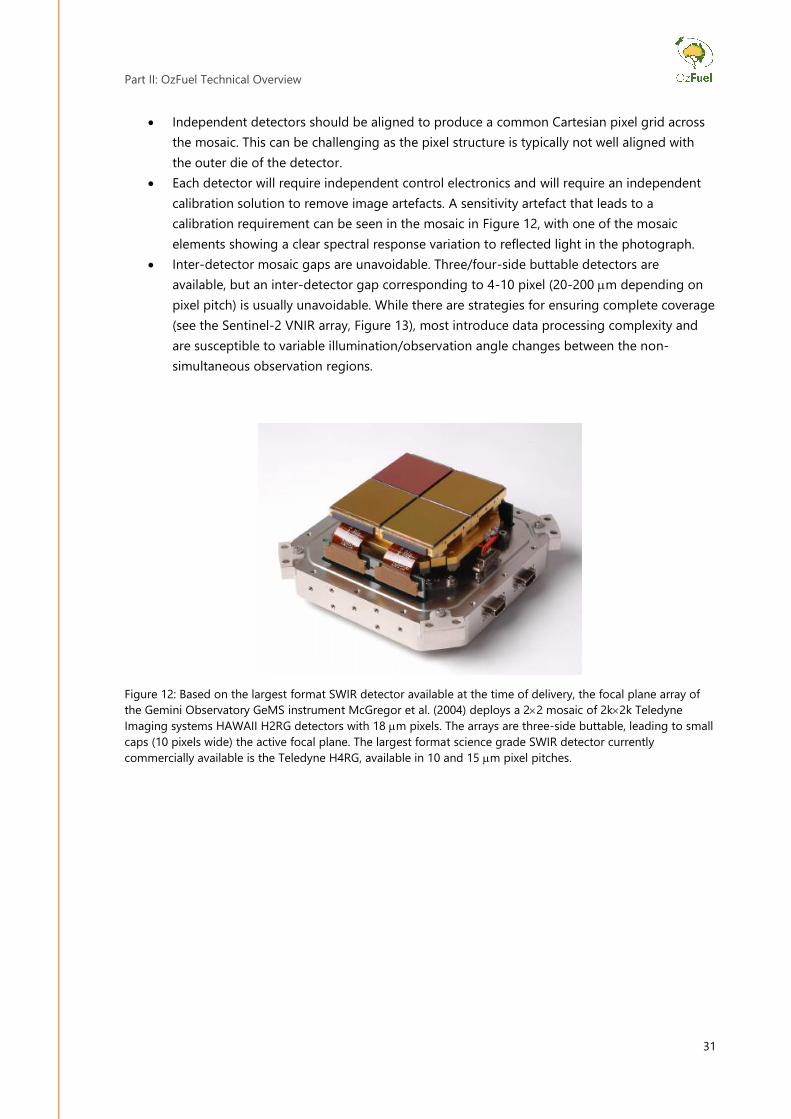
Figure 12: Based on the largest format SWIR detector available at the time of delivery, the focal plane array of
the Gemini Observatory GeMS instrument McGregor et al. (2004) deploys a 22 mosaic of 2k2k Teledyne
Imaging systems HAWAII H2RG detectors with 18 m pixels. The arrays are three-side buttable, leading to small
caps (10 pixels wide) the active focal plane. The largest format science grade SWIR detector currently
commercially available is the Teledyne H4RG, available in 10 and 15 m pixel pitches.

Part II: OzFuel Technical Overview
32
Figure 13: An exceptionally wide swath width was a design driver for the ESA Sentinel-2 mission. The large, 290
km projected ground distance, is not only optically demanding, but also required a large format offset mosaic
focal plane (to provided contiguous pixel coverage) of 12 large format detectors. The VNIR is shown here.
(image credit: https://sentinels.copernicus.eu/web/sentinel/missions/sentinel-2/instrument-payload/)
6.2.3. OzFuel Swath width and field of view
The initial OzFuel mission concept is baselined on the SAPHIRA SWIR detector from Leonardo UK
due to ANU’s current and ongoing experience with this device. The SAPHIRA device provides a
modest form factor, 320256 pixels, but is well suited to the frame rates necessary to provide high
ground resolution via TDI-like observations. The short detector axis is sufficient to accommodate 3-4
independent filter pass bands while still providing significant 2D field of view for georeferencing and
image alignment. The long axis provides a 16 km swath with a GSD of 50 m. This meets the basic
specification outlined in Part 1 of this document.
A second generation OzFuel satellite (OzFuel-2) would seek to deploy larger form factor arrays (1k
and 2k devices are available in the same family). The large array footprint would allow a wider swath
width, or conversely a smaller GSD, once the control electronics architecture and thermal
management system have been verified in the less demanding OzFuel-1 missions.
6.3. Satellite bus integration
The baseline model used to present likely OzFuel performance has been provided by Doug Griffin,
Director and Chief Engineer of Canberra-based SME Skykraft. The design study presented is an
evolution of a partnership between ANU, Skykraft, CSIRO and the Defence Materials Technology
Centre (DMTC). The DMTC-funded CHICO project seeks to develop a visible light hyperspectral
imaging system for coastal water monitoring applications. Material developed with the CHICO
program is used here (by agreement of the CHICO partnership) to demonstrate how OzFuel could be
deployed on a Skykraft platform either independently or alongside the CHICO sensor system. The
trade study adopted the TheMIS (Thermal Management Integrated System) cooling and thermal
control model from MSL (Section 6.4 Cooling systems). This system will be demonstrated in orbit
(TRL9) as part of Skykraft operations in late 2021.

Part II: OzFuel Technical Overview
33
Launch and bus performance risks are common to any satellite missions and are not unique to the
OzFuel mission concept. They are mitigated through careful selection of the correct partner(s) with
the competing goals of: balancing the portfolio risk; controlling program costs; and stimulating
growth, local capability and experience. The OzFuel concept as presented here has been developed
in partnership with Skykraft (industry partners on the DMTC CHICO project) to present a viable
roadmap for deployment of OzFuel (OZFUEL0SENG-ICD-0002; refer to Appendix A).
Figure 14: CAD rendering of the Skykraft ATM
satellite platform is shown hosting the OzFuel SWIR
multi-spectral sensor, mounted alongside the
CHICO visible light hyperspectral sensor. The
deployed solar array, and two of the internal star-
trackers (for point control) are seen. The TheMIS
cooler and thermal control system (from MSL) is
obscured by the sensor payloads in this rendering.
Figure 15: An example of the Skykraft ATM satellite
platform is shown with stowed solar panel assembly.
The Skykraft small satellite platform technology (and related developments for space-based Air
Traffic Management (ATM) system is an ideal host for small scale remote sensing payloads providing
a number of contemporary benefits:
Large size, weight and volume resources available to payload: The Skykraft ATM
platform departs from the CubeSat standard in order to host the large ATM surveillance and
communications payloads. The availability of this sovereign spacecraft platform opens up
the opportunity for ANU to design and operate innovative remote sensing payloads that
bypass the Size, Weight and Power constraints imposed by CubeSat spacecraft.
Regular and economical access to space: The development, operational deployment and
ongoing maintenance of the Skykraft space-based ATM constellation provides regular (at
least several times per year), opportunities to co-manifest spacecraft with remote sensing
payloads with the Skykraft ATM spacecraft launches starting 2022 and then into the
foreseeable future. This regular flight cadence and the economics of co-manifesting with the
ATM spacecraft provides the right environment for innovation and rapid development of
sovereign capability in this field.
Exploitation of Skykraft platform technology: The Skykraft spacecraft platform,
developed for its ATM business, provides the majority of critical capabilities needed to
operate the remote sensing payloads. The economics of the development of the ‘210’

Part II: OzFuel Technical Overview
34
spacecraft for Skykraft’s ATM constellation mean that NRE costs of adapting the platform to
remote sensing applications are highly favourable. Indeed, collaboration between Skykraft
and Melbourne Space Laboratory (MSL, Section 3.4) is using this model to retire program
risk for the TheMIS cooling system, and in the process, providing a TRL9 solution for cooling
for remote sensing payloads onboard the Skykraft ATM platform.
6.4. Cooling systems
Background information in this section, on COTS cooling systems and high TRL bespoke control
systems, has been provided by Simon Barraclough (MSL) in collaboration with Douglas Griffin
(Skykraft). – OzFuel Trade Study documents: “OZFUEL-OZFUEL-TRS-0001” & “OZFUEL-OZFUEL-TRS-
0002” (refer to Appendix A).
The equilibrium temperature for a small satellite system in Low Earth Orbit is highly dependent on
the specific geometry of the satellite system. However, the local ambient temperature within the
satellite body would be expected to be in the range of 40-70C.
Thermo-electric cooling is typically the option of choice for modest temperature reduction. It offers
a mass and power efficient solution for visible light sensor systems as well as restricted wavelength
SWIR systems (typically up to a wavelength of 1.7 microns but excluded from the 2-2.5 micron
window due to limitations of InGaAs detector technology). Cooling to lower temperature using
compact cryogenic coolers (such as the Thales Stirling cycle identified for OzFuel) is in principle
readily achieved. However, performance of such systems on satellite platforms is compromised by
the limited radiator area available which makes waste heat rejection challenging to operate high
performance SWIR sensors at.
For SWIR observation in a TDI-like mode with pixels anywhere in the 10-50 m GSD range, the
thermal load from the instrument and from the detector environment negligible (at least for daytime
observations).
Thermal considerations are important for a number of reasons:
- Calibration stability, changing background loads at the few percent level, and variable
thermal illumination across the field.
- The SWIR detectors need to operate reasonably cold, especially for wavelengths beyond 2.5
microns, at which the necessary sensor band gap becomes comparable to thermally excited
electronics in an uncooled detector substrate, leading to significant dark current generation.
The parasitic thermal load on a cooled focal plane array must be carefully controlled.
OzFuel is operating in the Short-Wave Infrared spectral region. This means that direct thermal
emission from the low emissivity telescope optics is expected to be of limited concern at the
operating temperature of 20-40 C expected for a LEO smallSat in radiative equilibrium. However,
high performance SWIR detectors capable of operating out to 2.5 m required cooling to
temperatures of ~100-200 K (-170 < T < -70 C) in order to suppress excessive dark current to
usable levels. Additionally, the detector enclosure – the high solid angle last surface seen directly by
the detector which is not filled by the telescope pupil – is a unit emissivity surface that would flood
the sensor with thermal background photons if not controlled. This leads to a requirement to
implement three thermal zones for the OzFuel system:

Part II: OzFuel Technical Overview
35
Warm Zone – Telescope and structure (20-40 C)
o This zone may be passively cooled and need only be stabilised, not actively controlled.
Cool zone – Detector enclosure last scattering surface (-70 < T < -20 C)
Cold zone – (-170 < T < -70 C)
o Actively cooled region ensuring the detector temperature is cold enough for the
required performance
o Detector temperature must be stabilised ensure calibration stability.
This cooling regime is beyond that accessible with simple thermo-electric designs. Indeed, the most
challenging element of cooling in this regime for a smallSat is the waste heat rejection due to the
restricted size of radiator panels practical on a smallSat form factor.
It is proposed that the detector and its immediate environment for the OzFuel mission will adopt the
thermal management strategy developed by the Melbourne Space Laboratory (MSL) team at the
University of Melbourne. The MSL TheMIS control system (Figure 16), coupled to the Thales LSF9987
Stirling cycle cryogenic cooler (Figure 17), provides a COTS solution with current TRL6 heritage. This
will be elevated to TRL9 in late 2022 as part of the ASA-funded SpIRIT mission managed by MSL.
An overview of the system has been provided to this OzFuel Pre-Phase A study by the SpIRIT
Nanosatellite Technical Director, Simon Barraclough (MSL - “OZFUEL-OZFUEL-TRS-0001 – Cooling
system”; refer to Appendix A). The ANU team has been collaborating with MSL on elements of the
SpIRIT and SkyHopper missions. The MSL team’s design heritage in satellite thermal systems
management also informed the design evolution of the ANU ‘Emu’ space telescope (Gilbert et al.,
2020, 2019; Mathew et al., 2020) which had adopted the previous generation cooling system
recommended by MSL.
Figure 16: A CAD rendering of The MSL
TheMIS system is shown.
Figure 17: The Thales LSD9997 Stirling cycle cooler is shown
in preparation for testing at MSL.
6.5. Focal plane array detectors and control systems
The OzFuel mission concept delivers high ground resolution (<50 m in the first instance but with a
goal of 10-30 m using a larger format detector for OzFuel-2) via high frame rate imaging. This
freezes out motion of the platform with respect to the ground, avoiding the need for costly (in terms
of volume, weight, complexity and direct expense) attitude control systems that are challenging on a

Part II: OzFuel Technical Overview
36
smallSat platform. The necessary high frame rate places high demands on the associated control
electronics driving the detector system. COTS control solutions typically cannot deliver the low-level
detector control necessary to provide low latency data digitisation, particularly when interfacing with
external on-board Artificial Intelligence (AI) processing solutions or when real-time data
management is required for data compression via dropped redundant frames, or similar dynamic
data manipulation is required.
ANU is developing the Rosella control system to address this problem. Based on Field
Programmable Gate Array (FPGA) technology and building on laboratory developments for ground-
based astronomical imaging camera systems, Rosella is a small form-factor (0.5 CubeSat U) control
system capable of interfacing with any CMOS based visible/SWIR or longer wavelength detector
technology, particularly those with no built-in pixel digitisation circuitry (i.e. most scientific grade
devices). The modular control system is designed for high frame rate operations with parallel
digitisation channels and the necessary clocking and power distribution systems (including filtering
and stabilisation) to ensure the native sensitivity of the detector is preserved though the digitisation
process.
Focal plane array detector choice for the OzFuel concept is based on the expediency of readily
available technology during the initial development stage of the program. The stated requirement
for OzFuel to image with at least one band in the 2-2.4 micron atmospheric window rules out low-
cost Indium Gallium Arsenide (InGaAs) detectors due to their band-gap limitation restricting
operations to below 1.8 microns. The preferred light-sensitive material for high-performance SWIR
sensors is Mercury Cadmium Telluride (MCT, or HgCdTe), which is hybridised to a conventional
silicon readout integrated circuit (ROIC). ANU has extensive experience with such devices from
Teledyne imaging systems (the Hawaii detector array family). Other US and European vendors are
available (e.g., Raytheon, Sofradir) and small formfactor devices are being actively fabricated at the
University of Western Australia, providing a viable domestic solution.
OzFuel is built around the SAPHIRA MCT detector from vendor Leonardo UK. The SAPHIRA detector
is an electron avalanche photodiode (eAPD) originally designed for low-noise and high-speed
operations as an astronomical wavefront sensor. The current device is small, limited to 320256
pixels, but specifically designed for high framerate with a large number of parallel readout channels.
Large-format devices with similar pixel architecture are available from Leonardo, providing future
upgrade paths for a larger format OzFuel mission, as well as next generation devices currently under
development that promise even higher speeds.
6.6. Optics
The optical system for OzFuel is functionally identical to that under development at the ANU for the
Emu astronomical survey telescope design for deployment on the International Space Station
(Gilbert et al., 2020, 2019; Mathew et al., 2020). The small form factor of the telescope (~1 CubeSat U
in cross-section) presents few optical challenges, with an on-axis catadioptric system providing a
compact design with the correct focal length. The necessary sensitivity limits and diffraction
performance for OzFuel-1, due to the 50 GSD, are achieved without the need for a bulky off-axis
system. A more complex design for OzFuel-2, with larger optics, would be required for <20 m
ground resolution, due to the demanding diffraction limit and decreased light return from a smaller
ground source. A larger axis system would provide increased sensitivity due to the clear aperture.
However, such systems require significant volume and common solutions. A three-mirror anastigmat
(TMA) typically produces complex spatial distortion at the focal plane that introduces variable plate

Part II: OzFuel Technical Overview
37
scale (and pixel sizes), and requires significant post-processing. Such complexities are not warranted
for OzFuel-1.
The suite of multispectral filters necessary for OzFuel is still under active development (see part 1 of
this document). However, their specification is unlikely to be optically demanding, with a range of
trusted international vendors available for fabrication as well as at the Australian National Fabrication
Facility. Development of a graded-index filter for an OzFuel-2 mission, providing a transition to a
hyperspectral capability, is more challenging, but this is largely a metrology and calibration problem
rather than a fundamental roadblock.
6.7. Calibration
Any observational system is only as trustworthy as its underlying calibration. High-performance on-
board calibration systems represent a significant parallel instrument development in their own right.
Full in-flight calibration, via direct injection of carefully regulated calibration light sources, is a
complex process. An accurate and repeatable system would likely be of comparable complexity,
volume and mass to the sensor system to be calibrated. Furthermore, the necessity to insert/remove
diffusing screens and ensure reliable operation of calibration lamps (dissipating heat, ensuring
performance stability etc.) introduces significant risk and complexity into any remote sensing system.
At the opposite extreme, simply relying on pre-flight laboratory calibration (with or without in-flight
validation via vicarious observations of well-understood test sites) places demanding stability
tolerances on instrumentation. Even with calibration and testing facilities such as the ANU Space
Detector Test Facility (recently enabled with supporting funding from the ACT Government Priority
Investment Program) significant calibration drift might be expected between the laboratory testing
and flight operations.
An intermediate solution is proposed for early OzFuel development. An extensive pre-flight test
program will establish baseline performance. The OzFuel sensor will then be equipped with a
deployable defusing element that covers the sensor entrance aperture. The screen can be
engineered so that a thin form-factor device can be inserted and removed in front of the sensor,
with relatively loose mechanical tolerances simplifying the necessary actuator without introducing
calibration error. With the screen deployed, the sensor can be tasked to periodically (daily, weekly
etc.) observe the Sun (or Moon) for a stable calibration reference source allowing confirmation and
updating of the instrument calibration function as required. Such a calibration solution provides a
reduced risk pathway to full in-flight calibration of a pathfinder mission such as OzFuel.

Part II: OzFuel Technical Overview
38
7. ROM COSTS
Element Cost without
any margin
Margin
(locally
applied)
ROM cost
OzFuel-1 Mission AUD 6.3 M 44% AUD 9.1 M
Ground Segment AUD 0.4 M 50% AUD 0.6 M
Launcher AUD 1 M 10% AUD 1.1 M
Mission Operations Centre AUD 0.5 M 50% AUD 0.8 M
Processing pipeline AUD 0.3 M 100% AUD 0.6 M
OzFuel Satellite AUD 4.1 M 47% AUD 6.0 M
- Environmental Qualification AUD 0.2 M 50% AUD 0.3 M
- Integration + System-level Tests AUD 0.4 M 20% AUD 0.5 M
- Payload AUD 2.5 M 30% AUD 3.3 M
- Platform / Bus AUD 1 M 100% AUD 2 M
8. Recommendations The requirements identified for remote sensing of fuel conditions (Table 3) should be verified and
validated via a dedicated field campaign during the Q4 2021/Q1 2022 fire season. The resulting
spectral library will verify the spectral bands that are more sensitive to variations in fuel conditions
and hence flammability. It will narrow down the preliminary spectral specification for OzFuel.
A follow-on Phase A study should be undertaken for mission analysis to detail the concept of
operations, payload (sensor, onboard processing, onboard calibration), spacecraft requirements and
the ground user segment. A concurrent engineering study would de-risk programmatic and
technological challenges for the OzFuel-1 pathfinder.
Preliminary market research should be undertaken to identify the use and distribution of OzFuel
spatial data beyond the Australian Flammability Monitoring System. ANU seeks to extend this
engagement to the commercial sector to understand, for example:
which data services would use or distribute the data for bushfire mitigation;
how the data would be used;
how the data would be delivered;
what parallel applications in Earth observation the data would benefit.
39
References ASA, 2021. Bushfire Earth Observation Taskforce - Report on the role of space based Earth
observations to support planning, response and recovery for bushfires. Canberra, ACT.
Cheng, T., Riaño, D., Ustin, S.L., 2014. Detecting diurnal and seasonal variation in canopy water
content of nut tree orchards from airborne imaging spectroscopy data using continuous
wavelet analysis. Remote Sens. Environ. 143, 39–53.
https://doi.org/https://doi.org/10.1016/j.rse.2013.11.018
Cui, H., Zhang, X., Su, J., Yang, Y., Fang, Q., Wei, X., 2015. Vibration–rotation absorption spectrum of
water vapor molecular in frequency selector at 0.5–2.5THz range. Optik (Stuttg). 126, 3533–
3537. https://doi.org/https://doi.org/10.1016/j.ijleo.2015.08.066
Curran, P.J., Dungan, J.L., Peterson, D.L., 2001. Estimating the foliar biochemical concentration of
leaves with reflectance spectrometry: Testing the Kokaly and Clark methodologies. Remote
Sens. Environ. 76, 349–359. https://doi.org/https://doi.org/10.1016/S0034-4257(01)00182-1
Daughtry, C.S.T., 2001. Discriminating Crop Residues from Soil by Shortwave Infrared Reflectance.
Agron. J. 93, 125–131. https://doi.org/https://doi.org/10.2134/agronj2001.931125x
Daughtry, C.S.T., Hunt Jr, E.R., Walthall, C.L., Gish, T.J., Liang, S., Kramer, E.J., 2001. Assessing the
spatial distribution of plant litter, in: Proceedings of the Tenth JPL Airborne Earth Science
Workshop. JPL Publication, pp. 1–2.
Deloitte Access Economics, 2021. Economic study into an Australian continuous launch small satellite
program for Earth observation.
ESA, Agency, E.S., 2015. Sentinel-2 User Handbook.
Féret, J.B., le Maire, G., Jay, S., Berveiller, D., Bendoula, R., Hmimina, G., Cheraiet, A., Oliveira, J.C.,
Ponzoni, F.J., Solanki, T., de Boissieu, F., Chave, J., Nouvellon, Y., Porcar-Castell, A., Proisy, C.,
Soudani, K., Gastellu-Etchegorry, J.P., Lefèvre-Fonollosa, M.J., 2019. Estimating leaf mass per
area and equivalent water thickness based on leaf optical properties: Potential and limitations
of physical modeling and machine learning. Remote Sens. Environ. 231, 110959.
https://doi.org/https://doi.org/10.1016/j.rse.2018.11.002
Fiete, R., Tantalo, T., 2001. Comparison of SNR image quality metrics for remote sensing systems.
Opt. Eng. 40.
Gilbert, J., Chandler, D., Grigoriev, A., King, S., Mathew, J., Sharp, R., Vacarella, A., 2020. Emu: a near-
infrared wide-field photometer for space. Proc. SPIE 11203, Adv. Opt. Astron. Instrum. 2019,
112030H (3 January 2020). https://doi.org/https://doi.org/10.1117/12.2539776
Gilbert, J., Grigoriev, A., King, S., Mathew, J., Sharp, R., Vacarella, A., 2019. Linear-mode avalanche
photodiode arrays for low-noise near-infrared imaging in space. 70th Int. Astronaut. Congr. 21-
25 Oct. 2019.
Gueymard, C.A., 2019. The SMARTS spectral irradiance model after 25 years: New developments and
validation of reference spectra. Sol. Energy 187, 233–253.
https://doi.org/https://doi.org/10.1016/j.solener.2019.05.048
Gueymard, C.A., 1995. SMARTS2, a simple models of the atmospheric radiative transfer of sunshine.
Florida Solar Energy Center, Florida.

40
Hovi, A., Lindberg, E., Lang, M., Arumäe, T., Peuhkurinen, J., Sirparanta, S., Pyankov, S., Rautiainen, M.,
2019. Seasonal dynamics of albedo across European boreal forests: Analysis of MODIS albedo
and structural metrics from airborne LiDAR. Remote Sens. Environ. 224, 365–381.
https://doi.org/https://doi.org/10.1016/j.rse.2019.02.001
Huang, G., Li, Z., Li, X., Liang, S., Yang, K., Wang, D., Zhang, Y., 2019. Estimating surface solar
irradiance from satellites: Past, present, and future perspectives. Remote Sens. Environ. 233,
111371. https://doi.org/https://doi.org/10.1016/j.rse.2019.111371
Jin, X., Chen, X., Shi, C., Li, M., Guan, Y., Yu, C.Y., Yamada, T., Sacks, E.J., Peng, J., 2017. Determination
of hemicellulose, cellulose and lignin content using visible and near infrared spectroscopy in
Miscanthus sinensis. Bioresour. Technol. 241, 603–609.
https://doi.org/https://doi.org/10.1016/j.biortech.2017.05.047
Jolly, W.M., Hadlow, A.M., Huguet, K., 2014. De-coupling seasonal changes in water content and dry
matter to predict live conifer foliar moisture content. Int. J. Wildl. Fire 23, 480–489.
Jolly, W.M., Johnson, D.M., 2018. Pyro-Ecophysiology: Shifting the Paradigm of Live Wildland Fuel
Research. Fire 1. https://doi.org/10.3390/fire1010008
Mathew, J., Gilbert, J., Sharp, R., Grigoriev, A., King, S., Vacarella, A., Chandler, D., Herrald, N., Price, I.,
Magniez, A., 2020. A space-based near-infrared sky survey to study the oxygen abundance in
cool stars. Proc. SPIE 11443, Sp. Telesc. Instrum. 2020 Opt. Infrared, Millim. Wave; 114430J.
https://doi.org/https://doi.org/10.1117/12.2560898
McGregor, P., Hart, J., Stefanovic, D., Bloxham, G., Jones, D., van Harmelen, J., Griesbach, J., Dawson,
M., Young, P., Jarnyk, M., 2004. Gemini South Adaptve Optic Imager (GSAOI), in: Moorwood,
F.M., Iye, M. (Eds.), Ground-Based Instrumentation for Astronomy, SPIE 5492. pp. 1033–1044.
Nagler, P.L., Inoue, Y., Glenn, E.P., Russ, A.L., Daughtry, C.S.T., 2003. Cellulose absorption index (CAI)
to quantify mixed soil–plant litter scenes. Remote Sens. Environ. 87, 310–325.
https://doi.org/https://doi.org/10.1016/j.rse.2003.06.001
Nolan, R.H., Blackman, C.J., de Dios, V.R., Choat, B., Medlyn, B.E., Li, X., Bradstock, R.A., Boer, M.M.,
2020. Linking Forest Flammability and Plant Vulnerability to Drought. Forests 11, 779.
https://doi.org/10.3390/f11070779
NSW Government, 2021. NSW Bushfire Inquiry. Sydney - NSW.
Roth, K.L., Roberts, D.A., Dennison, P.E., Peterson, S.H., Alonzo, M., 2015. The impact of spatial
resolution on the classification of plant species and functional types within imaging
spectrometer data. Remote Sens. Environ. 171, 45–57.
https://doi.org/https://doi.org/10.1016/j.rse.2015.10.004
Schaaf, C., Wang, Z., 2015. MCD43A3 MODIS/Terra+Aqua BRDF/Albedo Daily L3 Global - 500m V006.
2015. https://doi.org/https://doi.org/10.5067/MODIS/MCD43A3.006
Sharma, M.L., 1984. Evapotranspiration from a Eucalyptus community. Agric. Water Manag. 8, 41–56.
https://doi.org/https://doi.org/10.1016/0378-3774(84)90045-3
Soukupova, J., Rock, B.N., Albrechtova, J., 2002. Spectral characteristics of lignin and soluble
phenolics in the near infrared- a comparative study. Int. J. Remote Sens. 23, 3039–3055.
https://doi.org/10.1080/01431160110104683
Terdwongworakul, A., Punsuwan, V., Thanapase, W., Tsuchikawa, S., 2005. Rapid assessment of wood
chemical properties and pulp yield of Eucalyptus camaldulensis in Thailand tree plantations by
near infrared spectroscopy for improving wood selection for high quality pulp. J. Wood Sci. 51,
167–171. https://doi.org/10.1007/s10086-004-0633-3

41
Thulin, S., Hill, M.J., Held, A., Jones, S., Woodgate, P., 2014. Predicting levels of crude protein,
digestibility, lignin and cellulose in temperate pastures using hyperspectral image data. Am. J.
Plant Sci. 2014.
UNSW Canberra Space, 2021. Technical Feasibility Study into Australian Development of a Satellite
Cross-Calibration Radiometer (SCR) series including potential to support partner land imaging
programs. UNSW Canberra Space.
USGS, 2019. Landsat 8 Data Users Handbook.
Varshney, P.K., Arora, M.K., 2004. Advanced image processing techniques for remotely sensed
hyperspectral data. Springer, Berlin.
Wessman, C.A., Aber, J.D., Peterson, D.L., Melillo, J.M., 1988. Foliar analysis using near infrared
reflectance spectroscopy. Can. J. For. Res. 18, 6–11. https://doi.org/10.1139/x88-002
Yebra, M., Dennison, P.E., Chuvieco, E., Riaño, D., Zylstra, P., Hunt, E.R., Danson, F.M., Qi, Y., Jurdao, S.,
2013. A global review of remote sensing of live fuel moisture content for fire danger
assessment: Moving towards operational products. Remote Sens. Environ. 136, 455–468.
https://doi.org/10.1016/j.rse.2013.05.029
Yebra, M., Quan, X., Riaño, D., Rozas Larraondo, P., van Dijk, A.I.J.M., Cary, G.J., 2018. A fuel moisture
content and flammability monitoring methodology for continental Australia based on optical
remote sensing. Remote Sens. Environ. 212, 260–272.
https://doi.org/https://doi.org/10.1016/j.rse.2018.04.053
Yebra, M., Scortechini, G., Badi, A., Beget, M.E., Boer, M.M., Bradstock, R., Chuvieco, E., Danson, F.M.,
Dennison, P., Resco de Dios, V., Di Bella, C.M., Forsyth, G., Frost, P., Garcia, M., Hamdi, A., He, B.,
Jolly, M., Kraaij, T., Martín, M.P., Mouillot, F., Newnham, G., Nolan, R.H., Pellizzaro, G., Qi, Y.,
Quan, X., Riaño, D., Roberts, D., Sow, M., Ustin, S., 2019. Globe-LFMC, a global plant water
status database for vegetation ecophysiology and wildfire applications. Sci. Data 6, 155.
https://doi.org/10.1038/s41597-019-0164-9
Younes, N., Joyce, K.E., Maier, S.W., 2021. All models of satellite-derived phenology are wrong, but
some are useful: A case study from northern Australia. Int. J. Appl. Earth Obs. Geoinf. 97,
102285. https://doi.org/https://doi.org/10.1016/j.jag.2020.102285

42
Acronyms and abbreviations
Abbreviation Meaning
ASA Australian Space Agency
ATM Skykraft Air Traffic Management platform
BRDF Bi-directional Reflectance Distribution Function
CAD Computer-Aided Design
Cal/Val Calibration/Validation
CHICO Compact Hyperspectral Imager for Coastal Oceans mission
COTS Commercial off-the-shelf
CSIRO Commonwealth Scientific and Industrial Research Organisation
DMC Dry Matter Content
DMTC Defence Materials Technology Centre
DN Digital Numbers
eAPD Electron avalanche photodiode
ESA European Space Agency
FMC Fuel Moisture Content
FOV Field of View
FPGA Field Programmable Gate Array
FWHM Full Width at Half Maximum
GA Geoscience Australia
GSD Ground Sampling Distance
HASS High Altitude Sensor System
Hz Hertz
InGaAs Indium gallium arsenide
km Kilometre
K Kelvin
LEO Low Earth Orbit
LFMC Live Fuel Moisture Content
m Metre
µm Micron
msec Milliseconds
MCT Mercury cadmium telluride
MSL Melbourne Space Laboratory
OzFuel Australian Fuel Monitoring from Space
nm Nanometre
NIR Near Infrared
NRE Non-recurring engineering

43
ROIC Readout Integrated Circuit
ROM Rough Order of Magnitude
SME Small-Medium Enterprise
SNR Signal-to-Noise Ratio
SSO Sun-Synchronous Orbit
SWIR Short Wavelength Infrared
TDI Time Delay Integration
TheMIS Thermal Management Integrated System
TMA Three Mirror Anastigmat
TOA Top of Atmosphere
TRL Technology Readiness Level
UTC Universal Time Code
UTM Universal Transverse Mercator
VNIR Visible and Near Infrared
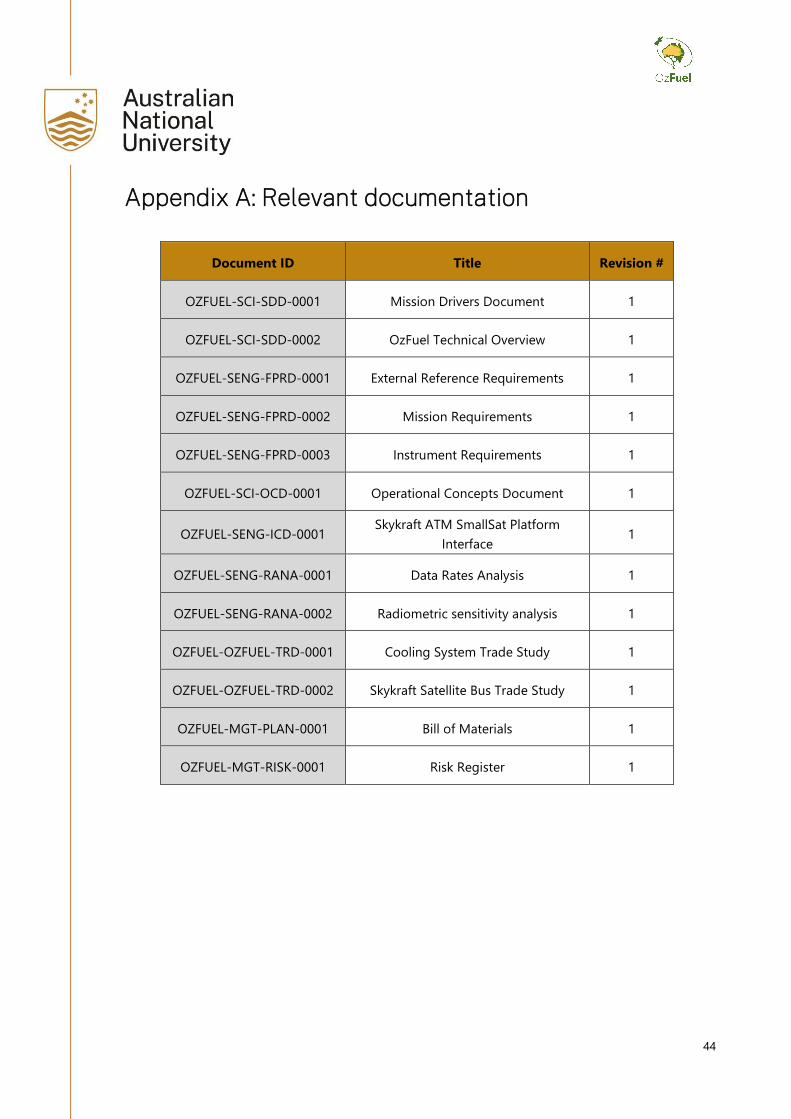
44
Appendix A: Relevant documentation
Document ID Title Revision #
OZFUEL-SCI-SDD-0001 Mission Drivers Document 1
OZFUEL-SCI-SDD-0002 OzFuel Technical Overview 1
OZFUEL-SENG-FPRD-0001 External Reference Requirements 1
OZFUEL-SENG-FPRD-0002 Mission Requirements 1
OZFUEL-SENG-FPRD-0003 Instrument Requirements 1
OZFUEL-SCI-OCD-0001 Operational Concepts Document 1
OZFUEL-SENG-ICD-0001 Skykraft ATM SmallSat Platform
Interface 1
OZFUEL-SENG-RANA-0001 Data Rates Analysis 1
OZFUEL-SENG-RANA-0002 Radiometric sensitivity analysis 1
OZFUEL-OZFUEL-TRD-0001 Cooling System Trade Study 1
OZFUEL-OZFUEL-TRD-0002 Skykraft Satellite Bus Trade Study 1
OZFUEL-MGT-PLAN-0001 Bill of Materials 1
OZFUEL-MGT-RISK-0001 Risk Register 1