Oxy Permian Tour · Avg 2017 Facilites Reduction Subsurface Engineering Longer Laterals 2018 2019...
27
Oxy Permian Tour Driving Value in the Permian September 20, 2017
Transcript of Oxy Permian Tour · Avg 2017 Facilites Reduction Subsurface Engineering Longer Laterals 2018 2019...

Oxy Permian TourDriving Value in the PermianSeptember 20, 2017

2
Forward-Looking StatementsPortions of this presentation contain forward-looking statements and involve risks and uncertainties that could materially affect expected results of operations, liquidity, cash flows and business prospects. Actual results may differ from anticipated results, sometimes materially, and reported results should not be considered an indication of future performance. Factors that could cause results to differ include, but are not limited to: global commodity pricing fluctuations; supply and demand considerations for Occidental's products; higher-than-expected costs; the regulatory approval environment; reorganization or restructuring of Occidental's operations, not successfully completing, or any material delay of, field developments, expansion projects, capital expenditures, efficiency projects, acquisitions or dispositions; uncertainties about the estimated quantities of oil and natural gas reserves; lower-than-expected production from development projects or acquisitions; exploration risks; general economic slowdowns domestically or internationally; political conditions and events; liability under environmental regulations including remedial actions; litigation; disruption or interruption of production or manufacturing or facility damage due to accidents, chemical releases, labor unrest, weather, natural disasters, cyber attacks or insurgent activity; failure of risk management; changes in law or regulations; or changes in tax rates. Words such as “estimate,” “project,” “predict,” “will,” “would,” “should,” “could,” “may,” “might,” “anticipate,” “plan,” “intend,” “believe,” “expect,” “aim,” “goal,” “target,” “objective,” “likely” or similar expressions that convey the prospective nature of events or outcomes generally indicate forward-looking statements. You should not place undue reliance on these forward-looking statements, which speak only as of the date of this presentation. Unless legally required, Occidental does not undertake any obligation to update any forward looking statements, as a result of new information, future events or otherwise. Material risks that may affect Occidental’s results of operations and financial position appear in Part I, Item 1A “Risk Factors” of the 2016 Form 10-K.
Use of non-GAAP Financial InformationThis presentation includes non-GAAP financial measures. You can find the reconciliations to comparable GAAP financial measures on the “Investors” section of our website.
Cautionary Statements

3
• Introduction
• Value Based Development – Sand Dunes
• Solving Permian Problems
• Q&A
Agenda

4
Permian Resources• Introduction
• Value Based Development
• Solving Permian Problems

5
0.0
1.0
2.0
3.0
4.0
5.0
6.0
2Q17 CFFOAdjusted to
$40 WTI
Chemicals Midstream &Marketing
71 MboedPermian
ResourcesProduction
OtherImprovements
Cash FlowNeutral at $40
WTI
Increase inCash Flow at
$50 WTI
Cash FlowBreakeven with5%-8% Growth
at $50 WTI
$3.3 $3.5 $3.7
$4.3 $4.5
Current Dividend
$2.4
Sustaining Capital$2.3
$120 MM per $1 Change in WTI
Current Dividend
$2.4
Sustaining Capital$2.1
Cash Flow Breakeven at $50:Dividend + 5% – 8% Production Growth $5.7 $5.7
Ope
ratin
g Ca
sh F
low
($ B
n) Growth Capital$1.0
Cash Flow Neutral at $40:Dividend with Flat Production
Seminole-San Andres Acquisition + Chemicals
Pathway to Cash Flow Breakeven at Low Oil Prices
$4.5

6
Oxy Permian
• Position> 302,000 net acres associated with
11,325 wells in unconventional inventory
> Largest oil producer in the Permian Basin
• Scale> 10k mi2 3D seismic
> 130k mi2 2D seismic
> 24.5k gross operated wells
> 10k gross OBO wells
• NM Delaware Basin 290,000
• TX Delaware Basin** 150,000
• Midland Basin* * 210,000
Total ~650,000
NetAcres*
Resources Basin Development Areas
• Central Basin Platform 215,000
• New Mexico NW Shelf 150,000
• Emerging Unconventional 50,000
• Continuing Evaluation 335,000
Total ~750,000
NetAcres*
Other Resources Unconventional Areas
• Resources – Unconventional Areas 1.4• Enhanced Oil Recovery Areas 1.1
Oxy Permian Total ~2.5MM
NetAcres*
Business Area Acreage
Permian Resources Acreage Permian EOR Acreage
NM Delaware Basin
TX Delaware Basin
Midland Basin
Central BasinPlatform
New Mexico NW Shelf
*Includes surface and minerals.**Adjustment for transactions of 13,000 net acres announced 6/19/2017 where Oxy divested non-strategic acreage in Andrews, Martin and Pecos Counties and added incremental acreage in a new development area in Glasscock County.
2Q Permian Resources Transactions** (13,000)
Updated Resources Basin Acreage ~637,000

7
Shaping Competitive Advantage
Full Cycle Value CapabilityResources – Dynamic Development
EOR – Reservoir Management
Advantage:
• Scale + Position
• Value Based Development
• Organizational Capability
• Technology + Innovation
Reservoir Management
Operational Efficiency & Speed
Subsurface Technical Excellence
Field Development Planning + Execution
Enhanced Recovery

8
Permian Resources• Introduction
• Value Based Development
• Solving Permian Problems

9
Oxy’s Competitive Advantage in Permian Unconventional
Subsurface Characterization
3D Modular Development
Development Scenarios
Vision Well Manufacturing Blueprint
Portfolio Decisions
Hands-Free Operations
Leadership in Full Cycle Returns
Automation and Data CaptureSystem Integration
Data Analytics
Organization Designed for Integrated Development
Valu
e B
ased
Tech
nolo
gy +
Dev
elop
men
t Sys
tem
Inno
vatio
n

10
Subsurface Characterization Adds Value• Extensive subsurface
characterization & expertise> Seismic integration
> Data acquisition
> Models
• Customized desings based on unique subsurface attributes> Sweet spots
> Frac barriers
> Landing zones
• Capture resource potential at the highest value
Schematic Representation of 2nd Bone Spring Sand Well Placement
2nd Bone Spring Net Sand Thickness and Middle Carbonate Outline
Seismic Interpretation of Middle Carbonate Inside 2nd Bone Spring Sand
A
A A’
Landing + Stimulation + Spacing Optimization
A A’
A’Middle Carb. Outline

11
Production drivers
Data analytics
Implement
Surveillance
Vision Well
Design the system
Challenging the Vision Well Adds Value
• Discover recipe for play-leading wells
• Apply data analytics to identify production drivers> Subsurface
> Completion Design
> Choke and lift optimization
• Design the system to test hypothesis
• Implement and confirm results
• Continue to push expectations

*Normalized to 4,500 ft
Customized Vision Wells Increase Well Productivity
2nd Bone Spring Productivity Improvement2nd Bone Spring Landing and Frac Optimization
0
20
40
60
80
100
0 10 20 30 40 50 60
Cum
ulat
ive
Oil
Prod
uctio
n M
bo
Normalized Day
2nd BS Carbonate – Recent 7,500’
2nd BS No Carbonate – 4,500’
2nd BS Carbonate – 4,500’

13
Modular Development Adds Value• Maximize value through optimizing
pace and sequencing
• Identify Uncertainties: > Variability of production results
> Rate of improvement
• Recognize Current Limitations> Existing infrastructure capacity and water
network
> Land position
• Realize full cycle returns through modular field development plans
1
Mature land position Bench delineation Advanced BLM permitting Fewer unknowns

14
Modular Development Adds Value• Maximize value through optimizing
pace and sequencing
• Identify Uncertainties: > Variability of production results
> Rate of improvement
• Recognize Current Limitations> Existing infrastructure capacity and water
network
> Land position
• Realize full cycle returns through modular field development plans
2
Land unitization complete Appraisal wells complete Optimized well designs Infrastructure sized for plan New technologies
implementable Detailed operations blueprint

15
Modular Development Adds Value• Maximize value through optimizing
pace and sequencing
• Identify Uncertainties: > Variability of production results
> Rate of improvement
• Recognize Current Limitations> Existing infrastructure capacity and water
network
> Land position
• Realize full cycle returns through modular field development plans
12
3
4
Land core-up completed Learnings from other
development units applied Vision wells maximizing value Infrastructure optimized

Optimizing Development Scenarios Adds Value
Time
Net Present Value
Vision ValueVision wells
Acreage improvements
Initial ValueAppraisal and SSC
Optimized InfrastructureBalance infrastructure capacity and pace
Modular DevelopmentPace to implement learning and technology
Optimized Well DesignProductivityWell costLift design
Hands Free OperationsHigher operabilityLower OPEX
• Scale + Position
• Value Based Development
• Organizational Capability
• Integrated Technology
Oxy’s Competitive Advantage
Optimized Pace + Sequencing =
Leadership in Full Cycle Returns

17
Permian Resources• Introduction
• Value Based Development
• Solving Permian Problems

18
Solving Permian Problems Now
• Data Analytics> Driving value @ the Bit
> Driving value @ the Reservoir
> Driving value @ the Well
> Driving value @ Field Development
• Subsurface Characterization with Data Analytics> Identify production drivers
> High-grade inventory and improve field development plans
• Oxy Drilling Dynamics with Analytics > Better wells faster
• Logistics Hubs> Integrated partnerships with service contractors
> Protect margins


20
Permian Resources Wells Continue to Improve
Top Peers is average of Peers in the Top 15 based on # of wells online in 2016 with 6 month cumulative production available.Oxy and Peer data sourced from IHS Performance Evaluator, Gas Equivalent calculated at 20:1, solid bars represent oil, grey bars represent gas
New Mexico Bone Spring
New Mexico Wolfcamp
Texas Delaware Wolfcamp
Midland Basin Wolfcamp
AVG Lat Length (ft) 4,169 4,937 5,174 ~6,000 4,849
AVG Lat Length (ft) 4,576 ~6,700 5,158 AVG Lat Length (ft) 6,700 7,457 7,467 ~8,200 7,907
AVG Lat Length (ft) 4,807 5,418 ~7,500 5,938
*Operators Include: Bopco, Bta Oil Producers, CVX, CXO, DVN, EOG, Fasken Oil And Ranch, GMT, LGCY, Mewbourne, MTDR, Regeneration Energy, WPX, XEC, XOM
*Operators Include: APA, APC, BHP, CDEV, CXO, EOG, FANG, HK, Mewbourne, MTDR, RDSA, REN, RSPP, WPX, XEC
*Operators Include: APA, CVX, CXO, ECA, EGN, END, EPE, FANG, LPI, PE, Permian Rscs, PXD, RSPP, SM, XOM
*Operators Include: Bc Opg, COP, CXO, DVN, EOG, Mewbourne, MTDR, WPX
0
50
100
150
200
2015 1H16 2H16 2017Target
Top Peers2016
0
50
100
150
200
250
2015 1H16 2H16 2017Target
Top Peers2016
0
50
100
150
2015 1H16 2H16 2017Target
Top Peers2016
020406080
100120
2015 1H16 2H16 2017Target
Top Peers2016
6 M
onth
BO
E Cu
mul
ativ
e Pr
oduc
tion
6 M
onth
BO
E Cu
mul
ativ
e Pr
oduc
tion
6 M
onth
BO
E Cu
mul
ativ
e Pr
oduc
tion
6 M
onth
BO
E Cu
mul
ativ
e Pr
oduc
tion

21
0
2
4
6
8
10
12
14
16
18
20
-
50
100
150
200
250
300
2017 2018 2019
Prod
uctio
n (M
boed
)
Multi-Year Permian Resources Growth
Rig
Cou
nt
20% 3-yr CAGR
30% 3-yr CAGR
Base rig count* Upside rig count*
6
8
8 8
1314
STX SaleRe-invested
13 rigs at exit
2017 Exit rig count*
Current trajectory of 30% CAGR
• Exited 2Q with 11 operated rigs> 26 wells online in 2Q17
• Exit 2017 with 11 company operated rigs, 2 net non-op rigs> Avg lateral length 7,400 in 1H17 to 7,900
in 2H17
> 2017 wells online ~130
• Shifting activity to New Mexico> 5 NM rigs in 2H 2017
> 7+ NM rigs in 2018+
> 1 net non-op rig in 2018+
Achieving Plan Through Value-based Approach
*Includes estimated net non-operated rigs

22
0
500
1,000
1,500
2,000
2,500
3,000
4Q16 <$50 BE Drilled 1H17 DemonstratedCapex
Efficiency
DemonstratedWell Performance
LandImprovement
EvaluatedNew Acreage
2Q17 <$50 BE
Added 400 Hz Locations <$50 BreakevenReached <$50 inventory additions goal since 4Q16
• + 400 locations YTD
• + 3.5 MM feet of total horizontal lateral
• Increased <$50 average length from 8,400’ to 8,600’
• Cost and well performance improvements are sustainable
• Executed 7,000 net acres of trades to enable longer laterals
• Evaluated ~15,000 net acres of new development areas
2,500
2,855
16 years of inventory <$50 breakeven with 10 rigs
Midland Basin
Texas Delaware
Basin
New Mexico
Delaware Basin
Breakeven defined as positive NPV 10
Und
evel
oped
Dril
ling
Loca
tions 45
155 45100
100

23
0
2,000
4,000
6,000
8,000
10,000
12,000
14,000
Breakeven <$50
Breakeven <$60
Breakeven <$70
AdditionalInventory
2Q17 Normalizedto 7,100'
4Q16
Added ~20 Rig Years of Activity to <$50 Inventory
2,855
4,250
5,725
11,325 11,650
Permian Resources Inventory 2Q17• + 400 locations BE <$50
> ~300 in New Mexico
> Replaced inventory from divestitures
• + 3.0 MM ft of horizontal lateral footage to inventory
> Increased average lengthfrom 7,100 ft to 7,500 ft
Midland Basin
Texas Delaware
Basin
New Mexico Delaware
Basin
*2Q 2017 increased lateral length adjustment to normalize current inventory to 7,100’. **Breakeven defined as positive NPV 10
11,963*
Und
evel
oped
Dril
ling
Loca
tions

24
2015 & 2016Avg
2017 FacilitesReduction
SubsurfaceEngineering
LongerLaterals
2018 2019
*Calculated using estimated total year capex (drilling, completions, hookup, facilities, infrastructure, capital workovers, maintenance, seismic). Annual wedge represents the new production added in each year from the capital program (excludes base production)** Other capex includes seismic, science, and maintenance capex.
Permian Resources Capital Intensity Improves through 2019
All-In Capital IntensityAnnual Capex $MM / Annual Wedge Mboed*
$54MM
$33MM2018 & 2019
$27MM – $23MM
• 2017 to 2019 – Value-based Development reduces capital intensity
> Facilities, infrastructure and other** 23% to <15% of
capital budget
> New Mexico wells ~30% to ~55% of total well count
> Effective lateral length from 7,700 ft to 8,600 ft for wells
drilled
• Future intensity improvement opportunities
> Well productivity
> Additional capital efficiency
> SL2 in secondary benches
> Maintenance & logistics hub
> Water recycling
10% improvement in well productivity or capital costs reduces capital intensity by $2MM
$42MM
2H 2017 Rig Ramp
Subsurface Characterization

25
The Permian Drives Oxy’s Value Proposition
Development Cost Opex G&A Production Taxes Cash Costs
$16 - $19/BOE
Note: Estimated future project costs.
Improving top tier margins with recent operational and technical breakthroughs.
$6 - $12/BOE
Development Cost Opex G&A Production Taxes Cash Costs
$6 - $10/BOE
$18 - $25/BOE
Permian EOR provides stable, free cash flow with minimal base decline.
~11,650 Undeveloped Drilling Locations ~2B Bbls Identified Undeveloped Resource
Permian Resources Permian EOR

26
Seminole-San Andres Further Strengthens Our Leading Position in EOR
*Source: 2014 Oil & Gas Journal, EOR Survey, adjusted for recent Oxy EOR acquisition
Occidental
Kinder Morgan
DenburyChevron
Exxon Anadarko
Whiting
Resolute
0
500
1,000
1,500
2,000
2,500
3,000
3,500
0 5 10 15 20 25 30 35 40
Inje
ctio
n W
ells
CO2 Projects
Gas EOR Projects*
$0
$100
$200
$300
$400
$500
$600
$700
Base Case Target Upside Case
Value of Operating Cost Synergies ($MM PV10)
$5/Boe
$7/Boe
$10/Boe
• Seminole-San Andres is now our largest operated CO2project in the Permian
> San Andres reservoir is world-class
> Oxy now operates 34 CO2 projects in the Permian Basin
• Scale in the Permian provides operating cost savings and production reliability opportunities:
> Base case savings ($5/Boe): improved well maintenance, automation, and commercial scale for supply chain and logistics
> Target savings ($7/Boe): improved plant reliability
> Upside savings ($10/Boe): asset performance at parity with our Denver Unit
• Additional opportunities: D&C cost improvement, plant expansion to accelerate growth, and re-drill and ROZ potential
Production Volumes
27
0
500
1,000
1,500
2,000
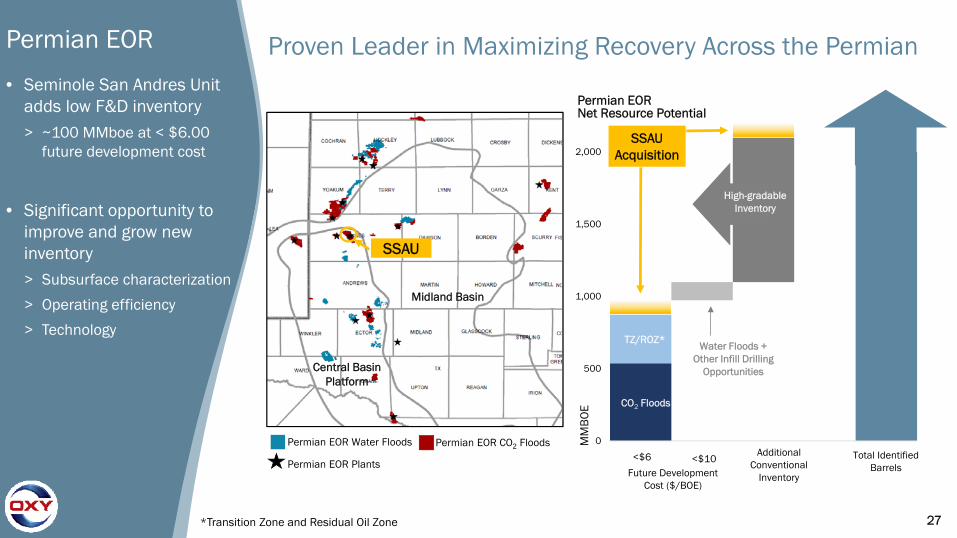
Proven Leader in Maximizing Recovery Across the Permian
<$10 <$6
Permian EOR Net Resource Potential
MM
BO
E CO2 Floods
TZ/ROZ*Water Floods +
Other Infill Drilling Opportunities
High-gradable Inventory
*Transition Zone and Residual Oil Zone
Permian EOR
• Seminole San Andres Unit adds low F&D inventory> ~100 MMboe at < $6.00
future development cost
• Significant opportunity to improve and grow new inventory> Subsurface characterization
> Operating efficiency
> Technology
Future Development Cost ($/BOE)
Permian EOR Water Floods
Midland Basin
Central BasinPlatform
Additional Conventional
Inventory
SSAU Acquisition
Permian EOR CO2 Floods
Permian EOR Plants
SSAU
Total Identified Barrels