Oxidative stress causes bone loss in estrogen-defi
6
Oxidative stress causes bone loss in estrogen-deficient mice through enhanced bone marrow dendritic cell activation Francesco Grassi*, Gianluca Tell † , Michaela Robbie-Ryan*, Yuhao Gao*, Masakazu Terauchi*, Xiaoying Yang*, Milena Romanello † , Dean P. Jones ‡ , M. Neale Weitzmann*, and Roberto Pacifici* § *Division of Endocrinology, Metabolism, and Lipids, and ‡ Division of Pulmonary, Allergy, and Critical Care Medicine, Department of Medicine, Emory University, Atlanta, GA 30322; and † Department of Biomedical Sciences and Technologies, University of Udine, 33100 Udine, Italy Edited by Richard A. Flavell, Yale University School of Medicine, New Haven, CT, and approved August 7, 2007 (received for review April 20, 2007) Increased production of tumor necrosis factor (TNF) in the bone marrow (BM) in response to both oxidative stress and T cell activation contributes to the bone loss induced by estrogen defi- ciency, but it is presently unknown whether oxidative stress causes bone loss through T cells. Here we show that ovariectomy causes an accumulation in the BM of reactive oxygen species, which leads to increased production of TNF by activated T cells through up- regulation of the costimulatory molecule CD80 on dendritic cells. Accordingly, bone loss is prevented by treatment of ovariecto- mized mice with either antioxidants or CTLA4-Ig, an inhibitor of the CD80/CD28 pathway. In summary, reactive oxygen species accu- mulation in the BM is an upstream consequence of ovariectomy that leads to bone loss by activating T cells through enhanced activity of BM dendritic cells, and these findings suggest that the CD80/CD28 pathway may represent a therapeutic target for post- menopausal bone loss. CTLA-4Ig reactive oxygen species T cells osteoporosis tumor necrosis factor P ostmenopausal bone loss is induced by ovarian involution and the resulting increase in follicle-stimulating hormone produc- tion through multiple effects on bone marrow (BM) and bone cells (1–4), but the most relevant consequence of natural menopause and ovariectomy (ovx) is a cytokine-driven increase in osteoclast (OC) formation (2, 4). OC formation occurs when bone marrow macrophages (BMMs) are costimulated by the essential osteoclas- togenic factors receptor activator of nuclear factor-B ligand (RANKL) and macrophage colony-stimulating factor (M-CSF) (2), but after menopause TNF is produced in greater amounts in the BM and up-regulates OC formation (4, 5). TNF stimulates the production of RANKL and M-CSF by bone and BM cells (6, 7), augments the responsiveness of OC precursors to RANKL (8, 9), and induces additional osteoclastogenic cytokines such as IL-1, IL-6, and IL-7 (4). Studies with genetic and pharmacological models have demonstrated the pivotal role of TNF in ovx-induced bone loss in rodents and humans (10–13) and have provided insights on the estrogen (E)-regulated sources of TNF. Ovx up- regulates the production of TNF by BM T lymphocytes (8, 12) by increasing thymic T cell output (14) and by stimulating the antigen (Ag)-dependent activation and expansion of T cells in the BM (15). Attesting to the relevance of T cell-produced TNF, T cell-deficient nude mice are protected against the loss of cortical and trabecular bone induced by ovx (8, 12, 16). Furthermore, the capacity of ovx to induce bone loss is restored by adoptive transfer into nude mice of T cells from wild-type (WT) but not of those from TNF / mice (12). T cell activation is caused by the presentation to T cells of Ag fragments bound to MHC molecules expressed on Ag-presenting cells (APCs) (17). Ovx up-regulates the capacity of BMMs to present Ag to CD4 T cells (4, 15), but no information is available on how ovx activates CD8 T cells and on whether ovx has additional stimulatory effects on BM DCs, the most potent pro- fessional APCs residing in the BM (18). Ovx alters the generation of ROS and the antioxidant defense capacity of the cell (19, 20), leading to an accumulation of ROS, which stimulate the production of TNF in the BM. This effect is compounded by the capacity of ROS to stimulate OC formation and activity directly (20–22). However, little information is avail- able regarding the cell lineage that produces TNF in response to ROS (19). Because ROS activate Ag presentation by DCs (23) and activated T cells further stimulate Ag presentation by BMMs through pro- duction of IFN, a plausible hypothesis, tested herein is that ovx induces the activation of both CD4 and CD8 cells through ROS-mediated stimulation of Ag presentation by DCs. We show that the generation of ROS represents an ‘‘upstream’’ event that leads to bone loss by increasing the capacity of DCs to present Ag, thus promoting the production of TNF by activated T cells. Results Ovx Selectively Activates BM DCs Through Increased Costimulation by CD80. To assess the effects of ovx on the number and function of APCs, BM was harvested 2 weeks after sham operation or ovx, a time when the rate of bone loss is most rapid (8, 12, 16). Ovx did not alter the percentage of DCs (data not shown) nor that of DCs expressing MHCII (Fig. 1A), whereas it increased the percentage of DCs expressing CD80, a costimulatory molecule that binds to the T cell receptor CD28 (17). Confirming earlier reports (15), ovx caused a 2-fold increase in the total number of BMMs and BM B cells (data not shown). The total number of BM DCs was also 50% higher in ovx mice than in sham controls (Fig. 1B). Ovx caused only a small increase in the number of MHCII DCs, whereas the number of DCs expressing CD80 was 3.5-fold higher in ovx than in sham mice. Attesting to specificity, ovx did not affect the expression of the DC costimulatory molecules CD86, CD40, PDL-1, PDL-2, and OX40 (data not shown). Author contributions: F.G., G.T., M.N.W., and R.P. designed research; F.G., G.T., M.R.-R., Y.G., M.T., M.R., and D.P.J. performed research; F.G., G.T., X.Y., and M.N.W. analyzed data; and M.N.W. and R.P. wrote the paper. The authors declare no conflict of interest. This article is a PNAS Direct Submission. Abbreviations: APC, antigen-presenting cell; Ag, antigen; BM, bone marrow; BMD, bone mineral density; BMM, bone marrow macrophage; CIITA, class II transactivator; CTX, C-terminal telopeptides; DC, dendritic cell; DXA, dual x-ray absorptiometry; E, estrogen; GSH, glutathione; H2O2, hydrogen peroxide; M-CSF, macrophage colony-stimulating fac- tor; CT, microcomputerized tomography; NAC, N-acetylcysteine; OC, osteoclast; ovx, ovariectomy; Prx-1, peroxiredoxin-1; RANKL, receptor activator of nuclear factor-B ligand; TRAP, tartrate-resistant acid phosphatase. § To whom correspondence should be addressed at: Division of Endocrinology, Metabolism, and Lipids, Emory University School of Medicine, 1639 Pierce Drive, Room 1309, Atlanta, GA 30322. E-mail: roberto.pacifi[email protected]. This article contains supporting information online at www.pnas.org/cgi/content/full/ 0703610104/DC1. © 2007 by The National Academy of Sciences of the USA www.pnas.orgcgidoi10.1073pnas.0703610104 PNAS September 18, 2007 vol. 104 no. 38 15087–15092 MEDICAL SCIENCES
Transcript of Oxidative stress causes bone loss in estrogen-defi
Oxidative stress causes bone loss inestrogen-deficient mice through enhancedbone marrow dendritic cell activationFrancesco Grassi*, Gianluca Tell†, Michaela Robbie-Ryan*, Yuhao Gao*, Masakazu Terauchi*, Xiaoying Yang*,Milena Romanello†, Dean P. Jones‡, M. Neale Weitzmann*, and Roberto Pacifici*§
*Division of Endocrinology, Metabolism, and Lipids, and ‡Division of Pulmonary, Allergy, and Critical Care Medicine, Department of Medicine,Emory University, Atlanta, GA 30322; and †Department of Biomedical Sciences and Technologies, University of Udine, 33100 Udine, Italy
Edited by Richard A. Flavell, Yale University School of Medicine, New Haven, CT, and approved August 7, 2007 (received for review April 20, 2007)
Increased production of tumor necrosis factor � (TNF) in the bonemarrow (BM) in response to both oxidative stress and T cellactivation contributes to the bone loss induced by estrogen defi-ciency, but it is presently unknown whether oxidative stress causesbone loss through T cells. Here we show that ovariectomy causesan accumulation in the BM of reactive oxygen species, which leadsto increased production of TNF by activated T cells through up-regulation of the costimulatory molecule CD80 on dendritic cells.Accordingly, bone loss is prevented by treatment of ovariecto-mized mice with either antioxidants or CTLA4-Ig, an inhibitor of theCD80/CD28 pathway. In summary, reactive oxygen species accu-mulation in the BM is an upstream consequence of ovariectomythat leads to bone loss by activating T cells through enhancedactivity of BM dendritic cells, and these findings suggest that theCD80/CD28 pathway may represent a therapeutic target for post-menopausal bone loss.
CTLA-4Ig � reactive oxygen species � T cells � osteoporosis �tumor necrosis factor
Postmenopausal bone loss is induced by ovarian involution andthe resulting increase in follicle-stimulating hormone produc-
tion through multiple effects on bone marrow (BM) and bone cells(1–4), but the most relevant consequence of natural menopauseand ovariectomy (ovx) is a cytokine-driven increase in osteoclast(OC) formation (2, 4). OC formation occurs when bone marrowmacrophages (BMMs) are costimulated by the essential osteoclas-togenic factors receptor activator of nuclear factor-�B ligand(RANKL) and macrophage colony-stimulating factor (M-CSF) (2),but after menopause TNF is produced in greater amounts in theBM and up-regulates OC formation (4, 5). TNF stimulates theproduction of RANKL and M-CSF by bone and BM cells (6, 7),augments the responsiveness of OC precursors to RANKL (8, 9),and induces additional osteoclastogenic cytokines such as IL-1,IL-6, and IL-7 (4). Studies with genetic and pharmacologicalmodels have demonstrated the pivotal role of TNF in ovx-inducedbone loss in rodents and humans (10–13) and have providedinsights on the estrogen (E)-regulated sources of TNF. Ovx up-regulates the production of TNF by BM T lymphocytes (8, 12) byincreasing thymic T cell output (14) and by stimulating the antigen(Ag)-dependent activation and expansion of T cells in the BM (15).Attesting to the relevance of T cell-produced TNF, T cell-deficientnude mice are protected against the loss of cortical and trabecularbone induced by ovx (8, 12, 16). Furthermore, the capacity of ovxto induce bone loss is restored by adoptive transfer into nude miceof T cells from wild-type (WT) but not of those from TNF �/�mice (12).
T cell activation is caused by the presentation to T cells of Agfragments bound to MHC molecules expressed on Ag-presentingcells (APCs) (17). Ovx up-regulates the capacity of BMMs topresent Ag to CD4� T cells (4, 15), but no information is availableon how ovx activates CD8� T cells and on whether ovx has
additional stimulatory effects on BM DCs, the most potent pro-fessional APCs residing in the BM (18).
Ovx alters the generation of ROS and the antioxidant defensecapacity of the cell (19, 20), leading to an accumulation of ROS,which stimulate the production of TNF in the BM. This effect iscompounded by the capacity of ROS to stimulate OC formationand activity directly (20–22). However, little information is avail-able regarding the cell lineage that produces TNF in response toROS (19).
Because ROS activate Ag presentation by DCs (23) and activatedT cells further stimulate Ag presentation by BMMs through pro-duction of IFN�, a plausible hypothesis, tested herein is that ovxinduces the activation of both CD4� and CD8� cells throughROS-mediated stimulation of Ag presentation by DCs. We showthat the generation of ROS represents an ‘‘upstream’’ event thatleads to bone loss by increasing the capacity of DCs to present Ag,thus promoting the production of TNF by activated T cells.
ResultsOvx Selectively Activates BM DCs Through Increased Costimulation byCD80. To assess the effects of ovx on the number and function ofAPCs, BM was harvested 2 weeks after sham operation or ovx, atime when the rate of bone loss is most rapid (8, 12, 16). Ovx didnot alter the percentage of DCs (data not shown) nor that of DCsexpressing MHCII (Fig. 1A), whereas it increased the percentage ofDCs expressing CD80, a costimulatory molecule that binds to theT cell receptor CD28 (17). Confirming earlier reports (15), ovxcaused a 2-fold increase in the total number of BMMs and BM Bcells (data not shown). The total number of BM DCs was also�50% higher in ovx mice than in sham controls (Fig. 1B). Ovxcaused only a small increase in the number of MHCII� DCs,whereas the number of DCs expressing CD80 was �3.5-fold higherin ovx than in sham mice. Attesting to specificity, ovx did not affectthe expression of the DC costimulatory molecules CD86, CD40,PDL-1, PDL-2, and OX40 (data not shown).
Author contributions: F.G., G.T., M.N.W., and R.P. designed research; F.G., G.T., M.R.-R.,Y.G., M.T., M.R., and D.P.J. performed research; F.G., G.T., X.Y., and M.N.W. analyzed data;and M.N.W. and R.P. wrote the paper.
The authors declare no conflict of interest.
This article is a PNAS Direct Submission.
Abbreviations: APC, antigen-presenting cell; Ag, antigen; BM, bone marrow; BMD, bonemineral density; BMM, bone marrow macrophage; CIITA, class II transactivator; CTX,C-terminal telopeptides; DC, dendritic cell; DXA, dual x-ray absorptiometry; E, estrogen;GSH, glutathione; H2O2, hydrogen peroxide; M-CSF, macrophage colony-stimulating fac-tor; �CT, microcomputerized tomography; NAC, N-acetylcysteine; OC, osteoclast; ovx,ovariectomy; Prx-1, peroxiredoxin-1; RANKL, receptor activator of nuclear factor-�B ligand;TRAP, tartrate-resistant acid phosphatase.
§To whom correspondence should be addressed at: Division of Endocrinology, Metabolism,and Lipids, Emory University School of Medicine, 1639 Pierce Drive, Room 1309, Atlanta,GA 30322. E-mail: [email protected].
This article contains supporting information online at www.pnas.org/cgi/content/full/0703610104/DC1.
© 2007 by The National Academy of Sciences of the USA
www.pnas.org�cgi�doi�10.1073�pnas.0703610104 PNAS � September 18, 2007 � vol. 104 � no. 38 � 15087–15092
MED
ICA
LSC
IEN
CES

Characterization studies of BM DCs revealed that ovxincreased the percentage of both CD80� plasmacytoid(B220�) DCs, and CD80�CD8� conventional (B220�) DCs,but not that of CD80�CD8�B220� DCs [supporting infor-mation (SI) Fig. 5]. Furthermore, ovx did not alter thepercentage of any CD80� DC lineage. Ref lecting the gener-alized increase in BM cellularity induced by ovx, the totalnumber of most BM DC subsets was higher in ovx than in shammice (SI Table 2). However, the increase induced by ovx waslarger for CD80� conventional DCs than for the other DClineage.
Ovx increased Ag presentation by BMMs and BM DCs by �2-and �5-fold, respectively (Fig. 1C). The effect of ovx on DCs wasorgan-specific because ovx increased the activity of BM DCs, but itfailed to affect that of spleen and lymph node DCs (Fig. 1D).
The expression of class II transactivator (CIITA), a gene thatencodes for a nuclear activator of MHCII transcription, is charac-teristically down-regulated as DCs acquire the capacity to presentAg (24). Attesting to an effect of ovx on DC activation, we foundovx to decrease the expression of CIITA mRNA by BM DC by�60% (Fig. 1E). Analysis of the T cell activation marker CD69 at2 weeks revealed that ovx increases CD69 expression on BM CD4�(Fig. 1F) and CD8� T cells (Fig. 1G) but not in spleen T cells. Thus,
the activation of DCs coincides, both spatially and temporally, withthe activation of T cells.
To assess whether T cell TNF production coincides with DCactivation, we cocultured �-irradiated BM and spleen DCs fromsham and ovx mice with the avian Ag ovalbumin and T cells fromOT-II mice, a strain with T cells that harbor a transgenic T cellreceptor responsive exclusively to ovalbumin. In this model ovalbu-min-derived peptides presented by APCs to T cells induce T cellactivation and T cell cytokine secretion. TNF was measured in theculture medium at the end of a 3-day culture period. Ovx increasedthe production of TNF by �40% in cocultures containing BM DC,whereas it had no effects in those containing spleen DCs (Fig. 1H).Together, the data demonstrate that increased Ag presentation byBM DCs leads to T cell activation and T cell TNF production.
Ovx Induces a Tissue-Selective Increase in Oxidative Stress in the BM.Oxidative stress has been implicated in ovx-induced bone loss (19,20, 22), although how ovx increases oxidative stress is unknown. Toaddress this issue we measured the levels of APE-1/Ref-1, perox-iredoxin-1 (Prx-1), and glutathione (GSH) in BM, spleen, and liver.These two latter tissues were chosen as controls because they areknown active sites of ROS production both under physiological andpathological conditions (25–27). APE-1/Ref-1 is an inhibitor of theNADPH oxidase that regulates the intracellular generation of ROS(28) and is also a redox coactivator of NF-�B (29). Prx-1 providescytoprotection against cellular oxidative stress through itsthioredoxin-dependent peroxidase activity (30), whereas GSH isessential to eliminate intracellular peroxide (31).
In the BM, ovx induced a 4-fold decrease in intracellular APE-1/Ref-1 (Fig. 2A), a nearly 3-fold decrease in Prx-1 levels (Fig. 2B),and a 30% decrease in intracellular GSH (Fig. 2C). Unexpectedly,ovx also caused an increase in APE-1/Ref-1 in the spleen and inGSH in the liver. Representative Western blots showing that ovxdown-regulates the levels of APE-1/Ref-1 and Prx-1 in BM but notin spleen or liver are shown in SI Fig. 6.
Protein carbonyl formation is a consequence of oxidative damageto cellular proteins (32). Thus, protein carbonylation was quantifiedin the BM to determine the extent of oxidative damage and wasfound to be significantly increased by ovx (Fig. 2D). Therefore, ovxinduces a tissue-selective decrease in both ROS intracellular scav-engers and inhibitors of ROS generation, leading to a local accu-mulation of ROS-induced protein damage in the BM.
Antioxidants Prevent the Activation of BM DCs and T Cells Induced byOvx. One relevant consequence of increased ROS production isinduction of APC maturation and T cell activation (23, 33). We thusinvestigated whether ovx increases Ag presentation by DCs, T cellactivation, and T cell TNF production, through oxidative stress.First, we assessed whether CD80 expression is directly modulatedby ROS. Thus, BM from intact mice was treated in vitro withhydrogen peroxide (H2O2) for 24 h to increase the levels of ROS.Measurements of cell viability by trypan blue exclusion showed theviability of BM cells to be �90% and �75% after treatment withH2O2 at 100 nM and 1,000 nM, respectively. FACS analysis of gatedMHCIIhi cells, a population of mature APCs, revealed that H2O2caused a dose-dependent expansion of the pool of CD80�CD11c�cells (Fig. 2E) and an increase in CD4 and CD8 T cell activation(Fig. 2F). These findings suggest that CD80-dependent T cellcostimulation is up-regulated by ROS.
To determine whether ovx activates T cells through oxidativestress in vivo, ovx mice were treated for 4 weeks with N-acetylcys-teine (NAC), an antioxidant that restores the intracellular pool ofGSH, preventing increases in ROS. Measurements of GSH levelsin the BM confirmed that NAC completely prevented the decreasein GSH levels induced by ovx (data not shown). Furthermore, NACprevented the increase in Ag presentation by BM DCs (Fig. 3A), theincrease in the relative number of CD80� BM DCs (Fig. 3B),increases in the total number of BM CD69�CD4� (Fig. 3C) and
Fig. 1. Effects (mean � SD) of ovx on DC expression of MHCII and CD80, Agpresentation,andTcellactivation. (A)Ovxup-regulatesthepercentageofCD80�but not that of MHCII� BM DCs. FACS analysis was carried out by gating CD11c�cells and analyzing for MHCII and CD80 expression. Dot plot shows one of threeindependent experiments. (B) Ovx increases the number of BM DCs, MHCII� DCs,and CD80� DCs. (C) Ovx increases Ag presentation by BMMs and BM DCs. (D) Ovxincreases Ag presentation by BM but not spleen (SPL) and lymph node (LN) DCs.(E) Ovx decreases CIITA mRNA expression in BM DCs. (F and G) Ovx increases theexpression of the activation marker CD69 in CD4� and CD8� BM T cells. (H) TNFlevels in conditioned medium from coculture of BM DCs, OT-II T cells, andovalbumin;n�4micepergroup ineachoneoftriplicateexperiments.*,P�0.05;
**, P � 0.001 compared with sham mice.
15088 � www.pnas.org�cgi�doi�10.1073�pnas.0703610104 Grassi et al.

CD69�CD8� T cells (Fig. 3D), and the increase in TNF produc-tion by ex vivo cultures of BM (Fig. 3E).
Furthermore, in vivo measurement of bone mineral density bydual-energy x-ray absorptiometry (DXA), a technique that pro-vides a combined assessment of cortical and trabecular bone,revealed that NAC treatment decreased the femoral bone lossinduced by ovx (Fig. 3F). Ex vivo micro-computed tomography(�CT) measurements of vertebral trabecular bone, the skeletal sitemost affected by ovx, demonstrated that NAC prevents the loss oftrabecular bone induced by ovx (Fig. 3G). Thus, the ovx-inducedaccumulation of ROS in BM stimulates immune cell activation andTNF production, whereas antioxidants prevent ovx-induced boneloss.
CTLA4-Ig Blocks Costimulation by CD80 Receptor and Protects Micefrom Ovx-induced Bone Loss. Up-regulation of CD80 expression onAPCs and its binding to CD28 on T cells is one of the earliest eventsin Ag-dependent T cell activation (17). To test the relevance ofCD80-mediated T cell activation on ovx-induced bone loss, micewere treated with 500 �g/day CTLA4-Ig, an immunosuppressantthat inhibits the binding of CD80 (and CD86) to CD28, or 500�g/day irrelevant (Irr) isotype-matched Ig. In a first experiment,
mice were treated with CTLA4-Ig or Irr-Ig three times a week for4 weeks. CTLA4-Ig prevented the increase in the number ofCD4�CD69� and CD8�CD69� BM T cells (Fig. 4 A and B) aswell as the increase in T cell TNF production induced by ovx (Fig.4C), confirming that ovx activates T cells through Ag presentation.Measurements of serum C-terminal telopeptides (CTX), a markerof bone resorption (Fig. 4D), and serum osteocalcin, a marker offormation (Fig. 4E), revealed that the increase in both indicesinduced by ovx was prevented by CTLA4-Ig.
To investigate the effect of CTLA4-Ig on in vitro OC formation,whole BM was cultured in the presence of a suboptimal concen-tration of RANKL. BM from ovx mice generated a 2-fold highernumber of OCs than BM from sham controls (Fig. 4F), and theovx-induced increase in OC formation was prevented by in vivoCTLA4-Ig treatment. In vitro treatment of osteoclastogenic culturesof BMMs with CTLA4-Ig did not alter the production of matureOCs (data not shown), demonstrating that CTLA4-Ig inhibits OCformation in vivo without directly inhibiting OC differentiation.
In vivo prospective measurements of femoral bone mineraldensity by DXA showed (Fig. 4G) that CTLA4-Ig completelyprevented the femoral bone loss induced by ovx. �CT measure-ments of femoral trabecular bone harvested at 4 weeks showed (Fig.4H) that treatment with CTLA4-Ig afforded nearly complete
Fig. 2. Ovx induces oxidative stress and T cell activation in the BM. (A and B)Densitometric quantification of Western blots. (A) Effect of ovx on intracellularlevels of APE-1/Ref-1. (B) Effect of ovx on BM Prx-1 levels. (C) Effect of ovx on GSHlevels in the BM. (D) Ovx increases protein carbonylation in BM lysates. (A–D) Alldataare themean�SDof three independentexperiments (n�3micepergroup;
*, P � 0.05, compared with the corresponding sham group). (E) H2O2 causes adose-dependent increase in the relative number of mature BM DC (CD80�MHCIIhi CD11c� cells). Whole BM was cultured in �-MEM with 10% FBS for 24 hand treated with the indicated concentrations of H2O2. Cell viability was con-firmed by trypan blue exclusion. FACS analysis was carried out by gating MHCIIhi
cells and analyzing for CD11c and CD80 expression. Dot plot shows one of threeindependentexperiments. (F)H2O2 increasesCD69expression inCD4�andCD8�BM T cells. (E and F) Data are the mean � SD of three independent experiments(n � 4 mice per group; *, P � 0.05; **, P � 0.01 compared with unstimulated BM).
Fig. 3. Effects (mean � SD) of in vivo treatment of ovx mice with 100 mg/kgper day i.p. NAC for 4 weeks. (A) Ag presentation by BM and spleen DCs. (B)Percentage CD80� BM DCs. (C) Percentage CD4�CD69� BM T cells. (D)Percentage CD8�CD69� BM T cells. (E) Levels of TNF in 24-h BM culturesstimulated with phorbol 12-myristate 13-acetate and ionomycin. (F) FemurBMD as measured in vivo by DXA at 2 and 4 weeks. (G) �CT measurements ofpercentage total volume occupied by trabecular bone volume (BV/TV) invertebras harvested 4 weeks after surgery (n � 7 mice per group; *, P � 0.05compared with sham mice; **, P � 0.05 compared with baseline).
Grassi et al. PNAS � September 18, 2007 � vol. 104 � no. 38 � 15089
MED
ICA
LSC
IEN
CES

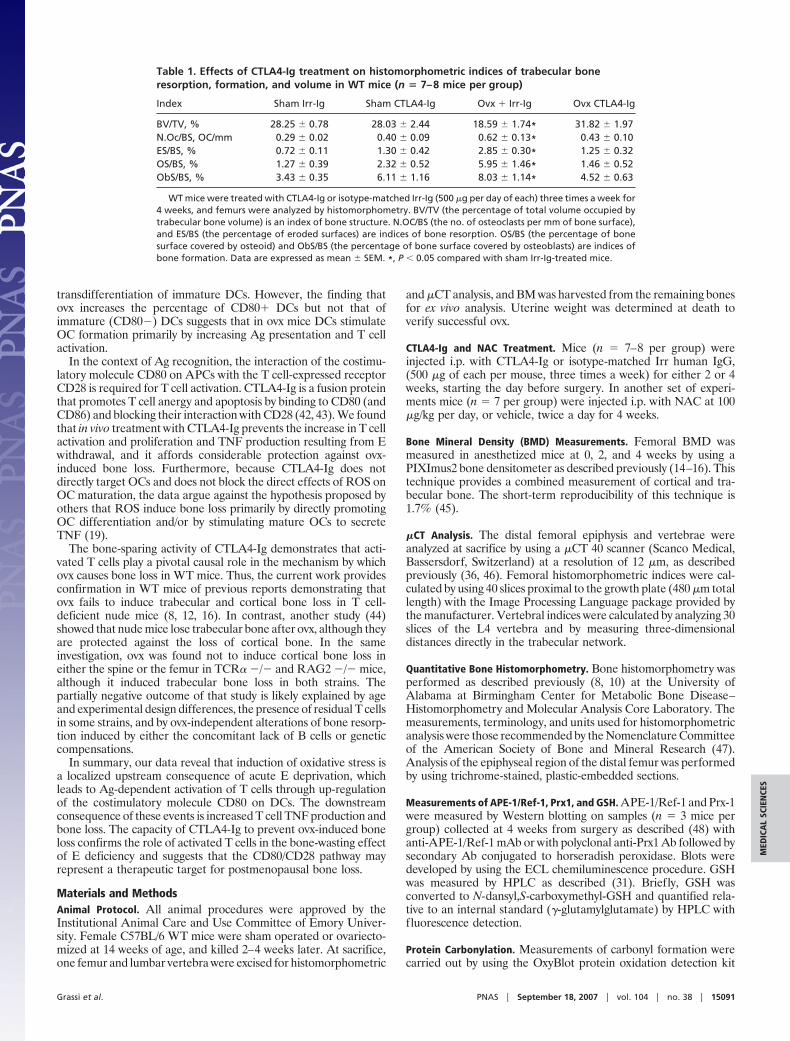
protection against the loss of trabecular bone volume and trabecularthickness induced by ovx. Analysis of trabecular bone by histomor-phometry (Table 1) confirmed that treatment with CTLA4-Igprevents the loss of trabecular bone volume induced by ovx as wellas the increase in bone resorption, as assessed by measurements ofthe number of OCs per bone surface and the percent erodedsurfaces. Treatment with CTLA4-Ig also prevented the ovx-inducedincrease in the percent of bone surface covered by osteoid and thepercent of bone surface covered by osteoblasts, two indices of boneformation.
In a second set of experiments, CTLA4-Ig was injected during the1st week after surgery and then discontinued, a protocol thatensures high circulating levels of the drug until the end of the 2ndweek of follow-up (34). Subsets of mice were then killed at 2 and4 weeks from surgery. In vivo bone density measurements by DXAas well as ex vivo �CT analysis of femurs showed a significantprotection against ovx-induced bone loss by CTLA4-Ig treatment at2 weeks. However, at 4 weeks, CTLA4-Ig-treated mice showedvalues of bone density similar to Irr-Ig-treated ovx mice, indicatingthat bone loss had resumed (SI Fig. 7).
DiscussionAmong the mechanisms responsible for ovx-induced bone loss is anexpansion of the pool of activated T cells that produce TNF (8, 12).Ovx increases CD4� T cell activation by enhancing Ag presentationby BMMs through increased expression of MHCII, a phenomenoncaused by a complex mechanism that involves increased productionof IFN� and IL-7 and blunted generation of TGF� in the BM (15,16, 35, 36). Here we show that additional effects of ovx are toexpand the pool of BM plasmacytoid and conventional mature DCsand to enhance Ag presentation by BM DCs through up-regulationof the costimulatory molecule CD80. The latter leads to theactivation in the BM of both CD4� and CD8� T cells. DCs are themost potent professional APCs (18), and ovx increases their anti-gen-presenting activity by �5-fold, whereas it enhances that ofBMMs by �2-fold (15). Therefore, DCs play a pivotal role in theT cell activation induced by ovx.
A striking finding of this work is that ovx activates BM DCswithout affecting DCs localized in other secondary lymphoidorgans, a phenomenon that may explain why E deprivation triggersan effector T cell response in the BM but does not induce a systemicinflammatory and/or immune response. Accordingly, an effect ofovx on DCs was not demonstrated in an earlier study (15) becauseonly DCs derived from lymph nodes were analyzed.
Our findings demonstrate that a mechanism by which ovxelicits a tissue-specific DC response is a change in redox state, akey microenvironment determinant (21). Multiple enzymaticpathways regulate the intracellular redox state through modu-lation of ROS levels (37). Ovx blunts the BM levels of GSH, acritical ROS scavenger, and those of APE-1/Ref-1 and Prx-1,proteins that contribute to limit the production of intracellularROS (28). Furthermore, the finding in the BM of ovx mice ofincreased protein carbonylation, a marker of protein oxidation(32), attests to the functional relevance of the ovx-inducedoxidative stress. Like the activation of DCs, the effects of ovx onthe redox state are spatially limited to the BM a phenomenonnoted previously by Lean et al. (19).
ROS comprise the superoxide anion (O2�� ), which has a short
half-life and is an intermediate during the reduction of molecularoxygen to H2O2. The latter is the most abundant and long-lastingROS. H2O2 plays a critical role in inflammation through its directeffects or by its transformation into OH� (38). This OH� is a morepotent ROS than H2O2 but exerts its effects only locally because ofits short half-life. Because ovx decreases Prx-1 and GSH levels, thedata suggest that ovx increases H2O2 levels (30). The finding of anincrease in protein carbonylation further suggests that a free radicalprocess was involved. However, because we did not measure specificoxidant species, a contribution of other reactive oxygen species suchas O2
�� and of Prx-1 cannot be excluded.Reports have suggested that stimulation of TNF production by
OCs or BM cells is the mechanism by which ROS cause bone loss(19, 20, 39). However these studies did not provide conclusiveinformation regarding the cellular source of TNF nor about themechanisms by which ROS stimulates TNF production. The cur-rent work demonstrates that key effects of ovx, the up-regulation ofAg-dependent activation of T cells and the resulting T cell produc-tion of TNF, are mediated by ROS and abolished by treatment withantioxidants. We also found that oxidative stress, like ovx, causes anexpansion of mature CD80�DCs and that antioxidants prevent theincrease in the number of CD80�DCs and the bone loss inducedby ovx. Together, these data suggest that the accumulation of ROSin the BM is the upstream event that leads to a tissue-specificactivation of DCs and T cell-dependent overproduction of TNF.
The interaction of activated T cells with immature DCs in areasof inflammation is now known to promote the transdifferentiationof DCs into OCs (40, 41). Because ovx causes an increase in thenumber of several populations of BM DCs, the up-regulation ofosteoclastogenesis induced by ovx is likely to be due, in part, to the
Fig. 4. CTLA4-Ig prevents T cell activation, T cell TNF production, OC forma-tion, and the bone loss induced by ovx. All data are shown as means � SD. Ovx-and sham-operated mice were treated with CTLA4-Ig (500 �g/mouse) orisotype-matched Irr-Ig (500 �g/mouse) three times per week for 4 weeks. (A)Percentage CD4�CD69� BM T cells. (B) Percentage CD8�CD69� BM T cells. (C)TNF levels in 24-h BM T cell culture medium. (D) Serum CTX levels. (E) Serumosteocalcin levels. (F) No. of OCs in 8-day BM cultures stimulated with sub-saturating doses of RANKL and M-CSF. (G) In vivo measurements of femoralBMD by DXA. (H) Epiphyseal trabecular volume over total volume and tra-becular thickness (Tb.Th) as measured by �CT in femurs at 4 weeks fromsurgery (n � 7–8 mice per group; *, P � 0.05 compared with Irr-Ig-treated shamcontrols; **, P � 0.05 compared with baseline.
15090 � www.pnas.org�cgi�doi�10.1073�pnas.0703610104 Grassi et al.
transdifferentiation of immature DCs. However, the finding thatovx increases the percentage of CD80� DCs but not that ofimmature (CD80�) DCs suggests that in ovx mice DCs stimulateOC formation primarily by increasing Ag presentation and T cellactivation.
In the context of Ag recognition, the interaction of the costimu-latory molecule CD80 on APCs with the T cell-expressed receptorCD28 is required for T cell activation. CTLA4-Ig is a fusion proteinthat promotes T cell anergy and apoptosis by binding to CD80 (andCD86) and blocking their interaction with CD28 (42, 43). We foundthat in vivo treatment with CTLA4-Ig prevents the increase in T cellactivation and proliferation and TNF production resulting from Ewithdrawal, and it affords considerable protection against ovx-induced bone loss. Furthermore, because CTLA4-Ig does notdirectly target OCs and does not block the direct effects of ROS onOC maturation, the data argue against the hypothesis proposed byothers that ROS induce bone loss primarily by directly promotingOC differentiation and/or by stimulating mature OCs to secreteTNF (19).
The bone-sparing activity of CTLA4-Ig demonstrates that acti-vated T cells play a pivotal causal role in the mechanism by whichovx causes bone loss in WT mice. Thus, the current work providesconfirmation in WT mice of previous reports demonstrating thatovx fails to induce trabecular and cortical bone loss in T cell-deficient nude mice (8, 12, 16). In contrast, another study (44)showed that nude mice lose trabecular bone after ovx, although theyare protected against the loss of cortical bone. In the sameinvestigation, ovx was found not to induce cortical bone loss ineither the spine or the femur in TCR� �/� and RAG2 �/� mice,although it induced trabecular bone loss in both strains. Thepartially negative outcome of that study is likely explained by ageand experimental design differences, the presence of residual T cellsin some strains, and by ovx-independent alterations of bone resorp-tion induced by either the concomitant lack of B cells or geneticcompensations.
In summary, our data reveal that induction of oxidative stress isa localized upstream consequence of acute E deprivation, whichleads to Ag-dependent activation of T cells through up-regulationof the costimulatory molecule CD80 on DCs. The downstreamconsequence of these events is increased T cell TNF production andbone loss. The capacity of CTLA4-Ig to prevent ovx-induced boneloss confirms the role of activated T cells in the bone-wasting effectof E deficiency and suggests that the CD80/CD28 pathway mayrepresent a therapeutic target for postmenopausal bone loss.
Materials and MethodsAnimal Protocol. All animal procedures were approved by theInstitutional Animal Care and Use Committee of Emory Univer-sity. Female C57BL/6 WT mice were sham operated or ovariecto-mized at 14 weeks of age, and killed 2–4 weeks later. At sacrifice,one femur and lumbar vertebra were excised for histomorphometric
and �CT analysis, and BM was harvested from the remaining bonesfor ex vivo analysis. Uterine weight was determined at death toverify successful ovx.
CTLA4-Ig and NAC Treatment. Mice (n � 7–8 per group) wereinjected i.p. with CTLA4-Ig or isotype-matched Irr human IgG,(500 �g of each per mouse, three times a week) for either 2 or 4weeks, starting the day before surgery. In another set of experi-ments mice (n � 7 per group) were injected i.p. with NAC at 100�g/kg per day, or vehicle, twice a day for 4 weeks.
Bone Mineral Density (BMD) Measurements. Femoral BMD wasmeasured in anesthetized mice at 0, 2, and 4 weeks by using aPIXImus2 bone densitometer as described previously (14–16). Thistechnique provides a combined measurement of cortical and tra-becular bone. The short-term reproducibility of this technique is1.7% (45).
�CT Analysis. The distal femoral epiphysis and vertebrae wereanalyzed at sacrifice by using a �CT 40 scanner (Scanco Medical,Bassersdorf, Switzerland) at a resolution of 12 �m, as describedpreviously (36, 46). Femoral histomorphometric indices were cal-culated by using 40 slices proximal to the growth plate (480 �m totallength) with the Image Processing Language package provided bythe manufacturer. Vertebral indices were calculated by analyzing 30slices of the L4 vertebra and by measuring three-dimensionaldistances directly in the trabecular network.
Quantitative Bone Histomorphometry. Bone histomorphometry wasperformed as described previously (8, 10) at the University ofAlabama at Birmingham Center for Metabolic Bone Disease–Histomorphometry and Molecular Analysis Core Laboratory. Themeasurements, terminology, and units used for histomorphometricanalysis were those recommended by the Nomenclature Committeeof the American Society of Bone and Mineral Research (47).Analysis of the epiphyseal region of the distal femur was performedby using trichrome-stained, plastic-embedded sections.
Measurements of APE-1/Ref-1, Prx1, and GSH. APE-1/Ref-1 and Prx-1were measured by Western blotting on samples (n � 3 mice pergroup) collected at 4 weeks from surgery as described (48) withanti-APE-1/Ref-1 mAb or with polyclonal anti-Prx1 Ab followed bysecondary Ab conjugated to horseradish peroxidase. Blots weredeveloped by using the ECL chemiluminescence procedure. GSHwas measured by HPLC as described (31). Briefly, GSH wasconverted to N-dansyl,S-carboxymethyl-GSH and quantified rela-tive to an internal standard (�-glutamylglutamate) by HPLC withfluorescence detection.
Protein Carbonylation. Measurements of carbonyl formation werecarried out by using the OxyBlot protein oxidation detection kit
Table 1. Effects of CTLA4-Ig treatment on histomorphometric indices of trabecular boneresorption, formation, and volume in WT mice (n � 7–8 mice per group)
Index Sham Irr-Ig Sham CTLA4-Ig Ovx � Irr-Ig Ovx CTLA4-Ig
BV/TV, % 28.25 � 0.78 28.03 � 2.44 18.59 � 1.74* 31.82 � 1.97N.Oc/BS, OC/mm 0.29 � 0.02 0.40 � 0.09 0.62 � 0.13* 0.43 � 0.10ES/BS, % 0.72 � 0.11 1.30 � 0.42 2.85 � 0.30* 1.25 � 0.32OS/BS, % 1.27 � 0.39 2.32 � 0.52 5.95 � 1.46* 1.46 � 0.52ObS/BS, % 3.43 � 0.35 6.11 � 1.16 8.03 � 1.14* 4.52 � 0.63
WT mice were treated with CTLA4-Ig or isotype-matched Irr-Ig (500 �g per day of each) three times a week for4 weeks, and femurs were analyzed by histomorphometry. BV/TV (the percentage of total volume occupied bytrabecular bone volume) is an index of bone structure. N.OC/BS (the no. of osteoclasts per mm of bone surface),and ES/BS (the percentage of eroded surfaces) are indices of bone resorption. OS/BS (the percentage of bonesurface covered by osteoid) and ObS/BS (the percentage of bone surface covered by osteoblasts) are indices ofbone formation. Data are expressed as mean � SEM. *, P � 0.05 compared with sham Irr-Ig-treated mice.
Grassi et al. PNAS � September 18, 2007 � vol. 104 � no. 38 � 15091
MED
ICA
LSC
IEN
CES

(Intergen, Purchase, NY) following the manufacturer’s protocol asdescribed, n � 3 mice per group.
Serum CTX and Osteocalcin Measurements. Serum CTX, a marker ofbone resorption, and osteocalcin, a marker of bone formation, weredetermined in serum by ELISA with the mouse-specific kitsRatlaps and Rat-MID, respectively (NordicBioscience DiagnosticsA/S, Herlev, Denmark).
Flow Cytometry. Flow cytometry was performed as described(14) by labeling cells with anti-CD69-conjugated Peridinin-chlorophyll-protein complex (PerCP), anti-CD4-conjugatedAPC, and anti-CD8-conjugated phycoerythrin (PE). For BMDCs subset analysis, BM cells were also stained with anti-CD11c-conjugated APC, anti MHCII (Ia-b)-conjugated PE,anti-CD80-conjugated FITC, anti-CD8-conjugated PerCP,and anti-B220-conjugated FITC. Nonspecific staining wasassessed by using FITC, APC, PerCP or PE-conjugated iso-type-matched normal IgG mAbs. For each set of mice, BMcells from four mice were individually processed and stainedcells were analyzed by a FACScan f low cytometer (BD Bio-science, San Jose, CA).
Purification of APCs. BMMs and B cells were isolated from spleenor BM by immunomagnetic-positive selection as described previ-ously (15). DCs were isolated by immunomagnetic-positive selec-tion of CD11c� of nonadherent mononuclear cells after an over-night adherence step on plastic to eliminate adherent cells. Cellphenotype was assessed by flow cytometry, and populations werefound to be �98% pure.
Antigen Presentation Assay. Ag presentation was measured asdescribed previously (15, 16). Briefly, T cells from OT-II mice inC57BL/6 background were purified and cultured for 8 days inmedium containing 40 units/ml IL-2 and 0.5 mg/ml ovalbumin. DC,BMMs or B cells (1 � 105 per well) were purified (n � 4 mice pergroup), �-irradiated, and cocultured in a 96-well plate for 72 h withT cells at a ratio of 5:1 in medium containing 0.5 mg/ml ovalbumin.
T cell proliferation induced by Ag presentation was quantitated by[3H]thymidine incorporation added during the last 18 h of culture.
T Cell TNF Production. T cell TNF was assessed by ELISA (Quan-tikine; R & D Systems, Minneapolis, MN) in the supernatants ofwhole BM or purified BM T cells isolated from OT-II mice byimmunomagnetic-positive selection of CD90� cells.
RT-PCR. CIITA was quantitated in DC by real-time PCR as de-scribed previously (15, 16). The primers used for CIITA were5-GAG AAG TTC ACC ATT GAG CCA TT A-3 (forward) and5-GTC CCG GAT GGC AGG AA CG-3 (reverse), mRNA wasnormalized against 18S mRNA by using the primers 5-CAC GGCCGG TAC AGT GAA AC (forward) and 5-AGA GGA GCGAGC GAC CAA AG-3 (reverse). Dissociation curves revealed asingle product in all cases. Fold change in cDNA concentration wascalculated by using the 2-CT method (15, 16, 49) with normal-ization of input using 18S.
In Vitro Osteoclast Formation. 1.2 � 106 BM cells were harvestedfrom four mice per group and cultured in 48-well plates with 15ng/ml RANKL (kindly provided by X. Feng, University of Alabamaat Birmingham, AL) and 10 ng/ml M-CSF. Cells were stained fortartrate-resistant acid phosphatase (TRAP) at day 8, and TRAP�cells with three or more nuclei were scored as OCs.
Statistical Analysis. All cross-sectional data were analyzed by one-way ANOVA and Fisher’s protected least-squares difference testsor by the Kruskal–Wallis test for data not normally distributed.Prospective data were analyzed by ANOVA for repeated measures.Simple comparisons were made by using a two-tailed unpairedStudent’s t test.
We are grateful to the University of Alabama at Birmingham Center forMetabolic Bone Disease–Histomorphometry and Molecular Analysis CoreLaboratory, National Institutes of Health Grant P30-AR46031, for thehistomorphometric analysis presented herein. This work was supported byNational Institutes of Health Grant AG 28278 and by a grant from theEmory University Research Committee (to R.P.). F.G. was supported byMarie-Curie Fellowship 09097 from the European Commission.
1. Manolagas SC, Kousteni S, Jilka RL (2002) Recent Prog Horm Res 57:385–409.2. Clowes JA, Riggs BL, Khosla S (2005) Immunol Rev 208:207–227.3. Sun L, Peng Y, Sharrow AC, Iqbal J, Zhang Z, Papachristou DJ, Zaidi S, Zhu LL,
Yaroslavskiy BB, Zhou H, et al. (2006) Cell 125:247–260.4. Weitzmann MN, Pacifici R (2006) J Clin Invest 116:1186–1194.5. Pfeilschifter J, Koditz R, Pfohl M, Schatz H (2002) Endocr Rev 23:90–119.6. Hofbauer LC, Lacey DL, Dunstan CR, Spelsberg TC, Riggs BL, Khosla S (1999) Bone
25:255–259.7. Sherman ML, Weber BL, Datta R, Kufe DW (1990) J Clin Invest 85:442–447.8. Cenci S, Weitzmann MN, Roggia C, Namba N, Novack D, Woodring J, Pacifici R (2000)
J Clin Invest 106:1229–1237.9. Lam J, Takeshita S, Barker JE, Kanagawa O, Ross FP, Teitelbaum SL (2000) J Clin Invest
106:1481–1488.10. Kimble R, Bain S, Pacifici R (1997) J Bone Miner Res 12:935–941.11. Ammann P, Rizzoli R, Bonjour JP, Bourrin S, Meyer JM, Vassalli P, Garcia I (1997) J Clin
Invest 99:1699–1703.12. Roggia C, Gao Y, Cenci S, Weitzmann MN, Toraldo G, Isaia G, Pacifici R (2001) Proc Natl
Acad Sci USA 98:13960–13965.13. Charatcharoenwitthaya N, Khosla S, Atkinson EJ, McCready LK, Riggs BL (2007) J Bone
Miner Res 22:724–729.14. Ryan MR, Shepherd R, Leavey JK, Gao Y, Grassi F, Schnell FJ, Qian WP, Kersh GJ,
Weitzmann MN, Pacifici R (2005) Proc Natl Acad Sci USA 102:16735–16740.15. Cenci S, Toraldo G, Weitzmann MN, Roggia C, Gao Y, Qian WP, Sierra O, Pacifici R (2003)
Proc Natl Acad Sci USA 100:10405–10410.16. Gao Y, Qian WP, Dark K, Toraldo G, Lin AS, Guldberg RE, Flavell RA, Weitzmann MN,
Pacifici R (2004) Proc Natl Acad Sci USA 101:16618–16623.17. Keir ME, Sharpe AH (2005) Immunol Rev 204:128–143.18. Inaba K, Turley S, Yamaide F, Iyoda T, Mahnke K, Inaba M, Pack M, Subklewe M, Sauter
B, Sheff D, et al. (1998) J Exp Med 188:2163–2173.19. Lean JM, Davies JT, Fuller K, Jagger CJ, Kirstein B, Partington GA, Urry ZL, Chambers
TJ (2003) J Clin Invest 112:915–923.20. Lean JM, Jagger CJ, Kirstein B, Fuller K, Chambers TJ (2005) Endocrinology 146:728–735.21. Droge W (2002) Physiol Rev 82:47–95.22. Lean J, Kirstein B, Urry Z, Chambers T, Fuller K (2004) Biochem Biophys Res Commun
321:845–850.23. Kantengwa S, Jornot L, Devenoges C, Nicod LP (2003) Am J Respir Crit Care Med
167:431–437.24. Landmann S, Muhlethaler-Mottet A, Bernasconi L, Suter T, Waldburger JM, Masternak K,
Arrighi JF, Hauser C, Fontana A, Reith W (2001) J Exp Med 194:379–391.
25. Moon EY, Lee JH, Oh SY, Ryu SK, Kim HM, Kwak HS, Yoon WK (2006) Free Radic BiolMed 40:2103–2111.
26. Loguercio C, Federico A (2003) Free Radic Biol Med 34:1–10.27. Farinati F, Cardin R, Bortolami M, Grottola A, Manno M, Colantoni A, Villa E (2002) Mol
Cell Endocrinol 193:85–88.28. Ozaki M, Suzuki S, Irani K (2002) FASEB J 16:889–890.29. Tell G, Damante G, Caldwell D, Kelley MR (2005) Antioxid Redox Signal 7:367–384.30. Wood ZA, Poole LB, Karplus PA (2003) Science 300:650–653.31. Jones DP (2002) Methods Enzymol 348:93–112.32. Levine RL, Wehr N, Williams JA, Stadtman ER, Shacter E (2000) Methods Mol Biol
99:15–24.33. Moon EY, Noh YW, Han YH, Kim SU, Kim JM, Yu DY, Lim JS (2006) Immunol Lett
102:184–190.34. Srinivas NR, Shyu WC, Weiner RS, Tay LK, Greene DS, Barbhaiya RH (1995) J Pharm Sci
84:1488–1489.35. Weitzmann MN, Roggia C, Toraldo G, Weitzmann L, Pacifici R (2002) J Clin Invest
110:1643–1650.36. Gao Y, Grassi F, Ryan MR, Terauchi M, Page K, Yang X, Weitzmann MN, Pacifici R (2007)
J Clin Invest 117:122–132.37. Finkel T (2003) Curr Opin Cell Biol 15:247–254.38. Gloire G, Legrand-Poels S, Piette J (2006) Biochem Pharmacol 72:1493–1505.39. Jagger CJ, Lean JM, Davies JT, Chambers TJ (2005) Endocrinology 146:113–118.40. Rivollier A, Mazzorana M, Tebib J, Piperno M, Aitsiselmi T, Rabourdin-Combe C, Jurdic
P, Servet-Delprat C (2004) Blood 104:4029–4037.41. Alnaeeli M, Park J, Mahamed D, Penninger JM, Teng YT (2007) J Bone Miner Res
22:775–780.42. Moreland L, Bate G, Kirkpatrick P (2006) Nat Rev Drug Discov 5:185–186.43. Ruderman EM, Pope RM (2005) Arthritis Res Ther 7(Suppl 2):S21–S25.44. Lee SK, Kadono Y, Okada F, Jacquin C, Koczon-Jaremko B, Gronowicz G, Adams DJ,
Aguila HL, Choi Y, Lorenzo JA (2006) J Bone Miner Res 21:1704–1712.45. Cenci S, Weitzmann MN, Gentile MA, Aisa MC, Pacifici R (2000) J Clin Invest 105:1279–
1287.46. Grassi F, Fan X, Rahnert J, Weitzmann MN, Pacifici R, Nanes MS, Rubin J (2006)
Endocrinology 147:4392–4399.47. Parfitt AM, Drezner MK, Glorieux FH, Kanis JA, Malluche H, Meunier PJ, Ott SM, Recker
RR (1987) J Bone Miner Res 2:595–610.48. Pines A, Perrone L, Bivi N, Romanello M, Damante G, Gulisano M, Kelley MR,
Quadrifoglio F, Tell G (2005) Nucleic Acids Res 33:4379–4394.49. Livak KJ, Schmittgen TD (2001) Methods 25:402–408.
15092 � www.pnas.org�cgi�doi�10.1073�pnas.0703610104 Grassi et al.