OWRB 2003 Lake Thunderbird Algae Report · LAKE THUNDERBIRD ALGAE STUDY FINAL REPORT 7 Methods Lake...
23
Lake Thunderbird Algae Study 2003 Final Report Lake Thunderbird Algae 2003 for the Central Oklahoma Master Conservancy District May 2004 Final Report Oklahoma Water Resources Board 3800 North Classen Boulevard Oklahoma City, OK 73118 Oklahoma Water Resources Board
Transcript of OWRB 2003 Lake Thunderbird Algae Report · LAKE THUNDERBIRD ALGAE STUDY FINAL REPORT 7 Methods Lake...

Lake Thunderbird Algae Study 2003 Final Report
Lake Thunderbird
Algae 2003
for the
Central Oklahoma Master Conservancy District
May 2004
Final Report Oklahoma Water Resources Board 3800 North Classen Boulevard Oklahoma City, OK 73118
Oklahoma Water Resources Board

LAKE THUNDERBIRD ALGAE STUDY FINAL REPORT
2
Executive Summary Algae have long been known to cause water quality problems in many municipal water systems. From the available data, Lake Thunderbird contains algae with the potential to produce taste and odor (T&O) and toxin chemicals (Table 0.1).
Table 0.1: Summary of potential taste and odor and toxin producing species identified in Lake Thunderbird in 2003.
Species Division Potential T&O
Potential Toxin
Anabaena bergeii v. limnetica Cyanophyta X X Anabaena flos-aquae Cyanophyta X X Anabaena spiroides Cyanophyta X X Anabaenopsis elenkinii** Cyanophyta X Aphanizomenon issatschenkoi Cyanophyta X X Cylindrospermopsis raciborskii Cyanophyta X Planktolyngbya contorta (Lyngbya lagerheimii f. minor) Cyanophyta X X
Planktolyngbya subtilis (Lyngbya limnetica) Cyanophyta X X
Oscillatoria limnetica Cyanophyta X X Oscillatoria rubescens Cyanophyta X X Ceratium hirundinella Pyrrophyta X In 2003 the total algal content of the lake, as measured by biovolume and cell density, has been on average equivalent to that seen in 2002, though 2003’s algae levels have ranged much higher on several acute events. Total algae content was considerably higher in 2001 than in the last two years. When you consider only the potential toxin and taste and odor producing algae, the results are similar. 2001 had the largest amount, by both cell density and biovolume, of potential toxin and T&O producers. Algae content was decreased by a factor of 10 in 2002, though subsequent sampling in 2003 measured a doubling of 2002’s nuisance algae content. Some of these algae are capable of becoming nuisance blooms. Most of the potential bloom-forming species have been identified in small quantities at Lake Thunderbird and should not raise great concern. Specific testing for the dominant potential toxin producing species, Cylindrospermopsis raciborskii did not detect any toxins. A relationship was noted between lake nutrient content and the number of species of problem algae. In general, the greater the phosphorus content, the greater the number of potential problem algae. To reduce the numbers of potential problem algae in Lake Thunderbird, nutrient reduction controls are recommended. In spite of these occurrences, Lake Thunderbird is not in immediate danger. However, actions to increase monitoring and reduce nutrient inputs will help to more effectively manage this resource and perceived risk of toxic events and taste and odor problems.

LAKE THUNDERBIRD ALGAE STUDY FINAL REPORT
3
Table of Contents Executive Summary ..........................................................................................................2
Table of Contents..............................................................................................................3
List of Figures....................................................................................................................4
List of Tables.....................................................................................................................4
Introduction .......................................................................................................................5
Methods ............................................................................................................................7
Nutrients ........................................................................................................................7
Cell Density ...................................................................................................................8
Biovolume....................................................................................................................11
Taste and Odor Potential.............................................................................................13
Toxin Potential.............................................................................................................18
Summary.........................................................................................................................21
Recommendations ..........................................................................................................22
References......................................................................................................................23
LAKE THUNDERBIRD ALGAE STUDY FINAL REPORT
4
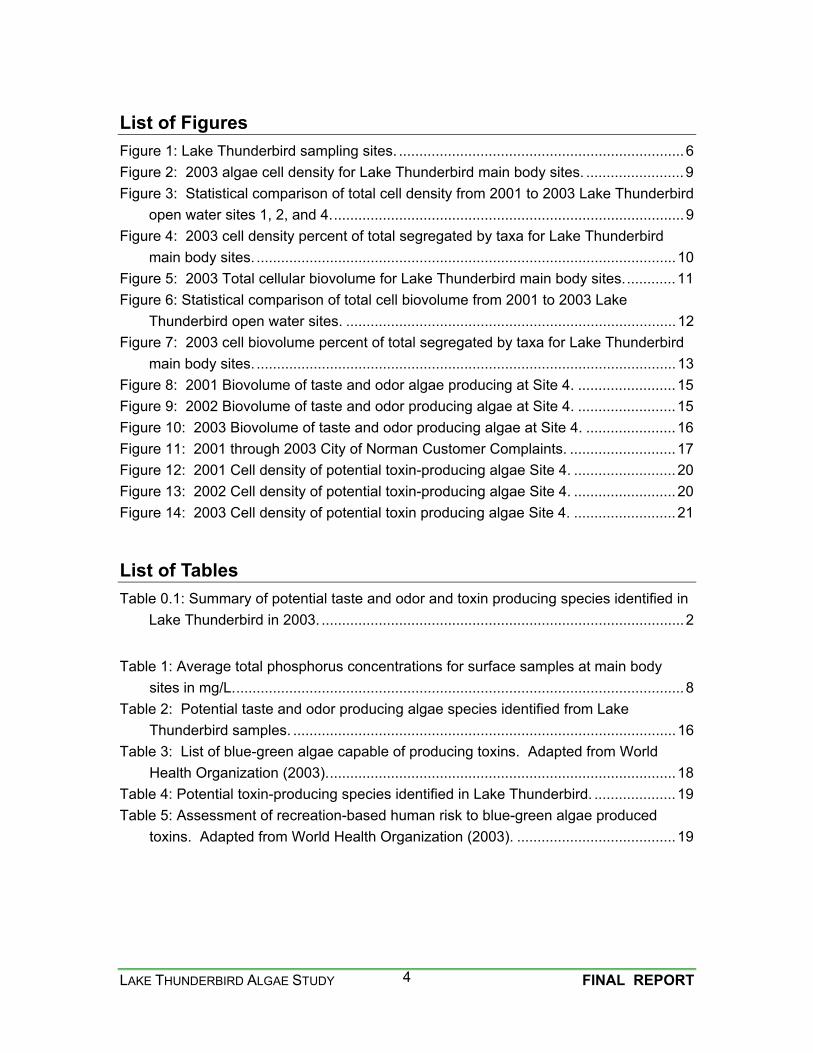
List of Figures Figure 1: Lake Thunderbird sampling sites. ......................................................................6 Figure 2: 2003 algae cell density for Lake Thunderbird main body sites. ........................9 Figure 3: Statistical comparison of total cell density from 2001 to 2003 Lake Thunderbird
open water sites 1, 2, and 4.......................................................................................9 Figure 4: 2003 cell density percent of total segregated by taxa for Lake Thunderbird
main body sites. .......................................................................................................10 Figure 5: 2003 Total cellular biovolume for Lake Thunderbird main body sites.............11 Figure 6: Statistical comparison of total cell biovolume from 2001 to 2003 Lake
Thunderbird open water sites. .................................................................................12 Figure 7: 2003 cell biovolume percent of total segregated by taxa for Lake Thunderbird
main body sites. .......................................................................................................13 Figure 8: 2001 Biovolume of taste and odor algae producing at Site 4. ........................15 Figure 9: 2002 Biovolume of taste and odor producing algae at Site 4. ........................15 Figure 10: 2003 Biovolume of taste and odor producing algae at Site 4. ......................16 Figure 11: 2001 through 2003 City of Norman Customer Complaints. ..........................17 Figure 12: 2001 Cell density of potential toxin-producing algae Site 4. .........................20 Figure 13: 2002 Cell density of potential toxin-producing algae Site 4. .........................20 Figure 14: 2003 Cell density of potential toxin producing algae Site 4. .........................21
List of Tables Table 0.1: Summary of potential taste and odor and toxin producing species identified in
Lake Thunderbird in 2003. .........................................................................................2 Table 1: Average total phosphorus concentrations for surface samples at main body
sites in mg/L...............................................................................................................8 Table 2: Potential taste and odor producing algae species identified from Lake
Thunderbird samples. ..............................................................................................16 Table 3: List of blue-green algae capable of producing toxins. Adapted from World
Health Organization (2003)......................................................................................18 Table 4: Potential toxin-producing species identified in Lake Thunderbird. ....................19 Table 5: Assessment of recreation-based human risk to blue-green algae produced
toxins. Adapted from World Health Organization (2003). .......................................19
LAKE THUNDERBIRD ALGAE STUDY FINAL REPORT
5
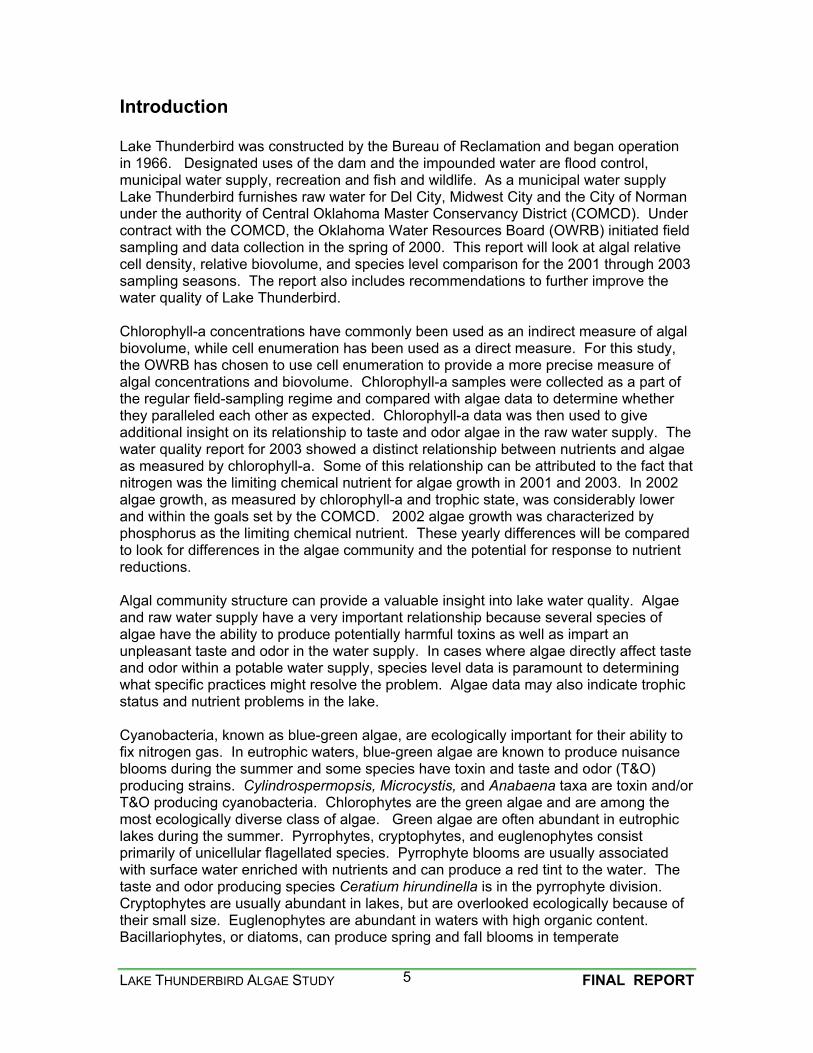
Introduction Lake Thunderbird was constructed by the Bureau of Reclamation and began operation in 1966. Designated uses of the dam and the impounded water are flood control, municipal water supply, recreation and fish and wildlife. As a municipal water supply Lake Thunderbird furnishes raw water for Del City, Midwest City and the City of Norman under the authority of Central Oklahoma Master Conservancy District (COMCD). Under contract with the COMCD, the Oklahoma Water Resources Board (OWRB) initiated field sampling and data collection in the spring of 2000. This report will look at algal relative cell density, relative biovolume, and species level comparison for the 2001 through 2003 sampling seasons. The report also includes recommendations to further improve the water quality of Lake Thunderbird. Chlorophyll-a concentrations have commonly been used as an indirect measure of algal biovolume, while cell enumeration has been used as a direct measure. For this study, the OWRB has chosen to use cell enumeration to provide a more precise measure of algal concentrations and biovolume. Chlorophyll-a samples were collected as a part of the regular field-sampling regime and compared with algae data to determine whether they paralleled each other as expected. Chlorophyll-a data was then used to give additional insight on its relationship to taste and odor algae in the raw water supply. The water quality report for 2003 showed a distinct relationship between nutrients and algae as measured by chlorophyll-a. Some of this relationship can be attributed to the fact that nitrogen was the limiting chemical nutrient for algae growth in 2001 and 2003. In 2002 algae growth, as measured by chlorophyll-a and trophic state, was considerably lower and within the goals set by the COMCD. 2002 algae growth was characterized by phosphorus as the limiting chemical nutrient. These yearly differences will be compared to look for differences in the algae community and the potential for response to nutrient reductions. Algal community structure can provide a valuable insight into lake water quality. Algae and raw water supply have a very important relationship because several species of algae have the ability to produce potentially harmful toxins as well as impart an unpleasant taste and odor in the water supply. In cases where algae directly affect taste and odor within a potable water supply, species level data is paramount to determining what specific practices might resolve the problem. Algae data may also indicate trophic status and nutrient problems in the lake. Cyanobacteria, known as blue-green algae, are ecologically important for their ability to fix nitrogen gas. In eutrophic waters, blue-green algae are known to produce nuisance blooms during the summer and some species have toxin and taste and odor (T&O) producing strains. Cylindrospermopsis, Microcystis, and Anabaena taxa are toxin and/or T&O producing cyanobacteria. Chlorophytes are the green algae and are among the most ecologically diverse class of algae. Green algae are often abundant in eutrophic lakes during the summer. Pyrrophytes, cryptophytes, and euglenophytes consist primarily of unicellular flagellated species. Pyrrophyte blooms are usually associated with surface water enriched with nutrients and can produce a red tint to the water. The taste and odor producing species Ceratium hirundinella is in the pyrrophyte division. Cryptophytes are usually abundant in lakes, but are overlooked ecologically because of their small size. Euglenophytes are abundant in waters with high organic content. Bacillariophytes, or diatoms, can produce spring and fall blooms in temperate
LAKE THUNDERBIRD ALGAE STUDY FINAL REPORT
6
environments and are known to deplete silicon concentrations in water bodies. Chrysophytes are known as brown algae. Blooms of some species may produce taste and odor problems in drinking water.
#
Site 6
#
#
#
#
#
#
Site 7
Site 4
Site 3
Site 1Site 5
Site 2
N
EW
S
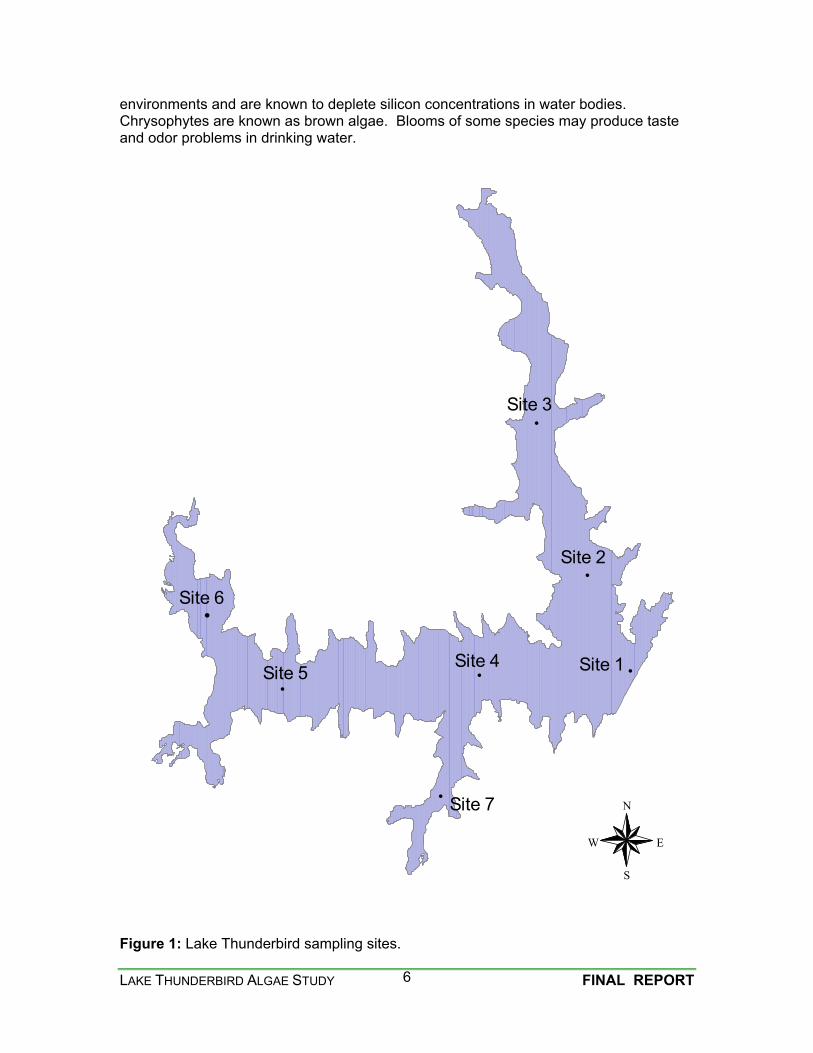
Figure 1: Lake Thunderbird sampling sites.

LAKE THUNDERBIRD ALGAE STUDY FINAL REPORT
7
Methods Lake Thunderbird was sampled for algae at the open water sites 1, 2, and 4 as indicated in Figure 1. All three algae sampling sites represent the main body of the lake and were monitored bi-weekly. Open water sites are characterized by large, open areas with summertime stratification. Site 1, maximum depth 17 meters, is located approximately 250 meters from the dam. Site 2, maximum depth 12.5 meters, is located near the shore of the Little River State Park. Site 4, is approximately 200 meters in front (south) of the COMCD raw water pumping station and has a maximum depth of 11.5 m. Algae samples were analyzed for species identification as well as enumeration by cell density and biovolume. The first data comparison presented is the broad view of relationship between nutrients and community measures of algae abundance (cell density and biovolume). Following this general discussion the community structure is examined by grouping the identifications into: cyanobacteria, chlorophyta, pyrrophyta, cryptophyta, bacillariophyceae, chrysophyta, euglenophyta, or miscellaneous flagellates. These give insight into general population dynamics. Following the discussion of community structure, genus and species level identifications will be examined for the potential of taste and odor chemical production as well as toxin production.
Nutrients
Samples were taken three times during the season. Samples taken in April and May represent spring conditions, samples from July represent summer conditions, and samples from September represent fall conditions. A comparison for each site and depth showed a general decrease in 2003 nitrogen levels when compared to 2002. At site 1, the 2003 maximum nitrogen levels were the lowest seen in the three years of sampling. The presence of heterocysts in some algae samples indicates that nitrogen may have been a limiting nutrient this season (Sze, 1986). Phosphorus is usually a better predictor for algae growth. Dissolved ortho-phosphorus is the form of phosphorus most easily used by algae for growth. There has been a steady decline for site 1 maximum ortho-phosphorus levels in the past three years. Aside from this distinct difference of the deep-water samples little year-to-year variation is noted for the other sites and samples. Generally, as long as the lake is stratified, surface nutrients are the primary determinant of algae growth. The delay of stratification in 2002 shortened the duration of anaerobic conditions in the hypolimnion. Because this did not occur in 2003, more phosphorus was released from sediment into the water. Surface total phosphorus levels increased in the fall of 2003 and approximated that of the summer and fall of 2001 (Table 1). The increase in surface phosphorus levels in 2003 suggests algae levels will be higher than in 2002. We would expect slightly lower algae levels than in 2001 due to the fact that the increase of phosphorus was not noted until the fall in 2003, while phosphorus was elevated in the summer of 2001. The presence of nitrogen-fixing blue-green algae also suggests that for actual phosphorus limitation, total phosphorus should be below 0.024 mg/L.

LAKE THUNDERBIRD ALGAE STUDY FINAL REPORT
8
Table 1: Average total phosphorus concentrations for surface samples at main body sites in mg/L.
Total Phosphorus concentrations (mg/L) Year
Spring n Summer n Fall n
2001 0.024 6 0.040 3 0.050 3
2002 0.020 3 0.020 3 0.019 3
2003 0.020 3 0.024 3 0.043 3
A strong relationship was noted between chlorophyll-a and nutrients in the 2003 water quality report. Using the same statistical methods as used in the water quality report, regressions between nutrients and total biomass and cell density were developed. Some statistical relationship was determined although not nearly as strong a relationship as that between nutrients and chlorophyll-a. The most notable aspect of these preliminary regressions was the high y-intercept values for each equation. High y-intercept does not allow for lower measures of algae growth. This leads the investigator to assume that nutrients levels relative to the most direct measures of algae growth (cell density and biomass) were abundant. The characterization of trophic status as eutrophic with hypereutrophic tendencies lends support to abundant nutrient levels. Although nutrients and chlorophyll-a showed a good relationship, nutrient levels are sufficiently high to preclude a linear relationship between nutrients and more direct measures of algae (cell density and biomass).
Cell Density Cell density is a measure of the total number of cells per a given volume of water. For Lake Thunderbird at the three main body sites, total cell density started near 20,000 cells/mL, rapidly peaked around the 1,000,000 cells/mL mark on May 28, 2003, and then generally varied around 100,000 cells/mL until a fall increase with cell density ranging from 150,000 cells/mL to 375,000 cells/mL (Figure 2). The drop in cell density following the May 28th peak represents an algae die-off event and loss of organic material to the water column. A similar peak and die-off event is centered around site 4 on July 24 2003. All three years had a peak of cyanobacteria at the end of May. Cell counts for all three years were well over 15,000 cells per mL, an indicator of eutrophic or nutrient rich systems. Hutchinson (1967) describes “eutrophic associations” by the appearance of the following three species: Aphanizomenon, Anabaena, and Oscillatoria. All three of these genera occurred in Lake Thunderbird.

LAKE THUNDERBIRD ALGAE STUDY FINAL REPORT
9
1
10
100
1,000
10,000
100,000
1,000,000
10,000,000
3/30/03 4/29/03 5/29/03 6/28/03 7/28/03 8/27/03 9/26/03 10/26/03 11/25/03
Cel
l den
sity
(cel
ls/m
L)
Site 1 Site 2 Site 4
Figure 2: 2003 algae cell density for Lake Thunderbird main body sites. 2003 was also marked by variability of cell density (Figure 3). While the median of 2003 is similar to 2002 the 50% quartile in 2003 extends much further than in 2002. The range for 2003 was also much greater than in 2002. The large range of data in 2003 shows algae growth between those observed in 2002 and 2002.
1,000
10,000
100,000
1,000,000
10,000,000
Cel
l Den
sity
(cel
ls/m
L)
2001 2002 2003 Figure 3: Statistical comparison of total cell density from 2001 to 2003 Lake
Thunderbird open water sites 1, 2, and 4.

LAKE THUNDERBIRD ALGAE STUDY FINAL REPORT
10
In 2002 and 2003, the beginning of the sampling season showed that the cryptophytes, haptophytes, and miscellaneous microflagellates had noticeably larger peaks in comparison to the cell density from the rest of the year (Figure 4). The rest of the sampling seasons were dominated by the blue-green algae. The extended sampling period in 2003 showed a decrease in cyanobacterial dominance. Cylindrospermopsis raciborskii dominated the second half of the sampling season for all three years at all main body sites. Declines in relative abundance of one genus usually preceded or occurred simultaneously with an increase in numbers from another genus. In 2001 and 2002, the species responsible for the peak was Aphanocapsa delicatissima. In 2003, Aphanocapsa holsatica was the species responsible for the peak. Aphanocapsa delicatissima and Aphanocapsa holsatica grow in microscopic colonies in primarily mesotrophic lakes (Wehr, 2003). It is likely that the large decline in cell density noted from May 28, 2003 to June 12, 2003 was the die-off of these relatively small blue-green algae. In 2003 there was a second cyanobacterial (Synechococcus nidulans) peak at the end of July at site 4. Synechococcus nidulans is normally seen in small water bodies, mainly in temperate zones (Wehr, 2003). In all three years, the beginning of the sampling season was dominated by the Aphanocapsa taxa. In 2003, Rhodomonas minuta (cryptophyta), various Anabaena species, and Aphanocapsa delicatissima dominated at the end of the sampling season at all main body sites. The review of the taxa and species enumerated in Lake Thunderbird indicate a eutrophic system.
0%10%20%30%40%50%60%70%80%90%
100%
5/1/03 5/28/03 6/24/03 7/24/03 9/2/03 10/8/03
% o
f Tot
al C
ell A
bund
ance
Misc. Cyanophyta Chlorophyta Pyrrhophyta CryptophytaBacillariophyceae Chrysophyta Euglenophyta Haptophyta
Figure 4: 2003 cell density percent of total segregated by taxa for Lake Thunderbird
main body sites.
LAKE THUNDERBIRD ALGAE STUDY FINAL REPORT
11
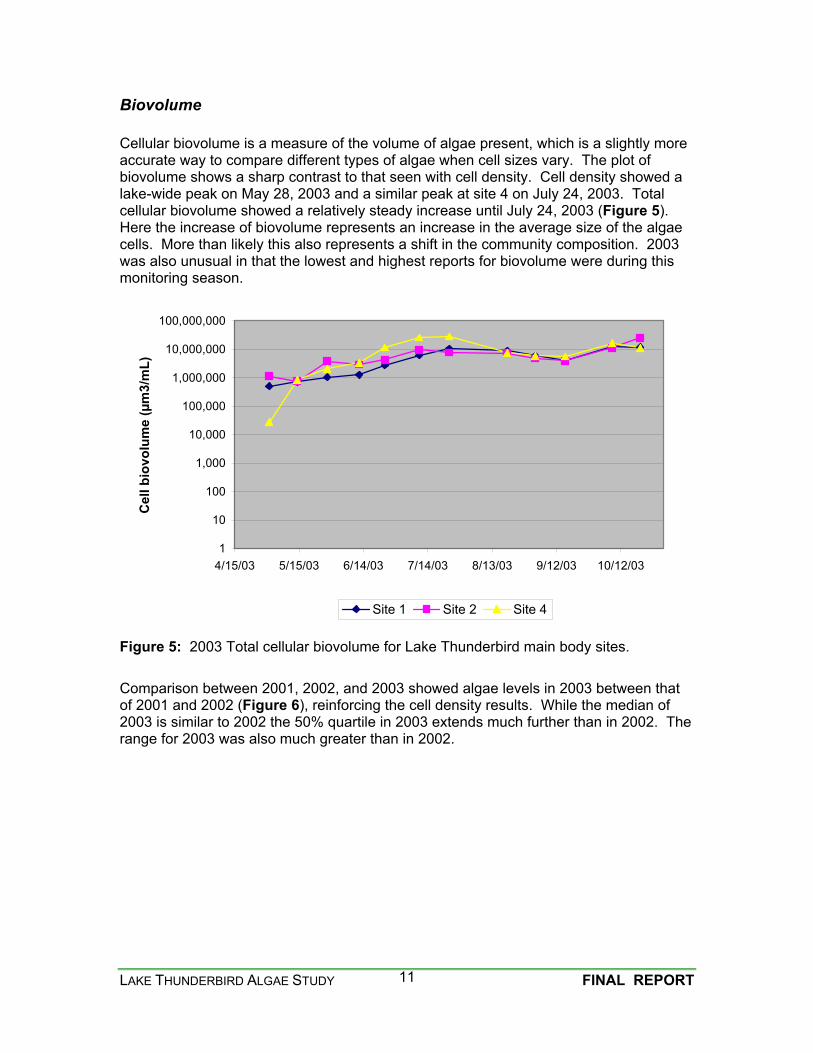
Biovolume Cellular biovolume is a measure of the volume of algae present, which is a slightly more accurate way to compare different types of algae when cell sizes vary. The plot of biovolume shows a sharp contrast to that seen with cell density. Cell density showed a lake-wide peak on May 28, 2003 and a similar peak at site 4 on July 24, 2003. Total cellular biovolume showed a relatively steady increase until July 24, 2003 (Figure 5). Here the increase of biovolume represents an increase in the average size of the algae cells. More than likely this also represents a shift in the community composition. 2003 was also unusual in that the lowest and highest reports for biovolume were during this monitoring season.
1
10
100
1,000
10,000
100,000
1,000,000
10,000,000
100,000,000
4/15/03 5/15/03 6/14/03 7/14/03 8/13/03 9/12/03 10/12/03
Cel
l bio
volu
me
(µm
3/m
L)
Site 1 Site 2 Site 4
Figure 5: 2003 Total cellular biovolume for Lake Thunderbird main body sites. Comparison between 2001, 2002, and 2003 showed algae levels in 2003 between that of 2001 and 2002 (Figure 6), reinforcing the cell density results. While the median of 2003 is similar to 2002 the 50% quartile in 2003 extends much further than in 2002. The range for 2003 was also much greater than in 2002.

LAKE THUNDERBIRD ALGAE STUDY FINAL REPORT
12
10,000
100,000
1,000,000
10,000,000
100,000,000
Biov
olum
e (µ
m3 /m
L)
2001 2002 2003
Figure 6: Statistical comparison of total cell biovolume from 2001 to 2003 Lake Thunderbird open water sites.
Similarities in the algal assemblages between the three sampled years include contribution from various divisions at the beginning of the season followed by the dominance of blue-green algae from the middle to the end of the season. In 2001, Diatoms and dinoflagellates (Pyrrhophyta) were the most obvious dominants in the beginning of the sampling season. In 2002 and 2003, Bacillariophyceae and cryptophytes were dominant at the beginning of the sampling season. At the community level, 2003 was similar to 2002 and 2001 with a large dinoflagellate peak in mid June or mid July (Figure 7). The pattern of steady peaks and valleys throughout the sampling season from 2002 was not as evident in 2003. In 2003, the blue-greens, dominated by Anabaena flos-aquae, peaked in mid May. From there the larger blue-greens thinned out while the cryptophyte, Rhodomonas minuta, dominated the next sample event. By June 12, 2004 the Pyrrhophyte, Ceratium hirundinella, had become dominant and blue-greens were relatively sparse. The next sample, June 24, 2003 showed the relatively large blue-green algae, Cylindrospermopsis raciborskii, to have become dominant. It dominated the algae community throughout the rest of the sampling season until the final sample event. By this time the Anabaena species had replaced Cylindrospermopsis as the primary blue-green algae while cryptophytes and diatoms had increased in abundance. The extension of the sampling season in October was crucial to capture the decrease in blue-greens in the fall.

LAKE THUNDERBIRD ALGAE STUDY FINAL REPORT
13
0%10%20%30%40%50%60%70%80%90%
100%
5/1/03 6/1/03 7/1/03 8/1/03 9/1/03 10/1/03
% o
f Tot
al C
ell B
iovo
lum
e
Misc. Cyanophyta Chlorophyta Pyrrhophyta CryptophytaBacillariophyceae Chrysophyta Euglenophyta Haptophyta
Figure 7: 2003 cell biovolume percent of total segregated by taxa for Lake Thunderbird
main body sites.
Taste and Odor Potential Blue-green algae have often been recognized as a nuisance in the drinking waster industry because of the ability of several taxa to produce earthy and musty smelling compounds. Earthy and musty smells produced by algae are commonly called taste and odor compounds. Geosmin and 2-methyl isoborneol (MIB) are common T&O compounds that produce musty smells. Aphanizomenon, Microcystis, Oscillatoria, and Anabaena are known geosmin producers (Perrson, 1983) and were found in Lake Thunderbird. Lyngbya limnetica, another cyanophyte in the lake, has also been known to cause a musty smell in large quantities. Ceratium hirundinella, a dinoflagellate found all three years in Lake Thunderbird, is known to produce a fishy smell and bitter taste. The biovolume of the potential taste and odor chemical producers can serve as indicators of algae contribution to customer complaints regarding finished drinking water. Taste and odor chemicals may be produced by algae throughout their life history. The key to taste and odor events is when these chemicals are released into the water column. The most common event for release of these chemicals is algae cell death. Algae reproduction is a process of cellular division. This means than unlike some organisms, when an algae cell reproduces, cell death does not necessarily follow. Given unlimited resources: light, nitrogen, and phosphorus; algae species growth will double in a logarithmic manner. When resources become limited, cell reproduction slows to a stationary phase which is soon followed by cell death (Fogg, 1965). Cell death is marked in the data by a decline of cell density and cell biovolume for a given species. Many algae cells actively manage buoyancy by swimming, as the Crytophytes and Pyrrophytes do, or the accumulation of (lighter than water) storage products, such as the oil produced by some diatoms or by the production of gas vesicles such as those
LAKE THUNDERBIRD ALGAE STUDY FINAL REPORT
14
produced by the blue-green algae Oscillatoria, Anabaena, Aphanizomenon, Microcystis, and Cylindrospermopsis species. Buoyancy is lost upon cell death. Cells with relatively soft cell walls will soon release their cellular contents into the water column. Algae species with harder cell walls, usually those with some sort of plate structure, such as the Euglenoids and Pyrrophytes, or frustrules, such as the diatoms, will sink prior to releasing their cell contents. These types of algae are likely to release their contents into the metalimnion and hypolimnion of Lake Thunderbird. Because different algae species may differentially release their cell contents, some taste and odor chemicals may not reach municipal treatment plants until metalimnetic and hypolimnetic waters are mixed in the fall (Lewis, 1997). Ceratium hirundinella is the most likely taste and odor producing algae species to release a proportion of its cell contents below the epilimnion. Should Cylindrospermopsis produce taste and odor chemicals it is likely that these would also be released below the epilimnion. This report focuses discussion on site 4 only because of its proximity to the COMCD raw water supply pump station. It is important to note that proximity does not preclude water from other areas of the lake influencing water quality. Strong winds and inflow events can rapidly move algae from one section of Thunderbird to another and punctuate raw water supply between the routine biweekly sample events. Since last year a search of literature has shown the number of known potential taste and odor producing algae species to have increased. This increase of knowledge has required us to revise the previous year’s reporting. It is important to note that the data set of generated algae from 2001 and 2002 has not changed; a broader interpretation has just been made based on more up-to-date information. In 2001, the total biovolume of algae genera known to produce taste and odor chemicals at site 4 (near the water supply point of diversion) indicate the potential for T&O reports from June through September (Figure 8). Ten species of algae were identified and distributed in six genera of potential T&O producers. In 2002, reports of T&O algae at site 4 showed a different distribution of species and amount over time but indicate the potential for T&O reports from May through September (Figure 9). Eight species of algae were identified and distributed in five genera of potential T&O producers. In 2003, reports of T&O algae showed the presence of the same five genera found in the 2002 season indicating the potential for T&O reports from May through October (Figure 10).

LAKE THUNDERBIRD ALGAE STUDY FINAL REPORT
15
1
10
100
1,000
10,000
100,000
1,000,000
10,000,000
100,000,000
1,000,000,000
4/15/01 5/15/01 6/14/01 7/14/01 8/13/01 9/12/01 10/12/01
Bio
volu
me
(µm
3/m
L)
Anabaena sp. Aphanizomenon speciesLyngbya species Microcystis aeruginosa-colony formMicrocystis aeruginosa-single cells Oscillatoria speciesCeratium hirundinella
Figure 8: 2001 Biovolume of taste and odor algae producing at Site 4.
1
10
100
1,000
10,000
100,000
1,000,000
10,000,000
100,000,000
1,000,000,000
4/15/02 5/15/02 6/14/02 7/14/02 8/13/02 9/12/02 10/12/02
Bio
volu
me
(µm
3/m
L)
Anabaena sp. Aphanizomenon species Lyngbya species
Oscillatoria species Ceratium hirundinella
Figure 9: 2002 Biovolume of taste and odor producing algae at Site 4.

LAKE THUNDERBIRD ALGAE STUDY FINAL REPORT
16
1
10
100
1,000
10,000
100,000
1,000,000
10,000,000
100,000,000
1,000,000,000
4/15/03 5/15/03 6/14/03 7/14/03 8/13/03 9/12/03 10/12/03
Bio
volu
me
(µm
3/m
L)
Anabaena sp. Aphanizomenon species Lyngbya species
Oscillatoria species Ceratium hirundinella
Figure 10: 2003 Biovolume of taste and odor producing algae at Site 4.
In 2003, the number of T&O species identified increased to nine, seven of which were also identified in 2002 (Table 2). The major difference between the years is the identification of two new species, Anabaena bergeii v. limnetica and Anabaena spiroides. An important fact to note is that Aphanizomenon only occurred once during the sampling season on July 9, 2003. Another difference was that Oscillatoria limnetica was only present from May through July, unlike 2002 where it persisted through the entire season.
Table 2: Potential taste and odor producing algae species identified from Lake Thunderbird samples.
Species Division 2001 2002 2003 Anabaena flos-aquae Cyanophyta X X X Anabaena bergeii v. limnetica Cyanophyta X Anabaena circinalis Cyanophyta X Anabaena oscillariodes Cyanophyta X X Anabaena spiroides Cyanophyta X Aphanizomenon flos-aquae Cyanophyta X Aphanizomenon issatschenkoi Cyanophyta X X X Planktolyngbya contorta (Lyngbya lagerheimii f. minor) Cyanophyta X X X Planktolyngbya subtilis (Lyngbya limnetica) Cyanophyta X X X Microcystis aeruginosa Cyanophyta X Oscillatoria limnetica Cyanophyta X X X Oscillatoria rubescens Cyanophyta X X Ceratium hirundinella Pyrrophyta X X X
LAKE THUNDERBIRD ALGAE STUDY FINAL REPORT
17
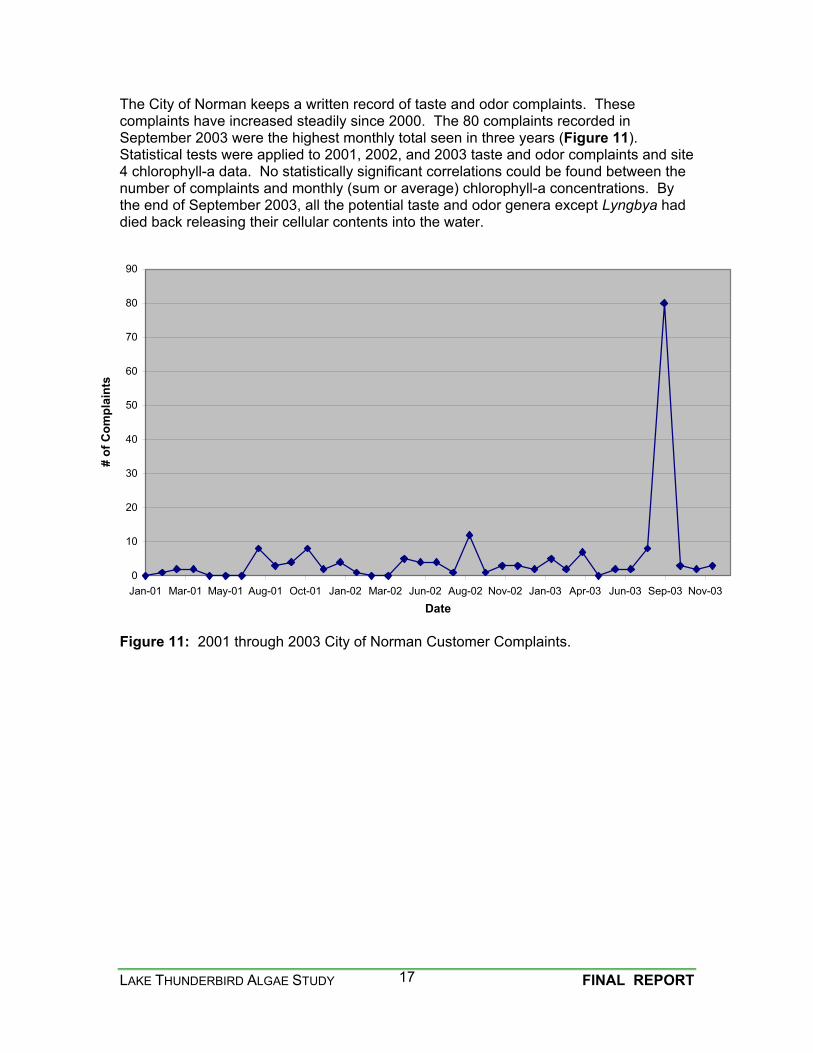
The City of Norman keeps a written record of taste and odor complaints. These complaints have increased steadily since 2000. The 80 complaints recorded in September 2003 were the highest monthly total seen in three years (Figure 11). Statistical tests were applied to 2001, 2002, and 2003 taste and odor complaints and site 4 chlorophyll-a data. No statistically significant correlations could be found between the number of complaints and monthly (sum or average) chlorophyll-a concentrations. By the end of September 2003, all the potential taste and odor genera except Lyngbya had died back releasing their cellular contents into the water.
0
10
20
30
40
50
60
70
80
90
Jan-01 Mar-01 May-01 Aug-01 Oct-01 Jan-02 Mar-02 Jun-02 Aug-02 Nov-02 Jan-03 Apr-03 Jun-03 Sep-03 Nov-03
Date
# of
Com
plai
nts
Figure 11: 2001 through 2003 City of Norman Customer Complaints.

LAKE THUNDERBIRD ALGAE STUDY FINAL REPORT
18
Toxin Potential Unfortunately many algae with the potential to produce taste and odor chemicals also have the potential to produce toxic chemicals. Blue-green algae are the taxa with the most species documented to produce toxic compounds (Carmicheal, 1985). The World Health Organization (2003) identifies twelve taxa capable of producing toxins (Table 3). Toxin production occurs while the cell is alive and growing in the water column with some loss while still living. However, acute levels of algae-produced toxins in the water column are mostly associated with the release of cellular contents into the water column when the cells die. Many of these potential toxin-producing algae are associated with eutrophic (nutrient enriched) water quality conditions. Most toxic effects are noted when a particular species is present as a surface scum, indicative of hypereutrophic conditions. Of these various classes of toxins the microcystins and cylindrospermopsin pose the greatest risk due to the potential to cause permanent tissue damage (Chorus, et. al., 2000). Anatoxins and saxitoxins pose less risk with the documentation of complete recovery with no chronic effects from sub-lethal exposure levels (Edwards, 1999). Cylindrospermopsin poses less of a recreation risk because the genus most known for producing cylindrospermopsin, Cylindrospermopsis, is not known to form surface scum. From a recreational perspective, the microcystins are considered the greatest risk to the human population while cylindrospermopsin is considered to pose the greatest risk to water supply (Chorus et. al., 2000). The Toxicological Summary for cylindrospermopsin clearly states that relatively low concentrations of chlorine (in excess of the amount that will react with organic matter) will decompose cylindrospermopsin (Carson, 2000).
Table 3: List of blue-green algae capable of producing toxins. Adapted from World Health Organization (2003).
Cyanotoxins Taxa known to produce the toxin Microcystis Planktothrix Oscillatoria Nostoc Anabaena Anabaenopsis
Microcystins
Hapalosiphon Nodularin Nodularia spumigena
Anabaena Aphanizomenon Anatoxin-a Oscillatoria Cylindrospermopsis Anabaena Aphanizomenon Saxitoxins Lyngbya Cylindrospermopsis
Cylindrospermopsin (Cytotoxin) Cylindrospermopsis Aphanizomenon
Between 2001 and 2003, a minimum of five and a maximum of seven taxa have been identified in Lake Thunderbird during a single monitoring season. Table 4 provides a list of species identified in the three years of sampling. Six species within five taxa were identified in all three years. No scum formation was noted in any year the OWRB monitored Lake Thunderbird water quality.

LAKE THUNDERBIRD ALGAE STUDY FINAL REPORT
19
Table 4: Potential toxin-producing species identified in Lake Thunderbird.
Species Division 2001 2002 2003Anabaena aphanizomenoides Cyanophyta X Anabaena bergeii v. limnetica Cyanophyta X Anabaena circinalis Cyanophyta X Anabaena flos-aquae Cyanophyta X X X Anabaena oscillariodes Cyanophyta X X Anabaena spiroides Cyanophyta X Anabaenopsis circularis Cyanophyta X Anabaenopsis elenkinii** Cyanophyta X Aphanizomenon flos-aquae Cyanophyta X Aphanizomenon issatschenkoi Cyanophyta X X X Cylindrospermopsis raciborskii Cyanophyta X X X Planktolyngbya contorta (Lyngbya lagerheimii f. minor) Cyanophyta X X X Planktolyngbya subtilis (Lyngbya limnetica) Cyanophyta X X X Microcystis aeruginosa Cyanophyta X Oscillatoria limnetica Cyanophyta X X X Oscillatoria rubescens Cyanophyta X X
The 2003 guidelines developed by the World Health Organization (Table 5) assessing relative risk of these toxic chemicals to recreational exposure have been compared against actual levels measured in Lake Thunderbird. Of these taxa identified two classes of toxin, microcystin and cylindrospermopsin are the most notable. Microcystis aeruginosa was noted in the 2001 but not in 2002 or 2003. This algae has the potential to produce a variety of hepatotoxins with one acute toxic event recorded in Oklahoma (Nishiwaki-Matsushima, et. al, 1992). The case for Cylindrospermopsis production of the toxin, cylindrospermopsin, is less clear. Recent research indicates toxin production may be concentrated in tropical and subtropical populations with little to no toxicity expressed in temperate zone populations of Cylindrospermopsis. The COMCD directed the OWRB to proceed with toxin analysis for algae-produced toxins in 2003 should relatively high levels of potential toxin producers be identified. The OWRB contracted with Wayne Carmichael of Wright State University, an internationally recognized expert in algae toxins to provide analysis. On October 8, 2003, three samples were shipped to Wright State for analysis. These samples were freeze-dried, extracted, and analyzed using liquid chromatography/mass spectrometer methods. All samples were below detection limit. This one-time sample event seems to corroborate low to no toxin production by Cylindrospermopsis in more temperate areas. Table 5: Assessment of recreation-based human risk to blue-green algae produced
toxins. Adapted from World Health Organization (2003).
Risk Level Cell density Magnitude of Potential Health Effects
Low 20,000 Short-Term
Moderate 100,000 Short-term and long-term
High Up to millions (Scum formation) Poisoning to short-term
LAKE THUNDERBIRD ALGAE STUDY FINAL REPORT
20
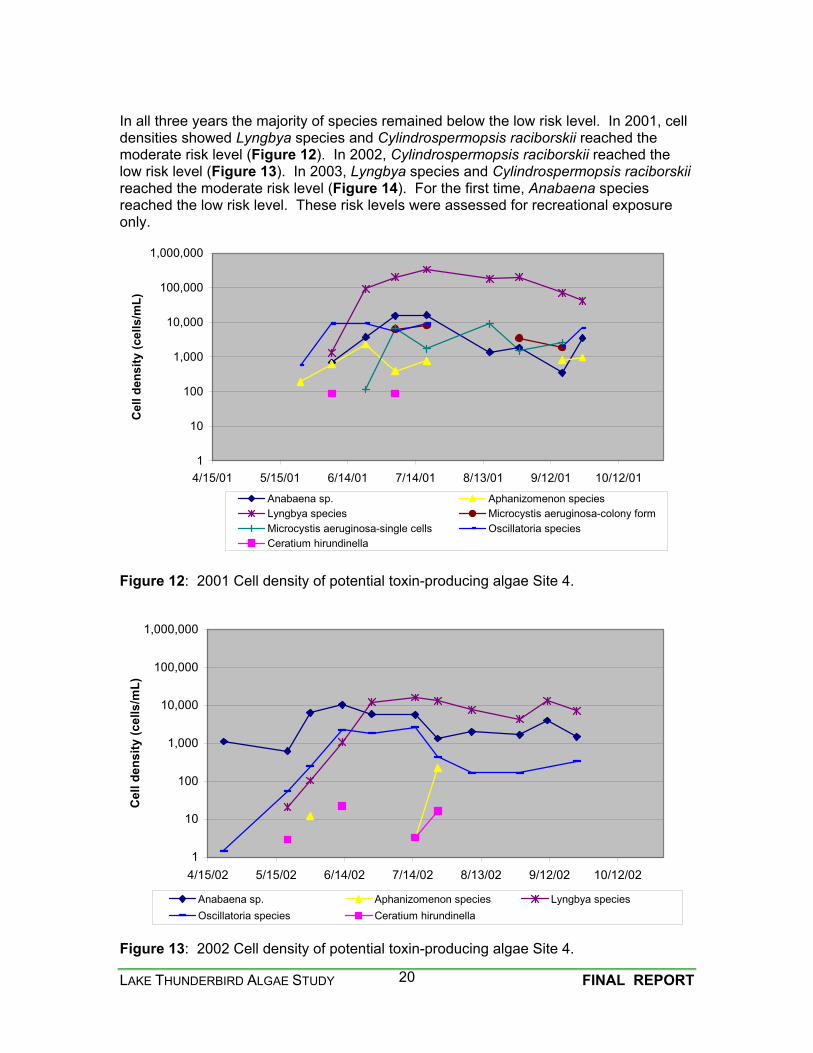
In all three years the majority of species remained below the low risk level. In 2001, cell densities showed Lyngbya species and Cylindrospermopsis raciborskii reached the moderate risk level (Figure 12). In 2002, Cylindrospermopsis raciborskii reached the low risk level (Figure 13). In 2003, Lyngbya species and Cylindrospermopsis raciborskii reached the moderate risk level (Figure 14). For the first time, Anabaena species reached the low risk level. These risk levels were assessed for recreational exposure only.
1
10
100
1,000
10,000
100,000
1,000,000
4/15/01 5/15/01 6/14/01 7/14/01 8/13/01 9/12/01 10/12/01
Cel
l den
sity
(cel
ls/m
L)
Anabaena sp. Aphanizomenon speciesLyngbya species Microcystis aeruginosa-colony formMicrocystis aeruginosa-single cells Oscillatoria speciesCeratium hirundinella
Figure 12: 2001 Cell density of potential toxin-producing algae Site 4.
1
10
100
1,000
10,000
100,000
1,000,000
4/15/02 5/15/02 6/14/02 7/14/02 8/13/02 9/12/02 10/12/02
Cel
l den
sity
(cel
ls/m
L)
Anabaena sp. Aphanizomenon species Lyngbya speciesOscillatoria species Ceratium hirundinella
Figure 13: 2002 Cell density of potential toxin-producing algae Site 4.

LAKE THUNDERBIRD ALGAE STUDY FINAL REPORT
21
1
10
100
1,000
10,000
100,000
1,000,000
4/15/03 5/15/03 6/14/03 7/14/03 8/13/03 9/12/03 10/12/03
Cel
l den
sity
(cel
ls/m
L)
Anabaena sp. Aphanizomenon species Lyngbya species
Oscillatoria species Ceratium hirundinella
Figure 14: 2003 Cell density of potential toxin producing algae Site 4.
Summary Deoxygenation of the hypolimnion during the summer months (OWRB, 2003), total algal abundance over 15,000 cells/mL threshold, high numbers of taste and odor, and the presence of potential toxin-producing blue-green algae all suggest a eutrophic to hypereutrophic classification for Lake Thunderbird (Raschke, 1993). More detailed algae sampling such as interval depth sampling may be beneficial to determine the dominant species at various depths in Lake Thunderbird. Nutrient sampling once per month may give more precise information rather than the previous method that only required three nutrient sample events based on stratification. From the available data, it seems clear Lake Thunderbird contains potential toxin and taste and odor producing species of algae. Some of these algae species are capable of becoming nuisance blooms. Most of the potential bloom-forming species have been identified in small quantities at Lake Thunderbird and should not raise great concern. The presence of taste and odor producers is not indicative of toxicity. However, hasty action taken to reduce taste and odor may inadvertently aid toxin production because many taste and odor producing species also release toxins, generally upon cell death. Preliminary testing for algae toxins did not suggest an immediate concern for Lake Thunderbird water quality. However, annual toxicity testing of raw water (preferably at site four and in finished water) is recommended to track yearly toxin production in the lake. Toxicity tests should begin when cell counts are over 20,000 cells/mL. A trend was noted between the nutrient levels and nuisance algae: the years with higher nutrient content had more taxa and species of nuisance algae. This was true whether potential for taste and odor production or potential for toxin production was examined. These suggest maintenance of lower nutrient levels in Lake Thunderbird will minimize risk from nuisance algae.

LAKE THUNDERBIRD ALGAE STUDY FINAL REPORT
22
Recommendations Increase toxicity testing. Additional testing would assure that the risk from algae toxins is minimal. Investigate means to reduce nutrients in Lake Thunderbird. Current data suggests lower summer phosphorus levels will reduce the number of taxa and species of problem algae.

LAKE THUNDERBIRD ALGAE STUDY FINAL REPORT
23
References Carmichael, W.W., Jones, C. L. A., Mahmood, N. A., Theiss, W. C. (1985). Algal Toxins and Water-Based Diseases. Critical Reviews in Environmental Control 15, 275-313. Carson, Bonnie (2000). Toxicological Summary for Cylindrospermopsin. North Carolina: National Institute of Environmental Health Services. Chorus, Ingrid, Falconer, I.R., Salas, H.J., and Bartram, J. (2000). Health Risks Caused by Freshwater Cyanobacteria in Recreational Waters. Journal of Toxicology and environmental Health, Part B, 3:323 – 347. Edwards, Neil. (1999). Anatoxin also known as Very Fast Death Factor. Retrieved Jan. 15, 2004, from the Molecule of the Month, the Chemical Laboratories at the University of Sussex at Brighton Website: http://www.chm.bris.ac.uk/motm/antx/antxh.htm. Fogg, G.E., (1965). Algae Cultures and Phytoplankton Ecology. Madison, WI: University of Wisconsin Press. Hutchinson, G.E. (1967). Introduction to lake biology and the limnoplankton. A Treatise on Limnology. Il, 1115. Nishiwaki-Matsushima, R., Ohta, T., Nishiwaki, S., Suganuma, M., Koyama, K., Ishikawa, T., Carmichael, W. W. and Fujiki, H. (1992). Liver tumor promotion by the cyanobacterial cyclic peptide toxin microcystin-LR. Journal of Cancer Research and Clinical Oncology 118, 420-424. Oklahoma Water Resources Board (OWRB). (2003). Lake Thunderbird Water Quality 2003 for the Central Oklahoma Master Conservancy District. Perrson, P. E. (1983). Off-flavors in aquatic ecosystems – An Introduction. Water Science Technology 15, pp 1-11. Raschke, R. (1993). Guidelines for assessing and predicting eutrophication status of small southeastern piedmont impoundments. EPA-Region IV. Environmental Services Division, Ecological Support Branch. Athens, GA. Sze, Philip. (1986). A biology of the algae. Dubuque, Iowa: Wm. C. Brown Publishers. Lweis, M. A., and W. Wang. (1997). Water Quality and Aquatic Plants. In Wang, W., Gorsuch, J.W. and Hughes, J.S. Plants for Environmental Studies. New York: Lewis Publishers. pp. 141-175. Wehr, John D., and Sheath, Robert G. (2003). Freshwater Algae of North America. San Diego, CA: Academic Press. World Health Organization (WHO). (2003). Guidelines for Safe Recreational Water Environments. Volume 1: Coastal and Fresh Waters. Geneva: World Health Organization.