Sole Proprietorship Partnership Corporations. Forms of Ownership Comparison.
1
Ownership and Control in Colombian Corporations
LUIS H. GUTIEREZ* [email protected] Universidad del Rosario
CARLOS POMBO1
[email protected] Universidad del Rosario
RODRIGO TABORDA** [email protected] Universidad del Rosario
Abstract We study the separation of ownership and control for an average of 140 listed non-financial Corporations in Colombia during the 1996-2002 period. Breaking the sample according to their listing status and economic activity, voting rights are greater than cash flow rights because of the presence of indirect ownership across firms that belong mainly to pyramidal and cross share holdings. The study sample also includes an important set of non-affiliated firms. Ownership statistics show high concentration for the top-four largest voting blocks similar to the levels observed in continental Europe, although the largest stake has on average 20% lower voting rights than the average observed in that region. Finally, holding investment and trust funds play a central role as the holdings’ ultimate controllers. JEL Classification: G32, L22 Keywords: Ownership, Control, Colombian Corporations
1 Corresponding author: Carlos Pombo, Associate Professor and Director of the Masters Program in Economics, Department of Economics, Universidad del Rosario; Email: [email protected]; We want to thank the following persons and institutions that without their collaboration it would have been impossible to undertake this research: Dr. Clemente del Valle (Superintendent of Securities); Dr. Rodolfo Laines (Superintendent for Commercial Societies), Dr. Alberto Florez (Delegate Superintendent for Equity Issuers) and Esperanza Sanabria (Statistic Office at the Superintendence of Commercial Societes). Roberto Fortich provided research assistance. Financial support for the IADB Research Network is gratefully acknowledged. * Associate Professor Department of Economics, Universidad del Rosario. ** Assistant professor Department of Economics Universidad del Rosario and PhD student Australian National University

2
Resumen Esta investigación analiza la separación entre propiedad y control para un promedio de 140 empresas no financieras en Colombia inscritas en Bolsa de Valores para el período 1996-2002. Dividiendo la muestra de acuerdo con su estatus de inscripción y por actividad económica, los derechos de votación son mayores a los derechos de flujo de caja debido a la presencia de propiedad indirecta a través de las firmas que pertenecen a grupos económicos con estructuras piramidales o de propiedad cruzada. La muestra de estudio incluye un conjunto importante de empresas no afiliadas. Las estadísticas de propiedad muestran una alta concentración para los cuatro primeros bloques de votación similar a los niveles observados en Europa continental, aunque el primer bloque es un 20% menor a lo observado en esta región. Finalmente, las sociedades de inversión y contratos de fidecomiso tienen un papel central como accionistas controlantes en las empresas y en de los conglomerados.
3
1. Introduction The modern literature of corporate structure has stressed the agency problem where ownership
is dispersed and shareholders have a passive role. Executive directors have a strong
independence and cross incentives through bonus shares payments. This implies that they have
incentives to disclose information when a company’s investments succeeded but they also hide
information when there are significant losses. This figure usually applies to big American
corporations and British publicly traded firms where legislation forbids individual stakes
greater than 25%.
Studies published during the last five years had questioning the typical Bearle and
Means (1932) corporation, providing evidence that ownership structures outside the Anglo-
Saxon world are complex due to the existence of cross-shareholdings, webs, pyramids, rings,
and other many types of structures and holdings’ webs. The most representative studies on the
issue of measuring corporate ownership and control beyond the US case since the mid 1990s
are perhaps Laporta et al (1999), Claessenss et al (2000), and Barca and Bech (2001) . The
first study covers the 20 largest publicly traded firms in each of the 21 OECD economies,
along with six non-OECD countries2. Their main finding was that the largest shareholders and
ultimate owners leverage their corporate control through pyramids and other hierarchical
business group structures.
The second study assembled data on 2,980 East Asian corporations. This study is by far
the most comprehensive regarding the measurement of cash flow to voting rights ratios. The
main finding is that voting rights exceed cash flow rights due to pyramid structures and cross
holdings. The third is composed by nine case studies of corporate ownership within
continental Europe. It includes cases in Austria, Belgium, France, Germany, Italy,
Netherlands, and Spain. The common finding across those studies is that ownership and
control are highly concentrated and differs in large scale from the UK and US patterns. In fact,
as more results became available from new country studies, they tend to confirm that widely
held corporate structures are outlier structures and are found mainly in the UK and the US.
Such pattern should not differ within Latin American publicly traded corporations. The largest
2 They are: Argentina, Israel, Hong Kong, South Korea, Mexico, and Singapore.

4
listed corporations are central pieces of complex business group structures that form several
webs, through property chains between corporations and unlisted firms, financial and non-
financial firms, core and non-core businesses, and in general different types of pure cross
shareholdings.
Business groups in Colombia also respond to complex structures. They are centered
around a core business with strategic alliances in non-core activities along with holding's
investment and fiduciary funds that play a central role as ultimate controllers as well as key
players in forming coalitions to control boards. This paper provides for the first time evidence
in measuring ownership and control for Colombian corporations following the methodologies
used in the studies of La Porta (1999) and their successors, becoming the first comprehensive
case study for one of the main emerging markets in Latin America where there is not much
published work on the topic. Besides this introduction the paper has seven additional sections.
Section 2 reviews the studies on corporate control and governance in Latin America and
Colombia. Section 3 explains the used dataset as well as the followed methodology to measure
integrated ownership as proxy of investor’s voting rights. Section 4 shows the ownership
statistics for an average sample of 141 real sector listed firms during the 1996-2002 period that
were overseen by the Superintendence of Securities. Section 5 presents the ownership
structure analysis of the three largest and oldest business groups in the country. Section 6
displays the core results regarding the separation of corporate ownership and control. Section
7 complements the previous exercise by studying the composition of the ultimate controllers
and its variation across periods. Section 8 concludes.
2. Corporate Ownership and Governance Studies in Latin America and Colombia
The subject of Corporate Governance (CG) has generated many case country studies for
developed economies. In contrast, research for developing economies is limited and new. By
mid-2003 there were few published papers on the topic for the case of Latin America. We can
highlight the work of Agosin and Pastén (2003) who present a description of CG in Chile
during the 90s. They analyze CG as an insider system where business groups control publicly
traded companies. Taking a sample of 177 listed companies, they found i) a high degree of
corporate concentration, a problem that is evident in all economic sectors, and ii) the
5
debt/equity ratios are low when compared to those of Korea, The last result is puzzling since
insider systems make use of debt instead of equity to finance their projects to protect their
ownership and control structures. The explanation is due to the apparent underdevelopment of
the Chilean capital market and the interlinked debt process of Chilean firms. They also
analyze how the creation of institutional investors, like pension funds have impacted the
domestic capital markets. The authors conclude that poor governance by corporate companies
has rendered the market without liquidity and has impaired a full development of Chilean
capital markets. Escobar et al. (2000) present a complete overview of the new legal mandate
on CG in Chile, Law 19.705 enacted in 2000.
Apreda (2000) reviews CG in Argentina before 1990 and provides an account of the
legal frame adopted in the 90s to implement good governance principles in corporate
companies. As in the Chilean case, it is clear that the development of CG was induced by the
privatization of SOEs and firm mergers. These events framed the evolution of CG in
Argentina moving from family-owned companies to corporate companies driven by foreign
and institutional investors, which have contributed to streamlining the governance system as in
common law countries.
Claessens, Klingebiel, & Lubrano (2000) study the Brazilian case. These authors found
also poor governance in Brazilian corporations despite the existence of a Code of Best
Practice issued by the Brazilian Institute of CG. One reason is the prevalence of non-voting
shares in corporations, and the lack of good measures to protect minority investor rights. All in
all stock concentration remains very high in Brazil.
Neto (2000) provides an analysis of the legal aspects of CG in Brazil regarding specific
topics. The paper follows a questions-answers format about developments on domestic CG
issues. Saito (2000) reviews the CG legislation in Brazil focusing on the legal determinants of
share composition with voting and non-voting powers, and the degree of protection provided
to outside investors. The paper tests three hypotheses. The first one tries to see how the ratio
of non-voting equity to total equity correlates with the voting premium, the second test how
the price differential between voting and non-voting stocks behaves with leverage, and the
third one tries to see the impact of the 1997 corporate law on ordinary and preferred marginal
shareholders.
6
Last, Chong et al. (2003) have also studied how (to have good) CG affects the volatility
of private capital flows and to what extent CG can limit the volatility of FDI flows to Latin
American countries. Taking some measures (simple and interacted) of CG like the ones
proposed by La Porta et al. (1999), i.e., investor protection (shareholder and creditor rights),
they found that "Effective credit rights and effective shareholder rights play a significant role
in limiting how portfolio flows respond to external nominal shocks"(page 19). Therefore,
countrywide developments in CG become a key element to avoid disruptive and negative
volatility in FDI flows to the country.
Regarding Colombia there are no studies either on corporate governance or corporate
ownership and control that follow the modern approach of ultimate controller analysis in
representative studies such as Laporta et al (1999), Claessenss et al (2000), and Barca and
Bech (2001) above mentioned. Nonetheless, there are related studies in the field of capital
market development. Such studies trace back to 1994 when the Finance Ministry [Ministerio
de Hacienda y Crédito Público (MHC)] sponsored a series of studies on capital markets
known as the Misión de Estudios sobre el Mercado de Capitales. The collective work had the
purpose of advising and making policy recommendations to MHC in subjects regarding the
Colombian capital markets, such us obstacles to their development, the reforms that should be
made to the institutional frame, and the steps needed to develop tools of coverage. The final
report3 summarizes the main findings on seven topics: the capital markets in Colombia, the
relationship between the capital markets and the macroeconomic environment, recent trends
and some perspectives in the supply and demand of financial assets, new products as
securisation and leasing, hedging instruments and over-the-counter markets, and capital
market regulatory policies.
The subject of CG is relatively new. It is, then, not surprising that despite the Cadbury
report (p. 11), 'The financial aspect of CG", had come to the light in December, 1992, and had
for the first time stated “The country’s economy depends on the drive and efficiency of its
companies. Thus the effectiveness with which their boards discharge their responsibilities
determines British competitive position. They must be free to drive their companies forward
but exercise that freedom within a framework of effective accountability. This is the essence of
3 Ministerio de Hacienda, Banco Mundial, y Fedesarrollo, “Misión de Estudios del Mercado de Capitales” Informe Final, mayo 1996.

7
any good corporate governance”, the Mission’s final report did not address the CG issue as
constraint for development of the capital market in Colombia. The Mission's report did not
mention even once the words of gobierno corporativo, gobernabilidad corporativa, or
gobierno societario, three terms synonymous with CG. The few elements that the report
stressed on the subject were some problems that foreign investors listed in a survey conducted
in 1995. The more relevant ones were that in Colombia there was: i) lack of liquidity, ii) high
stock ownership concentration, iii) insufficient information and iv) lack of transparency in
Colombia's capital market. Quoting the report, “All in all, the Colombian market was rated
among the three least attractive in Latin America, and among the five least attractive among
the emerging markets”. Thus, the mission report was addressing the CG issue without propose
it.
The same happened with a recent study about the evolution and behavior of capital
markets in Colombia during the nineties [Arbeláez, Zuluaga, & Guerra (2002)], where the
subject and importance of CG were limited to a single footnote, ignoring the agency theory
and empirical evidence that the literature on financial economics has been stressing during the
last 20 years. However, the study did mention some concerns about regulatory and
institutional development, but the authors do not seem to give too much weight to them. In
fact, they focus their short and implicit analysis of governance on bank versus market-based
modes given their diagnostic about the development of capital markets in Colombia. But as La
Porta et al (2000a, 18) state “the classification of financial systems into bank and market
centered is neither straightforward nor particularly fruitful...(and that) ...on average,
countries with bigger stock markets also have higher ratios of private debt to gross domestic
product (GDP)” and (2000, 19) that “Investor rights work better to explain differences among
countries, and in fact are often necessary for financial intermediaries to develop.”
On the other hand, we can highlight two descriptive studies about business groups in
Colombia that give a rough idea of the nature of the domestic corporate structure. The first one
is the study by Franco and De-Lombaerde (2000) on Colombian parent firms with subsidiaries
in foreign countries. This study presents statistics about Colombian direct investment abroad
by company and industry group during the 1990s. The core analysis centers on the motives
that domestic enterprises had to undertake new foreign investments mainly in other Latin
American markets during the 1990s after the capital flows and foreign investment statute

8
reforms that were central pieces of the economic openness program of 1991. They present a
list of strategic alliances of Colombian enterprises with foreign investors looking to penetrate
markets abroad and expand their sales. One mechanism has been the establishment of new
partnerships with local or multinational firms already settled in Latin America. This has been
the case of Colombian investment in Peru and Venezuela. Their analysis required the
assembling of a complete record of firms by business activity and group affiliation.
The second one is the book of Colmenares (2004) about the history of business groups in
Colombia. This is an updated version of a previous work published in the 1970s by the same
author. This work is a narrative journalist type work with plenty of details but no technical
economic analysis. Nonetheless, it provides useful information regarding the ownership
structure of the largest business groups in the country4.
3. Data and Methodology
The data of corporate shareholders used in this study comes from two sources: i)
Superintendence of Securities [Superintendencia de Valores (SVAL)] and ii) Superintendence
for Commercial Societies [Superintendencia de Sociedades (SSOC)]. These two institutions
are responsible for inspecting and overseeing publicly traded corporations and larger unlisted
firms respectively. The SVAL ownership database comes from the National Equity Registry
Forms, which records information of a company’s top 20 shareholders. This form is
mandatory for all equity issuers that are under the oversight of the Superintendence, and must
be updated on a yearly basis. The form also records information of names of members o board
of directors, number of outstanding shares, number of preferred dividend shares and the
nominal value for each type of shares. The main point of this obligation is that each listed
company must provide detailed information on its current statutes, the management enrolment
list, the relationship of any of its employees with traders or listed companies at the stock
exchange, the composition of the company’s social capital, and company’s internal rules and
regulations.
4 The official source of parent and subsidiary companies information is at Superintence for Commercial Societies (Superintendencia de Sociedades) along with chambers of commerce. The Superintendence’s ownership dataset constitutes one of the main data sources of shareholders records used in this study as is explained in section 3.

9
We assembled shareholders records for 233 real sector companies that were listed during
the 1996-2002 period5. Having a panel dataset of ownership improves the analysis because we
can capture ownership dynamics, an element that is not included in what one usually finds in
international studies of corporate control. Companies were classified according to listing
status and economic activity. The first one shows if by the end of 2002 a particular company
was still listed or rather was de-listed and canceled its equity registry. This feature is important
from the bias selection standpoint. We are including all the successful and failing cases. The
second classifies companies according to ISIC (Rev. 2) one digit codes6. The above dataset
provides the first and in some cases second layers of a company’s direct ownership stakes.
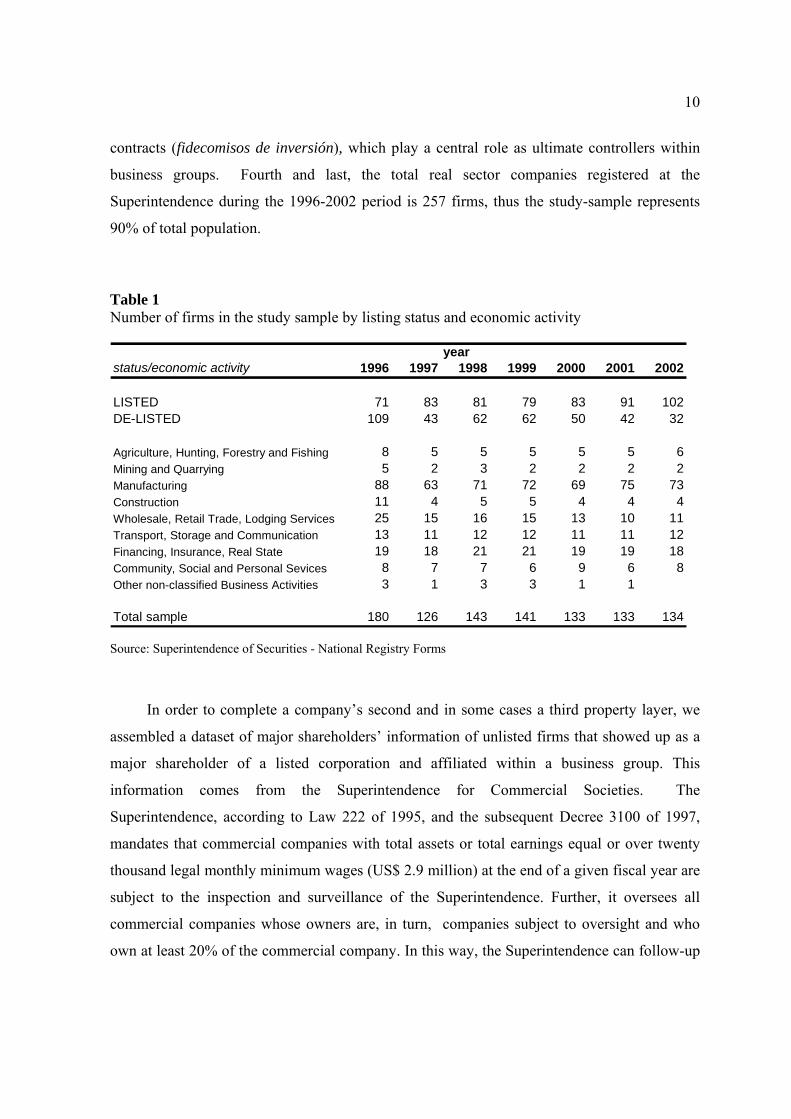
Table 1 presents the total number of companies with equity issues registered at the
Superintendence and by listing status and economic activity for the 1996-2002 period. There
are three details on the data structure worth mentioning. First, the weight of listed companies
increases during the time span passing from 39% in 1996 to 76% in 2002. One natural
question that arises is what explains the persistence of de-listed firms in the sample. The
answer is not straightforward and might be a result of several factors. On one hand, the size of
the Colombian stock market is still small relative to other emerging markets in Latin America.
In fact, the traded volume of stocks relative to fixed income securities has been less than 10%
since 1970 up to 2002. On the other hand, most of the companies overseen by the
Superintendence are usually bond issuers rather than stock issuers.
Second, the ownership dataset depends heavily on manufacturing firms, which are more
than 50% in the sample. This feature is not a coincidence, it is basically the result of the
Colombian stock exchange structure. Manufacturing firms are the oldest publicly traded firms
in the country and along commercial banks have the highest traded stocks at the exchange.
Moreover, we have manufacturing firms in the sample with more than 50 years of activity in
the stock market7. Third, most of the companies classified as financial, insurance and real
estate firms are holding investment funds (sociedades de inversión) or collective trust funds
5 We excluded all companies subject to special regulations such as public utilities, financial intermediaries, educational institutions, and livestock funds were their performance might be affected or induced by regulation and State property participation, which makes results no comparable. 6 The access to the Superintendence of Securities’ registry forms is publicly available on individual cases. Nonetheless, the access to the entire companies’ dossiers needs a special justified request. 7 For example, these are the cases of Bavaria S.A and Fabricato S.A. The first is the leading brewery in the country and one of the largest in Latin America. The second is the largest textile mill in the county and one of the symbols within Colombia’s manufacturing history.
10
contracts (fidecomisos de inversión), which play a central role as ultimate controllers within
business groups. Fourth and last, the total real sector companies registered at the
Superintendence during the 1996-2002 period is 257 firms, thus the study-sample represents
90% of total population.
Table 1 Number of firms in the study sample by listing status and economic activity
yearstatus/economic activity 1996 1997 1998 1999 2000 2001 2002
LISTED 71 83 81 79 83 91 102DE-LISTED 109 43 62 62 50 42 32
Agriculture, Hunting, Forestry and Fishing 8 5 5 5 5 5 6Mining and Quarrying 5 2 3 2 2 2 2Manufacturing 88 63 71 72 69 75 73Construction 11 4 5 5 4 4 4Wholesale, Retail Trade, Lodging Services 25 15 16 15 13 10 11Transport, Storage and Communication 13 11 12 12 11 11 12Financing, Insurance, Real State 19 18 21 21 19 19 18Community, Social and Personal Sevices 8 7 7 6 9 6 8Other non-classified Business Activities 3 1 3 3 1 1
Total sample 180 126 143 141 133 133 134 Source: Superintendence of Securities - National Registry Forms
In order to complete a company’s second and in some cases a third property layer, we
assembled a dataset of major shareholders’ information of unlisted firms that showed up as a
major shareholder of a listed corporation and affiliated within a business group. This
information comes from the Superintendence for Commercial Societies. The
Superintendence, according to Law 222 of 1995, and the subsequent Decree 3100 of 1997,
mandates that commercial companies with total assets or total earnings equal or over twenty
thousand legal monthly minimum wages (US$ 2.9 million) at the end of a given fiscal year are
subject to the inspection and surveillance of the Superintendence. Further, it oversees all
commercial companies whose owners are, in turn, companies subject to oversight and who
own at least 20% of the commercial company. In this way, the Superintendence can follow-up

11
all matrix, branch and subsidiary company. Decree 3100 also empowered it to oversee the
subsidiaries of all foreign companies.
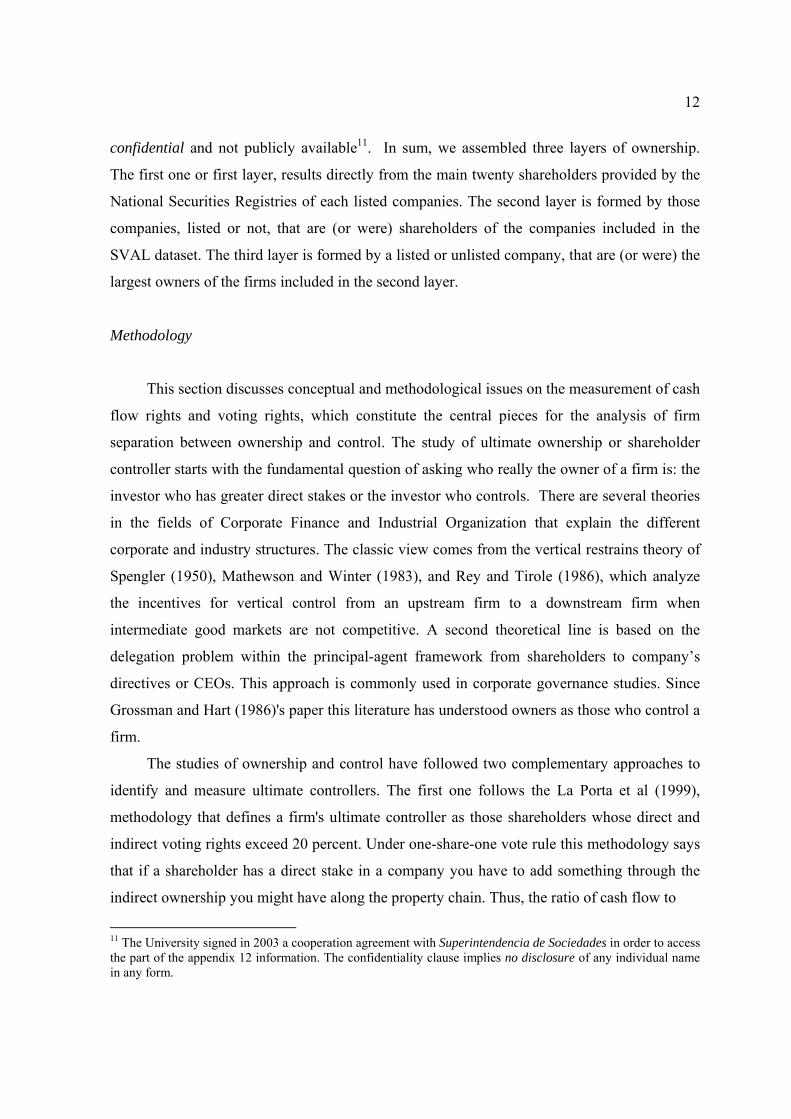
Figure 1 explains the assembling process of the entire ownership dataset. At the top of
the figure one finds the listed firms included in the analysis of ownership and control, which
are the companies with records at the Superintendence of Securities for a given year. This
group of firms is what we call the SVAL dataset. The larger shareholders can be an individual
or family, a listed firm, an unlisted firm, a non-profit organization, a holding investment or
trust fund, and other legal contractual forms allowed by law8. If the shareholder is a firm it can
be listed or unlisted. In the first case, a second layer is added from the SVAL dataset, while in
the second we complete the information with the Superintendence for Commercial Societies or
SSOC dataset. We continue such process until we complete a third layer for most listed
companies. Our SSOC dataset includes information for about 431 unlisted firms from 1996 up
to 2002.
The Superintendence requires companies to report annually their balance sheets and
income statements under a common format known as PUC9. The Superintendence registries
include 240 variables for the balance sheet and 12 variables for the income statement. The last
one is in practice a summary of the main accounts of earnings and spending flows. In addition
to the statements there is a file that reports the company's Tax ID number, legal status, and
type of legal statutes constitution such as corporate, limited liability, cooperative, and SCA
firms10.
The financial statements are complemented by 22 annexes, which record information on
the income statement notes, employment, wages and salaries, and investment in fixed assets.
The shareholders information is in appendix 12, which records on average the name of the 10
largest shareholders and their number of outstanding shares for corporations and the
partnership shares for limited liability companies. The information recorded at the annexes is
8 For instance, there are the inheritances and dead duties. 9 Plan único de cuentas. 10 SCA means “Sociedad en Comandita por Acciones”. Corporate law in Colombia follows the French system, thus SCAs are the Societes en Commandite par Actions of the French and Belgian system. These are firms with two types of partnerships: the passive ones or le commnaditaires and the active ones or le commadites. The former delegate control over the later ones and are accountable for the firm’s liabilities.
12
confidential and not publicly available11. In sum, we assembled three layers of ownership.
The first one or first layer, results directly from the main twenty shareholders provided by the
National Securities Registries of each listed companies. The second layer is formed by those
companies, listed or not, that are (or were) shareholders of the companies included in the
SVAL dataset. The third layer is formed by a listed or unlisted company, that are (or were) the
largest owners of the firms included in the second layer.
Methodology
This section discusses conceptual and methodological issues on the measurement of cash
flow rights and voting rights, which constitute the central pieces for the analysis of firm
separation between ownership and control. The study of ultimate ownership or shareholder
controller starts with the fundamental question of asking who really the owner of a firm is: the
investor who has greater direct stakes or the investor who controls. There are several theories
in the fields of Corporate Finance and Industrial Organization that explain the different
corporate and industry structures. The classic view comes from the vertical restrains theory of
Spengler (1950), Mathewson and Winter (1983), and Rey and Tirole (1986), which analyze
the incentives for vertical control from an upstream firm to a downstream firm when
intermediate good markets are not competitive. A second theoretical line is based on the
delegation problem within the principal-agent framework from shareholders to company’s
directives or CEOs. This approach is commonly used in corporate governance studies. Since
Grossman and Hart (1986)'s paper this literature has understood owners as those who control a
firm.
The studies of ownership and control have followed two complementary approaches to
identify and measure ultimate controllers. The first one follows the La Porta et al (1999),
methodology that defines a firm's ultimate controller as those shareholders whose direct and
indirect voting rights exceed 20 percent. Under one-share-one vote rule this methodology says
that if a shareholder has a direct stake in a company you have to add something through the
indirect ownership you might have along the property chain. Thus, the ratio of cash flow to
11 The University signed in 2003 a cooperation agreement with Superintendencia de Sociedades in order to access the part of the appendix 12 information. The confidentiality clause implies no disclosure of any individual name in any form.

13
Real sector listed firms in the study sample
% Net worth
Companies Families
Listed
Companies Families
Listed Unlisted
Unlisted
Top 20 stakes
Companies Families
Top 10 shareholders
FIGURE 1 - OWNERSHIP DATA STRUCTURE AND METHODOLOGY Notes: Solid line of the scheme shows full disclosure / no statistical constraint by Superintendence of Securities. Dotted line of the scheme shows no disclosure status.
...........
...........
...........
...........

14
voting rights is less or equal to 1, meaning that 1 dollar of direct investment will provide 1
times (1+x) voting rights if you have any indirect ownership.
The second one follows a portfolio view of a company’s direct investments. This
methodology uses an input-output methodology to compute integrated ownership stakes as the
sum of direct and indirect ownership. This approach has been used in several case studies in
Japan and continental Europe, where business groups structures are more complex than those
in the US and United Kingdom due to the existence of cross share holdings, rings, pyramidal
cascades, interlocks with financial institutions and high concentration levels of voting and
direct ownership stakes.
Applications are traced back to the work of Brioschi, Buzzachi, and Colombo (1989)
and Ellerman (1991) who used an input-output theory to arrange the ownership structure of
firms and derive a measure of integrated ownership. Flath (1992) took one step further
offering a way to find indirect shareholding. Then Baldone, Brioschi, and Paleari (1997),
proposed new refinements in the measurement of integrated ownership for cross share holding
groups. The studies collected in Barca and Bech (2001) of the European Corporate
Governance Network (ECGN) applied Baldone’s matrix formula to analyze corporate
structure and voting blocks in European conglomerates in seven countries. More recently,
Chapelle and Szafarz (2002) and Chapelle (2004) refine this methodology by including the
51% majority rule to exert firm control under the assumption of one share-one-vote
legislation.
This methodology defines cash flow rights as direct ownership and voting rights as
integrated ownership. Cash flow implies, under the portfolio view that an investor gets the
return of his investments through the direct stakes he owns. If a shareholder i has a 25% stake
in firm B and firm A, but company B owns 25% of firm A, then the shareholder i is entitled
to 25% of both firm A and B's earnings. If firm B increases its current profits by its
investments in firm A, shareholder i would get greater returns through firm B's dividend
payments and not through firm A. In contrast, voting rights includes the indirect ownership
dimension. In this case shareholder i exerts control over firm A. Under the one-share-one-
vote rule he has 25% from his direct investment plus 1/16 of additional votes through firm B.

15
The starting point in the methodology is the definition of a ( )N × N matrix ija⎡ ⎤⎣ ⎦A = of
direct shareholdings, where ija is the observed share of stocks of firm i in firm j . Three
properties of the elements of A in order to be used under input-output hypothesis are:
0 1ija≤ ≤ (1)
0 if ija i j= = (2)
Where
1, ,1, ,
i Nj N==K
K
and
11
N
iji
a=
≤∑ (3)
This model determines the integrated (direct + indirect) ownership on the basis that all
firms are affiliated within a business group. We followed the definition of integrated
ownership as the total value of equities recruited by a firm, which is unknown, but stems from
its direct and indirect ownership on other firms of the business group. 12 The first step in
implementing this definition is the solution for the integrated ownership matrix Y = [ ijy ]:
i ij ij iy a a y= +∑ (4)
where the first term in the right side of equation (4) represents the direct equity held by firm i
in firm j − ija , and the second one represents the indirect equity that firm i holds into firm j.
The solution for Y and its presentation in matrix notation is:
Y = A + AY or ( )-1Y = A I - A (5)
12 For more details regarding this formulation, see Ellerman, D (1991); Brioschi, Buzzachi, and Colombo (1989) and Flath, D (1992).
16
Equation (5) is useful to compute integrated ownership for hierarchical business groups. For
the case of cross-share holdings Baldone et al. (1997) defined integrated ownership as “(…)
the sum of percentage shares of total equity shareholder i holds in firm j directly, through
cross-shareholdings and indirectly.” This definition in matrix algebra is equivalent to
{ { ( )Direct Ownership Indirect Ownership
Reciprocal or cross-shareholding ownership
Y = A + YA - D Y A14243
(6)
where: ( )D Y stands for the diagonal elements of Y and I is an ( )N N× identity matrix. The
solution for Y in equation (6) is13:
( )( ) ( )-1-1 -1Y = D I - A A I - A (7)
Thus, we used the formula in (7) to estimate integrated ownership for all affiliated
firms in our sample and followed such an approach because Colombian corporate data
resembles the European group structures with high concentration in direct ownership and
voting levels. Lastly, we computed the firm’s direct ownership through concentration ratios
( )CR for the largest shareholder ( )1CR , the second largest shareholders ( )2CR , and so on as
desired. The concentration ratio at r level for a total of N individuals is given by
1
1
i r
iji
r N
iji
aCR
a
=
=
=
=∑
∑ (8)
An Example
13 Appendix 1 shows details on the solution.

17
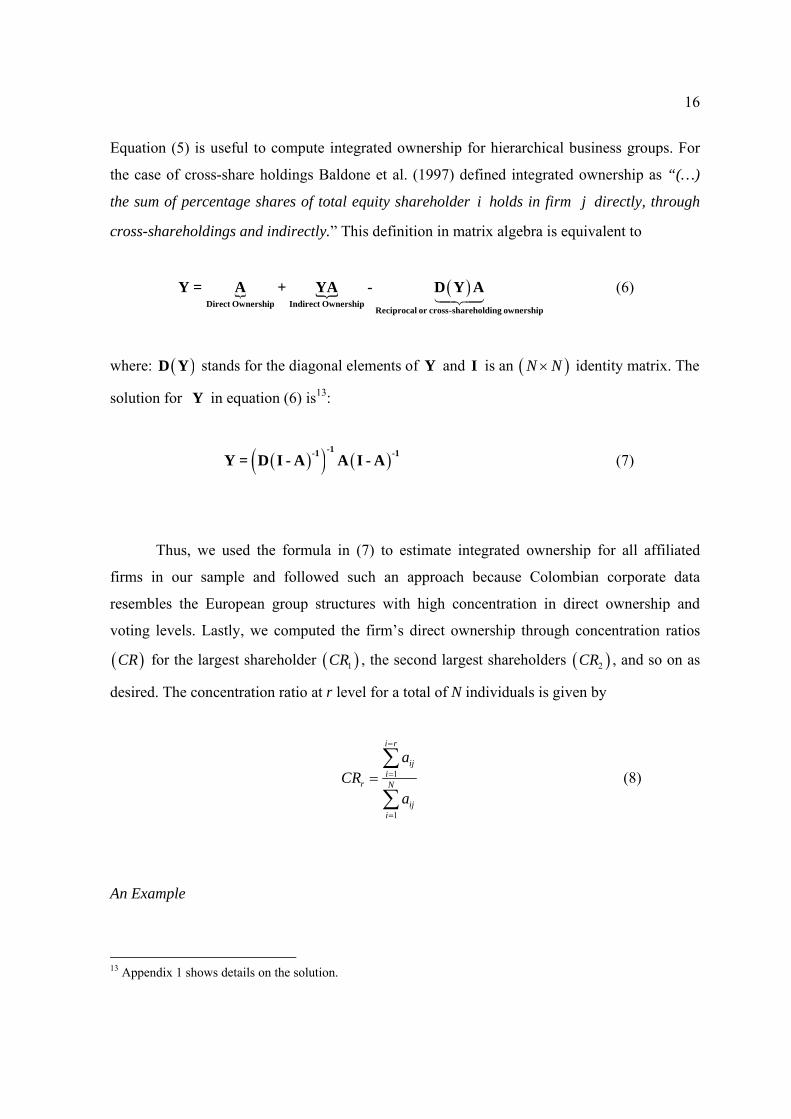
In order to gain understanding of how the matrix approach works in contrast to the manually
adding procedure in counting total voting rights (integrated ownership) of Laporta et al.
(1999), consider the inverse pyramid business group depicted in Figure 2. If one asks, who is
the ultimate controller of F5 in the sense of 20 percent we have two possible candidates: F1
and F4. The first has 41% votes in F5 and is equivalent to its direct stakes in such a firm. The
second has 40% of the votes in F5 given by its direct stakes plus 4% through firm F4, plus
1.25% from its investments in F2, who in turns owns 45% of F4, adding a total of 45.12% of
voting rights. Hence, F3 is the ultimate controller.
Figure 2 Integrated ownership - Pyramid structure group example
Now consider Table 2 that summarizes the results of Eq. (7). Matrix A is the direct
equity shares of each company within the pyramid equivalent to the percentage shares given in
Figure 2. Matrix Y is the integrated ownership matrix of the group. The reading of the results
is straightforward. Ultimate shareholder controller of F5 is F3 with 45.12%. In addition, the
table says that F3 is the ultimate controller of F4 with 51% of votes and F2 has 4.5% of voting
rights in F5 despite the fact that it does not have any direct stakes in that firm. The above
exercise tells that ultimate controllers are “in practice physical or legal persons that have no
known shareholders” [Becht, (1997)] or the last ownership layer in which information is
available, which is the case of F3 or F1 in the example. The implication is consistent and
matches with La Porta et al. (1999)'s ultimate owner definition based on the 20 percent
F3 F2 F1
F4
F5
0.45
0.25
0.40.41
0.4
0.1

18
threshold. Clearly, from the computational point of view the matrix set up is more efficient
and useful specially when there are complex property relations such as cross share holdings14.
Table 2 Pyramid Business Group Example Integrated Ownership Estimation
Matrix AF1 F2 F3 F4 F5
F1 0 0 0 0 0.41F2 0 0 0 0.45 0F3 0 0.25 0 0.40 0.40F4 0 0 0 0 0.10F5 0 0 0 0 0
sum 0 0.25 0 0.85 0.91
Matrix YF1 F2 F3 F4 F5
F1 0 0 0 0 0.410F2 0 0 0 0.450 0.045F3 0 0.250 0 0.513 0.451F4 0 0 0 0 0.100F5 0 0 0 0 0 Notes: Matrix A = direct ownership stakes, Matrix Y = integrated ownership (direct + indirect).
4. Ownership Statistics
A well known fact in Colombia is that corporate ownership and control is highly
concentrated. This fact has been tied to the formation of conglomerates and business groups
from the 1950s to late 1970s where vertical control was the incentive to control productive
chains from upstream to downstream industries. Most of them started as family businesses and
then became corporate groups with strategic investments in their core business. In fact,
business groups in Colombia are specialized and differentiated entities in which the holding 14 There is a common critique for both methodologies in the way of counting the voting rights, since might be double counting in cross share holdings, and thus integrate ownership statistics might overestimate the concentration of voting rights when the ultimate owner can not be traced fully such as a holding. An interesting refinement of this methodology is in system where there are not deviations from one share one vote rule. Applying the simple majority rule a shareholder with direct shares above 50% will exert company’s total control. For details, see Becht (1997) and Chapelle (2004).

19
control is centered-around key companies. Shareholders’ information in listed companies
improved substantially since 1995 when the Superintendence of Securities issued Resolution
400 regulates corporate governance issues for all listed companies whose stocks and securities
are publicly traded. It mandates the disclosure of up to the top 20 company’s shareholder as
well as the company’s shares in subsidiary firms as explained in the previous section.15
Corporate control concentration reduces the agency problem between stockholders and
companies’ management and might have positive effects on firm valuation, profitability and
efficiency. On the other hand, the risk of expropriation of minority shareholders increases.
This paper does not address those issues, which are analyzed and econometrically tested in
Gutierrez, Pombo and Taborda (2005b). Simply we ask if the distribution of ownership
concentration has recently changed, and by this means we provide new evidence on the
structure and patterns of equity concentration.
Table 3 summarizes the main results of the measurements of direct ownership stakes for
the total sample and listing status. There are four findings worth mentioning. First, our sample
coverage in terms of shareholders identification is high. The information recorded at the
RNVIs of the largest 20 shareholders discloses around 80% of firms’ direct sakes. That
disclosure rate increases among the currently listed corporations from a 0.74 (0.82) for the
1996-1999 period to 0.78 (0.85) mean (median) during the 2000-2002 period. Second, equity
concentration is high as expected. The largest stake has risen across the two periods. The
median increased in 7 percentage points for currently listed corporations, while for the de-
listed corporations that change was 11 percentage points. The overall effect on the total
sample mean (median) was an increase of 5 percent moving from 0.36 (0.30) to 0.41 (0.36)
between periods. Equity concentration rises substantially when one analyzes the share of the
four-largest direct stakes. In fact, the concentration rate doubles along the ownership
15 Resolution 400 has three core elements. First, all listed companies must determine the commercial and legal status of the company. Second, they have to be listed at the National Security Registry. The main point of this obligation is that each listed company must provide detailed information on its current statutes, the management enrolment list, the relationship of any of employees with traders or companies listed at the Registry, the way the social capital of the company is composed of, and the internal rules and regulations of the company. The same resolution also mandates that all stocks registered at the RNVI and not traded during two consecutive years will be cancelled by the Superintendence unless there be at least five hundred shareholders. Third, companies listed in the public stock exchange must have their records updated, and to provide audited annual information of their financial statements 30 days after being approved by the directory of the company. Additionally, each company listed at the Registry has to send quarterly information on the income statements and balance sheets 45 days after the end of each quarter although this does not need to be audited.
20
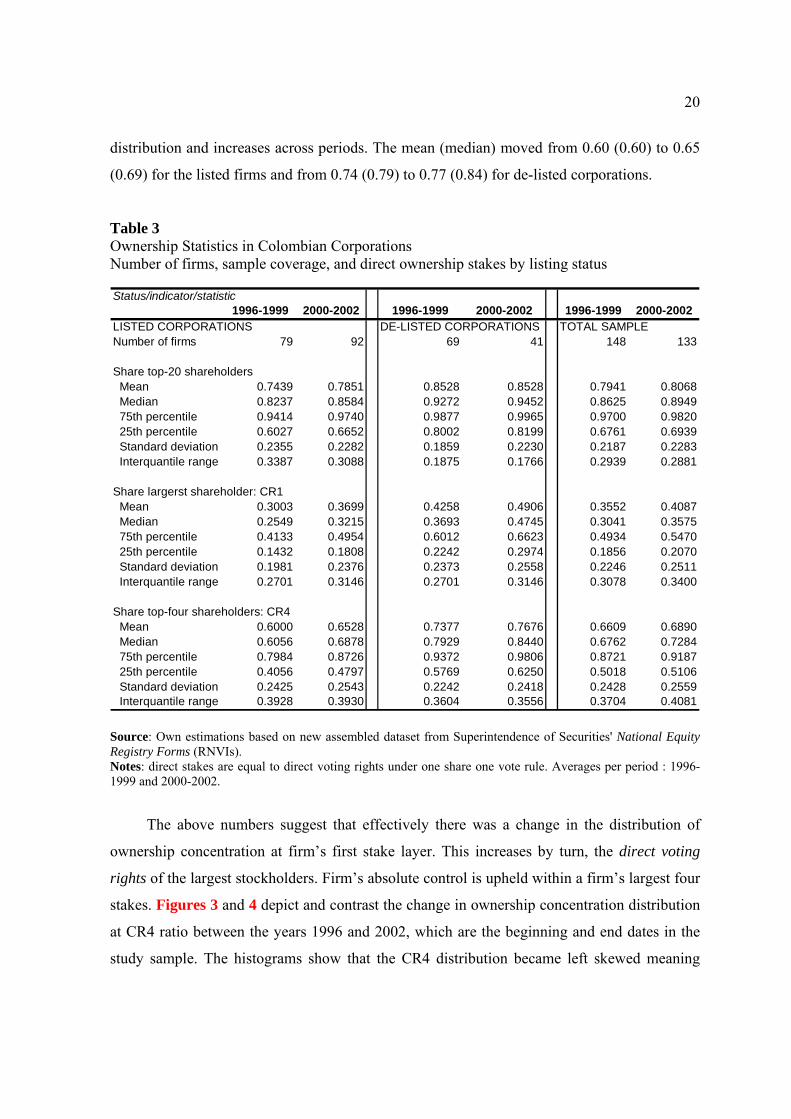
distribution and increases across periods. The mean (median) moved from 0.60 (0.60) to 0.65
(0.69) for the listed firms and from 0.74 (0.79) to 0.77 (0.84) for de-listed corporations.
Table 3 Ownership Statistics in Colombian Corporations Number of firms, sample coverage, and direct ownership stakes by listing status
Status/indicator/statistic1996-1999 2000-2002 1996-1999 2000-2002 1996-1999 2000-2002
LISTED CORPORATIONS DE-LISTED CORPORATIONS TOTAL SAMPLENumber of firms 79 92 69 41 148 133
Share top-20 shareholders Mean 0.7439 0.7851 0.8528 0.8528 0.7941 0.8068 Median 0.8237 0.8584 0.9272 0.9452 0.8625 0.8949 75th percentile 0.9414 0.9740 0.9877 0.9965 0.9700 0.9820 25th percentile 0.6027 0.6652 0.8002 0.8199 0.6761 0.6939 Standard deviation 0.2355 0.2282 0.1859 0.2230 0.2187 0.2283 Interquantile range 0.3387 0.3088 0.1875 0.1766 0.2939 0.2881
Share largerst shareholder: CR1 Mean 0.3003 0.3699 0.4258 0.4906 0.3552 0.4087 Median 0.2549 0.3215 0.3693 0.4745 0.3041 0.3575 75th percentile 0.4133 0.4954 0.6012 0.6623 0.4934 0.5470 25th percentile 0.1432 0.1808 0.2242 0.2974 0.1856 0.2070 Standard deviation 0.1981 0.2376 0.2373 0.2558 0.2246 0.2511 Interquantile range 0.2701 0.3146 0.2701 0.3146 0.3078 0.3400
Share top-four shareholders: CR4 Mean 0.6000 0.6528 0.7377 0.7676 0.6609 0.6890 Median 0.6056 0.6878 0.7929 0.8440 0.6762 0.7284 75th percentile 0.7984 0.8726 0.9372 0.9806 0.8721 0.9187 25th percentile 0.4056 0.4797 0.5769 0.6250 0.5018 0.5106 Standard deviation 0.2425 0.2543 0.2242 0.2418 0.2428 0.2559 Interquantile range 0.3928 0.3930 0.3604 0.3556 0.3704 0.4081 Source: Own estimations based on new assembled dataset from Superintendence of Securities' National Equity Registry Forms (RNVIs). Notes: direct stakes are equal to direct voting rights under one share one vote rule. Averages per period : 1996-1999 and 2000-2002.
The above numbers suggest that effectively there was a change in the distribution of
ownership concentration at firm’s first stake layer. This increases by turn, the direct voting
rights of the largest stockholders. Firm’s absolute control is upheld within a firm’s largest four
stakes. Figures 3 and 4 depict and contrast the change in ownership concentration distribution
at CR4 ratio between the years 1996 and 2002, which are the beginning and end dates in the
study sample. The histograms show that the CR4 distribution became left skewed meaning
21
higher concentration within firms. In 1996 there were two peaks in the frequency distribution
at the 0.55-0.65 and 0.9-1.0 bins. For both cases around 22% of the firms in the sample, the
four-largest shareholders had on average control of 60 and 95 percent of the direct voting
rights. This is accurate since computations only include outstanding shares, dropping all
preferred shares which have no voting rights. In addition, corporate law in Colombia
according to the Commercial Code forbids dual shares and any other kind of legal deviations
from one-share one vote rule. In 2002 the four-largest stakes had direct voting rights above
90% in 35% of the firms in the sample.
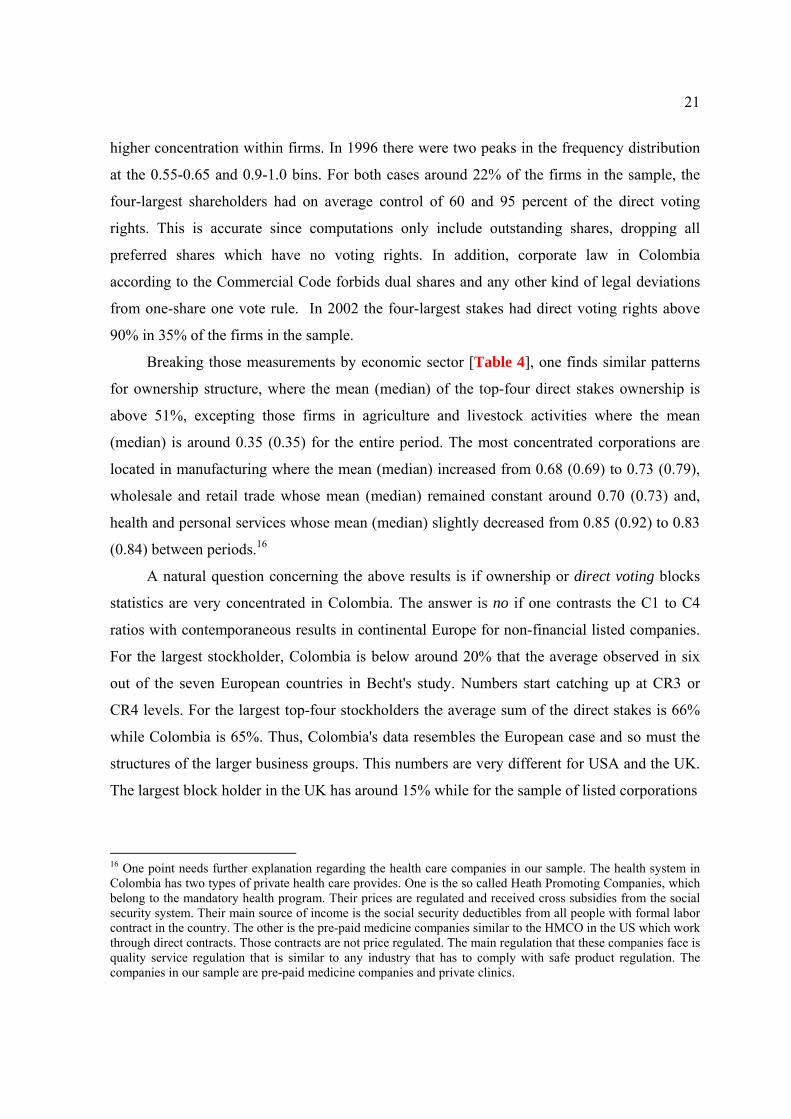
Breaking those measurements by economic sector [Table 4], one finds similar patterns
for ownership structure, where the mean (median) of the top-four direct stakes ownership is
above 51%, excepting those firms in agriculture and livestock activities where the mean
(median) is around 0.35 (0.35) for the entire period. The most concentrated corporations are
located in manufacturing where the mean (median) increased from 0.68 (0.69) to 0.73 (0.79),
wholesale and retail trade whose mean (median) remained constant around 0.70 (0.73) and,
health and personal services whose mean (median) slightly decreased from 0.85 (0.92) to 0.83
(0.84) between periods.16
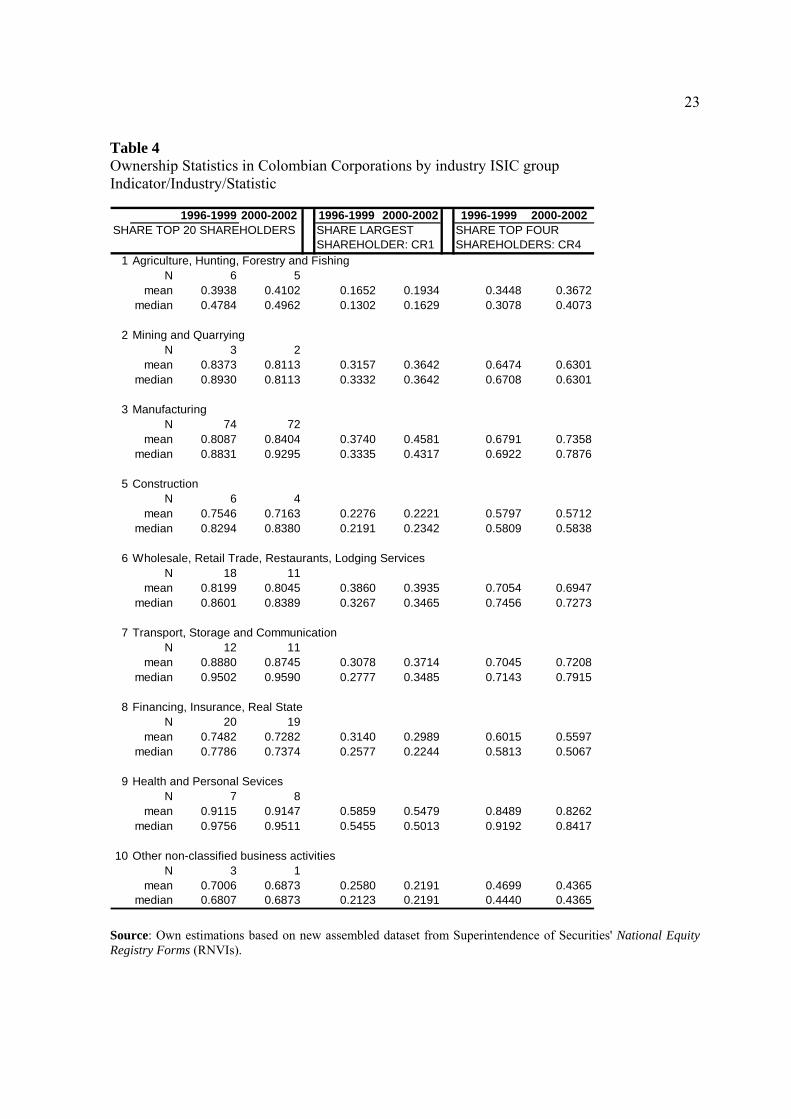
A natural question concerning the above results is if ownership or direct voting blocks
statistics are very concentrated in Colombia. The answer is no if one contrasts the C1 to C4
ratios with contemporaneous results in continental Europe for non-financial listed companies.
For the largest stockholder, Colombia is below around 20% that the average observed in six
out of the seven European countries in Becht's study. Numbers start catching up at CR3 or
CR4 levels. For the largest top-four stockholders the average sum of the direct stakes is 66%
while Colombia is 65%. Thus, Colombia's data resembles the European case and so must the
structures of the larger business groups. This numbers are very different for USA and the UK.
The largest block holder in the UK has around 15% while for the sample of listed corporations
16 One point needs further explanation regarding the health care companies in our sample. The health system in Colombia has two types of private health care provides. One is the so called Heath Promoting Companies, which belong to the mandatory health program. Their prices are regulated and received cross subsidies from the social security system. Their main source of income is the social security deductibles from all people with formal labor contract in the country. The other is the pre-paid medicine companies similar to the HMCO in the US which work through direct contracts. Those contracts are not price regulated. The main regulation that these companies face is quality service regulation that is similar to any industry that has to comply with safe product regulation. The companies in our sample are pre-paid medicine companies and private clinics.

22
Figure 3 Histogram of the top-four shareholders (CR4) – 1996
0.0
5.1
.15
.2.2
5Fr
actio
n
0 .1 .2 .3 .4 .5 .6 .7 .8 .9 1acr4
Source: Own estimations based on new assembled dataset from Superintendence of Securities' National Equity Registry Forms (RNVIs). Figure 4 Histogram of the top-four shareholders (CR4) – 2002
0.1
.2.3
Frac
tion
0 .1 .2 .3 .4 .5 .6 .7 .8 .9 1acr4
Source: Own estimations based on new assembled dataset from Superintendence of Securities' National Equity Registry Forms (RNVIs).
23
Table 4 Ownership Statistics in Colombian Corporations by industry ISIC group Indicator/Industry/Statistic
1996-1999 2000-2002 1996-1999 2000-2002 1996-1999 2000-2002SHARE TOP 20 SHAREHOLDERS SHARE LARGEST SHARE TOP FOUR
SHAREHOLDER: CR1 SHAREHOLDERS: CR41 Agriculture, Hunting, Forestry and Fishing
N 6 5mean 0.3938 0.4102 0.1652 0.1934 0.3448 0.3672
median 0.4784 0.4962 0.1302 0.1629 0.3078 0.4073
2 Mining and QuarryingN 3 2
mean 0.8373 0.8113 0.3157 0.3642 0.6474 0.6301median 0.8930 0.8113 0.3332 0.3642 0.6708 0.6301
3 ManufacturingN 74 72
mean 0.8087 0.8404 0.3740 0.4581 0.6791 0.7358median 0.8831 0.9295 0.3335 0.4317 0.6922 0.7876
5 ConstructionN 6 4
mean 0.7546 0.7163 0.2276 0.2221 0.5797 0.5712median 0.8294 0.8380 0.2191 0.2342 0.5809 0.5838
6 Wholesale, Retail Trade, Restaurants, Lodging ServicesN 18 11
mean 0.8199 0.8045 0.3860 0.3935 0.7054 0.6947median 0.8601 0.8389 0.3267 0.3465 0.7456 0.7273
7 Transport, Storage and CommunicationN 12 11
mean 0.8880 0.8745 0.3078 0.3714 0.7045 0.7208median 0.9502 0.9590 0.2777 0.3485 0.7143 0.7915
8 Financing, Insurance, Real StateN 20 19
mean 0.7482 0.7282 0.3140 0.2989 0.6015 0.5597median 0.7786 0.7374 0.2577 0.2244 0.5813 0.5067
9 Health and Personal SevicesN 7 8
mean 0.9115 0.9147 0.5859 0.5479 0.8489 0.8262median 0.9756 0.9511 0.5455 0.5013 0.9192 0.8417
10 Other non-classified business activitiesN 3 1
mean 0.7006 0.6873 0.2580 0.2191 0.4699 0.4365median 0.6807 0.6873 0.2123 0.2191 0.4440 0.4365
Source: Own estimations based on new assembled dataset from Superintendence of Securities' National Equity Registry Forms (RNVIs).
24
Table 5 Average direct ownership (direct voting rights) in Non-Financial listed firms for selected countries
Country year N CR1 CR2 CR3 CR4
Austria 1996 50 54.1 61.9 64.5 64.7
Belgium 1995 140 55.9 66.2 70.7 71.5
France* 1997 228 51.1 72.5 82.6 83.7
Germany** 1996 372 57.0 59.9 60.5 61.0
Italy 1996 214 52.3 60.0 63.5 64.4
Spain 1995 193 32.1 40.1 47.1 50.0
UK 1992 207 14.4 21.7 27.7 33.0
USA-NYSE 1996 1309 8.5 12.2 14.0 14.2
Colombia 1996 180 37.14 50.27 58.65 65.71Average Continental Europe 50.42 60.10 64.81 65.86Colombia/Avg Continental Europe 0.7366 0.8365 0.9050 0.9977 Sources: Becht (1997), Barca and Becht (2001), and Own estimations based on new assembled dataset from Superintendence of Equities' National Equity Registry Forms (RNVIs). Notes: France*: only holding companies; Germany**: Only manufacturing firms; N: Number of firms; CR1: share of the largest shareholder; CR2: share top-two shareholders; CR3: share top-three stockholders; CR4: share top-four stockholders.
at the NYSE the figure is around 8.5%. The next section analyzes the structure of the three
largest, most traditional and important real sector business groups in the country.
5. Examples of Ownership Structures
Business group structures in Colombia are complex. There is no restriction for cross-
shareholder structures and regulations regarding mergers, takeovers and minority shareholder
protection are in less develop stages, with low enforcement levels in contrast with the anti-
takeover legislation in the United States and the United Kingdom. On this particular, merged
firms must file for permission at the Superintendence of Industry who establishes if there is a
risk for market dominant position. However, during the last four years some advances in

25
shareholder protection have taken place. Resolutions 0932, 0072 and 0275 of 2001 of the
Superintendence of Securities sought the strengthening of the investor protection ruling, and to
lead domestic legislation toward international standards17. In addition, it is important to
highlight that since 1923 commercial banks are forbidden to hold any outstanding shares in
any real sector corporation, which is not the case of more advanced capital markets such as
Germany and Japan.
The three larger and best known non-financial business groups in Colombia are the so-
called Sindicato Antioqueño, the Santodomingo group and the Ardila group. These three
holdings count for 59 out of 116 affiliated corporations of our sample, and represent more
than 50% of sales or fixed assets for the entire sample of 233 firms (affiliated plus non-
affiliated firms). Description follows.
Sindicato Antoqueño
The Sindicato Antioqueño refers to a business group formed by firms in several industries as
well as financial companies. Its core businesses are cement, processed food, roasted coffee,
iron, tobacco, construction, textiles, investment funds, trust funds, investment banks
(corporaciones financieras) and insurance firms. The number of companies affiliated to the
group is around 100 between listed and non-listed firms. Its structure is the result of several
alliances and web of firms that make it a pure cross share holding. Its name comes from the
province in which its key companies are based, around the city of Medellin, which has the
second largest industrial district in Colombia and the largest textile and apparel industries
within the Andean countries. Some of the companies have more that 80 years of being
founded. For instance, Industrias Alimenticias Noel was founded in 1916, Nacional de
17 The core element of Resolution 0932 is that companies that have securities registered at the RNVI must provide to the Superintence “information regarding any relevant fact or extraordinary or significant operation or act relative to the issuer, its business, the registered securities and the supply of those securities to the market”. Among them are decisions reached by the board of directors, changes in the conditions of the issuer, calls for shareholder’s General Assembly, changes in the figures contained in the financial statements, distribution of dividends, change of auditor, merger or acquisition of business lines in the same industry. Resolution 0072 sets the conditions for companies that want the registration of their stocks to be cancelled from the stock exchanges. It states that a company in delisting from the stock exchange needs a simple majority of the outstanding shares votes in favor of the cancellation. Resolution 0275 incentive for the voluntary issue of a code of good corporate governance practices in all companies that want their issued and traded securities to be acquired by Colombian pension funds.
26
Chocolates and Fabricato S.A, the largest textile mill in the country, were both founded in
1920, and Compañía de Cementos Argos began commercial operations in 1935. Today the
heart of the conglomerate is within the cement industry and is centered around Cementos
Argos, which became a holding company in 2000 when it stopped operations as a cement mill.
Argos has direct investments across the largest cement companies in the country and integrates
all the productive chain: stone quarrying, clay, and sand mining, manufacture of cement,
cement mixing, reinforced concrete, and distribution. Argos’s group has one-half of market
share and exports around 2.5 million tons per year.
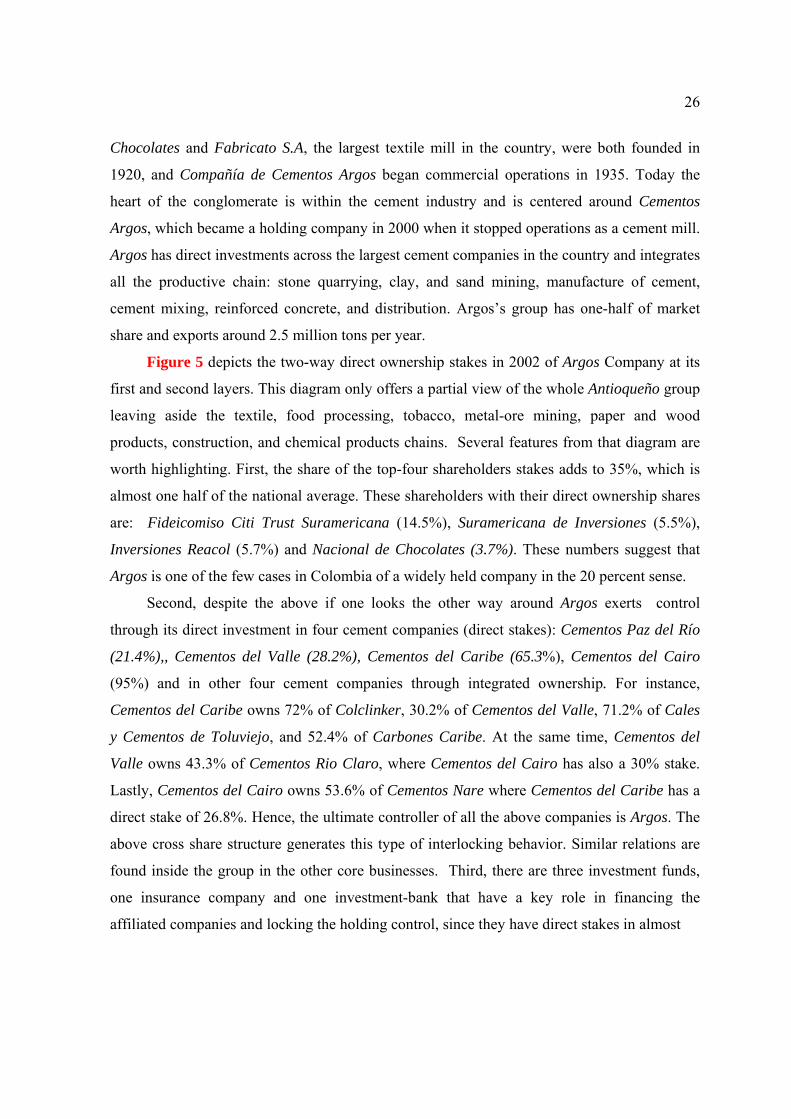
Figure 5 depicts the two-way direct ownership stakes in 2002 of Argos Company at its
first and second layers. This diagram only offers a partial view of the whole Antioqueño group
leaving aside the textile, food processing, tobacco, metal-ore mining, paper and wood
products, construction, and chemical products chains. Several features from that diagram are
worth highlighting. First, the share of the top-four shareholders stakes adds to 35%, which is
almost one half of the national average. These shareholders with their direct ownership shares
are: Fideicomiso Citi Trust Suramericana (14.5%), Suramericana de Inversiones (5.5%),
Inversiones Reacol (5.7%) and Nacional de Chocolates (3.7%). These numbers suggest that
Argos is one of the few cases in Colombia of a widely held company in the 20 percent sense.
Second, despite the above if one looks the other way around Argos exerts control
through its direct investment in four cement companies (direct stakes): Cementos Paz del Río
(21.4%),, Cementos del Valle (28.2%), Cementos del Caribe (65.3%), Cementos del Cairo
(95%) and in other four cement companies through integrated ownership. For instance,
Cementos del Caribe owns 72% of Colclinker, 30.2% of Cementos del Valle, 71.2% of Cales
y Cementos de Toluviejo, and 52.4% of Carbones Caribe. At the same time, Cementos del
Valle owns 43.3% of Cementos Rio Claro, where Cementos del Cairo has also a 30% stake.
Lastly, Cementos del Cairo owns 53.6% of Cementos Nare where Cementos del Caribe has a
direct stake of 26.8%. Hence, the ultimate controller of all the above companies is Argos. The
above cross share structure generates this type of interlocking behavior. Similar relations are
found inside the group in the other core businesses. Third, there are three investment funds,
one insurance company and one investment-bank that have a key role in financing the
affiliated companies and locking the holding control, since they have direct stakes in almost
27
Figure 5 – Cementos Argos’ web of direct ownership stakes - 2002
Source: Superintendence of Securities' National Equity Registry Forms (RNVIs).
Fideicomiso Citi-Trust IFC-
SuramericanaFund
Corfinsura
Banco Atlantico Ahamas Bank Cementos Argos
Cia de Inversiones La Merced
Inversiones Reacol
Suramericana de Inversiones
5.7%5.5%
23.5%
Portafolio de Inv. Suramericana
94.8%
Cia Nacional de Chocolales
Cia Suramericana de Seguros
4.5%
5.1%
2.4%
5.8%
3.7%
24.1% 4.6%7.2%
3.9%
2.4%
3.1%
3.0%
2.6%
2.3%
Industria Col de Café
4.7%
3.1
14.5%
9.8%
4.6%
5.1%
8.7%
Cementos Caribe
18.1% 65.3%
Cementos del Valle
4.4%
3.6%
30.2% 28.2%
2.9%
Cementos Paz del Río
21.4%
1.2%17.7%
Colclinker
4.0%
5.6%
3.4%
72.0%25.7%
33.0%
33.0%
Cementos del Cairo
Cementos Rio-Claro
Cementos Nare
30.0%
43.3%
94.8%
53.6%26.8%

28
all firms. They are Suramericana de Inversiones, Inversiones Reacol, Portafolio de
Inversiones Suramericana, Compañía Suramericana de Seguros, and Corporación Financiera
Suramericana [Corfinsura]. They form a pure web of direct and integrated ownership
relations.
Santo Domingo Group
The Santo Domingo group is the second largest business group in the country. Its core
business started within the beer industry. Bavaria S.A has been the leading beer company and
brand in the country and is one of the 10 largest firms in Colombia by size of sales and assets.
It is also one of the largest beer companies in Latin America. Bavaria shares have been
publicly traded since 1930s at the former Bogotá stock exchange. German immigrant Leo
Kopp set up the brewery industry in Bogotá in 1889. During the 1940s, as a result of World
War II, the Government expropriated all equity shares held by German or Italian citizens in
Colombian firms. By 1967 the Santodomingo family took control of the company through
their former brewery of Barranquilla18.
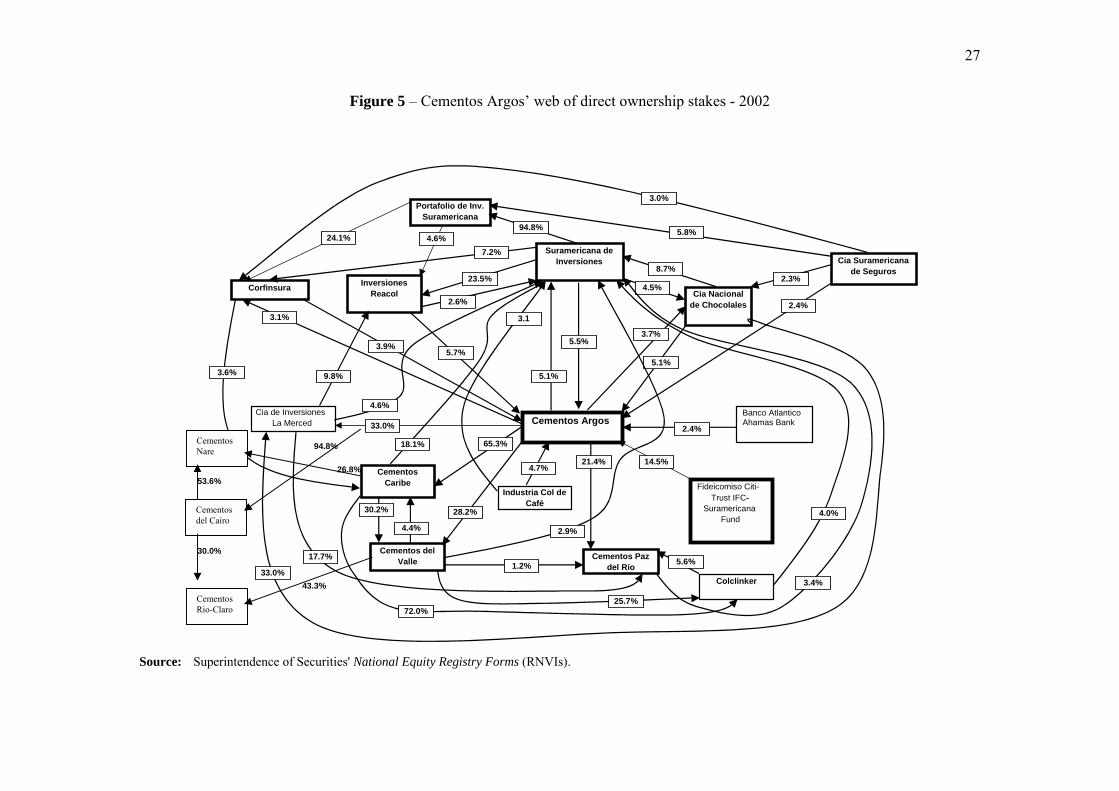
Despite its strong and historical presence in Colombian economic activities, the Santo
Domingo Group had only 17 listed firms in the 1996-2002 period. Figures 6a and 6b shows
the holding structure for the main companies, including some unlisted ones. This group has a
pyramidal structure, although there are cross shares among some firms. The pyramid has two
main branches. One is made of the beer companies headed by Bavaria who is the ultimate
controller with direct stakes in Malterias de Colombia (76%), and Cerveceria Aguila (50%)
and Sofasa (51%) the auto assembly producer. Through the first one it controls Conalvidrios
which is the supplier of glass bottles for the beer industry, and by means of these former two
companies it exerts absolute control over Productora de Jugos and Inversiones Aconcagua, a
holding investment fund. The beer companies do not have foreign investors among the largest
shareholders although some foreign-based holdings appear as small stockholders. Valores
Bavaria, which is the group's trust fund, heads the other holding branch. The largest and most
important companies on this side are Avianca, the largest passenger airline, Caracol Radio and
18 For more details on the History of Colombia’s leading enterprises and the development of the manufacturing industry see: Davila (2003), Mayor-Mora A., (1989), Ocampo J. A (1991, 1994), Echavarria (2000), and Pombo (2002).

29
31% 15%
51% 50% 76% 14%
49% 11%
50%
68%
48% 49%
33%
10%
49%
45%
8% 14%
Figure 6 – Santo Domingo Group - 1998
Bavaria
Unión de Valores S.A.
Cervecería Aguila Sofasa S.A Malterías de Colombia S.A Cía Nacional de Vidrios S.A
Productora de Jugos S.A Inv. Aconcagua S.A Cervecería Unión S.A
Caracol TV S.A
FiduValle Santodomingo Cia S.C.A
30
Figure 6 – Santo Domingo Group – 1998 (Cont.)
Source: Superintendence of Securities’ National Equity Registry Forms (RNVIs) Notes: Celumovil’s stakes refer to 1999.
48% 16%
36 O
11% 16% 23%
55%
48%
47%
13%
12% 36% 11% 21%
40%
35% 26% 15%
20%
38%
17% 13% 17%
11%
Valores Bavaria S.A
Inv. Fenicia
Redes de Colombia Inv. Bavaria
Reforestadora de la C
osta S.A
Inversiones Ser S.A
Avianca S.A
Inversiones Refonal S.A
Inmobiliaria A
guila S.A
Caracol R
adio S.A
Auditam
os Consulting ltda.
Grandes Superficies de C
bia S.A
Cía C
olombiana de Inv. C
olseguros S.A
Petroleum Aviation and Services S.A
32%
10%
Celum
óvil S.A
9%
9%
31%

31
Caracol TV a media communications companies, Colseguros the insurance branch of the
group, , Polipropileno del Caribe, a manufacturer of petrochemicals and synthetic resins, and
Grandes Superficies de Colombia (Carrefour) the second largest retail trade chain in the
country, and Celumovil (Bell-South Colombia) the cellular phone company.
All the above companies have important foreign investment stakes. In fact, the Santo
Domingo group has a very small minority stake in the insurance company Colseguros, where
93.6% of the company is currently owned by a foreign investor. Polipropileno del Caribe in
turn is basically foreign-owned (50% ). Sofasa and Bell-South Colombia are two companies in
which Santo Domingo has some presence. In the first one, it has a majority stake but this is
also a strategic alliance Renault and Toyota must supply the complete body of the cars. In
Celumovil (Bell-South Colombia), again foreign investors have the majority and the group by
means of two holding funds Inversiones Bavaria and Union de Valores acts as a strategic
partner. Finally, Union de Valores is at the top of the group with direct stakes in Bavaria
(30%) and in Valores Bavaria (30%). Therefore, under the 20% sense this holding fund is the
ultimate controller of the group. All in all, the Santo Domingo group shares most of the
characteristics present in the Sindicato Antioqueño except the fact that there is no substantial
cross-shareholding. In some cases, if foreign capital (or expertise) is needed, then strategic
alliances are implemented19.
Ardila- Group
The Ardila group is the third main conglomerate and dominates the soft-drink industry. Its
leading company is Postobon S.A founded in 1905 in Medellín by Gabriel Posada and Valerio
Tobón, as Gaseosas Posada & Tobón. Thanks to the rapid market growth the company signed
a distribution franchise with Coca-Cola in 1927 that lasted until 1937 when the multinational
decided to build its own plants in Colombia. One small shareholder of Postobon was Gaseosas
Lux, owned by Carlos Ardila. Lux was a regional soft drink firm that gradually leveraged its
stakes to take control over Postobon in 1968. Also in the sixties the company got the franchise
for Pepsi Co. Despite its growing importance and long history in Colombian business activity
19 The group undertook a restructuring process since 2002. The most important transaction within the group’s enterprises was the merger of Avianca with the second domestic largest air carrier (ACES), and its following sale of 75% of company’s shares to the Synergy Group of Brazil in December of 2004.

32
during the last four decades, the Ardila group surprisingly has had until year 2000 four listed
companies: Compañía Colombiana de Tejidos (COLTEJER), RCN TV, PELDAR S.A and
Ingenio del Cauca S.A; none of them are soft-drink companies and the last two got de-listed
during the late 1990s20.
Figure 7 describes the holding structure for the year 2000. It includes, besides the listed
ones, the holding's main unlisted companies. The diagram has two main bodies that follow the
beverage industry chain: i) the soft drink companies labeled as “Gaseosas” and ii) the soft
drink’s upstream industries. They are to the left and to the right of the group's leading
enterprises: Gaseosas Postobon and Gaseosas Colombianas. The figure shows that the two
ultimate controllers for these two set of companies are two holding investment funds:
Servicios e Inversiones S.A (Servinsa) and Inversiones Gamesa S.A. The first one has direct
stakes in Postobon (45%), Gaseosas Colombianas (45%), while the second one owns a 46%
stakes in Postobon and 39% in Gaseosas Colombianas. Hence, these two funds exert absolute
control over the group's two largest soft drink companies. At the same time both funds have
direct stakes of 48% in eight medium-size and regional soft drink companies, and 23% in
other one.
The group has vertical control in the production of key inputs. On one side, it has direct
investments in three large sugar refining mills. The holding funds together own 53% of
Ingenio del Cauca, which owns 45% of Ingenio Providencia which in turn owns 9% of
Ingenio Risaralda, where Ingenio del Cauca has a 20% stake. Providencia is the second main
shareholder of Sucromiles, a company that manufactures citric acid. On the other side, the
holding funds control the manufacturer of bottle lids [Tapas la Libertad] with a stake of 89%.
The group also has control over its distribution network. The truck fleet is gathered in
Empresa de Distribución Industriales S.A which is controlled by Servisa and Besmit S.A with
88% stake. This is another holding company with direct and representative investments across
the group beverage firms. To square the circle, the group has stakes in PELDAR S.A, the
glass manufacturer, in which there is a representative foreign investment share21.
The group has large investments in several non-core businesses. The most representative
are textiles and the media and communication industries. The Ardila group took control over
20 Gaseosas Postobón S.A got listed in 2004 and registered at the Superintence of Securities. 21 PELDAR was founded in 1939 and since the 1940s got over the control of Owens Illinois Glass Co. Today the largest shareholders are Owens Brockway Glass Inc, and Fiducomercio which is a Bank trust fund.

33
Figure 7 – The Ardila Group – 2000
Source: Superintendence of Securities’ National Equity Registry Forms (RNVIs), and Superintendence for Commercial Societies
Servinsa Oal S.A
Emp. de D
istrib. Industriles S.A
Gaseosas N
ariño S.A
Gaseosas C
hiquinquira S.A
Gaseosas del Lalno S.A
Gaseosas Lux S.A
Gaseosas Tolim
a S.A
Tapas La Libertad S.AIngenio del Cauca S.A
Gaseosas Colombianas S.A
Inversiones Gamesa S.A
Gaseosas Postobon S.A
RC
N S.A
Gaseosas de H
uila S.A
Gaseosas B
oyaca S.A
Gaseosas de C
ordoba S.A
Gaseosas M
ariquita S.A
Ingenio Providencia S.A RCN TV S.ASociedad de Comercializacion Internacional Coltejer S.A
Gaseosas Lux
Coltejer S.A
Textiles Rionegro y Compania Ltda. S.A
Ingenio Risaralda S.ASucromiles S.A
48% 48% 42%
48% 48% 23% 21%
45% 45%
42%
9%
48% 48%
48% 48%
14%
44% 47%
46% 39%
32%
20% 20%
11%
11%
45%
22%
38%
48%
99%
9% 20%
PELDAR S.ABesmist Ltda
Owens Glass Inc.
Fiducomercio S.A
20% 18%
4.4%
40%

34
Coltejer S.A in 1978. This firm started operations in 1909 and was, along with Fabricato S.A
the largest textile mill in the country and previously affiliated as well to the Sindicato
Antioqueño group. Today more than 15 affiliated companies are within the top 20 shareholders
with an aggregate stake of 80%. Regarding the media companies these are RCN radio and
RCN TV, where the holding investment funds Gamesa and Servinsa are the ultimate
controllers. Both funds have a 53% stake in RCN Radio, which in turn owns 38% of RCN TV
and along with the 14% stake of Gamesa investment they exert absolute control over that firm.
Summarizing, the above analysis of the largest business groups in Colombia showed the
existence of a mixture of ownership structures, high rates of direct stakes concentration, and
full specialization in each group core business. There are no intra-group investments. If there
is some, it is as a minority stockholder such as the case of Coltejer where some companies
affiliated to the Sindicato have around 10% stake in the company. In addition,
entrepreneurial history in Colombia has shown no successful undertakings when one
conglomerate seeks entry and competes for a rival’s core-markets. Perhaps the most
representative and recent example was when the Ardila group built a new brewery in 1994.
Six years later the company was acquired by Bavaria, because of its cash flow deficits and low
plant low capacity utilization rate.
6. The separation of ownership and control
The agency theory suggested for Berle and Means (1932)'s American-type Corporation
between insiders and shareholders posed the question of firm control as a central issue to study
firm performance and corporate valuation. La Porta et al (1999)'s study of corporate
ownership around the world and following papers highlight as a consistent fact that ownership
structures are complex where ultimate controllers leverage their voting through cross
shareholding and pyramidal relations. When conglomerates become highly concentrated
reduces the agency problem but creates new ones. The Colombian main holdings resemble
European holding structures as was shown by contrasting the ownership statistics of the larger
voting blocks within listed corporations. Ownership matters in both ways that is, being an
anonymous shareholder of a big corporation facing strong management structures or being a

35
strong owner that manages the firm. The latter poses new questions such as the incentives to
expropriate minorities, or the rules of the game among the largest voting blocks when none of
them has an absolute control. Clearly rent-seeking behavior is part of the theory but there is a
need for further modeling of the agency problem across largest ownership blocks within
conglomerates with complex two-way ownership relations. The measurement of voting rights
in this study relies on the concept of a shareholder’s integrated ownership (direct + indirect),
while cash flow is associated with direct ownership. In terms of control the first one provides
the indirect votes and the latter gives direct votes. Thus, the separation between ownership
and control is given by the direct to integrated ownership ratio and must be less than one by
construction.
Table 6 displays the results regarding the measurements of the separation ratio for the
larger shareholder, who is in most cases an ultimate controller under the 20 percent cutoff
level. We considered two time spans, before and after 2000. Several facts are visible from that
table. First, de-listed corporations are more concentrated than listed ones. The mean (median)
of the largest controller shareholder is 0.42 (0.37) for the de-listed ones, while the largest
controller in the listed ones is around 10 basis points lower at 0.30 (0.25). Second, the largest
voting block increased over time for both listed and de-listed firms. The median of the largest
voting block for the listed (de-listed) firms moved from 0.32 (0.45) to 0.38 (0.50) after 2000.
Third, concentration of voting is greater in manufacturing, and health and personal services
companies but with opposite trends. In manufacturing the median of the voting concentration
rises by ten points passing from 0.36 to 0.46, while in health companies the median decreases
from 0.53 to 0.50. Regarding the financial and insurance companies, they are composed by
holding investment or trust funds and play a role as ultimate controllers within the business
groups. The voting concentration has remained constant, so these ultimate owners are still
strategically the same. Fifth, separation ratios are high and above 0.9 in most cases. This
reflects that firm control is exerted through direct ownership. Thus, corporate structure follows
a strong owner management bias. In other words, owners command, control boards and
appoint CEOs.
The overall ratios tend to be slightly higher in Colombia (0.94, 0.96) than those found in
other studies. For instance Chapelle (2001) reports a 0.80 separation ratio for the large voting
block for 135 listed Belgium firms in 1995. Claessens et al (2000) report an overall ultimate

36
Table 6 Separation of Cash Flow to Voting Rights in Colombian Corporations (Largest Voting Block: by listing status and industry group (average per period)
1996 - 1999 2000-2002N mean Median P75 P25 N mean Median P75 P25
A. Cash Flow Rights (Direct Ownership)
LISTED CORPORATIONS 79 0.3003 0.2549 0.4133 0.1432 92 0.3699 0.3215 0.4954 0.1808DE-LISTED CORPORATIONS 69 0.4258 0.3693 0.6012 0.2242 41 0.4906 0.4745 0.6623 0.2974
Agriculture, Hunting, Forestry and Fishing 6 0.165 0.130 0.263 0.102 5 0.1934 0.1629 0.2846 0.0942Mining and Quarrying 3 0.316 0.333 0.436 0.197 2 0.3642 0.3642 0.5417 0.1866Manufacturing 74 0.374 0.333 0.514 0.184 72 0.4581 0.4317 0.6088 0.2555Construction 6 0.228 0.219 0.272 0.175 4 0.2221 0.2342 0.2825 0.1616Wholesale, Retail Trade, Lodging Services 18 0.386 0.327 0.533 0.235 11 0.3935 0.3465 0.5984 0.2048Transport, Storage and Communication 12 0.308 0.278 0.426 0.192 11 0.3714 0.3485 0.5043 0.2088Financing, Insurance, Real State 20 0.314 0.258 0.370 0.169 19 0.2989 0.2244 0.3604 0.1184Community, Social and Personal Sevices 7 0.586 0.546 0.765 0.425 8 0.5479 0.5013 0.7249 0.3846Other non-classified business activities 3 0.258 0.212 0.396 0.165 1 0.2191 0.2191 0.2191 0.2191
Total sample 148 0.3552 0.1856 0.3041 0.4934 133 0.4087 0.2070 0.3575 0.5470
B. Voting Rights(Integrated Ownership)
LISTED CORPORATIONS 79 0.3188 0.2761 0.4598 0.1638 92 0.3881 0.3538 0.5316 0.2012DE-LISTED CORPORATIONS 69 0.4459 0.3887 0.6623 0.2533 41 0.5058 0.4746 0.7451 0.3060
Agriculture, Hunting, Forestry and Fishing 6 0.177 0.136 0.279 0.105 5 0.204 0.180 0.300 0.098Mining and Quarrying 3 0.394 0.432 0.571 0.217 2 0.393 0.393 0.600 0.187Manufacturing 74 0.400 0.369 0.564 0.205 72 0.476 0.460 0.669 0.281Construction 6 0.228 0.219 0.272 0.175 4 0.222 0.234 0.283 0.162Wholesale, Retail Trade, Lodging Services 18 0.399 0.333 0.569 0.241 11 0.413 0.363 0.635 0.205Transport, Storage and Communication 12 0.329 0.308 0.428 0.223 11 0.397 0.360 0.504 0.267Financing, Insurance, Real State 20 0.336 0.284 0.383 0.195 19 0.319 0.269 0.392 0.139Community, Social and Personal Sevices 7 0.586 0.546 0.765 0.425 8 0.548 0.501 0.725 0.385Other non-classified business activities 3 0.258 0.212 0.396 0.165 1 0.219 0.219 0.219 0.219
Total Sample 148 0.3747 0.1996 0.3217 0.5156 133 0.4257 0.2235 0.3792 0.5845
C. Cash Flow to Voting Rights Ratio
LISTED CORPORATIONS 79 0.9409 0.9187 0.8977 0.8735 92 0.9527 0.9090 0.9333 0.8963DE-LISTED CORPORATIONS 69 0.9553 0.9490 0.9088 0.8889 41 0.9700 0.9998 0.8942 0.9710
Agriculture, Hunting, Forestry and Fishing 6 0.929 0.955 0.924 0.976 5 0.945 0.914 0.930 0.965Mining and Quarrying 3 0.780 0.762 0.744 0.891 2 0.927 0.927 0.904 1.000Manufacturing 74 0.934 0.903 0.913 0.897 72 0.963 0.939 0.908 0.910Construction 6 1.000 1.000 1.000 1.000 4 1.000 1.000 1.000 1.000Wholesale, Retail Trade, Lodging Services 18 0.968 0.981 0.949 0.974 11 0.951 0.955 0.940 1.000Transport, Storage and Communication 12 0.932 0.895 0.994 0.868 11 0.931 0.961 1.000 0.780Financing, Insurance, Real State 20 0.930 0.899 0.962 0.867 19 0.934 0.835 0.908 0.871Community, Social and Personal Sevices 7 1.000 1.000 1.000 1.000 8 1.000 1.000 1.000 1.000Other non-classified business activities 3 1.000 1.000 1.000 1.000 1 1.000 1.000 1.000 1.000
Total Sample 148 0.9480 0.9296 0.9451 0.9570 133 0.9601 0.9262 0.9428 0.9358Source: Own estimations based on new assembled dataset from Superintendence of Securities’ National Equity Registry Forms (RNVIs). Notes: separation ratio = direct ownership /integrated ownership.

37
controller separation ratio average of 0.74 for 2,611 publicly traded East Asian corporations
for 1997. Among them Hong Kong reports a ratio of 0.88, Philipines of 0.90, and Thailand of
0.94. In addition, La Porta et al. (1999) find that for the cases of Argentina and Mexico
ultimate controllers need around 19.6% and 16.5% of cash flow to get 20% voting rights. It is
important to point out that deviations from the one-share-one-vote rule are low, meaning
separation ratios close to one, in two opposite cases. The first is associated with widely held
corporations with lower voting power for the largest stockholders such as the case of the top
20 corporations in the US as presented in La Porta et. al (1999). The second case arises in
highly concentrated ownership structures where the largest voting block has companies’
absolute control with overall direct votes greater than 50%. This case will induce a strong
control bias toward owners. Thus, there is no need of further voting leverage through indirect
ownership investments.
Despite the above, the separation ratios for Colombian corporations decrease around 15
percentage points if one computes that measure relative to the top-four largest stockholders
according to the findings reported in Table 7. The mean (median) of the separation ratio for
the total sample decreases to a 0.75 (0.82) level. Here it is clear that there is voting leverage
through investments in pyramidal or cross shareholding structures. In addition, the separation
ratio measures for the largest and ultimate controller within the Sindicato Antioqueño group is
lower than the total sample. The mean (median) was 0.85 (0.87) for the 1996-1999 period, and
slightly arose to 0.89 (0.89) after 2000. Hence, the presence of cross ownership across firms
increases total voting leverages of ultimate owners.
Toward a coalition hypothesis of corporate control?
The separation ratio measures suggest that there is an owner-control bias in contrast to the
strong management and passive investor role observed in US corporations. To illustrate the
control direction bias we used the cumulative distribution functions (c.d.f) for the largest
direct voting block and the top-two direct voting blocks as used in the studies collected by
Barca and Becht (2001). The intuition behind these graphs is to find how asymmetric a
cumulative distribution function is. Concentration ratios by definition are within the zero-one
interval. Thus, the maximum value for an ownership stake is 100% of a company’s net worth.

38
Table 7 Separation of Cash Flow to Voting Rights in Colombian Corporations Total sample top-four voting blocks and the ultimate shareholder of Sindicato Antioqueño Group
1996 - 1999 2000-2002N mean Median P75 P25 N mean Median P75 P25
Total Sample Top-four largest shareholders: CR4
A. Cash Flow Rights (Direct Ownership)148 0.794 0.676 0.862 0.970 133 0.807 0.694 0.895 0.982
B. Voting Rights (Integrated Ownership)
148 1.032 0.804 0.965 1.158 133 1.091 0.853 0.991 1.297
C. Cash Flow to Voting Rights Ratio
148 0.7697 0.8409 0.8939 0.8378 133 0.7398 0.8134 0.9032 0.7573Sindicato Antioqueño Group - ultimate shareholder
A. Cash Flow Rights (Direct Ownership)
30 0.2790 0.2398 0.3759 0.1290 29 0.3553 0.3028 0.4917 0.1879
B. Voting Rights (Integrated Ownership)
30 0.3280 0.2731 0.4760 0.1618 29 0.3995 0.3384 0.5611 0.2216
C. Cash Flow to Voting Rights Ratio
30 0.8507 0.8780 0.7897 0.7970 29 0.8893 0.8950 0.8763 0.8481 Source: Own estimations based on new assembled dataset from Superintendence of Securities' National Equity Registry Forms (RNVIs). Notes: separation ratio = direct ownership /integrated ownership.
If the distribution is uniform with equally proportioned stakes across firms, its cumulative
distribution function would be the 45 degree line. That is, there is no dispersion with respect to
the distribution median. If the cumulative function for the largest direct voting block (CR1)
lies below the 45% degree line, this means that there is low ownership concentration along
with low levels of block-holder power. In the opposite case, if the c.d.f of the largest voting
block is above the 45 degree line, it represents the existence high ownership concentration and
block-holder power.

39
Corporate control bias direction will be towards having a strong-management bias for
the first case and owner-private bias in the second case. Figure 8 depicts the c.d.f for the
largest direct voting block (CR1) for 134 listed firms in Colombia for year 2002. The c.d.f lies
on the 45% degree line at a fraction of data smaller than 20% where it crosses the 45% line.
Stakes at this point are evenly distributed for the sample 20 percent. At the 50% fraction of the
data direct ownership stakes are around 40%. These numbers are lower than the figures
reported for the cases of Belgium, France and Italy [Barca and Becht (2001)], and are
consistent with the numbers of table 5 because the largest shareholder on average has 20%
less voting power in Colombia with respect to the European average (excluding the UK).
Renneboog (2001) and Becht (2001) show that such distributions follow an inverse-L
shape for the United Kingdom and United States cases. In particular their findings show that at
a 50% fraction of data, direct ownership stakes are less than 10% in the UK, and less than 5%
in the US. The opposite case is Germany, where the c.d.f of the largest direct voting block lies
above the 45% line. At the 50% fraction of data direct ownership is around 60%, meaning an
absolute control of the largest shareholder across German companies under the one share one
vote regime.
The picture changes drastically if one plots the c.d.f for the top-two largest voting
blocks. Figure 9 summarizes the results where the c.d.f is above the 45% degree line. Thus,
there is absolute control if the two largest shareholders collude in order to take over
companies’ board and management. In affiliated companies usually the two largest
shareholders belong to the holding. However, this might not the case for the non-affiliated
ones or for holdings with substantial cross shares where the second and third largest voting
blocks play an important strategic role in keeping the group control across the holding’s firms.
Next section explores what is the composition of ultimate owners.
7. Ultimate shareholders
A central question regarding corporate ownership is who the ultimate shareholders are. If a
firm has an ultimate controller means that she has enough voting rights to exert a firm’s
control. Concentration of voting rights is crucial for the designing of a firm’s management,

40
Figure 8
0.2
.4.6
.81
Max
imum
sha
reho
lder
per
com
pany
0 .25 .5 .75 1Fraction of the data
Percentile plot of the largest shareholder - 2002
Source: Own estimations based on new assembled dataset from Superintendence of Equities' National Equity Registry Forms (RNVIs).
Figure 9
0.2
.4.6
.81
Max
imum
sha
reho
lder
per
com
pany
0 .25 .5 .75 1Fraction of the data
Percentile plot of the top-two shareholders - 2002
Source: Own estimations based on new assembled dataset from Superintendence of Equities' National Equity Registry Forms (RNVIs).

41
dividend, and investment policies. This section reports the differences of concentration of
control as well as changes across time for 173 listed firms in 1996 and 126 corporations for
2002 that were overseen by the Superintendence of Securities. Tables 8 and 9 summarize the
results of controlling shareholders' composition and their separation ratio by type of firm’s
legal form under the cutoff of the 20 percent voting rights. There are several important results.
The first finding concerns to ultimate shareholders composition. Family controlled firms
have low weight within the study sample for both years. They represent at most 6.5% (1996)
within the total sample and they reduce to 3.3% (2002) if one restricts the sample to affiliated
firms to business groups. This outcome at first glance is opposite to what have been found in
international studies of corporate control for emerging markets. For instance, La Porta et al.
(1999) reports that family controlled firms represent 65% in Argentinean corporations and
100% for the case of Mexico for large and medium-size publicly traded firms. The results of
Claessenss et al. (2000) go in the same direction. In particular, under the 20% cutoff, family
controlled firms represent on average 58% of their study sample for East Asian Corporations.
Indonesia has the highest rate with 71.5% and Philippines the lowest with 45%. The
exception of this study is Japan, an OECD country, where family controlled firms are around
10%. Thus, the above numbers would indicate that ultimate controllers in Colombia have
similar characteristics than those in corporations trading in developed capital markets.
However, this is not the case if one takes a closer look of the data and figure out who are
behind of some type of legal societies. The business groups analyzed in section 5 showed that
holding funds or investment firms play a key role as controlling shareholders of affiliated
corporations but also as the entire holding ultimate shareholders. Family owners are hidden
within those investment firms and trust fund contracts. This also applies for an important
number of unlisted corporations and limited liability partnership firms. For instance, consider
the holding fund Union de Valores at the top of the Santo Domingo group pyramid. A main
shareholder of Bavaria company, is the Santo Domingo company CSA who by turn is the
largest shareholder of Union the Valores and that fund has the largest stake (30%) in Valores
Bavaria the other investment fund that controls all the group non-core (bear) businesses.
Hence, the Santo Domingo family is the ultimate owner of the 17 listed firms included in our
study sample as well as around 100 unlisted companies and commercial societies.

42
If one replicates the analysis for other business groups in the country, excepting the
Sindicato Antioqueño, one finds families hidden in investment firms, trust funds, and in
several types of unlisted firms22. Therefore, if one gathers all investment firms, trust fund
contracts, limited partnership and around 50% of the unlisted corporations as controlling
family firms we have that they represented for the total sample 38% in 1996 and 43% in year
2002. For affiliated firms these numbers are 51% and 56%. Those numbers doubles what is
common observed for continental Europe (18%) but still significant lower than the
Argentinean and Mexican cases as well as in East Asian countries.
The second finding is that widely held firms represent around 28% of ultimate
shareholders in 1996 despite ownership concentration within corporations. Here, the same
caveat for investment firms applies. In several cases these widely held partnerships were
unlisted firms, investment and trust funds showed up as ultimate controllers. These cases is
common to suspect that if you have 10 family members or relatives with uniform shares none
of them will have more than 10% voting rights and show up statistically as a widely held firm.
Around 40% of the widely held firms matched with investment firms, individual fiduciary
contracts and unlisted firms where families are the final owners. The remainder 60% were
truly widely held firms in the sense that the sum of minority shareholders had the largest stake
in those companies. Widely held firms decreased their participation to 10% by 2002.
The third result is that financial institutions play a limited role as controlling
shareholders in contrast the truly equity power of families as mentioned, and the significant of
ownership domestic corporations. Banks are forbidden by regulation to have direct stakes in
real sector companies. However, they make presence through subsidiary firms such as trust
funds, investment banks, and insurance companies. For both years financial institutions are
less than 10% of the controlling owners. This finding is consistent with those numbers
reported in La Porta (199) and Classensen (2000) studies. Domestic corporations are the
second source for controlling shareholders, representing around 25% for both years, and
foreign firms increased their participation as ultimate owners from 1996 to 2002. This is
22 Information regarding individual shareholders and names of investment funds is recorded in some cases at the Superintendence of Societies data base, which as mentioned is confidential for third parties. In addition, is common to find investment firms that are not registered at any Colombia’s chambers of Commerce and located in Panama City, Caiman Islands and other fiscal paradises which impede the tracing of further shareholders.
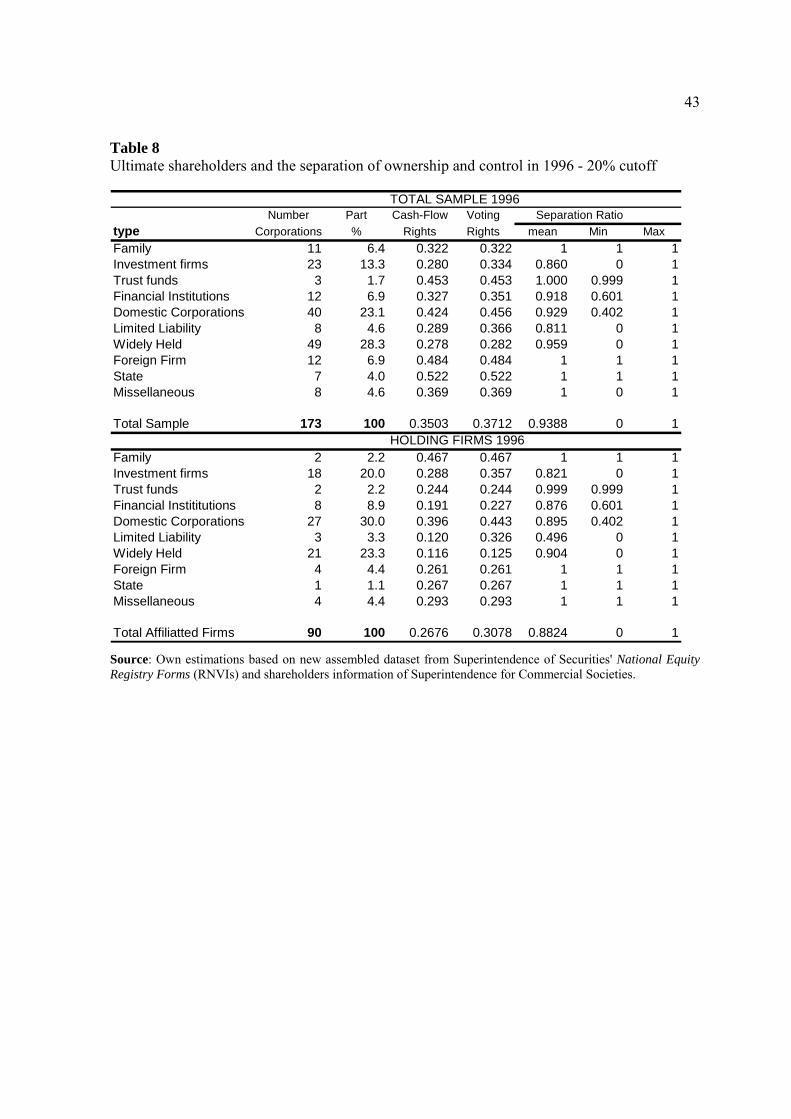
43
Table 8 Ultimate shareholders and the separation of ownership and control in 1996 - 20% cutoff
TOTAL SAMPLE 1996Number Part Cash-Flow Voting Separation Ratio
type Corporations % Rights Rights mean Min MaxFamily 11 6.4 0.322 0.322 1 1 1Investment firms 23 13.3 0.280 0.334 0.860 0 1Trust funds 3 1.7 0.453 0.453 1.000 0.999 1Financial Institutions 12 6.9 0.327 0.351 0.918 0.601 1Domestic Corporations 40 23.1 0.424 0.456 0.929 0.402 1Limited Liability 8 4.6 0.289 0.366 0.811 0 1Widely Held 49 28.3 0.278 0.282 0.959 0 1Foreign Firm 12 6.9 0.484 0.484 1 1 1State 7 4.0 0.522 0.522 1 1 1Missellaneous 8 4.6 0.369 0.369 1 0 1
Total Sample 173 100 0.3503 0.3712 0.9388 0 1HOLDING FIRMS 1996
Family 2 2.2 0.467 0.467 1 1 1Investment firms 18 20.0 0.288 0.357 0.821 0 1Trust funds 2 2.2 0.244 0.244 0.999 0.999 1Financial Instititutions 8 8.9 0.191 0.227 0.876 0.601 1Domestic Corporations 27 30.0 0.396 0.443 0.895 0.402 1Limited Liability 3 3.3 0.120 0.326 0.496 0 1Widely Held 21 23.3 0.116 0.125 0.904 0 1Foreign Firm 4 4.4 0.261 0.261 1 1 1State 1 1.1 0.267 0.267 1 1 1Missellaneous 4 4.4 0.293 0.293 1 1 1
Total Affiliatted Firms 90 100 0.2676 0.3078 0.8824 0 1 Source: Own estimations based on new assembled dataset from Superintendence of Securities' National Equity Registry Forms (RNVIs) and shareholders information of Superintendence for Commercial Societies.

44
Table 9 Ultimate shareholders and the separation of ownership and control in 2002 - 20% cutoff
TOTAL SAMPLE 2002Number Part Cash-Flow Voting Separation Ratio
type Corporations % Rights Rights mean Min MaxFamily 7 5.6 0.3866 0.3866 1 0.9999 1Investment firms 34 27.0 0.4449 0.4711 0.9119 0.1604 1Trust funds 6 4.8 0.3528 0.3534 0.9959 0.9699 1Financial Instititutions 7 5.6 0.4511 0.4511 1.0000 0.0889 1Domestic Corporations 33 26.2 0.4378 0.4686 0.8968 0 1Limited Liability 4 3.2 0.5232 0.5232 1.0000 0.9213 1Widely Held 13 10.3 0.2490 0.2947 0.9333 0.1812 1Foreign Firm 15 11.9 0.5737 0.5737 0.9999 0.9481 1State 3 2.4 0.4926 0.4931 0.9985 0.5866 1Missellaneous 4 3.2 0.2441 0.3071 1 1 1
Total Sample 126 100 0.4246 0.4465 0.9354 0 1
HOLDING FIRMS 2002Family 2 2.2 0.4183 0.4183 1 0.9999 1Investment firms 34 37.8 0.4449 0.4711 0.9119 0.1604 1Trust funds 6 6.7 0.3528 0.3534 0.9959 0.9699 1Financial Instititutions 3 3.3 0.2324 0.2324 1.0000 0.0889 1Domestic Corporations 25 27.8 0.4058 0.4464 0.8638 0 1Limited Liability 1 1.1 0.5000 0.5000 1.0000 1 1Widely Held 6 6.7 0.1390 0.2382 0.8554 0.1812 1Foreign Firm 8 8.9 0.3903 0.3904 0.9998 0.9481 1State 2 2.2 0.3401 0.3410 0.9977 0.5866 1Missellaneous 3 3.3 0.1346 0.2186 1 1 1
Total Affiliatted Firms 90 100 0.3829 0.4136 0.9096 0 1 Source: Own estimations based on new assembled dataset from Superintendence of Securities' National Equity Registry Forms (RNVIs) and shareholders information of Superintendence for Commercial Societies.
consequence of strategic alliances within groups and by the recent capital inflows experienced
across Latin American markets. Last, the role and presence of the State as ultimate owner is
limited, which is a consequence of the small size of Colombian public sector relative to their
Latin American peers23.
The fourth result regards with the voting power of controlling shareholders. On average
ultimate owners had 37% voting rights for the total sample and 31% for affiliated firms in
23 The miscellaneous category reported in ultimate controlling shareholders' tables includes private foundations, cooperatives, universities, live stock funds among other legal forms of commercial societies.

45
1996. These numbers increased to 42% and 38% in 2002. Ultimate owners have more
separation of cash flow to control voting within holding firms. On average the separation ratio
is 94% for the total sample and 89% for holding firms where there exists more voting leverage
through pyramids and cross share holdings. Investment and domestic corporations show lower
separation ratios for both years within affiliated firms meaning that they have more ownership
relations and links within business groups. One detail is that the average voting power of
widely held firms might exceed the 20% cutoff. This is because for some companies the
blocks of minority shareholders add up in some cases to 80%, and there is no information of
how many individuals form those voting blocks in order to figure out minorities’ average
voting rights. Another finding is that separation ratios have a minimum value of zero in both
years for several cases such as investment, limited liability and domestic corporations. This
means that in some companies there are controlling shareholders with zero cash flow and have
the greatest voting rights. This is a strong outcome that reinforces the previous results, and
constitutes an evidence of the real voting power leverage that takes place within business
group companies.
8. Conclusions
This paper has conduced a deep analysis about the separation of ownership and control for real
sector listed companies that were security issuers and therefore listed corporations during the
1996-2002 period in Colombia. The study provides for first time evidence for this economy of
direct measures of voting rights at the ultimate shareholder level following the modern
approach of recent studies of corporate ownership and control done for East Asia, and
European countries. It also constitute the first comprehensive case study for a Latin American
country where measures of voting rights are restricted to few cases with limited property
layers with out covering the entire business group structures.
Our findings suggest that direct ownership and direct voting blocks of the largest
shareholder has on average 35% of a company's equity. This number is 20% below the
average in continental Europe. The stake of the top-four largest shareholders is about 65%
matching the power level of largest blocks observed in countries such as Austria, Belgium,
Italy, and Spain according to the numbers reported in Becht's study of control in Corporate
46
Europe. We also found that ownership concentration has risen about 5% from 1996 to 2002
but none single voting block has the 51% absolute direct control under one share-one-vote
regime. In particular, the top four shareholders increased their direct control form 60% to 65%
from 1996 to 2002 and the fraction of firms increased from 20% to 30% where the top-four
voting blocks have between 90% to 100% a company's stake. Equity concentration of the
largest block is larger within non-affiliated firms than the ones affiliated to business groups. In
this case the largest stake is around 45% of company's total equity. Here it seems that stock
holders prefer to have direct and absolute control.
Voting leverage is implemented within affiliated firms to business groups. The
separation ratio of cash flow to voting rights is on average 0.94, similar to the levels observed
in emerging markets with high equity concentration such as Thailand. The separation
increases if one restricts such measurement to affiliated firms, the top-four share holders or at
controlling shareholders within business groups. In particular, we found that the separation
ratio for the top-four block holders was around 0.77 for the 1996-1999 period, and it
diminished to 0.74 for the 2000-2002 period, and the controlling owners of Sindicato
Antioqueño is on average 0.87, which is the largest business group in the country and a cross
share holding. Thus, strategic shareholders increase their voting power through the cross
shares and pyramids.
The analysis of controlling shareholders shows that around three-fourths of the firms
have ultimate controllers. Families are the most important source of equity power. We
decomposed ultimate owners in ten types of legal societies. We found that investment firms,
fiduciary fund contracts, and unlisted firms such as limited liability or non-traded
corporations, families are behind those property layers and in fact they are the ultimate
owners. Equity control by financial institutions is less common and this finding is consistent
with what has been found in other developed and emerging capital markets. On the other hand,
corporate control is privately biased in contrast the strong and independent management bias
typically found within American corporations. Here, owners set firm control and policies.
Concentration of cash flow rights and voting leverage constitute a natural barrier for deepen
corporate structures, develop capital markets, incentive firms to adopt codes of best practices
and the further develop of institutional channels for good corporate governance ruling. A

47
positive finding on that regard is that firm listing increased during the period and the de-listing
pattern decreased at the same time.
References
Agosin, M., and Paten, P. (2003) “Corporate Governance in Chile” Documento de Trabajo 209, Banco Central de Chile Apreda, R. (2000) “Corporate Governance in Argentina: New Development through 1991-2000” Universidad del CEMA, Mimeo. Arbelaez, M.A, S. Zuluaga, and M. Guerra. 2002. El mercado de capitales colombiano en los noventa y las firmas comisionistas de bolsa. Bogotá: Alfaomega Baldone, S, F. Brioschi, and S Paleari. 1997. "Ownership measures among firms connected by cross-shareholdings and a further analogy with input-output theory." Mimeo Politecnico di Milano. Barca, F. and M. Becht eds. 2001. The control of corporate Europe, Oxford University Press. Becht, M. 1997. "Strong blockholders, weak owners and the need for european mandatory disclosure" The separation of ownership and control: a survey of 7 european countries: 1-118: Report ECGN, Brussels Berle, A and G Means. 1932. The modern corporation and private property. London: transaction Publishers. Brioschi, F., L. Buzzachi, and M. Colombo. 1989. "Risk capital financing and the separation of ownership and control in business groups." Journal of Banking and Finance, 13, pp. 747-772. Cadbury Report (1992) “The Financial Aspects of Corporate Governance” Chapelle, A. 2004. "Separation between ownership and control: where do we stand?" Mimeo, Universite Libre de Bruxelles Chapelle, A. and A Szafarz. 2002. "Ownership and control: dissecting the pyramid." WP-CEB: 20. Claessens S., S. Djankov, and L. Larry. 2000. "The separation of ownership and control in east Asian corporations." Journal of Financial Economics, 58, pp. 81-112.

48
Claessens, S., Klingebiel, D. & Lubrano, M. (2000) “Corporate Governance Reform Issues in the Brazilian Equity Markets” Mimeo Chong, A., Izquierdo A., Micco A. & Panizza H. (2003) "Corporate Governance & Private Capital Flows to Latin America" IADB-RES WP 482 Dávila C., 2003. Empresas y empresarios en la historia de Colombia, Ediciones Uniandes, Facultad de Administración, Universidad de los Andes. Ellerman, D. 1991. "Cross ownership of corporations: a new application of input-output theory." Metroeconomica, 42:1, pp. 33-46. Echavarría J.J (1999). Crisis e Industrialización: Las lecciones de los treinta, Tercer Mundo Editores Flath, D. 1992. "Indirect shareholding within Japan's business groups" Economics Letters, 38, pp. 223-227 Franco, A. and P. De-Lombaerde. 2000. Las empresas multinacionales latinoamericanas. El caso de la inversión colombiana directa en Ecuador, México, Perú y Venezuela. Bogotá: Tercer Mundo Editores. Franks, J. and C. Mayer. 2001. "Ownership and control of german corporations." Review of Financial Studies, 14:4, pp. 943-977. Grossman S., and O. Hart. 1986. The costs and benefits of ownership: A theoy of vertical and lateral integration, Journal of Political Economy, 94: 691-719 La Porta, R., F. Lopez-de-Silanes, and A. Shleifer. 1999. "Corporate ownership around the world." Journal of Finance, 54:2, pp. 471-517 Mathewson and Winter. 1984. "An Economic Theory of Vertical Restraints", Rand Journal of Economics, Vol. 15 (Spring), pp. 27-38 Mayor-Mora A., 1989 " Historia de la industria Colombiana", in Nueva Historia de Colombia, Vol. 5, Planeta, Bogotá. Ministerio de Hacienda, Banco Mundial, y Fedesarrollo. 1996. Misión de Estudios del Mercado de Capitales, Bogotá Neto, P. 2000. “Corporate Governance Assessment: Brazil” Mimeo, Paper presented at First Meeting of the Latin American Corporate Governance Roundtable OECD. Ocampo J.A. 1991. "The transition from primary exports to industrial development in Colombia", in Diverging Paths, Blomstrom M., & Meller P. (eds.), Johns Hopkins University Press

49
Ocampo J.A. 1994. " Trade policy and industrialization in Colombia, 1967-1991", in Helleiner G., ed., Trade policy and Industrialization in Turbulent Times, Routledge, London. Pombo C. 2002 Industrialization and Industrial Policy in Colombia:A tale of economic development, Borradores de Investigación No. 23, Universidad del Rosario Rey P. and J. Tirole, 1986. "The Logic of Vertical Restraints", American Economic Review, Vol. 76, pp. 921-939. Saito, R. 2000. Differential Pricing of Equity Classes, Majority Control, and Corporate Governance: Evidence from the Brazilian Equity Market” LARC, Mimeo Silva-Colmenares, J. 2004. El gran capital en Colombia. Proyección al siglo XXI. Bogotá: Editorial Planeta. Spengler J., 1950. “Vertical Integration and Anti-Trust Policy” Journal of Political Economy, 58, pp. 347-352. Renneboog, L. 2000. "Ownership, managerial control and the governance of companies listed on the Brussels stock exchange." Journal of Banking and Finance, 24, pp. 1959-1995. Wiwattanakantang, Y. 2001. "Controling shareholders and corporate value: evidence from Thailand." Pacific-Basin Finance Journal, 9:4, pp. 323-362.
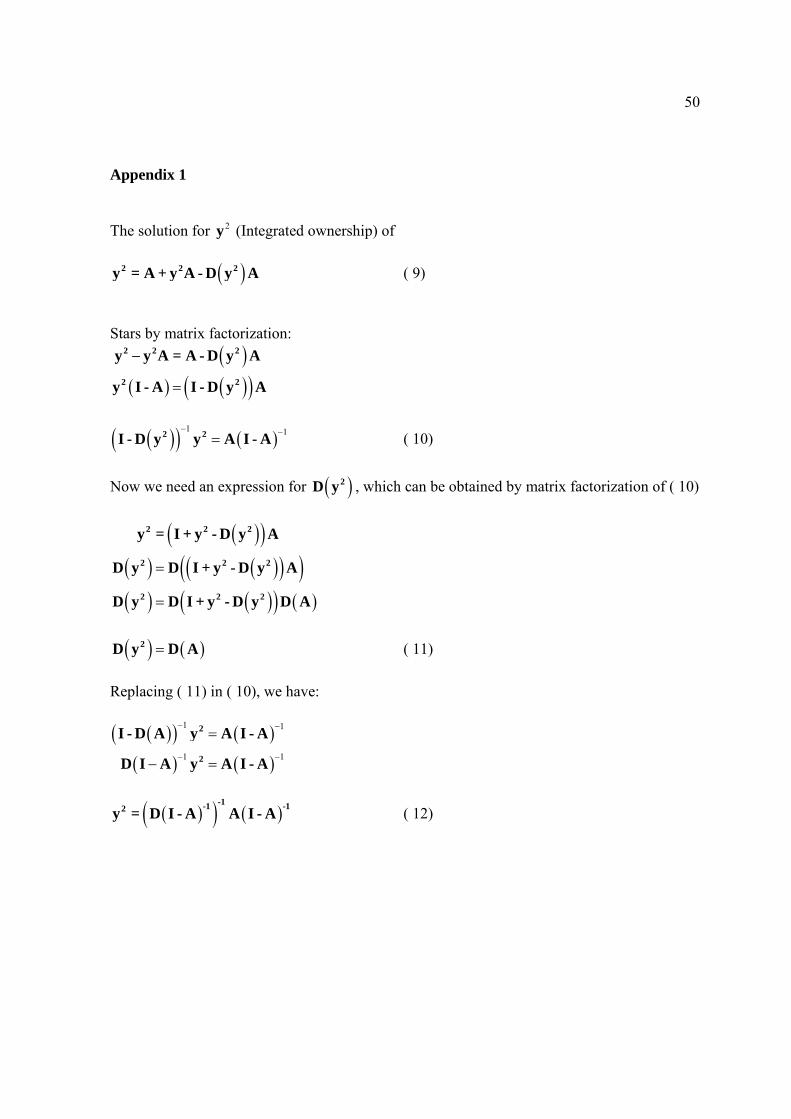
50
Appendix 1
The solution for 2y (Integrated ownership) of
( )2 2 2y = A + y A - D y A ( 9) Stars by matrix factorization:
( )( ) ( )( )−
=
2 2 2
2 2
y y A = A - D y A
y I - A I - D y A
( )( ) ( )1 1− −=2 2I - D y y A I - A ( 10)
Now we need an expression for ( )2D y , which can be obtained by matrix factorization of ( 10)
( )( )( ) ( )( )( )( ) ( )( ) ( )
=
=
2 2 2
2 2 2
2 2 2
y = I + y - D y A
D y D I + y - D y A
D y D I + y - D y D A
( ) ( )=2D y D A ( 11)
Replacing ( 11) in ( 10), we have:
( )( ) ( )( ) ( )
1 1
1 1
− −
− −
=
− =
2
2
I - D A y A I - A
D I A y A I - A
( )( ) ( )-1-1 -12y = D I - A A I - A ( 12)