Owen Byrd Chief Evangelist & General Counsel
75
Owen Byrd Chief Evangelist & General Counsel Brian C. Howard Legal Data Scientist & Director of Analytics Services Jason Maples Legal Data Analyst
Transcript of Owen Byrd Chief Evangelist & General Counsel

Owen Byrd Chief Evangelist & General Counsel
Brian C. HowardLegal Data Scientist & Director of Analytics Services
Jason Maples Legal Data Analyst

Executive Summary
Total Cases
Damages for patent infringement in U.S. District Court cases are awarded infrequently. Out of 36,629 patent cases filed and terminated from 2000 through 2013, only 708 cases (1.9%) involved compensatory damages awards.
Total and Median Awards
While relatively few patent cases involve damages awards, total awards made in these cases involve significant dollar amounts. Over $15 billion in dam-ages, fees, costs and interest have been awarded over the past 14 years. This total includes over $13 billion in compensatory damages, almost $1 billion in enhanced damages and over $200 million in attorneys’ fees.
Total and median damages awards have been increasing during this period, though not at steady rates. When total damages are viewed on a percentage basis, the portion attributable to reasonable royalties generally exceeds the por-tion attributable to lost profits.
The percentile plots show how, for reasonable royalties and lost profits awards (and compensatory damages as whole), damages drop off rapidly after the top awards: while each has a maximum over $1 billion, 90% of those awards are under approximately $50 million, 75% under approximately $10 million, and half under approximately $2 million. Enhanced damages (maximum of $152 million, 90% under $15.3 million, 75% under $2.3 million, and half under $475,000) and awards of attorneys’ fees (maximum of $11.4 million, 90% under $2 million, 75% under $410,000 and half under $43,000) followed a similar distribution.
Largest Awards
The largest damages awards by type show significant variability. Three cases involving awards of $1 billion or more (Centocor v. Abbott Laboratories, Carn-egie Mellon University v. Marvell, Monsanto v. DuPont) top the list of the 10 largest compensatory damages awards, while the remaining seven cases involve awards ranging from $328 million to $482 million. Below these “big-three” $1 billion cases, top reasonable royalties damages awards range from $156
Introduction
This report surveys the landscape of patent litigation damages awarded in U.S. District Court cases filed from January 1, 2000 through December 31, 2013. It analyzes these damages awards across districts, judges, parties and law firms. To gain greater insight, this report focuses primarily on compensatory damages (both reasonable royalties and lost profits), enhanced dam-ages, and awards of attorneys’ fees.
The last few years have seen some of the largest awards in patent litigation history - awards that have captured headlines and brought patent damages into mainstream public debate. This report seeks to inform that debate and provide patent litigators with information they can use to set litiga-tion strategies, develop case tactics, and produce results.
Lex Machina – Patent Litigation Damages Report i

million to $482 million, while top lost profits awards range from $57 million to $248 million. Most of these largest awards (8/10 compensatory, 7/10 reasonable royalties, 8/10 lost profits) occurred in the past five years (2009-2013), evidencing the upward trend in the size of awards.
Top enhanced damages awards range from $25 million to $152 million. Top at-torneys’ fees awards range from $5.6 million to $11.4 million.
Comparing total and median compensatory damages awards to total terminated cases also shows an overall upward trend, especially since 2008. The upward trend for total enhanced damages tracks the upward trend in terminated cases more closely than any other damages type. Total attorneys’ fees awards have been some-what trending downward since 2009.
District Courts
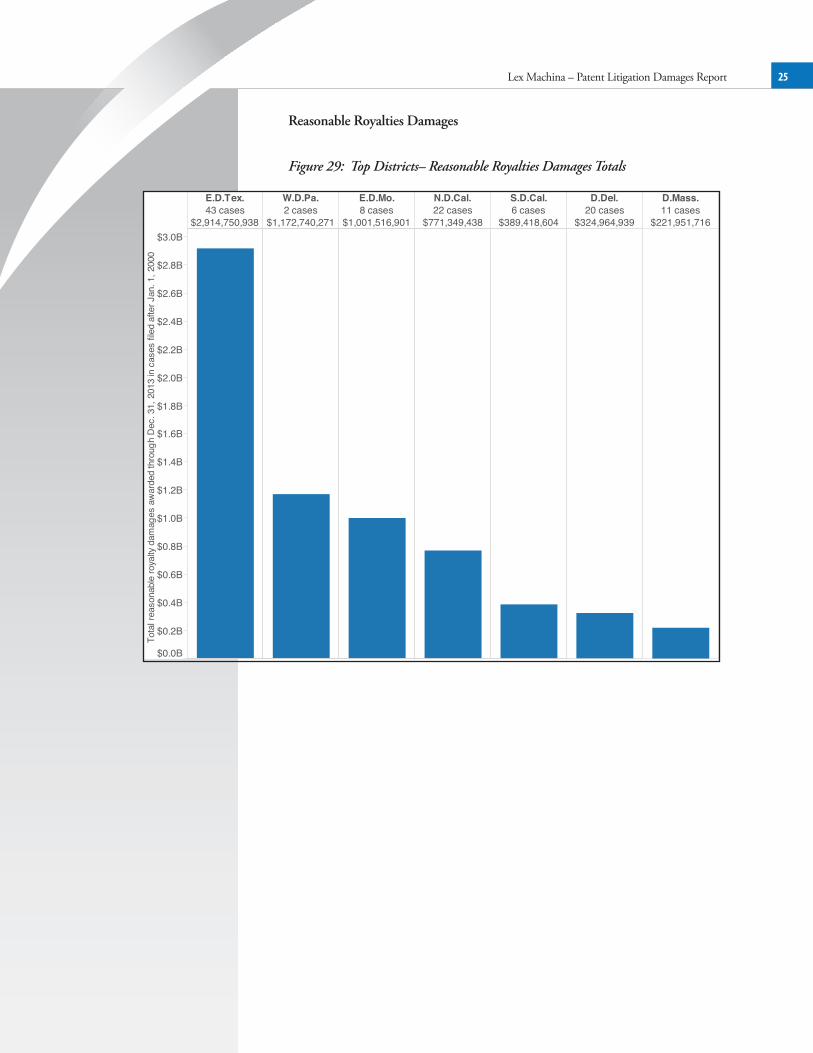
No surprise here for patent litigators: Cases filed in the Eastern District of Texas have generated the most awards of compensatory damages (84 cases), total com-pensatory damages (over $5 billion of $13 billion national total, or 38%), total reasonable royalties damages ($2.9 billion of $8 billion national total, or 36%), total lost profits damages ($1.4 billion of $2.7 billion national total, or 52%) and total enhanced damages ($232 million of $989 million national total, or 23%) than cases filed in any other district over the past 14 years.
Districts with far fewer total patent cases, however, top all lists of median damages awards:
Median Compensatory Damages
District of Kansas - $34.8 million (2 cases)
Median Reasonable Royalties Damages
Western District of Pennsylvania - $586 million (2 cases)
Median Lost Profits Damages
Western District of Wisconsin - $38 million (2 cases)
Median Enhanced Damages
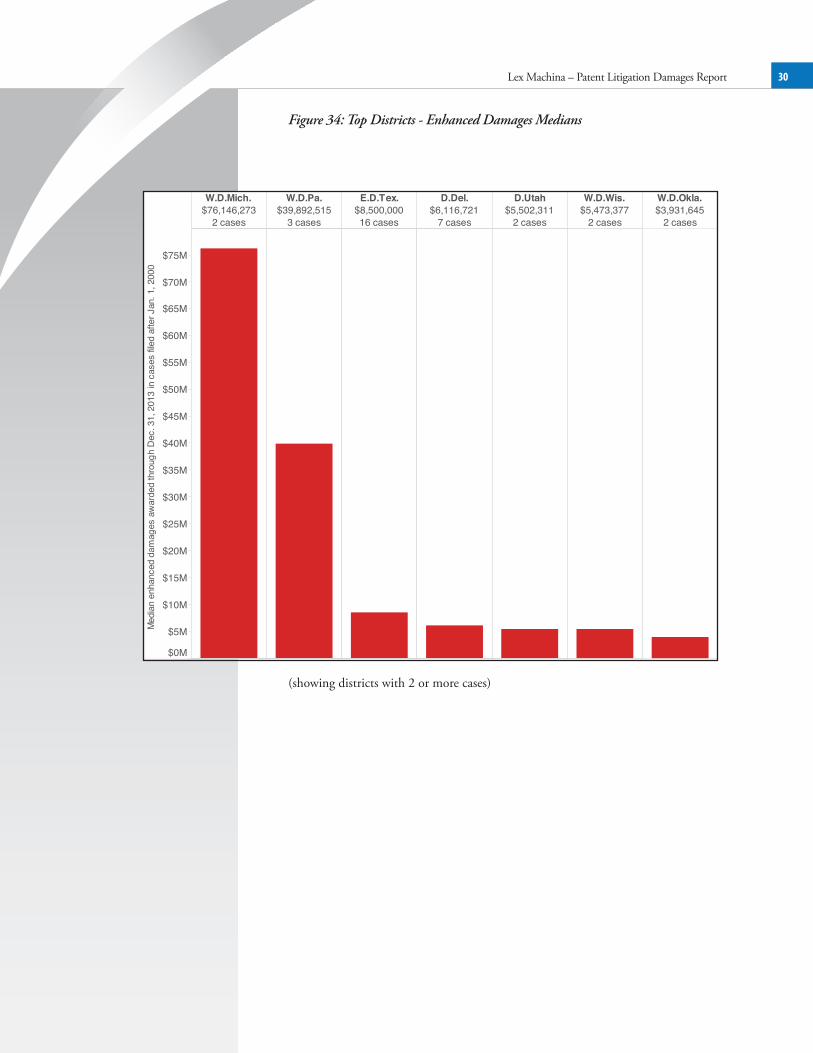
Western District of Michigan - $76.1 million (2 cases)
Top attorneys’ fees awards by district also involve districts other than the Eastern District of Texas. The Southern District of New York tops the list of total awards at $34.4 million (14 cases), while the Western District of Pennsylvania tops the list of median awards at $4.7 million (2 cases).
Judges
Four of the seven judges who have awarded the most total compensatory damages are from the Eastern District of Texas: Judges Michael Schneider ($2.3 billion/9 cases), T. John Ward ($1 billion/19 cases), Leonard Davis ($956 million/18 cases) and James Gilstrap ($609 million/15 cases).
The same four Eastern District of Texas judges also appear on the list of top seven total reasonable royalties damages awarded, while Judge Schneider also tops the list of total lost profits damages awarded.
Lex Machina – Patent Litigation Damages Report ii

Judges on the list of top median compensatory damages awards range from Judge Marilyn Huff from the Southern District of California ($188 million/2 cases) to Judge Edward Chen from the Northern District of California ($57 million/3 cases). Judge E. Richard Webber from the Eastern District of Missouri tops the list of median reasonable royalties damages awards ($500 million/2 cases), while Judge Schneider makes another appearance in a top spot, this time for median lost profit damages awards ($589 million/2 cases).
Judges awarding the most total enhanced damages awards range from Judge Robert Jonker of the Western District of Michigan ($152 million/1 case) to Judge Dolly Gee of the Central District of California ($58 million/1 case). Top spots for awards of median enhanced damages range from Judge Kent Jordan of the District of Delaware ($73 million/2 cases) to Judge Garrett Brown of the District of New Jersey ($7.4 million/2 cases).
Judge Denise Cole of the Southern District of New York awarded the most total attorneys’ fees ($16.8 million/3 cases), while Judge Mariana Pfaeizer of the Central District of California topped the list of the largest median attorneys’ fees awards ($6.9 million/2 cases).
Parties
Calculating compensatory damages won per terminated case identifies the top parties (with five or more terminated cases) that show a sustained ability to win patent damages awards. Centocor tops the list at $278 million per case (6 cases). New York University (NYU) is second at $209 million per case (8 cases). The remaining eight parties in the top 10 won between $13.6 million and $94 million per case.
Monsanto has the most cases with compensatory damages awards won, an amaz-ing 71, with a total of $1.02 billion and median of $127,500. Parties with the next most total wins are all in the single digits: Ovidian and Phillips each won six cases, ArrivalStar and Directed Electronics each won five, East-West Trading won four and seven parties each won three.
Centocor and NYU top the list of parties with the most compensatory damages won, with $1.6 billion each. Carnegie Mellon University and Monsanto both also won more than $1 billion in compensatory damages. All top 20 parties with the most compensatory damages won received awards of $128 million or more.
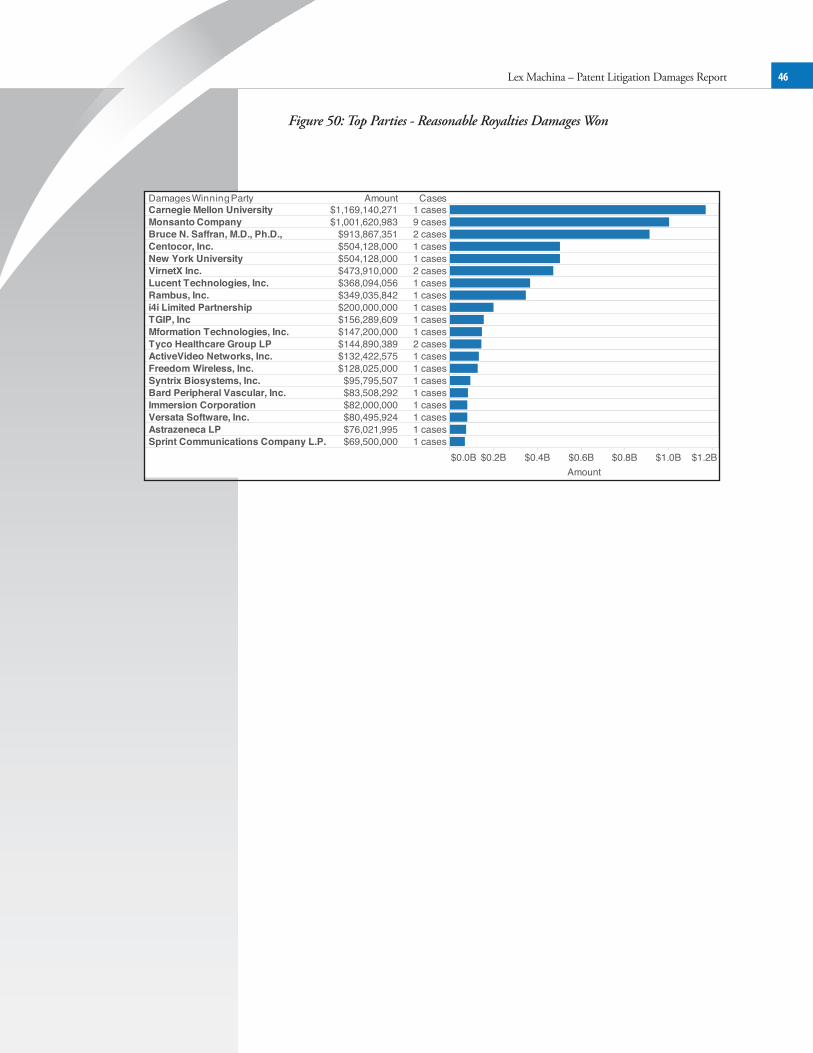
Inventor Bruce N. Saffran M.D., Ph.D., joins Carnegie Mellon, Monsanto, Cento-cor and NYU in the top five of reasonable royalties damages won, all above $500 million.
The list of parties with the most lost profits damages won is also lead by Centocor and NYU, both with awards greater than $1 billion. Versata Software, General Electric, Bard Peripheral Vascular and Warsaw Orthopedic all won lost profits awards of between $100 million and $250 million.
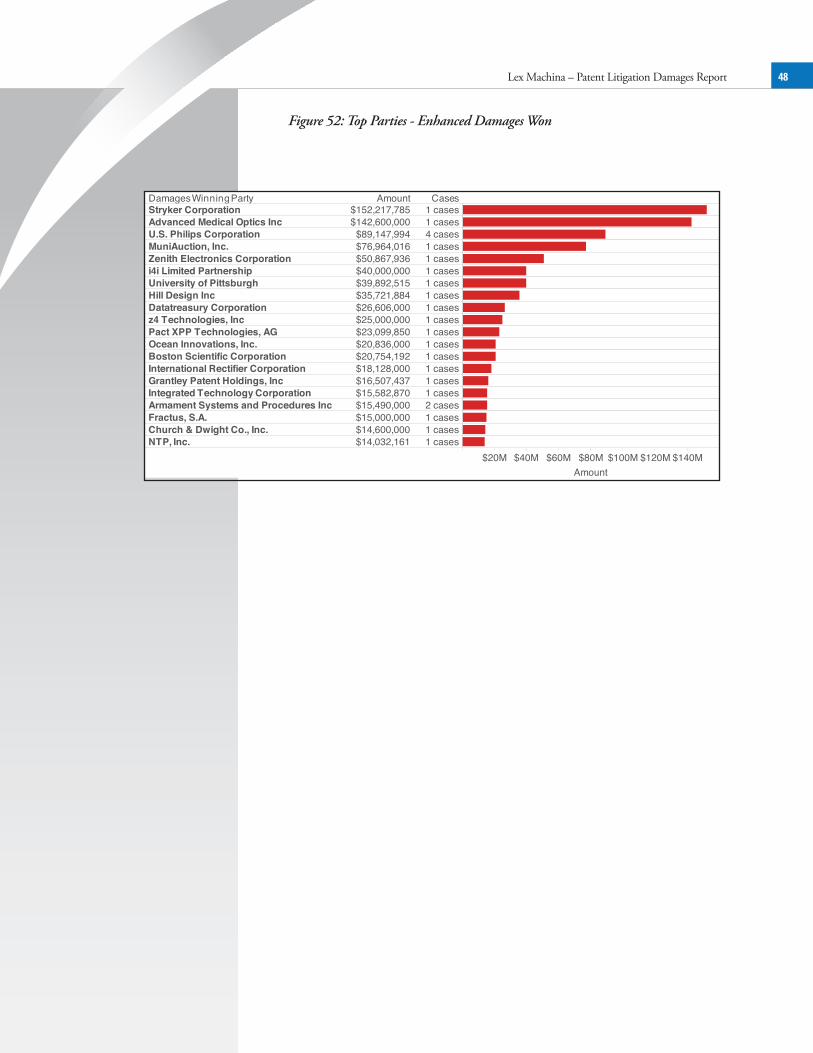
Stryker Corporation ($152 million), Advanced Medical Optics ($142 million), U.S. Phillips ($89.1 million), Muniauction ($76.9 million), and Zenith ($50.8 mil-lion) top the list of parties with the most enhanced damages won.
Parties with the most attorneys’ fees won include Takeda Chemical ($16.8 mil-lion), University of Pittsburgh ($9.2 million), Stryker Corporation ($8 million) and 17 more parties with over $3 million.
The roster of parties with the most cases lost and largest totals of different damages types lost includes both well-known and more obscure companies and inventors.
Lex Machina – Patent Litigation Damages Report iii

Lex Machina – Patent Litigation Damages Report iv
Microsoft has six cases with compensatory damages awards lost, for a total of $857 million and median of $110 million. Abbott Laboratories, Cordis and Dell each lost four cases and Apple, Arthrex, Cisco and Hyundai each lost three.
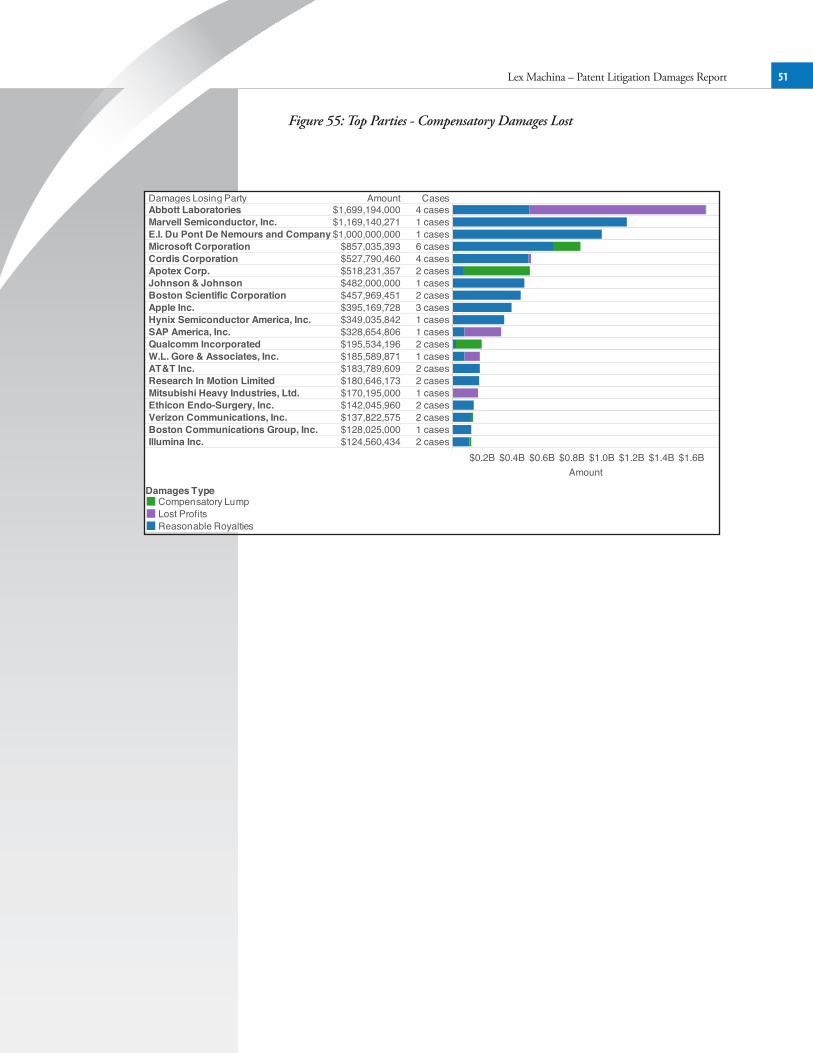
Abbott Laboratories, Marvell Semiconductor and DuPont lead the list of parties with the most compensatory damages lost, each with more than $1 billion. Twen-ty parties have lost more than $112 million in compensatory damages awards.
Marvell Semiconductor and DuPont also top the list of reasonable royalties dam-ages lost, again more than $1 billion each. Twenty parties have lost more than $76 million in reasonable royalties damages awards.
Abbott Laboratories also leads the list of parties with lost profits damages lost. Its $1.17 billion total towers above SAP America at $248 million, Mitsubishi Heavy Industries at $166 million, W.L. Gore at $102 million and Nuvasive at $101 million. Twenty parties have lost more than $20 million in lost profits damages award.
Zimmer ($152 million) and Alcon Manufacturing ($142 million) have the most enhanced damages lost and the only awards above $100 million. Twenty parties have lost more than $12 million in enhanced damages awards.
Parties with the most attorneys’ fees lost are led by Mylan Pharmaceuticals, with $11.4 million. Twenty parties have lost more than $3.7 million in attorneys’ fees awards.
Law Firms
Just as with parties, calculating compensatory damages won per terminated case identifies the top law firms (with five or more terminated cases) with a sustained ability to win patent damages awards. Three firms have won more than $60 mil-lion per case: Caldwell Cassady & Curry tops the list at $80.8 million per case (7 cases), followed by Stokes Roberts & Wagner at $73.6 million (6 cases) and Haar & Woods at $66.6 million per case (15 cases). The remaining law firms in the top 10 won between $20 million and $38 million per case.
Husch Blackwell has 45 cases with compensatory damages awards won, with a total of $1.09 billion and median of $183,639. Law firms with the next most total wins are Thompson Coburn (30 cases, $23.1 million total, $155,170 median), McKool Smith (23 cases, $2.04 billion total, $19 million median), Fish & Rich-ardson (22 cases, $162.3 million total, $2.9 million median) and Frilot (19 cases, $11.1 million total, $200,000 median).
McKool Smith tops the list of law firms with the most compensatory damages won, with $2 billion in 23 cases. Five other firms won more than $1.6 billion in compensatory damages: Sayles Werbner ($1.736 billion), Woodcock Washburn ($1.695 billion), Beck Redden & Secrest ($1.691 billion), Akin Gump ($1.674 bil-lion) and Millberg Gordon Stewart ($1.672 billion).
Twenty-one law firms have total reasonable royalties damages won of more than $500 million, led by McKool Smith with $1.388 billion.
Twenty-five law firms have total lost profits damages won of more than $102 mil-lion, led by Woodcock Washburn with $1.187 billion.
Twenty law firms have total enhanced damages won of more than $55 million, led by McAndrews, Held & Malloy and Miller Johnson with $152 million each.
Twenty-two law firms have total attorneys’ fees won of more than $5.4 million, led by Edwards Wildman with $26 million.

Data Included In, and Excluded From, This Report
Lex Machina’s U.S. District Court data includes all patent cases filed beginning on January 1, 2000.
This report analyzes both total (cumulative) and median1 damages awarded on, or prior to, December 31, 2013, in cases filed beginning on January 1, 2000.It’s important to note that it often take two years or more after the date of filing for a case to generate a damages award.
Because cases filed prior to January 1, 2000, are not included in this report, neither are their damages awards, even if such awards were made on or after January 1, 2000.
In other words, we had to start somewhere, and whatever start date we chose would necessarily result in incomplete data about damages awards made in the years immediately following the start date. So we assume that, in the period 2000-2002, courts made damages awards that are not contained in the data presented in this report.
Data Included
• Compensatory Damages
• Compensatory damages are awarded to compensate the patentee - to place him in the position he would be in had the infringement not occurred.
• Compensatory damages are sub-coded as reasonable royalties, lost profits, or compensatory lump.
• Reasonable Royalties: The statute governing damages for patent infringe-ment specifies that the patentee shall receive “in no event less than a reasonable royalty for the use made of the invention by the infringer.”2
• Lost Profits: A patentee may also obtain as damages the profits from sales he would have made absent infringement if he can meet the higher burden of proof defined as the Panduit factors: (1) demand for the pat-ented product, (2) absence of acceptable noninfringing substitutes, (3) his manufacturing and marketing capability to exploit the demand, and (4) the amount of profit he would have made.3
• Compensatory Lump: Where a damages award is clearly compensa-tory but the specific sub-type (reasonable royalties or lost profits) is not specified or the apportionment of the award between sub-types is not specified, we have coded the award as a compenstory lump.
1 To provide data useful to attorneys, parties and others forming an expectation, median graphs in this report exclude entities where the median is based on fewer than two cases. For example, districts with fewer than two cases are excluded from the median graphs in the District Courts section; judges with fewer than two cases are excluded from the median graphs in the Judges section.2 35 U.S.C. § 2843 Panduit Corp. v. Stalin Bros. Fibre Works, Inc., 575 F.2d 1152, 1156 (6th Cir. 1978).
Lex Machina – Patent Litigation Damages Report v

• Enhanced Damages
• Awarded for willful patent infringement, where the judge has discretion to “in-crease the damages up to three times the amount found or assessed.”4
• Calculation of enhanced damages is exclusive to the underlying compensatory damages. For example, a judge awards $1 million in compensatory damages, plus an additional $2 million in enhanced damages.
• Attorneys’ Fees
• In exceptional cases, a judge has discretion to award as damages to the prevailing party the recovery of reasonable attorneys’ fees.5
• All prevailing-party fee awards are included, regardless of who won the case (pat-ent rights holder or accused infringer).
• Sanctions under F.R.C.P. Rules 11 or 37 are not included because the standard for sanctions under those rules differ from the standard for awards of attor-neys’ fees under U.S.C. § 285.
• Default Judgments
• When a party fails to appear, or fails to respond to a dispositive motion, the relief requested in the complaint may be granted and result in damages.
• Consent Judgments
• A consent judgment occurs when the parties agree to have the court enter a judg-ment against one party. Because consent judgments are legally enforceable judgments and often occur late in the litigation, they are included to provide more complete data.
Data Excluded
To more accurately quantify the economics of damages awards in the U.S. District Courts, this report excludes:
• Cases awarding only equitable relief (e.g, an injunction)
• Appeals
• Although we hope to include Federal Circuit data in the future, this report is limited to the actions of the district courts to best help readers understand the actual (rather than the legally proper) behavior of those courts. Therefore, this report does not contain data on whether or not damages awarded by district courts were ultimately modified (or overturned) on appeal, or on outcomes in the district courts on remand.
• Cross-Category Damages
• A cross-category damages award is one awarded on the basis of different claim types, without apportionment of the amount among those claim types, (or where documents specifying the types/apportionment are not available). For example, the much-publicized $290 million award in the November 2013 Apple v. Samsung case (N.D. Cal., 5:11-cv-01846-LHK) was not apportioned between patent infringement and trade-dress infringement; thus LMI classifies this award as cross-category.
4 35 U.S.C. § 2845 35 U.S.C. § 284
Lex Machina – Patent Litigation Damages Report vi

A Special Note: Law Firms With Attorneys Admitted Pro Hac Vice, Especially in the District of Delaware
Lex Machina has recently become aware of a flaw in the way that the PACER (Public Access to Court Electronic Records) service, which is the source of the raw district court data in our system, encodes data for certain pro hac vice attorneys (attorneys not admitted to practice in a certain jurisdiction, who are allowed to participate in a particular case).
This flaw causes some attorneys and their law firms to be omitted from PACER’s counsel records for certain cases, or to be displayed with an unconventional format. This problem appears to affect only a small number of attorneys and law firms. We are working to revise our data to account for this anomaly.
Nonetheless, as the problem disproportionately affects attorneys who are members of national law firms appearing in cases in the District of Delaware, we note it here. It may impact the data contained in this report, especially the section about law firms.
Lex Machina – Patent Litigation Damages Report vii

Lex Machina – Patent Litigation Damages Report viii
Table of Contents
Executive Summary i
Data Included In, and Excluded From, This Report vi
Table of Contents ix
Overview 1
Figure 1: Cases 1Figure 2: Damages Totals by Type 1Figure 3: Total Damages by Year 2Figure 4: Total Damages by Year (Data) 3Figure 5: Total Damages by Year - Percentages 4Figure 6: Median Damages by Year 5Figure 7: Median Damages by Year (Data) 6Figure 8: Compensatory Damages - Percentiles 7Figure 9: Reasonable Royalties Damages - Percentiles 7Figure 10: Lost Profits Damages - Percentiles 7Figure 11: Enhanced Damages - Percentiles 8Figure 12: Attorneys’ Fees - Percentiles 8Figure 13: Reasonable Royalties, Lost Profits, Enhanced Damages and Attorneys’ Fees - Comparison of Percentiles and Maximum
9
Largest Damages Awards 10
Figure 14: Top 10 Compensatory Damages Awards 10Figure 15: Top 10 Reasonable Royalties Damages Awards 11Figure 16: Top 10 Lost Profits Damages Awards 12Figure 17: Top 10 Enhanced Damages Awards 13Figure 18: Top 10 Attorneys’ Fees Awards 14
Damages Awards Compared to Total Terminated Cases 15
Compensatory Damages 15
Figure 19: Compensatory Damages - Totals and Medians by Year 15Figure 20: Compensatory Damages - Totals Compared to Total Terminated Cases
16
Figure 21: Compensatory Damages - Medians Compared to Total Terminated Cases
17
Enhanced Damages 18
Figure 22: Enhanced Damages - Totals Compared to Total Terminated Cases
18
Figure 23: Enhanced Damages - Medians Compared to Total Terminated Cases
19
Attorneys’ Fees 20
Figure 24: Attorneys’ Fees - Totals Compared to Total Terminated Cases 20

Lex Machina – Patent Litigation Damages Report ix
Figure 25: Attorneys’ Fees - Medians Compared to Total Terminated Cases
21
District Courts 22
Figure 26: All Districts – Total Cases With Compensatory Damages 22
Compensatory Damages 23
Figure 27: Top Districts – Compensatory Damages Totals 23Figure 28: Top Districts - Compensatory Damages Medians 24
Reasonable Royalties Damages 25
Figure 29: Top Districts– Reasonable Royalties Damages Totals 25Figure 30: Top Districts - Reasonable Royalties Damages Medians 26
Lost Profits Damages 27
Figure 31: Top Districts - Lost Profits Damages Totals 27Figure 32: Top Districts - Lost Profits Damages Medians 28
Enhanced Damages 29
Figure 33: Top Districts - Enhanced Damages Totals 29Figure 34: Top Districts - Enhanced Damages Medians 30
Attorneys’ Fees 31
Figure 35: Top Districts – Attorneys’ Fees Totals 31Figure 36: Top Districts – Attorneys’ Fees Medians 32
Judges 33
Compensatory Damages 33
Figure 37: Top Judges - Compensatory Damages Totals 33Figure 38: Top Judges - Compensatory Damages Medians 34
Reasonable Royalties Damages 35
Figure 39: Top Judges – Reasonable Royalties Damages Totals 35Figure 40: Top Judges – Reasonable Royalties Damages Medians 36
Lost Profits Damages 37
Figure 41: Top Judges – Lost Profits Damages Totals 37Figure 42: Top Judges – Lost Profits Damages Medians 38
Enhanced Damages 39
Figure 43: Top Judges – Enhanced Damages Totals 39Figure 44: Top Judges – Enhanced Damages Medians 40
Attorneys’ Fees 41
Figure 45: Top Judges – Attorneys’ Fees Totals 41Figure 46: Top Judges – Attorneys’ Fees Medians 42

Lex Machina – Patent Litigation Damages Report x
Parties 43
Figure 47: Top Parties – Compensatory Damages Won per Terminated Case
43
Damages Won 44
Figure 48: Top Parties – Total Cases With Compensatory Damages Won
44
Figure 49: Top Parties - Compensatory Damages Won 45Figure 50: Top Parties - Reasonable Royalties Damages Won 46Figure 51: Top Parties – Lost Profits Damages Won 47Figure 52: Top Parties - Enhanced Damages Won 48Figure 53: Top Parties – Attorneys’ Fees Won 49
Damages Lost 50
Figure 54: Top Parties – Total Cases With Compensatory Damages Lost 50Figure 55: Top Parties - Compensatory Damages Lost 51Figure 56: Top Parties - Reasonable Royalties Damages Lost 52Figure 57: Top Parties – Lost Profits Damages Lost 53Figure 58: Top Parties – Enhanced Damages Lost 54Figure 59: Top Parties – Attorneys’ Fees Lost 55
Law Firms 56
Figure 60: Top Law Firms – Compensatory Damages Won per Terminated Case
56
Damages Won 57
Figure 61: Top Law Firms – Total Cases With Compensatory Damages Won
57
Figure 62: Top Law Firms - Compensatory Damages Won 58Figure 63: Top Law Firms - Reasonable Royalties Damages Won 59Figure 64: Top Law Firms – Lost Profits Damages Won 60Figure 65: Top Law Firms - Enhanced Damages Won 61Figure 66: Top Law Firms – Attorneys’ Fees Won 62
The Lex Machina Data Advantage 63

Overview
Figure 1: Cases
Case Sets Number of Cases
Percent of Cases Terminated
Cases Terminated 2000-2013 36,629 100%
Cases Terminated; Reached Merits Decision(e.g. summary judgment or trial)
5,098 13.9%
Cases Terminated; Reached Merits Decision; Damages, Attorneys’ Fees and/or Costs Awarded
1,392 3.8%
Cases Terminated; Reached Merits Decision; Compensatory Damages, Enhanced Damages and/or Attorneys’ Fees Awarded
883 2.4%
Cases Terminate; Reached Merits Decision;Compensatory Damages Awarded
708 1.9%
Figure 2: Damages Totals by Type
Compensatory Damages
Reasonable Royalties $8,054,107,352
Lost Profits $2,737,432,416
Compensatory Lump $2,255,161,843
Total Compensatory Damages $13,046,701,611
Enhanced Damages $989,152,808
Attorneys’ Fees $218,895,261
Costs $45,193,015
Prejudgment Interest $1,137,662,614
Total Damages $15,437,605,309
Lex Machina – Patent Litigation Damages Report 1

Figure 3: Total Damages by Year
Because the dataset for this report is limited to cases filed after January 1, 2000, and most cases take more than two years from filing to reach the damages phase, damages totals shown in this report for 2000 and 2001 can be assumed to underreport the actual totals.
Lex Machina – Patent Litigation Damages Report 2
Year
2000 2001 2002 2003 2004 2005 2006 2007 2008 2009 2010 2011 2012 2013$0.0B
$0.2B
$0.4B
$0.6B
$0.8B
$1.0B
$1.2B
$1.4B
$1.6B
$1.8B
$2.0B
$2.2B
$2.4B
$2.6B
$2.8B
$3.0B
$3.2BTo
tal d
amag
es
Damages TypeReasonable RoyaltiesLost ProfitsCompensatory LumpEnhanced DamagesAttorneys' feesCostsPrejudgment Interest
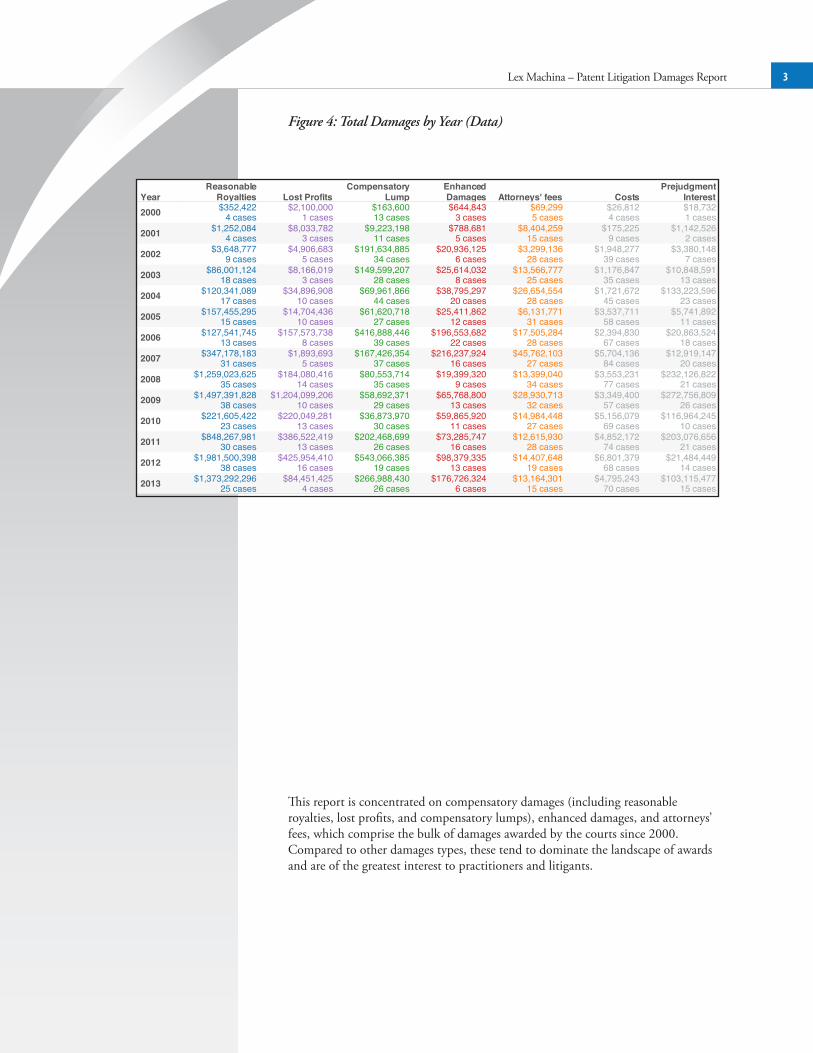
Figure 4: Total Damages by Year (Data)
This report is concentrated on compensatory damages (including reasonable royalties, lost profits, and compensatory lumps), enhanced damages, and attorneys’ fees, which comprise the bulk of damages awarded by the courts since 2000. Compared to other damages types, these tend to dominate the landscape of awards and are of the greatest interest to practitioners and litigants.
Lex Machina – Patent Litigation Damages Report 3
YearReasonable
Royalties Lost ProfitsCompensatory
LumpEnhancedDamages Attorneys' fees Costs
PrejudgmentInterest
2000
2001
2002
2003
2004
2005
2006
2007
2008
2009
2010
2011
2012
2013 $103,115,47715 cases
$21,484,44914 cases
$203,076,65621 cases
$116,964,24510 cases
$272,756,80926 cases
$232,126,82221 cases
$12,919,14720 cases
$20,863,52418 cases
$5,741,89211 cases
$133,223,59623 cases
$10,848,59113 cases
$3,380,1487 cases
$1,142,5262 cases
$18,7321 cases
$4,795,24370 cases
$6,801,37968 cases
$4,852,17274 cases
$5,156,07969 cases
$3,349,40057 cases
$3,553,23177 cases
$5,704,13684 cases
$2,394,83067 cases
$3,537,71158 cases
$1,721,67245 cases
$1,176,84735 cases
$1,948,27739 cases
$175,2259 cases
$26,8124 cases
$13,164,30115 cases
$14,407,64819 cases
$12,615,93028 cases
$14,984,44827 cases
$28,930,71332 cases
$13,399,04034 cases
$45,762,10327 cases
$17,505,28428 cases
$6,131,77131 cases
$26,654,55428 cases
$13,566,77725 cases
$3,299,13628 cases
$8,404,25915 cases
$69,2995 cases
$176,726,3246 cases
$98,379,33513 cases
$73,285,74716 cases
$59,865,92011 cases
$65,768,80013 cases
$19,399,3209 cases
$216,237,92416 cases
$196,553,68222 cases
$25,411,86212 cases
$38,795,29720 cases
$25,614,0328 cases
$20,936,1256 cases
$788,6815 cases
$644,8433 cases
$266,988,43026 cases
$543,066,38519 cases
$202,468,69926 cases
$36,873,97030 cases
$58,692,37129 cases
$80,553,71435 cases
$167,426,35437 cases
$416,888,44639 cases
$61,620,71827 cases
$69,961,86644 cases
$149,599,20728 cases
$191,634,88534 cases
$9,223,19811 cases
$163,60013 cases
$84,451,4254 cases
$425,954,41016 cases
$386,522,41913 cases
$220,049,28113 cases
$1,204,099,20610 cases
$184,080,41614 cases
$1,893,6935 cases
$157,573,7388 cases
$14,704,43610 cases
$34,896,90810 cases
$8,166,0193 cases
$4,906,6835 cases
$8,033,7823 cases
$2,100,0001 cases
$1,373,292,29625 cases
$1,981,500,39838 cases
$848,267,98130 cases
$221,605,42223 cases
$1,497,391,82838 cases
$1,259,023,62535 cases
$347,178,18331 cases
$127,541,74513 cases
$157,455,29515 cases
$120,341,08917 cases
$86,001,12418 cases
$3,648,7779 cases
$1,252,0844 cases
$352,4224 cases

Figure 5: Total Damages by Year (Percentages)
Lex Machina – Patent Litigation Damages Report 4

Lex Machina – Patent Litigation Damages Report 5
Figure 6: Median Damages by Year
Year
2000 2001 2002 2003 2004 2005 2006 2007 2008 2009 2010 2011 2012 2013$0M
$1M
$2M
$3M
$4M
$5M
$6M
$7M
$8M
$9M
$10M
$11M
$12M
Damages TypeReasonable RoyaltiesLost ProfitsCompensatory LumpEnhanced DamagesAttorneys' feesCostsPrejudgment Interest

Lex Machina – Patent Litigation Damages Report 6
Figure 7: Median Damages by Year (Data)
YearReasonable
Royalties Lost ProfitsCompensatory
LumpEnhancedDamages Attorneys' fees Costs
PrejudgmentInterest
2000
2001
2002
2003
2004
2005
2006
2007
2008
2009
2010
2011
2012
2013 $1,362,98215 cases
$88,37214 cases
$823,25021 cases
$320,14610 cases
$955,91526 cases
$369,11121 cases
$62,28520 cases
$87,97318 cases
$130,67311 cases
$82,53323 cases
$327,41013 cases
$13,4167 cases
$571,2632 cases
$18,7321 cases
$19,34270 cases
$28,76968 cases
$20,98474 cases
$11,02769 cases
$21,94757 cases
$19,05177 cases
$29,02484 cases
$7,68367 cases
$19,26458 cases
$15,86745 cases
$16,53635 cases
$10,90439 cases
$9,4869 cases
$3734 cases
$199,28115 cases
$36,90719 cases
$88,62928 cases
$63,53427 cases
$73,97532 cases
$35,92634 cases
$225,00027 cases
$37,36928 cases
$36,40931 cases
$132,97528 cases
$109,86225 cases
$9,45728 cases
$36,60815 cases
$9,7655 cases
$698,9656 cases
$137,50013 cases
$540,50016 cases
$265,84011 cases
$1,200,00013 cases
$306,6699 cases
$504,71716 cases
$729,17422 cases
$372,44312 cases
$513,00020 cases
$604,5688 cases
$203,7076 cases
$40,0005 cases
$86,5603 cases
$669,58426 cases
$1,018,52919 cases
$437,50026 cases
$129,96030 cases
$183,63929 cases
$125,00035 cases
$300,00037 cases
$139,53039 cases
$240,00027 cases
$147,50044 cases
$107,06828 cases
$51,93734 cases
$20,00011 cases
$5,00013 cases
$5,000,0004 cases
$2,800,00016 cases
$2,358,61313 cases
$3,300,50313 cases
$3,721,24810 cases
$1,085,59614 cases
$150,0005 cases
$1,907,0128 cases
$157,50010 cases
$1,119,58210 cases
$866,0003 cases
$69,7985 cases
$14,3283 cases
$2,100,0001 cases
$403,00025 cases
$2,715,11638 cases
$860,00030 cases
$457,98723 cases
$5,404,50038 cases
$2,539,46835 cases
$321,34031 cases
$400,59713 cases
$850,00015 cases
$245,00017 cases
$354,50818 cases
$106,1339 cases
$287,6914 cases
$36,6404 cases

Lex Machina – Patent Litigation Damages Report 7
Figure 8: Compensatory Damages - Percentiles
Maximum: $1,672,594,000
Figure 9: Reasonable Royalties Damages - Percentiles
Maximum: $1,169,140,271
Figure 10: Lost Profits Damages - Percentiles
Maximum: $1,168,466,000
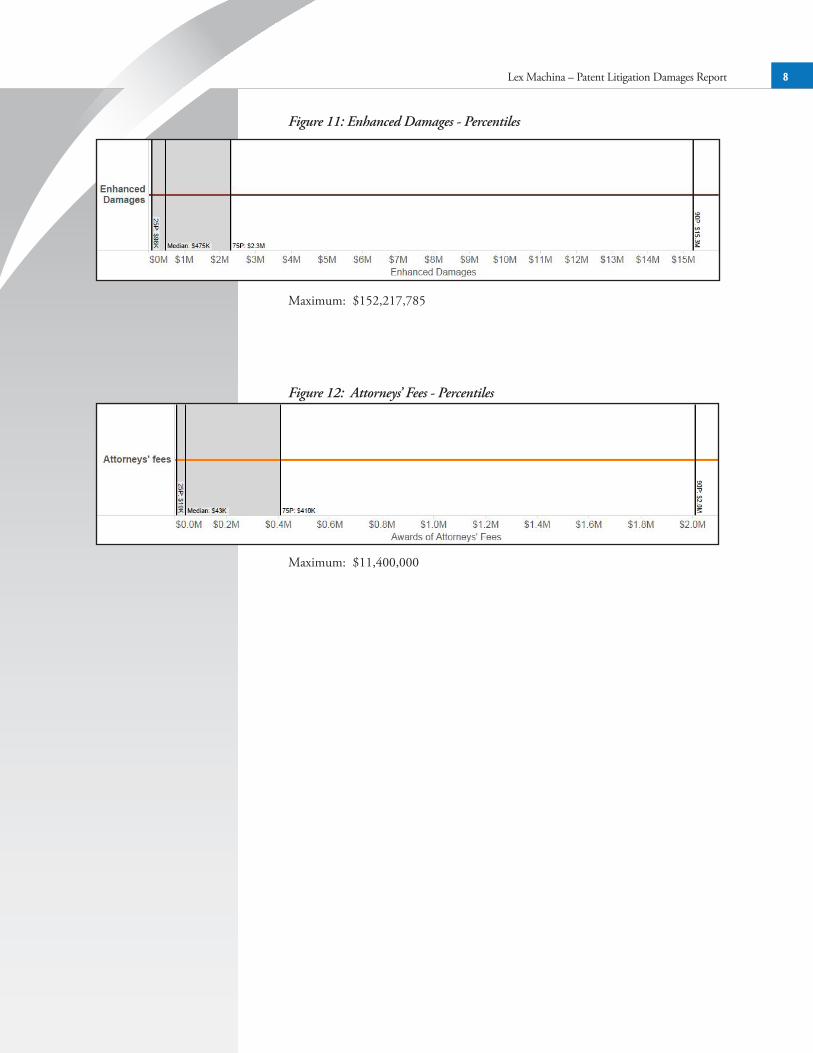
Figure 11: Enhanced Damages - Percentiles
Maximum: $152,217,785
Figure 12: Attorneys’ Fees - Percentiles
Maximum: $11,400,000
Lex Machina – Patent Litigation Damages Report 8

Figure 13: Reasonable Royalties, Lost Profits, Enhanced Damages, and Attorneys’ Fees - Comparison of Percentiles and Maximum
Lex Machina – Patent Litigation Damages Report 9

Largest Damages Awards
Figure 14: Top 10 Compensatory Damages Awards1
1 Damages in the Apple v. Samsung case (5:11-cv-1846) have been excluded, as they are awarded on the basis of both trade dress claims and patent infringement claims without apportionment (coded here as “cross-category” damages, which are excluded from this report unless explicitly stated otherwise).
Lex Machina – Patent Litigation Damages Report 10
Case Total Damages Year of Award
Winning Party(ies)
Losing Party(ies)
Damages Type(s)
1 Centocor v. Abbott Laboratories
$1,672,594,000 2009 Centocor, New York University
Abbott Laboratories
Lost Profits, Reasonable Royalties
2 Carnegie Mellon University v. Marvell
$1,169,140,271 2012 Carnegie Mellon University
Marvell Reasonable Royalties
3 Monsanto v. DuPont
$1,000,000,000 2013 Monsanto DuPont Reasonable Royalties
4 Saffran v. Johnson & Johnson
$482,000,000 2011 Bruce N. Saffran
Cordis, Johnson & Johnson
Reasonable Royalties
5 Sanofi-Synthelabo v. Apotex
$442,209,362 2012 Sanofi-Synthelabo
Apotex Compensatory Lump
6 Saffran v. Boston Scientific
$431,867,351 2008 Bruce N. Saffran
Boston Scientific
Reasonable Royalties
7 VirnetX v. Cisco $368,160,000 2012 VirnetX Apple Reasonable Royalties
8 Lucent Technologies v. Gateway
$368,094,056 2008 Lucent Technologies
Dell, Microsoft Reasonable Royalties
9 SK Hynix v. Rambus
$349,035,842 2009 Rambus Hynix Semiconductor
Reasonable Royalties
10 Versata Software v. SAP America
$328,654,806 2011 Versata Software
SAP America Lost Profits, Reasonable Royalties

Lex Machina – Patent Litigation Damages Report 11
Case Total Damages Year of Award Winning Party(ies) Losing Party(ies)
1 Carnegie Mellon University v. Marvell
$1,169,140,271 2012 Carnegie Mellon University
Marvell
2 Monsanto v. DuPont
$1,000,000,000 2013 Monsanto DuPont
3 Centocor v. Abbott Laboratories
$504,128,000 2009 Centocor and New York University
Abbott Laboratories
4 Saffran v. Johnson & Johnson
$482,000,000 2011 Bruce N. Saffran Cordis, Johnson & Johnson
5 Saffran v. Boston Scientific
$431,867,351 2008 Bruce N. Saffran Boston Scientific
6 VirnetX v. Cisco $368,160,000 2012 VirnetX Apple
7 Lucent Technologies v. Gateway
$368,094,056 2008 Lucent Technologies Dell, Microsoft
8 SK Hynix v. Rambus
$349,035,842 2009 Rambus Hynix Semiconductor
9 i4i v. Microsoft $200,000,000 2009 i4i Microsoft
10 TGIP v. AT&T $156,289,609 2007 TGIP AT&T
Figure 15: Top 10 Reasonable Royalties Damages Awards

Lex Machina – Patent Litigation Damages Report 12
Figure 16: Top 10 Lost Profits Damages Awards
Case Total Damages Year of Award
Winning Party(ies)
Losing Party(ies)
1 Centocor v. Abbott Laboratories
$1,168,466,000 2009 Centocor, New York University
Abbott Laboratories
2 Versata Software v. SAP America
$248,158,882 2011 Versata Software SAP America
3 General Electric v. Mitsubishi Heavy Industries
$166,750,000 2012 General Electric Mitsubishi Heavy Industries
4 Bard Peripheral Vascular v. W. L. Gore & Associates
$102,081,579 2008 Bard Peripheral Vascular
W. L. Gore & Associates
5 Medtronic v. Nuvasive $101,196,000 2011 Warsaw Orthopedic
NuVasive
6 WesternGeco v. ION Geophysical
$93,400,000 2012 WesternGeco ION Geophysical
7 Edwards Lifesciences v. Corevalve
$72,645,555 2010 Edwards Lifesciences
Corevalve
8 Globespanvirata v. Texas Instruments
$70,000,000 2006 Texas Instruments
Globespanvirata
9 Stryker v. Zimmer $70,000,000 2013 Stryker Zimmer
10 Dow Chemical v. Nova Chemicals
$57,447,024 2010 Dow Chemical Nova Chemicals

Lex Machina – Patent Litigation Damages Report 13
Figure 17: Top 10 Enhanced Damages Awards
Case Total Damages Year of Award
Winning Party(ies) Losing Party(ies)
1 Stryker v. Zimmer $152,217,785 2013 Stryker Zimmer
2 Advanced Medical Optics v. Alcon
$142,600,000 2006 Advanced Medical Optics
Alcon
3 Muniauction v. Thomson Corporation
$76,964,016 2007 Muniauction Thomson Corporation
4 Philips v. KXD $58,510,166 2007 Philips KXD
5 Zenith v. Vizio $50,867,936 2010 Zenith Vizio
6 i4i v. Microsoft $40,000,000 2009 i4i Microsoft
7 University of Pittsburgh v. Varian Medical Systems
$39,892,515 2012 University of Pittsburgh
Varian Medical Systems
8 Hill Design Group v. Spring Wang
$35,721,884 2007 Hill Design Group Spring Wang
9 DataTreasury v. Wells Fargo
$26,606,000 2011 DataTreasury U.S. Bank National Association
10 z4 Technologies v. Microsoft
$25,000,000 2006 z4 Technologies Microsoft

Figure 18: Top 10 Attorneys’ Fees Awards
Lex Machina – Patent Litigation Damages Report 14
Case Total Damages Year of Award
Winning Party(ies) Losing Party(ies)
1 Takeda Chemical v. Mylan Laboratories
$11,400,000 2009 Takeda Chemical Mylan Pharmaceuticals
2 Aventis v. Amphastar $9,231,058 2007 Amphastar, Teva Aventis
3 University of Pittsburgh v. Varian Medical Systems
$9,200,000 2012 University of Pittsburgh
Varian Medical Systems
4 Stryker v. Zimmer $8,000,000 2013 Stryker Zimmer
5 Philips v. Postech $7,367,946 2004 Philips Postech
6 Rambus v. Infineon $7,123,990 2001 Infineon Rambus
7 TALtech v. Esquel Enterprises
$6,790,045 2007 Esquel Enterprises TALtech
8 Lazare Kaplan International v. Photoscribe
$6,305,979 2009 Gemological Institute of America, Photoscribe
Lazare Kaplan International
9 Microtune v. Broadcom $5,657,827 2004 Microtune Inc Broadcom
10 Nilssen v. Osram Sylvania $5,600,000 2007 Osram Sylvania GEO Foundation and Ole Nilssen

Damages Awards Compared to Total Terminated Cases
Compensatory Damages
Figure 19: Compensatory Damages - Totals and Medians by Year1
Year Cases Terminated Total Median2000 710 $2,616,022 $8,0002001 1,649 $18,509,064 $35,0002002 2,068 $200,190,346 $67,6652003 2,285 $243,766,349 $258,2322004 2,517 $225,199,863 $177,1802005 2,444 $233,780,449 $308,1592006 2,458 $702,003,929 $341,6712007 2,575 $545,753,313 $321,3402008 2,602 $1,523,257,755 $747,5062009 2,625 $2,749,905,720 $1,392,3642010 2,473 $468,582,644 $305,3992011 2,810 $1,454,803,013 $917,5002012 3,910 $2,953,600,993 $1,856,2702013 5,503 $1,724,732,151 $688,000
1 To provide more useful insight, all compensatory damages within a case have been summed and attributed to most recent year in which any were awarded. Otherwise, awards from a single case might be split across years, reducing median figures improperly. Number of cases terminated shown to provide approximate correlation between volume of litigation and trends in damages.
Lex Machina – Patent Litigation Damages Report 15
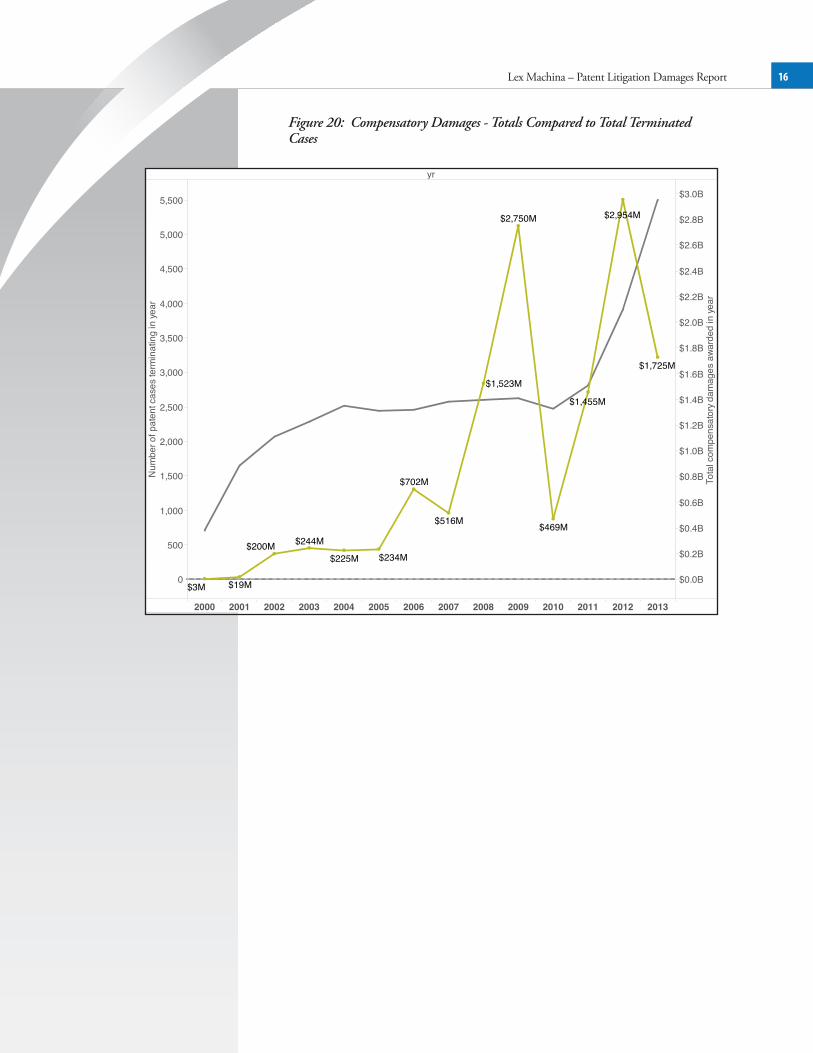
Figure 20: Compensatory Damages - Totals Compared to Total Terminated Cases
Lex Machina – Patent Litigation Damages Report 16
yr
2000 2001 2002 2003 2004 2005 2006 2007 2008 2009 2010 2011 2012 2013
0
500
1,000
1,500
2,000
2,500
3,000
3,500
4,000
4,500
5,000
5,500
Num
ber o
f pat
ent c
ases
term
inat
ing
in ye
ar
$0.0B
$0.2B
$0.4B
$0.6B
$0.8B
$1.0B
$1.2B
$1.4B
$1.6B
$1.8B
$2.0B
$2.2B
$2.4B
$2.6B
$2.8B
$3.0B
Tota
l com
pens
ator
y dam
ages
awa
rded
in ye
ar
$1,455M
$2,954M$2,750M
$702M
$516M $469M
$1,523M
$244M$234M$225M
$200M
$1,725M
$19M$3M

Lex Machina – Patent Litigation Damages Report 17
Figure 21: Compensatory Damages - Medians Compared to Total Terminated Cases
yr
2000 2001 2002 2003 2004 2005 2006 2007 2008 2009 2010 2011 2012 20130
500
1,000
1,500
2,000
2,500
3,000
3,500
4,000
4,500
5,000
5,500
Num
ber o
f pat
ent c
ases
term
inat
ing
in ye
ar
$0.0M
$0.2M
$0.4M
$0.6M
$0.8M
$1.0M
$1.2M
$1.4M
$1.6M
$1.8M
Med
ian
dam
ages
awa
rded
in ye
ar
$1,856,270
$688,000
$341,671
$747,506
$308,159$305,399
$1,392,364
$300,000$258,232
$177,180
$917,500
$67,665$35,000

Lex Machina – Patent Litigation Damages Report 18
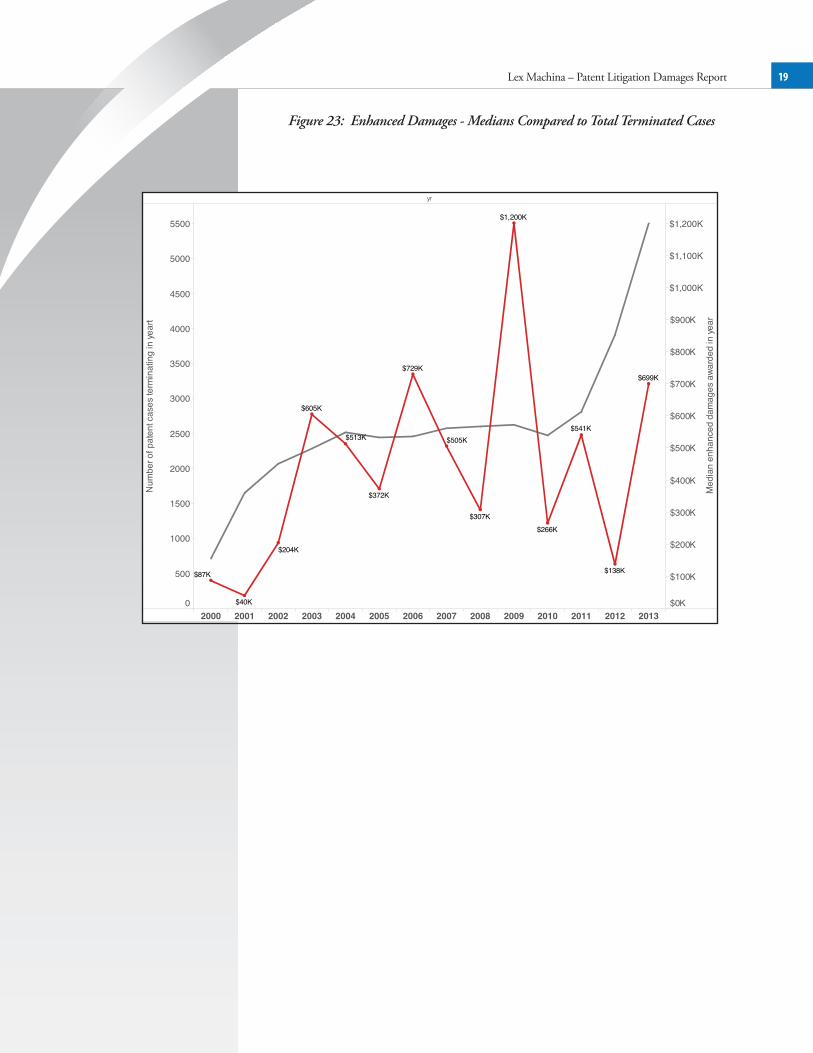
Enhanced Damages
Figure 22: Enhanced Damages - Totals Compared to Total Terminated Cases
yr
2000 2001 2002 2003 2004 2005 2006 2007 2008 2009 2010 2011 2012 20130
500
1000
1500
2000
2500
3000
3500
4000
4500
5000
5500
Num
ber o
f pat
ent c
ases
term
inat
ing
in ye
art
$0M
$20M
$40M
$60M
$80M
$100M
$120M
$140M
$160M
$180M
$200M
$220M
Tota
l enh
ance
d da
mag
es a
ward
ed in
year
$73.3M
$216.2M
$65.8M
$59.9M
$196.6M
$98.4M
$38.8M
$176.7M
$25.6M $25.4M$20.9M
$19.4M
$0.8M$0.6M
Lex Machina – Patent Litigation Damages Report 19
Figure 23: Enhanced Damages - Medians Compared to Total Terminated Cases
yr
2000 2001 2002 2003 2004 2005 2006 2007 2008 2009 2010 2011 2012 20130
500
1000
1500
2000
2500
3000
3500
4000
4500
5000
5500
Num
ber o
f pat
ent c
ases
term
inat
ing
in ye
art
$0K
$100K
$200K
$300K
$400K
$500K
$600K
$700K
$800K
$900K
$1,000K
$1,100K
$1,200K
Med
ian
enha
nced
dam
ages
awa
rded
in ye
ar
$1,200K
$505K$513K
$372K
$541K
$307K
$605K
$266K
$40K
$204K
$699K
$87K
$729K
$138K

Attorneys’ Fees
Figure 24: Attorneys’ Fees - Totals Compared to Total Terminated Cases
Lex Machina – Patent Litigation Damages Report 20
yr
2000 2001 2002 2003 2004 2005 2006 2007 2008 2009 2010 2011 2012 2013
0
500
1000
1500
2000
2500
3000
3500
4000
4500
5000
5500
Num
ber o
f pat
ent c
ases
term
inat
ing
in ye
ar
$0M
$5M
$10M
$15M
$20M
$25M
$30M
$35M
$40M
$45M
Tota
l awa
rds
of a
ttorn
eys'
fees
as
dam
ages
$45.8M
$15.0M$14.4M
$17.5M
$13.6M$13.4M $13.2M$12.6M
$8.4M
$0.1M
$6.1M
$28.9M
$26.7M
$3.3M
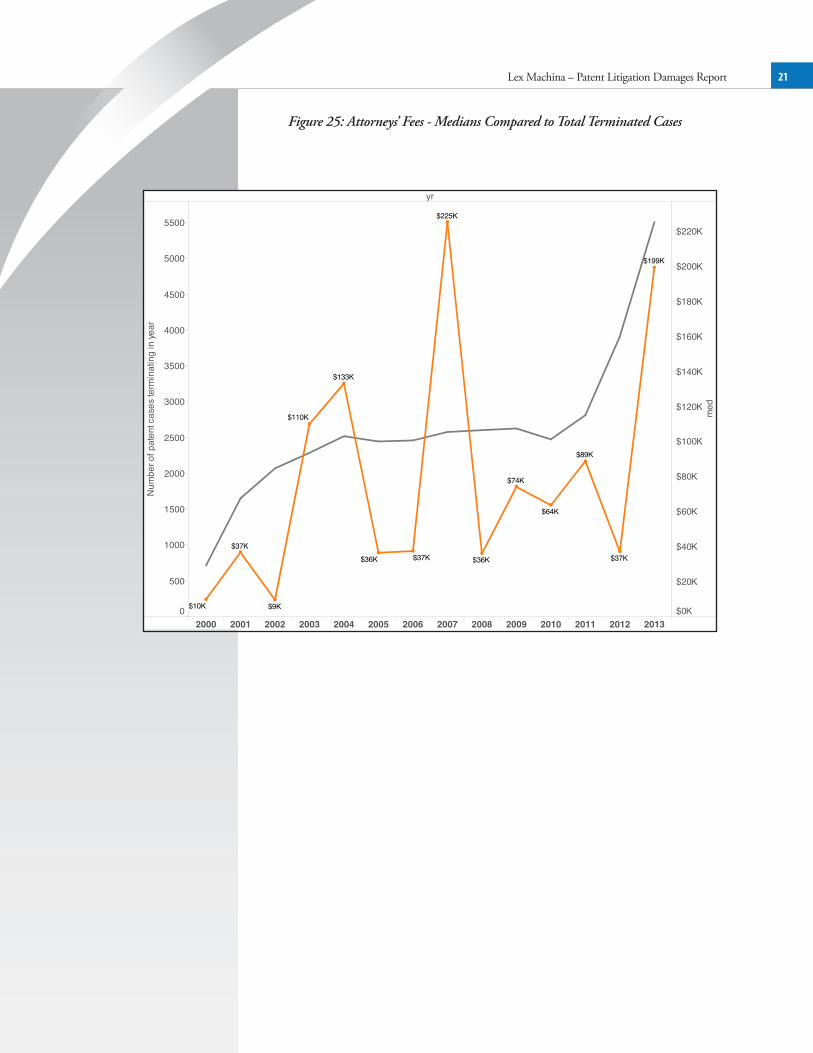
Figure 25: Attorneys’ Fees - Medians Compared to Total Terminated Cases
Lex Machina – Patent Litigation Damages Report 21
yr
2000 2001 2002 2003 2004 2005 2006 2007 2008 2009 2010 2011 2012 20130
500
1000
1500
2000
2500
3000
3500
4000
4500
5000
5500
Num
ber o
f pat
ent c
ases
term
inat
ing
in ye
ar
$0K
$20K
$40K
$60K
$80K
$100K
$120K
$140K
$160K
$180K
$200K
$220K
med
$225K
$74K
$89K
$199K
$64K
$110K
$37K $37K$37K
$36K $36K
$133K
$9K$10K

District Courts
Figure 26: All Districts – Total Cases With Compensatory Damages
Lex Machina – Patent Litigation Damages Report 22
2000 2001 2002 2003 2004 2005 2006 2007 2008 2009 2010 2011 2012 2013 Total
C.D.Cal.
C.D.Ill.
D.Ariz.
D.Colo.
D.Conn.
D.D.C.
D.Del.
D.Haw.
D.Idaho
D.Kan.
D.Mass.
D.Md.
D.Me.
D.Minn.
D.N.D.
D.N.H.
D.N.J.
D.N.M.
D.Neb.
D.Nev.
D.Or.
D.R.I.
D.S.C.
D.S.D.
D.Utah
E.D.Ark.
E.D.Cal.
E.D.La.
E.D.Mich.
E.D.Mo.
E.D.N.C.
E.D.N.Y.
E.D.Pa.
E.D.Tenn.
E.D.Tex.
E.D.Va.
E.D.Wash.
E.D.Wis.
M.D.Fla.
M.D.N.C.
M.D.Pa.
M.D.Tenn.
N.D.Ala.
N.D.Cal.
N.D.Ga.
N.D.Ill.
N.D.Ind.
N.D.Iowa
N.D.Miss.
N.D.N.Y.
N.D.Ohio
N.D.Okla.
N.D.Tex.
S.D.Cal.
S.D.Fla.
S.D.Ill.
S.D.Ind.
S.D.Iowa
S.D.N.Y.
S.D.Ohio
S.D.Tex.
W.D.Ark.
W.D.Mich.
W.D.Mo.
W.D.N.C.
W.D.N.Y.
W.D.Okla.
W.D.Pa.
W.D.Tenn.
W.D.Tex.
W.D.Wash.
W.D.Wis.
Grand Total 748
13
8
7
3
7
4
2
1
2
6
1
12
1
20
6
4
2
22
17
22
1
10
5
2
2
4
43
9
34
4
3
2
4
27
2
2
15
84
1
4
3
6
48
11
2
5
5
7
1
7
2
6
16
2
1
12
1
1
21
1
3
16
2
3
2
44
1
4
5
7
2
83
49
2
1
1
1
1
2
2
3
1
1
3
3
1
7
1
3
1
2
1
2
1
1
3
1
4
66
3
1
2
1
1
1
1
1
2
2
1
6
1
4
2
2
12
1
2
1
1
1
3
1
1
3
3
6
64
2
1
1
1
3
1
3
2
2
2
4
2
17
2
3
1
1
2
1
1
2
3
7
59
1
1
1
2
2
2
2
1
1
2
2
2
2
1
1
2
1
9
1
4
1
1
2
1
1
1
4
3
1
1
3
67
1
1
2
1
1
3
1
2
1
1
1
1
1
4
2
1
1
8
1
6
1
2
2
1
2
4
1
2
1
2
2
7
75
1
1
2
1
3
1
1
5
1
4
2
1
1
1
14
1
4
2
1
1
1
3
1
1
1
1
1
1
5
2
1
9
73
2
1
2
1
2
3
1
3
1
2
4
2
4
1
3
3
2
2
4
3
1
1
2
1
4
1
1
4
1
11
56
1
1
1
1
1
1
1
2
1
1
1
4
1
4
2
1
3
7
1
3
1
1
2
1
6
1
6
50
2
1
2
1
1
2
2
1
1
4
1
1
2
4
1
1
2
1
1
2
3
4
1
1
8
65
1
1
1
1
6
1
2
5
1
1
3
4
1
2
1
2
1
1
7
1
1
1
4
1
1
2
3
1
1
7
45
2
1
1
1
3
1
1
2
4
4
3
4
2
2
1
1
6
1
1
4
45
1
1
2
3
4
1
1
2
1
3
1
1
1
3
3
2
1
1
2
1
5
1
4
16
1
1
1
1
1
4
2
1
4
18
1
1
1
1
1
1
2
1
5
1
3

Lex Machina – Patent Litigation Damages Report 23
Compensatory Damages
Figure 27: Top Districts – Compensatory Damages Totals
E.D.Tex.84 cases
$5,012,859,215
W.D.Pa.7 cases
$1,259,398,385
E.D.Mo.48 cases
$1,035,863,598
N.D.Cal.34 cases
$912,927,002
D.Del.44 cases
$800,189,547
S.D.N.Y.20 cases
$617,069,573
S.D.Cal.17 cases
$528,528,281
$0.0B
$0.5B
$1.0B
$1.5B
$2.0B
$2.5B
$3.0B
$3.5B
$4.0B
$4.5B
$5.0B
Tota
l com
pens
ator
y da
mag
es a
war
ded
thro
ugh
Dec
. 31,
201
3 in
cas
es fi
led
afte
r Jan
. 1, 2
000
Damages TypeCompensatory LumpLost ProfitsReasonable Royalties

Lex Machina – Patent Litigation Damages Report 24
Figure 28: Top Districts - Compensatory Damages Medians
(showing districts with 2 or more cases)
D.Kan.2 cases
$34,864,586
E.D.Va.15 cases
$20,001,951
E.D.Tex.84 cases
$8,250,000
W.D.Pa.7 cases
$8,100,000
N.D.Iowa2 cases
$7,128,251
D.Del.44 cases
$6,906,422
N.D.Miss.2 cases
$4,460,500
$0M
$5M
$10M
$15M
$20M
$25M
$30M
$35M
Med
ian
com
pens
ator
y da
mag
es a
war
ded
thro
ugh
Dec
. 31,
201
3 in
cas
es fi
led
afte
r Jan
. 1, 2
000
Lex Machina – Patent Litigation Damages Report 25
Reasonable Royalties Damages
Figure 29: Top Districts– Reasonable Royalties Damages Totals
E.D.Tex.43 cases
$2,914,750,938
W.D.Pa.2 cases
$1,172,740,271
E.D.Mo.8 cases
$1,001,516,901
N.D.Cal.22 cases
$771,349,438
S.D.Cal.6 cases
$389,418,604
D.Del.20 cases
$324,964,939
D.Mass.11 cases
$221,951,716
$0.0B
$0.2B
$0.4B
$0.6B
$0.8B
$1.0B
$1.2B
$1.4B
$1.6B
$1.8B
$2.0B
$2.2B
$2.4B
$2.6B
$2.8B
$3.0B
Tota
l rea
sona
ble
roya
lty d
amag
es a
war
ded
thro
ugh
Dec
. 31,
201
3 in
cas
es fi
led
afte
r Jan
. 1, 2
000

Figure 30: Top Districts - Reasonable Royalties Damages Medians
Lex Machina – Patent Litigation Damages Report 26
(showing districts with 2 or more cases)
W.D.Pa.$586,370,136
2 cases
D.Ariz.$41,754,302
2 cases
N.D.N.Y.$27,635,698
2 cases
E.D.Va.$25,249,053
6 cases
E.D.Tex.$15,399,900
43 cases
S.D.N.Y.$15,050,000
6 cases
W.D.Tex.$8,352,095
4 cases
$0M
$50M
$100M
$150M
$200M
$250M
$300M
$350M
$400M
$450M
$500M
$550M
$600M
Med
ian
reas
onab
le ro
yalty
dam
ages
aw
arde
d th
roug
h D
ec. 3
1, 2
013
in c
ases
file
d af
ter J
an. 1
, 200
0

Lost Profits Damages
Figure 31: Top Districts - Lost Profits Damages Totals
Lex Machina – Patent Litigation Damages Report 27
E.D.Tex.$1,448,417,289
9 cases
D.Del.$238,866,984
9 cases
N.D.Tex.$180,342,727
7 cases
S.D.Cal.$107,334,607
5 cases
S.D.Tex.$104,859,608
6 cases
D.Ariz.$102,098,924
3 cases
N.D.Cal.$102,007,037
5 cases
$0.0B
$0.1B
$0.2B
$0.3B
$0.4B
$0.5B
$0.6B
$0.7B
$0.8B
$0.9B
$1.0B
$1.1B
$1.2B
$1.3B
$1.4B
$1.5B
Tota
l lost
pro
fits
dam
ages
aw
arde
d th
roug
h D
ec. 3
1, 2
013
in c
ases
file
d af
ter J
an. 1
, 200
0
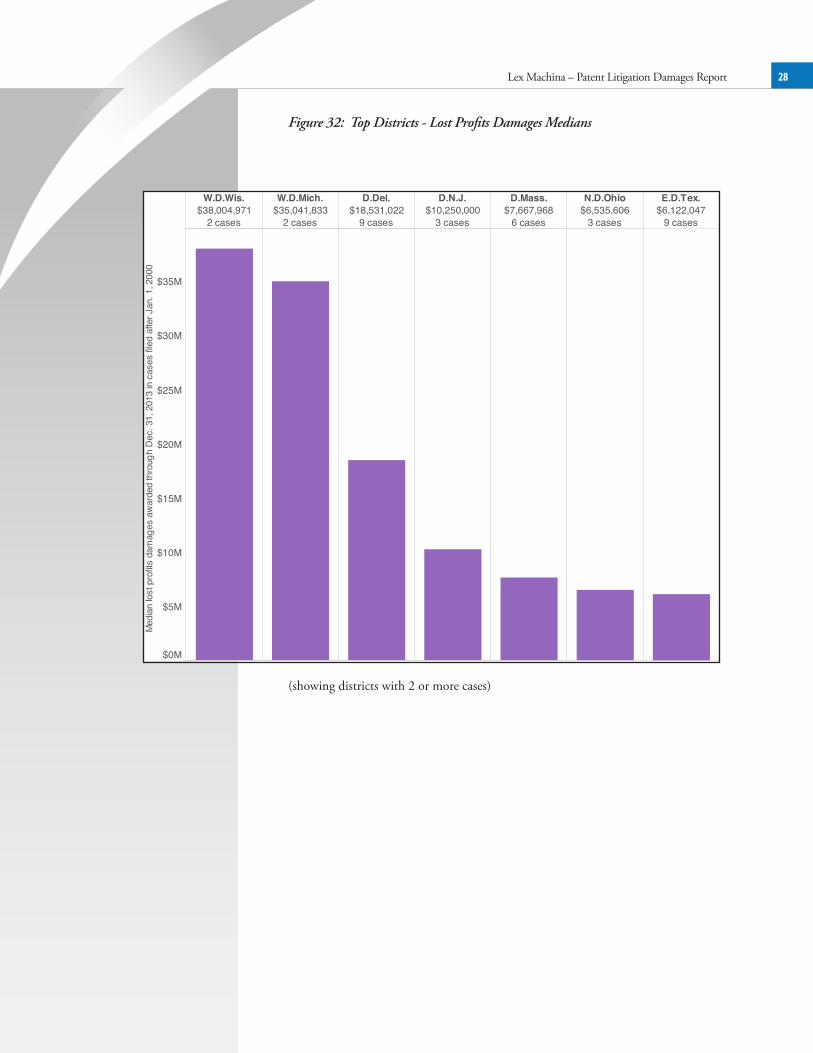
Figure 32: Top Districts - Lost Profits Damages Medians
Lex Machina – Patent Litigation Damages Report 28
(showing districts with 2 or more cases)
W.D.Wis.$38,004,971
2 cases
W.D.Mich.$35,041,833
2 cases
D.Del.$18,531,022
9 cases
D.N.J.$10,250,000
3 cases
D.Mass.$7,667,968
6 cases
N.D.Ohio$6,535,606
3 cases
E.D.Tex.$6,122,047
9 cases
$0M
$5M
$10M
$15M
$20M
$25M
$30M
$35M
Med
ian
lost
pro
fits
dam
ages
aw
arde
d th
roug
h D
ec. 3
1, 2
013
in c
ases
file
d af
ter J
an. 1
, 200
0
Lex Machina – Patent Litigation Damages Report 29
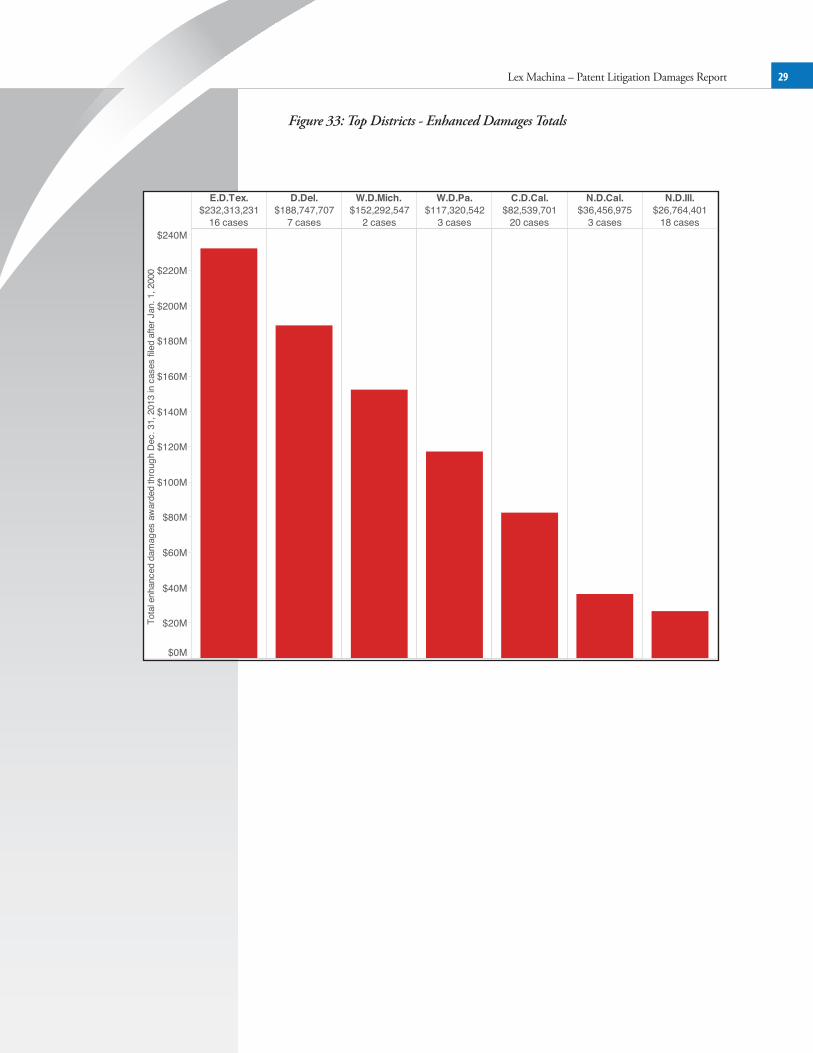
Figure 33: Top Districts - Enhanced Damages Totals
E.D.Tex.$232,313,231
16 cases
D.Del.$188,747,707
7 cases
W.D.Mich.$152,292,547
2 cases
W.D.Pa.$117,320,542
3 cases
C.D.Cal.$82,539,701
20 cases
N.D.Cal.$36,456,975
3 cases
N.D.Ill.$26,764,401
18 cases
$0M
$20M
$40M
$60M
$80M
$100M
$120M
$140M
$160M
$180M
$200M
$220M
$240M
Tota
l enh
ance
d da
mag
es a
war
ded
thro
ugh
Dec
. 31,
201
3 in
cas
es fi
led
afte
r Jan
. 1, 2
000
Lex Machina – Patent Litigation Damages Report 30
Figure 34: Top Districts - Enhanced Damages Medians
(showing districts with 2 or more cases)
W.D.Mich.$76,146,273
2 cases
W.D.Pa.$39,892,515
3 cases
E.D.Tex.$8,500,00016 cases
D.Del.$6,116,721
7 cases
D.Utah$5,502,311
2 cases
W.D.Wis.$5,473,377
2 cases
W.D.Okla.$3,931,645
2 cases
$0M
$5M
$10M
$15M
$20M
$25M
$30M
$35M
$40M
$45M
$50M
$55M
$60M
$65M
$70M
$75M
Med
ian
enha
nced
dam
ages
aw
arde
d th
roug
h D
ec. 3
1, 2
013
in c
ases
file
d af
ter J
an. 1
, 200
0

Lex Machina – Patent Litigation Damages Report 31
Attorneys’ Fees
Figure 35: Top Districts – Attorneys’ Fees Totals
S.D.N.Y.$34,431,284
14 cases
C.D.Cal.$21,182,420
59 cases
E.D.Va.$16,203,097
10 cases
E.D.Tex.$14,288,799
7 cases
N.D.Ill.$11,040,947
21 cases
W.D.Pa.$9,497,146
2 cases
E.D.Mo.$9,435,636
9 cases
$0M
$5M
$10M
$15M
$20M
$25M
$30M
$35M
Tota
l enh
ance
d da
mag
es a
war
ded
thro
ugh
Dec
. 31,
201
3 in
cas
es fi
led
afte
r Jan
. 1, 2
000

Figure 36: Top Districts – Attorneys’ Fees Medians
Lex Machina – Patent Litigation Damages Report 32
W.D.Pa.$4,748,573
2 cases
D.Del.$2,111,758
4 cases
E.D.Tex.$2,010,200
7 cases
D.Colo.$703,1792 cases
W.D.Okla.$618,4843 cases
N.D.Ohio$581,6175 cases
D.Mass.$501,3056 cases
$0.0M
$0.5M
$1.0M
$1.5M
$2.0M
$2.5M
$3.0M
$3.5M
$4.0M
$4.5M
Med
ian
enha
nced
dam
ages
aw
arde
d th
roug
h D
ec. 3
1, 2
013
in c
ases
file
d af
ter J
an. 1
, 200
0
(showing districts with 2 or more cases)

Lex Machina – Patent Litigation Damages Report 33
Judges
Compensatory Damages
Figure 37: Top Judges - Compensatory Damages Totals
MichaelSchneiderE.D.Tex.
$2,370,627,2699 cases
Nora Fischer
W.D.Pa.$1,169,140,271
1 cases
T. John Ward
E.D.Tex.$1,016,348,320
19 cases
E. RichardWebberE.D.Mo.
$1,000,656,2704 cases
Leonard Davis
E.D.Tex.$956,536,252
18 cases
James Gilstrap
E.D.Tex.$669,804,352
15 cases
Sidney Stein
S.D.N.Y.$450,659,959
3 cases
$0.0B
$0.2B
$0.4B
$0.6B
$0.8B
$1.0B
$1.2B
$1.4B
$1.6B
$1.8B
$2.0B
$2.2B
$2.4B
Tota
l com
pens
ator
y da
mag
es a
war
ded
thro
ugh
Dec
. 21,
201
3 in
cas
es fi
led
afte
r Jan
. 1, 2
000
Damages TypeCompensatory LumpLost ProfitsReasonable Royalties

Lex Machina – Patent Litigation Damages Report 34
Figure 38: Top Judges - Compensatory Damages Medians
(showing judges with 2 or more cases)
Marilyn Huff
E.D.Cal.,S.D.Cal.
$188,377,0152 cases
Ronald Whyte
N.D.Cal.
$174,586,9312 cases
Roy Dalton
M.D.Fla.
$86,353,0922 cases
Allen Fish
N.D.Tex.
$85,180,0002 cases
RaymondJacksonE.D.Va.
$81,467,3652 cases
EdwardHarrington
D.Mass.
$74,512,5002 cases
Edward Chen
N.D.Cal.
$57,807,1893 cases
$0M
$20M
$40M
$60M
$80M
$100M
$120M
$140M
$160M
$180M
Med
ian
com
pens
ator
y da
mag
es a
war
ded
thro
ugh
Dec
. 31,
201
3 in
cas
es fi
led
afte
r Jan
. 1, 2
000

Lex Machina – Patent Litigation Damages Report 35
Reasonable Royalties Damages
Figure 39: Top Judges – Reasonable Royalties Damages Totals
Nora Fischer
W.D.Pa.
$1,169,140,2711 cases
E. RichardWebberE.D.Mo.
$1,000,046,2702 cases
MichaelSchneiderE.D.Tex.
$991,128,0003 cases
T. John Ward
E.D.Tex.
$944,312,4757 cases
Leonard Davis
E.D.Tex.
$750,614,9018 cases
James Gilstrap
E.D.Tex.
$639,539,9477 cases
Marilyn Huff
E.D.Cal.,S.D.Cal.
$370,844,0562 cases
$0.0B
$0.1B
$0.2B
$0.3B
$0.4B
$0.5B
$0.6B
$0.7B
$0.8B
$0.9B
$1.0B
$1.1B
$1.2B
Tota
l rea
sona
ble
roya
lty d
amag
es a
ward
ed th
roug
h De
c. 3
1, 2
013
in c
ases
file
d af
ter J
an. 1
, 200
0
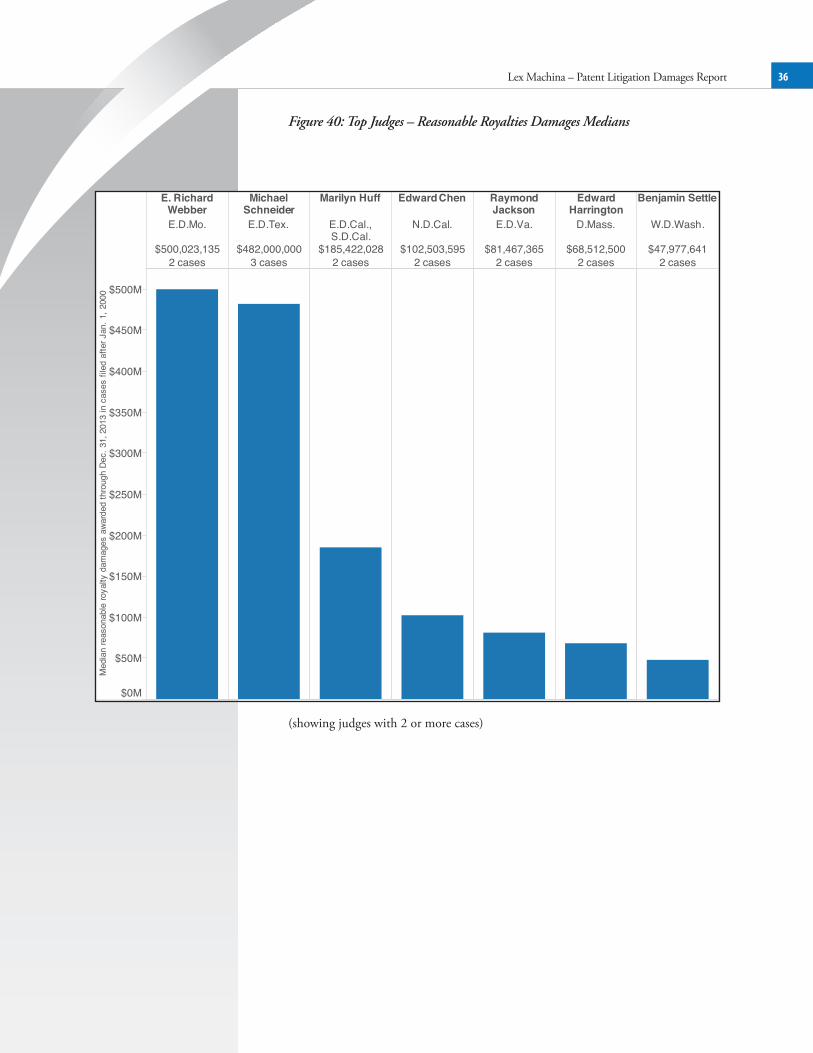
Figure 40: Top Judges – Reasonable Royalties Damages Medians
Lex Machina – Patent Litigation Damages Report 36
(showing judges with 2 or more cases)
E. RichardWebberE.D.Mo.
$500,023,1352 cases
MichaelSchneiderE.D.Tex.
$482,000,0003 cases
Marilyn Huff
E.D.Cal.,S.D.Cal.
$185,422,0282 cases
Edward Chen
N.D.Cal.
$102,503,5952 cases
RaymondJacksonE.D.Va.
$81,467,3652 cases
EdwardHarrington
D.Mass.
$68,512,5002 cases
Benjamin Settle
W.D.Wash.
$47,977,6412 cases
$0M
$50M
$100M
$150M
$200M
$250M
$300M
$350M
$400M
$450M
$500M
Med
ian
reas
onab
le ro
yalty
dam
ages
awa
rded
thro
ugh
Dec.
31,
201
3 in
cas
es fi
led
afte
r Jan
. 1, 2
000

Lost Profits Damages
Figure 41: Top Judges – Lost Profits Damages Totals
Lex Machina – Patent Litigation Damages Report 37
MichaelSchneiderE.D.Tex.
$1,179,200,6452 cases
Allen Fish
N.D.Tex.$166,915,000
2 cases
WilliamFurgesonN.D.Tex.
$166,750,0001 cases
Mary Murguia
D.Ariz.$102,081,579
1 cases
CathyBencivengo
S.D.Cal.$101,196,000
1 cases
Keith Ellison
S.D.Tex.$93,400,000
1 cases
Garrett Brown
D.N.J.$80,250,000
2 cases
$0.0B
$0.1B
$0.2B
$0.3B
$0.4B
$0.5B
$0.6B
$0.7B
$0.8B
$0.9B
$1.0B
$1.1B
$1.2B
Tota
l lost
pro
fits
dam
ages
aw
arde
d th
roug
h D
ec. 3
1, 2
013
in c
ases
file
d af
ter J
an. 1
, 200
0

Figure 42: Top Judges – Lost Profits Damages Medians
Lex Machina – Patent Litigation Damages Report 38
(showing judges with 2 or more cases)
MichaelSchneiderE.D.Tex.
$589,600,3232 cases
Allen Fish
N.D.Tex.$83,457,500
2 cases
Garrett Brown
D.N.J.$40,125,000
2 cases
Gregory Sleet
D.Del.$38,424,989
2 cases
Barbara Crabb
W.D.Wis.$38,004,971
2 cases
Leonard Stark
D.Del.$37,223,512
2 cases
MaxineChesneyN.D.Cal.
$24,099,3072 cases
$0M
$50M
$100M
$150M
$200M
$250M
$300M
$350M
$400M
$450M
$500M
$550M
$600M
Med
ian
lost
pro
fits
dam
ages
aw
arde
d th
roug
h D
ec. 3
1, 2
013
in c
ases
file
d af
ter J
an. 1
, 200
0

Lex Machina – Patent Litigation Damages Report 39
Enhanced Damages
Figure 43: Top Judges – Enhanced Damages Totals
Robert JonkerW.D.Mich.
$152,217,7851 cases
Kent JordanD.Del.
$146,688,5842 cases
Leonard DavisE.D.Tex.
$92,000,0004 cases
David FolsomE.D.Tex.
$77,473,9362 cases
Gary LancasterW.D.Pa.
$76,964,0161 cases
Manuel RealC.D.Cal.
$76,638,1662 cases
Dolly GeeC.D.Cal.
$58,510,1661 cases
$0M
$10M
$20M
$30M
$40M
$50M
$60M
$70M
$80M
$90M
$100M
$110M
$120M
$130M
$140M
$150M
Tota
l enh
ance
d da
mag
es a
war
ded
thro
ugh
Dec
. 31,
201
3 in
cas
es fi
led
afte
r Jan
. 1, 2
000

Lex Machina – Patent Litigation Damages Report 40
Figure 44: Top Judges – Enhanced Damages Medians
(showing judges with 2 or more cases)
Kent Jordan
D.Del.$73,344,292
2 cases
David Folsom
E.D.Tex.$38,736,968
2 cases
Manuel Real
C.D.Cal.$38,319,083
2 cases
Leonard Davis
E.D.Tex.$20,000,000
4 cases
Ron Clark
E.D.Tex.$8,978,412
2 cases
RebeccaPallmeyer
N.D.Ill.$7,562,917
2 cases
Garrett Brown
D.N.J.$7,432,920
2 cases
$0M
$5M
$10M
$15M
$20M
$25M
$30M
$35M
$40M
$45M
$50M
$55M
$60M
$65M
$70M
$75M
Med
ian
enha
nced
dam
ages
aw
arde
d th
roug
h D
ec. 3
1, 2
013
in c
ases
file
d af
ter J
an. 1
, 200
0

Lex Machina – Patent Litigation Damages Report 41
Attorneys’ Fees
Figure 45: Top Judges – Attorneys’ Fees Totals
Denise Cote
S.D.N.Y.$16,806,032
3 cases
MarianaPfaelzerC.D.Cal.
$13,818,6812 cases
Arthur Schwab
W.D.Pa.$9,200,000
1 cases
Robert Jonker
W.D.Mich.$8,067,275
3 cases
Charles Brieant
S.D.N.Y.$7,367,946
1 cases
E. RichardWebberE.D.Mo.
$7,278,8132 cases
Robert Payne
E.D.Va.$7,123,990
1 cases
$0M
$2M
$4M
$6M
$8M
$10M
$12M
$14M
$16M
Tota
l atto
rney
s' fe
es a
war
ded
thro
ugh
Dec
. 31,
201
3 in
cas
es fi
led
afte
r Jan
. 1, 2
000

Figure 46: Top Judges – Attorneys’ Fees Medians
Lex Machina – Patent Litigation Damages Report 42
MarianaPfaelzerC.D.Cal.
$6,909,3402 cases
Denise Cote
S.D.N.Y.$5,400,000
3 cases
E. RichardWebberE.D.Mo.
$3,639,4062 cases
Leonard Davis
E.D.Tex.$3,005,100
2 cases
Terry Means
N.D.Tex.$2,641,489
2 cases
James Spencer
E.D.Va.$2,105,649
2 cases
Daniel Hurley
S.D.Fla.$1,425,000
2 cases
$0M
$1M
$1M
$2M
$2M
$3M
$3M
$4M
$4M
$5M
$5M
$6M
$6M
$7M
$7M
Med
ian
atto
rney
s' fe
es d
amag
es a
war
ded
thro
ugh
Dec
. 31,
201
3 in
cas
es fi
led
afte
r Jan
. 1, 2
000
(showing judges with 2 or more cases)

Parties
Figure 47: Top Parties – Compensatory Damages Won per Terminated Case
Party Total Compensatory Damages Won
Total Terminated Cases (Won
or Lost)
Compensatory Damages Won per Terminated
Case
1 Centocor $1,672,594,000 6 $278,765,667
2 New York University $1,672,594,000 8 $209,074,250
3 VirnetX $473,910,000 5 $94,782,000
4 Sanofi-Synthelabo $442,209,362 8 $55,276,170
5 Versata Software $328,654,806 11 $29,877,710
6 Warsaw Orthopedic $103,963,546 5 $20,792,709
7 Rambus $349,035,842 17 $20,531,520
8 Advanced Medical Optics
$89,556,860 5 $17,911,372
9 SynQor $112,019,855 8 $14,002,482
10 Immersion $82,000,000 6 $13,666,667
(showing parties with 5 or more terminated cases)
Lex Machina – Patent Litigation Damages Report 43

Damages Won
Figure 48: Top Parties – Total Cases With Compensatory Damages Won
Party Cases Total Damages Median Damages
1 Monsanto 71 $1,028,692,955 $127,500
2 Ovadia 6 $72,153 $5,500
3 Philips 6 $65,456,365 $284,032
4 ArrivalStar 5 $316,667 $62,728
5 Directed Electronics 5 $45,000 $5,000
6 East-West Trading Corp 4 $56,030 $4,875
7 David Moscatello 3 $98,316 $37,500
8 Heeling Sports Limited 3 $3,236,970 $375,300
9 Metabolic Technologies 3 $102,298 $20,000
10 Mobile Hi-Tech Wheels 3 $471,314 $146,314
11 Oakley 3 $11,060 $2,774
12 Smith & Nephew 3 $27,454,550 $4,713,000
13 TriStrata 3 $27,893,105 $846,000
(showing parties with 3 or more cases)
Lex Machina – Patent Litigation Damages Report 44

Lex Machina – Patent Litigation Damages Report 45
Figure 49: Top Parties - Compensatory Damages Won
Damages Winning Party Amount Cases
$0.2B $0.4B $0.6B $0.8B $1.0B $1.2B $1.4B $1.6BAmount
Centocor, Inc. $1,672,594,000 1 casesNew York University $1,672,594,000 1 casesCarnegie Mellon University $1,169,140,271 1 casesMonsanto Company $1,028,692,955 71 casesBruce N. Saffran, M.D., Ph.D., $913,867,351 2 casesVirnetX Inc. $473,910,000 2 casesSanofi-Synthelabo Inc $442,209,362 1 casesLucent Technologies, Inc. $368,094,056 1 casesRambus, Inc. $349,035,842 1 casesVersata Software, Inc. $328,654,806 1 casesi4i Limited Partnership $200,000,000 1 casesBard Peripheral Vascular, Inc. $185,589,871 1 casesParkerVision, Inc. $172,704,600 1 casesGeneral Electric Company $170,195,000 1 casesTGIP, Inc $156,289,609 1 casesMformation Technologies, Inc. $147,200,000 1 casesTyco Healthcare Group LP $144,890,389 2 casesz4 Technologies, Inc $133,000,000 1 casesActiveVideo Networks, Inc. $132,422,575 1 casesFreedom Wireless, Inc. $128,025,000 1 cases
Damages TypeCompensatory LumpLost ProfitsReasonable Royalties
Lex Machina – Patent Litigation Damages Report 46
Figure 50: Top Parties - Reasonable Royalties Damages Won
Damages Winning Party Amount Cases
$0.0B $0.2B $0.4B $0.6B $0.8B $1.0B $1.2BAmount
Carnegie Mellon University $1,169,140,271 1 casesMonsanto Company $1,001,620,983 9 casesBruce N. Saffran, M.D., Ph.D., $913,867,351 2 casesCentocor, Inc. $504,128,000 1 casesNew York University $504,128,000 1 casesVirnetX Inc. $473,910,000 2 casesLucent Technologies, Inc. $368,094,056 1 casesRambus, Inc. $349,035,842 1 casesi4i Limited Partnership $200,000,000 1 casesTGIP, Inc $156,289,609 1 casesMformation Technologies, Inc. $147,200,000 1 casesTyco Healthcare Group LP $144,890,389 2 casesActiveVideo Networks, Inc. $132,422,575 1 casesFreedom Wireless, Inc. $128,025,000 1 casesSyntrix Biosystems, Inc. $95,795,507 1 casesBard Peripheral Vascular, Inc. $83,508,292 1 casesImmersion Corporation $82,000,000 1 casesVersata Software, Inc. $80,495,924 1 casesAstrazeneca LP $76,021,995 1 casesSprint Communications Company L.P. $69,500,000 1 cases

Lex Machina – Patent Litigation Damages Report 47
Figure 51: Top Parties – Lost Profits Damages Won
Damages Winning Party Amount Cases
$0.0B $0.2B $0.4B $0.6B $0.8B $1.0B $1.2BAmount
Centocor, Inc. $1,168,466,000 1 casesNew York University $1,168,466,000 1 casesVersata Software, Inc. $248,158,882 1 casesGeneral Electric Company $166,750,000 1 casesBard Peripheral Vascular, Inc. $102,081,579 1 casesWarsaw Orthopedic, Inc. $101,196,000 1 casesWesternGeco LLC $93,400,000 1 casesEdwards Lifesciences LLC $72,645,555 1 casesStryker Corporation $70,000,000 1 casesTexas Instruments Incorporated $70,000,000 1 casesDow Chemical Company $57,447,025 1 casesPromega Corporation $52,009,941 1 casesBrocade Communications Systems, Inc. $49,397,904 1 casesVNUS Medical Technologies, Inc. $45,840,000 1 casesAdvanced Medical Optics Inc $43,769,358 1 casesAkamai Technologies, Inc. $40,102,000 1 casesMuniAuction, Inc. $38,482,008 1 casesRiddell, Inc. $24,000,000 1 casesSt. Jude Medical, Inc. $20,400,000 1 casesTruePosition Inc. $18,600,000 1 cases
Lex Machina – Patent Litigation Damages Report 48
Figure 52: Top Parties - Enhanced Damages Won
Damages Winning Party Amount Cases
$20M $40M $60M $80M $100M $120M $140MAmount
Stryker Corporation $152,217,785 1 casesAdvanced Medical Optics Inc $142,600,000 1 casesU.S. Philips Corporation $89,147,994 4 casesMuniAuction, Inc. $76,964,016 1 casesZenith Electronics Corporation $50,867,936 1 casesi4i Limited Partnership $40,000,000 1 casesUniversity of Pittsburgh $39,892,515 1 casesHill Design Inc $35,721,884 1 casesDatatreasury Corporation $26,606,000 1 casesz4 Technologies, Inc $25,000,000 1 casesPact XPP Technologies, AG $23,099,850 1 casesOcean Innovations, Inc. $20,836,000 1 casesBoston Scientific Corporation $20,754,192 1 casesInternational Rectifier Corporation $18,128,000 1 casesGrantley Patent Holdings, Inc $16,507,437 1 casesIntegrated Technology Corporation $15,582,870 1 casesArmament Systems and Procedures Inc $15,490,000 2 casesFractus, S.A. $15,000,000 1 casesChurch & Dwight Co., Inc. $14,600,000 1 casesNTP, Inc. $14,032,161 1 cases

Lex Machina – Patent Litigation Damages Report 49
Figure 53: Top Parties – Attorneys’ Fees Won
Damages Winning Party Amount Cases
$2M $4M $6M $8M $10M $12M $14M $16MAmount
Takeda Chemical Industries, Ltd. $16,800,000 2 casesUniversity of Pittsburgh $9,200,000 1 casesStryker Corporation $8,000,000 1 casesU.S. Philips Corporation $7,632,974 2 casesInfineon Technology Corporation $7,123,990 1 casesEsquel Enterprises Ltd $6,790,045 1 casesMonsanto Company $5,696,378 8 casesMicrotune Inc $5,657,827 1 casesOsram Sylvania, Inc. $5,600,000 1 casesHighmark, Inc. $5,279,754 1 casesAmphastar Pharmaceuticals Inc $4,834,072 1 casesGia & Co. Enterprises, Inc. $4,663,744 1 casesAlaris Medical Systems Inc $4,587,623 1 casesTeva Pharmaceuticals USA, Inc. $4,396,986 1 casesThird Wave Technologies, Inc. $4,244,636 1 casesNTP, Inc. $4,203,161 1 casesHalliburton Energy Services Inc $4,000,000 1 casesIntegrated Technology Corporation $3,252,289 1 casesPfizer Inc. $3,111,538 2 casesEon Labs Manufacturing, Inc. $3,104,959 1 cases

Damages Lost
Figure 54: Top Parties – Total Cases With Compensatory Damages Lost
Party Cases Total Damages Median Damages
1 Microsoft 6 $857,035,393 $110,375,000
2 Abbott Laboratories 4 $1,699,194,000 $10,800,000
3 Cordis 4 $527,790,460 $20,967,417
4 Dell 4 $7,871,000 $1,210,000
5 Apple 3 $395,169,728 $19,009,728
6 Arthrex 3 $52,454,550 $18,741,550
7 Cisco 3 $70,325,536 $6,500,000
8 Hyundai 3 $48,005,645 $11,575,580 (showing parties with 3 or more cases)
Lex Machina – Patent Litigation Damages Report 50
Lex Machina – Patent Litigation Damages Report 51
Figure 55: Top Parties - Compensatory Damages Lost
Damages Losing Party Amount Cases
$0.2B $0.4B $0.6B $0.8B $1.0B $1.2B $1.4B $1.6BAmount
Abbott Laboratories $1,699,194,000 4 casesMarvell Semiconductor, Inc. $1,169,140,271 1 casesE.I. Du Pont De Nemours and Company $1,000,000,000 1 casesMicrosoft Corporation $857,035,393 6 casesCordis Corporation $527,790,460 4 casesApotex Corp. $518,231,357 2 casesJohnson & Johnson $482,000,000 1 casesBoston Scientific Corporation $457,969,451 2 casesApple Inc. $395,169,728 3 casesHynix Semiconductor America, Inc. $349,035,842 1 casesSAP America, Inc. $328,654,806 1 casesQualcomm Incorporated $195,534,196 2 casesW.L. Gore & Associates, Inc. $185,589,871 1 casesAT&T Inc. $183,789,609 2 casesResearch In Motion Limited $180,646,173 2 casesMitsubishi Heavy Industries, Ltd. $170,195,000 1 casesEthicon Endo-Surgery, Inc. $142,045,960 2 casesVerizon Communications, Inc. $137,822,575 2 casesBoston Communications Group, Inc. $128,025,000 1 casesIllumina Inc. $124,560,434 2 cases
Damages TypeCompensatory LumpLost ProfitsReasonable Royalties

Lex Machina – Patent Litigation Damages Report 52
Figure 56: Top Parties - Reasonable Royalties Damages Lost
Damages Losing Party Amount Cases
$0.2B $0.4B $0.6B $0.8B $1.0B $1.2BAmount
Marvell Semiconductor, Inc. $1,169,140,271 1 casesE.I. Du Pont De Nemours and Company $1,000,000,000 1 casesMicrosoft Corporation $673,793,056 3 casesAbbott Laboratories $515,478,000 3 casesCordis Corporation $509,259,438 4 casesJohnson & Johnson $482,000,000 1 casesBoston Scientific Corporation $457,969,451 2 casesApple Inc. $395,169,728 3 casesHynix Semiconductor America, Inc. $349,035,842 1 casesAT&T Inc. $183,789,609 2 casesResearch In Motion Limited $180,646,173 2 casesEthicon Endo-Surgery, Inc. $142,045,960 2 casesVerizon Communications, Inc. $132,422,575 1 casesBoston Communications Group, Inc. $128,025,000 1 casesCingular Wireless LL $122,000,000 1 casesIllumina Inc. $112,522,966 2 casesSony Computer Entertainment America, Inc. $100,500,000 2 casesW.L. Gore & Associates, Inc. $83,508,292 1 casesSAP America, Inc. $80,495,924 1 casesApotex Corp. $76,021,995 1 cases

Lex Machina – Patent Litigation Damages Report 53
Figure 57: Top Parties – Lost Profits Damages Lost
Damages Losing Party Amount Cases
$0.2B $0.4B $0.6B $0.8B $1.0B $1.2BAmount
Abbott Laboratories $1,178,716,000 2 casesSAP America, Inc. $248,158,882 1 casesMitsubishi Heavy Industries, Ltd. $166,750,000 1 casesW.L. Gore & Associates, Inc. $102,081,579 1 casesNuvasive, Inc. $101,196,000 1 casesION Geophysical Corporation $93,400,000 1 casesCorevalve, Inc. $72,645,555 1 casesGlobespan Virata, Inc. $70,000,000 1 casesZimmer, Inc. $70,000,000 1 casesNova Chemicals Inc. $57,447,025 1 casesApplied Biosystems, LLC $52,009,941 1 casesInvitrogen IP Holdings, Inc. $52,009,941 1 casesLife Technologies Corporation $52,009,941 1 casesA10 Networks, Inc. $49,397,904 1 casesBiolitec, Inc. $45,840,000 1 casesAlcon Manufacturing LTD $43,769,358 1 casesLimelight Networks, Inc. $40,102,000 1 casesThomson Inc. $38,482,008 1 casesSchutt Sports, Inc. $24,000,000 1 casesAccess Closure, Inc. $20,400,000 1 cases

Lex Machina – Patent Litigation Damages Report 54
Figure 58: Top Parties – Enhanced Damages Lost
Damages Losing Party Amount Cases
$0M $50M $100M $150MAmount
Zimmer, Inc. $152,217,785 1 casesAlcon Manufacturing LTD $142,600,000 1 casesKXD Technology Inc $87,765,249 1 casesThomson Inc. $76,964,016 1 casesMicrosoft Corporation $65,000,000 2 casesV, Inc. $50,867,936 1 casesVarian Medical Systems, Inc. $39,892,515 1 casesSpring Wang $35,721,884 1 casesCordis Corporation $28,965,446 3 casesU.S. Bank National Association $26,606,000 1 casesAvnet, Inc. $23,099,850 1 casesXilinx, Inc. $23,099,850 1 casesIXYS Corporation $18,128,000 1 casesClear Channel Communications, Inc. $16,507,437 1 casesRudolph Technologies, Inc. $15,582,870 1 casesColl-Fu Enterprise Co., Ltd. $15,000,000 1 casesSamsung Electronics Co., Ltd. $15,000,000 1 casesAbbott Laboratories $14,600,000 1 casesResearch In Motion Limited $14,032,161 1 casesSmith International Inc $12,000,000 1 cases

Lex Machina – Patent Litigation Damages Report 55
Figure 59: Top Parties – Attorneys’ Fees Lost
Damages Losing Party Amount Cases
$0M $2M $4M $6M $8M $10MAmount
Mylan Pharmaceuticals Inc. $11,400,000 1 casesAventis Pharmaceuticals $9,231,058 1 casesVarian Medical Systems, Inc. $9,200,000 1 casesGEO Foundation, Ltd. $8,500,287 2 casesOle K Nilssen $8,500,287 2 casesZimmer, Inc. $8,000,000 1 casesPostech Corporation $7,367,946 1 casesRambus, Inc. $7,123,990 1 casesTalTech Ltd. $6,790,045 1 casesLazare Kaplan International Inc. $6,305,979 1 casesBroadcom Corporation $5,657,827 1 casesAlpahPharm Pty., Ltd. $5,400,000 1 casesAllcare Health Management System, Inc $5,279,754 1 casesBayer BioScience N.V. $4,616,202 1 casesICU Medical Inc $4,587,623 1 casesArmament Systems and Procedures Inc $4,259,745 1 casesStratagene $4,244,636 1 casesResearch In Motion Limited $4,203,161 1 casesSmith International Inc $4,000,000 1 casesKim Laube & Co., Inc. $3,791,922 2 cases

Lex Machina – Patent Litigation Damages Report 56
Law Firms
Figure 60: Top Law Firms – Compensatory Damages Won per Terminated Case
Law Firm Total Compensatory Damages Won
Total Terminated Cases (Won
or Lost)
Compensatory Damages Won per Terminated
Case
1 Caldwell Cassady & Curry
$565,989,600 7 $80,855,657
2 Stokes Roberts & Wagner
$368,094,056 5 $73,618,811
3 Haar & Woods $1,000,000,000 15 $66,666,667
4 Sayles Werbner $1,736,385,153 45 $38,586,337
5 Gammage & Burnham
$185,589,871 6 $30,931,645
6 Hahn & Adema $368,094,056 14 $26,292,433
7 Coleman Law Firm $484,168,646 19 $25,482,560
8 Bridges & Mavrakakis $368,094,056 15 $24,539,604
9 Willi Law Firm $328,654,806 14 $23,475,343
10 H. Craig Hall, Jr. $103,920,250 5 $20,784,050
(showing law firms with 5 or more terminated cases)

Lex Machina – Patent Litigation Damages Report 57
Damages Won
Figure 61: Top Law Firms – Total Cases With Compensatory Damages Won
Firm Cases Total Damages Median Damages
1 Husch Blackwell 45 $1,093,023,898 $183,639
2 Thompson Coburn 30 $23,156,289 $155,170
3 McKool Smith 23 $2,040,431,161 $19,090,000
4 Fish & Richardson 22 $162,384,374 $2,919,631
5 Frilot 19 $11,145,564 $200,000
6 Ireland, Carroll & Kelley 17 $277,147,656 $6,873,357
7 Kirkland & Ellis 17 $909,213,258 $15,399,900
8 McDermott Will & Emery
16 $1,354,836,769 $7,550,000
9 WilmerHale 16 $1,387,709,468 $16,157,784
10 Ward & Smith Law Firm 15 $512,902,119 $8,712,294

Lex Machina – Patent Litigation Damages Report 58
Figure 62 Top Law Firms - Compensatory Damages Won
Law Firm Amount Cases
$0.0B $0.4B $0.8B $1.2B $1.6B $2.0BAmount
McKool Smith $2,040,431,161 23 casesSayles Werbner $1,736,385,153 2 casesWoodcock Washburn $1,695,844,000 2 casesBeck Redden & Secrest $1,691,185,123 4 casesAkin Gump Strauss Hauer & Feld $1,674,210,123 2 casesMillberg Gordon Stewart $1,672,594,000 1 casesWilmerHale $1,387,709,468 16 casesMcDermott Will & Emery $1,354,836,769 16 casesK&L Gates $1,231,409,211 9 casesWinston & Strawn $1,116,824,306 11 casesSidley Austin $1,101,866,324 11 casesHusch Blackwell $1,093,293,898 45 casesArnold & Porter $1,008,900,000 2 casesCovington & Burling $1,004,982,138 2 casesHaar & Woods $1,000,000,000 1 casesKorein Tillery $1,000,000,000 1 casesAlbritton Law Firm $969,925,016 9 casesDickstein Shapiro $955,979,629 5 casesWilliams Morgan & Amerson $947,867,351 3 casesParker, Bunt & Ainsworth $934,331,765 11 cases
Damages TypeCompensatory LumpLost ProfitsReasonable Royalties
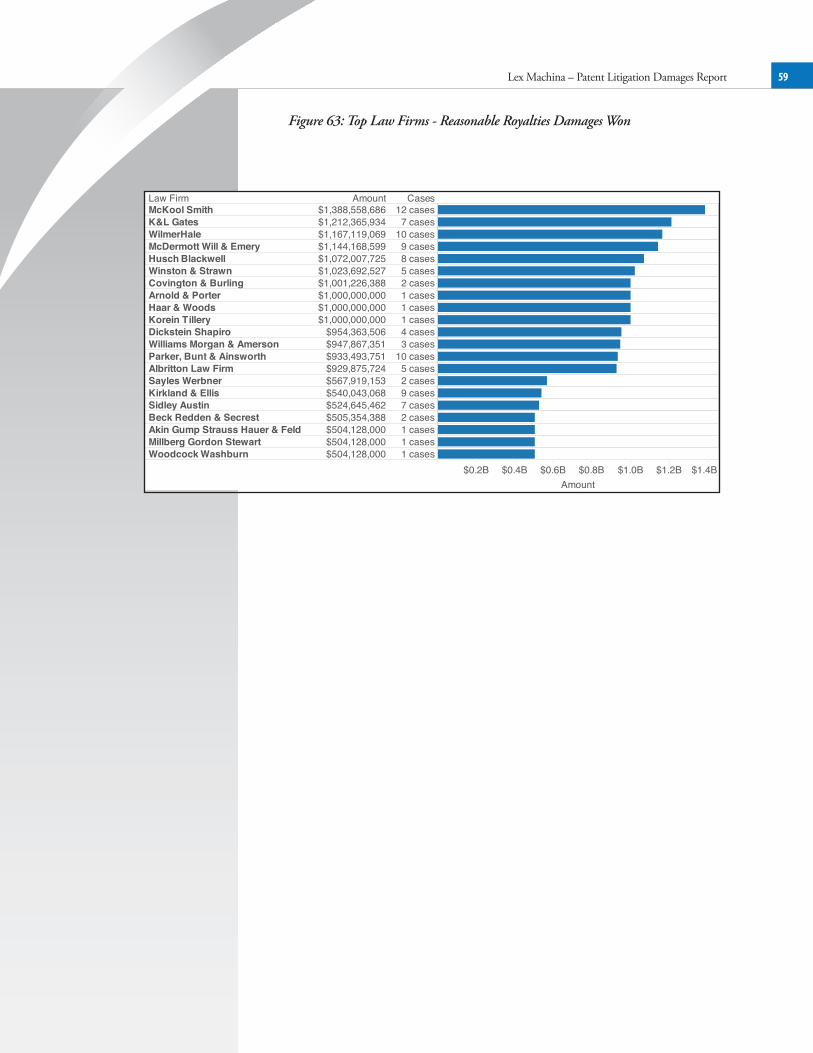
Lex Machina – Patent Litigation Damages Report 59
Figure 63: Top Law Firms - Reasonable Royalties Damages Won
Law Firm Amount Cases
$0.2B $0.4B $0.6B $0.8B $1.0B $1.2B $1.4BAmount
McKool Smith $1,388,558,686 12 casesK&L Gates $1,212,365,934 7 casesWilmerHale $1,167,119,069 10 casesMcDermott Will & Emery $1,144,168,599 9 casesHusch Blackwell $1,072,007,725 8 casesWinston & Strawn $1,023,692,527 5 casesCovington & Burling $1,001,226,388 2 casesArnold & Porter $1,000,000,000 1 casesHaar & Woods $1,000,000,000 1 casesKorein Tillery $1,000,000,000 1 casesDickstein Shapiro $954,363,506 4 casesWilliams Morgan & Amerson $947,867,351 3 casesParker, Bunt & Ainsworth $933,493,751 10 casesAlbritton Law Firm $929,875,724 5 casesSayles Werbner $567,919,153 2 casesKirkland & Ellis $540,043,068 9 casesSidley Austin $524,645,462 7 casesBeck Redden & Secrest $505,354,388 2 casesAkin Gump Strauss Hauer & Feld $504,128,000 1 casesMillberg Gordon Stewart $504,128,000 1 casesWoodcock Washburn $504,128,000 1 cases

Lex Machina – Patent Litigation Damages Report 60
Figure 64: Top Law Firms – Lost Profits Damages Won
Law Firm Amount Cases
$0.0B $0.2B $0.4B $0.6B $0.8B $1.0B $1.2BAmount
Woodcock Washburn $1,187,066,000 2 casesBeck Redden & Secrest $1,185,830,735 4 casesAkin Gump Strauss Hauer & Feld $1,168,466,000 1 casesMillberg Gordon Stewart $1,168,466,000 1 casesSayles Werbner $1,168,466,000 1 casesMcKool Smith $355,476,929 3 casesKirkland & Ellis $336,104,586 6 casesPatton Tidwell & Schroeder $268,558,882 2 casesAhmad, Zavitsanos, Anaipakos, Alavi & Mensing $248,158,882 1 casesLee & Hayes $248,158,882 1 casesWilli Law Firm $248,158,882 1 casesPaul, Weiss, Rifkind, Wharton & Garrison $239,395,555 2 casesWeil, Gotshal & Manges $174,767,762 2 casesShore Chan Bragalone $172,250,000 2 casesFitzpatrick, Cella, Harper & Scinto $166,750,000 1 casesWilmerHale $162,123,364 4 casesMorris, Nichols, Arsht & Tunnell $147,092,580 3 casesDesmarais $111,931,022 2 casesSmyser Kaplan & Veselka $102,295,985 2 casesFennemore Craig $102,081,579 1 casesGammage & Burnham $102,081,579 1 casesLatham & Watkins $102,081,579 1 casesPolese Pietzsch Williams & Nolan $102,081,579 1 casesRopes & Gray $102,081,579 1 casesWolf, Greenfield & Sacks $102,081,579 1 cases

Lex Machina – Patent Litigation Damages Report 61
Figure 65: Top Law Firms - Enhanced Damages Won
Law Firm Amount Cases
$0M $50M $100M $150MAmount
McAndrews, Held & Malloy $152,217,785 1 casesMiller Johnson $152,217,785 1 casesPotter Anderson & Corroon $146,690,000 2 casesWard & Smith Law Firm $111,146,852 5 casesGreenberg Traurig $102,314,795 6 casesKilpatrick Townsend & Stockton $95,476,503 2 casesFinnegan, Henderson, Farabow, Garrett & Dunner $89,147,994 4 casesKeats McFarland & Wilson $88,843,059 4 casesJai Rho Law Offices $88,813,059 3 casesFox Rothschild $88,566,443 2 casesStubbs Alderton & Markiles $88,566,443 2 casesAnglin Flewelling Rasmussen Campbell & Trytten $87,765,249 1 casesKleinberg & Lerner $87,765,249 1 casesOKeefe & Associates $87,765,249 1 casesNiro, Scavone, Haller & Niro $78,068,473 3 casesEckert Seamans Cherin & Mellott $77,428,027 2 casesMcKool Smith $66,782,850 3 casesParker, Bunt & Ainsworth $63,099,850 2 casesKirkland & Ellis $56,235,916 4 casesFish & Richardson $55,476,913 4 cases

Lex Machina – Patent Litigation Damages Report 62
Figure 66 : Top Law Firms – Attorneys’ Fees Won
Law Firm Amount Cases
$0M $5M $10M $15M $20M $25MAmount
Edwards Wildman Palmer $26,796,986 4 casesKirkland & Ellis $19,440,941 7 casesDLA Piper $17,329,191 7 casesMichael Best & Friedrich $14,263,399 6 casesWinston & Strawn $13,588,564 5 casesMcAndrews, Held & Malloy $12,587,623 2 casesMorgan Lewis & Bockius $9,478,793 3 casesDel Sole Cavanaugh Stroyd $9,200,000 1 casesMiller Johnson $8,000,000 1 casesSullivan & Cromwell $7,367,946 1 casesMcGuireWoods $7,123,990 1 casesGreenberg Traurig $6,491,000 6 casesFinnegan, Henderson, Farabow, Garrett & Dunner $6,425,893 3 casesHowrey $6,104,141 4 casesTroutman Sanders $5,974,221 6 casesQuinn Emanuel Urquhart & Sullivan $5,923,870 4 casesMcDermott Will & Emery $5,841,677 4 casesCohen Pontani Lieberman & Pavane $5,822,893 2 casesReed Smith $5,804,413 3 casesSteptoe & Johnson $5,600,000 1 casesSterne, Kessler, Goldstein & Fox $5,600,000 1 casesHusch Blackwell $5,472,270 6 cases

Lex Machina – Patent Litigation Damages Report 69
Lex Machina’s DataThis report draws on data from Lex Machina’s specialized intellectual property litigation database. Although most of our data is derived from litigation information publicly available from PACER (federal court system) or EDIS (the ITC system), Lex Machina applies additional layers of intelligence to bring consistency to, and ensure the completeness of, the data.
For example, this report analyzes trends in patent litigation. To determine whether a case is a patent case, others may blindly trust the Cause-of-Action (CoA) and Nature-of-Suit (NoS) codes entered in PACER. But Lex Machina actively analyzes complaints to ensure that patent cases filed under mistaken CoA/NoS codes (or a CoA/NoS code corresponding to a different claim, e.g. contract in a combined patent/contract case) are not missed. This same system also allows Lex Machina to filter out the many spurious cases that have no claim of patent infringement despite bearing a patent CoA/NoS code (e.g. false marking cases).
Moreover, due to inherent design limitations, PACER often shows inaccurate or corrupted information for older terminated cases. For example, when a lawyer leaves one firm for another, PACER may show closed cases that the lawyer worked on at his old firm as having been handled by his new firm. When combined with law firm splits, acquisitions, and mergers, these inaccuracies accumulate to render PACER data less reliable for older cases. Lex Machina, however, has a historic record going back to the first days of electronic filing on PACER (and other data going back even further). These snapshots, unique to Lex Machina, give us access to normalized contemporary data and enable us to provide more accurate data for older cases than someone using PACER today.

Lex Machina1010 Doyle Street, Suite 200Menlo Park, CA 94025Phone: (650) 390-9500www.lexmachina.com© 2014 Lex Machina