Overview - Transport Accident Web viewVehicle ownership and purchasing. ... The average interview...
112
Road Safety Monitor 2015 Wave 17 Report December 2015 Prepared for: Hafez Alavi & Michael Nieuwesteeg The Transport Accident Commission Victoria PO Box 742 Geelong VIC 3220 Prepared by: Kim Borg & Shane Compton The Social Research Centre Level 9, 277 William Street
Transcript of Overview - Transport Accident Web viewVehicle ownership and purchasing. ... The average interview...

Road Safety Monitor 2015Wave 17 Report
December 2015
Prepared for:Hafez Alavi & Michael Nieuwesteeg
The Transport Accident Commission Victoria
PO Box 742
Geelong VIC 3220
Prepared by:Kim Borg & Shane Compton
The Social Research Centre
Level 9, 277 William Street
Melbourne VIC 3051
Ph: (613) 9236 8500 Fax: (613) 9602 5422
www.srcentre.com.au [email protected]

Road Safety Monitor 2015A Summary Report for the TAC
Contents
Executive summary......................................................................................................................................... i1. Introduction........................................................................................................................................... 1
1.1. Background and objectives.....................................................................................................11.2. Reading this report.................................................................................................................. 5
2. Driver demographics and characteristics........................................................................................102.1. Driver profile.......................................................................................................................... 102.2. Individual characteristics.......................................................................................................12
3. Driving attitudes and behaviours......................................................................................................173.1. Perceived cause of road accidents........................................................................................173.2. Personal safety...................................................................................................................... 173.3. Level of danger in driving behaviours....................................................................................20
4. Towards zero...................................................................................................................................... 234.1. Acceptable number of deaths................................................................................................234.2. Belief in ‘zero’........................................................................................................................244.3. Regression analysis (Towards Zero).....................................................................................26
5. Speed................................................................................................................................................... 285.1. Definition of speeding............................................................................................................285.2. Frequency of speeding..........................................................................................................295.3. Speeding behaviour..............................................................................................................305.4. Attitudes toward speeding.....................................................................................................325.5. Regression analysis (Speeding)............................................................................................33
6. Impaired driving.................................................................................................................................. 366.1. Use of drugs & alcohol..........................................................................................................366.2. Attitudes to impaired driving..................................................................................................376.3. Drink and drug driving...........................................................................................................386.4. Regression analysis (drink driving)........................................................................................43
7. Drowsy driving.................................................................................................................................... 467.1. Regular drowsy driving..........................................................................................................467.2. Attitudes to drowsy driving....................................................................................................477.3. Regression analysis (drowsy driving)....................................................................................48
8. Distractions......................................................................................................................................... 498.1. Distractions while driving.......................................................................................................498.2. Mobile phone use.................................................................................................................. 518.3. Regression analysis (phone use while driving)......................................................................54
9. Vehicle ownership & purchasing......................................................................................................559.1. Vehicle ownership.................................................................................................................559.2. Purchasing behaviour............................................................................................................58
Appendix 1 – Hardcopy Questionnaire.......................................................................................................62Appendix 2 – Online Questionnaire............................................................................................................63Appendix 3 – CATI Follow-up Script...........................................................................................................64

Road Safety Monitor 2015 A Summary Report for the TAC
The Social Research Centre

Road Safety Monitor 2015 A Summary Report for the TAC
List of figures
Figure 1.1: Example Odds ratios for model of mobile phone use while driving.................................................8Figure 2.1: Work status – time series (%).......................................................................................................10Figure 2.2: Type of vehicle used for work related purposes (%) (2015)..........................................................11Figure 2.3: Average kilometres driven per year (2012 to 2015 total sample)..................................................12Figure 2.4: Road accidents in last five years (%) – time series......................................................................14Figure 2.5: Rating of driving (%) (2012 to 2015 total sample).........................................................................15Figure 3.1: Factors that lead to serious road accidents (%) (2015)................................................................17Figure 3.2: Concerns about personal safety on the road (%) (2015)..............................................................17Figure 3.3: Wears a seatbelt all the time (%) - time series.............................................................................19Figure 3.4: Level of danger in driving behaviours (mean) (2015)...................................................................20Figure 4.1: Accident acceptability (2015)........................................................................................................23Figure 4.2: Odds ratios for model of perceived acceptability of current road toll............................................26Figure 4.3: Odds ratios for model of Belief that zero deaths from road accidents is possible.........................27Figure 5.1: Definition of speeding in a 60km/h and 100km/h zone – time series............................................28Figure 5.2: Frequency of driving over THE POSTED speed (2015)...............................................................29Figure 5.3: Frequency of driving over SELF-DEFINED speed (2015)............................................................29Figure 5.4: Incidence of being caught speeding in last 12 months – time series............................................30Figure 5.5: Odds ratios for model of Speeding...............................................................................................33Figure 5.6: Odds ratios for model of High chance of being caught speeding..................................................34Figure 5.7: Odds ratios for model of Easy to avoid being caught while speeding...........................................35Figure 6.1: Alcohol and drug use* – time series.............................................................................................36Figure 6.2: Plan for getting home the last time drinking – time series.............................................................38Figure 6.3: Drivers tested in the last 12 months – time series........................................................................39Figure 6.4: Reasons for being a passenger when driver over the legal limit (%) (2015).................................41Figure 6.5: Reasons for driving when over the legal limit (%) (2015).............................................................42Figure 6.6: Number of times driven under the limit (%) (2015 Pulse and Main)..............................................42Figure 6.7: Odds ratios for model of Drink driving..........................................................................................43Figure 6.8: Odds ratios for model of Easy to avoid being caught while driving over 0.05 limit........................44Figure 6.9: Odds ratios for model of High change of being caught while driving over 0.05 limit.....................45Figure 7.1: Regularly driving while drowsy (2013 to 2015 total sample).........................................................46Figure 7.2: Why drove while drowsy (%) (2015).............................................................................................47Figure 7.3: Odds ratios for model of Drowsy driving.......................................................................................48Figure 8.1: Use of handheld mobile while driving – time series......................................................................49Figure 8.2: Distractions while driving (multiple response) (2013 to 2015 total sample)..................................49Figure 8.3: Normal phone use in car (%) (2012 to 2015 total sample)............................................................51Figure 8.4: Odds ratios for model of mobile phone use while driving.............................................................54Figure 9.1: Car ownership (%) (2015).............................................................................................................55Figure 9.2: Importance of car to respondent (2015)........................................................................................56Figure 9.3: Forms of transport (2015).............................................................................................................57Figure 9.4: Future car purchase intent – time series.......................................................................................58Figure 9.5: New versus used car purchase intent – time series.....................................................................58Figure 9.6: Type of car purchase (2015).........................................................................................................59Figure 9.7: Factors influencing vehicle selection (mean) (2015).....................................................................59Figure 9.8: Safety factors influencing vehicle selection (mean) (2015)...........................................................61
The Social Research Centre
Road Safety Monitor 2015 A Summary Report for the TAC
List of tables
Table 1.1: Overview of the RSM schedule........................................................................................................2Table 1.2: Cooperation rate by mode of completion and basic demographic characteristics...........................3Table 1.3: Weighting parameters...................................................................................................................... 6Table 1.4: Categories for occupation (Q5) and vehicle type (Q49 type)...........................................................9Table 2.1: Licence type by demographics (2015)...........................................................................................10Table 2.2: Occupation by demographics (2015).............................................................................................11Table 2.3: Average kilometres by demographics (2015).................................................................................12Table 2.4: Average kilometres by behaviours (2015)......................................................................................13Table 2.5: Road accidents in last five years and personal injury by demographics (2015).............................14Table 2.6: Road accidents in last five years and personal injury by behaviours (2015)..................................15Table 2.7: Self-reported driving competency by demographics (2015)...........................................................16Table 2.8: Self-reported driving competency by behaviour (2015).................................................................16Table 3.1: Concerns about personal safety on the road by demographics (2015)..........................................18Table 3.2: Concerns about personal safety on the road by behaviours (2015)...............................................19Table 3.3: Level of danger in driving behaviours by demographics (2015).....................................................21Table 3.4: Level of danger in driving behaviours by behaviours (2015)..........................................................22Table 4.1: Accident acceptability (number of deaths) by demographics (2015)..............................................23Table 4.2: Accident acceptability (number of deaths) by behaviours (2015)...................................................24Table 4.3: Believe in no deaths as a result of road accidents by demographics (2015).................................24Table 4.4: Believe in no deaths as a result of road accidents by behaviours (2015)......................................25Table 5.1: Frequency of self-defined speeding by demographics (2015).......................................................30Table 5.2: Speeding behaviour by demographics (2015)...............................................................................31Table 5.3: Speeding behaviour by behaviours (2015)....................................................................................31Table 5.4: Attitudes towards speeding (total agree %) by demographics (2015)............................................32Table 5.5: Attitudes towards speeding (total agree %) by behaviours (2015).................................................32Table 6.1: Alcohol and drug use by demographics (2015)..............................................................................36Table 6.2: Alcohol and drug use by behaviours (2015)...................................................................................37Table 6.3: Attitudes to impaired driving (total agree %) by demographics (2015)...........................................37Table 6.4: Attitudes to impaired driving (total agree %) by behaviours (2015)................................................38Table 6.5: Drivers tested in the last 12 months by demographics (2015).......................................................39Table 6.6: Driver & passenger who got into car by demographics (2015)......................................................40Table 6.7: Driver & passenger who got into car by behaviours (2015)...........................................................41Table 7.1: Regularly driving while drowsy by demographics (2015)...............................................................46Table 7.2: Regularly driving while drowsy by behaviours (2015)....................................................................46Table 7.3: Attitudes to drowsy driving (total agree and mean) by demographics (2015)................................47Table 7.4: Attitudes to drowsy driving (total agree %) by behaviours (2015)..................................................47Table 8.1: Attitudes to distracted driving (total agree %) by demographics (2015).........................................50Table 8.2: Attitudes to distracted driving (total agree %) by behaviours (2015)..............................................50Table 8.3: Normal phone use in car by demographics (2015)........................................................................51Table 8.4: Normal phone use in car by behaviours (2015).............................................................................52Table 8.5: Use of handheld mobile for calls in car by demographics (2015)...................................................52Table 8.6: Use of handheld mobile for texting in car by demographics (2015)...............................................53Table 9.1: Most common makes of car by demographics (top 10) (2015)......................................................56Table 9.2: Mean number of vehicles in household by demographics (2015)..................................................57Table 9.3: Factors influencing vehicle selection (mean) by demographics (2015)..........................................60Table 9.4: Consider crash test results when purchasing by demographics (2015).........................................61
The Social Research Centre

Road Safety Monitor 2015 Page iA Summary Report for the TAC
Executive summary
Overview
This report presents the findings from the 17th wave of the Transport Accident Commission’s (TAC) Road
Safety Monitor (RSM) – the ‘Main’ 2015 survey. In total, 2,000 licence holders and registered vehicle owners
from Victoria were invited to participate and 961 (48.1%) completed the survey. Participants were randomly
selected from the VicRoads driver licence and registration database, within a number of sampling categories
(age, gender, location and socioeconomic quintile) to ensure a representative sample was achieved.
All participants were mailed a paper questionnaire and a return envelope on September 14, 2015. The letter
also contained a username and password to enable the respondent to complete the survey online or to call
the Social Research Centre to complete the survey over the phone. Follow-up phone calls were conducted
from October 7 with non-responders after the initial survey distribution and reminder letter activity, in which
respondents were encouraged to complete the survey and offered the option of completing the survey over
the phone.
Driver demographics and characteristics
Similar to previous waves, the vast majority of licence holders were employed with around one in ten not in
the workforce or unemployed. Respondents who drove a vehicle for work related purposes typically drove a
car (65%), a utility/pick up (15%), or a commercial van (6%).
Just over 50% of drivers were classified as ‘long distance drivers’ that is, driving more than 15,000km per
year or 300km per week. More regional respondents were classified as long distance drivers compared to
metropolitan respondents.
Remaining relatively consistent with previous waves, 16% of respondents reported that they had been
involved in a road accident within the last five years. Of those involved in an accident, 17% reported that
someone involved in the accident sustained personal injury. Driver confidence remains similar to previous
waves with around two thirds (65%) rating themselves as ‘better than average’.
Driving attitudes and behaviours
When asked about major contributing factors that could lead to serious road accidents, seven in ten (70%)
mentioned alcohol and more than half (54%) believed that speed was a key factor. In 2015 a question was
introduced which asked respondents to nominate their greatest concern about their own safety on the road
as a driver or passenger. While ‘speed’ (13%) and ‘alcohol’ (12%) were nominated by around one in ten
respondents, the most common responses were general mentions of ‘aggressive or reckless drivers’ (28%),
and simply ‘other drivers’ (24%).
Similar to previous waves, the vast majority of licence holders aged 18 to 60 years (98%) reported always
wearing a seatbelt when they drive. Also consistent with previous waves, respondents generally rated driving
while impaired (drugs or alcohol) and driving while using a hand held phone as ‘very dangerous’, with slightly
lower ratings for driving with a hands free phone and speeding.
The Social Research Centre

Road Safety Monitor 2015 Page iiA Summary Report for the TAC
Towards Zero
In the 2015 ‘Main’ and the 2015 ‘Pulse’ questions were included in the RSM to assess community attitudes
around the concept of ‘Towards Zero’. At the start of the 2015 ‘Main’ surveying period Phase 1 of the
Towards Zero campaign was run (‘Man on the street’).
In the 2015 Main, around three quarters (76%) of respondents felt that the current road toll of around 250
was unacceptable – this was significantly lower than the 2015 Pulse (84%). Males were twice as likely as
females to find the road toll acceptable; respondents aged 61 or older were less likely to agree than those
aged 18 to 25 years. When respondents were asked about their belief in the possibility of a zero road toll in
the future, one in ten (11%) believed that ‘zero deaths’ could be achieved. Most of those who believed in the
possibility of a zero road toll felt it would take up to 20 years to achieve (61%).
Speed
When road users nominated an ‘acceptable speed limit’, the proportion who believed that they should be
able to drive in excess of 5km over the limit in a 100km/h zone increased marginally compared to 2014 but
has remained relatively consistent in recent years. Around half of respondents stated that they never drive
over the posted speed, while around one in ten drive above the posted speed limit at least half of the time in
a 60km/ zone and 100km/h zone. This finding was very similar for driving over their self-defined limit in both
speed zones. After accounting for other characteristics, male drivers were almost three times as likely to
drive over their self-defined speed limit compared to females; older drivers were significantly less likely to
driver over their self-defined limit than 18 to 25 year olds; and ‘blue collar’ workers (technicians and trade
workers, labourers, and machinery operators and drivers) were four times as likely as those not in the
workforce.
When all respondents are included, around one in six (16%) had been caught speeding in the last twelve
months with an average of 1.26 times. Typically, more males and respondents from metropolitan areas had
been caught speeding than females and those from regional areas.
When asked to rate their level of agreement toward specific speeding attitude statements, more than half
(53%) of respondents agreed that they had a high chance of being caught speeding – regional respondents
were twice as likely to agree compared to metropolitan respondents. Around a third (32%) believed that it
was easy to avoid being caught driving over the limit – young respondents (aged 18 to 25) were significantly
more likely to agree compared to those aged 26 years or older. And a quarter (25%) agreed that their family
and friends felt it was okay to speed a few kilometres over in a 60km/h zone.
Impaired driving
Three quarters of respondents (75%) stated that they drank alcohol, compared to only 6% who admitted to
using recreational drugs. Of those who drank alcohol, around one in ten (9%) had driven after drinking when
they thought they were over the legal limit, and 6% had been a passenger when they thought the driver may
have been over the limit. In contrast, 57% said that they had never driven after they had been drinking even
when they thought they were under the legal limit.
Males were twice as likely as females to have driven when they suspected they were over the limit; those
aged 61 or older were less likely than those aged 18 to 25; and SUV/4WD drivers were less likely to have
driven after drinking compared to drivers of passenger cars. Of the 60 respondents who reported that they
use drugs, 10 stated that they had driven after taking drugs in the last twelve months.
The Social Research Centre

Road Safety Monitor 2015 Page iiiA Summary Report for the TAC
Just over half (57%) of all respondents agreed that if they were even just slightly over the limit, they were
likely to be caught – those aged 40 to 60 were twice as likely to agree compared to 18 to 25 year olds.
Around one in four (23%) agreed that it was easy to avoid being caught if they were driving over the legal
alcohol limit – 18 to 25 year olds were significantly more likely to agree than 40 to 60 year olds. Similarly,
19% of respondents agreed that it was easy to avoid being caught if they drive after using drugs. Just 9%
believed that their family and friends thought it was okay to drive slightly over the legal 0.05 limit.
Drowsy driving
Similar to previous waves, a small proportion (9%) of respondents admitted that they regularly drive while
feeling drowsy. Drowsy driving was significantly more likely among those aged 18 to 25, and among ‘blue
collar’ workers (compared to those not in the workforce). Around a third (34%) believed that it was easy to
keep themselves awake if they needed to drive, despite the general view that driving while drowsy was
dangerous – considered just as dangerous as driving after taking drugs or drinking alcohol.
Distractions
The most common driving distractions reported by respondents were other drivers (40%), their own thoughts
(36%), and passengers (24%). Mobile phones were only mentioned by 18% of respondents. Since 2013
there has also been a gradual decline in the proportion of licence holders aged 18 to 60 years who use a
handheld mobile while driving. When asked how they use their mobile when driving, most respondents said
they either do not use their phone at all while driving (42%), or they use a hands free kit such as Bluetooth
(41%).
The minority of respondents continue to use handheld mobile phone for calls while driving – most commonly
to answer a call but placing the phone on their lap or using the in-built speaker (22%). Almost one in ten (9%)
said they would make a call while actively driving. When asked about texting while driving the most common
behaviour was reading a text while stopped at the lights (34%). Only 5% said they would write and send a
message while actively driving.
A large proportion of respondents believed that taking their eyes off the road for two seconds is dangerous
(88%) and agreed that they could ignore their phone if a message or phone call was to arrive while they were
driving (87%). Meanwhile, almost two in ten (18%) believe that their family and friends thought it was okay to
use a mobile phone without using a hands free kit.
Vehicle ownership & purchasing
Most respondents (79%) personally owned the car they drive with just 2% not owning or ever driving a car.
More females owned the car they drove (while males were more likely to have both a company car and a
personal car). Many young drivers used a car belonging to someone else. A large proportion of respondents
felt that the car they drove was important to them to some extent, with just 11% reporting they don’t care
about the car they drive. On average, there were 2.18 cars, 0.20 motorbikes, 0.07 trucks or buses registered
to each household. Regional households more often had trucks or buses registered than metropolitan
households.
Four in ten (41%) respondents indicated that they intended to purchase a car in the future with 18% intending
to purchase within the next twelve months. Of those who were planning to make a purchase, 43% intended
to buy a used car and 34% intended to buy a new car.
The Social Research Centre

Road Safety Monitor 2015 Page 1A Summary Report for the TAC
1. Introduction
1.1. Background and objectives
1.1.1. Background
The Transport Accident Commission (TAC) was formed in 1986 by the Victorian Government. The
primary statutory roles of the TAC are a) to provide personal injury insurance to people injured in
transport accidents and b) to promote road safety in Victoria.
The TAC Road Safety Monitor (RSM) has been conducted annually since the benchmark survey in
2001. During that time a number of different research agencies have undertaken the fieldwork and
reporting for this research. Since 2010, the Social Research Centre has been commissioned to
undertake the research, implementing a number of changes to improve the research tool and
reporting. As of 2014, two waves of the RSM are run – a shorter ‘Pulse’ version, and the standard
‘Main’ version.
This document reports on findings from the 2015 ‘Main’ RSM specifically (hereafter referred to as the
2015 RSM) but also highlights key changes over time (particularly between 2014 and 2015) and
discusses how different groups of Victorian drivers and registered vehicle owners think and behave
with respect to road safety issues.
This research has been undertaken in accordance with the Privacy Act (1988) and the Australian
Privacy Principles contained therein, the Privacy (Market and Social Research) Code 2014, the
Australian Market and Social Research Society’s Code of Professional Practice, and ISO 20252
standards.
1.1.2. Research objectives
The broad objectives of the RSM are to:
Monitor driver attitudes and self-reported behaviour in regards to road safety issues;
Identify potential areas of concern for the TAC in the community; and
Provide information that assists in the development of programs that address these community
concerns.
The specific objectives of the RSM are to:
Monitor the change in attitudes and behaviours of drivers regarding a range of road safety
issues, including:
o Speed;
o Impaired driving;
o Drowsy driving
o Distractions; and
o Vehicle ownership and purchasing.
The Social Research Centre

Road Safety Monitor 2015 Page 2A Summary Report for the TAC
o Identify groups of Victorian drivers who have different attitudes, behaviours and histories
The Social Research Centre

Road Safety Monitor 2015 Page 3A Summary Report for the TAC
1.1.3. Research methodology
The RSM has evolved over time and changes in methodology may have impacted historical results
contained within this report:
From 2001 to 2007 the RSM was conducted exclusively via telephone interviewing. An internet
pilot was conducted in 2007.
In 2008 and 2009 the research simultaneously used both telephone and online methodologies
for data collection.
From 2010 the methodology was altered to allow flexible participation, so that paper, online and
CATI surveying are all employed.
From 2014 the Monitor was extended to be conducted twice yearly as a (smaller) ‘Pulse’ survey
and a (full) ‘Main’ survey.
In 2010, the TAC was granted access to the VicRoads driver licence and registration database. This
database is used to randomly select individuals to represent the State, and these individuals are
posted an invitation to participate in the survey, along with a paper copy of the questionnaire. In 2015
(Main), 2,000 individuals were sampled from the VicRoads database and sent a hard copy survey.
Participants were also provided with the option of completing the survey online or over the phone (by
using a free call 1800 number). One week after the surveys were mailed, a reminder letter was sent to
participants yet to complete the survey, with another following approximately one week after that.
Reminder calls targeted low-response groups who had an active and identifiable phone number. Table
1.1 provides an overview of the RSM schedule for 2015.
Table 1.1: Overview of the RSM schedulePhase / task DateFinalisation of questionnaire 18-Aug-2015
Finalisation of sample 21-Aug-2015
Initial mail out 14-Sep-2015
1800 number operational 15-Sep-2015
Online survey launch 15-Sep-2015
Reminder letter mailing 23-Sep-2015
Second reminder letter mailing 1-Oct-2015
Commence telephone response maximisation activity 7-Oct-2015
Complete telephone response maximisation activity 27-Oct-2015
Online survey close 2-Nov-2015
Cut off for data processing (hard copy returns) 3-Nov-2015
As part of this methodology, an incentive of entry into a draw for one of six $250 prizes was offered to
all of those who completed the survey (two were offered to those responding within the first weeks of
the survey), with an additional $500 prize draw for those who responded online. This additional
incentive for online completion was offered to encourage respondents to choose this option as it is
The Social Research Centre

Road Safety Monitor 2015 Page 4A Summary Report for the TAC
more cost effective and ensures appropriate questions are asked through programmed sequencing
(e.g. only asking drink-driving questions of those who drink alcohol).
1.1.4. Fieldwork overview
The 2015 survey is based on a sample of 961 licence holders and registered vehicle owners from
across Victoria. In total, 2,000 Victorians were invited to participate in the survey. The overall
cooperation rate was 48.1%. The cooperation rate was slightly higher than previous years (typically
averaging around 47%). It is suspected that the improvement in cooperation rate may was most likely
influenced by improved sample quality.
The initial survey invitation was sent by mail on September 14, 2015. Two reminder letters were also
sent to non-responders, the first on September 23 and the second on October 1. One week after the
second reminder letter was sent, reminder calls began (October 7) for those respondents who had not
completed the survey and for whom a phone number was identified by the TAC using Sensis’
MacroMatch service. The survey remained open for seven weeks, closing on November 2.
Almost half of the surveys were completed via hard copy (446), with 418 completed online. The CATI
reminder component achieved 97 interviews. The average interview length for CATI completes was
just over 22 minutes.
1.1.5. Sample performance
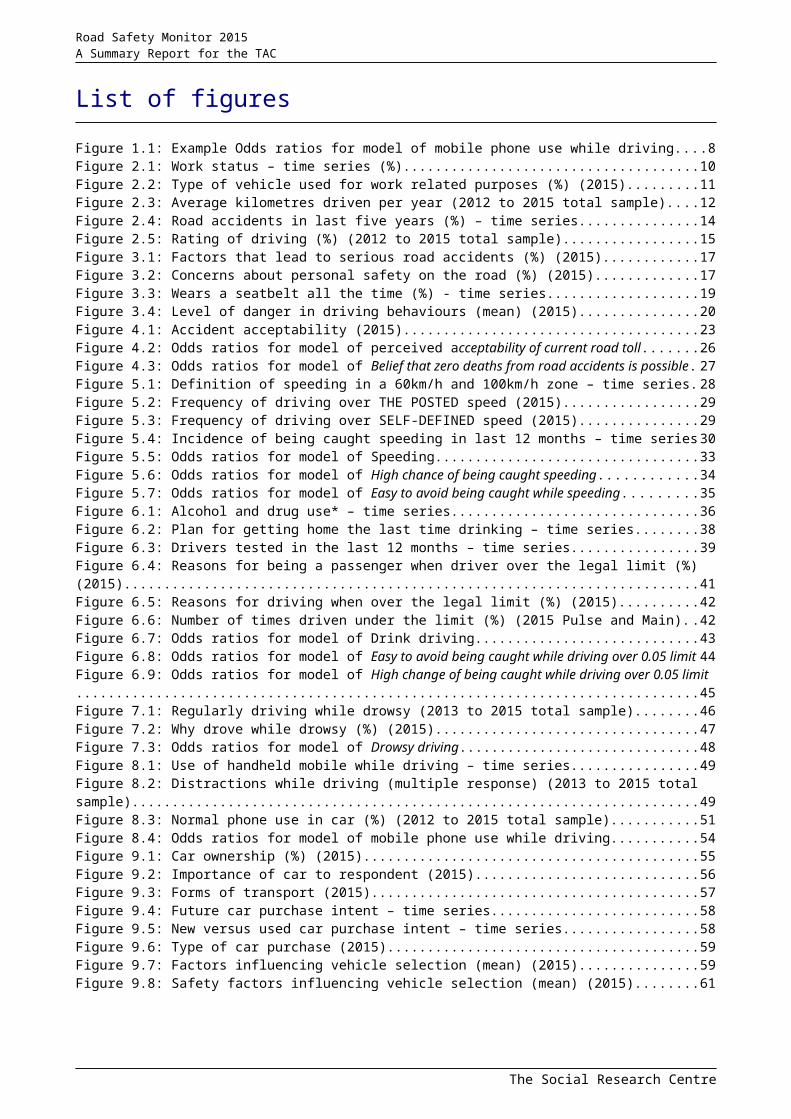
Table 1.2 below summarises the final cooperation rate by mode of completion and basic demographic
characteristics. As in previous years, gender differences were observed where cooperation rates for
males were lower than females (44.3% and 51.7% respectively) and those aged 61+ were more likely
to respond (59.8%) than younger age groups (38.2% for 18-24 year olds, 38.5% for 25-39 year olds).
Young adults (18-25 years) were more likely to complete online (20.1%) or via CATI (8.2%) compared
to older adults (61+ years) who were more likely to complete via hardcopy (43.5%).
Table 1.2: Cooperation rate by mode of completion and basic demographic characteristicsCompletion Mode
Total sample Completes Coop.
rateOnline
completeHardcopy complete
Phone interview
Total 2000 961 48.1% 20.9% 22.3% 4.9%
SEIFA Index
1st Quintile 265 123 46.4% 17.0% 25.7% 3.8%2nd Quintile 214 101 47.2% 17.3% 24.3% 5.6%3rd Quintile 344 157 45.6% 18.3% 21.5% 5.8%4th Quintile 583 288 49.4% 24.0% 20.6% 4.8%5th Quintile 594 292 49.2% 22.4% 22.2% 4.5%
GenderMale 1092 483 44.2% 19.1% 19.8% 5.3%Female 908 470 51.8% 22.8% 24.7% 4.3%Refused - 8
Age group
18-25 353 135 38.2% 20.1% 9.9% 8.2%26-39 645 248 38.4% 20.3% 12.7% 5.4%40-60 627 330 52.6% 24.4% 25.4% 2.9%61-90 375 225 60.0% 12.5% 43.5% 4.0%Refused - 23
The Social Research Centre

Road Safety Monitor 2015 Page 5A Summary Report for the TAC
LocationMetro 1428 695 48.7% 21.7% 22.0% 5.0%
Regional 572 266 46.5% 18.9% 23.1% 4.5%
1.1.6. Road Safety in Victoria during the survey period (September – November 2015)
The single biggest focus for the TAC during the survey period for this iteration of the Road Safety
Monitor has been Towards Zero. Towards Zero is a vision for a future free of deaths and serious
injuries on our roads. Latest road safety data show that in the twelve months to September 2015, 250
people died on Victorian roads1 and while this is approximately a quarter2 of what it was four decades
ago we are aspiring for zero fatalities and serious injuries.
Towards Zero represents a philosophy that acknowledges that humans are fallible – they make errors
of judgement or deliberately refuse to do the right thing. This reality, coupled with the fact that road
crashes frequently involve impacts that our bodies cannot withstand, means humans will almost
always come off badly when mistakes happen3 unless we improve the system. The most ethical and
pragmatic way then to seek to reduce road trauma is to design a transport system within which human
frailty and fallibility are accommodated4. The components of this system are: safe roads, safe speeds,
safe vehicles and safe people.
The Towards Zero vision is a partnership between the TAC, VicRoads, Victoria Police, the Department
of Justice and Regulation and the Department of Health and Human Services5. Most importantly
Towards Zero is a collaborative effort with the Victorian community to improve road safety. If we all
understand the key principles of Towards Zero and work together everyone will be better off.
The 2013-2022 Road Safety Strategy6 embodies the Towards Zero philosophy and outlines an
approach to achieving major safety improvements. This ten year strategy aims to reduce the road toll
by more than 30%, to fewer than 200 deaths per year. Of course, the TAC’s vision is ultimately zero
deaths or serious injuries.
In addition to Toward Zero, TAC’s campaign activity7 during this reporting period also focussed on
drink driving and motorcycles. Using the full range of online, sponsorship, print and media channels
these campaigns targeted the general Victorian community as well as higher risk audiences such as
younger males and regional Victorians.
This iteration of the Road Safety Monitor maintains its focus on key tracking measures around road
safety attitudes and behaviours (e.g. speeding, drink driving, drowsy driving, and distractions) but it
also includes a number of enhancements to reflect the focus for the TAC on Towards Zero:
Inclusion of an open ended question about road safety concerns (see 3.2. Personal safety)
Inclusion of three questions to assess attitudes to ‘Towards Zero’;
o In the current number of deaths Acceptable/Unacceptable? (Section 4.1.)
o Will there be no deaths as a result of road accidents one day in Victoria? (Section 4.2.)
1 Road Safety Statistical Summary, September 2015 (RSSS_SEP15.pdf)2 https://www.towardszero.vic.gov.au/3 https://www.towardszero.vic.gov.au/what-is-towards-zero/what-is-towards-zero 4 https://www.towardszero.vic.gov.au/making-progress/articles/vision-zero-and-swedens-approach-to-road-safety 5 https://www.towardszero.vic.gov.au/what-is-towards-zero/whos-behind-towards-zero 6 https://www.towardszero.vic.gov.au/__data/assets/pdf_file/0011/171659/road_safety_strategy.pdf 7 TAC campaigns during the reporting period (TAC Campaigns Sept - Nov 2015.xls)
The Social Research Centre

Road Safety Monitor 2015 Page 6A Summary Report for the TAC
o How long will it take to reach zero road deaths in Victoria? (Section 4.2.)
1.2. Reading this report
1.2.1. Time series reporting
Prior to 2012, only drivers with a current licence aged 18 to 60 years were invited to participate in the
RSM. In recent years, all Victorians who held a drivers licence (regardless of status) or vehicle
registration were invited to participate (selected from the VicRoads database). This included drivers
whose licence was currently disqualified as well as drivers aged 61 years and over. For comparability
with previous years, time series data only is filtered to respondents with a valid licence aged 18 to 60
years. Where only 2015 data is presented, all respondents are included.
Information is provided below each chart and table to report the sample base, question filtering,
question format (prompted or unprompted, single or multiple response) and question text. In some
instances, total proportions may not add up to 100%. This may be due to either rounding and/or
multiple responses being permitted.
1.2.2. Subgroup reporting
Throughout this report results are presented in summary for 2015 and by demographic subgroups
(location, gender and age group). In order to better understand the relationship between driving
behaviours and attitudes towards road safety, analysis was also conducted according to certain driving
behaviours. The following categories are used throughout this report to analyse driver behaviour:
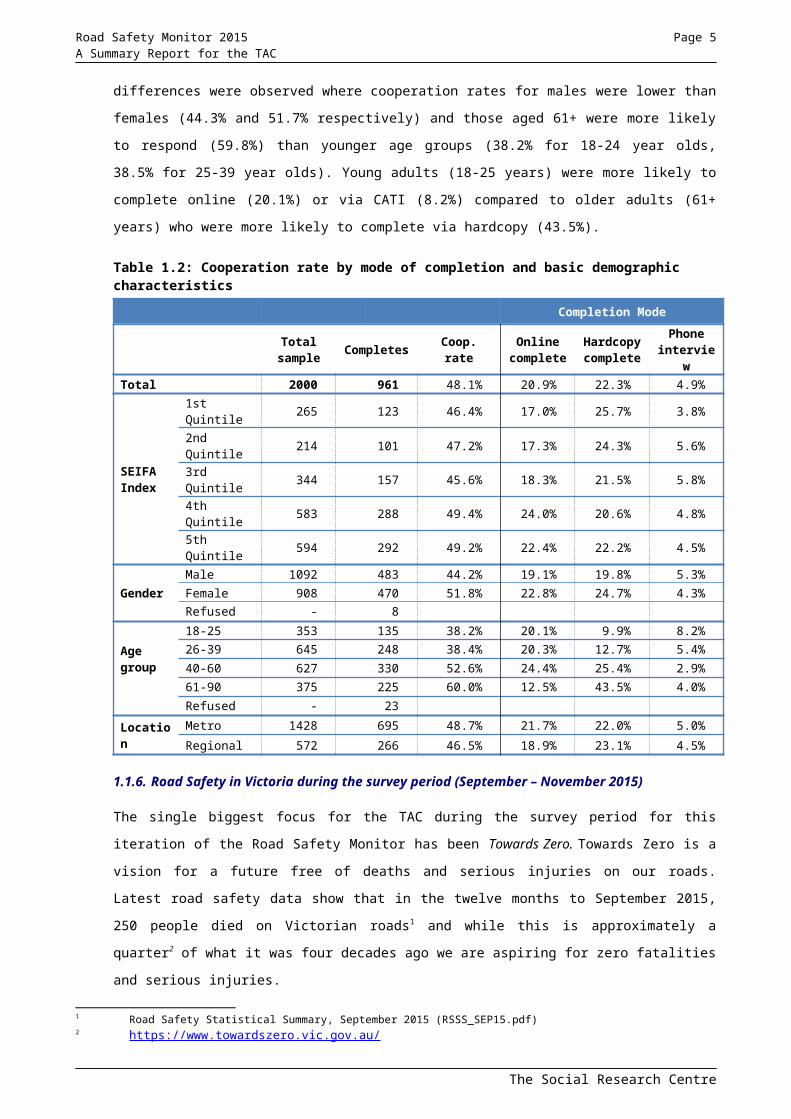
Speeding : those who indicated they drove above either the posted or their self-defined
speeding limit at least half of the time (‘speeders’) vs. those who drove above their self-
defined speeding limit none to some of the time (‘non-speeders’).
Drink driving : those who said they had driven a car when they knew or thought they were over
the legal blood alcohol limit within the last 12 months (‘drink drivers’) vs. those who had not
(‘non-drink drivers’).
Drowsy driving: those who indicated they regularly drove while drowsy (at least once a week)
(‘drowsy drivers’) vs. those who do not (‘non-drowsy drivers’).
Using mobile phones: those who used a handheld mobile while driving to answer a call, make
a call, read a text message, or write a text message (‘phone users’) vs. those who do not use
their phone while driving, or who only use it while stopped at the lights (‘non-phone users’).
Accident involvement : those who indicated they had been involved in a road accident within
the past five years vs. those who had not.
When comparing the overlap between ‘risk taking’ behaviours (speeding, drink driving, drowsy driving,
and phone use) only n=4 respondents were flagged in all four subgroups. In contrast, 390 respondents
were non-speeders, non-drink drivers, non-drowsy drivers, and non-phone users. The overlap was a
little higher for respondents who engaged in three of the four behaviours:
Drink driving + drowsy driving + phone use = 9 respondents
The Social Research Centre

Road Safety Monitor 2015 Page 7A Summary Report for the TAC
Speeding + drowsy driving + phone use = 17 respondents
Speeding + drink driving + phone use = 14 respondents
Speeding + drink driving + drowsy driving = 4 respondents
The Social Research Centre

Road Safety Monitor 2015 Page 8A Summary Report for the TAC
1.2.3. Statistical significance
A number of methods have been used within this report to highlight statistically significant differences
(at 95% confidence), as follows:
In charts shows a significant increase or decrease at the 95% confidence level between data
points (noted in text). Where time series data are shown, statistical significance is only calculated
between 2015 and 2014 data.
In tables, when two columns are compared, cell colouring is used to indicate the presence of
significant differences in column proportions or mean scores between the two groups (at the 95% level
of confidence). As demonstrated in Example 1 below, colouring indicates a significant difference where
green highlights the larger number and orange highlights the smaller number.
Example 1 Example 2
Column ‘A ’
Column ‘B’
Column ‘C’
Column ‘D’
Column ‘E’
95% 5%15%D,E
17%C
18%
Where more than two columns are compared, significant differences are indicated by letters below the
figure showing which column(s) they differ from. In Example 2, in the columns above, Column ‘C’
varies significantly from Columns ‘D’ and ‘E’, while Column ‘D’ differs from Column ‘C’, only.
1.2.4. Weighting
To correct biases in the sample, the data has been weighted to reflect the general Victorian driver and
registered vehicle owner population with respect to gender and age characteristics and hence the
results can be generalised as representing all Victorian drivers/vehicle owners.
The VicRoads population data were obtained in June, 2015. Throughout this report, the results
presented show weighted data, unless otherwise specified. The base “n” figure in charts and tables
(number in brackets) represents the unweighted number of people who responded to the survey.
Table 1.3: Weighting parametersProportional Weights
Gender Age Actual population Achieved sample Target sample Weight
Male 18-25 292,623 70 65 0.93Male 26-39 606,365 129 135 1.05Male 40+ 1,304,267 288 291 1.01Female 18-25 277,992 65 62 0.95Female 26-39 581,446 127 130 1.02Female 40+ 1,251,199 282 279 0.99
The Social Research Centre

Road Safety Monitor 2015 Page 9A Summary Report for the TAC
1.2.5. Regression analysis
Throughout this report results are presented from regression modelling analyses which were
conducted for the 2015 RSM. The regression analyses explore the relationship between respondent
attitudes and behaviours and selected demographic characteristics. In contrast to cross-tabulations,
regression models can simultaneously account for a number of different variables in assessing their
association with an attitude or behaviour of interest8. The particular approach applied was logistic
regression modelling which predicts the likelihood that a respondent will fall in a given category,
conditional upon their characteristics.
The outcome categories of interest (with the corresponding Questionnaire number) were:
1. Speeding (Q11, Q12, Q14 & Q15)
- Speeder (drives above self-defined speeding limit at least half of the time) vs Non-speeder;
2. Drink driving (Q22)
- Yes (has driven a car while over the legal limit in the last 12 months) vs No;
3. Drowsy driving (Q17);
- Yes (drives at least once a week while drowsy) vs No;
4. Mobile phone use while driving (Q30a to Q30j)
- Has used mobile while driving in past month vs Has not used mobile while driving;
5. Acceptable number of deaths on Victorian roads (Q45a)
- Thinks 250 deaths is acceptable (somewhat or completely) vs Unacceptable (somewhat or completely);
6. Believes Towards Zero is achievable (Q45b)
- Yes (believes that one day there will be no deaths) vs No (does not believe);
7. Easy to avoid being caught while driving over the speed limit (Q16a)
- Somewhat or strongly agree vs Somewhat or strongly disagree;
8. High chance of being caught speeding in 60km/h zone (Q16b)
- Somewhat or strongly agree vs Somewhat or strongly disagree;
9. Easy to avoid being caught while driving over the BAC limit (Q29a)
- Somewhat or strongly agree vs Somewhat or strongly disagree;
10. High chance of being caught while driving over the BAC limit (Q29b)
- Somewhat or strongly agree vs Somewhat or strongly disagree.
8 For instance, a cross-tabulation may show that a certain attitude appears to be more prevalent in some regions than others. A regression model may show that, after accounting for the different demographic profiles of respondents in these regions, there is in fact no net geographic effect. Attitudes are different because the respondents are different and there is likely nothing intrinsically noteworthy about the regions for that particular variable.
The Social Research Centre

Road Safety Monitor 2015 Page 10A Summary Report for the TAC
The characteristics (and variables) that were tested for association with the outcome measures were:
Completion mode;
Metro/Regional;
Section of State;
Gender;
Age;
Occupation;
Vehicle type.
Graphs are presented showing which characteristics, if any, seemed to be associated with an attitude
or behaviour of interest. Results for logistic regression models are expressed in terms of the "odds
ratio" and its 95% confidence interval, which show the relative likelihood of a respondent having the
outcome of interest compared to respondents in a reference group (for completion mode, the
reference group is hardcopy; for age, the reference group is 18 to 25 year olds; for vehicle type, the
reference group is sedan; and so on). Where an odds ratio is not significantly different from 1 (that is,
no difference from the reference category), its confidence interval is expected to contain 1.
For example, Figure 1.1 below shows two of the variables associated with using a mobile phone while
driving (completion mode and location). Statistically significant associations are shown in red. The
graph may be interpreted as follows:
Compared to respondents who completed a hardcopy questionnaire, online respondents were
1.26 times as likely to use a mobile phone while driving whereas CATI respondents were 0.64
times as likely. However, none of these “odds ratios” was significantly different from 1, so we
cannot conclude that completion mode was notably associated with the propensity to admit to
using a mobile phone while driving.
On the other hand, regional respondents were only 0.54 times as likely to use a mobile phone
while driving as metropolitan respondents. This ratio was significantly different from 1.
Figure 1.1: Example Odds ratios for model of mobile phone use while driving
The Social Research Centre
Road Safety Monitor 2015 Page 11A Summary Report for the TAC
As already stated, a regression model accounts for the simultaneous effects of all included variables;
therefore the odds ratios displayed are all “net” – this is what is left over after all other differences have
been taken into account. For example, if two respondents are otherwise identical in all their
characteristics, except that one is female and the other is male, the “net” effect is that the male is 0.79
times as likely to use his mobile phone while driving compared to the female (albeit, not significantly).
Categories were collapsed for two of the explanatory variables (occupation and vehicle type) (Table
1.4). Categories were removed from models where there were too few cases for reliable estimation.
Table 1.4: Categories for occupation (Q5) and vehicle type (Q49 type)Questionnaire category Collapsed category
Occupation (Q5)
Clerical and administrative workers White collar lowerCommunity and personal service workers White collar lowerLabourers and related workers Blue collarMachinery operators and drivers Blue collarManagers and administrators White collar upperNot applicable (those not asked Q5) Not in workforceProfessionals & Associate professionals White collar upperSales workers White collar lowerTechnicians and trade workers Blue collar
Vehicle type (Q49 type)
Sedan Passenger carsWagon Passenger carsPeople mover Passenger carsHatchback Passenger carsCoupe Passenger carsSUV/4WD SUV/4WDUtility Utility/Twin-cab utilityTwin-cab utility Utility/Twin-cab utilityCommercial van Panel van/Commercial van/OtherPanel van Panel van/Commercial van/OtherOther Panel van/Commercial van/ Other
The Social Research Centre

Road Safety Monitor 2015 Page 12A Summary Report for the TAC
2. Driver demographics and characteristics
2.1. Driver profile
As seen in previous waves, over two thirds (71%) of respondents were born in Australia; consistent
with the 2011 ABS census (69%). A further 5% were born in the United Kingdom (ABS: 3%).
2.1.1. Licence type
In the 2015 RSM, 87% of respondents held a full drivers licence. A further 7% stated that they held
some form of a probationary licence with 1% indicating they held a red and 6% indicating they held a
green probationary licence. Only 3% held a learner’s permit. Just over a third (35%) of 18 to 25 year
olds held a full licence, while the majority held a green probationary licence (40%).
Table 2.5: Licence type by demographics (2015)Total Region Gender Age group
2015M (961)
Metro (695)
Regional (266)
Males(483)
Females
(470)
18-25(135)
26-39 (248)
40-60 (330)
61+ (225)
A B C D E F G H
Full licence 87% 88% 86% 88% 87% 35% 93%E
98%E,F
96%E
Red Probationary 1% 1% 2% 1% 2% 9%F,G,H
- - -
Green Probationary 6% 6% 7% 5% 7% 40%F,G,H
2% - -
Learners Permit 3% 3% 2% 4% 2% 15%F,G,H
3%G,H
1% -
Other 1% 1% 2% 2% 1% - 2% 1% 1%Base: All respondents (n=961)Q1 What type of care licence do you hold? [single response]
2.1.2. Work status
As found in previous waves, the majority (79%) of licence holders aged 18 to 60 years were employed
at the time of the interview. An additional 9% indicated that they were studying while one in ten (11%)
reported that they were either unemployed or not in the workforce.
Figure 2.2: Work status – time series (%)
Base: Licence holders aged 18-60 (n=700)Q4 What is your current employment status? [single response]
The Social Research Centre
61 63 61 67 66 66 67 60 6279 81 81 79 78 79
8 9 11 7 7 7 78 8
6 6 5 5 8 931 29 29 26 27 27 26 32 3015 12 14 15 14 11
0%
20%
40%
60%
80%
100%
2001(511)
2002(499)
2003(509)
2004(510)
2005(500)
2006(499)
2007(499)
2008(500)
2009(500)
2010(503)
2011(809)
2012(1140)
2013(784)
2014M(685)
2015M(700)
Employed Studying Not in Workforce / Unemployed

Road Safety Monitor 2015 Page 13A Summary Report for the TAC
2.1.3. Occupation
Similar to previous years, a greater proportion of respondents from a metropolitan area indicated that
they were working as professionals or associate professionals than those in a regional area (34% vs.
25%). A significantly greater proportion of males were working in an occupation with a trade or
technical focus than females (21% vs. 3%). And young workers were overrepresented in sales (24%)
and technical and trade jobs (22%).
Table 2.6: Occupation by demographics (2015)Total Region Gender Age group
2015M (620)
Metro (464)
Regional (156)
Males(322)
Females(296)
18-25(71)
26-39 (209)
40-60 (271)
61+ (54)
A B C D E F G H
Managers and administrators 14% 14% 16% 17% 11% 6% 14% 17%E
13%
Professionals and associate professionals 32% 34% 25% 28% 36% 14% 37%
E33%
E26%
Technicians and trade workers 13% 12% 14% 21% 3% 22%
F,G12% 11% 13%
Clerical and administrative workers 12% 11% 15% 4% 22% 17% 10% 12% 20%
FCommunity and personal service workers 6% 7% 4% 3% 10% 9% 7% 5% 7%
Sales workers 8% 7% 10% 7% 9% 24%F,G,H
7% 4% 7%
Machinery operators and drivers 4% 4% 6% 6% 2% - 4% 6%
E2%
Labourers and related workers 8% 7% 10% 10% 5% 7% 8% 7% 6%
Base: Respondents in paid employment (n=620)Q5 How would you describe you main paid employment? [single response]
2.1.4. Work related driving
Respondents were asked about the amount of work related driving they do. Overall, 65% drive for
work related purposes (29% on a daily basis). Of those who drove a vehicle for work related purposes,
65% drove a car, 15% drove a utility/pick up, 6% drove a commercial van and 3% drove a truck. Males
and regional respondents tended to drive a utility/pick up compared to female and metropolitan
respondents.
Figure 2.3: Type of vehicle used for work related purposes (%) (2015)
Base: Respondents who drive a vehicle for work purposes (n=401)Q63: What type of vehicle do you usually drive as part of your job? [single response]
The Social Research Centre
65
156 3 1 1 2
0
10
20
30
40
50
60
70
Car Utility/Pickup
CommercialVan
Truck Bus Motorcycle Other
Road Safety Monitor 2015 Page 14A Summary Report for the TAC
2.2. Individual characteristics
2.2.1. Typical driving distance per year
The average kilometres driven per year in the 2015 were consistent with previous waves. More than a
quarter of respondents (28%) stated they drove between 15,000kms and 30,000kms per year while
just one in ten (14%) claimed to drive more than 30,000kms per year.
Figure 2.4: Average kilometres driven per year (2012 to 2015 total sample)
Base: All respondents with a valid response (n=937) Q60: In a typical year, how many kilometres would you drive for any reason? [single response]
Significant differences between demographic groups include:
26% of drivers aged 61 or over drove less than 10,000km per year compared to all other age
groups,
Males (20%) were more likely than females (8%) to drive more than 30,000km per year,
Regional respondents were more likely to drive between 15,000km and 29,999km per year
(34%) compared to metropolitan respondents (26%).
2.2.1. Long distance drivers
Those who indicated they drove 15,000km or more in a year, or who said they drove 300km or more in
a week (‘long distance drivers’) were grouped together and compared to those who drove less (‘short
distance drivers’). More than half (56%) of respondents drove long distances, comprised largely of
regional respondents (68%), and males (65%). Of those driving shorter distances, the proportion
skewed towards drivers aged 61 and over (59%).
Table 2.7: Average kilometres by demographics (2015)Total Region Gender Age group
2015M (795)
Metro (573)
Regional (222)
Males(418)
Females
(370)
18-25(101)
26-39 (211)
40-60 (282)
61+ (187)
A B C D E F G HShort distance drivers 44% 48% 32% 35% 53% 46% 36% 38% 59%
E,F,G
Long distance drivers 56% 52% 68% 65% 47% 54%H
64%H
62%H
41%
Base: All respondents with a valid response (n=795)Q60: In a typical year, how many kilometres would you drive for any reason? [single response]Q61: In a typical week, how many kilometres would you drive for any reason? [single response]
The Social Research Centre
14 16
28
202015
28
1520
17
29
1417 18
28
14
0
10
20
30
40
Up to 9,999 10,000 to 14,999 15,000 to 29,999 30,000 and above
% 2012 2013 2014M 2015M

Road Safety Monitor 2015 Page 15A Summary Report for the TAC
Respondents who reported speeding (71%) were more likely to be long distance drivers, as were
those who reported drink driving (72%), who regularly drove while drowsy (73%), and who used a
mobile phone while driving (68%). Speeders were also more likely to be long distance drivers (82%)
than non-speeders (albeit not significantly).
Table 2.8: Average kilometres by behaviours (2015)Total Speeding Drink driving Drowsy driving Phone use Road accident
2015M (795)
Yes (95)
No (694)
Yes (58)
No (548)
Yes (80)
No (709)
Yes (254)
No (538)
Yes (118)
No (675)
A B C D E F G H I J
Short distance drivers 44% 29% 46% 28% 41% 27% 45% 32% 49% 39% 45%
Long distance drivers 56% 71% 54% 72% 59% 73% 55% 68% 51% 61% 55%
Base: All respondents with a valid response (n=795)Q60: In a typical year, how many kilometres would you drive for any reason? [single response]Q61: In a typical week, how many kilometres would you drive for any reason? [single response]
Additional analysis was conducted which compared short distance drivers (n=349) and long distance
drivers (n=446) across a variety of measures, attitudes and behaviours. There were some significant
differences between the two groups as follows:
Short distance drivers were:
More likely to drive a car for work related purposes (74%) (long distance drivers more likely to
drive a utility/pickup (21%) or a truck (4%)),
More concerned about aggressive or reckless driving when it comes to personal safety (33%
vs. 26%).
Long distance drivers were:
More confident in their driving ability, 73% rated themselves as a ‘better than average’ driver
(while short distance drivers were more likely to rate themselves as ‘average’ (62%)),
More likely to agree that if they were to speed in a 60km/h zone they would have a high
chance of being caught (56% vs. 47%),
More likely to agree that it easy to avoid being caught driving over the legal blood alcohol limit
(60% vs. 53%),
More likely to have been breath tested in the last twelve months (72% vs. 53%),
More likely to have been a passenger in a car where the driver was over the limit (8% vs. 3%),
More likely to use their mobile phone with the assistance of a hands free device such as
Bluetooth (55% vs. 30%)
The Social Research Centre

Road Safety Monitor 2015 Page 16A Summary Report for the TAC
2.2.2. Accident involvement
Self-reported involvement in a road accident remained consistent with previous waves, recording
levels between 15% and 20% since 2010. The proportion of those involved in a road accident who
stated that someone sustained a personal injury, however, increased significantly compared to 2014
(9%) to reach a peak level of 18%.
The significant increase in the proportion of accidents involving a personal injury was most prominent
among females (significant increase from 7% in 2014 to 20% in 2015), and respondents aged 40 to 60
(significant increase from 5% in 2014 to 20% in 2015).
Figure 2.5: Road accidents in last five years (%) – time series
Base: Q40 All respondents (n=700); Q41 respondents involved in a road accident (n=114)Q40 In the past five years, have you been involved in any road accidents as a driver regardless of who was at fault? (This
does not include accidents in car parks and driveways) [single response]Q41 Did anyone in the accident(s) sustain personal injury? [single response]
Involvement in a road accident was significantly lower among those aged 61 and over (7%). Of those
involved in a road accident, personal injury was marginally greater in regional areas (21%) and among
females (20%) although not significantly.
Table 2.9: Road accidents in last five years and personal injury by demographics (2015)Total Region Gender Age group
2015M (961)
Metro (695)
Regional (266)
Males(483)
Females
(470)
18-25(135)
26-39 (248)
40-60 (330)
61+ (225)
A B C D E F G HInvolved in road accident 14% 16% 11% 15% 14% 16%
H17%
H17%
H7%
Personal injury 17% 16% 21% 15% 20% 14% 19% 20% 12%
Base: Q40 All respondents (n=961); Q41 respondents involved in a road accident (n=139)Q40 In the past five years, have you been involved in any road accidents as a driver regardless of who was at fault? (This
does not include accidents in car parks and driveways) [single response]Q41 Did anyone in the accident(s) sustain personal injury? [single response]
The Social Research Centre
17%20%
15% 16% 15%
16%
10% 11% 12%
8% 9%
18%
0%
5%
10%
15%
20%
25%
30%
2010(702)
2011(809)
2012(1140)
2013(784)
2014M(685)
2015M(700)
Involvement in road accident Personal injury

Road Safety Monitor 2015 Page 17A Summary Report for the TAC
As seen in Table 2.6, involvement in road accidents was significantly more common among
respondents who admitted to using a mobile phone while driving (17%), compared to those who did
not use a mobile while driving (12%). Of those involved in an accident, personal injury was more
common among regular drowsy drivers (44%) (not significant).
Table 2.10: Road accidents in last five years and personal injury by behaviours (2015)Total Speeding Drink driving Drowsy driving Phone use Road accident
2015M (961)
Yes (108)
No (838)
Yes (64)
No (650)
Yes (91)
No (856)
Yes (295)
No (662)
Yes (139)
No (815)
A B C D E F G H I JInvolved in road accident 14% 12% 15% 15% 14% 17% 14% 18% 13% 100% -
Personal injury 17% 7% 19% 9% 21% 44% 14% 15% 19% 17% -
Base: Q40 All respondents (n=961); Q41 respondents involved in a road accident (n=139)Q40 In the past five years, have you been involved in any road accidents as a driver regardless of who was at fault? (This
does not include accidents in car parks and driveways) [single response]Q41 Did anyone in the accident(s) sustain personal injury? [single response]
2.2.3. Perceptions of driving competence
Consistent with recent years, around a third of respondents (65%) rated their driving as ‘better’
compared to the average Victorian driver (14% felt they were ‘much’ better, 31% felt they were ‘better’,
and 20% felt they were ‘slightly’ better). A further three in ten (30%) believed their driving to be
‘average’. A small proportion reported that their driving was ‘worse’ than average (1%), or were unsure
(3%) how they compared.
Figure 2.6: Rating of driving (%) (2012 to 2015 total sample)
Base: All respondents (n=961)Q59: Thinking about how you compare to the average driver on Victorian roads, would you say that you were a…[single
response]
The Social Research Centre
62
65
66
65
33
30
30
30
1
1
2
1
2
2
2
3
0% 20% 40% 60% 80% 100%
2012
2013
2014M
2015M
Total 'better' than average About average Total 'worse' than average Unsure

Road Safety Monitor 2015 Page 18A Summary Report for the TAC
Table 2.7 compares self-reported driving competency by demographic characteristics. Drivers aged
between 26 to 39 years (74%) and 40 to 60 years (67%) rated themselves as ‘better’ than the average
driver, significantly greater when compared to drivers aged 61+ years (53%). Significantly more
respondents from metropolitan areas (67%) also rated themselves as ‘better’ compared to regional
respondents. Drivers who rated themselves as an ‘about average’ driver were typically in the youngest
(18-25 years, 33%) or oldest (61+, 42%) age brackets.
Table 2.11: Self-reported driving competency by demographics (2015)Total Region Gender Age group
2015M (961)
Metro (695)
Regional (266)
Males(483)
Females
(470)
18-25(135)
26-39 (248)
40-60 (330)
61+ (225)
A B C D E F G HTotal 'better than average' drivers 65% 67% 60% 68% 62% 62% 74%
E,H67%
H53%
‘About average’ drivers 30% 28% 35% 28% 32% 33%
F23% 28% 42%
F,GTotal 'worse than average' drivers 1% 1% - 1% 1% 2% - 2% -
Base: All respondents (n=961)Q59: Thinking about how you compare to the average driver on Victorian roads, would you say that you were a…[single
response]
Significantly more ‘speeders’ rated themselves as ‘better than average’ (75%) compared to ‘non-
speeders’. All other sub-groups were relatively similar in their self-perceived driving competence.
Table 2.12: Self-reported driving competency by behaviour (2015)Total Speeding Drink driving Drowsy driving Phone use Road accident
2015M (961)
Yes (108)
No (838)
Yes (64)
No (650)
Yes (91)
No (856)
Yes (295)
No (662)
Yes (139)
No (815)
A B C D E F G H I JTotal 'better than average' drivers 65% 74% 64% 69% 66% 67% 66% 69% 64% 67% 65%
‘About average’ drivers 30% 24% 31% 28% 30% 27% 30% 27% 31% 28% 31%
Total 'worse than average' drivers 1% 1% 1% 1% 1% 1% 1% 1% 1% 2% 1%
Base: All respondents (n=961)Q59: Thinking about how you compare to the average driver on Victorian roads, would you say that you were a…[single
response]
The Social Research Centre

Road Safety Monitor 2015 Page 19A Summary Report for the TAC
3. Driving attitudes and behaviours
3.1. Perceived cause of road accidents
Respondents were asked about the key factors that lead to serious road accidents. Figure 3.1 shows
that alcohol is perceived as the factor most likely to contribute to serious accidents (70%), with speed
the second most commonly mentioned factor (54%). This finding is consistent with previous waves.
Figure 3.7: Factors that lead to serious road accidents (%) (2015)
Base: All respondents (n=961)Q6 What do you think are the three main factors that most often lead to serious road accidents? [3 mentions]
3.2. Personal safety
In the 2015 RSM, respondents were also asked to nominate their greatest concern about their own
safety on the road, either as a driver or passenger. Figure 3.2 shows that of respondents who provided
a response, ‘aggressive or reckless driving’ (28%) and other drivers (24%) were the most commonly
cited concerns. ‘Distractions’ (17%), ‘speed’ (13%), and ‘drugs’ and ‘alcohol’ (both 12%) were also
among the top five concerns. It is worth noting that just under a quarter of survey respondents (23%)
did not provide an answer.
Figure 3.8: Concerns about personal safety on the road (%) (2015)
Base: All respondents who provided an answer (n=742)Q7 Either as a driver or a passenger, what concerns you most about your safety on the road?
The Social Research Centre
2
5
19
22
38
41
45
54
70
0 10 20 30 40 50 60 70 80
Other
Older drivers
Young drivers
Tiredness / fatigue
Aggressive or reckless driving
Drugs
Distractions
Speed
Alcohol
%
811
377
81212
1317
2428
0 5 10 15 20 25 30
OtherOlder drivers
Tiredness / fatigueYoung Drivers
Poor road condition or designDrivers ignoring road rules
Inexperienced driversAlcohol
DrugsSpeed
DistractionsOther drivers
Aggressive or reckless driving
%

Road Safety Monitor 2015 Page 20A Summary Report for the TAC
When looking at concerns for personal safety by demographics, respondents in metropolitan areas
were more likely than regional respondents to mention ‘aggressive or reckless driving’ (30%); in
comparison, regional respondents were more likely to mention ‘other drivers’ (30%) in general. ‘Drivers
ignoring road rules’ was a greater concern for female respondents (9%) compared to males (4%).
Those aged 26 to 39 years were more concerned about ‘young drivers’ (4%), compared to those aged
18 to 25.
Table 3.13: Concerns about personal safety on the road by demographics (2015)Total Region Gender Age group
2015M (742)
Metro (528)
Regional (214)
Males(365)
Females
(373)
18-25(111)
26-39 (183)
40-60 (264)
61+ (170)
A B C D E F G H
Young Drivers 3% 3% 2% 3% 3% - 4%E
3% 2%
Alcohol 12% 11% 14% 10% 14% 16%G
17%GH
9% 9%
Distraction(s) 17% 17% 15% 16% 17% 8% 23%EH
19%EH
11%
Drugs 12% 11% 15% 10% 14% 11% 16% 12% 10%
Speed 13% 14% 13% 12% 14% 13% 15% 11% 15%
Tiredness / fatigue 1% - 1% 1% 1% 1% 2%G
- -
Aggressive or reckless driving 28% 30% 22% 29% 27% 26% 27% 30% 28%
Older drivers 1% 1% - 1% 1% 3% 1% 2% 1%
Inexperienced drivers 8% 9% 6% 8% 7% 10%
H8% 10%
H4%
Poor road condition or design 7% 6% 10% 8% 6% 7% 7% 7% 6%
Drivers ignoring road rules 7% 6% 8% 4% 9% 6% 7% 6% 7%
Other drivers 24% 21% 30% 23% 25% 29% 22% 22% 26%Base: All respondents who provided an answer (n=742)Q7 Either as a driver or a passenger, what concerns you most about your safety on the road?
The Social Research Centre

Road Safety Monitor 2015 Page 21A Summary Report for the TAC
Compared to those who do not use a mobile phone while driving, mobile phone users were
significantly more likely to mention ‘drugs’ (15%), ‘alcohol’ (14%), ‘inexperienced drivers’ (11%) and
‘tiredness or fatigue’ (1%). Of drivers who drink drive (4%) or drive drowsy (4%), ‘older drivers’ were
seen as more of a concern compared to those who do not drink drive or regularly drive when drowsy
(both 1%). ‘Speeders’ were more concerned about poor road condition or design (13%) than ‘non-
speeders’ (6%).
Table 3.14: Concerns about personal safety on the road by behaviours (2015)Total Speeding Drink driving Drowsy driving Phone use Road accident
2015M (742)
Yes (84)
No (647)
Yes (51)
No (512)
Yes (75)
No (661)
Yes (226)
No (513)
Yes (105)
No (634)
A B C D E F G H I JYoung Drivers 3% 1% 3% 6% 2% 3% 3% 4% 3% 3% 3%
Alcohol 12% 9% 12% 6% 12% 13% 12% 16% 10% 7% 13%
Distraction(s) 17% 16% 17% 16% 17% 22% 16% 17% 17% 15% 17%
Drugs 12% 13% 12% 8% 12% 12% 12% 16% 10% 8% 13%
Speed 13% 9% 14% 8% 13% 15% 13% 17% 12% 10% 14%
Tiredness / fatigue 1% 1% 1% - 1% 1% 1% 1% * - 1%Aggressive or reckless driving 28% 20% 29% 20% 29% 27% 28% 23% 30% 34% 27%
Older drivers 1% 2% 1% 4% 1% 4% 1% 1% 1% 2% 1%
Inexperienced drivers 8% 9% 8% 10% 9% 8% 8% 12% 6% 11% 7%Poor road condition or design 7% 13% 6% 12% 8% 11% 6% 8% 6% 7% 7%
Drivers ignoring road rules 7% 6% 7% 4% 7% 5% 7% 6% 7% 9% 6%
Other drivers 24% 31% 23% 25% 24% 25% 24% 22% 25% 22% 24%Base: All respondents who provided an answer (n=742)Q7 Either as a driver or a passenger, what concerns you most about your safety on the road?
3.2.1. Restraint wearing
Consistent with previous waves, the vast majority of licence holders aged 18 to 60 years reported
wearing a seatbelt ‘all the time’ when they drive (98%). There were no differences in wearing a
seatbelt by demographic characteristics. Looking at driving behaviours however, those who reported
drink driving and drowsy driving were marginally less likely to report wearing a seatbelt ‘all the time’
(both 93%) compared to those who did not drink drive or drive while drowsy (both 99%).
Figure 3.9: Wears a seatbelt all the time (%) - time series
Base: All licence holders aged 18-60 (n=700)Q9 When you drive a car (or other vehicle) do you wear a seatbelt...? [single response]
The Social Research Centre
93% 92%94% 94% 95%
97%95% 96% 95% 95% 95% 96% 96%
98% 98%
75%
80%
85%
90%
95%
100%
2001(511)
2002(499)
2003(509)
2004(510)
2005(500)
2006(499)
2007(499)
2008(500)
2009(500)
2010(503)
2011(809)
2012(1140)
2013(784)
2014M(685)
2015M(700)

Road Safety Monitor 2015 Page 22A Summary Report for the TAC
3.3. Level of danger in driving behaviours
Respondents were asked to rate a series of driving behaviours on a scale of 0 (not dangerous at all) to
10 (extremely dangerous). Figure 3.4 shows that behaviours which impair driving ability, in particular,
drink and drug driving, were viewed as the most dangerous (mean between 9.4 and 9.7 out of 10).
The activity of driving while drowsy was viewed as extremely dangerous (rating of 9.0 out of 10) and
considered just as dangerous as driving after taking drugs or drinking alcohol. The use of a handheld
mobile phone (8.7) was considered far more dangerous than hands free (5.5), while speeding a few
kilometres over the speed limit in a 100km zone (5.6) or 60km zone (5.4) were considered less
dangerous activities.
Figure 3.10: Level of danger in driving behaviours (mean) (2015)
Base: All respondents (n=961)Q8 Using a scale where 0 is not dangerous at all and 10 is extremely dangerous, how dangerous do you think it is to…
[single response]
The Social Research Centre
5.4
5.6
5.5
8.7
9.0
8.5
9.4
9.5
9.7
9.7
0 1 2 3 4 5 6 7 8 9 10
A few kms above the speed limit (60 zone)
A few kms above the speed limit (100 zone)
While using a hands free mobile phone
While using a handheld mobile phone
While very drowsy
After alcohol and prescription medicines
With an illegal BAC level
After using depressant drugs
After using stimulant drugs
After using drugs and alcohol
Spe
edD
istr
act
Dro
wsy
Impa
ir

Road Safety Monitor 2015 Page 23A Summary Report for the TAC
Compared to males, female drivers provided higher ratings for driving over the speed limit in a 60km
zone (5.8) and a 100km zone (6.2), driving with an illegal BAC (9.6), driving after using depressant
drugs (9.6), and using a mobile phone either handheld (8.9) or hands free (5.8). Drivers living in
regional areas viewed driving a few kilometres over the limit in a 60km zone (5.9) and using a mobile
either handheld (9.0) or hands free (5.8) as more dangerous than those living in metropolitan areas.
Older drivers (aged 40-60 and aged 61+) provided higher ratings for using a mobile phone compared
to younger drivers (18-25 and 26-39). Females and older adults tended to provide higher ratings on
average for drowsy driving than males and young drivers.
Table 3.15: Level of danger in driving behaviours by demographics (2015)Total Region Gender Age group
2015M (961)
Metro (695)
Regional (266)
Males(483)
Females(470)
18-25(135)
26-39 (248)
40-60 (330)
61+ (225)
A B C D E F G HDrive a few kms above the speed limit (60 zone) 5.4 5.3 5.9 5.2 5.8 5.2 5.6 5.5 5.5
Drive a few kms above the speed limit (100 zone) 5.6 5.6 5.7 5.1 6.2 5.4 5.5 5.6 5.9
Drive with an illegal BAC level 9.4 9.4 9.5 9.2 9.6 9.3 9.4 9.4 9.6
Drive after using stimulant drugs 9.7 9.7 9.7 9.6 9.7 9.7 9.7 9.6 9.8
Drive after using depressant drugs 9.5 9.5 9.6 9.4 9.6 9.3 9.5 9.5 9.6
EDrive after using drugs and alcohol 9.7 9.7 9.8 9.7 9.7 9.7 9.7 9.6 9.8
Drive after drinking alcohol and using prescription medicines
8.5 8.4 8.6 8.4 8.6 8.6 8.4 8.4 8.6
Drive while drowsy 9.0 9.0 9.0 8.8 9.1 8.5 8.8E
9.1E
9.3E,F
Drive while using a handheld mobile phone 8.7 8.6 9.0 8.5 8.9 8.3 8.4 8.8
E,F9.2
E,F,GDrive while using a hands free mobile phone 5.5 5.3 5.8 5.2 5.8 5.2 5.0 5.6
F6.2
E,F,GBase: All respondents (n=961)Q8 Using a scale where 0 is not dangerous at all and 10 is extremely dangerous, how dangerous do you think it is to…
[single response]
The Social Research Centre

Road Safety Monitor 2015 Page 24A Summary Report for the TAC
Drivers who had driven when they suspected they were over the limit provided significantly lower
mean ratings on almost every type of driving behaviour (with exception of driving a few kilometres over
the limit in a 60km zone). Similarly, those who use their mobile phone while driving provided
significantly lower ratings than those who do not use their phone, with the exception of driving after
using drugs and alcohol. ‘Speeders’ tended to perceive driving a few kilometres over the limit, as well
as driving with an illegal BAC, driving while drowsy, and driving while using a mobile phone as less
dangerous than ‘non-speeders’. Drowsy drivers also provided lower ratings for speeding in a 100km
zone, driving while drowsy, and driving while using a hands free phone.
Table 3.16: Level of danger in driving behaviours by behaviours (2015)Total Speeding Drink driving Drowsy driving Phone use Road accident
2015M (961)
Yes (108)
No (838)
Yes (64)
No (650)
Yes (91)
No (856)
Yes (295)
No (662)
Yes (139)
No (815)
A B C D E F G H I JDrive a few kms above the speed limit (60 zone)
5.4 3.9 5.7 4.9 5.3 5.1 5.5 5.0 5.6 5.4 5.5
Drive a few kms above the speed limit (100 zone)
5.6 3.6 5.9 4.1 5.3 4.9 5.7 4.8 5.9 5.7 5.6
Drive with an illegal BAC level 9.4 9.1 9.5 8.7 9.4 9.2 9.5 9.3 9.5 9.4 9.4
Drive after using stimulant drugs 9.7 9.6 9.7 9.3 9.7 9.5 9.7 9.6 9.7 9.7 9.7
Drive after using depressant drugs 9.5 9.4 9.5 9.0 9.5 9.5 9.5 9.3 9.6 9.5 9.5
Drive after using drugs and alcohol 9.7 9.6 9.7 9.3 9.7 9.6 9.7 9.6 9.8 9.8 9.7
Drive after drinking alcohol and using prescription medicines
8.5 7.8 8.5 7.7 8.4 8.4 8.5 8.1 8.6 8.4 8.5
Drive while drowsy 9.0 8.2 9.1 8.3 9.0 8.6 9.0 8.6 9.1 9.0 9.0
Drive while using a handheld mobile phone
8.7 7.9 8.8 8.0 8.7 8.4 8.8 8.1 9.0 8.7 8.7
Drive while using a hands free mobile phone
5.5 4.0 5.7 4.5 5.4 4.7 5.5 4.9 5.7 5.2 5.5
Base: All respondents (n=961)Q8 Using a scale where 0 is not dangerous at all and 10 is extremely dangerous, how dangerous do you think it is to…
[single response]
The Social Research Centre

Road Safety Monitor 2015 Page 25A Summary Report for the TAC
4. Towards zero
The 2015 ‘Main’ RSM continued to monitor the questions introduced in the 2015 ‘Pulse’ to assess
community attitudes around the concept of ‘Towards Zero’ – a vision for a future free of deaths and
serious injuries in Victoria. It is a collaborative effort with the community to improve road safety to
ultimately reach zero deaths or serious injuries. At the start of the 2015 ‘Main’ surveying period (26
August to 20 September, 2015) Phase 1 of the Towards Zero campaign was run (‘Man on the street’)
which targeted all Victorian road users via TV, radio, online, social media, outdoor and out of home.
4.1. Acceptable number of deaths
Respondents were asked their opinion on the acceptability of the current number of Victorians killed
on the road each year. Figure 4.1 shows that of all respondents, more than three quarters (76%)
believed that the road toll is unacceptable. Compared to the 2015 Pulse, this proportion has declined
significantly from 84%. Just over one in ten (13%) respondents believed the road toll to be neither
acceptable nor unacceptable, an increase from 7% in the 2015 Pulse. Only 6% believe the road toll is
acceptable – consistent with the 2015 Pulse.
Figure 4.11: Accident acceptability (2015)
Base: All respondents (n=961)Q45a Fifteen years ago, more than 400 people were killed on Victorian roads each year. This number has now fallen to
almost 250. In your opinion is this number of deaths . . . [single response]
Table 4.1 shows that perceived acceptability of the road toll is largely consistent between demographic
groups. That said, the proportion of drivers who stated that they believe the road toll is currently
‘acceptable’ was higher among males (8%) and those aged between 18 and 25 (10%) and 26 to 39
years (8%); while drivers aged 61 and over were significantly more likely to state that the road toll is
unacceptable (83%).
Table 4.17: Accident acceptability (number of deaths) by demographics (2015)Total Region Gender Age group
2015M (961)
Metro (695)
Regional (266)
Males(483)
Females
(470)
18-25(135)
26-39 (248)
40-60 (330)
61+ (225)
A B C D E F G H
Total acceptable 6% 7% 4% 8% 4% 10%H
8%H
5% 3%
Neither acceptable nor unacceptable 13% 13% 13% 12% 14% 18%
H14% 13% 9%
Total unacceptable 76% 74% 80% 74% 78% 69% 73% 77% 83%E,F
Base: All respondents (n=961)Q45a Fifteen years ago, more than 400 people were killed on Victorian roads each year. This number has now fallen to
almost 250. In your opinion is this number of deaths . . . [single response]
The Social Research Centre
6 13 76 4
0% 20% 40% 60% 80% 100%
2015M
Acceptable Neither Unacceptable Don't know

Road Safety Monitor 2015 Page 26A Summary Report for the TAC
As seen in Table 4.2, the road toll was generally more accepted by respondents who participated in
‘risky’ behaviours such as speeding (13%), drink driving (13%), and using their phone while driving
(10%). Interestingly, while the number is small, respondents who had been in a road accident in the
last five years were more likely to rate the road toll as acceptable (11%) compared to those not
involved in an accident (5%) – possibly influenced by their involvement in an accident.
Table 4.18: Accident acceptability (number of deaths) by behaviours (2015)Total Speeding Drink driving Drowsy driving Phone use Road accident
2015M (961)
Yes (108)
No (838)
Yes (64)
No (650)
Yes (91)
No (856)
Yes (295)
No (662)
Yes (139)
No (815)
A B C D E F G H I J
Total acceptable 6% 13% 5% 13% 6% 9% 6% 10% 5% 11% 5%
Neither acceptable nor unacceptable 13% 12% 13% 9% 14% 14% 13% 12% 13% 14% 13%
Total unacceptable 76% 69% 77% 76% 77% 74% 77% 74% 77% 71% 77%
Base: All respondents (n=961)Q45a Fifteen years ago, more than 400 people were killed on Victorian roads each year. This number has now fallen to
almost 250. In your opinion is this number of deaths . . . [single response]
4.2. Belief in ‘zero’
In light of the Towards Zero goals, respondents were asked if they believed the road toll could be
reduced to zero and if so, how long it would take to reach zero deaths on Victorian roads.
As seen in Table 4.3, one in ten (11%) respondents believed that the road toll could be reduced to
zero in the future, this remains consistent with the 2015 Pulse (10%). Respondents living in
metropolitan areas (13%) were more optimistic than those in regional areas (7%); as were younger
respondents (18-25, 14%; 26-39, 17%).
Of those who believed that the road toll could one day reach zero, the majority (61%) believed it would
take less than 20 years to achieve. In contrast, 48% of respondents in the 2015 Pulse believed zero
could be achieved within 20 years (not significant). A notable difference between the 2015 Pulse and
2015 Main is an 11 percentage point shift in those who believed it would take between 20 and 29
years, moving towards a shorter time frame.
Table 4.19: Believe in no deaths as a result of road accidents by demographics (2015)Total Region Gender Age group
2015M (961)
Metro (695)
Regional (266)
Males(483)
Females
(470)
18-25(135)
26-39 (248)
40-60 (330)
61+ (225)
A B C D E F G HBelieve there will be no deaths one day 11% 13% 7% 13% 10% 14%
H17%G,H
10% 6%
Less than 10 years 20% 21% 12% 20% 19% 5% 24% 15% 31%
10 to 19 years 41% 43% 33% 43% 39% 37% 46% 42% 38%
20 to 29 years 10% 9% 16% 7% 15% 21% 7% 9% 8%
30 years or more 29% 27% 39% 30% 28% 37% 22% 33% 23%Base: Q49b All respondents (n=961); Q49c believes 0 deaths is achievable (n=109)Q45b Do you believe that one day in Victoria there will be no deaths as a result of road accidents? [single response]Q45c How long do you think it will take to reach zero road deaths in Victoria? [single response]
The Social Research Centre

Road Safety Monitor 2015 Page 27A Summary Report for the TAC
Significantly fewer respondents who had driven when they suspected they were over the limit (2%)
believed that one day there would be zero deaths on Victorian roads, compared to those who had not
driven after drinking (12%). Despite being more inclined to agree that the current road toll is
acceptable, those who had been involved in an accident were actually more likely to believe that a
zero road toll was achievable (17%) than those who had not been in an accident (10%).
Table 4.20: Believe in no deaths as a result of road accidents by behaviours (2015)Total Speeding Drink driving Drowsy driving Phone use Road accident
2015M (961)
Yes (108)
No (838)
Yes (64)
No (650)
Yes (91)
No (856)
Yes (295)
No (662)
Yes (139)
No (815)
A B C D E F G H I JBelieve there will be no deaths one day 11% 13% 11% 2% 12% 11% 11% 11% 11% 17% 10%
Less than 10 years 20% 14% 21% - 19% 20% 20% 21% 19% 13% 21%
10 to 19 years 41% 29% 42% - 35% 61% 39% 50% 37% 54% 38%
20 to 29 years 10% 7% 11% - 13% - 11% 9% 11% - 13%
30 years or more 29% 50% 27% 100% 33% 19% 31% 20% 33% 34% 28%Base: Q49b All respondents (n=961); Q49c believes 0 deaths is achievable (n=109)Q45b Do you believe that one day in Victoria there will be no deaths as a result of road accidents? [single response]Q45c How long do you think it will take to reach zero road deaths in Victoria? [single response]
Additional analysis was conducted which compared respondents who believed that a zero road toll
was achievable (‘believers’) (n=109) and those who did not think it was possible (‘non-believers’)
(n=763). It is interesting to note that there were some significant differences in attitudes between the
two groups, largely involving attitudes toward speeding. This included:
‘Believers’ provided significantly higher ratings for the dangerousness of driving a few
kilometres above the posted speed limit in both a 60km/h zone (6.12 vs. 5.28) and a 100km/h
zone (6.45 vs. 5.33).
‘Believers’ were more likely to agree that they would have a high chance of being caught if
they were to speed a few kilometres over the speed limit in a 60km/h zone (66% vs. 51%).
The Social Research Centre

Road Safety Monitor 2015 Page 28A Summary Report for the TAC
4.3. Regression analysis (Towards Zero)
4.3.1. Perceived acceptability of current road toll
After accounting for other differences, there remained some significant effects across region, gender,
age group and vehicle type in terms of the propensity to agree that the number of deaths on Victorian
roads is acceptable:
Respondents in Other Urban areas were less likely to agree than respondents in Major Urban
areas;
Males were twice as likely as females to agree;
Respondents aged 61 or older were less likely to agree than those aged 18 to 25 years; and
SUV/4WD drivers were significantly less likely to agree compared to drivers of passenger
cars. Note that there were too few respondents in the Panel van/Commercial van/Other
category for reliable estimation so this group has been omitted from the figure.
The Social Research Centre

Road Safety Monitor 2015 Page 29A Summary Report for the TAC
Figure 4.12: Odds ratios for model of perceived acceptability of current road toll
The Social Research Centre

Road Safety Monitor 2015 Page 30A Summary Report for the TAC
4.3.1. Belief in possibility of zero road toll
There were no significant differences across demographic characteristics for the likelihood of agreeing
that it is possible to achieve zero road deaths in Victoria.
Figure 4.13: Odds ratios for model of Belief that zero deaths from road accidents is possible
The Social Research Centre

Road Safety Monitor 2015 Page 31A Summary Report for the TAC
5. Speed
5.1. Definition of speeding
To understand how road users defined speeding, respondents were asked to indicate how fast they
thought people should be allowed to drive in a 60km/h and a 100km/h zone without being booked for
speeding. Prior to 2010, respondents were asked how many kilometres over the defined speed limit
they considered to be speeding (i.e. 1km/h or more) regardless of what the law states. This
methodological change impacts on the series and should be considered when interpreting the results.
Figure 5.1 shows that the majority of respondents (89%) believe they should only be able to drive up
to 65km/h in a 60km/h zone; meanwhile, almost three quarters (73%) provided a speed of up to
105km/h above in a 100 zone. Consistent with previous years, around one in ten (11%) believe they
should be allowed to drive in excess of 65km/h in a 60km/h zone; in contrast, 27% felt they should be
able to drive in excess of 105km/h in a 100km/h zone.
Figure 5.14: Definition of speeding in a 60km/h and 100km/h zone – time series
Base: Respondents aged 18-60 who could specify a number and not below 60km/h (n=700) Q11 How fast should people be allowed to drive in a 60km/h zone without being booked for speeding? [single response]Q14 How fast should people be allowed to drive in a 100km/h without being booked for speeding? [single response]
The Social Research Centre
69%74% 73%
78% 76% 78% 81% 82% 79% 79%88% 90% 92% 91% 89%
30%26% 26%
21% 23% 22% 19% 18% 19% 21%12% 10% 8% 9% 11%
47%
53%57%
65%57%
63% 62% 61% 59% 61%69%
74% 76%71% 73%
52%
45% 42%35%
42%36% 37% 39% 40% 39%
31%26% 24%
29%
0%
20%
40%
60%
80%
100%
2001(511)
2002(499)
2003(509)
2004(510)
2005(500)
2006(499)
2007(499)
2008(500)
2009(500)
2010(681)
2011(767)
2012(1099)
2013(745)
2014M(624)
2015M(629)
Up to 65km/h In excess of 65km/h
Up to 105km/h In excess of 105km/h

Road Safety Monitor 2015 Page 32A Summary Report for the TAC
5.2. Frequency of speeding
Respondents were asked how often they intentionally drove above the posted speed limit in the last
three months. Figure 5.2 shows that around half of respondents (52% in a 60km/h zone; 50% in a
100km/h) never speed about the posted speed limit. Only 8% indicated that they speed at least half of
the time over the posted speed limit in a 60km/h and 11% indicated that they speed at least half of the
time in a 100km/h zone.
Figure 5.15: Frequency of driving over THE POSTED speed (2015)
Base: All respondents (n=961) Q10 How often have you intentionally driven above the limit in a 60km/h zone, even if by only a few kms per hour, in the
last three months? [single response]Q13 How often have you intentionally driven above the limit in a 100km/h zone, even if by only a few kms per hour, in the
last three months? [single response]
Respondents who nominated a speed greater than the posted limit as an acceptable limit were asked
how often they travel above the speed which they nominated. Similar to driving over the posted limit,
47% of respondents in a 60km/h zone and 48% in a 100km/h zone stated that they never drove over
their self-defined speed limit. A small proportion (2% and 4%) reported that they drive at or above their
self-defined speed limit ‘all of the time’ in a 60km/h zone and 100km/h zone respectively. As
anticipated, there was a strong relationship between those who drive over the posted limit and over
their own self-defined limit.
Figure 5.16: Frequency of driving over SELF-DEFINED speed (2015)
Base: Respondents who nominated a speed greater than 60/100 as acceptable (n=655)Q12 When you have the opportunity, how often do you travel at or above that speed in a 60km/h zone? [single response]Q15 When you have the opportunity, how often do you travel at or above that speed in a 100km/h zone? [single response]
The Social Research Centre
50
52
36
35
5
5
5
2
1
1
0% 20% 40% 60% 80% 100%
100km/h zone
60km/h zone
None of the time Some of the time About half the time Most of the time All of the time
48
47
40
42
3
3
4
2
0% 20% 40% 60% 80% 100%
100km/h zone
60km/h zone
None of the time Some of the time About half the time Most of the time All of the time
Road Safety Monitor 2015 Page 33A Summary Report for the TAC
As seen in Table 5.1, responses were relatively consistent among demographic groups for self-defined
speeding in a 60km/h zone however, significantly more male respondents reported driving at or above
the self-defined speed limit in a 100km/h zone ‘all of the time’ (6%), compared to females (2%).
Similarly, those aged 18 to 25 years (7%) were more likely to speed ‘all of the time’ compared to
drivers aged 61 or over (2%).
Table 5.21: Frequency of self-defined speeding by demographics (2015)Total Region Gender Age group
2015M (655)
Metro (483)
Regional (172)
Males(341)
Females(306)
18-25(109)
26-39 (180)
40-60 (225)
61+ (124)
A B C D E F G H
60km: None of the time 47% 46% 51% 47% 47% 51% 43% 48% 50%
60km: Some to half of the time 45% 45% 45% 45% 46% 43% 49% 45% 44%
60km: Most to all of the time 2% 2% 1% 2% 2% 2% 2% 2% 1%
100km: None of the time 48% 50% 43% 47% 49% 49% 41% 48% 56%F
100km: Some to half of the time 43% 41% 48% 42% 44% 42% 49%H
42% 37%
100km: Most to all of the time 4% 3% 6% 6% 2% 7%H
4% 4% 2%
Base: Respondents who nominated a speed greater than 60/100 as acceptable (n=655)Q12 When you have the opportunity, how often do you travel at or above that speed in a 60km/h zone? [single response]Q15 When you have the opportunity, how often do you travel at or above that speed in a 100km/h zone? [single response]
5.3. Speeding behaviour
Respondents were asked if they had been caught speeding in the last twelve months by either the
police or a fixed/mobile camera. Figure 5.3 shows that among licence holders aged up to 60, there
was a small decline in the proportion who reported being caught speeding (17%) compared to the last
wave, however this is comparable to levels seen in 2012/13.
Figure 5.17: Incidence of being caught speeding in last 12 months – time series
Base: Licence holders aged 18-60 with a valid response (n=700)Q35 Have you been caught speeding in the last 12 months (either by police or a fixed/mobile camera)? [single response]
The Social Research Centre
12%
18%20%
15%
21%
17% 18% 18% 19% 18% 18% 17% 17%19%
17%
0%
5%
10%
15%
20%
25%
2001(511)
2002(499)
2003(509)
2004(510)
2005(500)
2006(499)
2007(499)
2008(500)
2009(500)
2010(702)
2011(809)
2012(1140)
2013(784)
2014M(685)
2015M(700)

Road Safety Monitor 2015 Page 34A Summary Report for the TAC
Overall, one in ten (16%) respondents reported that they had been caught speeding in the last twelve
months (Table 5.2). More drivers in metropolitan areas reported being caught speeding (18%) than
drivers in regional areas (8%). Similarly, more male drivers had been caught speeding (18%) than
female drivers (13%). Overall, drivers were caught speeding at an average of 1.26 times with no
significant differences between demographics.
Table 5.22: Speeding behaviour by demographics (2015)Total Region Gender Age group
2015M (961)
Metro (695)
Regional (266)
Males(483)
Females
(470)
18-25(135)
26-39 (248)
40-60 (330)
61+ (225)
A B C D E F G H
Caught speeding 16% 18% 8% 18% 13% 15% 18%H
17%H
11%
Average number of times caught 1.26 1.25 1.29 1.22 1.31 1.25 1.28 1.23 1.26
Base: Q35 All respondents (n=961): Q36 Caught speeding (n=149) Q35 Have you been caught speeding in the last 12 months (either by police or a fixed/mobile camera)? [single response]Q36 How many times have you been caught speeding in the last 12 months? [numeric response]
When looking at speeding behaviour by behaviours, Table 5.3 shows that drivers who reported driving
over the posted or their own speed limit were more likely to be caught speeding (25%), as were those
who reported drink driving (30%), and using mobile phones while driving (23%); compared to those
who do not speed (14%), drink drive (16%), or use their phone while driving (12%). Interestingly,
drivers who reported not using a mobile phone had been caught more frequently on average than
those who use a mobile phone (mean of 1.41 times compared to 1.18 times).
Table 5.23: Speeding behaviour by behaviours (2015)Total Speeding Drink driving Drowsy driving Phone use Road accident
2015M (961)
Yes (108)
No (838)
Yes (64)
No (650)
Yes (91)
No (856)
Yes (295)
No (662)
Yes (139)
No (815)
A B C D E F G H I J
Caught speeding 16% 25% 14% 30% 16% 21% 15% 23% 12% 22% 15%
Average number of times caught 1.26 1.16 1.28 1.26 1.23 1.34 1.24 1.17 1.34 1.25 1.26
Base: Q35 All respondents (n=961): Q36 Caught speeding (n=149) Q35 Have you been caught speeding in the last 12 months (either by police or a fixed/mobile camera)? [single response]Q36 How many times have you been caught speeding in the last 12 months? [numeric response]
The Social Research Centre

Road Safety Monitor 2015 Page 35A Summary Report for the TAC
5.4. Attitudes toward speeding
Respondents were asked about their level of agreement with a range of speeding statements. Drivers
aged 18 to 25 years were significantly more likely to agree that it is easy to avoid being caught driving
over the limit (44%) compared to any other age group. Drivers in regional areas were more likely to
agree that there was a high chance of being caught speeding (60% vs. 51%); as were drivers aged 40
to 60 years (56%) and 61+ years (59%) compared to 18 to 25 year olds (42%).
It is interesting to note that there were no significant differences in attitudes toward the chances of
being caught speeding between those who had been caught in the last 12 months and those who had
not been caught.
Table 5.24: Attitudes towards speeding (total agree %) by demographics (2015)Total Region Gender Age group
2015M (961)
Metro (695)
Regional (266)
Males(483)
Females(470)
18-25(135)
26-39 (248)
40-60 (330)
61+ (225)
A B C D E F G HEasy to avoid being caught driving over the limit 32% 31% 33% 32% 32% 44%
F,G,H31% 28% 33%
If I speed by a few kms in a 60 zone, I have a high chance of being caught
53% 51% 60% 53% 53% 42% 52% 56%E
59%E
My family and friends think it’s okay to speed by a few kms in a 60 zone
25% 27% 22% 26% 24% 33%G,H
27% 23% 23%
Base: All respondents (n=961)Q16 On a scale of 1 to 5, where 1 is “Strongly disagree” and 5 is “Strongly agree”, to what extent do you agree or disagree
with the following statements? [single response]
Respondents who participated in risk taking behaviours, particularly speeding (37%), driving while
drowsy (35%) and using a mobile phone while driving (33%), were significantly more likely to agree
that their family and friends think it is okay to speed a few kilometres over in a 60 zone, compared to
those who do not regularly drive while drowsy (24%), and do not use their phone while driving (22%).
There was also a higher level of agreement among non-drink drivers who felt there was a high chance
of being caught speeding (53%) compared to drink drivers (37%).
Table 5.25: Attitudes towards speeding (total agree %) by behaviours (2015)Total Speeding Drink driving Drowsy driving Phone use Road accident
2015M (961)
Yes (108)
No (838)
Yes (64)
No (650)
Yes (91)
No (856)
Yes (295)
No (662)
Yes (139)
No (815)
A B C D E F G H I JEasy to avoid being caught driving over the limit
32% 34% 32% 44% 33% 36% 32% 35% 30% 33% 32%
If I speed by a few kms in a 60 zone, I have a high chance of being caught
53% 46% 54% 37% 53% 49% 54% 44% 58% 58% 52%
My family and friends think it’s okay to speed by a few kms in a 60 zone
25% 37% 24% 35% 26% 35% 24% 33% 22% 24% 26%
Base: All respondents (n=961)Q16 On a scale of 1 to 5, where 1 is “Strongly disagree” and 5 is “Strongly agree”, to what extent do you agree or disagree
with the following statements? [single response]
The Social Research Centre

Road Safety Monitor 2015 Page 36A Summary Report for the TAC
5.5. Regression analysis (Speeding)
5.5.1. Self-defined speeding regression
After accounting for other characteristics, the likelihood of speeding was:
Significantly higher for males compared to females;
Significantly lower for older respondents (aged 61 and over) compared to those aged 18 to 25;
and
Significantly higher for respondents in ‘blue collar’ occupations compared to those who were
not working.
Figure 5.18: Odds ratios for model of Speeding
The Social Research Centre

Road Safety Monitor 2015 Page 37A Summary Report for the TAC
5.5.1. Perceptions of being caught speeding regression
After accounting for other differences between respondents, only location remained as significantly
associated with the propensity to agree that there is a high chance of being caught speeding.
Respondents in regional areas were approximately twice as likely to agree compared to those in
metropolitan areas. All age groups were more likely to agree than 18-25 year olds, with those aged 26-
39 years being significantly more likely.
Figure 5.19: Odds ratios for model of High chance of being caught speeding
The Social Research Centre

Road Safety Monitor 2015 Page 38A Summary Report for the TAC
After accounting for other differences between respondents, only age remained as significantly
associated with the propensity to agree that it is easy to avoid being caught speeding. Respondents
aged 26 years or older were approximately half as likely to agree compared to those aged 18 to 25
years.
Figure 5.20: Odds ratios for model of Easy to avoid being caught while speeding
The Social Research Centre

Road Safety Monitor 2015 Page 39A Summary Report for the TAC
6. Impaired driving
6.1. Use of drugs & alcohol
All respondents were asked whether they drink and if they had used recreational drugs in the last
twelve months. Figure 6.1 shows that among licence holders aged 18 to 60, around four in five (79%)
drink alcohol, while less than one in ten (8%) have used recreational drugs in the last twelve months.
While the proportion of those who drink alcohol in 2015 is generally consistent with previous years,
there was a significant decrease in the 2014 (74%).
Figure 6.21: Alcohol and drug use* – time series
Base: Licence holders aged 18-60 with a valid response (n=700)Q21 Do you drink alcohol? [single response]Q26 Have you used recreational drugs (for example, methamphetamine, ice, marijuana etc.) in the last 12 months? [single
response]*Note: ‘Drug use’ was introduced in 2014
As shown in Table 6.1, males were significantly more likely to drink alcohol (79%) compared to
females (72%), while drivers aged 61 and over were significantly less likely to drink alcohol (66%) than
all other age groups. Although a small proportion admitted to using drugs in the last twelve months,
usage was considerably higher among respondents aged 18 to 25 years (16%) than any other age
group. It is interesting to note that all respondents who reported using drugs also drank alcohol.
Table 6.26: Alcohol and drug use by demographics (2015)Total Region Gender Age group
2015M (961)
Metro (695)
Regional (266)
Males(483)
Females
(470)
18-25(135)
26-39 (248)
40-60 (330)
61+ (225)
A B C D E F G H
Drinks alcohol 75% 74% 79% 79% 72% 84%H
79%H
76%H
66%
Uses drugs 6% 7% 5% 7% 6% 16%F,G,H
7%H
5%H
1%
Base: All respondents (n=961)Q21 Do you drink alcohol? [single response]Q26 Have you used recreational drugs (for example, methamphetamine, ice, marijuana etc.) in the last 12 months? [single
response]
The Social Research Centre
71%78% 80% 77% 80% 81% 79% 78% 77% 79% 79% 82%
77% 74%79%
9% 8%
0%
20%
40%
60%
80%
100%
2001(511)
2002(499)
2003(509)
2004(510)
2005(500)
2006(499)
2007(499)
2008(500)
2009(500)
2010(702)
2011(809)
2012(1140)
2013(784)
2014M(685)
2015M(700)
Drinks alcohol Uses drugs
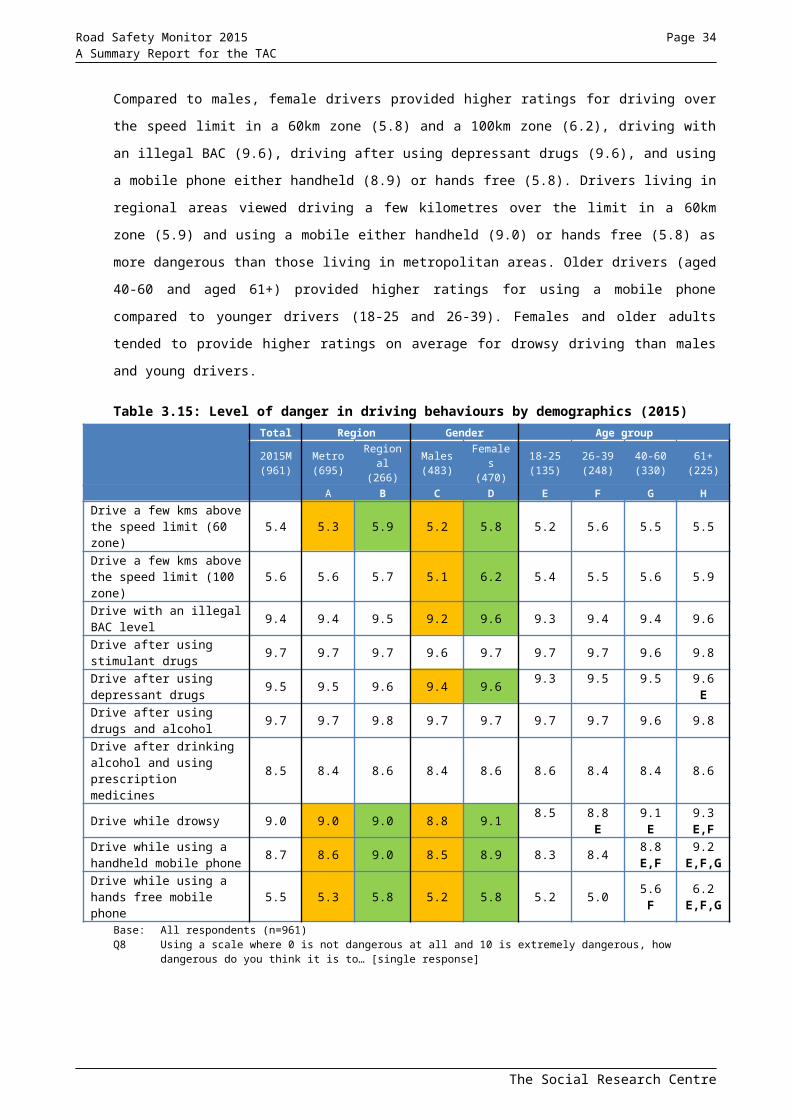
Road Safety Monitor 2015 Page 40A Summary Report for the TAC
Table 6.2 looks at alcohol and drug use by behaviours. The proportion of drivers who drink alcohol
was significantly higher among speeders (85%), drowsy drivers (88%) and mobile phone users (85%).
It is worth noting that the question about ‘drink driving’ was only asked of those respondents who
indicated they drank alcohol. Drivers who participated in any ‘risky’ driving behaviour reported
significantly higher levels of drug usage than those who did not participate in ‘risky’ driving behaviours.
Table 6.27: Alcohol and drug use by behaviours (2015)Total Speeding Drink driving Drowsy driving Phone use Road accident
2015M (961)
Yes (108)
No (838)
Yes (64)
No (650)
Yes (91)
No (856)
Yes (295)
No (662)
Yes (139)
No (815)
A B C D E F G H I J
Drinks alcohol 75% 85% 74% 100% 100% 88% 75% 85% 71% 73% 76%
Uses drugs 6% 17% 5% 31% 5% 14% 5% 12% 4% 5% 6%
Base: All respondents (n=961)Q21 Do you drink alcohol? [single response]Q26 Have you used recreational drugs (for example, methamphetamine, ice, marijuana etc.) in the last 12 months? [single
response]
6.2. Attitudes to impaired driving
Respondents were asked about their attitudes towards impaired driving (e.g. drink and drug driving).
Overall, more than half (57%) of respondents agreed that if they drove, even slightly over the legal
limit they were likely to be caught. Around one in five agreed that it was easy to avoid being caught
driving over the legal limit (23%) or after using drugs (19%). Less than one ten (9%) respondents
agreed that their family and friends thought it was okay to drive slightly over the legal alcohol limit.
Table 6.3 shows that a greater proportion of drivers aged 18 to 25 years (29%) and 61+ years (27%)
agreed that it is easy to avoid being caught if driving over the 0.05 limit compared to those aged 40 to
60 years (19%). More regional respondents (64%) agreed they were likely to be caught driving over
the legal limit even if it was slightly over compared to metropolitan drivers (55%), fewer drivers aged
18 to 25 years (44%) agreed with this same statement compared to other age groups.
Table 6.28: Attitudes to impaired driving (total agree %) by demographics (2015)Total Region Gender Age group
2015M (961)
Metro (695)
Regional (266)
Males(483)
Females(470)
18-25(135)
26-39 (248)
40-60 (330)
61+ (225)
A B C D E F G HEasy to avoid being caught if driving over the 0.05 limit 23% 24% 23% 23% 25% 29%
G25% 19% 27%
GIf I was driving (slightly) over the (0.05) limit, I am likely to be caught
57% 55% 64% 57% 59% 44% 57%E
60%E
63%E
My family and friends think it’s OK to drive slightly over the 0.05 limit
9% 9% 9% 10% 9% 6% 12% 7% 12%
It’s easy to avoid being caught if I was driving after using drugs
19% 19% 20% 18% 21% 17% 22% 17% 23%
Base: All respondents (n=961)Q29a,b,c,e To what extent do you agree or disagree with the following statements, using a scale of 1 to 5, where 1 is “Strongly
disagree” and 5 is “Strongly agree”? [single response]
The Social Research Centre

Road Safety Monitor 2015 Page 41A Summary Report for the TAC
Table 6.4 looks at attitudes towards impaired driving by behaviours. A higher proportion of drivers who
did not participate in ‘risky’ driving behaviours (speeding and drink driving) agreed that they were likely
to be caught drink driving, while those who have been involved in a road accident tended to agree
more than those not involved in an accident.
Table 6.29: Attitudes to impaired driving (total agree %) by behaviours (2015)Total Speeding Drink driving Drowsy driving Phone use Road accident
2015M (961)
Yes (108)
No (838)
Yes (64)
No (650)
Yes (91)
No (856)
Yes (295)
No (662)
Yes (139)
No (815)
A B C D E F G H I JEasy to avoid being caught if driving over the 0.05 limit
23% 25% 23% 28% 22% 24% 23% 29% 21% 26% 23%
If I was driving (slightly) over the (0.05) limit, I am likely to be caught
57% 48% 59% 39% 60% 51% 58% 53% 59% 68% 56%
My family and friends think it’s OK to drive slightly over the 0.05 limit
9% 13% 9% 11% 9% 13% 9% 12% 8% 12% 9%
It’s easy to avoid being caught if I was driving after using drugs
19% 18% 20% 13% 20% 15% 20% 20% 19% 21% 19%
Base: All respondents (n=961)Q29a,b,c,e To what extent do you agree or disagree with the following statements, using a scale of 1 to 5, where 1 is “Strongly
disagree” and 5 is “Strongly agree”? [single response]
6.3. Drink and drug driving
6.3.1. Getting home after drinking
Respondents were asked about the last time they went out and drank alcohol and at what point they
decided how they would get home. Consistent with previous waves, nine in ten (93%) licence holders
aged 18 to 60 reported that they made plans before they went out drinking, 4% made plans after.
Figure 6.22: Plan for getting home the last time drinking – time series
Base: Licence holders aged 18-60 who drink alcohol and do not always drink at home (n=552)Q25 Please think about the last time you went out (not at home) and drank alcohol. Did you decide how you would get
home…? [single response]
The Social Research Centre
88% 90% 91% 94% 94% 95% 94% 93%
6% 6% 5% 4% 5% 4% 4% 4%
0%
20%
40%
60%
80%
100%
2008(395)
2009(396)
2010(536)
2011(644)
2012(926)
2013(608)
2014M(504)
2015M(552)
Planned before drinking Planned after drinking

Road Safety Monitor 2015 Page 42A Summary Report for the TAC
6.3.2. Breath and drug testing
When asked about breath and drug testing, the proportion of licence holders aged 18 to 60 who
reported being drug tested was comparable with previous waves (9%). The proportion who reported
being breath tested was consistent with recent years.
Figure 6.23: Drivers tested in the last 12 months – time series
Base: Licence holders aged 18-60 (n=700)Q37 Over the past 12 months have you been breath tested or been in a car when the driver was breath tested? [single
response]Q39 Over the past 12 months have you been drug tested or been in a car when the driver was drug tested? [single
response]
The proportion of drivers aged 61 and over (46%) who reported being breath tested was significantly
lower when compared to other age groups. Significantly more metropolitan respondents reported
being drug tested in the last twelve months (10%) compared to regional drivers (5%).
Table 6.30: Drivers tested in the last 12 months by demographics (2015)Total Region Gender Age group
2015M (961)
Metro (695)
Regional (266)
Males(483)
Females
(470)
18-25(135)
26-39 (248)
40-60 (330)
61+ (225)
A B C D E F G HBreath tested in last 12 months 61% 59% 65% 64% 58% 64%
H70%
H63%
H46%
Drug tested in last 12 months 8% 10% 5% 9% 7% 11% 10% 7% 7%
Base: All respondents (n=961)Q37 Over the past 12 months have you been breath tested or been in a car when the driver was breath tested? [single
response]Q39 Over the past 12 months have you been drug tested or been in a car when the driver was drug tested? [single
response]
The Social Research Centre
63% 63% 66%71% 73%
65% 65%60%
68%61%
71%65% 67% 66% 65%
4% 5% 5% 6% 7% 9%
0%
20%
40%
60%
80%
2001(511)
2002(499)
2003(509)
2004(510)
2005(500)
2006(499)
2007(499)
2008(500)
2009(500)
2010(702)
2011(809)
2012(1140)
2013(784)
2014M(685)
2015M(700)
Been breath tested Been drug tested

Road Safety Monitor 2015 Page 43A Summary Report for the TAC
6.3.3. Driver or passenger after drinking or drug use
Less than one in ten drivers aged 18 to 60 (7%) reported being a passenger in a car when they knew
or suspected the driver was over the legal blood alcohol limit. In comparison, among licence holders
aged 18 and 60 years who drink alcohol, one in ten (11%) reported driving when they knew or
suspected they were over the legal limit. This figure is comparable to 2014 where the proportion
returned to 2009 rates. It is worth noting that the proportion of respondents who had driven when they
suspected that they were over the limit decreases to 9% when the whole sample is included – this
figure is consistent with previous waves.
Questions around drug use and drug driving were introduced in 2014 and are typically applicable to a
small proportion of respondents. Of the 60 respondents who reported taken drugs in the last twelve
months, 10 indicated that they had driven after taking drugs.
As seen in Table 6.6, while proportions are generally small, respondents aged 18 to 25 years were
significantly more likely to report being a passenger when they knew or thought that the driver was
over the limit (11%), and driving when they suspected that they were over the limit, compared to older
respondents.
Table 6.31: Driver & passenger who got into car by demographics (2015)Total Region Gender Age group
2015M (961)
Metro (695)
Regional (266)
Males(483)
Females
(470)
18-25(135)
26-39 (248)
40-60 (330)
61+ (225)
A B C D E F G HBeen in car when driver over the limit 6% 5% 8% 6% 6% 11%
G,H8%H
5%H
1%
Driven over the limit 9% 8% 11% 10% 7% 11%H
10%H
12%H
2%
Driven on drugs* 17% 19% 9% 21% 12% 9% 22% 22% -
Base: Q19 all respondents (n=961); Q22 respondents who drink alcohol (n=724); Q27 respondents who have taken drugs (n=61)
Q19 Have you ever gotten into a car when you knew or thought the driver was over the legal blood alcohol limit over the last 12 months? [single response]
Q22 During the last 12 months, have you driven a car when you knew or thought you were over the legal blood alcohol limit? [single response]
Q27 Have you driven a car after using recreational drugs in the last 12 months? [single response]*Note: caution should be taken when interpreting drug driving figures due to small sample size (n=61)
The Social Research Centre

Road Safety Monitor 2015 Page 44A Summary Report for the TAC
Generally speaking, respondents who participated in ‘risky’ driving behaviours were more likely to
report being a passenger when they suspected the driver was over the limit, and were more likely to or
have themselves driven when they suspected they were over the limit compared to those who do not
engage in ‘risky’ driving behaviours.
Table 6.32: Driver & passenger who got into car by behaviours (2015)Total Speeding Drink driving Drowsy driving Phone use Road accident
2015M (961)
Yes (108)
No (383)
Yes (64)
No (650)
Yes (91)
No (856)
Yes (295)
No (662)
Yes (139)
No (815)
A B C D E F G H I JBeen in car when driver over the limit 6% 17% 5% 37% 4% 13% 5% 13% 3% 6% 6%
Driven over the limit 9% 22% 7% 100% - 17% 8% 18% 4% 10% 9%
Driven on drugs* 17% 28% 12% 35% 6% 30% 13% 17% 16% - 19%
Base: Q19 all respondents (n=961); Q22 respondents who drink alcohol (n=724); Q27 respondents who have taken drugs (n=61)
Q19 Have you ever gotten into a car when you knew or thought the driver was over the legal blood alcohol limit over the last 12 months? [single response]
Q22 During the last 12 months, have you driven a car when you knew or thought you were over the legal blood alcohol limit? [single response]
Q27 Have you driven a car after using recreational drugs in the last 12 months? [single response]*Note: caution should be taken when interpreting drug driving figures due to small sample size (n=61)
Respondents who had been a passenger in a car where they knew or thought that the driver was over
the limit were asked the main reason they got into the car. Figure 6.4 shows that the main reason for
being a passenger was that they believed the driver was capable (26%). Other notable mentions
include just wanting to get home (14%) and that the trip was short (10%).
Figure 6.24: Reasons for being a passenger when driver over the legal limit (%) (2015)
Base: Respondents who had been a passenger when they thought the driver was over the legal limit (n=57)Q20 What was the main reason you got into a car when you knew or thought the driver was over the over the legal blood
alcohol limit? [multiple response]
The Social Research Centre
12
2
2
4
7
9
10
14
26
0 10 20 30 40
Other
I was also over the limit
The driver was my spouse/ partner
No other transport alternatives
It was convenient
I was drunk
It was a short trip
I just wanted to get home
Thought the driver was capable
%

Road Safety Monitor 2015 Page 45A Summary Report for the TAC
Respondents were also asked the main reason why they drove while over the legal limit. As seen in
Figure 6.5, a quarter of respondents drove because they ‘just wanted to get home’ (25%), a further
20% drove because it was a short trip. One in ten (11%) respondents claimed that there was no other
method to get home.
Figure 6.25: Reasons for driving when over the legal limit (%) (2015)
Base: Respondents who had driven when they thought the driver was over the legal limit (n=64)Q23 What was the main reason for you driving a car when you knew or thought you were over the legal limit? [multiple
response]
The small group who had driven on drugs (n=10) were asked to provide the main reason why they had
done so. The responses provided by those who had used drugs were similar to those that had driven
after consuming alcohol. A sample of responses is provided below:
“Was the next day, didn’t think I would still have it in my system.”
“Still felt in control to drive.”
“To get home.”
In the 2015 ‘Pulse’ RSM, a question was introduced which asked respondents how many times in the
last four weeks they had driven a car after drinking when they knew or thought they were under the
limit. More than half (53%) of respondents reported that they had not driven after drinking even if they
thought they were under the limit in the ‘Pulse’, increasing marginally to 57% in the 2015 ‘Main’. Just
over a quarter (26%) reported driving 1 to 3 times. A small proportion (5%) reported having not driven
a car at all in the last four weeks.
Figure 6.26: Number of times driven under the limit (%) (2015 Pulse and Main)
Base: All respondents (n=961)Q24 How many times have you driven a car after drinking when you knew or thought you were under the legal blood
alcohol limit in the last four weeks?
The Social Research Centre
14
6
3
5
6
8
11
20
25
0 5 10 15 20 25 30
Other
Don't know
Needed to drive
Thought I was capable
I was only just on or just off the limit
Unsure of my BAC level
No other transport alternatives
It was a short trip
I just wanted to get home
%
53
57
30
26
5
7
4
5
5
4
0% 10% 20% 30% 40% 50% 60% 70% 80% 90% 100%
2015P
2015M
Zero 1-3 times 4+ times Haven't driven a car Don’t know/ Refused

Road Safety Monitor 2015 Page 46A Summary Report for the TAC
6.4. Regression analysis (drink driving)
6.4.1. Self-reported drink driving regression
After accounting for other differences, there remained some significant effects across gender, age
group and vehicle type in terms of the propensity to drive while over the legal limit:
Males were more than twice as likely as females to have driven while drunk in the past year;
Respondents aged 61 or older were less likely to have driven while drunk than those aged 18
to 25 years; and
SUV/4WD drivers were less likely to have driven while drunk compared to drivers of
passenger cars.
Figure 6.27: Odds ratios for model of Drink driving
The Social Research Centre

Road Safety Monitor 2015 Page 47A Summary Report for the TAC
6.4.1. Perceptions of being caught driving over 0.05 regression
After accounting for other differences between respondents, only age remained as significantly
associated with the propensity to agree that it is easy to avoid being caught while driving over the 0.05
limit. Respondents aged 40-60 years were approximately half as likely to be in this category compared
to those aged 18-25 years.
Figure 6.28: Odds ratios for model of Easy to avoid being caught while driving over 0.05 limit
The Social Research Centre

Road Safety Monitor 2015 Page 48A Summary Report for the TAC
After accounting for other differences between respondents, only age remained as significantly
associated with the propensity to agree that there is a high chance of being caught while driving over
the legal limit. Respondents aged 40-60 years were approximately twice as likely to agree compared
to those aged 18-25 years.
Figure 6.29: Odds ratios for model of High change of being caught while driving over 0.05 limit
The Social Research Centre

Road Safety Monitor 2015 Page 49A Summary Report for the TAC
7. Drowsy driving
7.1. Regular drowsy driving
In 2013 a question was introduced which asked respondents if they regularly drove while drowsy (at
least once a week). As seen in Figure 7.1, the proportion of respondents who report regularly driving
while drowsy has gradually declined from 18% in 2013 to 9% in 2015.
Figure 7.30: Regularly driving while drowsy (2013 to 2015 total sample)
Base: All respondents (n=960)Q17 Do you find yourself regularly (at least once a week) driving while drowsy? [single response]
There were no demographic differences in drowsy driving according to region or gender. However, a
greater proportion of young respondents (aged 18 to 25 years) reported driving while drowsy regularly
(19%) compared to those aged 40 to 60 years (9%) and aged 61 and over years (1%). Older drivers
(aged 61+) were the least likely group to regularly drive while drowsy.
Table 7.33: Regularly driving while drowsy by demographics (2015)Total Region Gender Age group
2015M (960)
Metro (694)
Regional (266)
Males(482)
Females
(470)
18-25(135)
26-39 (248)
40-60 (329)
61+ (225)
A B C D E F G HRegularly driving while drowsy 9% 9% 10% 10% 9% 19%
G,H13%
H9%H
1%
Base: All respondents (n=960)Q17 Do you find yourself regularly (at least once a week) driving while drowsy? [single response]
As can be seen in Table 7.2, those who engage in certain ‘risky’ driving behaviours have a higher
tendency to engage in multiple behaviours. Significantly more speeders (19%), drink drivers (22%),
and mobile phone users (18%) regularly drove while drowsy compared to non-speeders (8%), non-
drink drivers (10%), and those who did not use their phone (6%).
Table 7.34: Regularly driving while drowsy by behaviours (2015)Total Speeding Drink driving Drowsy driving Phone use Road accident
2015M (960)
Yes (108)
No (838)
Yes (64)
No (650)
Yes (91)
No (856)
Yes (295)
No (662)
Yes (138)
No (815)
A B C D E F G H I JRegularly driving while drowsy 9% 19% 8% 22% 10% 100% - 18% 6% 11% 9%
Base: All respondents (n=960)Q17 Do you find yourself regularly (at least once a week) driving while drowsy? [single response]
The Social Research Centre
18%
11%9%
0%
5%
10%
15%
20%
25%
2013(946)
2014M(928)
2015M(960)

Road Safety Monitor 2015 Page 50A Summary Report for the TAC
The main reasons that respondents provided for regularly driving while feeling drowsy are presented in
Figure 7.2. It can be seen that the requirement for work (36%) and the desire to ‘just get home’ (32%)
accounted for the majority of mentions. More than a quarter (27%) stated that they ‘had to travel
somewhere’ but no further information was provided.
Figure 7.31: Why drove while drowsy (%) (2015)
Base: Respondents who regularly drive while drowsy (n=91)Q18 Thinking about the last time you drove while drowsy, what was the main reason you did this? [single response]
7.2. Attitudes to drowsy driving
Overall, around a third (34%) of respondents agreed that they found it easy to keep themselves awake
if they needed to drive. Table 7.3 shows attitudes towards drowsy driving by demographics. A greater
proportion of drivers aged 18 to 25 years (45%) and 26 to 39 years (41%) agreed that it is easy to
keep themselves awake if they need to drive compared to those aged 61 or over (32%).
Table 7.35: Attitudes to drowsy driving (total agree and mean) by demographics (2015)Total Region Gender Age group
2015M (961)
Metro (695)
Regional (266)
Males(483)
Females(470)
18-25(135)
26-39 (248)
40-60 (330)
61+ (225)
A B C D E F G HIt’s easy to keep myself awake if I need to drive 34% 36% 31% 33% 36% 45%
G,H41%
G27% 32%
Base: All respondents (n=961)Q29d To what extent do you agree or disagree with the following statements, using a scale of 1 to 5, where 1 is “Strongly
disagree” and 5 is “Strongly agree”? [single response]Q8 Using a scale where 0 is not dangerous at all and 10 is extremely dangerous, how dangerous do you think it is to…
[single response]
While few differences were recorded in the extent of agreement with the statement “it’s easy to keep
myself awake if I need to drive” according to the various driving behaviour groups, there were
significant differences in the perceived level of danger associated with driving while drowsy.
Table 7.36: Attitudes to drowsy driving (total agree %) by behaviours (2015)Total Speeding Drink driving Drowsy driving Phone use Road accident
2015M (961)
Yes (108)
No (838)
Yes (64)
No (650)
Yes (91)
No (856)
Yes (442)
No (515)
Yes (139)
No (815)
A B C D E F G H I JIt’s easy to keep myself awake if I need to drive
34% 34% 34% 38% 33% 43% 33% 36% 34% 38% 34%
Base: All respondents (n=961)Q29d To what extent do you agree or disagree with the following statements, using a scale of 1 to 5, where 1 is “Strongly
disagree” and 5 is “Strongly agree”? [single response]Q8 Using a scale where 0 is not dangerous at all and 10 is extremely dangerous, how dangerous do you think it is to…
[single response]
The Social Research Centre
2
3
4
27
32
36
0 10 20 30 40 50
Other
Driving a long distance
Had to pick up/drive family/friends
I had to travel somewhere
I just wanted to get home
Had to for work
%

Road Safety Monitor 2015 Page 51A Summary Report for the TAC
7.3. Regression analysis (drowsy driving)
After accounting for other characteristics, the likelihood of driving while drowsy was:
Significantly lower for all age groups compared to those aged 18 to 25 years; and
Significantly higher for ‘blue collar’ workers compared to those who were not working.
Figure 7.32: Odds ratios for model of Drowsy driving
The Social Research Centre

Road Safety Monitor 2015 Page 52A Summary Report for the TAC
8. Distractions
8.1. Distractions while driving
Respondents were asked whether or not they had used a handheld mobile phone within the last
month. Among licence holders aged 18 to 60 years, just over half (55%) admitted to using a mobile
phone while driving in the last month. As can be seen in Figure 8.1, since 2011 the use of a handheld
mobile phone has been gradually declining.
Figure 8.33: Use of handheld mobile while driving – time series
Base: Licence holders aged 18-60 years (n=698)Q30 During the last month, have you used a HANDHELD mobile phone? [single response]
Respondents were also asked whether or not they had been distracted by other factors in the last
week. As seen in previous years, the most common distraction was other drivers (40%), followed by
‘your own thoughts’ (36%). Compared to 2014, there was a significant drop in mentions of street signs
(20%).
Figure 8.34: Distractions while driving (multiple response) (2013 to 2015 total sample)
Base: All respondents (n=961)Q34 In the last week, have you been distracted while driving by any of the following? [multiple response]
The Social Research Centre
32% 29% 29% 33% 32% 36%47%
64% 60% 62%56% 55%
0%
20%
40%
60%
80%
2004(510)
2005(500)
2006(499)
2007(499)
2008(500)
2009(500)
2010(702)
2011(809)
2012(1140)
2013(784)
2014M(685)
2015M(698)
46
36
24
2018
22
11 12
4 4
41
37
24 24
16
2018
11
3
10
40
36
24
20 19 18 17
12
47
0
5
10
15
20
25
30
35
40
45
50
Otherdrivers
Your ownthoughts
Passengers Streetsigns
Advertisingor shops
Mobilephone
Map/GPS CD/Radio Animalsinside car
Other
%2013
2014M
2015M

Road Safety Monitor 2015 Page 53A Summary Report for the TAC
Overall, a large proportion of respondents agreed that taking their eyes off the road for two seconds is
dangerous (88%) and drivers can ignore their phone if a message or call arrives while driving (87%).
Almost two in ten (18%) drivers agree that their family and friends think it is okay to use a mobile
phone without a hands free kit.
As seen in Table 8.1, significantly more females agreed that taking their eyes off the road for two
seconds is dangerous (91%) compared to males (86%). Also, a significantly greater proportion of
drivers aged 18 to 25 years agreed that they could ignore their phone if a message or call arrived
while they were driving (91%) compared to those aged 26 to 39 (82%); and that their family and
friends think it is okay to use a mobile phone without a hands free kit (24%) compared to those aged
40 to 60 (15%).
Table 8.37: Attitudes to distracted driving (total agree %) by demographics (2015)Total Region Gender Age group
2015M (961)
Metro (695)
Regional (266)
Males(483)
Females(470)
18-25(135)
26-39 (248)
40-60 (330)
61+ (225)
A B C D E F G HTaking my eyes off the road for two seconds is dangerous
88% 88% 87% 86% 91% 87% 90% 89% 85%
I can ignore my mobile phone if a message or call arrives while I am driving
87% 87% 87% 85% 89% 91%F
82% 88% 88%
My family and friends think it is ok to use a mobile phone without using a hands free kit
18% 18% 19% 19% 17% 24%G
20% 15% 18%
Base: All respondents (n=961)Q33 To what extent do you agree or disagree with the following statements, using a scale of 1 to 5, where 1 is “Strongly
disagree” and 5 is “Strongly agree”? [single response]
As seen in Table 8.2, those who reported speeding above the posted or their own speed limit were
less likely to agree that taking their eyes off the road is dangerous (82%) and that they can ignore their
phone while driving (80%) compared to those who do not speed (89% and 88% respectively). Also, a
significantly greater proportion of drivers who did not drive while drowsy who agreed that taking their
eyes off the road for a couple of seconds was dangerous (89%) compared to those who regularly
drove while drowsy (81%). As expected, phone users were less likely to agree that they can ignore
their phone while driving (77% compared to 91%).
Table 8.38: Attitudes to distracted driving (total agree %) by behaviours (2015)Total Speeding Drink driving Drowsy driving Phone use Road accident
2015M (961)
Yes (108)
No (838)
Yes (64)
No (650)
Yes (91)
No (856)
Yes (295)
No (662)
Yes (139)
No (815)
A B C D E F G H I JTaking my eyes off the road for two seconds is dangerous
88% 82% 89% 89% 87% 81% 89% 86% 89% 90% 88%
I can ignore my mobile phone if a message or call arrives while I am driving
87% 80% 88% 81% 87% 84% 88% 77% 91% 83% 88%
My family and friends think it is ok to use a mobile phone without using a hands free kit
18% 24% 18% 25% 17% 24% 18% 21% 17% 16% 18%
Base: All respondents (n=961)
The Social Research Centre
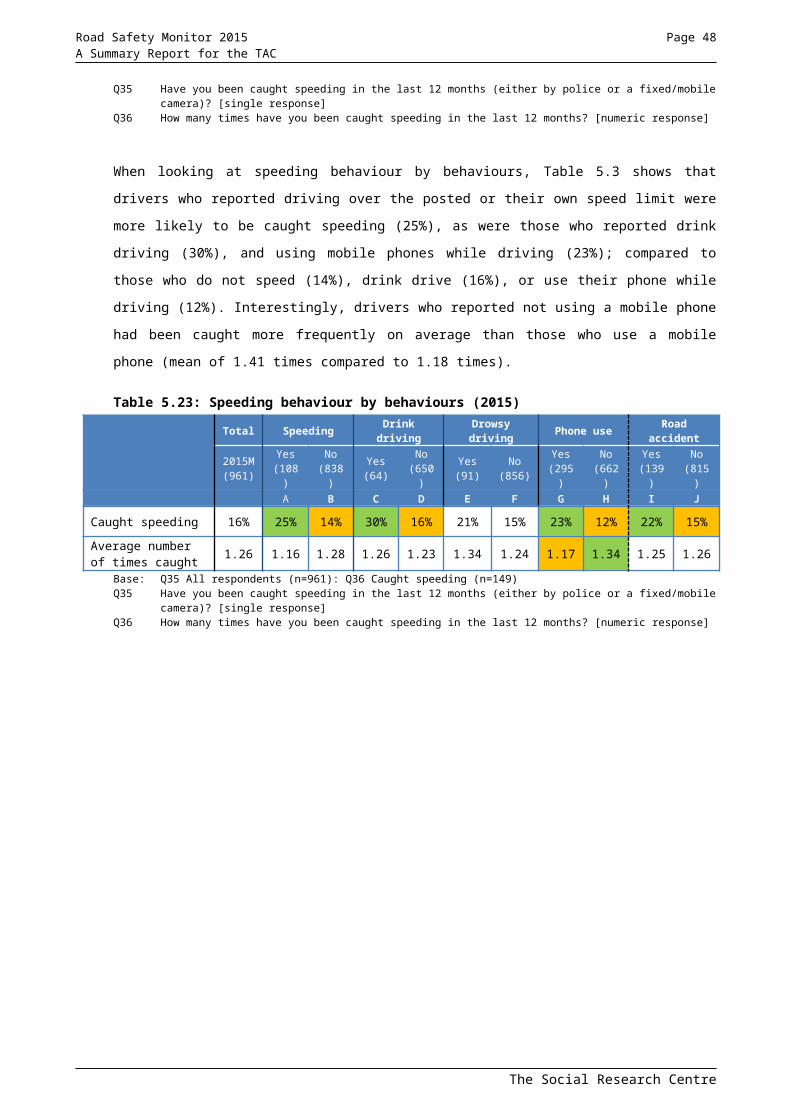
Road Safety Monitor 2015 Page 54A Summary Report for the TAC
Q33 To what extent do you agree or disagree with the following statements, using a scale of 1 to 5, where 1 is “Strongly disagree” and 5 is “Strongly agree”? [single response]
8.2. Mobile phone use
Respondents were asked how they used their phone to make or answer calls when driving. Four in ten
(42%) respondents reported that they did not use their phone at all while driving. A further 41%
reported that they normally used a hands free kit – this represents a significant increase from 2014
(34%).
Figure 8.35: Normal phone use in car (%) (2012 to 2015 total sample)
Base: All respondents (n=961)Q31 When you use your phone to make or answer calls while driving, do you normally …[single response]
As with previous years, there were a number of differences in phone answering behaviour according
to demographic groups. Some notable differences include:
Male drivers were more likely to hold the phone to their ear (4% vs. 1%), while females were
more likely to put the phone on their lap or console (16% vs 10%).
Drivers aged 18 to 39 years were more likely to place the phone on their lap or console.
Metropolitan drivers use a hands free device such as Bluetooth compared to regional drivers
(44% vs. 34%), and regional drivers were most likely to report not answering their phone while
driving (49% vs. 39%).
Drivers aged 61+ (71%) were the most likely group to report not answering or making calls
while driving.
Table 8.39: Normal phone use in car by demographics (2015)Total Region Gender Age group
2015M (961)
Metro (695)
Regional (266)
Males(483)
Females(470)
18-25(135)
26-39 (248)
40-60 (330)
61+ (225)
A B C D E F G HHold phone to/away from ear 3% 3% 3% 4% 2% 1% 4% 3% 2%
Put phone in lap or on console 13% 13% 13% 10% 16% 26%
G,H24%G,H 7% 3%
Only use hands free kit such as Bluetooth 41% 44% 34% 43% 39% 28% 54%
E,H49%E,H
21%
I never make or answer call while driving
42% 39% 49% 42% 42% 44%F
17% 40%F
71%E,F,G
Base: All respondents (n=961)
The Social Research Centre
10 8 5 3
16 15 13 13
27 3434 41
44 40 45 42
0%
20%
40%
60%
80%
100%
2012 2013 2014M 2015M
Never while driving
Only use a hands free kit
Put phone on lap or console
Hold phone to/away from ear

Road Safety Monitor 2015 Page 55A Summary Report for the TAC
Q31 When you use your phone to make or answer calls while driving, do you normally… [single response]
Table 8.4 looks at phone use by driving behaviour. Of those who had used a mobile phone while
driving in the last month, 40% indicated that when they use their phone to make or answer calls while
driving they normally put the phone in their lap or on the console. Speeders (26%), drink drivers
(31%), and drowsy drivers (23%) also reported higher levels of using a phone by placing it on their lap
or console than those who did not speed (11%), drink drive (13%) or drive while drowsy (12%).
Table 8.40: Normal phone use in car by behaviours (2015)Total Speeding Drink driving Drowsy driving Phone use Road accident
2015M (961)
Yes (108)
No (838)
Yes (64)
No (650)
Yes (91)
No (856)
Yes (295)
No (662)
Yes (139)
No (815)
A B C D E F G H I JHold phone to/away from ear 3% 5% 3% 5% 4% 4% 3% 8% 1% 6% 2%
Put phone in lap or on console 13% 26% 11% 31% 13% 23% 12% 40% 1% 16% 12%
Only use hands free kit such as Bluetooth 41% 50% 40% 47% 44% 59% 39% 44% 40% 48% 40%
I never make or answer call while driving
42% 18% 45% 17% 38% 14% 45% 6% 58% 29% 44%
Base: All respondents (n=961)Q31 When you use your phone to make or answer calls while driving, do you normally… [single response]
Respondents were also asked if they had used their phone in the last month to answer calls, make
calls, and text in various driving situations. As seen in Table 8.5, around one in five (22%) respondents
had answered a call but used their lap or the in-built speaker; with around 18% who had answered a
call while stopped at the lights (18%). Less than one in ten (9%) had used their phone to make a call
while actively driving.
Metropolitan (20%) respondents were more likely to answer a call while stopped at the lights
compared to regional respondents (13%). Older adults (aged 61+) were less likely than all other age
groups to use their phone for calls while driving in any situation.
Table 8.41: Use of handheld mobile for calls in car by demographics (2015)Total Region Gender Age group
2015M (961)
Metro (695)
Regional (266)
Males(483)
Females(470)
18-25(135)
26-39 (248)
40-60 (330)
61+ (225)
A B C D E F G HTo answer a call while stopped at the lights
18% 20% 13% 19% 17% 27%G,H
25%G,H
16%H
9%
To make a call while stopped at the lights 13% 14% 9% 13% 12% 21%
G,H19%G,H
12%H
2%
To answer a call but phone on lap and used in-built speaker
22% 22% 20% 20% 23% 36%G,H
37%G,H
16%H
5%
To make a call but phone on lap and used in-built speaker
14% 15% 14% 14% 15% 26%G,H
27%G,H
10%H
2%
To answer a call while actively driving 16% 16% 17% 18% 15% 22%
H22%
H16%
H8%
To make a call while actively driving 9% 9% 9% 10% 7% 14%
G,H13%G,H
8%H
2%
Base: All respondents (n=961)Q30a, c, e, f, i, j During the last month, have you used a HANDHELD mobile phone [single response]
The Social Research Centre

Road Safety Monitor 2015 Page 56A Summary Report for the TAC
The Social Research Centre

Road Safety Monitor 2015 Page 57A Summary Report for the TAC
As seen in Table 8.6 around a third (34%) of respondents read a text message while stopped at the
lights, while less than two in ten (18%) sent a message while stopped at the lights. One in ten (10%)
actively read a message while driving while only 5% sent a message while actively driving.
Females (40%) were more likely than males (28%) to read a text while stopped at the lights, while
males (12%) were more likely than females (8%) to read a text while actively driving. Texting while
stopped at the lights was more common among metropolitan respondents; in contrast, regional
respondents were more likely to read a text while actively driving. Again, older adults were the least
likely group to text while driving in any situation.
Table 8.42: Use of handheld mobile for texting in car by demographics (2015)Total Region Gender Age group
2015M (961)
Metro (695)
Regional (266)
Males(483)
Females(470)
18-25(135)
26-39 (248)
40-60 (330)
61+ (225)
A B C D E F G HTo read a text message while stopped at the lights
34% 36% 27% 28% 40% 47%G,H
53%G,H
31%H
10%
To write and send a text message while stopped at the lights
18% 20% 13% 18% 19% 31%G,H
31%G,H
15%H
1%
To read a text message while actively driving
10% 9% 14% 12% 8% 18%G,H
14%H
11%H
2%
To write and send a text message while actively driving
5% 5% 6% 6% 4% 9%H
8%H
5%H
-
Base: All respondents (n=961)Q30b,d,g,h During the last month, have you used a HANDHELD mobile phone? [single response]
The Social Research Centre

Road Safety Monitor 2015 Page 58A Summary Report for the TAC
8.3. Regression analysis (phone use while driving)
The results for mobile phone use while driving are presented below:
Regional respondents were significantly less likely than metropolitan respondents to driving
while using a phone;
Older respondents (aged 40 years and over) were significantly less likely to use their mobile
while driving than those aged 18 to 25 years;
Respondents in ‘white collar upper’ occupations were almost twice as likely as those who
were not working to state that they used their mobile while driving; and
Respondents who drove a panel, commercial or other sort of van were more than two times as
likely to use a mobile phone compared to sedan drivers.
Figure 8.36: Odds ratios for model of mobile phone use while driving
The Social Research Centre

Road Safety Monitor 2015 Page 59A Summary Report for the TAC
9. Vehicle ownership & purchasing
9.1. Vehicle ownership
Respondents were asked about ownership of the car they usually drove. Figure 9.1 shows that around
eight in ten (79%) respondents personally owned the car they drove, with a further 10% reporting that
the car they drove was owned by someone within their household. A small proportion (2%) did not own
or drive a car.
Notable differences in terms of vehicle ownership by demographics include:
Females were more likely to own the car they drove compared to males (84% vs. 74%).
Older drivers (61 year and over) reported owning their car more than any other age group
(90%).
Young drivers aged 18 to 25 years were most likely to be driving a car that was owned by
someone else in the household (32%) compared to all other ages.
Male drivers were more likely to have both a company and personal car compared to females
(8% compared to 1%).
Figure 9.37: Car ownership (%) (2015)
Base: All respondents (n=961)Q48 Which of the following statements best describe the car (not motorcycle or truck) you usually drive? Personally owned
includes cars that are under finance or leased. [single response]
The Social Research Centre
79
104 2 1 2
0
20
40
60
80
100
I personally ownthe car that Iusually drive
The car that Iusually drive is
owned by someoneelse in myhousehold
I usually drive acompany car but
also have my ownpersonal car
I only drive acompany car anddo not own a car
personally
I do not personallyown a car but hireor borrow one as
needed
I do not own a carand do not ever
drive a car
%

Road Safety Monitor 2015 Page 60A Summary Report for the TAC
Respondents were asked to provide the make, model and year of car they drove. The most common
makes in 2015 were Toyota (19%), Holden (15%), Ford (11%) and Mazda (8%). Regional drivers were
more likely to drive a Ford (16%), while metropolitan drivers were more likely to drive a Honda (6%) or
Volkswagen (5%). Males tended to drive a Holden (19%) and females were most commonly driving a
Mazda (10%) or a Hyundai (8%).
Table 9.43: Most common makes of car by demographics (top 10) (2015)Total Region Gender Age group
2015M (937)
Metro (675)
Regional (262)
Males(469)
Females(460)
18-25(127)
26-39 (241)
40-60 (324)
61+ (223)
A B C D E F G H
Toyota 19% 18% 21% 19% 19% 24%G
17% 15% 22%
Holden 15% 14% 18% 19% 10% 16% 16% 15% 14%
Ford 11% 9% 16% 11% 11% 9% 8% 15%F
10%
Mazda 8% 8% 6% 6% 10% 8% 8% 8% 7%
Hyundai 6% 7% 5% 5% 8% 5% 5% 6% 11%F,G
Mitsubishi 6% 6% 7% 6% 5% 6% 8% 5% 5%Nissan 6% 6% 7% 6% 6% 3% 8% 6% 4%
Honda 5% 6% 2% 5% 5% 7%G
7%G
2% 7%G
Volkswagen 4% 5% 1% 4% 3% 4% 4% 5% 2%Subaru 3% 3% 2% 2% 4% 1% 4% 3% 2%
Base: Respondents who do drive a car (n=937)Q49 What type of car do you usually drive? [single response]
Respondents were also asked about the importance of the car they drove. A small proportion (7%) felt
that their car was everything to them, while around a third (34%) felt their car was important to them
but not everything. Around a quarter (28%) said they cared a little but not all that much, while a further
20% reported that they don’t mind.
Figure 9.38: Importance of car to respondent (2015)
Base: All respondents (n=961)Q46 Which of the following statements best describes how important the type of car you drive is to you? [single response]
The Social Research Centre
7
3428
20
11
0
10
20
30
40
50
Everythingto me
Important to me,but not everything
I care a little,but not too much
I don't mind I don't care at all
%

Road Safety Monitor 2015 Page 61A Summary Report for the TAC
9.1.1. Household vehicles
Respondents were asked about any registered vehicles were at their home address. Table 9.2
presents the mean number of vehicles in a household by demographics. Overall, there was an
average of 2.18 cars per household, an average of 0.20 motorbikes and 0.07 trucks or buses per
household.
Generally, regional properties were more likely to have a truck or bus registered (0.17) than
metropolitan areas (0.03). The average number of cars was considerably higher among drivers aged
18 to 25 years (2.95) than any other age group. Drivers aged 61 or over were less likely than other
age groups to have vehicles registered.
Table 9.44: Mean number of vehicles in household by demographics (2015)Total Region Gender Age group
2015M (961)
Metro (695)
Regional (266)
Males(483)
Females(470)
18-25(135)
26-39 (248)
40-60 (330)
61+ (225)
A B C D E F G H
Cars 2.18 2.18 2.20 2.16 2.22 2.95F,G,H
2.09H
2.25H
1.80
Trucks or buses 0.07 0.03 0.17 0.07 0.07 0.07 0.07 0.08 0.06
Motorbikes 0.20 0.19 0.23 0.22 0.18 0.22 0.16 0.25 0.14
Base: All respondents (n=961)Q47 How many of each of the following types of registered vehicles are there at your home address? [numeric]
9.1.2. Forms of transport
In addition to using a car, respondents were asked the frequency of which they use different forms of
transport. As anticipated, the vast majority use a car daily as a driver (71%), with around one in three
reporting that they walked daily (34%). The least frequent forms of transport were riding a motorcycle
(84% ‘never’) and driving a truck (85% ‘never’).
Figure 9.39: Forms of transport (2015)
Base: All respondents (n=961)Q64 How often do you use the following forms of transport? [single response]
The Social Research Centre
2
1
1
2
3
6
34
5
71
1
2
7
3
8
7
27
45
20
2
2
6
3
8
11
10
19
2
3
3
14
32
38
47
9
17
2
85
84
64
52
36
24
13
8
2
0% 20% 40% 60% 80% 100%
Truck as a driver
Ride Motorcycle
Ride Bicycle
Bus
Tram
Train
Walk
Car as passenger
Car as driver
Daily At least weekly At least monthly At least yearly Never

Road Safety Monitor 2015 Page 62A Summary Report for the TAC
9.2. Purchasing behaviour
9.2.1. Intent to buy
Respondents were asked about their intent regarding a future vehicle purchase. Consistent with
previous waves, around four in ten (41%) reported that they intended to purchase a car in the future,
with 18% intending to purchase in the next twelve months.
Figure 9.40: Future car purchase intent – time series
Base: Licence holders aged 18-60 (n=700)Q51 Are you planning to purchase a car in future? [single response]
Similar to previous years, around two in five respondents who were planning to purchase a vehicle in
the future were planning to purchase a used car (43%). Whereas around one in three (34%) were
planning to purchase a new car.
Figure 9.41: New versus used car purchase intent – time series
Base: Respondents who plan to purchase a car aged 18-60 (n=286)Q52 Do you intend to buy a new or used car? [single response]
The Social Research Centre
61%55%
62%67% 67% 63%
69% 69%
44%51%
46% 43%37% 37% 41%
27% 28% 24% 27% 23%31%
15% 16% 20% 18% 17% 18%0%
20%
40%
60%
80%
2001(511)
2002(499)
2003(509)
2004(510)
2005(500)
2006(499)
2007(499)
2008(500)
2009(500)
2010(702)
2011(809)
2012(1140)
2013(784)
2014M(685)
2015M(100)
Plan to purchase car in future Plan to buy in next 12 months
21%28%
36%46%
40%29%
35% 33% 32% 30% 34%
50%40%
50%42%
60%
41%47% 47% 46% 49%
43%
0%
20%
40%
60%
80%
2005(500)
2006(499)
2007(499)
2008(500)
2009(500)
2010(336)
2011(384)
2012(501)
2013(297)
2014M(251)
2015M(286)
Intend to buy NEW car Intend to buy USED car

Road Safety Monitor 2015 Page 63A Summary Report for the TAC
Figure 9.6 illustrates the type of vehicle that respondents indicated that they planned to purchase in
the future. The most commonly mentioned vehicle types were a sedan (34%), followed by an
SUV/4WD (31%). Less than one in ten planned to purchase a twin-cab utility (6%), wagon (5%) or
utility (2%) while a further 15% had not yet made a decision.
Figure 9.42: Type of car purchase (2015)
Base: Respondents who plan to purchase a car (n=339)Q54 What type of vehicle are you planning to buy in the future? [single response]
9.2.2. Factors influencing selection
Once a budget had been set, respondents were asked to rate the importance of features that would
influence their vehicle selection from a scale of 1 (not important at all) to 5 (very important). The
condition of the vehicle (4.8) and the safety features of the vehicle (4.5) were considered the most
important features that influenced vehicle selection decision, while the towing or load capacity rated as
the least important influencing factor (2.7).
Figure 9.43: Factors influencing vehicle selection (mean) (2015)
Base: Respondents who may purchase a car (n=517)Q56 Once you have decided your budget, please give each of the following factors a score out of five (with 1 being not
important at all and 5 being very important) [single response]
The Social Research Centre
15
5
2
5
6
31
34
0 10 20 30 40 50
Haven't decided yet
Other
Utility
Wagon
Twin-cab utility
SUV/4WD
Sedan
%
2.7
3.3
3.4
3.5
3.8
4.0
4.1
4.1
4.2
4.5
4.8
1 2 3 4 5
Towing or load carrying capacity
Manufacturer
Power / performance
Style / appearance / image
Size of vehicle
Type of vehicle
Transmission type
Features of vehicle
Fuel economy / fuel cost
Safety features of the vehicle
Condition of the vehicle
(mean)

Road Safety Monitor 2015 Page 64A Summary Report for the TAC
Female respondents tended to place a higher level of importance on vehicle condition (4.8), fuel
economy (4.3), safety features (4.7) and transmission type (4.3); whereas males felt that power /
performance of the vehicle was of greater importance (3.5). Drivers in metropolitan areas placed a
greater emphasis on the manufacturer (3.4) and style (3.6), while those in regional areas were more
concerned with fuel economy (4.3). Older age groups tended to place greater importance on most
areas compared to younger drivers.
Table 9.45: Factors influencing vehicle selection (mean) by demographics (2015)Total Region Gender Age group
2015M (961)
Metro (389)
Regional (131)
Males(276)
Females(243)
18-25(98)
26-39 (158)
40-60 (163)
61+ (90)
A B C D E F G H
Condition of the vehicle 4.8 4.8 4.9 4.7 4.8 4.7 4.7 4.8 4.8
Features of vehicle 4.1 4.1 4.1 4.0 4.2 3.7 4.1E
4.1E
4.5E,F,G
Fuel economy / fuel cost 4.2 4.1 4.3 4.1 4.3 4.0 4.2 4.2 4.3E
Manufacturer 3.3 3.4 3.1 3.3 3.2 3.0 3.4E
3.4E
3.3
Power / performance 3.4 3.4 3.3 3.5 3.3 3.3 3.4 3.5 3.3
Safety features of the vehicle 4.5 4.5 4.6 4.4 4.7 4.5 4.6 4.5 4.6
Size of vehicle 3.8 3.9 3.7 3.8 3.9 3.1 4.0E
4.0E
3.9E
Style / appearance / image 3.5 3.6 3.3 3.6 3.5 3.5 3.6 3.5 3.5
Transmission type 4.1 4.1 4.1 3.9 4.3 3.9 4.0 4.0 4.7E,F,G
Type of vehicle 4.0 4.0 3.8 3.9 4.0 3.5 4.0E
4.1E
4.0E
Towing or load carrying capacity 2.7 2.6 2.9 2.8 2.6 2.0 2.8
E3.0E
2.6E
Base: Respondents who may purchase a car (n=520)Q56 Once you have decided on your budget, please give each of the factors a score out of five (with 1 being not important
at all and 5 being very important) [single response]
The Social Research Centre

Road Safety Monitor 2015 Page 65A Summary Report for the TAC
When asked specifically about the importance of various safety factors, airbags (including driver and
passenger frontal (4.6), side curtain (4.3) and side airbags (4.3)) were considered the most important
safety features. Lane departure warnings were considered least important on average (3.5).
Figure 9.44: Safety factors influencing vehicle selection (mean) (2015)
Base: Respondents who may purchase a car (n=525)Q57 From this list, please give each of the features a score out of five (with 1 being not important at all and 5 being very
important) [single response]
Respondents who were planning to purchase a car in the future were also asked if they would
consider the crash test results when they purchase their vehicle. Table 9.4 shows that overall, around
two thirds (67%) would consider crash test results when looking to purchase a vehicle, while just over
one in ten (16%) would not.
The proportion that would not consider the crash test results skewed towards males while females
tended to be unsure of their consideration.
Table 9.46: Consider crash test results when purchasing by demographics (2015)Total Region Gender Age group
2015M (534)
Metro (401)
Regional (133)
Males(285)
Females(247)
18-25(99)
26-39 (163)
40-60 (167)
61+ (92)
A B C D E F G HWould consider results 67% 69% 63% 66% 70% 67% 69% 64% 73%
Would not consider results 16% 15% 18% 20% 10% 15% 16% 17% 12%
Don’t know 16% 16% 18% 13% 20% 18% 15% 18% 13%
Base: Respondents who may purchase a car (n=534)Q58 Would you consider crash test results or safety ratings before you purchase your next car? This includes ANCAP
Used Car Safety Ratings and 5 star ratings. [single response]
The Social Research Centre
3.5
3.6
4.0
4.0
4.0
4.3
4.3
4.6
0 1 2 3 4 5
Lane departure warning systems
Rear parking aids
ABS brakes
Traction control
Stability Control
Side airbags
Side curtain airbags
Driver and passenger frontal airbags
(mean)

Road Safety Monitor 2015 Page 66A Summary Report for the TAC
Appendix 1 – Hardcopy Questionnaire
The Social Research Centre

Road Safety Monitor 2015 Page 67A Summary Report for the TAC
Appendix 2 – Online Questionnaire
The Social Research Centre

Road Safety Monitor 2015 Page 68A Summary Report for the TAC
Appendix 3 – CATI Follow-up Script
The Social Research Centre