
Overview & Status of The Decadal Survey Aerosol-Cloud ... · Overview & Status of The Decadal...
33
Overview & Status of The Decadal Survey Aerosol-Cloud- Ecology (ACE) Mission Ocean Color Research Team Mtg. May 4, 2009 Chuck McClain ACE Ocean Team Leader
Transcript of Overview & Status of The Decadal Survey Aerosol-Cloud ... · Overview & Status of The Decadal...

Overview & Status of TheDecadal Survey Aerosol-Cloud-
Ecology (ACE) Mission
Ocean Color Research Team Mtg.May 4, 2009
Chuck McClainACE Ocean Team Leader
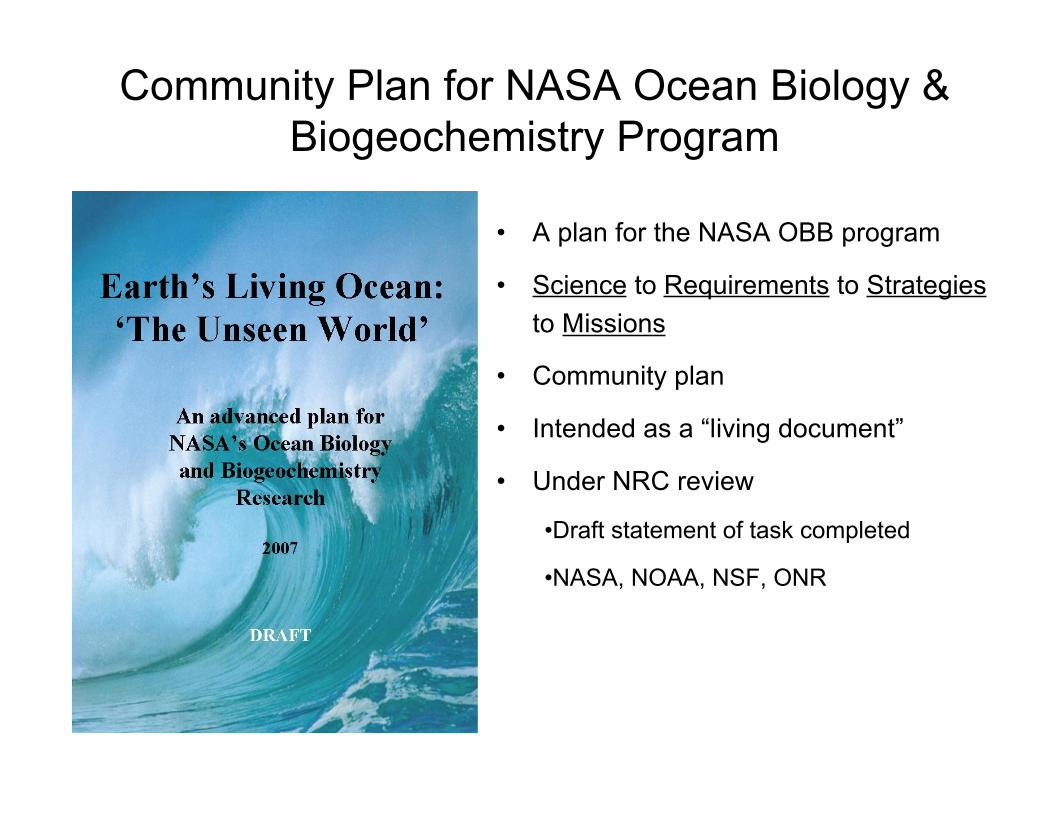
• A plan for the NASA OBB program
• Science to Requirements to Strategiesto Missions
• Community plan
• Intended as a “living document”
• Under NRC review
•Draft statement of task completed
•NASA, NOAA, NSF, ONR
Community Plan for NASA Ocean Biology &Biogeochemistry Program

The 4 NASA OBB Questions(1) How are ocean ecosystems and the biodiversity they support
influenced by climate and environmental variability and change,and how will these changes occur over time?
(2) How do carbon and other elements transition between oceanpools and pass through the Earth System, and how dobiogeochemical fluxes impact the ocean and Earth's climate overtime?
(3) How (and why) is the diversity and geographical distribution ofcoastal marine habitats changing, and what are the implicationsfor the well-being of human society?
(4) How do hazards and pollutants impact the hydrography andbiology of the coastal zone? How do they affect us, and can wemitigate their effects?
Earth's Living Ocean: A Strategic Vision for the NASA Ocean Biological and Biogeochemistry Program (under NRC review - draft athttp://www.icess.ucsb.edu/~davey/TRANSFER/OBB_plan_OCRT2007.ppt)

Climate Data Records• CDRs drive sensor stability and derived product accuracy requirements• Ocean Products
– Normalized water-leaving radiances– Chlorophyll-a & other plant pigment concentrations– Primary production– Inherent optical properties (IOPs; spectral absorption & scattering coefficients)– Particulate organic carbon concentration (POC)– Colored dissolved organic matter (CDOM)– Calcite concentration– Functional group distributions– Particle size distributions
• Ocean-Aerosol Products TBD• In situ observation requirements being addressed by the NASA Calibration &
Validation Office (separate presentation by Stan Hooker)– Includes on-orbit “vicarious” calibration– Includes improved instrumentation & protocols for expanded CDR suite
Current OBB CDRs
Additional “current” products:limited validation data
Future products

ACE Science ObjectivesACE is a aerosol-cloud and ocean ecosystem mission“… to reduce the uncertainty in climate forcing in aerosol-cloud
interactions and ocean ecosystem CO2 uptake” - Decadal Survey pg4-4
Aerosol-cloud component science objectives are to:1. decrease the uncertainty in aerosol forcing as a component in climate
change2. quantify the role of aerosols in cloud formation, alteration of cloud
properties and changes in precipitation.Ocean ecosystem goals are to:1. characterize and quantify changes in the ocean biosphere2. quantify the amount of dissolved organic matter, carbon, and other
biogeochemical species to define the role of the oceans in the carboncycle (e.g., uptake and storage).
The ocean ecosystem imager needs aerosol measurements to optimizetheir retrievals which is an important reason for the combinedpayloads.

ACE Sensor SuiteACE Payload currently considers the following instrument candidates:
1. Lidar for assessing aerosol/cloud heights and aerosol properties. (TRL 4-6)2. Dual frequency cloud radar for cloud properties and precipitation (TRL 4-6)3. Multi-angle, swath polarimeter for imaging aerosol and clouds (TRL 4-6)4. Ocean color radiometer for ocean ecosystems (TRL 5)5. IR imager for cloud temperatures and heights (TRL 6)6. High frequency microwave radiometer for cloud ice measurements (TRL 6)7. Low frequency microwave radiometer for precipitation measurements (TRL 8)8. Microwave temperature/humidity sounder (ATMS, TRL 9)
It is anticipated that all instruments will be openly competed.The payload may require more than one spacecraft.
Instruments in underlined gray were mentioned in the NAS DS ACE description. TheScience Working Group considers these overguide instruments critical to the mission.

Slide 7
Ocean EcosystemSpectrometer
Cloud Radar
HSR Lidar
Multi-anglemulti-wavelength
polarimeter
HF and LFradiometers
Orbit: 400-450 km, 13:45 SS orbit following EC
ACE B
ACE A
Notional ACE+PACE : Observing Geometry
EarthCARE (2014)
PACE - launches in 2016 with a polarimeter and the Ocean Ecosystem Spectrometer (OES),polarimeter, and nadir µ- wave radiometer (ATMS). PACE flies behind EarthCARE augmenting ECobservations. The rest of ACE launches in ~2020. This configuration provides 8-10 years ofmeasurements and continuity with EC. The PACE polarimeter and bus might be an internationalcontribution.
PACE
Multi-anglemulti-wavelength
polarimeters PACE LRD 2016ACE A, B LRD 2020
Nadir µ radiometer

The Pre-ACE (PACE) Mission
• EarthCare – one of the 6 ESA Earth Explorer satellites (LRD 2013)orbits at ~400 (or 450) km, PSS, 13:45 crossing time
• EarthCare payload consists of– Cloud Precipitation Radar (CPR): 94 GHz, -36dBz Doppler radar– High Spectral Resolution Lidar (HSRL @ 355nm)– Multi-angle BB IR Radiometer (2 channel, 0.2-4µ radiometer)– Multi-Spectral Imager (MSI) - 7 channel, 150 km swath imager (500m nadir
pixels, 0.66, 0.865, 1.6, 2.2, 8.2, 10.8, 12. µ)• EarthCare lacks a polarimeter and a wide swath multi-channel UV-
visible spectrometer (Ocean Ecosystem Spectrometer, OES)• PACE: A joint NASA-CNES (French space agency) mission
– Fly OES, 3MI (polarimeter) and Advanced Technology MicrowaveSounder (TMS) behind EarthCare
– NASA provides OES & ATMS (also on NPOESS Preparatory Mission)– CNES provides 3MI
Overview: PACE is a small mission (3 instruments) that would fly within 1minute behind or in front of EarthCare. The additional measurements fromPACE instruments would greatly augment the science of EC and provide newscience as well.

PACE Mission Design Study
PACE can fit in severalcandidate launch vehicles
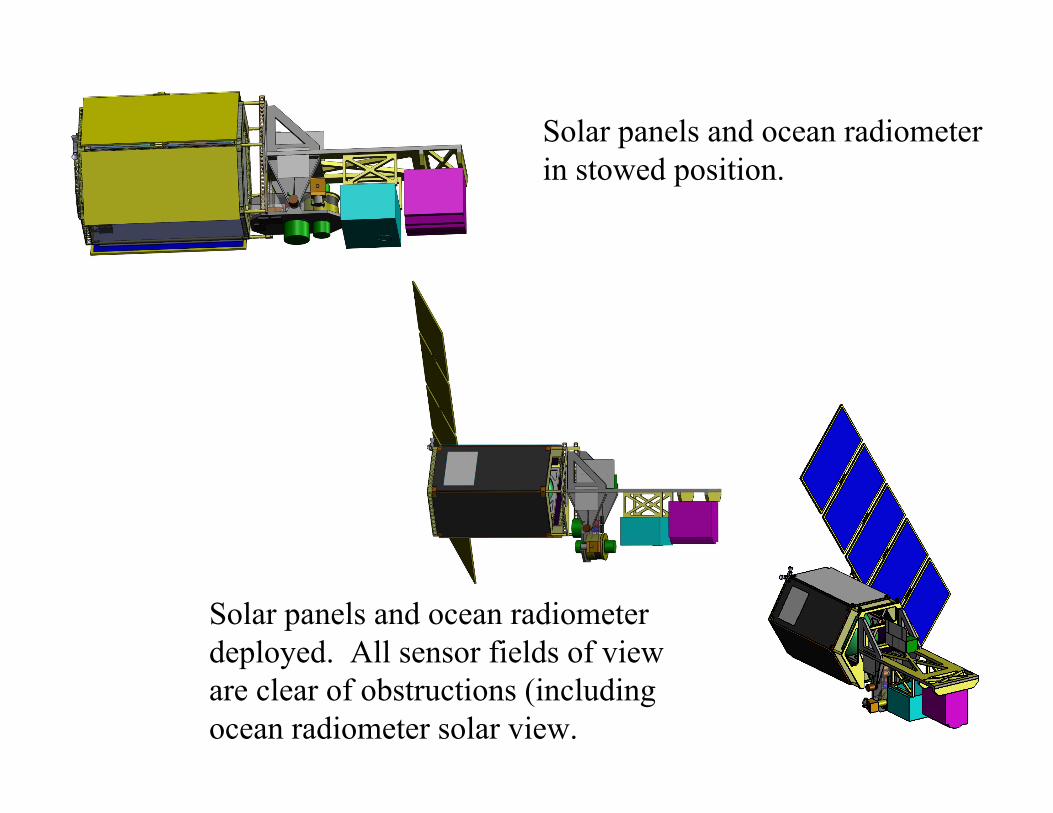
Solar panels and ocean radiometerin stowed position.
Solar panels and ocean radiometerdeployed. All sensor fields of vieware clear of obstructions (includingocean radiometer solar view.

ACE Study ScheduleACE Study Schedule• FY08
– Science team formed– Science team meeting - June (NASA/GSFC)– Working groups organized
• FY09– ST meeting Nov. 2008 (University of Utah)– ST meeting Mar. 2009 (Oxnard, CA)– GSFC/Mission Design Lab, JPL/Team X studies began April 2009– EC meeting – 10-12 June 2009 (Kyoto)– Open ST meeting August (not official yet)– Follow-up ST meeting Sept. (not official yet)– Mission white paper, fall 2009
• FY10 Schedule– Additional science team meetings– Field campaign work including aircraft flight opportunities
11
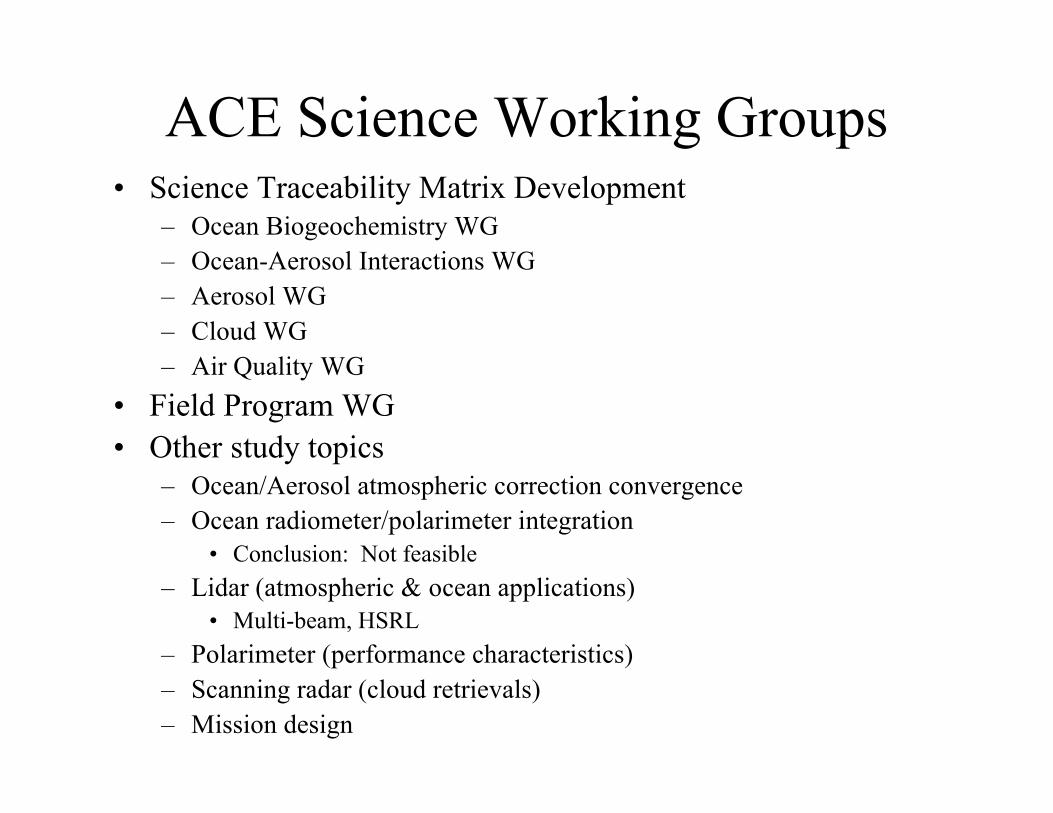
ACE Science Working Groups• Science Traceability Matrix Development
– Ocean Biogeochemistry WG– Ocean-Aerosol Interactions WG– Aerosol WG– Cloud WG– Air Quality WG
• Field Program WG• Other study topics
– Ocean/Aerosol atmospheric correction convergence– Ocean radiometer/polarimeter integration
• Conclusion: Not feasible– Lidar (atmospheric & ocean applications)
• Multi-beam, HSRL– Polarimeter (performance characteristics)– Scanning radar (cloud retrievals)– Mission design
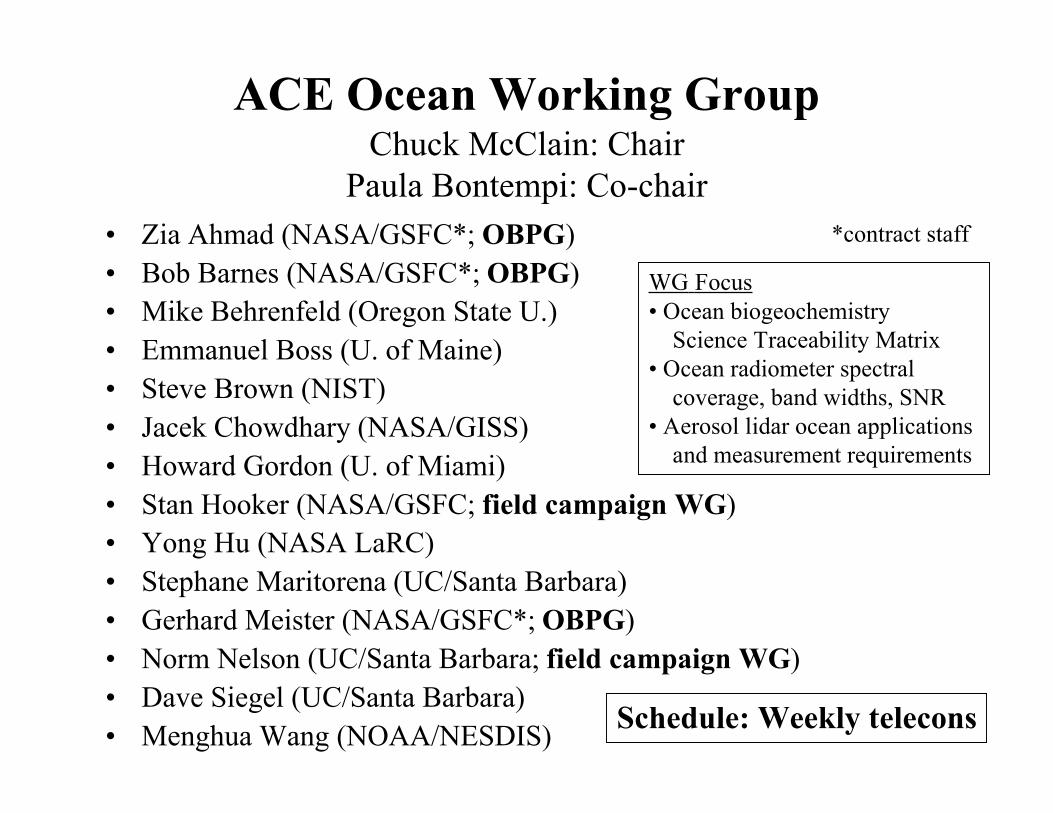
ACE Ocean Working GroupChuck McClain: Chair
Paula Bontempi: Co-chair• Zia Ahmad (NASA/GSFC*; OBPG)• Bob Barnes (NASA/GSFC*; OBPG)• Mike Behrenfeld (Oregon State U.)• Emmanuel Boss (U. of Maine)• Steve Brown (NIST)• Jacek Chowdhary (NASA/GISS)• Howard Gordon (U. of Miami)• Stan Hooker (NASA/GSFC; field campaign WG)• Yong Hu (NASA LaRC)• Stephane Maritorena (UC/Santa Barbara)• Gerhard Meister (NASA/GSFC*; OBPG)• Norm Nelson (UC/Santa Barbara; field campaign WG)• Dave Siegel (UC/Santa Barbara)• Menghua Wang (NOAA/NESDIS)
*contract staff
WG Focus• Ocean biogeochemistry Science Traceability Matrix• Ocean radiometer spectral coverage, band widths, SNR• Aerosol lidar ocean applications and measurement requirements
Schedule: Weekly telecons
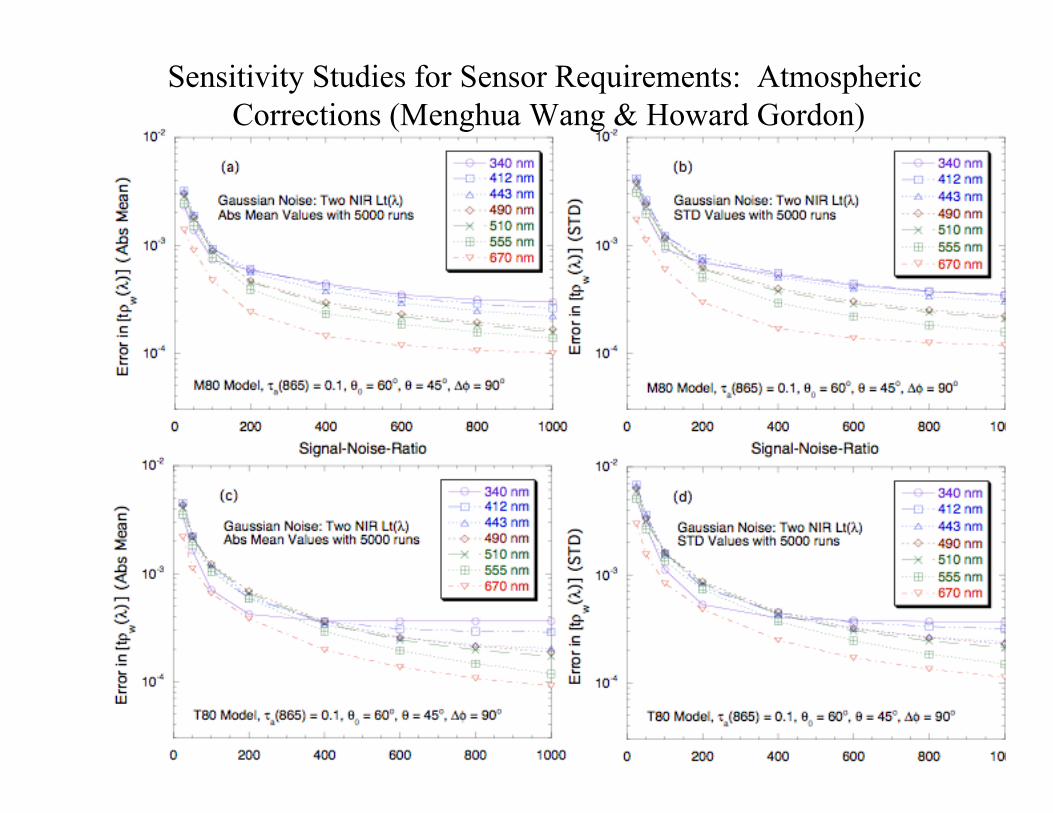
Sensitivity Studies for Sensor Requirements: Atmospheric Corrections (Menghua Wang & Howard Gordon)

Ocean-Aerosol Working GroupChuck McClain: Chair
Paula Bontempi: Co-chair
• Susanne Bauer (NASA/GISS)• Yuan Gao (Rutgers U.)• Santiago Gasso (U. Maryland/Baltimore County)• Joanna Joiner (NASA/GSFC)• Natalie Mahowald (Cornell U.)• Paty Matrai (Bigelow Lab. for Ocean Science)• Nicholas Meskhidze (NC State U.)• Joe Prospero (U. of Miami)• Lorraine Remer (NASA/GSFC; aerosol STM chair)• Eric Saltzman (UC/Irvine)• Stanley Sanders (JPL)
Ocean WG Participants:Zia AhmadMike BehrenfeldJacek ChowdharyNorm NelsonDave Siegel
Schedule: Weekly telecons

Ocean Requirements Support Group
• Participants– OBPG: Gerhard Meister (lead), Chuck McClain (co-
lead), Bryan Franz, Fred Patt, Zia Ahmad, Sean Bailey,Jeremy Werdell, Gene Eplee
– Others: Steve Brown (NIST), Jim Butler (GSFC),Rick Stumpf (NOAA/NOS)
• Focus: detailed ocean sensor performance specificationsand test requirements– Spectral-out-of-band-response, polarization sensitivity,
stray light response, SNR’s, Ltyp’s, Lmax’s, etc.– Review SeaWiFS, MODIS, & VIIRS specs
• Schedule: Weekly meetings

ACE Ocean Questions
• Ocean ecosystems– What are the standing stocks, composition, & productivity of ocean
ecosystems? How and why are they changing? [OBB1]
• Ocean biogeochemical cycles– How and why are ocean biogeochemical cycles changing? How do
they influence the Earth system? [OBB2]
• Land-ocean interactions– What are the material exchanges between land & ocean? How do they
influence coastal ecosystems, biogeochemistry & habitats? How arethey changing? [OBB3 w/1&2]
ACE Ocean Questions cont.• Ocean-atmosphere interactions
– How do aerosols & clouds influence ocean ecosystems &biogeochemical cycles? How do ocean biological & photochemicalprocesses affect the atmosphere and the Earth system? [OBB2]
• Links to the international Surface Ocean-Lower Atmosphere Study(SOLAS)
• Bio-physical ocean interactions– How do physical ocean processes affect ocean ecosystems &
biogeochemistry? How do ocean biological processes influence oceanphysics? [OBB1&2]
• Algal blooms & consequences– What is the distribution of algal blooms and their relation to
harmful algal & eutrophication events? How are these eventschanging? [OBB4 & OBB1]

Phytoplankton Functional Groups:Spectral Derivative Analyses
SDA requires 5nm spectral resolution from 360-755 nm.

Approach• Quantify phytoplankton biomass, pigments, optical properties,
key (functional/HABS) phytoplankton groups, and productivityusing bio-optical models & chlorophyll fluorescence.
• Measure particulate & dissolved carbon pools, theircharacteristics & optical properties
• Quantify ocean photobiochemical & photobiological processes.• Estimate particle abundance, size distributions, & characteristics• Assimilate ACE observations in ocean biogeochemical model
fields of key properties (cf., air-sea CO2 fluxes, export, pH, etc.)• Compare ACE observations with ground-based & model data of
biological properties, land-ocean exchange in the coastal zone,physical properties (e.g., winds, SST, SSH, etc.) and circulation(ML dynamics, horizontal divergence, etc.)
• Combine ACE ocean & atmosphere observations with models toevaluate (1) air-sea exchange of particulates, dissolved materials,& gases and (2) impacts on aerosol & cloud properties.
• Assess ocean radiant heating & feedbacks• Conduct field sea-truth measurements & modeling to validate
retrievals from the pelagic to near-shore environments
Accurate satellite & field observations
Robust calibration &validation program
Targeted processstudies
Advanced modeling &data assimilation


Biogenic VOC & marineorganic aerosol emission
Jickells et al., 2005
Anthropogenicpollution
Soil Mineralogy
Initial Fesolubility
Cloud cycling
Organic acids
Pyrogenicsources
Oce
an-A
eros
ol In
tera
ctio
ns

Aerosol-Ocean STM GoddardSpace
Flight Center
Measurement Instrument Platform OtherCategory Focused Questions Approach Requirements Requirements Requir’ts Needs
Aerosol-OceanInter-action
What is flux of aerosolsto the ocean and theirtemporal and spatialdistribution
What are the physicalcharacteristics and thesource of aerosolsdeposited into theoceans?
How are the physical andchemical characteristicsof deposited aerosolstransformed in theatmosphere?
What is the spatial andtemporal distribution ofaerosols and gasesemitted from the oceanand how are these fluxesregulated by oceanecosystems?
How do oceanecosystems respond toaerosol deposition?
What are the feedbacksamong ocean emissionsof aerosols and gases,microphysical andradiative properties of theoverlying aerosols andclouds, aerosoldeposition, oceanecosystems and theEarth's climate, and howis humankind changingthese feedbacks?
1
2
3
4
5
12
23
4
31
5
5
34
2
51
23
Map
s to
Sci
ence
Que
stio
n
Spectrometer• multiwavelength UV-VIS• capable of high quality ocean color
Polorimeter• detailsLidar• details
Orbitpermitting 2-day globalcoverage ofoceanradiometermeasurements
Sun-synchronousorbit withcrossing timebetween 10:30a.m. & 1:30p.m.
Storage anddownload offull spectral andspatial data
Monthly lunarcalibration at 7o
phase anglethrough Earthobserving port
Global data setsfrom missions,models, or fieldobservations:
MeasurementRequirements(1) Vicariouscalibration &validation(2) Fullprelaunchcharacterization(2% accuracyradiometric)(3) Blah blah
ScienceRequirements(1) SST(2) SSH(3) PAR(4) Blah blah
OMIIASICRIS
Modeling• blah blah
1) Characterize dust aerosols, their column mass,iron content and other trace elements/ toxins, andtheir regional-to-global scale transport and fluxfrom events to the annual cycle
2) Characterize aerosol chemical composition andtransformation during transport (includinginfluences of vertically distributed nitrous oxide,NOx, sulfur dioxide, formaldehyde, and glyoxyl)and partition gas-derived and mechanically-derivedcontributions to total aerosol column
3) Observe urban aerosol plumes, quantify theirnutrients/toxin burdens, and characterize theirtransport and fate
4) Monitor global phytoplankton biomass,pigments, taxonimic groups, productivity, Chl:C,and fluorescence; measure and distinguish oceanparticle pools and colored dissoved organic carbon;quantify aerosol-relevant surface oceanphotobiological and photobiochemical processes
5) Relate changes in ocean properties to aerosoldeposition patterns and events
6) Demonstrate influences of ocean taxonomy,physiological stress, and photochemistry oncloud/aerosol properties, including organic aersoltransfer
7) Assimilate ACE space and field observations inmodels to evaluate (1) aerosol chemicaltransformations and long range transport, (2) air-to-sea and sea-to-air exchange and (3) impacts onocean biology
8) Conduct appropriate field observations tovalidate satellite retrievals of aerosols and oceanfeedbacks
9) Identify microphysical and optical properties ofaerosols, including spectral complex index ofrefractive and particle size distribution
Field/Airborne•
6

ACE Ocean Field Program WG• Ocean members of ACE Joint Campaign WG: Stan Hooker, Norm Nelson, Mary Russ
• Objectives– Support science goals outlined in the Ocean Science Traceability
Matrix
– Support calibration and validation activities, in particular, therequirements for producing and maintaining climate data records(i.e., protocols, reference materials, uncertainty budgets,performance metrics, and national metrology institute traceability)
• Schedule: Biweekly telecons

ACE Oceans Technology Development MatrixField Community Reference Uncertainty Performance NMI
Parameter Protocol Material Budget Metrics Traceability M T G R A S
Oceanic AOPs C 1 2 3 4 5 6
Oceanic IOPs ? 1 2 3 4
Atm. Optical Properties 2 4 5
CDOM C 2 3 4 5
DOC C 2 3 4
POC/N/P C 1 2 3 4
PIC C 1 2 3 4
Carbon Flux 1 2 4 6
TSM 2 3 4
PON/DON 1 2 3 4
Ammonium ? ? 2 3 4 6
Nitrate/Nitrite ? ? ? 1 2 3 4
Biological PP C 1 2 4 5 6
HPLC pigments C 1 2 4 6
Natural fluorescence C 1 2 6
MAAs 1 6
Micro Taxonomy ? 1 2 4 6
Pico Taxonomy ? 1 2 4 6
O2 ? 2 5 6
Salinity ? C 3 4 5 6
Temperature C 1 3 4 5 6
Surface meteorology ? 1 4 5 6
Particle size/abundance ? ? 1 3 4
DMS, DMSp 1 2 4
Silicate ? ? 1 2 3 4
Phosphate/DOP ? ? 1 2 3 4 6
pCO2 ? 4
Trace nutrients ? 1 2 4 5
pH ? ? 2 4
Analytical Level Experimental ResearchSemi-
QuantitativeQuantitative CDR
Moor.
Tow
er
Glid
er
R/V
A/C
Sat.
1.
2. All protocols and reference materials must be upgraded to community standards (green).
3. All field parameters must be conducted at the indicated analytical level (bold outline).
4. Field parameters must achieve their indicated analytical levels at the highest level (green).
5.
Deployment Tech. Ocean Biology
Science Questions
Carbon
Cycle
Optical
Science
Discipline
Nitrogen
Cycle
A deployment technology must be at the highest level of capability (green) to be used in
calibration and validation exercises.
Some capability demonstrated,
but more work needs to be done.Mature capability (calibration and
validation quality).
Readiness Capabilities for Analytical
Levels and Deployment Technologies
Physical
A field parameter for a satellite CDR (denoted C in deployment technology) must be at an
analytical level of quantitative analysis with traceability.
Ocean Ecosystems Calibration and Validation Requirements
Chemical
Little capability demonstrated,
significant work to be done.
ACE Ocean Field EffortFocused Campaigns
• Philosophy: Address STM questions and collect cal/val oralgorithm development data concurrently
• Pre-launch cal/val efforts focused on STM questions plustechnology & algorithm development
• Post-launch efforts focused on STM questions and validation• Explore opportunities for multi-disciplinary studies (e.g.,
ocean-aerosol working group topics)• Coordinate with national/international steering groups
(SOLAS, OCB, CLIVAR) for field program access• Implementation needs -- resources and science teams, dates,
advance planning.

• Ocean productivity / particle flux– Connect carbon fixation to the biological pump with
additional information on community structure• Soluble iron and productivity
– Ocean-aerosol connections, paleoclimatology• Fate of carbon in the coastal transition zone
– Partition the biological, chemical, and photobiologicalsinks of terrestrial carbon under a mixedterrestrial/oceanic aerosol
• Asian aerosol impact on Pacific productivity– Ocean-aerosol connections, ocean acidification
ACE Ocean Field Effort - CampaignsCase studies - white papers

Instrument Applications: Oceans &Ocean-Aerosols
• Baseline Product Generation– Ocean Radiometer
• Water-leaving radiances in near-ultraviolet, visible, & near-infrared forseparation of absorbing & scattering constituents and calculation of chlorophyllfluorescence
• Total radiances in UV, NIR, and SWIR for atmospheric corrections• Cloud radiances for assessing instrument stray light• Support certain aerosol and cloud community measurements requirements
• Research & Development Themes– Lidar
• Highly absorbing aerosols: aerosol heights for atmospheric corrections in thepresence of highly absorbing aerosols (not required for non-absorbing aerosols)
• Subsurface particle scattering & depth profile– Polarimeter
• Highly absorbing aerosols: Broad spatial coverage highly absorbing aerosolareal distribution, heights & single scattering albedo for quality flag andatmospheric correction
• Subsurface polarized return for typing oceanic particles

• 5 nm resolution 350 to 755 nm (functional group derivative analyses)• 1000 – 1500:1 SNR for 15 nm aggregate bands UV & visible
– 1125:1 for 360 nm @ Ltyp– 1500:1 for bands between 380-665 nm @ Ltyps
• 10 nm fluorescence bands (667, 678, 710, 748 nm band center)– 1500:1 SNR for 667, 678, & 710 nm @ Ltyps– 600:1 SNR for 748 nm @ Ltyp
• 10 to 40 nm bandwidth aerosol correction bands at 748, 820, 865, 1245, 1640 nm– 600:1 SNR for 748, 820 & 865 nm @ Ltyps– 300:1 SNR at 1245 nm & 250 SNR at 1640 nm @ Ltyps
• Stability– 0.1% radiometric stability knowledge (mission duration)– 0.1% radiometric stability (1 month prelaunch verification)
• 58.3o cross track scanning• Sensor tilt (20o) for glint avoidance• Polarization: < 0.7% sensor radiometric sensitivity, 0.2% prelaunch characterization accuracy• < 2% prelaunch radiance calibration accuracy• 1 km spatial resolution @ nadir• No saturation in UV to NIR bands• 5 year minimum design lifetime
Instrument Requirements: Radiometer(preliminary-refinements under discussion)
Remaining Specs:Relative spectral responseStray lightTemperature sensitivityResponse vs. scanetc.
Platform Requirements• Orbit permitting 2-day global coverage of
ocean radiometer measurements• Sun-synchronous orbit with crossing time
between 10:30 a.m. & 1:30 p.m.• Storage and download of full spectral and
spatial data• Monthly lunar calibration at 7o phase angle
through Earth observing aperture and optics(only)
• Daily solar diffuser calibrations
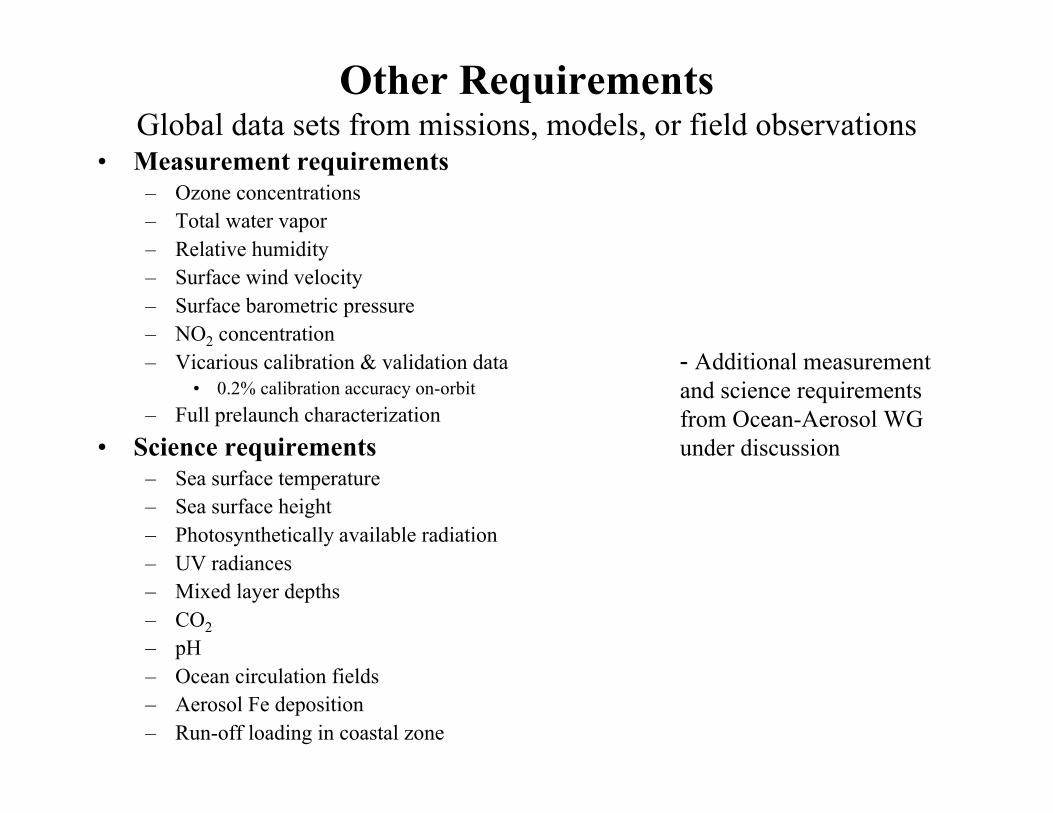
Other RequirementsGlobal data sets from missions, models, or field observations
• Measurement requirements– Ozone concentrations– Total water vapor– Relative humidity– Surface wind velocity– Surface barometric pressure– NO2 concentration– Vicarious calibration & validation data
• 0.2% calibration accuracy on-orbit– Full prelaunch characterization
• Science requirements– Sea surface temperature– Sea surface height– Photosynthetically available radiation– UV radiances– Mixed layer depths– CO2– pH– Ocean circulation fields– Aerosol Fe deposition– Run-off loading in coastal zone
- Additional measurementand science requirementsfrom Ocean-Aerosol WGunder discussion

Ocean Radiometermulti-spectral bandspecifications:preliminaryNotes:
Units: mW/cm2 µm str
Ltyp’s based on fits to MODISand SeaWiFS observations
Based on SeaWiFSobservations, Lmax’s result in<0.2% pixels saturated
SNR ratios to SeaWiFS: 412-670 nm (1.5-1.7) 765 nm(1.15), 865 nm (1.5)
Analysis of MODIS oceanproducts showed cirruscontamination to beinsignificant.
5-Mar-05 Ltyp Lmax SNR
(Ahmad) (Barnes) (required)
Band Center
Band- width
Application/Comments
360 15 CDOM-chlorophyll separation; strong NO2 absorption 7.220 37.6 1125
385 15 CDOM-chlorophyll separation; strong NO2 absorption; avoid
precipitous drop in solar
spectrum at 400 nm 6.110 38.1 1500
412 15 CDOM-chlorophyll separation; SeaWiFS (20 nm) & MODIS
(15 nm) bands; strong NO2
absorption 7.860 60.2 1500
425 15 CDOM-chlorophyll separation, strong NO2 absorption 6.950 58.5 1500
443 15 Chlorophyll-a absorption peak; SeaWiFS (20 nm) & MODIS
(10 nm) bands; strong NO2
absorption 7.020 66.4 1500
460 15 Assessory pigments & chlorophyll 6.830 72.4 1500
475 15 Assessory pigments & chlorophyll 6.190 72.2 1500
490 15 SeaWiFS (20 nm) & MODIS (10 nm) bands; chlorophyll
band-ratio algorithm 5.310 68.6 1500
510 15 SeaWiFS (20 nm) band; chlorophyll-a band-ratio
algorithm; strong O3
absorption 4.580 66.3 1500
532 15 Aerosol lidar transmission band; MODIS (10 nm) band;
strong O3 absorption 3.920 65.1 1500
555 15 Bio-optical algorithms (e.g., band-ratio chlorophyll); MODIS-
548 nm, SeaWiFS-555 nm;
strong O3 absorption 3.390 64.3 1500
583 15 Phycoerythrin, strong O3 absorption 2.810 62.4 1500
617 15 Strong O3 absorption; bounded at 628 nm by water
vapor absorption band 2.190 58.2 1500
640 10 Between O3 & water vapor absorption peaks 1.900 56.4 1500

Ocean Radiometermulti-spectral bandspecifications cont.:preliminary
655 15 Chlorophyll a&b, strong O3 absorption, weak water vapor
absorption 1.670 53.5 1500
665 10 Fluorescence line height baseline, bandwidth
constrained by water vapor
absorption line & 678 band 1.600 53.6 1500
678 10 Fluorescence line height; band center offset from
fluorescence peak by O2
absorption line 1.450 51.9 1500
710 15 Fluorescence line height baseline; HABS detection;
terrestrial "red edge";
straddles water vapor
absorption band 1.190 48.9 1500
748 10 Atmospheric correction-open ocean; MODIS band, between
O2 A-band & water vapor
absorption peaks 0.930 44.7 600
765 40 Atmospheric correction-open ocean; SeaWiFS band, O2 A-
band absorption 0.830 43.0 600
820 15 Water vapor concentration/corrections.
There are other water vapor
absorption features that could
be used. 0.590 39.3 600
865 40 Atmospheric correction-open ocean; SeaWiFS band (40 nm
bandwidth); MODIS band-869
(15 nm bandwidth) 0.450 33.3 600
1245 20 Atmospheric correction-turbid water; MODIS band;
bandwidth constrained by
water vapor & O2 absorption
peaks 0.088 15.8 300
1640 40 Atmospheric correction-turbid water; MODIS-1640 nm,
moved to 1610 tobroaden
bandpass & improve SNR 0.029 8.2 250
Represents one option for a required function
Notes: Franz MODIS Lmax values show the effects of sensor degradation
Ahmad Ltyp values based on curve fit to Franz MODIS Ltyp's
Units: mW/cm2 um str
Lmax (Barnes) assumes albedo of 1.1 with 0 degree incidence angle


