Overview RTD’s Mission is: To meet our constituents...
16
Regional Transportation District Service Development Page 1 4/4/2018 Service Performance 2016 (Rev 4/2018) Networked Family of Services Overview RTD’s Mission is: "To meet our constituents' present and future public transit needs by offering safe, clean, reliable, courteous, accessible and cost-effective service throughout the district." Service development and performance analysis require that we ask several questions. What are the markets or demand? Should service be provided and how much? What type of service should be provided? RTD’s general approach is as follows. Develop a family of services suited to a variety of markets. Connect all the services together in a network to accommodate today’s dispersed travel patterns. Match the level-of-service with demand, thus improving performance and sustainability. Performance is a term often used interchangeably with effectiveness and efficiency. The effectiveness- productivity charts in this report present these measures for all RTD services. Effectiveness measures attainment of the objective—maximize ridership within the budget—and is presented on the y-axis as subsidy per boarding. Efficiency—productivity or output/input— is presented on the x-axis as boardings/vehicle hour. The charts offer a convenient, comparative analysis of all classes of services, illustrating both absolute and relative performance. RTD service standards are depicted in the charts to help make judgments about performance. Each rectangle labeled by service type represents the domain for routes that meet or exceed the 10% minimum/maximum performance requirements for that service class. So this is a case where it’s bad to be “outside the box.” Routes that perform minimally get minimum service frequency, typically every 30 minutes during peak periods and 60 minutes off-peak. The charts also depict guidelines for routes where ridership significantly exceeds the minimum, and passenger loads justify more frequent service. The orange, dotted, vertical line at 25 boardings per hour represents the typical minimum productivity for a route to justify 15-minute frequency, and the green line at 40 boardings per hour for 10-minute frequency. Please note that these are true apples-to-apples comparisons of performance: all fare revenues, boardings and costs—both operating and amortized capital—are included. For complete, detailed information see RTD’s Transit Service Policies & Standards (under Reports). NOTE For 2016 fare revenue was not allocated by route. Last year the fare zone structure was changed and Service Standards revised to combine the Express, SkyRide and Regional routes into one Regional class. We also discovered some issues with the revenue allocation method in use for many years that will be addressed with a new model now under development to improve revenue allocation and provide better inputs into service performance evaluation. Due to all these changes, we did not have the resources to prepare accurate subsidy Better Same boardings, less subsidy Same subsidy, more boardings Subsidy per Boarding or Effectiveness Boardings per Vehicle Hour or Productivity Lower Higher Effectiveness - Productivity Chart
Transcript of Overview RTD’s Mission is: To meet our constituents...
Regional Transportation District
Service Development Page 1 4/4/2018
Service Performance 2016 (Rev 4/2018)
Networked Family of Services
Overview
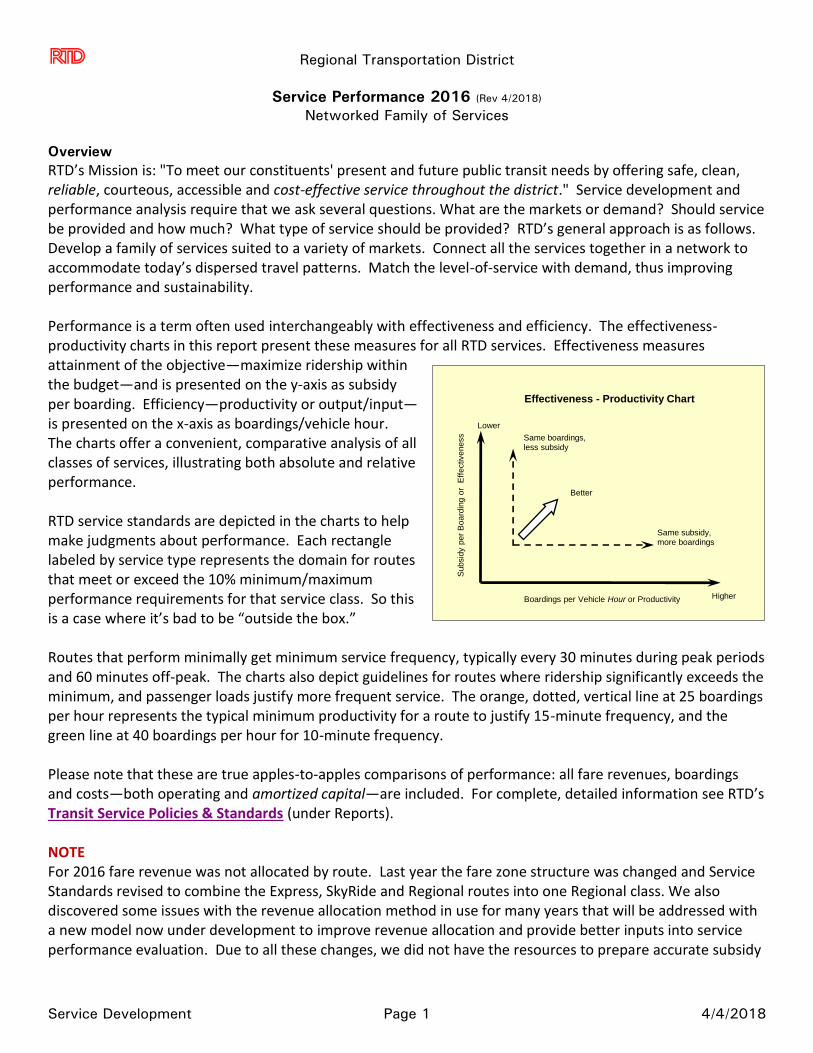
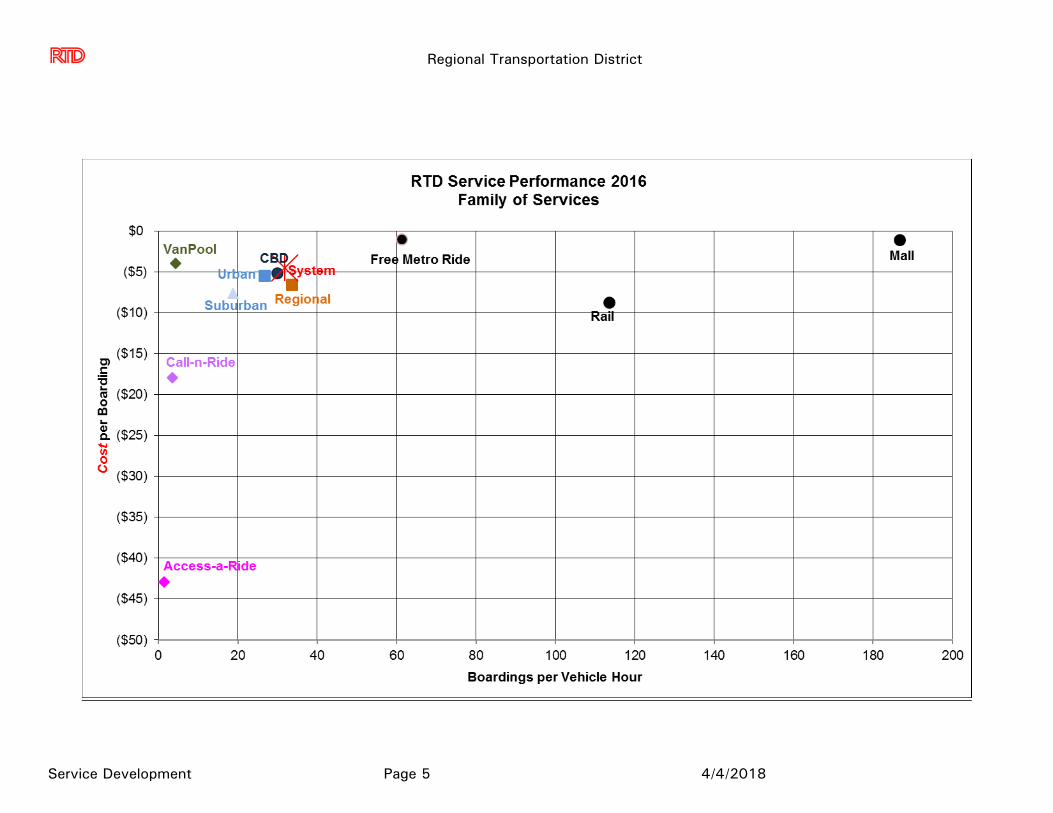
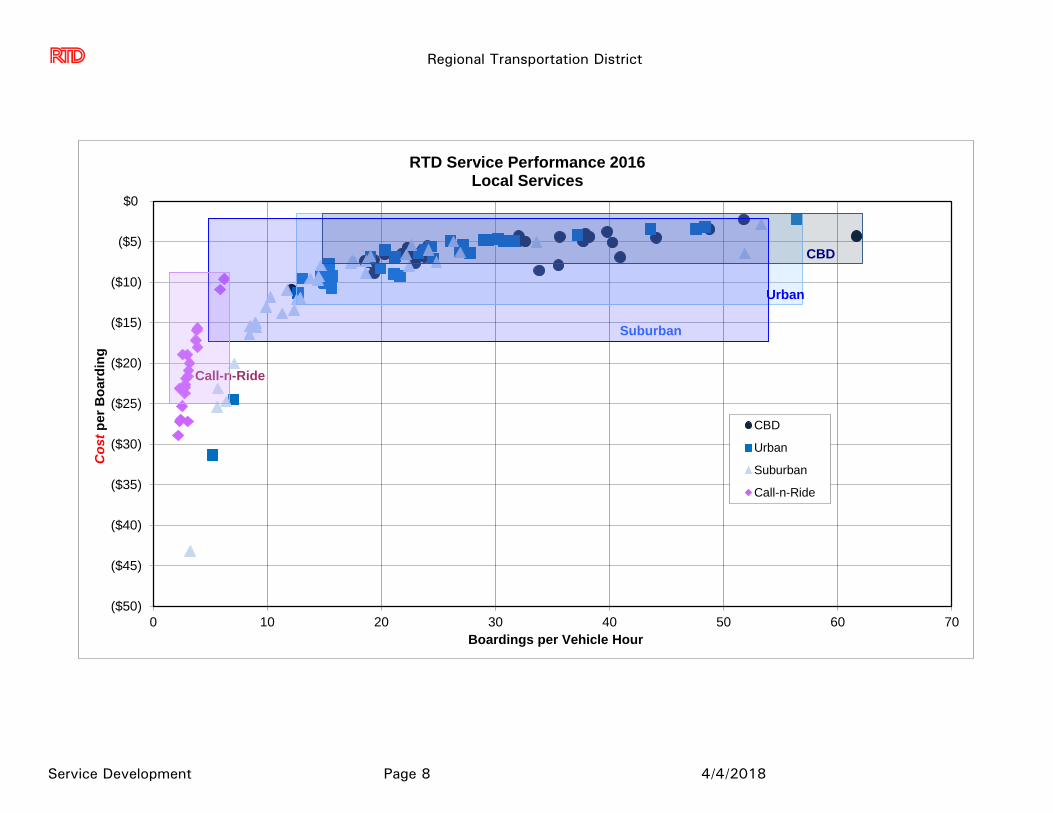
RTD’s Mission is: "To meet our constituents' present and future public transit needs by offering safe, clean, reliable, courteous, accessible and cost-effective service throughout the district." Service development and performance analysis require that we ask several questions. What are the markets or demand? Should service be provided and how much? What type of service should be provided? RTD’s general approach is as follows. Develop a family of services suited to a variety of markets. Connect all the services together in a network to accommodate today’s dispersed travel patterns. Match the level-of-service with demand, thus improving performance and sustainability. Performance is a term often used interchangeably with effectiveness and efficiency. The effectiveness-productivity charts in this report present these measures for all RTD services. Effectiveness measures attainment of the objective—maximize ridership within the budget—and is presented on the y-axis as subsidy per boarding. Efficiency—productivity or output/input—is presented on the x-axis as boardings/vehicle hour. The charts offer a convenient, comparative analysis of all classes of services, illustrating both absolute and relative performance. RTD service standards are depicted in the charts to help make judgments about performance. Each rectangle labeled by service type represents the domain for routes that meet or exceed the 10% minimum/maximum performance requirements for that service class. So this is a case where it’s bad to be “outside the box.” Routes that perform minimally get minimum service frequency, typically every 30 minutes during peak periods and 60 minutes off-peak. The charts also depict guidelines for routes where ridership significantly exceeds the minimum, and passenger loads justify more frequent service. The orange, dotted, vertical line at 25 boardings per hour represents the typical minimum productivity for a route to justify 15-minute frequency, and the green line at 40 boardings per hour for 10-minute frequency. Please note that these are true apples-to-apples comparisons of performance: all fare revenues, boardings and costs—both operating and amortized capital—are included. For complete, detailed information see RTD’s Transit Service Policies & Standards (under Reports). NOTE For 2016 fare revenue was not allocated by route. Last year the fare zone structure was changed and Service Standards revised to combine the Express, SkyRide and Regional routes into one Regional class. We also discovered some issues with the revenue allocation method in use for many years that will be addressed with a new model now under development to improve revenue allocation and provide better inputs into service performance evaluation. Due to all these changes, we did not have the resources to prepare accurate subsidy
Better
Same boardings,less subsidy
Same subsidy,more boardings
Subsid
y p
er
Bo
ard
ing o
r E
ffe
ctive
ne
ss
Boardings per Vehicle Hour or Productivity
Lower
Higher
Effectiveness - Productivity Chart

Regional Transportation District
Service Development Page 2 4/4/2018
calculations for 2016, and the report reflects only cost or cost per boarding by route. The results are still very useful and similar to previous reports and we will provide a complete analysis for 2017. Definitions
Boardings: Unlinked passenger trips; includes transfers as boardings.
Hours: In-service vehicle hours, not including dead head garage time or layover/recovery.
Fare Revenues: Cash, ticket, and tokens allocated by route by farebox recorded boardings. Monthly pass revenues are allocated by class of pass and the number of uses by route. Revenue from Eco, CU, and Auraria passes are allocated individually by the counts for each route weighted by the ratio of the class of service fare to the local fare.
Costs: All operating, maintenance and administrative costs for providing current service, plus depreciation on all RTD assets. Excludes interest and any costs attributed to future projects. RTD’s cost allocation model allocates costs to each route based on its miles, hours, and peak vehicles; accounting line items are assigned to the most relevant variable.
Subsidy: Costs minus Fare Revenues. Standards RTD has established guidelines in its Transit Service Policies & Standards that the least productive 10% of routes based on either subsidy per boarding or boardings per hour need to be evaluated for marketing, revision or elimination, or if both measures fall below 25% for a route. The performance charts illustrate the acceptable performance domain containing all routes meeting the 10% minimum/maximum for each class of service. The calculation of the 10% and 25% standards are made from the annual, un-weighted data, assuming the data have a normal distribution and using the appropriate formulas for standard deviation and confidence intervals; however, the standard deviation is applied to the weighted average. The following table gives the current year weighted averages and standards by class of service.
Year 2016 Service Standards
Service Class Average 10% Max 25% Max Average 10% Min 25% Min
CBD Local $5.19 $7.58 $6.44 30.0 15.2 22.3
Urban Local $5.47 $12.61 $9.21 26.7 12.2 19.1
Suburban Local $7.60 $17.29 $12.67 18.7 4.7 11.4
Regional $6.58 $12.27 $9.55 33.5 11.3 21.9
Call-n-Ride $17.92 $25.05 $21.65 3.5 2.0 2.7
Rail $8.75 $12.33 $10.62 113.5 67.1 89.2
Mall $1.04 186.7
Access-a-Ride $44.60 1.5
Vanpool $3.93 4.3
System $6.50 30.9
System 2015* $4.53 33.3
* Subsidy per Boarding
Cost Per Boarding Boardings Per Hour

Regional Transportation District
Service Development Page 3 4/4/2018
Notes on Routes Outside Their Acceptable Performance Domain The following provides the status of these routes as of October, 2017 listed in route number order. Route 9 West 10th Ave – Restructured April 2013 with the West Corridor opening. Current ridership productivity slipped below standard this year and this route will be monitored for further action. Route 32 32nd Ave/City Park – Current ridership and subsidy are below standards. Duplication with the Route 40 on Colorado Blvd was eliminated in April 2016. Route 33 Platte Valley — This service was restructured from the Route 34 in August 2015 in hopes of gaining ridership with a new routing. We will continue to monitor for further action and possible discontinuance. Route 36L Fort Logan Ltd — The Route 36L was linked to and classified with Routes 29 and 36 in the Urban Local category. The service will be monitored, though a Federal Boulevard service restructure is planned that would impact the Route 36 if implemented. Route 48 East 48th Ave/Commerce City — This service currently meets the ridership standard and narrowly misses the cost per boarding standard, it will be monitored for further action. It is likely that the route will be impacted in the N Line bus and rail service plan. Route 72L Quaker St via Ward Ltd — The route currently meets the ridership standard, though it is outside of the cost per boarding standard. The route will be replaced in the implementation of the G Line bus and rail service plan. Route 85 Chatfield Avenue — Formerly a part of the Route 401, the Route 85 was created in August 2015 to provide clarity as to where buses are traveling and allow better monitoring of the route. Route 89 Stapleton/Anschutz Campus – This route was started January 2013 to serve new transitional housing and in anticipation of the opening of the East Corridor rail services in 2016. In 2014 service was reduced by half due to poor performance and ridership fell precipitously. This service has been proposed for discontinuance in January 2018. Route 100L South Kipling Ltd — This service meets the ridership standard, but falls short of the cost per rider standard. We will continue to monitor its performance for further action. Route 116L Ken Caryl Limited – This route was discontinued January 2017. Route 157 CCA/Buckley — This route was newly implemented in April 2016, formed from former segments of Routes 10, 130 and 169. Current ridership does show improvement this year (13 passengers/hour) and will be monitored closely. Route 403 Lucent Blvd — Service realigned and retimed for January 2014 and performance improved somewhat. It is now below subsidy and productivity standards and will be monitored. Route 410 Franktown/Parker — This route was substantially revised with the reinstatement of Route P Parker/Denver Spring 2007. Service was reduced to every 30 minutes peak and every two hours midday. Service was reduced to peak period only May 2009. Additional trips added January 2014 in response to public meetings where constituents noted that this would make the route more attractive. In 2016 this route was combined with a portion of the Route 153 to form the new Route 483 Lincoln/Parker/Nine Mile. Route 483 — This service was implemented in April 2016 with the University of Colorado A Line bus and rail service plan. The route is a combination of a segment formerly on the Route 153 in Southeast Arapahoe and the Route 410 in Parker.

Regional Transportation District
Service Development Page 4 4/4/2018
Route AA Wagon Road/DIA — Performance is just below service standards. Considering potential restructuring with the North Metro Corridor service plan. Route CV Pine Junction/Conifer/Denver – This route is slightly below subsidy standard, but above productivity standard. Route EV Evergreen/Aspen Park/Denver – This route is just below subsidy and just above productivity standards and will be monitored. Route GS Golden/Boulder – This route is just below cost per boarding/subsidy standard. We will continue to monitor before taking further action. Route J Longmont/Gunbarrel Boulder — This route is just below cost per boarding/subsidy standard. We will continue to monitor before taking further action. Route L Longmont/Denver — This route is just below cost per boarding/subsidy standard. We will continue to monitor before taking further action. Route R/RC Brighton/Denver —Service was added in January 2011 and ridership has increased modestly, but it still does not meet service standards. Will need to evaluate service options with the opening of North Metro rail in 2018. Jeffco Call-n-Ride — Marketing assistance requested for 2017. Evergreen Call-n-Ride – Ridership fell due to discontinuation of two local programs. A Transportation Advisory Committee was formed to increase ridership. It is just below service standards and will be monitored. Highlands Ranch Call-n-Ride — This service was discontinued January, 2017. Lone Tree Call-n-Ride — Marketing assistance requested for 2017. Thornton Call-n-Ride — Service design changes and marketing assistance requested for 2017. C Line – This line misses the subsidy per boarding standard and easily meets the boardings per hour standard. Changes were made in January 2018.
Regional Transportation District
Service Development Page 5 4/4/2018

Regional Transportation District
Service Development Page 6 4/4/2018

Regional Transportation District
Service Development Page 7 4/4/2018
Regional Transportation District
Service Development Page 8 4/4/2018
($50)
($45)
($40)
($35)
($30)
($25)
($20)
($15)
($10)
($5)
$0
0 10 20 30 40 50 60 70
Co
st
per
Bo
ard
ing
Boardings per Vehicle Hour
RTD Service Performance 2016Local Services
CBD
Urban
Suburban
Call-n-Ride
CBD
Urban
Suburban
Call-n-Ride

Regional Transportation District
Service Development Page 9 4/4/2018
($11)
($9)
($7)
($5)
($3)
($1)
0 10 20 30 40 50 60 70
Co
st
per
Bo
ard
ing
Boardings per Vehicle Hour
RTD Service Performance 2016CBD Local Routes
Shaded domains contain all routes meeting the 10% max/min standards.
Minimum productivity for 10 minute frequency
Minimum productivity for 15 minute frequency
100L
36L
15L
0L
15
55L
32
9
72L48

Regional Transportation District
Service Development Page 10 4/4/2018

Regional Transportation District
Service Development Page 11 4/4/2018

Regional Transportation District
Service Development Page 12 4/4/2018

Regional Transportation District
Service Development Page 13 4/4/2018
RTD Service Standards Analysis - 2016
Sorted By Service Class and Route
Standards Fare Operating Total In-Service Net Subsidy per Boardings
Route Class Revenue Costs Boardings Hours Subsidy Boarding per Hour
00 CBD Local $0 $11,146,944 2,289,119 71,375 $11,146,944 $4.87 32.07
0L CBD Local $0 $1,979,721 462,433 7,499 $1,979,721 $4.28 61.66
01 CBD Local $0 $3,682,182 511,416 26,454 $3,682,182 $7.20 19.33
3L CBD Local $0 $1,002,373 145,348 3,551 $1,002,373 $6.90 40.93
06 CBD Local $0 $4,284,837 771,086 32,037 $4,284,837 $5.56 24.07
08 CBD Local $0 $2,112,115 287,204 15,492 $2,112,115 $7.35 18.54
09 CBD Local $0 $2,110,863 238,084 12,301 $2,110,863 $8.87 19.35
10 CBD Local $0 $5,281,548 811,678 37,246 $5,281,548 $6.51 21.79
15 CBD Local $0 $11,300,550 2,986,141 75,040 $11,300,550 $3.78 39.79
15L CBD Local $0 $11,728,290 3,411,249 69,953 $11,728,290 $3.44 48.77
16 CBD Local $0 $8,570,838 1,727,128 52,962 $8,570,838 $4.96 32.61
16L CBD Local $0 $2,666,603 665,768 17,586 $2,666,603 $4.01 37.86
19 CBD Local $0 $1,708,370 261,588 12,881 $1,708,370 $6.53 20.31
20 CBD Local $0 $4,931,382 826,647 35,007 $4,931,382 $5.97 23.61
28 CBD Local $0 $3,936,340 522,662 27,659 $3,936,340 $7.53 18.90
30L CBD Local $0 $595,556 135,802 3,550 $595,556 $4.39 38.26
31L CBD Local $0 $137,727 31,381 880 $137,727 $4.39 35.65
32 CBD Local $0 $2,648,361 328,560 16,894 $2,648,361 $8.06 19.45
36L CBD Local $0 $862,160 79,112 6,529 $862,160 $10.90 12.12
38 CBD Local $0 $4,241,331 621,394 26,141 $4,241,331 $6.83 23.77
39L CBD Local $0 $207,290 48,348 1,509 $207,290 $4.29 32.05
43 CBD Local $0 $5,928,359 893,335 38,237 $5,928,359 $6.64 23.36
44 CBD Local $0 $4,827,886 734,600 32,814 $4,827,886 $6.57 22.39
48 CBD Local $0 $3,788,066 496,631 21,636 $3,788,066 $7.63 22.95
52 CBD Local $0 $4,073,800 713,532 32,017 $4,073,800 $5.71 22.29
55L CBD Local $0 $207,261 92,434 1,785 $207,261 $2.24 51.78
72L CBD Local $0 $990,820 125,445 3,532 $990,820 $7.90 35.52
80L CBD Local $0 $158,348 31,141 774 $158,348 $5.08 40.26
83L/D CBD Local $0 $6,151,208 1,240,477 32,930 $6,151,208 $4.96 37.67
87L CBD Local $0 $205,859 45,931 1,042 $205,858 $4.48 44.08
100L CBD Local $0 $673,211 78,747 2,327 $673,211 $8.55 33.84
Subtotal CBD $0 $112,140,201 21,614,421 719,639 $112,140,200 $5.19 30.04
Standard Deviation $1.87 11.6
Min/Max at 10% or better: Average ± 1.28 * Std Dev $7.58 15.2
Min/Max at 25% or better: Average ± .67 * Std Dev $6.44 22.3
03 Urban Local $0 $4,972,402 936,712 34,480 $4,972,402 $5.31 27.17
04 Urban Local $0 $651,511 95,621 4,509 $651,511 $6.81 21.21
11 Urban Local $0 $4,668,132 775,541 38,218 $4,668,132 $6.02 20.29
12 Urban Local $0 $6,126,718 1,033,345 43,457 $6,126,718 $5.93 23.78
14 Urban Local $0 $1,629,197 231,187 9,430 $1,629,197 $7.05 24.52
17 Urban Local $0 $420,000 41,535 2,754 $420,000 $10.11 15.08
21 Urban Local $0 $6,437,771 1,310,051 42,689 $6,437,771 $4.91 30.69
27 Urban Local $0 $3,108,880 336,417 22,875 $3,108,880 $9.24 14.71
29 Urban Local $0 $1,195,226 132,915 6,304 $1,195,226 $8.99 21.08
30 Urban Local $0 $1,726,923 364,526 12,426 $1,726,923 $4.74 29.34
31 Urban Local $0 $7,400,386 1,606,426 53,186 $7,400,386 $4.61 30.20
33 Urban Local $0 $467,822 19,120 2,719 $467,822 $24.47 7.03
35 Urban Local $0 $1,244,413 134,561 8,602 $1,244,413 $9.25 15.64
36 Urban Local $0 $809,066 258,722 5,352 $809,066 $3.13 48.34
40 Urban Local $0 $6,203,800 1,296,146 44,727 $6,203,800 $4.79 28.98
42 Urban Local $0 $3,420,329 303,245 23,960 $3,420,329 $11.28 12.66
45 Urban Local $0 $3,635,719 366,107 24,535 $3,635,719 $9.93 14.92
46 Urban Local $0 $1,886,138 197,948 15,161 $1,886,138 $9.53 13.06
50 Urban Local $0 $1,589,469 247,874 10,665 $1,589,469 $6.41 23.24
51 Urban Local $0 $5,006,208 729,686 38,307 $5,006,208 $6.86 19.05
73 Urban Local $0 $3,093,968 444,037 21,015 $3,093,968 $6.97 21.13
80 Urban Local $0 $352,887 45,871 2,979 $352,887 $7.69 15.40
105 Urban Local $0 $6,993,513 1,666,861 44,809 $6,993,513 $4.20 37.20
121 Urban Local $0 $6,112,707 1,245,688 39,399 $6,112,707 $4.91 31.62
131 Urban Local $0 $663,249 62,105 3,978 $663,249 $10.68 15.61
133 Urban Local $0 $3,326,823 520,767 18,767 $3,326,823 $6.39 27.75
139 Urban Local $0 $1,722,891 186,451 8,635 $1,722,891 $9.24 21.59
153 Urban Local $0 $5,683,101 907,096 33,708 $5,683,101 $6.27 26.91
157 Urban Local $0 $482,970 15,437 2,981 $482,970 $31.29 5.18

Regional Transportation District
Service Development Page 14 4/4/2018
RTD Service Standards Analysis - 2016
Sorted By Service Class and Route
Standards Fare Operating Total In-Service Net Subsidy per Boardings
Route Class Revenue Costs Boardings Hours Subsidy Boarding per Hour
204 Urban Local $0 $1,918,172 393,213 15,095 $1,918,172 $4.88 26.05
208 Urban Local $0 $914,517 163,710 6,717 $914,517 $5.59 24.37
209 Urban Local $0 $965,858 116,385 5,844 $965,858 $8.30 19.92
BOND Urban Local $0 $2,115,985 621,615 13,060 $2,115,985 $3.40 47.60
SKIP Urban Local $0 $5,260,272 1,541,773 35,375 $5,260,272 $3.41 43.58
STMP Urban Local $0 $1,201,932 539,979 9,568 $1,201,932 $2.23 56.44
Subtotal Urban $103,408,956 18,888,673 706,285 $103,408,956 $5.47 26.74
Standard Deviation $5.57 11.4
Min/Max at 10% or better: Average ± 1.28 * Std Dev $12.61 12.2
Min/Max at 25% or better: Average ± .67 * Std Dev $9.21 19.1
24 Suburban Local $0 $2,710,063 400,742 21,023 $2,710,063 $6.76 19.06
34 Suburban Local $0 $1,100,483 384,710 7,219 $1,100,483 $2.86 53.29
37 Suburban Local $0 $844,820 95,382 5,120 $844,820 $8.86 18.63
59 Suburban Local $0 $1,108,561 101,170 8,620 $1,108,561 $10.96 11.74
65 Suburban Local $0 $3,072,684 484,342 18,001 $3,072,684 $6.34 26.91
66 Suburban Local $0 $2,998,214 394,059 22,761 $2,998,214 $7.61 17.31
67 Suburban Local $0 $718,810 51,859 4,591 $718,810 $13.86 11.30
72 Suburban Local $0 $1,906,594 239,787 16,323 $1,906,594 $7.95 14.69
76 Suburban Local $0 $4,967,931 1,001,897 38,059 $4,967,931 $4.96 26.32
77 Suburban Local $0 $492,174 41,231 3,205 $492,174 $11.94 12.87
85 Suburban Local $0 $360,741 8,348 2,584 $360,741 $43.21 3.23
88 Suburban Local $0 $3,262,922 440,542 25,270 $3,262,922 $7.41 17.43
89 Suburban Local $0 $397,076 17,181 3,030 $397,076 $23.11 5.67
92 Suburban Local $0 $2,569,463 345,246 19,609 $2,569,463 $7.44 17.61
100 Suburban Local $0 $3,503,078 296,535 28,828 $3,503,078 $11.81 10.29
104 Suburban Local $0 $368,914 24,676 2,767 $368,914 $14.95 8.92
112 Suburban Local $0 $1,036,254 85,535 6,665 $1,036,254 $12.11 12.83
116L Suburban Local $0 $195,751 7,920 1,241 $195,751 $24.72 6.38
120 Suburban Local $0 $1,745,527 113,294 13,349 $1,745,527 $15.41 8.49
128 Suburban Local $0 $798,137 85,916 5,916 $798,137 $9.29 14.52
130 Suburban Local $0 $3,090,674 411,036 16,555 $3,090,674 $7.52 24.83
135 Suburban Local $0 $1,883,033 235,495 10,493 $1,883,033 $8.00 22.44
169 Suburban Local $0 $2,036,843 151,671 12,284 $2,036,843 $13.43 12.35
169L Suburban Local $0 $1,574,597 243,614 4,697 $1,574,597 $6.46 51.86
205 Suburban Local $0 $2,265,032 378,557 15,674 $2,265,032 $5.98 24.15
206 Suburban Local $0 $1,054,881 110,568 8,034 $1,054,881 $9.54 13.76
225 Suburban Local $0 $2,909,087 393,716 21,096 $2,909,087 $7.39 18.66
228 Suburban Local $0 $1,402,333 93,220 10,360 $1,402,333 $15.04 9.00
323 Suburban Local $0 $793,947 60,920 6,153 $793,947 $13.03 9.90
324 Suburban Local $0 $1,625,334 165,577 11,446 $1,625,334 $9.82 14.47
326 Suburban Local $0 $402,079 61,292 2,764 $402,079 $6.56 22.17
327 Suburban Local $0 $404,320 25,903 2,859 $404,320 $15.61 9.06
401 Suburban Local $0 $609,133 50,093 3,995 $609,133 $12.16 12.54
402L Suburban Local $0 $1,622,694 98,861 11,718 $1,622,694 $16.41 8.44
403 Suburban Local $0 $1,157,869 57,805 8,135 $1,157,869 $20.03 7.11
153/410/483 Suburban Local $0 $980,019 38,611 6,881 $980,019 $25.38 5.61
DASH Suburban Local $0 $3,737,309 745,265 22,169 $3,737,309 $5.01 33.62
JUMP Suburban Local $0 $3,246,343 599,931 26,469 $3,246,343 $5.41 22.67
Subtotal Suburban $0 $64,953,722 8,542,507 455,963 $64,953,722 $7.60 18.74
Standard Deviation $7.56 10.98
Min/Max at 10% or better: Average ± 1.28 * Std Dev $17.29 4.7
Min/Max at 25% or better: Average ± .67 * Std Dev $12.67 11.4
Regional Transportation District
Service Development Page 15 4/4/2018
RTD Service Standards Analysis - 2016
Sorted By Service Class and Route
Standards Fare Operating Total In-Service Net Subsidy per Boardings
Route Class Revenue Costs Boardings Hours Subsidy Boarding per Hour
104X Regional $0 $152,452 30,365 1,223 $152,452 $5.02 24.82
116X Regional $0 $473,464 40,941 2,287 $473,464 $11.56 17.90
120X Regional $0 $2,502,010 740,430 12,170 $2,502,010 $3.38 60.84
122X Regional $0 $2,385,207 571,200 7,548 $2,385,207 $4.18 75.68
145X Regional $0 $201,199 29,000 720 $201,199 $6.94 40.29
AA Regional $0 $2,604,470 153,183 11,012 $2,604,470 $17.00 13.91
AB Regional $0 $4,581,729 408,374 20,159 $4,581,729 $11.22 20.26
AT Regional $0 $3,527,337 503,984 13,106 $3,527,337 $7.00 38.46
BOLT Regional $0 $4,237,441 371,882 22,486 $4,237,441 $11.39 16.54
CV Regional $0 $1,887,137 124,955 6,651 $1,887,137 $15.10 18.79
EV Regional $0 $1,688,112 96,708 6,141 $1,688,112 $17.46 15.75
FF Regional $0 $18,760,875 4,257,181 92,928 $18,760,875 $4.41 45.81
GS Regional $0 $1,384,576 107,866 7,129 $1,384,576 $12.84 15.13
J Regional $0 $742,984 52,100 2,922 $742,984 $14.26 17.83
L Regional $0 $4,450,382 335,933 20,757 $4,450,382 $13.25 16.18
N Regional $0 $1,289,634 113,178 6,066 $1,289,634 $11.39 18.66
P Regional $0 $1,391,042 129,591 3,890 $1,391,042 $10.73 33.31
R Regional $0 $1,353,645 88,868 5,325 $1,353,645 $15.23 16.69
Y Regional $0 $225,152 29,288 1,706 $225,152 $7.69 17.17
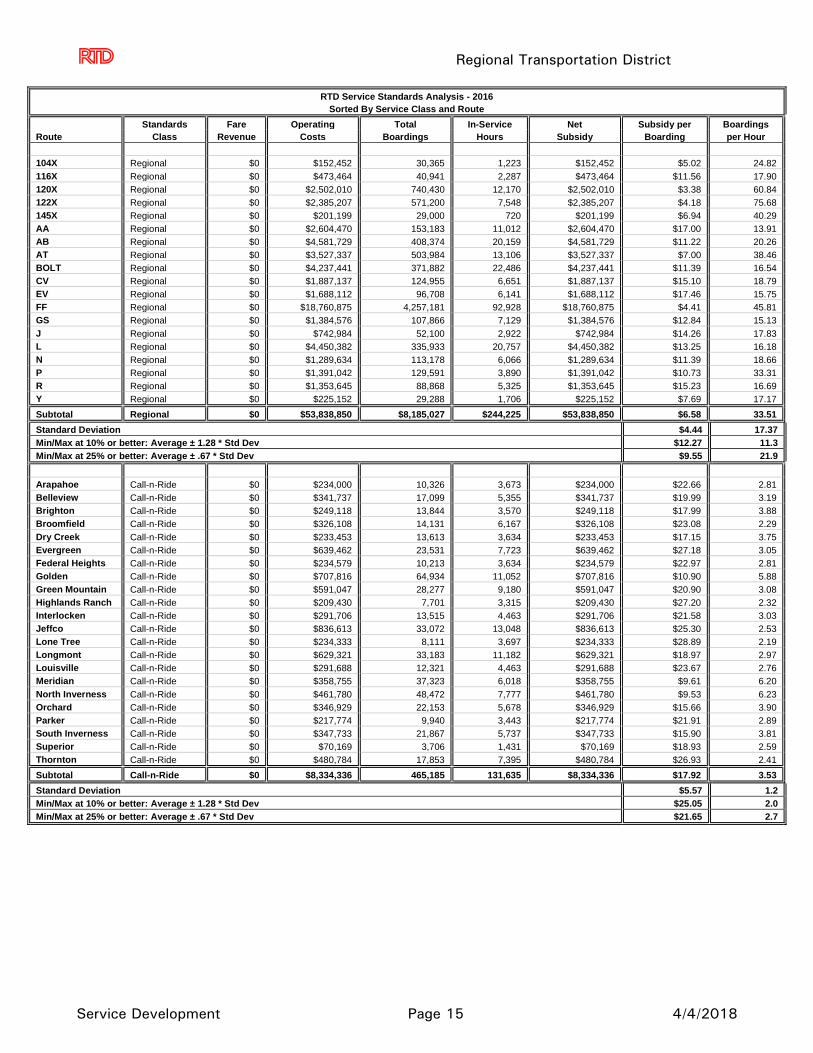
Subtotal Regional $0 $53,838,850 $8,185,027 $244,225 $53,838,850 $6.58 33.51
Standard Deviation $4.44 17.37
Min/Max at 10% or better: Average ± 1.28 * Std Dev $12.27 11.3
Min/Max at 25% or better: Average ± .67 * Std Dev $9.55 21.9
Arapahoe Call-n-Ride $0 $234,000 10,326 3,673 $234,000 $22.66 2.81
Belleview Call-n-Ride $0 $341,737 17,099 5,355 $341,737 $19.99 3.19
Brighton Call-n-Ride $0 $249,118 13,844 3,570 $249,118 $17.99 3.88
Broomfield Call-n-Ride $0 $326,108 14,131 6,167 $326,108 $23.08 2.29
Dry Creek Call-n-Ride $0 $233,453 13,613 3,634 $233,453 $17.15 3.75
Evergreen Call-n-Ride $0 $639,462 23,531 7,723 $639,462 $27.18 3.05
Federal Heights Call-n-Ride $0 $234,579 10,213 3,634 $234,579 $22.97 2.81
Golden Call-n-Ride $0 $707,816 64,934 11,052 $707,816 $10.90 5.88
Green Mountain Call-n-Ride $0 $591,047 28,277 9,180 $591,047 $20.90 3.08
Highlands Ranch Call-n-Ride $0 $209,430 7,701 3,315 $209,430 $27.20 2.32
Interlocken Call-n-Ride $0 $291,706 13,515 4,463 $291,706 $21.58 3.03
Jeffco Call-n-Ride $0 $836,613 33,072 13,048 $836,613 $25.30 2.53
Lone Tree Call-n-Ride $0 $234,333 8,111 3,697 $234,333 $28.89 2.19
Longmont Call-n-Ride $0 $629,321 33,183 11,182 $629,321 $18.97 2.97
Louisville Call-n-Ride $0 $291,688 12,321 4,463 $291,688 $23.67 2.76
Meridian Call-n-Ride $0 $358,755 37,323 6,018 $358,755 $9.61 6.20
North Inverness Call-n-Ride $0 $461,780 48,472 7,777 $461,780 $9.53 6.23
Orchard Call-n-Ride $0 $346,929 22,153 5,678 $346,929 $15.66 3.90
Parker Call-n-Ride $0 $217,774 9,940 3,443 $217,774 $21.91 2.89
South Inverness Call-n-Ride $0 $347,733 21,867 5,737 $347,733 $15.90 3.81
Superior Call-n-Ride $0 $70,169 3,706 1,431 $70,169 $18.93 2.59
Thornton Call-n-Ride $0 $480,784 17,853 7,395 $480,784 $26.93 2.41
Subtotal Call-n-Ride $0 $8,334,336 465,185 131,635 $8,334,336 $17.92 3.53
Standard Deviation $5.57 1.2
Min/Max at 10% or better: Average ± 1.28 * Std Dev $25.05 2.0
Min/Max at 25% or better: Average ± .67 * Std Dev $21.65 2.7

Regional Transportation District
Service Development Page 16 4/4/2018
RTD Service Standards Analysis - 2016
Sorted By Service Class and Route
Standards Fare Operating Total In-Service Net Subsidy per Boardings
Route Class Revenue Costs Boardings Hours Subsidy Boarding per Hour
FMR Free Metro Ride $0 $546,568 557,005 9,102 $546,568 $0.98 61.19
MALL Mall $0 $12,273,962 11,783,047 63,110 $12,273,962 $1.04 186.71
A Rail $0 $44,784,924 4,137,809 22,466 $44,784,924 $10.82 184.18
B Rail $0 $1,990,911 179,596 1,263 $1,990,911 $11.09 142.16
C Rail $0 $22,583,713 1,451,824 18,711 $22,583,713 $15.56 77.59
D Rail $0 $48,421,264 5,792,303 57,035 $48,421,264 $8.36 101.56
E Rail $0 $37,846,394 4,873,037 40,842 $37,846,394 $7.77 119.31
F Rail $0 $23,635,055 3,134,029 20,484 $23,635,055 $7.54 153.00
H Rail $0 $40,828,082 4,879,828 40,025 $40,828,082 $8.37 121.92
W Rail $0 $32,752,975 4,454,061 53,897 $32,752,975 $7.35 82.64
Subtotal Rail $0 $252,843,317 $28,902,487 $254,722 $252,843,317 $8.75 113.47
Standard Deviation $2.80 36.2
Min/Max at 10% or better: Average ± 1.28 * Std Dev $12.33 67.1
Min/Max at 25% or better: Average ± .67 * Std Dev $10.62 89.2
Access-a-Ride ADA $0 $39,301,959 881,283 575,853 $39,301,959 $44.60 1.53
BroncoRide Special Services $0 $1,334,242 132,440 14,926 $1,334,242 $10.07 8.87
RockiesRide Special Services $0 $280,082 13,360 3,235 $280,082 $20.96 4.13
SeniorRide Special Services $0 $520,375 49,583 6,047 $520,375 $10.50 8.20
VanPool Special Services $932,247 $1,824,513 227,001 53,173 $892,266.00 $3.93 4.27
Focus Point Special Services $0 $52,196 2237 687 $52,196.00 $23.33 3.3
Shopper Special Special Services $0 $454,433 9,528 6,149 $454,433.00 $47.69 1.55
Littleton Shop Special Services $0 $69,566 8,373 1692 $69,566.00 $3.61 4.9
Subtotal Special Services $932,247 $4,535,407 $431,912 $83,530 $3,603,160 $8.34 5.17
System Totals System $932,247 $652,177,277 $100,251,547 $3,244,064 $651,245,030 $6.50 30.90