Overview on the Korean Food Industry - European...
38
1 Overview on the Korean Food Industry
Transcript of Overview on the Korean Food Industry - European...

1
Overview on the Korean Food Industry

2
Overv iew Korea-EU FTA
Upbr ing ing Po l i cy o f Korean Food I ndus t ry
Deve lopment and Changes o f Korean Food I ndus t ry Ⅰ
Ⅱ
Ⅲ
Overv iew o f Marke t by ma jo r i t em Ⅳ

3 3
Development and Changes of Korean Food Industry 1

4
<Scale of World’s Food Industry (Unit: Trillions in USD)>
2012 2011 2008 2009 2010 2020
6.4 trillion
4.8
5.4
4.9 5.1
5.3
64
67
131
‘10
61
70
131
‘09
55
65
120
‘08
48
60
108
‘07
44
51
95
‘06 ‘11 ’12
Food manufacturer
Food Service Industry
(Unit : trillion won)
70
74
144
‘20
International Food Market Korean Food Market
<Scale of Korean Food Industry (Unit: Trillions in KRW)>
* Reference : Major Index of Food Industry of 2010

5
Globalization: Emerging market of Asia, Intensifying competition at least a billion people of new customers will be appeared within 10 years
Changes of Population Structure: The expansion of Aging and Multicultural Society Expectation of entering super aged society of Korea in 2026
Climatic Change: Intensifying Global warming, Exhaustion of Natural Source and Energy During the past century (1906~2005), 0.74°C increased
Value Change: From Price and quantity mainstay to Health, nutrition, and safety mainstay During 1998~2006, the area of environment-friendly agriculture increased by 305%
Technical progression and convergence: Convergence including BT, IT, NT The fate of a country will be affected by imagination and creativity

6

7

8
Post liberation~ 1960s 1970 ~ 1980s 1990s 2010s

9
19 21 15
26 32
27 34
30 32 28 30
34 38 45 48
59
77
80
0
20
40
60
80
100
`80 `81 `82 `83 `84 `85 `86 `87 `88 `89 `90 `91 `92 `93 `94 `95 `96 `97 `98 `99 `00 `01 `02 `03 `04 `05 `06 `07 `08 `09 `10 `11 `12
Annual export statistic of Agro-Fishery Products
(Increased by 6.3% annually)
‘81 $21 billion
‘88 $32 billion ‘08 $45 billion
Olympic IMF Recession
(Increased by 1.0% annually) (Increased by 16% annually) Breakthrough $30 billion Breakthrough $40 billion / taking 20 years

10
Weight of export per Country

11
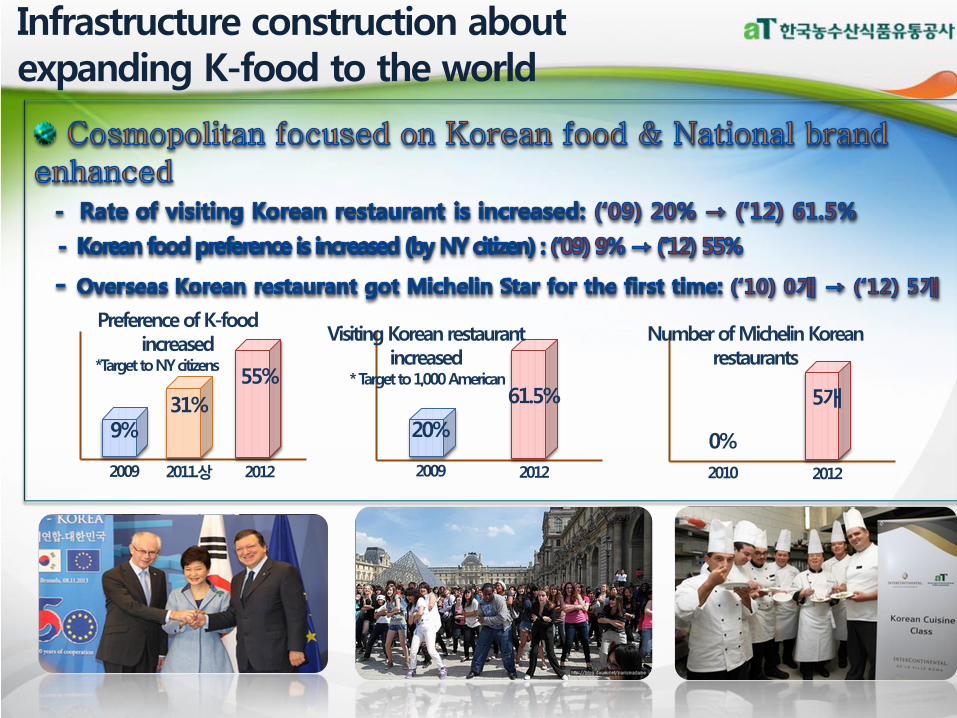
The growth in the popularity of K-food with Korean wave in the world
Hot Seller of 2011 in Japan: Makgeoli (raw rice wine) ranked 7th, Red vinegar ranked 14th
Russia: Choco-pie, Doshirak Ramen, Sempio Soy sauce, Ottogi Mayonnaise
East Asia: Spout Gum, Maeil powdered milk
12

13 13
Overview of Korea-EU FTA 2

14
Signed /Effected FTA(9 / 46 countries) Settled (1, 1 country) Negotiatied (8 / 16 countries) Joint research(7 / 21 countries)
EU
(’11.7)
EFTA
(’06.9)
Israel
MERCOSUR
GCC India (’10.1)
ASEAN(’07.6)
Singapore(’06.3)
Australia
New Zealand
Canada
America
(’12.3)
Colombia
Peru
(’11.8)
Chile
(’04.4)
Turkey (’12.3)
Indonesia
China
RCEP
Vietnam 6 nations of Central America Malaysia
Mexico
Korea, China, and Japan2
Japan

15
EU Export EU Import
2010.7~2011.6 2011.7~2012.6 Growth rate 2010.7~2011.6 2011.7~2012.6 Growth rate
364.7 389.9 6.9 2,382.0 2,990.9 25.6

16 16
Major Upbringing Policy of Food Industry 3

17
- Develop Export strategy item - Develop professional organization of export
Build a System of export expansion to create the result
- Foundation of Food corporation promotion center - Improvement of food reserves supply function in food service industry - Develop support system of food information
Core function to develop Food Industry
- Expansion of overseas export based on distribution - Securement of food independence due to introduction of overseas grain
Global strengthening of ability
(Past) Distribution & Export of agro-fishery products
→ (Expansion) Development of Food Industry +
Grain Business + Cyber exchange
Korea Agro-Fisheries Trade Corporation
→ Korea Agro-Fisheries & Food Trade Corporation

18
Vision &
Objectives
Develop global Food Industry to lead Agriculture and Fishing
▶ Revenue of Food Industry : (‘09) 131 trillion → (‘17) 245
▶ Agrifood export : (‘09) 48 billion dollar → (‘17) 100
▶ Employee of Food Industry: (’09) 176 million → (‘17) 200
Expansion of
Food Industry
Infrastructure
Connection
reinforcement
with agriculture
and Fisheries
Enhancement of global
competitiveness
Customer
information offering
and protection
Expansion of Food R&D
National Food Cluster
Training Food manpower
Enforcement Statistic &
information management
Expansion of financial
support
Support center for Agrifood
Food processing vitalization
Developing local strategy item
Developing convergence
corporation with agriculture and
manufacture
Boosting consumption of best food
reserves
Developing food service industry
Processing industry per item
vitalization
Export expansion of agrifood
Globalization of Korean food
Supporting overseas expansion of
food corporation
Developing traditional fermented
food
Developing functional food
Vitalization of related industry
Enforcement of providing
consumers’ information
Reforming certification system
Education of green food life
Enforcement prevention safety
management

19
Connected with external network
R&D (Rural development administration,
Korea food research institute, universities)
Foundations(Consulting company, Association)
Supporting manpower (human resource development service, universities)
Education(private educational organization)
aT Customizing support
Consulting
Export(global marketing, etc)
Fund support (Purchasing raw material, facility modernization)
Customizing support of food service coporation through management consultant
“Achieve to two thousand food corporations with revenue more than 10 billion won till 2017”

20
National food cluster, size of 232 million㎡, was built in Iksan, Jeonbuk
150 of food companies and laboratories are located
(plan to achieve annual revenue of 4 trillion won)
*55 of MOU was Contracted MOU (Domestic 41, Overseas 14)
Established 3 R&D Centers : Evaluation of functionality, Quality and Safety Package Center
Food corporations: 150
Private laboratory: 10
Attracting corporations
related to Food Industry
R&D is at the level of advanced country
(’08)40% → (‘15)90%
about 22,000 employees
Develop a National Food Industrial Complex of R&D·Network·Export-oriented
Deploy R&D center of the level of advanced country and support R&D
Develop a world-wide food cluster to invite global corporations
※A Comprehensive plan of National Food Cluster(July, 2012)

21

22
Forming export leading
organization
Safety management
Training export experts
Making Gardening area
Export fund support
Export information
research
Overseas PR
Globalization of
Korean Food
Feed Back
Developing exporting
products
Making strategy item
Establishing joint
representative brand
Supporting export
distribution cost
Deploying overseas
advanced base
Safety manual
Inviting quarantine officer
Attending international
exhibition
Promotion with distribution
industry
Intercession of buyer dealings
Operating sales business
directly
Overseas branch business
Produce Commercialization Distribution Global Marketing Overseas Consumption

23

24
Feature of tourism resource of small brewery
Luxury alcohol contest for enhancing the quality of
traditional alcoholic drinks
- Korean alcoholic drinks show(Sept., 8 of drinks), Participate in
International alcoholic drinks contest (June, Sept.) ’13 ’17
5 places
Brewery tourism
Public Relations for pioneering overseas market of traditional food
- Cooking contest for soy sauce (Nov., Shanghai) Rice cake festival (Sept., Beijing), Making
feature program at local broadcasting
Traditional food experience tour linked to KORAIL
Promote experience event of traditional food
- Making traditional food for kids / Making Makgeolli for foreigners

25

26 26
Overview of Market by major item 4

27

28

29

30

31

32

33
Overall Coffee
Nations 2011 2012 Growth rate(%)
TOTAL 718,936.7 598,542.3 -16.7
1 Brazil 149.6 134.5 -10.14
2 Vietnam 89.6 79.7 -10.98
3 Colombia 114.1 70.9 -37.87
4 USA 32.7 45.9 40.58
5 Honduras 65.8 42.5 -35.45
6 Peru 54.2 39.1 -27.83
7 German 18.4 28.8 56.68
8 Ethiopia 18.0 22.3 23.73
9 Switzerland 23.9 18.1 -24.24
10 Italy 13.3 14.1 6.02
Prepared Coffee
Nations 2011 2012 Price(%)
TOTAL 100.3 121 21.0
1 Brazil 26.4 42.8 61.92
2 German 14.3 24.7 72.95
3 Colombia 5.3 9.6 85.46
4 Spain 21.7 7.4 -65.75
5 Malaysia 6.4 7 6.67
6 USA 5.8 6.8 16.88
7 Vietnam 2.9 5.9 105.33
8 Egypt 3.2 3.2 2.31
9 Japan 3.8 2.6 -33.62
10 Israel 0.1 2,338.6

34
Division Dongsuh
Food Nestle of
Korea Other
2011 76.7% 21.1% 2.3%
2012 78.7% 17.6% 3.7%
Division Dongsuh
Food Coca-cola
Lotte Chilsung
Other
2011 11.9% 9.4% 33.6% 45.2%
2012 10.3% 10.6% 33.6% 45.5%

35

36

37

38
Thank You