Overview of TNM and Case Studies with TNM 2panos/444/TNM.pdf · Overview of TNM and Case Studies...
40
Overview of TNM and Case Studies with TNM 2.5 By By Panos D. Prevedouros, PhD Department of Civil and Environmental Engineering University of Hawaii at Manoa June 2011
-
Upload
hoangthuan -
Category
Documents
-
view
233 -
download
0
Transcript of Overview of TNM and Case Studies with TNM 2panos/444/TNM.pdf · Overview of TNM and Case Studies...

Overview of TNM
and Case Studies with TNM 2.5
By By
Panos D. Prevedouros, PhD
Department of Civil and Environmental Engineering
University of Hawaii at Manoa
June 2011
Outline
� TNM Fundamentals
� Data Input
� Data Preparation � Data Preparation
� TNM Sensitivity Case Studies
� TNM Case Studies on H-1 Freeway
2


What is TNM?
�State-of-the-art computer program for predicting noise levels
near a highway
�Uses a nationally representative noise emission database
� Emissions levels of 6,000 different vehicles under different � Emissions levels of 6,000 different vehicles under different
operating conditions
� Reference distance of 50 ft.
� Shielding effect of barriers, berms, grounds, buildings and
trees
4

History
� Before TNM, FHWA-RD-77-108 was in use for over 20
years
• No data for vehicles on grade or vehicles subject to
interrupted-flow conditions
� March 1998: FHWA released the Traffic Noise Model,
Version 1.0Version 1.0
• Version 1.0a, March 1999
• Version 1.0b, August 1999
• Version 1.1, September 2000
• Version 2.0, June 2002
• Version 2.1, March 2003
• Version 2.5, April 2004
• Version 3.0, September 2011
5
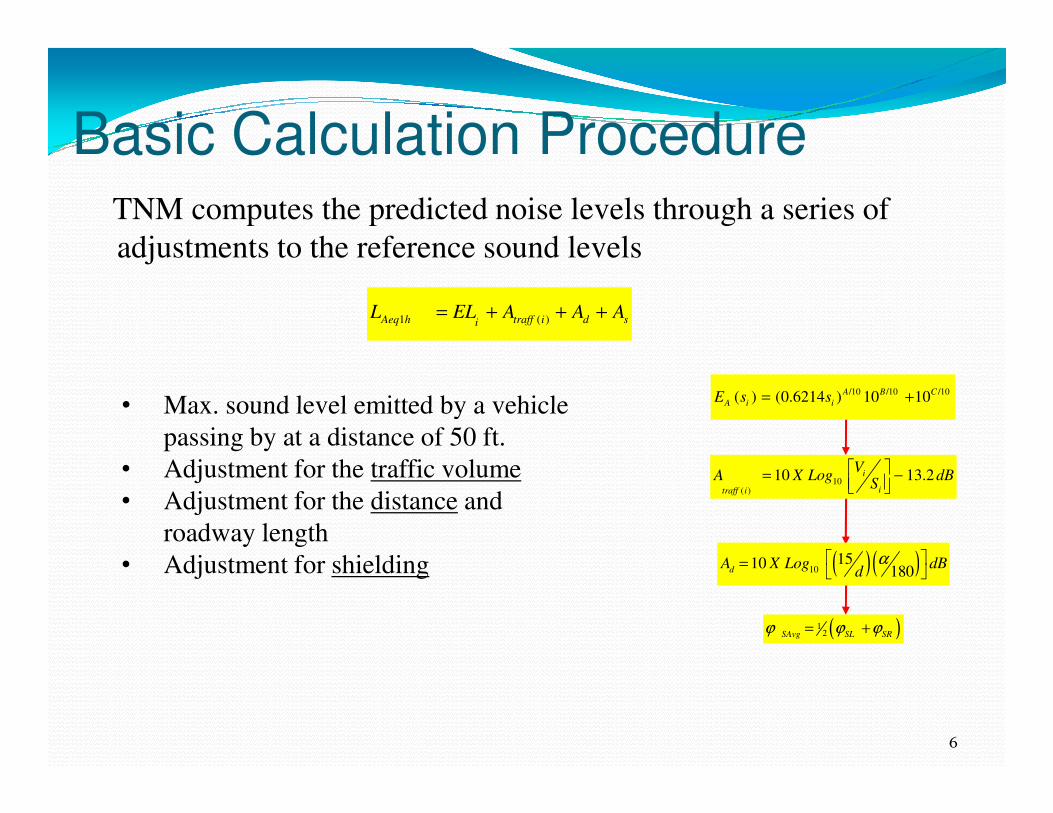
Basic Calculation ProcedureTNM computes the predicted noise levels through a series of
adjustments to the reference sound levels
1 ( )Aeq h traff i d siL EL A A A= + + +
• Max. sound level emitted by a vehicle /10 /10 /10( ) (0.6214 ) 10 10A B C
A i iE s s= +
6
• Max. sound level emitted by a vehicle
passing by at a distance of 50 ft.
• Adjustment for the traffic volume
• Adjustment for the distance and
roadway length
• Adjustment for shielding
A i i
10( )
10 13.2i
itraff i
VA X Log dB
S = −
( )( )101510
180dA X Log dBd
α =
( )12SAvg SL SRϕ ϕ ϕ= +
TNM Applications
� Calculate noise levels at receiver locations for both
conditions: Existing and future
� Design highway noise barriers
� Communicate predicted noise results from proposed new
projects to local authorities and general public
� Develop noise contours
� Required for federally funded highway projects
7

Noise Analysis
� Input Files
� Model Building
� Data Input
� Data Check� Data Check
� Results
8

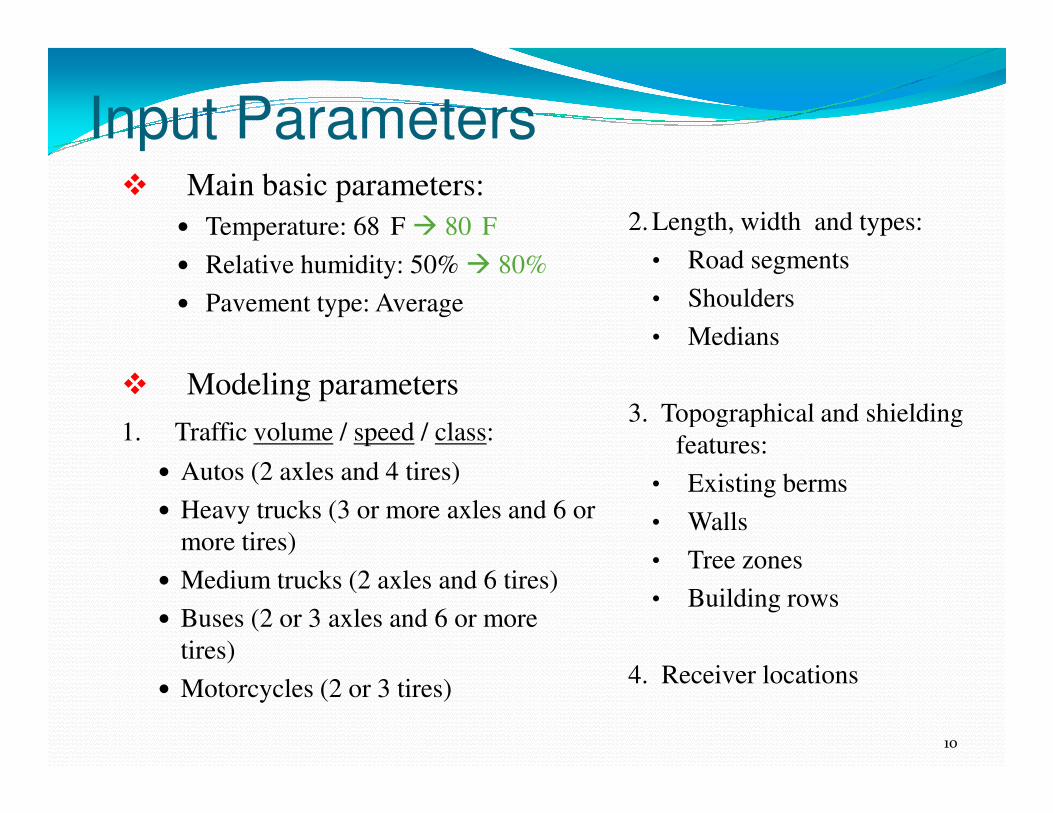
Input Parameters� Main basic parameters:
� Temperature: 68 F � 80 F
� Relative humidity: 50% � 80%
� Pavement type: Average
� Modeling parameters
2. Length, width and types:
• Road segments
• Shoulders
• Medians
3. Topographical and shielding 1. Traffic volume / speed / class:
� Autos (2 axles and 4 tires)
� Heavy trucks (3 or more axles and 6 or
more tires)
� Medium trucks (2 axles and 6 tires)
� Buses (2 or 3 axles and 6 or more
tires)
� Motorcycles (2 or 3 tires)
10
3. Topographical and shielding
features:
• Existing berms
• Walls
• Tree zones
• Building rows
4. Receiver locations

Methodology
� TNM steps
� Identification of existing
land use categories within
500 ft.
� Data collection
� Segmentation of highway
� Receiver selection
� Model development
� Simulation
� Impact analysis
11

Noise Levels for Various
Conditions (1/4)
Determinants Change by Results in noise
levels Reference Remarks
±12% ±0.6 dBA [43]
±9% ±0.4 dBA [43]
Test was done in a multilane highway ( 3-
lane in each direction), slightly rolling
terrain and short grass ground in between
receivers and highway. Vehicles speed
was 65 mph.
12
20% 1 dBA
100% 3 dBA
1% Medium truck 0.1 dBA
1% Heavy truck 0.2 - 0.3 dBA
1% Motorcycle 0.2 dBA
1% Bus 0.1 dBA
Vehicle speed ±12% ±1 dBA [13,43]
Test was done in a multilane highway ( 3-
lane in each direction), slightly rolling
terrain and short grass ground in between
receivers and highway. Vehicle speed was
65 mph.
Increase in volume
Increase vehicle volume on each category
[22]Vehicle volume
[22]
Not
From See slide no. 61 for reference citations
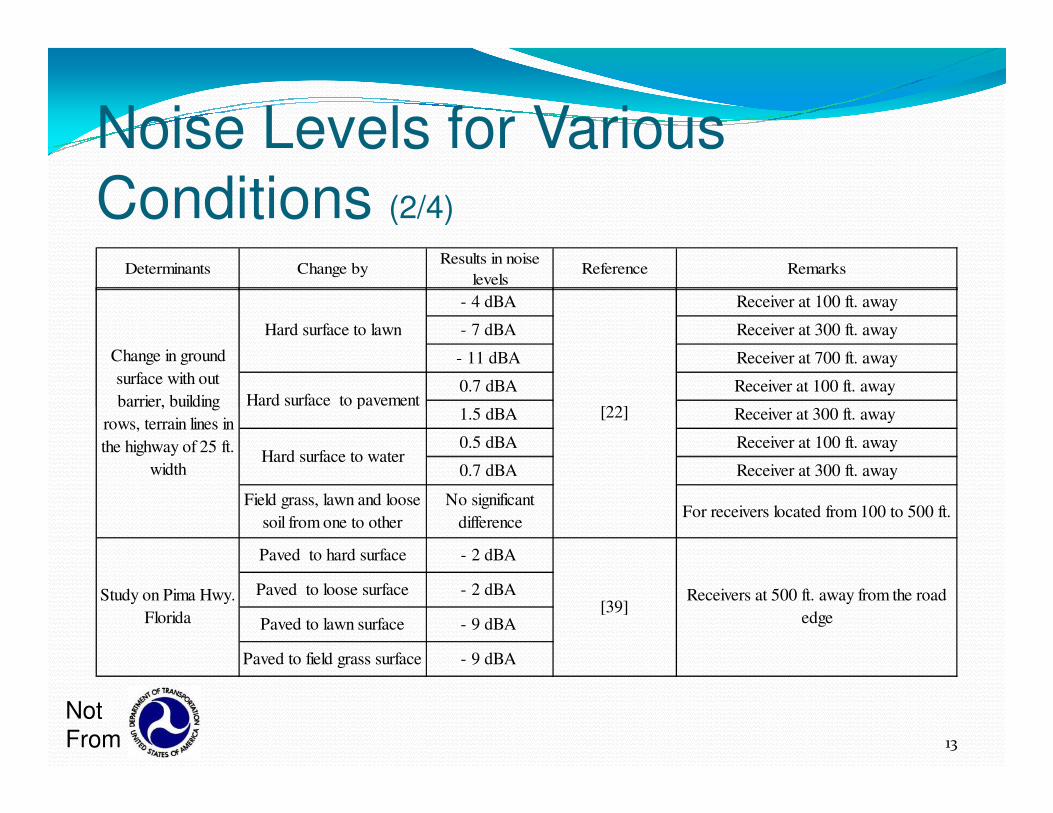
Noise Levels for Various
Conditions (2/4)
- 4 dBA Receiver at 100 ft. away
- 7 dBA Receiver at 300 ft. away
- 11 dBA Receiver at 700 ft. away
0.7 dBA Receiver at 100 ft. away
1.5 dBA Receiver at 300 ft. away [22]
Change in ground
surface with out
barrier, building
Hard surface to lawn
Hard surface to pavement
Determinants Change by Results in noise
levels Reference Remarks
13
1.5 dBA Receiver at 300 ft. away
0.5 dBA Receiver at 100 ft. away
0.7 dBA Receiver at 300 ft. away
Field grass, lawn and loose
soil from one to other
No significant
difference For receivers located from 100 to 500 ft.
Paved to hard surface - 2 dBA
Paved to loose surface - 2 dBA
Paved to lawn surface - 9 dBA
Paved to field grass surface - 9 dBA
[22]barrier, building
rows, terrain lines in
the highway of 25 ft.
width
Study on Pima Hwy.
Florida[39]
Receivers at 500 ft. away from the road
edge
Hard surface to pavement
Hard surface to water
Not
From

Noise Levels for Various
Conditions (3/4)
Temperature 30°F - 70°F Increase by <1
dBA [22]
Receivers located 300 ft. away from
roadway
- 0.5 dBA Receivers at 200 ft. away from the road
edge
- 1 dBA Receivers at 500 ft. away from the road
edge
Average to PCC 2 dBA
Relative humidity 50% to 20% [22]
Determinants Change by Results in noise
levels Reference Remarks
14
Average to DGAC - 1 dBA
Average to OGAC - 2 dBA
- 0.1 dBA At distance 200 & 300 ft. away from
road edge
- 0.2 dBA At distance 400 & 500 ft. away from
road edge
3 point berm of 3:1 slope No differences For receiver at 200,300, 400 & 500 ft.
away from road edge
1.1 dBA 200 ft. away
0.5 dBA 300 ft. away
0.3 dBA 400 ft. away
0.2 dBA 500 ft. away
For receivers located 300 ft. away from
road edge[13, 22]
Pavement effect on
noise levels
[22]
Replacing berms
with 3:1 slope by
berms with 3 & 5
terrain lines 5 point rounded berm
[22]
Replacing existing
wall with berms Berms with 3:1 slope
Not
From
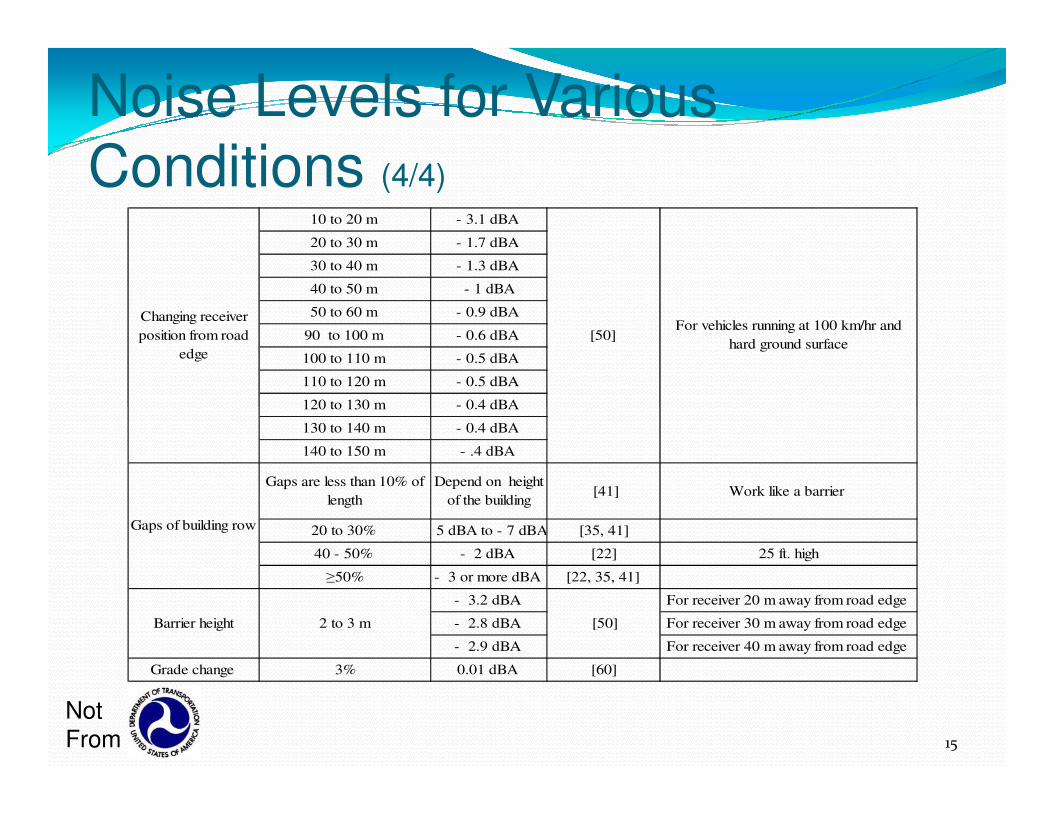
Noise Levels for Various
Conditions (4/4)10 to 20 m - 3.1 dBA
20 to 30 m - 1.7 dBA
30 to 40 m - 1.3 dBA
40 to 50 m - 1 dBA
50 to 60 m - 0.9 dBA
90 to 100 m - 0.6 dBA
100 to 110 m - 0.5 dBA
110 to 120 m - 0.5 dBA
120 to 130 m - 0.4 dBA
For vehicles running at 100 km/hr and
hard ground surface [50]
Changing receiver
position from road
edge
15
120 to 130 m - 0.4 dBA
130 to 140 m - 0.4 dBA
140 to 150 m - .4 dBA
Gaps are less than 10% of
length
Depend on height
of the building [41] Work like a barrier
20 to 30% - 5 dBA to - 7 dBA [35, 41]
40 - 50% - 2 dBA [22] 25 ft. high
≥50% - 3 or more dBA [22, 35, 41]
- 3.2 dBA For receiver 20 m away from road edge
- 2.8 dBA For receiver 30 m away from road edge
- 2.9 dBA For receiver 40 m away from road edge
Grade change 3% 0.01 dBA [60]
Barrier height [50]2 to 3 m
Gaps of building row
Not
From

Homogeneous Segments
�Freeway is divided into segments based on
large changes to major TNM inputs
�Segments are considered homogeneous as
long as the changes on noise levels are ±3
dBA compared to base case
16
Not
From

Suggested Criteria for
Homogeneous Segments Determinants Situation Limiting Value /Condition Effect on Noise Levels
Hard Should be same throughout the segment Same
Field grass, lawn and
loose soil Can change from one to another Not significant change
Vehicle volume Change ±20% ±1 dBA
Ground surface
17
Vehicle speed Change ±15% ±1 dBA
Freeway width or
number of lanes No change Should be same throughout segment (s) Same
Topographical
features No change
The average height of existing wall and
berms should be sameSame
Freeway grade Change ±3% Not significant change
Heavy trucks Change 3% 0.6 to 0.9 dBA
Not
From
Start from a central segment and expand on both directions as long as volume, speed, grade, and % HV fluctuate within these criteria values and there is no change in shielding. Viaducts, tunnels and high volume ramps are typical locations for ending a segment and starting a new one.

Sample Interface
18
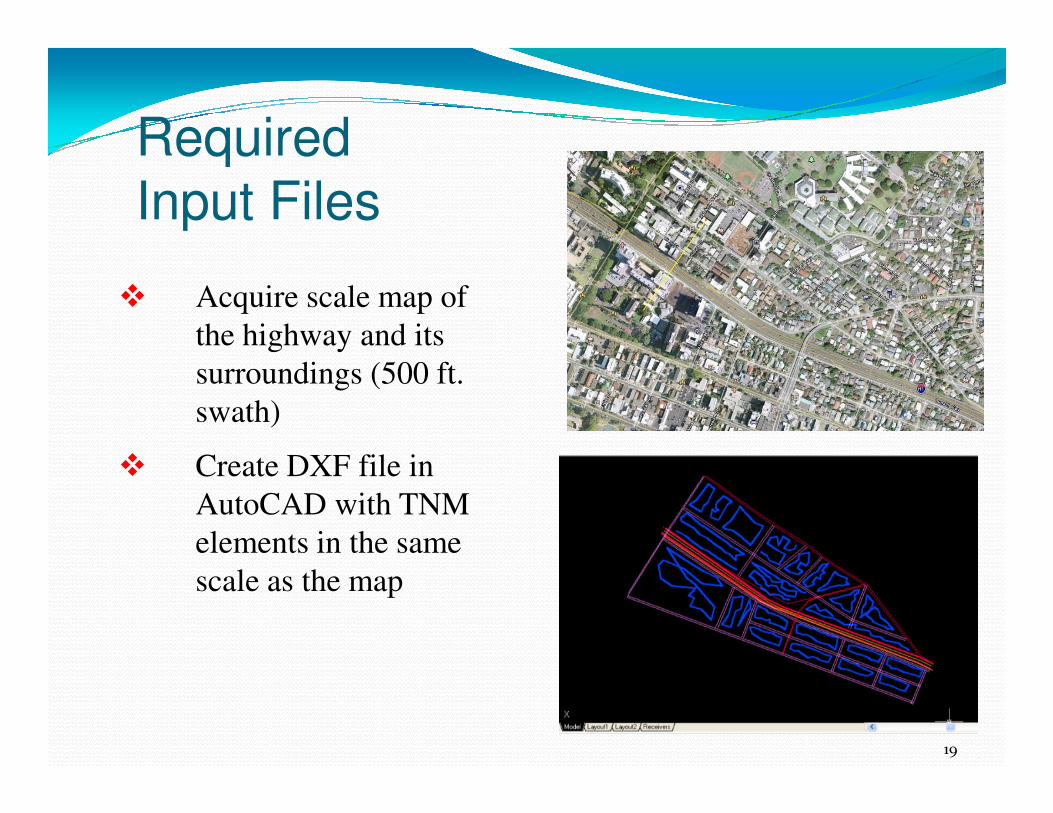
Required
Input Files
� Acquire scale map of
the highway and its
surroundings (500 ft.
swath)swath)
� Create DXF file in
AutoCAD with TNM
elements in the same
scale as the map
19

Model Building
� General information
• Units of length of
TNM elementsTNM elements
• Relative Humidity
• Temperature
• Ground Type
20

Importing and Digitizing DXF file
� Import DXF file from
AutoCAD
� Digitize TNM elements like
road, receivers, barriers etc.
� Many improvements in TNM � Many improvements in TNM
3.0
21

Roadways � General information
• Width
• Pavement
• Grade
� Traffic flow
• Types, Volume and Speed • Types, Volume and Speed
� Traffic control
• Stop, Signal, Toll, On/off-ramp
22
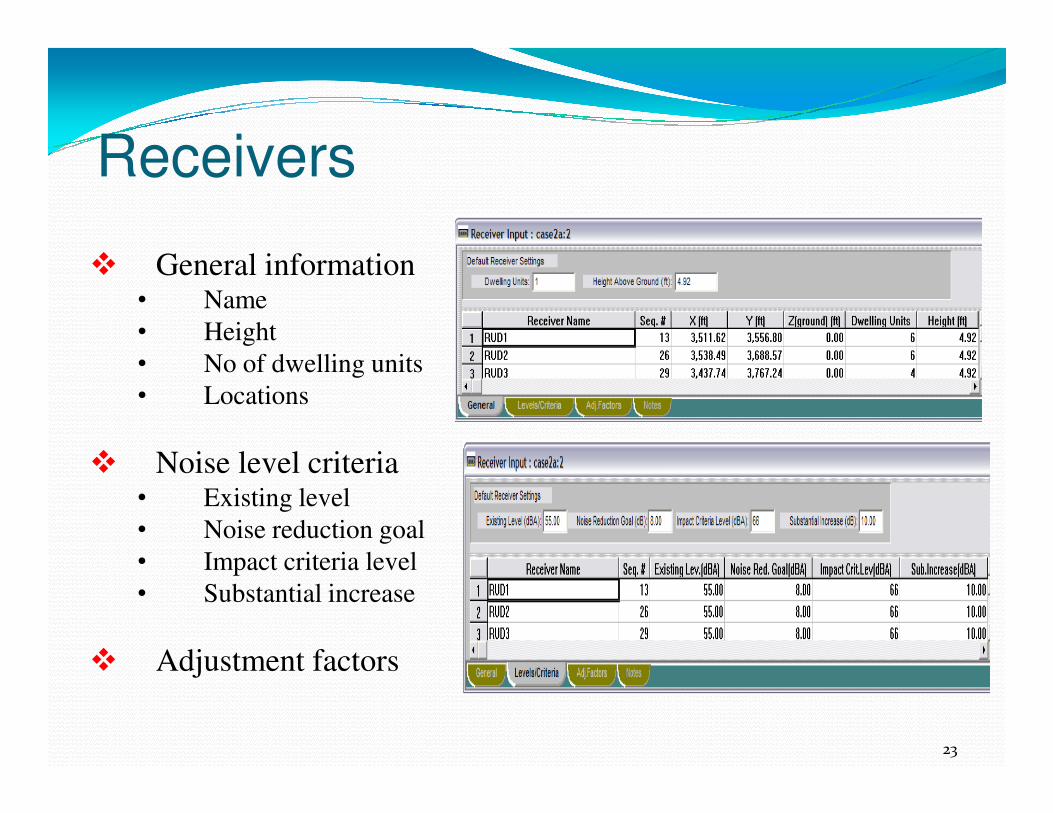
Receivers
� General information• Name
• Height
• No of dwelling units
• Locations • Locations
� Noise level criteria• Existing level
• Noise reduction goal
• Impact criteria level
• Substantial increase
� Adjustment factors
23
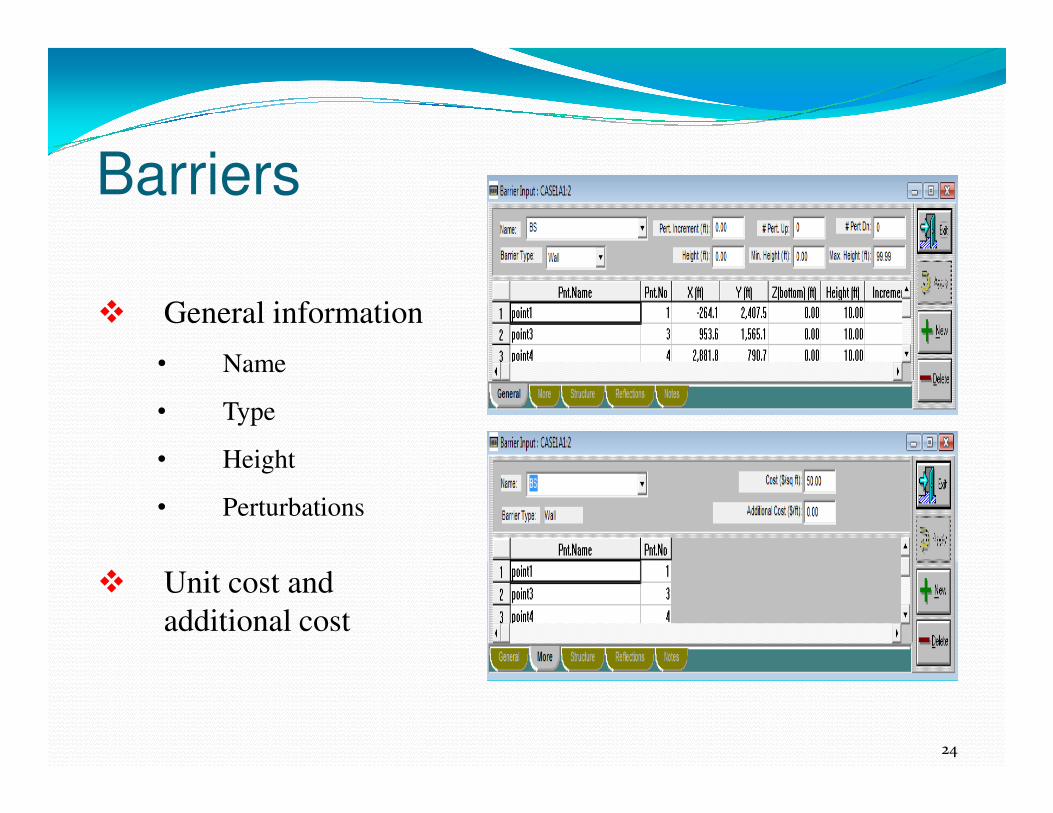
Barriers
� General information
• Name
• Type• Type
• Height
• Perturbations
� Unit cost and
additional cost
24

Contours
� Set up contour
parameters
� Select contour zones
� Calculate sound level � Calculate sound level
contours
25
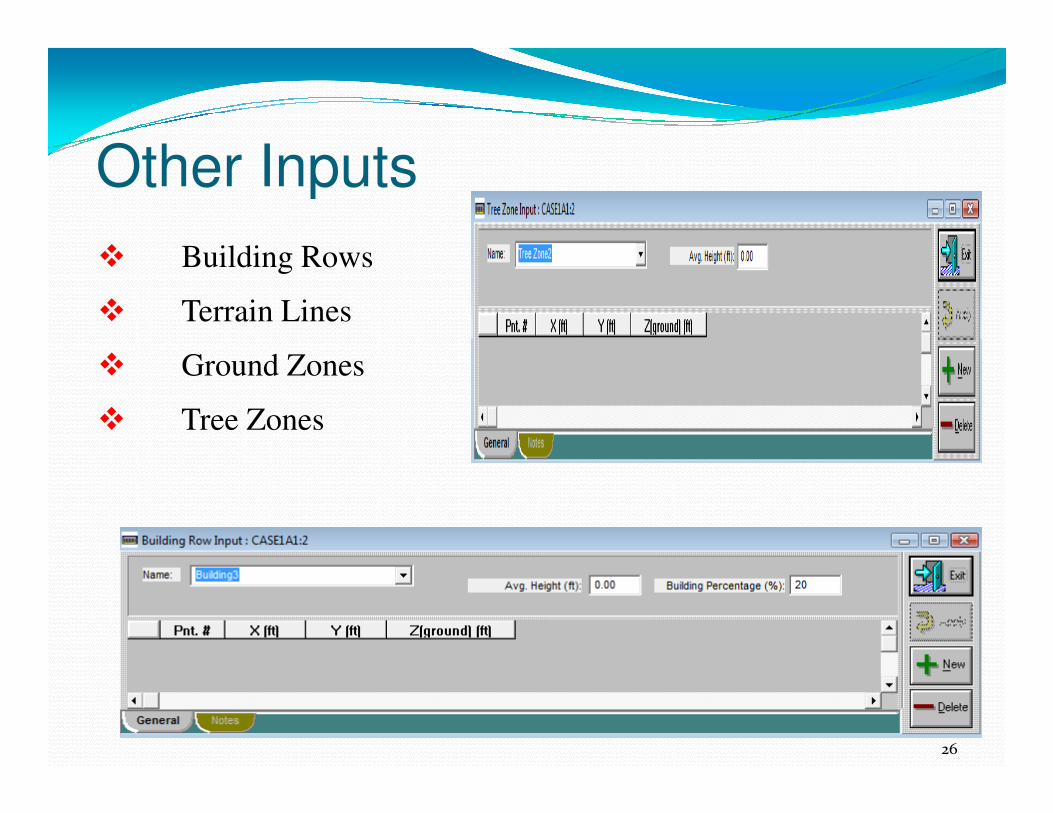
Other Inputs
� Building Rows
� Terrain Lines
� Ground Zones
� Tree Zones � Tree Zones
26

Data Check
� TNM checks for invalid inputs• Section with zero length
• Vehicle with zero speed
• Receiver position too close to
road
• Receivers with identical • Receivers with identical
location
• Perturbation beyond max. or
min. limit of barrier height
• Berms on structures
• Grade of road >20%
27

Outputs
� Sound level results
� Barrier design and
cost
� Sound level contours
28


TNM Sensitivity
� Case Study I
H-1 Fwy. section between Wilder Ave. and Punahou St.
� Case Study II� Case Study II
H-1 Fwy. Kahala Mall Viaduct (Ainakoa Ave. to 20th Ave.)
� Case Study III
Likelike Hwy. between School St. and Emmeline Pl.
30

Case Study I
Objective was to determine the effect of:
• Noise from freeway only
• Noise from frontage roads and on-ramp
• Noise level with a reduction of traffic volume• Noise level with a reduction of traffic volume
• Noise level with noise barrier on one side only
• Noise level if the receiver locations are moved
10 ft. or 50 ft. further away from the freeway
31

Results
� Traffic noise is mainly from freeway
Receivers
1e
Name 10ft shift 50ft shift 10ft shift 50ft shift
RNF11 78.8 78.8 78.3 46.3 78.2 74.7 65.7 65.7 65.3 66.3 63.9 63.8 63.9 63.4 62.0 62.1 61.7
RNF12 76.3 76.4 75.9 55.1 75.9 71.8 65.5 70.0 69.5 69.9 66.8 64.3 69.7 69.2 62.8 69.4 68.9
RNF13 79.9 79.9 79.4 53.7 79.0 75.5 65.7 65.9 65.4 67.0 64.9 64.2 64.3 63.8 62.2 62.2 61.7
RSF11 76.5 76.5 76.0 60.6 76.0 72.5 65.3 65.9 65.4 65.5 62.7 64.0 64.8 64.3 62.4 63.5 63.0
RSF12 76.2 76.2 75.7 59.1 75.8 72.5 65.3 65.8 65.3 65.5 62.7 64.0 64.6 64.1 62.4 63.3 62.8
RSF13 77.6 77.7 77.2 62.8 77.1 73.8 66.0 67.6 67.1 67.1 64.5 64.7 66.6 66.1 62.9 65.5 65.0
1b
10 ft height barrier 12 ft height barrier 15 ft height barrier
North
Side
South
Side
1e
1a 1b 1c 1c 1a 1b 1c
No Barrier
1d 1a 1b 1c 1a
� Traffic noise is mainly from freeway
� Noise level does not change when barrier is installed on
one side only
� Noise level is not reduced with 10% decrease in traffic
� Small errors in precision in location of receivers do not
change the results dramatically (~10 ft or so)
� A 10 ft. relocation has imperceptible improvement < 1 dBA
� A 50 ft. relocation has perceptible improvement > 3 dBA
32
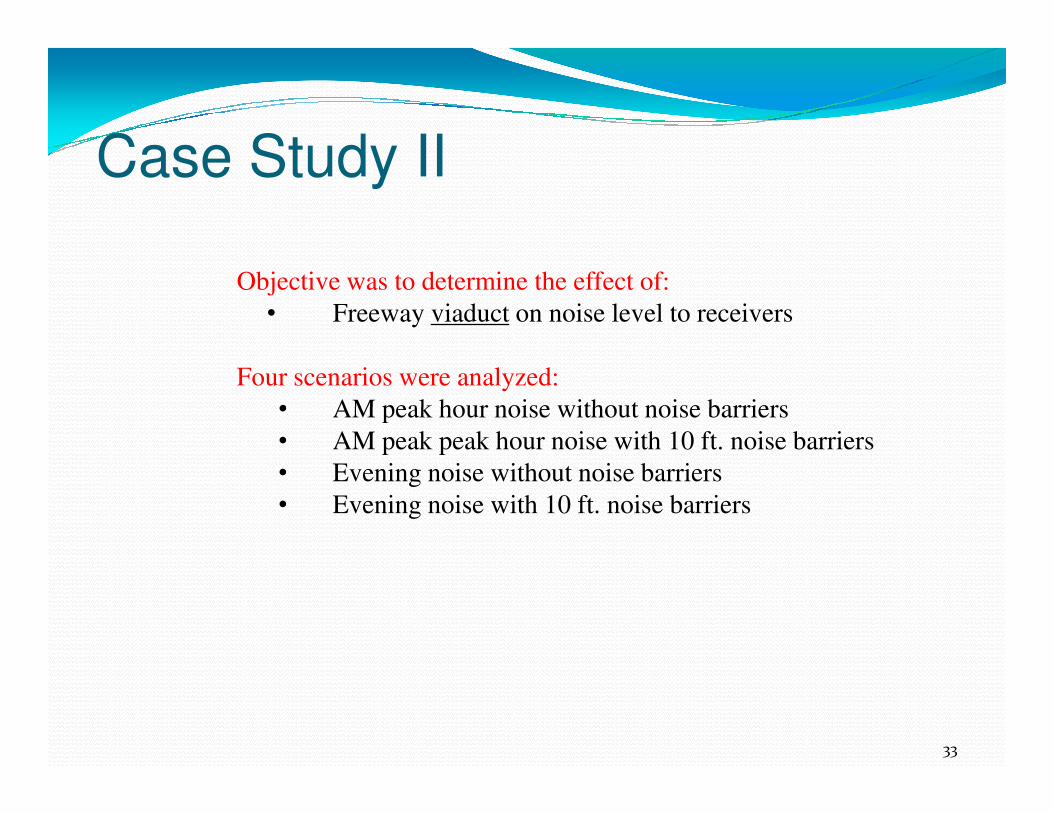
Case Study II
Objective was to determine the effect of:
• Freeway viaduct on noise level to receivers
Four scenarios were analyzed:
• AM peak hour noise without noise barriers• AM peak hour noise without noise barriers
• AM peak peak hour noise with 10 ft. noise barriers
• Evening noise without noise barriers
• Evening noise with 10 ft. noise barriers
33

ResultsE x is t i n g l e v e l C r t . 1 C rt . 2
R e c e i v e r N o B a rr ie r 1 0 fe e t N o B a rr ie r 1 0 fe e t L e s s th a n 6 6 d B A
L e s s th a n 6 6
d B A
O v e r 8 d B A
re d u c t i o n
R 1 5 8 . 8 5 5 . 2 5 2 . 1 5 0 .0 O k O k N o
R 2 5 6 . 4 5 3 . 0 5 1 . 7 5 0 .1 O k O k N o
R 3 5 7 . 1 5 4 . 7 5 0 . 8 4 9 .1 O k O k N o
R 4 5 8 . 2 5 5 . 0 5 3 . 5 5 1 .5 O k O k N o
R 5 5 7 . 9 5 5 . 5 5 1 . 5 5 0 .0 O k O k N o
R 6 5 5 . 7 5 3 . 0 5 1 . 0 5 0 .2 O k O k N o
R 7 6 8 . 2 6 5 . 0 6 2 . 7 6 2 .5 N o O k N o
R 8 7 2 . 3 7 2 . 3 6 6 . 6 6 7 .6 N o N o N o
R 9 7 2 . 3 6 2 . 1 6 7 . 5 5 7 .5 N o O k Y e s
1 0 f t B a rr ie r
N i g h t M o r n i n g P e a k H o u r
N o i s e l e v e l
With out
barrier
With 10ft
barrier
With out
barrier
With 10ft
barrier
R7 65.0 farther away from the Hwy 68.2 65.0 62.7 62.5
R8 65.0 first row 72.3 72.3 66.6 67.6
R9 32.0 first row 72.3 62.1 67.5 57.5
Morning peak
Noise level in dBA
ReceiversHeight from road level in meters
Locations of receivers Night 10 -11 PM
R 9 7 2 . 3 6 2 . 1 6 7 . 5 5 7 .5 N o O k Y e s
34

� Noise from the freeway viaduct affects the high-rise
apartment buildings more significantly than low-rise
buildings
� Noise barriers are not effective for mitigating noise
levels for high-rise buildingslevels for high-rise buildings
� Effect of highway noise during night time is less than
morning peak hour (but annoyance is a separate issue)
35
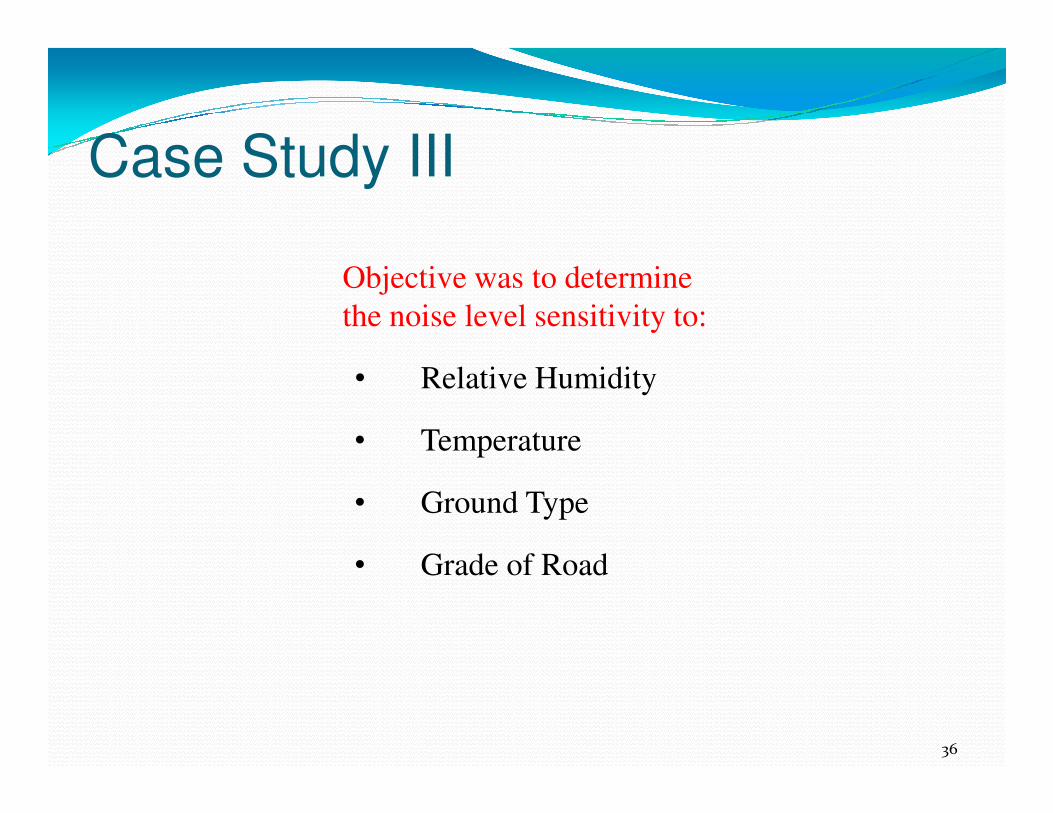
Case Study III
Objective was to determine
the noise level sensitivity to:
• Relative Humidity
• Temperature
• Ground Type
• Grade of Road
36

Different Scenarios
37

Results
Items Change in ParametersChange in Noise Level in
Avg. in dBA
Change in
Temperature 85 to 65°F 0.13
Change in
Re lative Humidity 80 to 60 % 0.01
Change in Lawn to Water 2.27
Change in Ground Nature
Lawn to Water 2.27
Change in Road Grade
3% to Leve l -0 .01
38

References13. Illingworth and Rodkin, Inc., I- 80 Davis OGAC Pavement Noise Study. California
DOT, 2005.
22. Michael, H., Cerjan, J., Leasure, J., Evaluation of the FHWA traffic noise model for
highway traffic prediction. Colorado DOT. 2006.
35. Arnold, L.B., Highway Noise Study Analysis. Virginia DOT, 2001.
39. Pima Freeway Authority, Background and Sound Propagation, Pima Freeway,
Florida, 2005.Florida, 2005.
41. Miller, H., Freeway Noise Barrier Feasibility Study Final Report. District of
Columbia Government. 2001.
43. Nadella, S., Accuracy of a Traffic Noise Model Using Data from Machine Vision
Technology, Transportation Research Record, No 1941, 2005.
50. US DOT Research and Special Programs Administration John A, Volpe National
Transportation Systems Center, TNM, U.S. DOT, 2004.
60. Prevedouros, P.D., Li, Shenghong, and KC, Laxman, Tutorial and Case Studies on
TNM, University of Hawaii at Manoa, May 2009.
39