Overview of the Projections - Bureau of Labor Statistics · Bureau of Labor Statistics. ... a brief...
18
Monthly Labor Review • January 2012 3 Overview of the Projections Overview of projections to 2020 Slow labor force growth and a gross domestic product growth of 3.0 percent annually are projected to result in a gain of 20.5 million jobs between 2010 and 2020; the fastest job growth is projected for industries and occupations related to healthcare and construction, although the construction industry is not expected to regain all the jobs it lost since its annual average peak employment in 2006 Dixie Sommers and James C. Franklin Dixie Sommers is Assistant Commissioner of the Office of Occupational Statistics and Employment Projections, Bureau of Labor Statistics. James C. Franklin is Chief of the Division of Industry Employment Projections in the same office. Email: sommers. [email protected] and franklin. [email protected] T his issue of the Monthly Labor Re- view features the Bureau of Labor Statistics (BLS) 2010–2020 employ- ment projections, providing a detailed pic- ture of the expected size and structure of the U.S. economy in 2020 and the change over the decade. is overview article presents highlights from these projections and sum- marizes results set forth in the four articles that follow. e BLS projections are built on the as- sumption of a full-employment economy in 2020. Given the sharp downturn expe- rienced in the 2007–2009 recession and the subsequent slow recovery, especially in the labor market, the path from 2010 to 2020 is from a relative low point to a robust target year. As discussed in the next section, this situation results in projected rapid growth rates for some measures that reflect recovery from the recession and, with some impor- tant exceptions, growth beyond recovery. Here are some highlights from the 2010– 2020 projections: • e labor force will grow slowly and become much older as the baby-boom generation moves entirely into the 55-years-and-older age group, whose labor force participation rates are sig- nificantly lower. Employment outlook: 2010–2020 • e labor force will continue to become more diverse, with Hispanics making up 18.6 percent of the total by 2020. • Consistent with slow labor force growth and assumptions concerning a full-em- ployment economy in 2020, gross domes- tic product (GDP) is projected to grow by 3.0 percent annually. Productivity growth is projected at an annual rate of 2.0 per- cent, similar to its long-term trend. • Nonfarm payroll employment is pro- jected to increase by 1.4 percent annu- ally, regaining the jobs lost during the 2007–2009 recession and expanding further, to reach 149.5 million by 2020. Total employment, including agriculture and self-employed and unpaid family workers, is projected to increase by 20.5 million over the decade. • e health care and social assistance in- dustry is expected to be the most rapidly growing sector in terms of employment, followed by the construction sector. De- spite rapid growth, the construction sec- tor is not projected to return to its prere- cession peak employment level. • Occupation groups related to health care, personal care services, social ser-
Transcript of Overview of the Projections - Bureau of Labor Statistics · Bureau of Labor Statistics. ... a brief...

Monthly Labor Review • January 2012 3
Overview of the Projections
Overview of projections to 2020Slow labor force growth and a gross domestic product growth of 3.0 percent annually are projected to result in a gain of 20.5 million jobs between 2010 and 2020; the fastest job growth is projectedfor industries and occupations related to healthcare and construction,although the construction industry is not expected to regain all the jobsit lost since its annual average peak employment in 2006
Dixie Sommersand James C. Franklin
Dixie Sommers is Assistant Commissioner of the Office of Occupational Statistics and Employment Projections, Bureau of Labor Statistics. James C. Franklin is Chief of the Division of Industry Employment Projections in the same office. Email: [email protected] and [email protected]
This issue of the Monthly Labor Re-view features the Bureau of Labor Statistics (BLS) 2010–2020 employ-
ment projections, providing a detailed pic-ture of the expected size and structure of the U.S. economy in 2020 and the change over the decade. This overview article presents highlights from these projections and sum-marizes results set forth in the four articles that follow.
The BLS projections are built on the as-sumption of a full-employment economy in 2020. Given the sharp downturn expe-rienced in the 2007–2009 recession and the subsequent slow recovery, especially in the labor market, the path from 2010 to 2020 is from a relative low point to a robust target year. As discussed in the next section, this situation results in projected rapid growth rates for some measures that reflect recovery from the recession and, with some impor-tant exceptions, growth beyond recovery.
Here are some highlights from the 2010–2020 projections:
• The labor force will grow slowly and become much older as the baby-boom generation moves entirely into the 55-years-and-older age group, whose labor force participation rates are sig-nificantly lower.
Employment outlook: 2010–2020
• The labor force will continue to become more diverse, with Hispanics making up 18.6 percent of the total by 2020.
• Consistent with slow labor force growth and assumptions concerning a full-em-ployment economy in 2020, gross domes-tic product (GDP) is projected to grow by 3.0 percent annually. Productivity growth is projected at an annual rate of 2.0 per-cent, similar to its long-term trend.
• Nonfarm payroll employment is pro-jected to increase by 1.4 percent annu-ally, regaining the jobs lost during the 2007–2009 recession and expanding further, to reach 149.5 million by 2020. Total employment, including agriculture and self-employed and unpaid family workers, is projected to increase by 20.5 million over the decade.
• The health care and social assistance in-dustry is expected to be the most rapidly growing sector in terms of employment, followed by the construction sector. De-spite rapid growth, the construction sec-tor is not projected to return to its prere-cession peak employment level.
• Occupation groups related to health care, personal care services, social ser-

Overview of the Projections
4 Monthly Labor Review • January 2012
vices, and construction are expected to be the most rapidly growing; however, office and administrative support occupations are projected to add the largest number of new jobs.
• Employment in the construction and extraction, production, and transportation and material mov-ing occupation groups fell by 10 percent or more from 2006 to 2010. Although all three groups are expected to grow between 2010 and 2020, none is projected to regain its 2006 employment level.
• Occupations in which a master’s degree is typi-cally needed for entry are expected to grow by 21.7 percent, faster than the growth rate for any other education category. Among occupations in which a high school diploma or the equivalent is typically needed for entry, occupations that have appren-ticeships as the typical kind of on-the-job training are projected to be the fastest growing and to have higher pay. These two results are based on the new education and training system introduced with the 2010–2020 projections.1
Since the 1960s, BLS has produced long-term econom-ic and employment projections every other year. These projections are used in career exploration by high school students and their teachers and parents, college students, career changers, and career development and guidance specialists. The projections are the foundation of the BLS Occupational Outlook Handbook, the nation’s most widely used career information resource.2 The projections also are used by state workforce agencies as a starting point for developing state and area projections that, together with the national projections, are widely used by policy-makers and education and training officials to make deci-sions about education and training policy, funding, and program offerings. In addition, other federal agencies, researchers, and academics use the projections to under-stand trends in the economy and labor market.
Because the 2010–2020 projections were prepared as the U.S. economy was emerging from the deepest reces-sion since the 1930s, this article begins with a discussion of the impact of the recession on the projections and a consideration of the way to understand them in the con-text of recession and recovery. The next section presents a brief review of the BLS projection methods. Finally, the article provides an overview of the projection results, summarizing the four subsequent articles in this issue of the Monthly Labor Review.
Interpreting the projections after recession
Because of the uncertainty of shocks and of the state of the business cycle at a 10-year time horizon, long-term models are generally predicated on the assumption that the economy will converge back to long-term trends. In this sense, the recession does not have as much of an in-fluence on the BLS projections as some might expect. The United States has a history of recoveries from recessions, and the BLS assumes that the coming decade will exhibit similar behavior. More fundamentally, the projections as-sume that the U.S. economy will be at or near full employ-ment. Thus, GDP is expected to recover to somewhere near the level of its potential by 2020. But this possibility is not a certainty and therefore presents a risk to the projections. Further, the severity of the 2007–2009 recession can af-fect the interpretation of the projections, particularly the projected growth rates. Both the interpretation problem and risks to the projections are explored next.
Interpreting projected growth rates
Depending upon which industry or occupation is being considered, one should keep in mind that “growth” may mean either recovery growth or growth beyond recovery, or both. The recession affected industry and occupation groups differently: some were severely affected, some mildly so, and others seem not to have been affected at all. Not all industries or occupations are expected to recover completely; others are expected to recover and have continued growth. Industries and occupations that maintained growth through the recession are generally expected to continue to grow. In contrast, industries and occupations with a long-term trend of declining employ-ment that accelerated during the recession may exhibit projected rates of decline that are slower than otherwise expected.
Because levels of many variables are low in 2010 rela-tive to their historical behavior, projected growth rates may appear more robust than they would otherwise be. Users of the 2010–2020 projections should keep this pos-sibility in mind when they take projected employment trends into account in making decisions. For example, consider the projected value of 149.5 million3 for total nonfarm payroll employment, shown in chart 1. From the 2007 peak of 137.6 million, the projected annual growth rate to 2020 is 0.6 percent, while from the 2010 level of 129.8 million, the growth rate to 2020 is 1.4 percent, or more than twice as fast.
For one key sector, construction, growth is expected

Monthly Labor Review • January 2012 5
to be rapid over the next decade, but projected levels for 2020 are generally lower than peaks experienced during 2005 and 2006. Housing starts are expected to increase by 10 percent annually, to 1.5 million units.4 Although this annual growth rate is high, the projection for 2020 housing starts is still more than a half million lower than the peak of 2.1 million units built in 2005. Similarly, construction wage and salary employment is projected to grow at a 2.9-percent annual rate from the 2010 level of 5.5 million to 7.4 million in 2020. (See chart 2.) How-ever, even this employment growth is not sufficient for construction to return to its peak, the 2006 figure of 7.7 million. In contrast, the health care and social assistance major industry sector had wage and salary employment of 14.9 million in 2006 and grew through the recession, to 16.4 million in 2010, a 2.4-percent annual growth rate. This sector is projected to grow by 3.0 percent annually, to a level of 22 million in 2020.
The situation with the construction sector carries over to the occupational projections, as discussed by C. Brett Lockard and Michael Wolf in their article.5 Compar-ing the construction and extraction occupation group with the computer and mathematical occupation group, Lockard and Wolf find that both groups have projected growth of about 22 percent over the decade. The two
groups had dramatically different experiences during the recession, however. Employment in computer and math-ematical occupations grew by 7.0 percent between 2006 and 2010, while the construction and extraction occupa-tions declined nearly 24 percent. (See chart 3.) As a re-sult, the 2010 unemployment rates for these groups were 5.2 percent and 20.1 percent, respectively.6 The strong projected employment growth has a different meaning for each group. In the computer and mathematics group, ro-bust growth is expected to provide opportunities for new workers; in the construction and extraction group, all of the projected rapid growth represents the partial recovery of jobs lost during the recession and the potential reab-sorption of many workers who were displaced.
Risks to the projections
Compiling 10-year projections always involves consider-able uncertainty. All econometric models and analytical frameworks abstract from reality and make simplifying assumptions that may not hold in the future. But, given the severity of the most recent recession and the slowness of recovery to date, BLS recognizes that the current set of projections faces more uncertainty than usual. Among the most uncertain factors are fiscal policy, recovery of the
Millions Millions155
150
145
140
135
130
125
120
115
Total nonfarm payroll employment, 2000–2010 and projected to 2020
2000 2002 2004 2006 2008 2010 2020
Chart 1.
NOTE: BLS does not project specific data for each of the years between 2010 and 2020. Interim years to the 2020 projection point are expressed by a dashed straight line only.
SOURCE: U.S. Bureau of Labor Statistics, Current Employment Statistics (historical data), and Employment Projections Program (2020 data).
155
150
145
140
135
130
125
120
115
0.6-percent annual rate,2007–2020
1.4-percent annual rate,2010–2020
137.6
129.8
149.5
2010–2020
2007–2020
2000–2010

Overview of the Projections
6 Monthly Labor Review • January 2012
Percent of 2006employment
160
150
140
130
120
110
100
90
80
70
60
Employment trends for selected major industry sectors, 2006, 2010, and projected 2020
NOTE: BLS does not project specific data for each of the years between 2010 and 2020. Interim years to the 2020 projection point are expressed by a dashed straight line only.
SOURCE: U.S. Bureau of Labor Statistics, Current Employment Statistics (historical data), and Employment Projections Program (2020 data).
Chart 2.
Percent of 2006employment
2.9-percentannual rate
3.0-percentannual rate
160
150
140
130
120
110
100
90
80
70
602006 2010 2020,
projected
Health care andsocial assistance
Construction
Employment trends in two selected occupation groups, 2006, 2010, and projected 2020 Chart 3.
NOTE: BLS does not project specific data for each of the years between 2010 and 2020. Interim years to the 2020 projection point are expressed by a dashed straight line only.
SOURCE: U.S. Bureau of Labor Statistics, Employment Projections Program.
140
130
120
110
100
90
80
70
60
Percent of 2006employment
Percent of 2006employment
2.0-percentannual rate
2.0-percent annual rate
140
130
120
110
100
90
80
70
60
Computer and mathematical occupations
Construction and extraction occupations
2006 2010 2020, projected

Monthly Labor Review • January 2012 7
housing market, residual effects of the 2007–2009 reces-sion, and the resolution of the sovereign debt crisis in Europe.
Fiscal policy. U.S. fiscal policy covers both tax and spend-ing policies at the federal level. Generally, BLS assumes that the policy enacted at the time of the development of the projections will be in effect during the projection period. However, the Budget Control Act of 2011 made significant reductions in federal government discretion-ary spending over the coming decade without stipulating the details of how the spending cuts will be implemented. These cuts had not yet been decided upon when the BLS 2020 macroeconomic projections were finalized. The course of fiscal policy from 2010 to 2020 presents an in-creased underlying risk to the projections.
Housing market. The timing and magnitude of the housing recovery are uncertain. The recession was precipitated by the financial crisis, which was in turn driven by defaults in the subprime mortgage market. The housing market and the construction industry suffered severely. As the recession unfolded, many additional homeowners were forced into default through the loss of their jobs. Substan-tial home equity declines caused many homeowners to curtail spending as their wealth declined. The low num-ber of private housing starts in both 2009 and 2010—less than 600,000—was unprecedented: from 1959 to 2006, the figure never fell below 1 million. Given the nature of the recession, recovery in the markets for both existing and new homes is critical to overall economic recovery. Although BLS expects eventual recovery in the housing market, the timing and magnitude remain uncertain.
Residual impacts. BLS considers two aspects of the 2007–2009 recession to be sources of risk to the projections: first, the potential for a prolonged recovery, given the nature of the recession; and second, the possibility of a considerable structural change in the labor market. These events are not necessarily exclusive and they may interact.
The depth and financial nature of the last recession give rise to an uncertain expectation of a recovery period that is longer than history otherwise suggests. In a multicountry study of the decade following financial crises that were pre-ceded by a period of credit expansion and leverage, Carmen Reinhart and Vincent Reinhart found that unemployment rates were significantly higher in the decade that followed.7 U.S. data so far bear out this point for the 2007–2009 re-cession. The unemployment rate peaked at 10.0 percent in October 2009, 4 months after the end of the recession, in
June 2009.8 As of December 2011, 30 months following the end of the recession, the unemployment rate was 8.5 percent. (See chart 4.) Over the 74 months from the trough of the 2001 recession in November 2001 to the peak of the cycle in December 2007, the beginning of the most recent recession, unemployment averaged 5.3 percent, with a maximum of 6.3 percent and a minimum of 4.4 percent. Over the 30 months since the end of the last recession in June 2009, through December 2011, unemployment has averaged 9.4 percent, peaked at 10.0, and been as low as 8.5 percent. The long-term unemployed, those unemployed 27 or more weeks, increased to above 40 percent as a per-centage of the unemployed in December 2009 and has re-mained there since, reaching as much as 45.4 percent of the unemployed in April 2010. (See chart 5.) Previously, the high had been 26.0 percent, in June 1983.
In terms of employment loss and recovery, the recent recession was both deep and long. With regard to the re-cessions of 1973, 1981, and 1990, employment recovered to the level it had at the beginning of the recession in 25,9 28, and 31 months, respectively, after the recession began. (See chart 6.)10 As regards the 2001 recession, em-ployment recovered 47 months after the start. In sharp contrast to all these recessions, 4 years since the begin-ning of the 2007–2009 recession employment is about 5 percent below the level it had at the start of the recession.
There is also some debate over whether the slow em-ployment recovery is the result of structural changes in the economy or is due to a slow recovery in cyclical demand.11 In this context, cyclical unemployment refers to a worker’s being laid off by his or her firm because of weak demand, but who expects to go back to work when demand picks up, typically for the same firm, but gener-ally in the same occupation or industry. Structural unem-ployment also may be precipitated by weak demand, but is rooted in some other element that hinders a worker’s ability to return to work as demand revives. For example, recessions may accelerate the adoption of new technolo-gies or practices by firms in their struggle to survive, and those technologies and practices may require fewer workers. Workers who are unemployed for structural reasons will likely face a longer period of unemployment than those who are unemployed for cyclical reasons. To find new employment, the worker who is unemployed for structural reasons may have to consider a new occupation or industry and may need to seek retraining. Recessions produce unemployment from both causes, and the char-acter of the recession may stimulate either or both causes.
Taken together, the data show that the recession of 2007–2009 was unusual in its employment impacts.

Overview of the Projections
8 Monthly Labor Review • January 2012
Unemployment rate, January 2000 to December 2011 Chart 4.
NOTE: Shaded areas denote recessions as determined by the National Bureau of Economic Research.SOURCE: U.S. Bureau of Labor Statistics, Current Population Survey.
2000 2001 2002 2003 2004 2005 2006 2007 2008 2009 2010 2011
12
10
8
6
4
2
0
Percent unemployed
Percent unemployed
2007–2009Recession
4.4 percent
12
10
8
6
4
2
0
2001Recession
6.3 percent
Prerecession expansionaverage, 5.3 percent
Postrecession expansion averagethrough Dec. 2011, 9.4 percent
10.0 percent
8.5 percent
Long-term unemployed as a percentage of total unemployed, January 1960 to December 2011 Chart 5.
50.0
45.0
40.0
35.0
30.0
25.0
20.0
15.0
10.0
5.0
0
Percent of total unemployed
Percent of totalunemployed
June 1983,26.0 percent
NOTE: Shaded areas denote recessions as determined by the National Bureau of Economic Research. SOURCE: U.S. Bureau of Labor Statistics, Current Population Survey.
1960 1963 1966 1969 1972 1975 1978 1981 1984 1987 1990 1993 1996 1999 2002 2005 2008 2011
50.0
45.0
40.0
35.0
30.0
25.0
20.0
15.0
10.0
5.0
0
April 2010,45.4 percent

Monthly Labor Review • January 2012 9
Much discussion has ensued among economists as to the underlying dynamics of the recession and the implica-tions for recovery, including the likelihood of an extended period being required to reduce debt and rebuild the bal-ance sheets of both consumers and businesses, and the extent to which the employment impacts are structural or cyclical. The main concern is that the long-term natural rate of unemployment has increased above expectations. BLS projections are predicated on a natural rate of unem-ployment of about 5.2 percent,12 and although employ-ment is expected to recover, BLS also recognizes that the character of the recent recession creates an underlying risk to the projections.
European sovereign debt crisis. The resolution of the Eu-ropean sovereign debt crisis is uncertain. The global as-pects of the financial crisis and subsequent recession con-tributed directly to the current situation in Europe. The resolution of the debt crisis will require addressing both unresolved political integration issues in the management of a common currency13 and the demographic and politi-cal institutional realities that inhibit economic growth.14 The risk for the U.S. economy is that the situation will deteriorate, creating increased international financial
Indexes of nonfarm payroll employment during five recessions Chart 6.
108
106
104
102
100
98
96
94
92
Index (Starting month = 100)
Index(Starting month = 100)
SOURCE: U.S. Bureau of Labor Statistics, Current Employment Statistics.
0 2 4 6 8 10 12 14 16 18 20 22 24 26 28 30 32 34 36 38 40 42 44 46 48Months from start of recession
108
106
104
102
100
98
96
94
92
1973
Recession end
2007
2001
19901981
End of recession
stress with spillover effects on the U.S. financial markets, reduced European demand for U.S. goods and services, and a general worldwide economic contraction.
BLS projection methods
To produce its long-term projections, BLS begins with projections of the labor force, which then become an input to the next step, the macroeconomic projections. In turn, macroeconomic projections are the starting point for the industry output and employment projections. In the final component, the industry projections are translated to oc-cupational employment projections and replacement rates are applied to generate estimates of replacement needs.15
Projecting the labor force begins with adjusting the resident population projections from the U.S. Census Bureau to the civilian noninstitutional population16—the population concept used in labor force measure-ment—and benchmarking this population to the annual average from the Current Population Survey, in this case for 2010. Time series extrapolation procedures are used to project labor force participation rates. The population and labor force participation rate projections are created for 136 age, gender, and race or ethnicity groups. For
1990
2001
2007–2009
1993
1981Recovery to level
at start of recession

Overview of the Projections
10 Monthly Labor Review • January 2012
each of these groups, the projected participation rates are applied to the projected population and the results are summed across all groups, resulting in the total labor force projection.
The size of the projected labor force serves as a labor supply constraint on economic growth and is therefore an input to the macroeconomic projections. BLS uses a mac-roeconomic model provided by Macroeconomic Advisers, llc, to prepare projections of GDP and its components. The macroeconomic projections also yield projections of total household employment and total nonfarm payroll employment. In addition to producing the labor force projection, BLS develops assumptions and target values for other variables in the model, including the unemploy-ment rate.17
In the industry projections process, estimates of GDP obtained from the macroeconomic projections are disag-gregated into commodity-level demand and entered into an input–output model to derive output by industry. This output is then translated to industry employment on the basis of labor productivity trends.
The BLS National Employment Matrix is used to trans-late industry employment to occupational employment. The matrix is a set of tables, one for each detailed indus-try, depicting the 2010 percent distribution of industry employment by occupation—the staffing pattern—and the 2020 projected staffing patterns developed by BLS staff.18 Projected staffing patterns reflect past trends, as well as expectations regarding changes in occupational usage resulting from changes in technology, business practices, product mixes, and other factors. The 2020 staffing patterns are applied to the 2020 industry employ-ment projections, and the results are summed across in-dustries to produce projected employment by occupation. Replacement rates are developed from age cohort data for each occupation and are applied to derive projected job openings from replacement needs.
The final employment levels for 2010 and 2020 are measures of total employment as a count of jobs, not a count of individual workers. This concept is different from that used by other measures that are familiar to many readers, including the Current Population Survey’s total employment as a count of the number of workers and the BLS Current Employment Statistics’ count of nonfarm payroll jobs.
Overview of the 2010–2020 projections
Each of the four subsequent articles in this issue of the Review presents the results for one of the components of
the BLS projections process. These results are summarized here, starting with the labor force and the macroeconomic projections, followed by the industry output and employ-ment projections, and, finally, the occupational employ-ment projections.
Labor force highlights
Mitra Toossi’s article “Labor force projections to 2020: a more slowly growing workforce”19 presents a picture of the U.S. labor force, one of the driving forces of growth in the economy, continuing to grow over the 2010–2020 decade, although at a slower rate than in past decades. The labor force is projected to grow by 0.7 percent annually, a rate slightly slower than the 0.8-percent growth exhibited in 2000–2010, and to add 10.5 million persons by 2020. (See table 1.) This slower growth results from the combi-nation of two trends: slightly slower growth in the civilian noninstitutional population and a continuing decline in the total labor force participation rate. The labor force is projected to get older, become racially and ethnically more diverse, and show a small increase in women as a share of the total. (See table 2.)
The civilian noninstitutional population grew by 1.1 percent annually between 2000 and 2010, adding 25.3 million people. Over the 2010–2020 period, the civilian noninstitutional population is projected to show an annu-al growth of 1.0 percent and an increase of 25.2 million, reaching a total of 263.0 million in 2020. Toossi describes how growth rates are expected to vary considerably across age and race or ethnicity groups. In particular, the His-panic population is projected to rise rapidly, growing 3.2 percent annually and by 12.4 million people, reflecting immigration and relatively high fertility rates among Hispanics.
The declining total labor force participation rate re-flects the aging of the baby-boomer generation as these 77 million Americans move entirely from the “prime age” for labor force participation to the 55-years-and-older group, with lower participation rates. This effect is some-what offset by rising labor force participation among older workers, a trend that Toossi observes began in the late 1990s. The participation rate for those 55 years and older rose from 32.4 percent in 2000 to 40.2 percent in 2010 and is projected to reach 43.0 percent in 2020. Toossi projects continued declining labor force participation rates for the youngest and the prime age groups. Participation rates for those 16–24 years old are projected to decline by 7.0 percentage points, from 55.2 percent to 48.2 percent; for the prime age group, participation is projected to decline

Monthly Labor Review • January 2012 11
slowly, from 82.2 percent to 81.3 percent.Total participation rates for both men and women are
projected to decline from 2010 to 2020. For both gen-ders, participation rates are projected to decline among the youngest and the prime age groups and to increase among those 55 years and older. Although participa-tion rates for men will fall somewhat faster than those for women, by 2020 men are expected to have a higher overall participation rate (68.2 percent) than women (57.1 percent) and to continue to be the majority of the labor force. Women’s share of the labor force is projected to rise from 46.7 percent in 2010 to 47.0 percent by 2020. La-bor force participation rates are expected to decline for all race groups and for Hispanics.20
As the baby-boomer generation, born between 1946 and 1964, moves entirely into the 55-years-and-older age group by 2020, the labor force in this age group will grow rapidly, by a projected 3.3 percent annually, representing a gain of 11.4 million people. (See table 2.) Labor force growth in the 25-to-54-year-old prime age group, which has the highest labor force participation rates, will be very slow, 0.2 percent annually. The group is expected to add 1.7 million people, as the baby boomers are replaced by members of the “baby bust” generation, born during a period of lower birthrates. The labor force for the young-est age group, those 16 to 24 years old, is projected to decline, falling 1.3 percent annually and by 2.6 million individuals. (See table 2.)
Toossi also projects rapid growth in the Hispanic labor force, by 3.0 percent annually and 7.7 million people, re-flecting the rapid population growth for this group, even though its labor force participation rate is expected to fall slightly. By contrast, the White non-Hispanic labor force is projected to decline slightly, by 0.2 percent annually, or 1.6 million by 2020. Projected annual labor force growth rates for the racial groups are 0.4 percent for Whites, 1.0 percent for Blacks, 2.7 percent for Asians, and 2.5 percent for all other racial groups. (See table 2.)
Macroeconomic highlights
Kathryn J. Byun and Christopher Frey describe the pro-jected macroeconomy for 2020, building on the labor force projections and assumptions and the target variables consistent with a full-employment economy. They project GDP growth averaging 3.0 percent annually between 2010 and 2020, much faster than the 1.6 percent exhibited over the previous decade, during which the United States ex-perienced two recessions, including the severe 2007–2009 downturn. Household employment is projected to grow by 1.1 percent annually, adding 16.8 million workers, to reach 155.9 million by 2020, consistent with the labor force projection and the target unemployment rate of 5.2 percent. Nonfarm payroll employment is projected to grow somewhat faster, at 1.4 percent annually, reaching 149.5 million, a gain of 19.7 million jobs since 2010.21
Key labor force, macroeconomic, output, and employment variables, 2006, 2010, and projected 2020 [Numbers in thousands]
Projections component
Level Change Percent change
2006 2010 Projected 2020 2006–2010 Projected
2010–2020 2006–2010 Projected 2010–2020
Labor force
Civilian noninstitutional population 228,815 237,830 263,009 9,015 25,179 3.9 10.6 Labor force participation rate (percent) 66.2 64.7 62.5 –1.5 –2.2 –2.3 –3.4 Labor force 151,428 153,889 164,360 2,461 10,471 1.6 6.8 Unemployment rate (percent) 4.6 9.6 5.2 5.0 –4.4 108.7 –45.8
Macroeconomic variablesReal gross domestic product (billions of chained 2005 dollars) $12,958 $13,088 $17,513 $130 $4,425 1.0 33.8
Industry outputOutput (gross duplicated output, billions of chained 2005 dollars) $23,625 $23,171 $30,876 –$453 $7,705 –1.9 33.3
Employment (thousands)Household employment 144,427 139,064 155,901 –5,363 16,837 –3.7 12.1 Nonfarm payroll employment 136,086 129,818 149,530 –6,268 19,712 –4.6 15.2
SOURCES: Historical GDP data, Bureau of Economic Analysis; historical labor force and employment data, Bureau of Labor Statistics; historical
industry output estimates, Bureau of Labor Statistics; projected data, Bureau of Labor Statistics.
Table 1.

Overview of the Projections
12 Monthly Labor Review • January 2012
(See table 1.) Labor productivity is projected to grow by 2.0 percent annually, more similar to the long-run histori-cal trend than the faster growth seen in the 2000–2010 decade.
Projected GDP and employment growth figures are consistent with recovery in the housing market, increased consumer confidence, renewed business investment, and expanding exports. At the same time, the economy is fac-ing the challenges of an aging population, rising demand and costs for medical care, and uncertainties surrounding housing and consumer demand.
Byun and Frey caution that the 2010 starting point of the projections is a low point, with GDP, employment, and other factors below historical trends because of the severity of the 2007–2009 recession and the slow recov-ery through 2010. Thus, although the projected growth rates may appear strong, much of the projected growth is regaining ground lost in the recession.
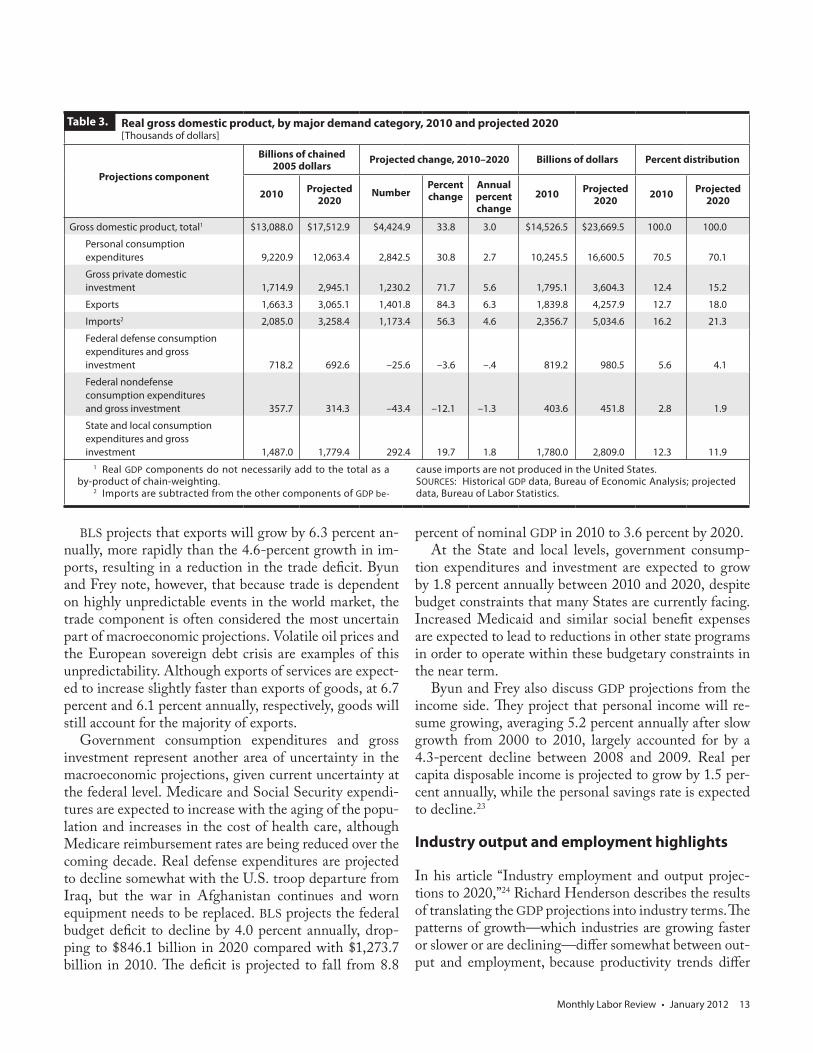
Viewing GDP growth from the demand side, Byun and Frey examine each GDP component. (See table 3.) Personal consumption expenditures (PCE) are by far the
largest demand component, accounting for 70.5 percent of nominal GDP in 2010. Real PCE is projected to grow by 2.7 percent annually over the 2010–2020 decade, compared with 1.9 percent for 2000–2010. Expenditures on durable goods are projected to be the fastest growing component of PCE, rising at a 4.4-percent annual rate, followed by 2.7 percent on services and 2.0 percent on nondurable goods.
Gross private domestic investment is projected to in-crease by 5.6 percent annually, led by residential invest-ment growth, at 7.0 percent annually. Residential invest-ment growth is based on an expected recovery of the housing market, reversing declines during 2000–2010 that resulted from the bursting of the housing bubble.22 Housing investment, key to economic recovery and pro-jected growth, is one of the areas of greatest uncertainty in the 2010–2020 projections. Nonresidential investment is projected to grow at a 5.4-percent annual rate, with stronger growth for equipment and software (6.2 percent) than for nonresidential buildings and other structures (3.2 percent).
Summary of labor force projections, 2010 and projected 2020 [Numbers in thousands]
Projections component
Level Projected change, 2010–2020 Percent distribution
2010Projected
2020 NumberPercent change
Annual percent change
2010Projected
2020
Civilian noninstitutional population 237,830 263,009 25,179 10.6 1.0 ... ...Labor force participation rate (percent) 64.7 62.5 –2.2 –3.4 –.3 ... ...
Labor force (thousands) Total 153,889 164,360 10,471 6.8 .7 100.0 100.0 Age, years
16 to 24 20,934 18,330 –2,604 –12.4 –1.3 13.6 11.2 25 to 54 102,940 104,619 1,679 1.6 .2 66.9 63.7 55 and older 30,014 41,411 11,397 38.0 3.3 19.5 25.2
GenderMen 81,985 87,128 5,143 6.3 .6 53.3 53.0
Women 71,904 77,232 5,328 7.4 .7 46.7 47.0 Race
White 125,084 130,516 5,432 4.3 .4 81.3 79.4 Black 17,862 19,676 1,814 10.2 1.0 11.6 12.0 Asian 7,248 9,430 2,182 30.1 2.7 4.7 5.7 All other groups1 3,694 4,738 1,044 28.3 2.5 2.4 2.9
EthnicityHispanic origin 22,748 30,493 7,745 34.0 3.0 14.8 18.6 Other than Hispanic origin 131,141 133,867 2,726 2.1 .2 85.2 81.4 White non-Hispanic 103,947 102,371 –1,576 –1.5 –.2 67.5 62.3
1 The “all other groups" category includes (1) those classified as being of multiple racial origin and (2) the racial categories of (2a) American Indian and Alaska Native and (2b) Native Hawaiian and Other Pacific Islanders.
NOTE: Details may not sum to totals because of rounding.SOURCE: U.S. Bureau of Labor Statistics.
Table 2.
Monthly Labor Review • January 2012 13
BLS projects that exports will grow by 6.3 percent an-nually, more rapidly than the 4.6-percent growth in im-ports, resulting in a reduction in the trade deficit. Byun and Frey note, however, that because trade is dependent on highly unpredictable events in the world market, the trade component is often considered the most uncertain part of macroeconomic projections. Volatile oil prices and the European sovereign debt crisis are examples of this unpredictability. Although exports of services are expect-ed to increase slightly faster than exports of goods, at 6.7 percent and 6.1 percent annually, respectively, goods will still account for the majority of exports.
Government consumption expenditures and gross investment represent another area of uncertainty in the macroeconomic projections, given current uncertainty at the federal level. Medicare and Social Security expendi-tures are expected to increase with the aging of the popu-lation and increases in the cost of health care, although Medicare reimbursement rates are being reduced over the coming decade. Real defense expenditures are projected to decline somewhat with the U.S. troop departure from Iraq, but the war in Afghanistan continues and worn equipment needs to be replaced. BLS projects the federal budget deficit to decline by 4.0 percent annually, drop-ping to $846.1 billion in 2020 compared with $1,273.7 billion in 2010. The deficit is projected to fall from 8.8
percent of nominal GDP in 2010 to 3.6 percent by 2020. At the State and local levels, government consump-
tion expenditures and investment are expected to grow by 1.8 percent annually between 2010 and 2020, despite budget constraints that many States are currently facing. Increased Medicaid and similar social benefit expenses are expected to lead to reductions in other state programs in order to operate within these budgetary constraints in the near term.
Byun and Frey also discuss GDP projections from the income side. They project that personal income will re-sume growing, averaging 5.2 percent annually after slow growth from 2000 to 2010, largely accounted for by a 4.3-percent decline between 2008 and 2009. Real per capita disposable income is projected to grow by 1.5 per-cent annually, while the personal savings rate is expected to decline.23
Industry output and employment highlights
In his article “Industry employment and output projec-tions to 2020,”24 Richard Henderson describes the results of translating the GDP projections into industry terms. The patterns of growth—which industries are growing faster or slower or are declining—differ somewhat between out-put and employment, because productivity trends differ
Real gross domestic product, by major demand category, 2010 and projected 2020 [Thousands of dollars]
Projections component
Billions of chained 2005 dollars
Projected change, 2010–2020 Billions of dollars Percent distribution
2010 Projected 2020
NumberPercent change
Annual percent change
2010 Projected 2020
2010 Projected 2020
Gross domestic product, total1 $13,088.0 $17,512.9 $4,424.9 33.8 3.0 $14,526.5 $23,669.5 100.0 100.0
Personal consumption expenditures 9,220.9 12,063.4 2,842.5 30.8 2.7 10,245.5 16,600.5 70.5 70.1
Gross private domestic investment 1,714.9 2,945.1 1,230.2 71.7 5.6 1,795.1 3,604.3 12.4 15.2
Exports 1,663.3 3,065.1 1,401.8 84.3 6.3 1,839.8 4,257.9 12.7 18.0
Imports2 2,085.0 3,258.4 1,173.4 56.3 4.6 2,356.7 5,034.6 16.2 21.3
Federal defense consumption expenditures and gross investment 718.2 692.6 –25.6 –3.6 –.4 819.2 980.5 5.6 4.1
Federal nondefense consumption expenditures and gross investment 357.7 314.3 –43.4 –12.1 –1.3 403.6 451.8 2.8 1.9
State and local consumption expenditures and gross investment 1,487.0 1,779.4 292.4 19.7 1.8 1,780.0 2,809.0 12.3 11.9
1 Real GDP components do not necessarily add to the total as a by-product of chain-weighting.
2 Imports are subtracted from the other components of GDP be-
cause imports are not produced in the United States.SOURCES: Historical GDP data, Bureau of Economic Analysis; projected data, Bureau of Labor Statistics.
Table 3.
Overview of the Projections
14 Monthly Labor Review • January 2012
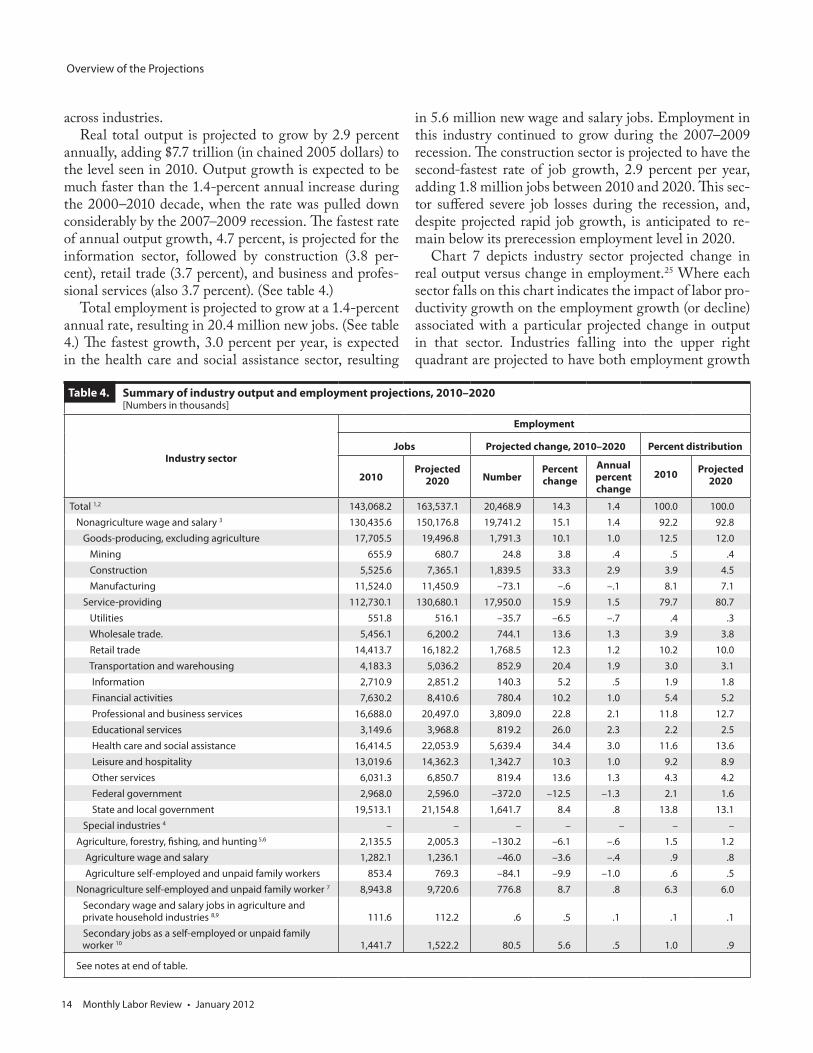
across industries. Real total output is projected to grow by 2.9 percent
annually, adding $7.7 trillion (in chained 2005 dollars) to the level seen in 2010. Output growth is expected to be much faster than the 1.4-percent annual increase during the 2000–2010 decade, when the rate was pulled down considerably by the 2007–2009 recession. The fastest rate of annual output growth, 4.7 percent, is projected for the information sector, followed by construction (3.8 per-cent), retail trade (3.7 percent), and business and profes-sional services (also 3.7 percent). (See table 4.)
Total employment is projected to grow at a 1.4-percent annual rate, resulting in 20.4 million new jobs. (See table 4.) The fastest growth, 3.0 percent per year, is expected in the health care and social assistance sector, resulting
in 5.6 million new wage and salary jobs. Employment in this industry continued to grow during the 2007–2009 recession. The construction sector is projected to have the second-fastest rate of job growth, 2.9 percent per year, adding 1.8 million jobs between 2010 and 2020. This sec-tor suffered severe job losses during the recession, and, despite projected rapid job growth, is anticipated to re-main below its prerecession employment level in 2020.
Chart 7 depicts industry sector projected change in real output versus change in employment.25 Where each sector falls on this chart indicates the impact of labor pro-ductivity growth on the employment growth (or decline) associated with a particular projected change in output in that sector. Industries falling into the upper right quadrant are projected to have both employment growth
Summary of industry output and employment projections, 2010–2020 [Numbers in thousands]
Industry sector
Employment
Jobs Projected change, 2010–2020 Percent distribution
2010Projected
2020 NumberPercent change
Annual percent change
2010 Projected 2020
Total 1,2 143,068.2 163,537.1 20,468.9 14.3 1.4 100.0 100.0 Nonagriculture wage and salary 3 130,435.6 150,176.8 19,741.2 15.1 1.4 92.2 92.8 Goods-producing, excluding agriculture 17,705.5 19,496.8 1,791.3 10.1 1.0 12.5 12.0 Mining 655.9 680.7 24.8 3.8 .4 .5 .4 Construction 5,525.6 7,365.1 1,839.5 33.3 2.9 3.9 4.5 Manufacturing 11,524.0 11,450.9 –73.1 –.6 –.1 8.1 7.1 Service-providing 112,730.1 130,680.1 17,950.0 15.9 1.5 79.7 80.7 Utilities 551.8 516.1 –35.7 –6.5 –.7 .4 .3 Wholesale trade. 5,456.1 6,200.2 744.1 13.6 1.3 3.9 3.8 Retail trade 14,413.7 16,182.2 1,768.5 12.3 1.2 10.2 10.0 Transportation and warehousing 4,183.3 5,036.2 852.9 20.4 1.9 3.0 3.1 Information 2,710.9 2,851.2 140.3 5.2 .5 1.9 1.8 Financial activities 7,630.2 8,410.6 780.4 10.2 1.0 5.4 5.2 Professional and business services 16,688.0 20,497.0 3,809.0 22.8 2.1 11.8 12.7 Educational services 3,149.6 3,968.8 819.2 26.0 2.3 2.2 2.5 Health care and social assistance 16,414.5 22,053.9 5,639.4 34.4 3.0 11.6 13.6 Leisure and hospitality 13,019.6 14,362.3 1,342.7 10.3 1.0 9.2 8.9 Other services 6,031.3 6,850.7 819.4 13.6 1.3 4.3 4.2 Federal government 2,968.0 2,596.0 –372.0 –12.5 –1.3 2.1 1.6 State and local government 19,513.1 21,154.8 1,641.7 8.4 .8 13.8 13.1 Special industries 4 – – – – – – – Agriculture, forestry, fishing, and hunting 5,6 2,135.5 2,005.3 –130.2 –6.1 –.6 1.5 1.2 Agriculture wage and salary 1,282.1 1,236.1 –46.0 –3.6 –.4 .9 .8 Agriculture self-employed and unpaid family workers 853.4 769.3 –84.1 –9.9 –1.0 .6 .5 Nonagriculture self-employed and unpaid family worker 7 8,943.8 9,720.6 776.8 8.7 .8 6.3 6.0 Secondary wage and salary jobs in agriculture and private household industries 8,9 111.6 112.2 .6 .5 .1 .1 .1 Secondary jobs as a self-employed or unpaid family worker 10 1,441.7 1,522.2 80.5 5.6 .5 1.0 .9
See notes at end of table.
Table 4.

Monthly Labor Review • January 2012 15
and output growth. The chart shows a 45-degree line on which projected output and employment growth rates are identical, meaning zero productivity growth.26 Any sec-tor in the upper right quadrant that falls above the line is expected to have positive productivity growth, support-
ing more rapid growth in output than in employment. The farther each sector appears above the 45-degree line, the faster is its projected rate of productivity growth. Any sector in the upper right quadrant that falls below the 45-degree line is projected to have declining productivity,
Continued—Summary of industry output and employment projections, 2010 and projected 2020 [Numbers in thousands]
Industry sector
Output
Billions of chained 2005 dollars
Projected change, 2010–2020
Billions of dollars Percent distribution
2010 Projected 2020
NumberAnnual percent change
2010 Projected 2020
2010 Projected 2020
Total 1,2 23,171.3 30,876.3 7,705.0 2.9 26,273.7 43,000.3 100.0 100.0 Nonagriculture wage and salary 3 22,869.9 30,507.3 7,637.4 2.9 24,632.9 40,332.4 93.8 93.8 Goods-producing, excluding agriculture 5,565.8 7,385.6 1,819.8 2.9 6,390.9 9,769.0 24.3 22.7 Mining 388.1 441.0 52.9 1.3 417.9 641.1 1.6 1.5 Construction 814.7 1,183.3 368.6 3.8 932.5 1,540.2 3.5 3.6 Manufacturing 4,363.0 5,723.3 1,360.3 2.8 5,040.6 7,587.6 19.2 17.6 Service-providing 16,165.8 21,600.5 5,434.7 2.9 18,242.0 30,563.4 69.4 71.1 Utilities 354.2 431.7 77.5 2.0 429.0 644.0 1.6 1.5 Wholesale trade 1,176.4 1,648.9 472.5 3.4 1,213.5 1,836.6 4.6 4.3 Retail trade 1,165.0 1,671.0 506.0 3.7 1,208.1 2,029.3 4.6 4.7 Transportation and warehousing 709.4 977.6 268.2 3.3 820.4 1,365.6 3.1 3.2 Information 1,196.4 1,893.0 696.6 4.7 1,281.2 2,407.4 4.9 5.6 Financial activities 3,329.5 4,568.5 1,239.0 3.2 3,761.4 6,489.4 14.3 15.1 Professional and business services 2,355.0 3,372.1 1,017.1 3.7 2,667.4 5,056.6 10.2 11.8 Educational services 198.5 235.5 37.0 1.7 260.7 387.8 1.0 .9 Health care and social assistance 1,525.9 2,025.9 500.0 2.9 1,763.2 3,145.1 6.7 7.3 Leisure and hospitality 870.2 1,123.9 253.7 2.6 996.4 1,664.6 3.8 3.9 Other services 514.5 652.3 137.8 2.4 591.7 947.5 2.3 2.2 Federal government 1,012.1 938.9 –73.2 –.7 1,158.6 1,345.8 4.4 3.1 State and local government 1,758.6 2,120.4 361.8 1.9 2,090.3 3,243.7 8.0 7.5 Special industries 4 1,138.3 1,521.1 382.8 2.9 1,272.6 2,182.2 4.8 5.1 Agriculture, forestry, fishing, and hunting 5,6 301.4 365.1 63.7 1.9 368.2 485.7 1.4 1.1 Agriculture wage and salary – – – – – – – – Agriculture self-employed and unpaid family workers – – – – – – – – Nonagriculture self-employed and unpaid family workers 7 – – – – – – – – Secondary wage and salary jobs in agriculture and private household industries 8,9 – – – – – – – – Secondary jobs as a self-employed or unpaid family worker 10 – – – – – – – –
1 Output subcategories do not necessarily add to higher categories as a by-product of chain-weighting.
2 Employment data for wage and salary workers are from the BLS Current Employment Statistics survey, which counts jobs, whereas self-employed, unpaid family workers, and agriculture, forestry, fishing, and hunting are from the Current Population Survey (household survey), which counts workers.
3 Includes wage and salary data from the Current Employment Statistics survey, except private households, which is from the Current Populations Survey. Logging workers are excluded.
4 Consists of accounting categories to reconcile the input-output system with NIPA accounts.
5 Includes agriculture, forestry, fishing, and hunting data from the Cur-rent Population Survey, except logging, which is from Current Employment Statistics survey. Government wage and salary workers are excluded.
6 Estimate of output not available separately by employment class.7 Comparable estimate of output growth is not available.8 Due to methodological changes, these data are not comparable to
previously published numbers for these categories of secondary workers.9 Workers who hold a secondary wage and salary job in agricultural
production, forestry, fishing, and private household industries.10 Wage and salary workers who hold a secondary job as a self-
employed or unpaid family worker.NOTE: Dash indicates data not available.
Table 4.

Overview of the Projections
16 Monthly Labor Review • January 2012
resulting in more rapid growth in employment than in output. Any sector falling into the upper left quadrant of the chart is projected to have output growth, but because of productivity growth, employment in that sector is pro-jected to decline.
Ten of the fifteen industry sectors shown in chart 7 fall above the 45-degree line in the upper right quadrant, indicating that their productivity growth is allowing projected output to grow faster than employment but job gains are still expected. Because it has the fastest pro-jected productivity growth, the information sector ap-pears farthest above the line. Real output in this sector is projected to grow at 4.7 percent annually, but projected employment growth is a very slow 0.5 percent per year. Other industry sectors with above-average productivity growth and both output and job gains are retail trade, financial activities, and wholesale trade.
Chart 7 shows two industry sectors falling below the 45-degree line in the upper right quadrant: education services and health care and social assistance. Both in-dustries have projected output growth, but productivity is expected to decline somewhat, resulting in slower growth for output than for employment.
Three industry sectors fall into the upper left quadrant
of chart 7: manufacturing, utilities, and the agriculture sector. These sectors are projected to grow in output, but lose jobs, between 2010 and 2020 because productivity growth is outstripping output growth. Manufacturing real output is projected to grow by 2.8 percent annually, close to the 2.9-percent rate for the overall economy. However, manufacturing employment is projected to continue its long-term decline, although at a very slow rate of 0.1 percent per year, but still resulting in 73,100 fewer jobs than in 2010. The utilities and agriculture sec-tors present a similar picture: utilities are projected to see real output grow by 2.0 percent per year, but a slow 0.7- percent annual rate of job decline, while the agriculture, forestry, fishing, and hunting industry is projected to have 1.9 percent annual growth in output and a 0.6-percent rate of job loss.
Occupational projections
In their article “Occupational employment projections to 2020,”27 C. Brett Lockard and Michael Wolf examine how the overall projected 14.3-percent growth in employ-ment to a full-employment economy will affect occupa-tions. The fastest growth is expected in health care, per-
Projected annual percent change: employment versus output by industry sector, 2010–2020 Chart 7.
Annual average rate of change of output
SOURCE: U.S. Bureau of Labor Statistics.
Educational services
Information
Mining
Financial activities Wholesale
tradeLeisure and hospitality Other
services
Retail trade
Health care and social assistance
Construction
Professional and business
services
Utilities
Agriculture, forestry, fishing, and hunting
Transportation and warehousingManufacturing
-2 -1 0 1 2 3 4 5
5
4
3
2
1
0
-1
-2Annual average rate of change of employment
Annual average rate of change of output

Monthly Labor Review • January 2012 17
sonal care, and community and social service occupations. Lockard and Wolf review each of the 22 major occupation groups and present data on projected job openings result-ing from both employment growth and the need to replace workers who are expected to leave the occupation over the coming decade. Finally, they introduce some results from a new BLS education and training system that depicts (1) the education and work experience in a related occupa-tion typically needed for entry into a given occupation and (2) the postemployment or on-the-job training typically needed to attain competency in a given occupation.
Lockard and Wolf also discuss the impact of the reces-sion on the 22 major occupation groups and show that, for some groups, projected growth from 2010 to 2020 will consist largely of the recovery of jobs lost between 2006 and 2010. (Their analysis is discussed, in part, in the previous section on the impact of the recession on the projections.) Further, employment in three occupa-tion groups—construction and extraction, production, and transportation and material moving occupations—fell by 10 percent or more from 2006 to 2010. Although all three groups are expected to grow between 2010 and 2020, none is expected to regain its 2006 employment level. In contrast, six major groups grew by at least 2.0 percent between 2006 and 2010; all are projected to con-tinue to grow to 2020, and all but one at rates above the 14.3-percent average for all occupations. (See table 5.)
Major occupation groups. Major occupation groups provide a summary view of the impact on occupational demand from industry employment growth and expected changes in the occupational composition of industry staffing patterns.
Employment is projected to grow rapidly, 20.0 percent or more, in 6 major occupation groups, with the fastest growth found in healthcare support occupations (34.5 percent), personal care and service occupations (26.8 per-cent), and healthcare practitioners and technical occupa-tions (25.9 percent). Below-average growth is expected in 10 major groups, with the slowest growth projected for food preparation and serving related occupations (9.8 percent), management occupations (7.0 percent), and production occupations (4.2 percent). One major group—farming, forestry, and fishing occupations—is projected to continue its long-term decline, with a pro-jected 2.0-percent employment decrease.
Projected growth rates tell only part of the story, how-ever, because rapid growth may not result in large num-bers of new jobs if the occupation (or occupation group) is not large to start with. Thus, the office and administrative support occupations group is projected to add the most
new jobs, 2.3 million, but is expected to grow at a below-average rate of 10.3 percent. Other major groups adding the largest numbers of new jobs are healthcare practitioners and technical occupations (2.0 million) and sales and re-lated occupations (1.9 million).
Detailed occupations. Lockard and Wolf find that employ-ment in 657 of the 749 detailed occupations is projected to grow, while 92 occupations are expected to decline. They summarize the projections for detailed occupations through lists showing the most rapidly growing occupa-tions, those adding the most new jobs, those declining most rapidly, and those losing the most jobs. As with the major occupation groups, these lists reflect the changing demand for workers in each occupation, as driven by in-dustry change and the changing occupational composi-tion of industries. Thus, the 30 fastest growing detailed occupations include 10 from either the healthcare practi-tioner and technical occupations group or the healthcare support occupations group, reflecting the rapid growth in demand for health care for the aging population.
The list of the fastest growing occupations also includes eight construction occupations, a result of rapid job gains as the construction industry partially recovers from the 2007–2009 recession. As noted earlier, the construction and extraction occupations group, to which these eight occupations belong, is not projected to regain enough jobs to return to its prerecession employment level.
Among the 30 occupations expected to generate the largest numbers of new jobs, healthcare occupations are prominent. Six of these occupations are in either the healthcare practitioner and technical occupations group or the healthcare support occupations group, including registered nurses, the occupation projected to add the most new jobs. Medical secretaries, an occupation con-centrated in health care industries, appears on this list, as does personal care aides, an occupation that is in demand because of the aging population. The list also includes several large office and administrative support occupa-tions that are employed across many industries and will gain jobs as the economy recovers.
The lists of declining occupations—the 10 fastest de-clining and the 10 losing the most jobs—include 4 unique occupations, that appear on both lists. Five of the occupa-tions listed are for textile, apparel, or furnishings work-ers, concentrated in apparel- and textile-manufacturing industries that are declining rapidly due to increased im-ports, and four are Postal Service occupations. Farmers, ranchers, and other agricultural managers are expected to lose 96,100 jobs, more than any other occupation, as pro-

Overview of the Projections
18 Monthly Labor Review • January 2012
ductivity gains continue to reduce the number of workers needed despite projected output growth in the agriculture sector.
Job openings from replacement needs. In addition to job openings from employment growth, openings will oc-cur because some workers leave the occupation over the decade, either to retire, to leave the labor force for other
reasons, or to move to other occupations. Openings from replacements generally are much larger in number than openings from the creation of new jobs; Lockard and Wolf find that, of the 54.8 million total job openings ex-pected from 2010 to 2020, 61.5 percent are from replace-ment needs and 38.5 percent are from growth. Because of replacement needs, even occupations with projected de-clining employment are expected to have some openings.
[Numbers in thousands]
Matrix code
2010 National Employment Matrix title
Employment Change, 2006–2010 Projected change, 2010–2020 Median
annual wage, May
20102006 2010 Projected2020 Number Percent Number Percent
00–0000 Total, all occupations 150,620.0 143,068.2 163,537.1 –7,551.8 –5.0 20,468.9 14.3 $33,84011–0000 Management occupations 8,771.9 8,776.1 9,391.9 4.2 .0 615.8 7.0 91,44013–0000 Business and financial operations
occupations 6,831.9 6,789.2 7,961.7 –42.7 –.6 1,172.5 17.3 60,67015–0000 Computer and mathematical
occupations. 3,313.2 3,542.8 4,321.1 229.6 6.9 778.3 22.0 73,72017–0000 Architecture and engineering
occupations 2,583.2 2,433.4 2,686.2 –149.8 –5.8 252.8 10.4 70,61019–0000 Life, physical, and social science
occupations 1,172.6 1,228.8 1,419.6 56.2 4.8 190.8 15.5 58,53021–0000 Community and social service
occupations 2,385.5 2,402.7 2,985.0 17.2 .7 582.3 24.2 39,28023–0000 Legal occupations 1,222.2 1,211.9 1,342.9 –10.3 –.8 131.0 10.8 74,58025–0000 Education, training, and library
occupations 9,033.7 9,193.6 10,597.3 159.9 1.8 1,403.7 15.3 45,69027–0000 Arts, design, entertainment, sports,
and media occupations 2,677.0 2,708.5 3,051.0 31.5 1.2 342.5 12.6 42,87029–0000 Healthcare practitioners and
technical occupations 7,197.6 7,799.3 9,819.0 601.7 8.4 2,019.7 25.9 58,49031–0000 Healthcare support occupations 3,723.5 4,190.0 5,633.7 466.5 12.5 1,443.7 34.5 24,76033–0000 Protective service occupations 3,162.9 3,302.5 3,667.0 139.6 4.4 364.5 11.0 36,66035–0000 Food preparation and serving
related occupations 11,352.4 11,150.3 12,242.8 –202.1 –1.8 1,092.5 9.8 18,77037–0000 Building and grounds cleaning and
maintenance occupations 5,744.6 5,498.5 6,162.5 –246.1 –4.3 664.0 12.1 22,49039–0000 Personal care and service
occupations. 4,877.6 4,994.7 6,331.4 117.1 2.4 1,336.6 26.8 20,64041–0000 Sales and related occupations 15,985.4 14,915.6 16,784.7 –1,069.8 –6.7 1,869.1 12.5 24,37043–0000 Office and administrative support
occupations 24,344.0 22,602.5 24,938.2 –1,741.5 –7.2 2,335.7 10.3 30,71045–0000 Farming, fishing, and forestry
occupations 1,037.8 972.1 952.6 –65.7 –6.3 –19.4 –2.0 19,63047–0000 Construction and extraction
occupations 8,294.5 6,328.0 7,735.2 –1,966.5 –23.7 1,407.2 22.2 39,08049–0000 Installation, maintenance, and
repair occupations 5,883.3 5,428.6 6,228.7 –454.7 –7.7 800.2 14.7 40,12051–0000 Production occupations 10,674.6 8,594.4 8,951.2 –2,080.2 –19.5 356.8 4.2 30,33053–0000 Transportation and material
moving occupations 10,350.8 9,004.8 10,333.4 –1,346.0 –13.0 1,328.7 14.8 28,400
SOURCE: C. Brett Lockard and Michael Wolf, “Occupational employment projections to 2020,” this issue, pp. 84–108, table 1.
Table 5. Employment by major occupational groups, 2006, 2010, and projected 2020

Monthly Labor Review • January 2012 19
Lockard and Wolf cite the example of farmers, ranchers, and other agricultural managers, an occupation that is projected to decline in employment yet have 234,500 job openings that are due to replacement needs.
New education, work experience, and on-the-job training information. With the 2010–2020 projections, BLS is introducing a new way of depicting the entry-level edu-cation, experience, and training needed for the various occupations. Each occupation is assigned a level for each of three dimensions: typical education needed for entry into the occupation, work experience in a related occu-pation, and typical on-the-job training. Compared with the old BLS education and training categories, this new system presents a more complete picture of the education, related work experience, and training needed for entry into a given occupation and to become competent in the occupation.28
Lockard and Wolf present the first analysis of employ-ment and projections data for these new categories, begin-ning with employment and projected job openings in each of the eight categories indicating the typical education needed for entry. Note that these data are the sum of em-ployment and job openings for the occupations assigned to
each education category; the data are not counts of work-ers who have the particular level of education attainment.
Occupations assigned to the education category of master’s degree are projected, as a group, to grow by 21.7 percent between 2010 and 2020, faster than any other education category. These occupations, however, make up a small share, 1.5 percent, of projected total employment. (See table 6.)
The slowest growth, 12.2 percent, is projected for occu-pations in which a high school diploma or the equivalent is typically needed for entry. The occupations assigned to this education category account for 42.6 percent of total projected employment.
The new BLS education and training system allows for a fuller understanding of the preparation needed for entry into, and competency in, a given occupation by examin-ing the work experience in related occupations and the on-the-job training, along with education needed. For example, among occupations assigned to the high school education category, those in which apprenticeship is the typical on-the-job training are projected to grow by 22.5 percent over the decade and have higher wages than the high school group as a whole.29 Further analysis will be presented in a forthcoming article in the Review.
Employment and total job openings, by education category, 2010 and projected 2020 and median annual wage, May 2010
[Numbers in thousands]
Typical education needed for entry
EmploymentProjected change,
2010–2020
Job openings due to growth and replacement
needs, 2010–2020
Median Annual wage, May 2010
Number Percent distribution
2010 Projected2020 2010 Projected
2020 Number Percent Number Percent distribution
Total, all occupations 143,068.2 163,537.1 100.0 100.0 20,468.9 14.3 54,787.4 100.0 $33,840Doctoral or professional degree 4,409.7 5,286.3 3.1 3.2 876.6 19.9 1,701.8 3.1 87,500Master's degree 1,986.0 2,417.2 1.4 1.5 431.2 21.7 903.9 1.6 60,240Bachelor's degree 22,171.1 25,827.2 15.5 15.8 3,656.1 16.5 8,562.4 15.6 63,430Associate's degree 7,994.6 9,434.6 5.6 5.8 1,440.0 18.0 2,941.0 5.4 61,590Postsecondary nondegree award 6,524.0 7,624.9 4.6 4.7 1,100.9 16.9 2,389.6 4.4 34,220Some college, no degree 811.6 953.8 .6 .6 142.2 17.5 362.0 .7 44,350High school diploma or equivalent 62,089.6 69,665.7 43.4 42.6 7,576.1 12.2 21,745.9 39.7 34,180Less than high school 37,081.7 42,327.4 25.9 25.9 5,245.7 14.1 16,180.8 29.5 20,070
SOURCE: C. Brett Lockard and Michael Wolf, “Occupational employment projections to 2020,” this issue, pp. 84–108, table 6.
Table 6.
Notes1 See “Employment Projections: Education and Training Assign-
ments” (U.S. Bureau of Labor Statistics, Dec. 6, 2011), http://www.bls.gov/emp/ep_education_training_system.htm.
2 The 2010–2011 Occupational Outlook Handbook appears online at http://www.bls.gov/oco. The forthcoming 2012–2013 edition will
use a new format and provide new search tools. 3 This figure is equivalent to the nonfarm payroll employment mea-
sure published by the BLS Current Employment Statistics program. It includes the wage and salary employment in all industries, less private households and the agricultural sector, but also includes logging.

Overview of the Projections
20 Monthly Labor Review • January 2012
4 See Kathryn J. Byun and Christopher Frey, “The U.S. economy in 2020: recovery in uncertain times,” this issue, pp. 21–42.
5 C.Brett Lockard and Michael Wolf, “Occupational employment projections to 2020,” this issue, pp. 84–108.
6 See “Household data annual averages, table 25, Unemployed persons by occupation and sex” (Bureau of Labor Statistics, Current Population Survey,) ftp://ftp.bls.gov/pub/special.requests/lf/aat25.txt.
7 Carmen Reinhart and Vincent Reinhart, “After the Fall,” NBER working paper 16334 (Cambridge, MA, National Bureau of Eco-nomic Research, September 2010).
8 The National Bureau of Economic Research is the official U.S. arbiter of the beginning and ending dates of recessions. (See “U.S. Business Cycle Expansions and Contractions” (Cambridge, MA, National Bureau of Economic Research, Jan. 6, 2012), http://www.nber.org/cycles/cyclesmain.html.)
9 After the start of the 1973 recession, employment continued to increase for 11 months before beginning to decline. Employment regained its postrecession starting high point 27 months after the recession began, or, alternatively, 16 months from the peak of em-ployment after the recession began.
10 The recession of 1980 is not shown in the chart for reasons of visual clarity. Employment recovered to the level it had at the begin-ning of the 1980 recession 11 months later.
11 See, for example, Christina D. Romer, “Jobless Rate Is Not the New Normal,” The New York Times, Apr. 9, 2011, http://www.nytimes.com/2011/04/10/business/10view.html.
12 See Byun and Frey, “The U.S. economy in 2020: recovery in uncertain times,” for further discussion.
13 See, for example, Austan Goolsbee, “Europe’s Currency Road to Nowhere,” The Wall Street Journal, Nov. 29, 2011, http://online.wsj.com/article/SB10001424052970203611404577046532948487236.html, and Sebastian Mallaby, “Germany Is the Real Win-ner in a Transfer Union,” Council on Foreign Relations, Nov. 25, 2011, http://www.cfr.org/financial-crises/germany-real-winner-transfer-union/p26585.
14 See, for example, Fareed Zakaria, “Europe’s real problem: a lack of growth,” The Washington Post, Oct. 12, 2011, http://www.washingtonpost.com/opinions/europes-real-problem-a-lack-of-growth/2011/10/12/gIQAUKkDgL_story.html.
15 Detailed descriptions of the projection methodology for each of these stages are found at the BLS website, http://www.bls.gov/emp/ep_tech_documentation.htm.
16 The civilian noninstitutional population comprises all persons 16 years and older who are not in the Armed Forces and who are
neither inmates of penal or mental institutions nor residents of sani-tariums or homes for the aged.
17 Values for assumed variables are presented in Byun and Frey, “The U.S. economy in 2020: recovery in uncertain times,” table 1, p. 23. The authors also discuss assumptions and target variables.
18 For most industries, the National Employment Matrix uses data from the Occupational Employment Statistics (OES) survey as the source of the staffing patterns for wage and salary workers. Current Population Survey (CPS) data are used when OES data are not avail-able—for example, for the agriculture production and private house-hold industries. BLS treats self-employed workers and unpaid family workers as industries, using data from the CPS.
19 This issue, pp. 43–64; see especially table 3, pp. 50–51. 20 Ibid. 21 In the macroeconomic model, nonfarm payroll employment is
as defined in the BLS Current Employment Statistics program. In the industry projections component of the BLS Employment Projections program, this definition is adjusted to remove the logging industry and add the private households industry to derive the alternative measure nonagriculture wage and salary employment. Thus, the nonfarm payroll employment projection of 149.5 million in the mac-roeconomic model is different from the projection of 150.2 million presented in the industry output and employment projection results.
22 See Kathryn J. Byun, “The U.S. housing bubble and bust: im-pacts on employment,” Monthly Labor Review, December 2010, pp. 3–17, http://www.bls.gov/opub/mlr/2010/12/art1full.pdf.
23 Byun and Frey, “The U.S. economy in 2020: recovery in uncer-tain times.”
24 This issue, pp. 65–83.25 The government sectors are excluded, because output is measured
in terms of compensation and, under this measure, productivity change is difficult to interpret.
26 The line roughly indicates zero labor productivity in terms of output per job. The BLS projections model, however, uses a more pre-cise measure of labor productivity, namely, output per hour worked.
27 This issue, pp. 84–108.28 See “Employment Projections: Education and Training Assign-
ments” (U.S. Bureau of Labor Statistics, Dec. 6, 2011), http://www.bls.gov/emp/ep_education_training_system.htm.
29 Lockard and Wolf present additional examples as well. For tables of education and training assignments and attainment, as well as more detailed summary data, see “Employment Projections: Education and Training Assignments (U.S. Bureau of Labor Statistics, Dec. 6, 2011), http://www.bls.gov/emp/ep_education_training_system.htm.