Overview of the NTCIR-7 ACLIA Tasks: Advanced Cross-Lingual Information...
15
Proceedings of NTCIR-7 Workshop Meeting, December 16–19, 2008, Tokyo, Japan - 11 - Overview of the NTCIR-7 ACLIA Tasks: Advanced Cross-Lingual Information Access Teruko Mitamura* Eric Nyberg* Hideki Shima* Tsuneaki Kato † Tatsunori Mori ‡ Chin-Yew Lin# Ruihua Song# Chuan-Jie Lin+ Tetsuya Sakai @ Donghong Ji◊ Noriko Kando** *Carnegie Mellon University †Tokyo University ‡Yokohama National University #Microsoft Research Asia +National Taiwan Ocean University @NewsWatch, Inc. ◊Wuhan University **National Institute of Informatics [email protected] Abstract This paper presents an overview of the ACLIA (Advanced Cross-Lingual Information Access) task cluster. The task overview includes: a definition of and motivation for the evaluation; a description of the complex question types evaluated; the document sources and exchange formats selected and/or defined; the official metrics used in evaluating participant runs; the tools and process used to develop the official evaluation topics; summary data regarding the runs submitted; and the results of evaluating the submitted runs with the official metrics. 1. Introduction Current research in QA is moving beyond factoid questions, so there is significant motivation to evaluate more complex questions in order to move the research forward. The Advanced Cross-Lingual Information Access (ACLIA) task cluster is novel in that it evaluates complex cross-lingual question answering (CCLQA) systems (i.e. events, biographies/definitions, and relationships) for the first time. Although the QAC4 task in NTCIR-6 evaluated monolingual QA on complex questions, no formal evaluation has been conducted in cross-lingual QA on complex questions in Asian languages until now. As a central problem in question answering evaluation, the lack of standardization has been pointed out [1], which makes it difficult to compare systems under a certain condition. In NLP research, system design is moving away from monolithic, black box architectures and more towards modular architectural approaches that include an algorithm-independent formulation of the system’s data structures and data flows, so that multiple algorithms implementing a particular function can be evaluated on the same task. Following this analogy, the ACLIA data flow includes a pre-defined schema for representing the inputs and outputs of the document retrieval step, as illustrated in Figure 1. This novel standardization effort made it possible to evaluate cross-lingual information retrieval (CLIR) task called IR4QA (Information Retrieval for Question Answering) in a context of a closely related QA task. During the evaluation, the question text and QA system question analysis results were provided as input to the IR4QA task, which produced retrieval results that were subsequently fed back into the end-to- end QA systems. The modular design and XML interchange format supported by the ACLIA architecture make it possible to perform such embedded evaluations in a straightforward manner. More details regarding the XML interchange schemes and so on can be found on the ACLIA wiki [6]. Figure 1. Data flow in ACLIA task cluster showing how interchangeable data model made inter-system and inter-task collaboration possible. The modular design of this evaluation data flow is motivated by the following goals: a) to make it possible for organizations to contribute component algorithms to an evaluation, even if they cannot field an end-to-end system; b) to make it possible to conduct evaluations on a per-module basis, in order to target metrics and error analysis on important bottlenecks in the end-to-end system; and c) to determine which combination of algorithms works best by combining the results from various modules built by different teams. In order to evaluate many different combinations of systems effectively, human evaluation must be complemented by development of automatic evaluation metrics that
Transcript of Overview of the NTCIR-7 ACLIA Tasks: Advanced Cross-Lingual Information...
Proceedings of NTCIR-7 Workshop Meeting, December 16–19, 2008, Tokyo, Japan
- 11 -
Overview of the NTCIR-7 ACLIA Tasks:
Advanced Cross-Lingual Information Access
Teruko Mitamura* Eric Nyberg* Hideki Shima* Tsuneaki Kato†
Tatsunori Mori‡ Chin-Yew Lin# Ruihua Song# Chuan-Jie Lin+
Tetsuya Sakai@ Donghong Ji◊ Noriko Kando**
*Carnegie Mellon University †Tokyo University ‡Yokohama National University
#Microsoft Research Asia +National Taiwan Ocean University @NewsWatch, Inc.
◊Wuhan University **National Institute of Informatics [email protected]
Abstract This paper presents an overview of the ACLIA
(Advanced Cross-Lingual Information Access) task
cluster. The task overview includes: a definition of and
motivation for the evaluation; a description of the
complex question types evaluated; the document sources
and exchange formats selected and/or defined; the
official metrics used in evaluating participant runs; the
tools and process used to develop the official evaluation
topics; summary data regarding the runs submitted; and
the results of evaluating the submitted runs with the
official metrics.
1. Introduction
Current research in QA is moving beyond factoid
questions, so there is significant motivation to evaluate
more complex questions in order to move the research
forward. The Advanced Cross-Lingual Information
Access (ACLIA) task cluster is novel in that it evaluates
complex cross-lingual question answering (CCLQA)
systems (i.e. events, biographies/definitions, and
relationships) for the first time. Although the QAC4 task
in NTCIR-6 evaluated monolingual QA on complex
questions, no formal evaluation has been conducted in
cross-lingual QA on complex questions in Asian
languages until now.
As a central problem in question answering
evaluation, the lack of standardization has been pointed
out [1], which makes it difficult to compare systems
under a certain condition. In NLP research, system
design is moving away from monolithic, black box
architectures and more towards modular architectural
approaches that include an algorithm-independent
formulation of the system’s data structures and data
flows, so that multiple algorithms implementing a
particular function can be evaluated on the same task.
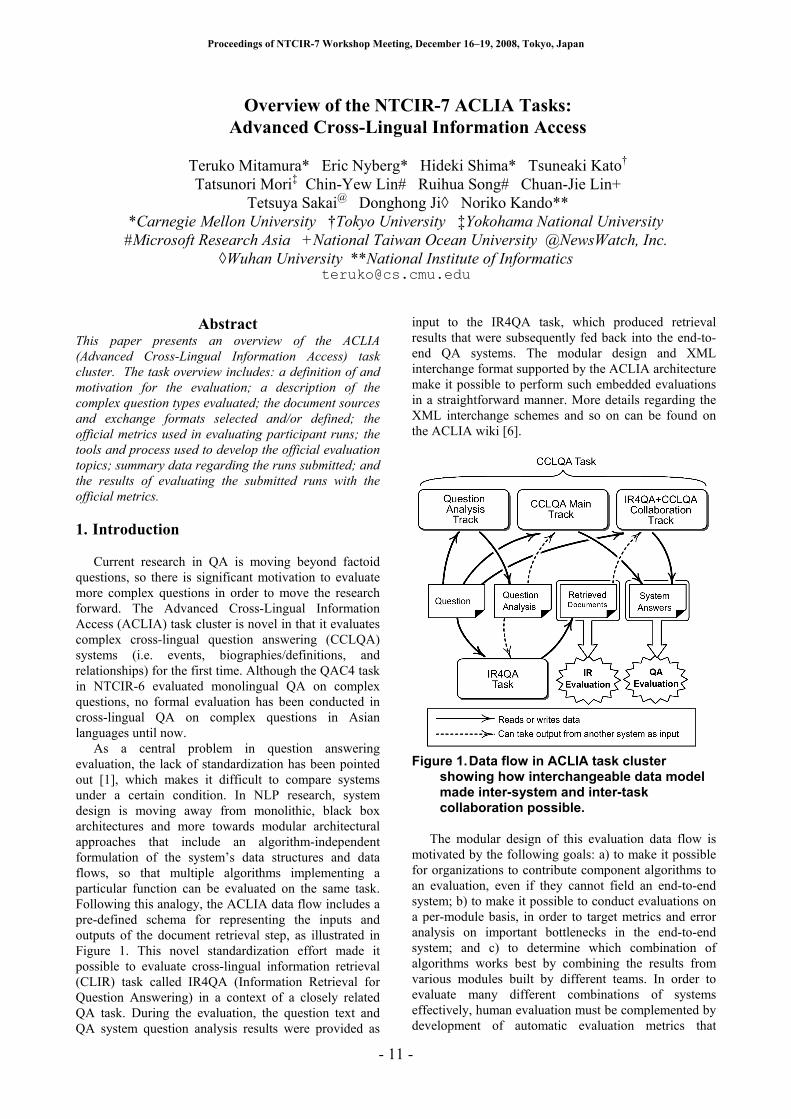
Following this analogy, the ACLIA data flow includes a
pre-defined schema for representing the inputs and
outputs of the document retrieval step, as illustrated in
Figure 1. This novel standardization effort made it
possible to evaluate cross-lingual information retrieval
(CLIR) task called IR4QA (Information Retrieval for
Question Answering) in a context of a closely related
QA task. During the evaluation, the question text and
QA system question analysis results were provided as
input to the IR4QA task, which produced retrieval
results that were subsequently fed back into the end-to-
end QA systems. The modular design and XML
interchange format supported by the ACLIA architecture
make it possible to perform such embedded evaluations
in a straightforward manner. More details regarding the
XML interchange schemes and so on can be found on
the ACLIA wiki [6].
Figure 1. Data flow in ACLIA task cluster
showing how interchangeable data model made inter-system and inter-task collaboration possible.
The modular design of this evaluation data flow is
motivated by the following goals: a) to make it possible
for organizations to contribute component algorithms to
an evaluation, even if they cannot field an end-to-end
system; b) to make it possible to conduct evaluations on
a per-module basis, in order to target metrics and error
analysis on important bottlenecks in the end-to-end
system; and c) to determine which combination of
algorithms works best by combining the results from
various modules built by different teams. In order to
evaluate many different combinations of systems
effectively, human evaluation must be complemented by
development of automatic evaluation metrics that
Proceedings of NTCIR-7 Workshop Meeting, December 16–19, 2008, Tokyo, Japan
- 12 -
correlate well with human judgment. Therefore, we
have developed mechanisms to evaluate the CCLQA
results using automatic evaluation methods.
The CCLQA task included topics developed initially
for the evaluation of monolingual systems, and then
translated to English. Since translation is considered an
important challenge in CCLQA, monolingual QA results
on the same topics and corpora provide an important
baseline for comparison.
The remainder of this paper is structured as follows.
Section 2 describes the specific tasks, topics and corpora
that were used in the ACLIA evaluation, along with a
list of the data interchange formats that were specified to
support the exchange of system inputs and outputs.
Section 3 provides the details of the CCLQA task
definition, and Section 4 provides a detailed explanation
of the evaluation metrics and measures (including both
human measurement and automatic evaluation
techniques). Section 5 provides a brief overview of the
support tools that were built to support topic creation
and nugget evaluation. Section 6 presents the evaluation
results for the participant runs that were submitted.
Section 7 provides further analysis of the evaluation
results; the paper concludes in Section 8.
2. ACLIA Tasks & Runs
ACLIA consisted of two tasks named IR4QA and
CCLQA, which evaluated Information Retrieval and
Question Answering, respectively. The same set of
topics was shared between the two tasks. For details on
the IR4QA task evaluation, we refer the reader to the
IR4QA overview paper [2]. This paper focuses on the
CCLQA task, which evaluated QA systems on complex
questions.
For both tasks, we evaluated monolingual and cross-
lingual topics. Topic languages included English (EN),
Simplified Chinese (CS), Traditional Chinese (CT), and
Japanese (JA); target (corpus) languages included CS,
CT and JA. An active participant (i.e. a participant who
submitted at least one run; hereafter called simply a
participant) submitted a system result for at least one of
six pairings of source language (i.e. language for
questions) and target language (i.e. language for
documents), listed below:
• Cross-lingual: EN-CS, EN-CT, EN-JA • Monolingual: CS-CS, CT-CT, JA-JA
For each track, a participant submitted up to three runs.
For each run, we evaluated the top 50 system responses
for each question. The official run, Run 1, was evaluated
by independent assessors. Unofficial runs 2 and 3 were
evaluated by volunteer assessors, including assessors
from participant teams.
2.1 Evaluation Topics
We focused on the evaluation of four types of
questions: DEFINITION, BIOGRAPHY,
RELATIONSHIP, and EVENT; examples are shown
below.
• DEFINITION o What is the Human Genome Project? o What are stem cells? o What is ASEAN? o What is the Three Gorges project? o What is Falun Gong?
• BIOGRAPHY o Who is Kim Jong-Il? o Who is Alberto Fujimori? o Who is Lee Kuan Yew? o Who is Howard Dean?
• EVENT o List the major events related to controversies
regarding the new Japanese history textbooks. o List major events in Saddam Hussein's life. o List major events in formation of European Union. o List the major conflicts between India and China on
border issues. • RELATIONSHIP
o What is the relationship between Saddam Hussein and Jacques Chirac?
o Does Iraq possess uranium, and if so, where did it come from?
A topic developer created a topic by first generating a
question and a narrative-style information need in the
target language, which were subsequently translated into
English. This approach supported a comparison between
monolingual and cross-lingual QA using the same set of
topics and corpora. A group of volunteers from the
participant group created a set of pilot training topics so
that details of the task definitions could be refined and
finalized. The total number of topics in the training
dataset was 88, 84 and 101 for CS, CT, and JA
respectively.
For the formal evaluation, an independent third-party
organization created 100 topics (20 DEFINITION, 20
BIOGRAPHY, 30 RELATIONSHIP and 30 EVENT)
for each target language. Some of the topics are shared
topics which contain a question originally created for
another target language. An analysis of shared topics is
presented later in Section 7.3.
2.2 Corpus
The target corpus consists of digital newswire articles
(see Table 1). We select newswire articles in the same
time span (ranging from 1998 through 2001) in order to
support the evaluation of shared topics.
Table 1. Corpora used in ACLIA.
Language Corpus Name Time Span # document
CS Xinhua 1998-2001 295,875
Lianhe Zaobao 1998-2001 249,287
CT cirb20 1998-1999 249,508
cirb40 2000-2001 901,446
JA Mainichi 1998-2001 419,759
2.3 Input/Output Format
In order to combine a CLIR module with a CLQA
system for module-based evaluation, we defined five
types of XML schema to support exchange of results
Proceedings of NTCIR-7 Workshop Meeting, December 16–19, 2008, Tokyo, Japan
- 13 -
among participants and submission of results to be
evaluated:
• Topic format: The organizer distributes topics in
this format for formal run input to IR4QA and
CCLQA systems.
• Question Analysis format: CCLQA participants
who chose to share Question Analysis results
submit their data in this format. IR4QA
participants can accept task input in this format.
• IR4QA submission format: IR4QA participants
submit results in this format.
• CCLQA submission format: CCLQA
participants submit results in this format.
• Gold Standard Format: Organizer distributes
CCLQA gold standard data in this format.
For more details regarding each interchange format,
see the corresponding examples on the ACLIA wiki [6].
3. CCLQA Task
Participants in the CCLQA task submitted results for
the following four tracks:
• Question Analysis Track: Question Analysis
results contain key terms and answer types
extracted from the input question. These data are
submitted by CCLQA participants and released to
IR4QA participants.
• CCLQA Main Track: For each topic, a system
returned a list of system responses (i.e. answers
to the question), and human assessors evaluated
them. Participants submitted a maximum of three
runs for each language pair.
• IR4QA+CCLQA Collaboration Track
(obligatory): Using possibly relevant documents
retrieved by the IR4QA participants, a CCLQA
system generated QA results in the same format
used in the main track. Since we encouraged
participants to compare multiple IR4QA results,
we did not restrict the maximum number of
collaboration runs submitted, and used automatic
measures to evaluate the results. In the obligatory
collaboration track, only the top 50 documents
returned by each IR4QA system for each
question were utilized.
• IR4QA+CCLQA Collaboration Track
(optional): This collaboration track was identical
to the obligatory collaboration track, except that
participants were able to use the full list of
IR4QA results available for each question (up to
1000 documents per topic).
In the CCLQA task, there were eight participating
teams (see Table 2), supplemented by an Organizer team
who submitted simple runs for baseline comparison. The
number of submitted runs is shown in Table 3 for the
CCLQA main and Question Analysis tracks, and in
Table 4 for the IR4QA+CCLQA collaboration tracks.
Table 2. CCLQA Task Participants.
Team Name Organization
ATR/NiCT National Institute of Information and Communication Technology
Apath Beijing University of Posts & Telecoms
CMUJAV Language Technologies Institute, Carnegie Mellon University
CSWHU School of Computer Science, Wuhan University
Forst Yokohama National University
IASL Institute of Information Science, Academia Sinica
KECIR Shenyang Institute of Aeronautical Engineering
NTCQA NTT Communication Science Labs
Organizer (baseline)
ACLIA CCLQA Organizer
Table 3. Number of CCLQA runs submitted, followed by number of Question Analysis
submissions in parenthesis. Team Name CS-CS EN-CS CT-CT JA-JA EN-JA
ATR/NiCT 3 3
Apath 2 (1) 1 (1)
CMUJAV 3 (1) 3 (1) 3 (1) 3 (1)
CSWHU 2 (3)
Forst 1 1
IASL 2 3
KECIR 1 (1) 2
NTCQA 2 1
Organizer (baseline) 1 1 1 1
Total by lang pair 14 (6) 10 (2) 3 7 (1) 6 (1)
Total by target lang 24 (8) 3 13 (2)
Table 4. Number of IR4QA+CCLQA Collaboration runs submitted for obligatory
runs followed by optional runs in parenthesis.
Team Name CS-CS EN-CS CT-CT JA-JA EN-JA
ATR/NiCT 6
Apath 2 (2)
CMUJAV 20 (20) 14 (14) 14 (14) 11 (11)
Forst 11
KECIR (20) (18)
NTCQA (14)
Total by lang pair 22 (42) 20 (32) 0 14 (28) 22 (11)
Total by target lang 42 (74) 0 36 (39)
3.1 . Answer Key Creation
In order to build an answer key for evaluation, third
party assessors created a set of weighted nuggets for
each topic. A "nugget" is defined as the minimum unit
of correct information that satisfies the information need.
In the rest of this section, we will describe steps taken to
create the answer key data.
3.1.1 . Answer-bearing Sentence Extraction
A nugget creator searches for documents that may
satisfy the information need, using a search engine.
During this process, a developer tries different queries
that are not necessarily based on the key terms in the
Proceedings of NTCIR-7 Workshop Meeting, December 16–19, 2008, Tokyo, Japan
- 14 -
question text. Whenever a developer finds an answer-
bearing sentence or paragraph, it is saved with the
corresponding document ID.
3.1.2 . Nugget Extraction
A nugget creator extracts nuggets from a set of
answer-bearing sentences. In some cases, multiple
answer-bearing sentences map to one nugget because
they represent the same meaning, even though the
surface text is different. In other cases, multiple nuggets
are extracted from a single answer-bearing sentence.
A comparison of character length is shown in Table 5,
which compares the average length for all answer-
bearing sentences and nuggets in the formal dataset. The
average value for nugget length is incorporated as a
parameter in the evaluation model described in Section 4.
Table 5. Micro-average character length statistics.
Language Answer-bearing
Sentence Nugget
CS 46.0 18.3
CT 51.4 26.8
JA 72.7 24.2
3.1.3 . Nugget Voting
After nuggets are extracted, we wish to assign
weights ranging from 0 to 1 to each nugget in order to
model its importance in answering the information need.
In earlier TREC evaluations, assessors made binary
decisions as to whether a nugget is vital (contains
information to satisfy the information need) or ok. More
recently, TREC introduced a pyramid nugget evaluation
inspired by research in text summarization. In a pyramid
evaluation, multiple assessors make a vital/ok decision
for each nugget, and weights are assigned according to
the proportion of vital scores assigned [3].
We adapted the pyramid nugget voting method for
the ACLIA evaluation. For each language, there were
three independent assessors who voted on answer
nuggets. Inter-assessor agreement was measured via
Cohen’s Kappa statistic, as shown in Table 6. The
observed measurements suggest that it would be risky to
rely on votes from a single assessor; in this evaluation,
each nugget was assessed by all three assessors.
Table 6. Inter-assessor agreement on vital/non-vital judgments on nuggets, measured by
Cohen’s Kappa.
Language Inter-assessor
agreement
CS 0.537
CT 0.491
JA 0.529
We also compared the total number of nuggets and
their average character length and weight over the set of
topics (see Table 7). Nuggets in JA topics have (12.8-
7.6)/7.6 = 70% more nuggets on average than CS topics.
Among the four topic types, nuggets for BIOGRAPHY
topics have the shortest length on average for all target
languages. Average nugget weight is much lower for JA
(0.57) than for CS (0.85) and CT (0.86).
Table 7. Macro-average nugget statistics over topics.
Lang Answer Type
Avg # Avg Char Length
Avg Weight
CS
DEF 4.3 26.4 0.91
BIO 6.0 8.3 0.87
REL 6.6 15.6 0.84
EVE 11.9 21.4 0.82
Overall 7.6 18.0 0.85
CT
DEF 8.3 27.9 0.80
BIO 18.1 16.5 0.87
REL 6.0 23.5 0.91
EVE 14.4 36.8 0.85
Overall 11.4 27.0 0.86
JA
DEF 10.4 18.9 0.59
BIO 15.5 15.5 0.54
REL 10.8 24.6 0.53
EVE 14.4 32.3 0.61
Overall 12.8 23.9 0.57
4. Evaluation Metrics
In this section, we present the evaluation framework
used in ACLIA, which is based on weighted nuggets. To
avoid the potential ambiguity of the word “answer” (i.e.
as in “system answer” and “correct answer”), we use the
term system responses or SRs to denote the output from
a CCLQA system given a topic. The term gold standard
denotes a piece of information that satisfies the
information need.
Both human-in-the-loop evaluation and automatic
evaluation were conducted using the same topics and
metrics. The primary difference is in the step where
nuggets in system responses are matched with gold
standard nuggets. During human assessment, this step is
performed manually by human assessors, who judge
whether each system response nugget matches a gold
standard nugget. In automatic evaluation, this decision is
made automatically. The subsections that follow, we
detail the differences between these two styles of
evaluation.
4.1 . Human-in-the-loop Evaluation Metrics
In CCLQA, we evaluate how good a QA system is at
returning answers that satisfy information needs on
average, given a set of natural language questions.
In an earlier related task, NTCIR-6 QAC-4 [10], each
system response was assigned to one of four levels of
correctness (i.e. A, B, C, D); in practice, it was difficult
for assessors to reliably assign system responses to four
different levels of correctness. For CCLQA, we adopt
the nugget pyramid evaluation method [3] for evaluating
CCLQA results, which requires only that human
assessors make a binary decision whether a system
response matches a gold standard vital or ok nugget.
This method was used in the TREC 2005 QA track for
Proceedings of NTCIR-7 Workshop Meeting, December 16–19, 2008, Tokyo, Japan
- 15 -
evaluating definition questions, and in the TREC 2006-
2007 QA tracks for evaluating "other" questions.
A set of system responses to a question will be
assigned an F-score calculated as shown in Figure 2. We
evaluate each submitted run by calculating the macro-
average F-score over all questions in the formal run
dataset.
In the TREC evaluations, a character allowance
parameter C is set to 100 non-whitespace characters for
English [4]. We adjusted the C value to fit our dataset
and languages. Based on the micro-average character
length of the nuggets in the formal run dataset (see
Table 5), we derived settings of C=18 for CS, C=27 for
CT and C=24 for JA.
Let
r sum of weights over matched nuggets
R sum of weights over all nuggets
HUMANa # of nuggets matched in SRs by
human
L total character-length of SRs
C character allowance per match
allowanc
e CaHUMAN ×
Then
recall R
r=
precision
<
=otherwise
if1
L
allowance
allowanceL
)(βF recallprecision
recallprecision
+×××+
=2
2 )1(
ββ
Figure 2. Official per-topic F-score definition based on nugget pyramid method.
Note that precision is an approximation, imposing a
simple length penalty on the SR. This is due to
Voorhees’ observation that "nugget precision is much
more difficult to compute since there is no effective way
of enumerating all the concepts in a response" [5]. The
precision is a length-based approximation with a value
of 1 as long as the total system response length per
question is less than the allowance, i.e. C times the
number of nuggets defined for a topic. If the total length
exceeds the allowance, the score is penalized. Therefore,
although there is no limit on the number of SRs
submitted for a question, a long list of SRs harms the
final F score.
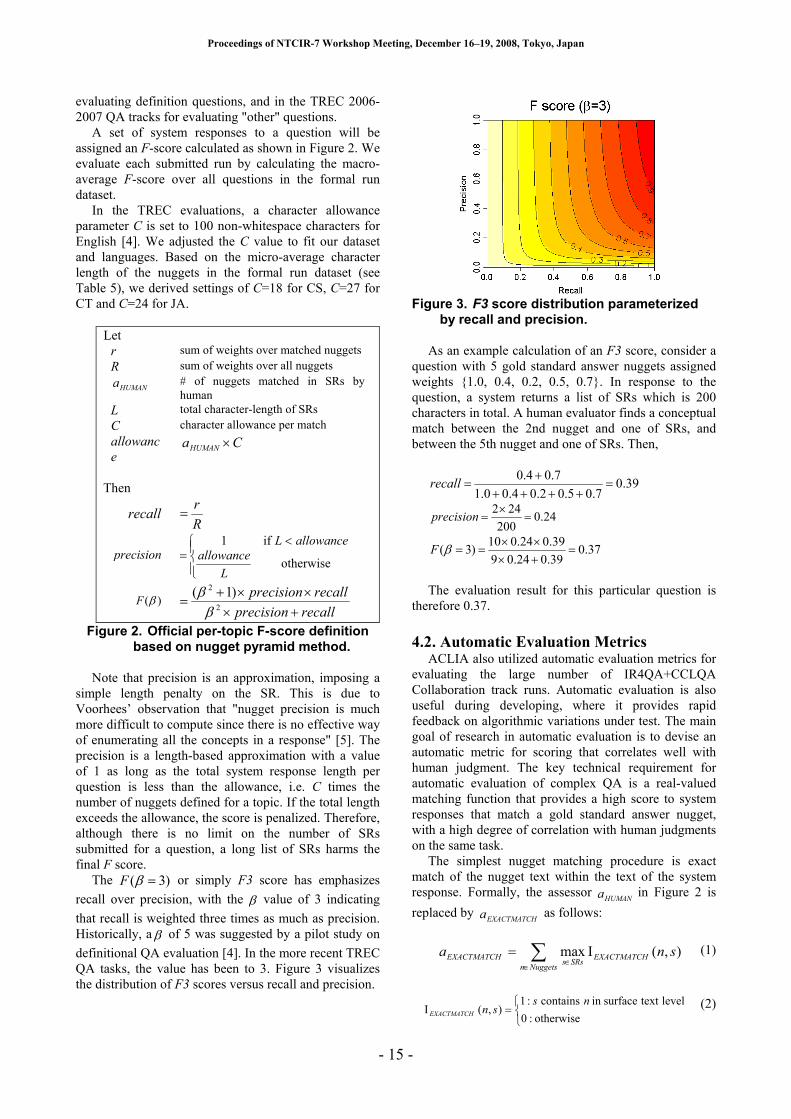
The )3( =βF or simply F3 score has emphasizes
recall over precision, with the β value of 3 indicating that recall is weighted three times as much as precision.
Historically, a β of 5 was suggested by a pilot study on definitional QA evaluation [4]. In the more recent TREC
QA tasks, the value has been to 3. Figure 3 visualizes
the distribution of F3 scores versus recall and precision.
Figure 3. F3 score distribution parameterized
by recall and precision.
As an example calculation of an F3 score, consider a
question with 5 gold standard answer nuggets assigned
weights {1.0, 0.4, 0.2, 0.5, 0.7}. In response to the
question, a system returns a list of SRs which is 200
characters in total. A human evaluator finds a conceptual
match between the 2nd nugget and one of SRs, and
between the 5th nugget and one of SRs. Then,
39.07.05.02.04.00.1
7.04.0=
+++++
=recall
24.0200
242=
×=precision
37.039.024.09
39.024.010)3( =
+×××
==βF
The evaluation result for this particular question is
therefore 0.37.
4.2 . Automatic Evaluation Metrics ACLIA also utilized automatic evaluation metrics for
evaluating the large number of IR4QA+CCLQA
Collaboration track runs. Automatic evaluation is also
useful during developing, where it provides rapid
feedback on algorithmic variations under test. The main
goal of research in automatic evaluation is to devise an
automatic metric for scoring that correlates well with
human judgment. The key technical requirement for
automatic evaluation of complex QA is a real-valued
matching function that provides a high score to system
responses that match a gold standard answer nugget,
with a high degree of correlation with human judgments
on the same task.
The simplest nugget matching procedure is exact
match of the nugget text within the text of the system
response. Formally, the assessor HUMANa in Figure 2 is
replaced by EXACTMATCHa as follows:
),(Imax sna EXACTMATCH
NuggetsnSRss
EXACTMATCH ∑∈
∈= (1)
=otherwise:0
level text surfacein contains:1),(I
nssnEXACTMATCH
(2)
Proceedings of NTCIR-7 Workshop Meeting, December 16–19, 2008, Tokyo, Japan
- 16 -
Although exact string match (or matching with
simple regular expressions) works well for automatic
evaluation of factoid QA, this model does not work well
for complex QA, since nuggets are not exact texts
extracted from the corpus text; the matching between
nuggets and system responses requires a degree of
understanding that cannot be approximated by a string
or regular expression match for all acceptable system
responses, even for a single corpus.
For the evaluation of complex questions in the TREC
QA track, Lin and Demner-Fushman [8] devised an
automatic evaluation metric called POURPRE by
replacing HUMANa with an automatically generated value
based on nugget recall:
),(llNuggetRecamax token snaNuggetsn
SRssSOFTMATCH ∑
∈∈
= (3)
|)tokenize(|
|)(tokenize)tokenize(|),(llNuggetReca token
n
snsn
∩= (4)
Since the TREC target language was English, the
evaluation procedure simply tokenized answer texts into
individual words as the smallest units of meaning for
token matching. In contrast, the ACLIA evaluation
metric tokenized Japanese and Chinese texts into
character unigrams. We did not extract word-based
unigrams since automatic segmentation of CS, CT and
JA texts is non-trivial; these languages lack white space
and there are no general rules for comprehensive word
segmentation. Since a single character in these
languages can bear a distinct unit of meaning, we chose
to segment texts into character unigrams, a strategy that
has been followed for other NLP tasks in Asian
languages (e.g. Named Entity Recognition [9]).
One of disadvantages of POUPRE is that it gives a
partial score to a system response if it has at least one
common token with any one of the nuggets. To avoid
over-estimating the score via aggregation of many such
partial scores, we devised a novel metric by mapping the
POURPRE soft match score values into binary values:
),(Imax θ snaNuggetsn
SRssBINARIZED ∑
∈∈
= (5)
>
=otherwise:0
),(llNuggetReca:1),(I
token
θ
θsnsn (6)
We set the threshold θ to be somewhere in between no match and an exact match, i.e. 0.5, and we used this
BINARIZED metric as our official automatic evaluation
metric for ACLIA. In Section 7.1, we provide further
comparison of automatic evaluation scores with human
assessor scores, for the three nugget matching
algorithms introduced in this section.
5. Evaluation Tools To support the creation of test and evaluation topics,
as well as the sharing of system and module I/O using
XML interchange formats, we created the Evaluation
Package for ACLIA and NTCIR (EPAN). The EPAN
toolkit contains a web interface, a set of utilities and a
backend database for persistent storage of evaluation
topics, gold standard nuggets, submitted runs, and
evaluation results for training and formal run datasets.
5.1 . Topic Creation Tools The EPAN topic creation tools consist of interfaces
for topic development, nugget extraction and nugget
voting using the pyramid method. These three activities
are described in the subsections that follow.
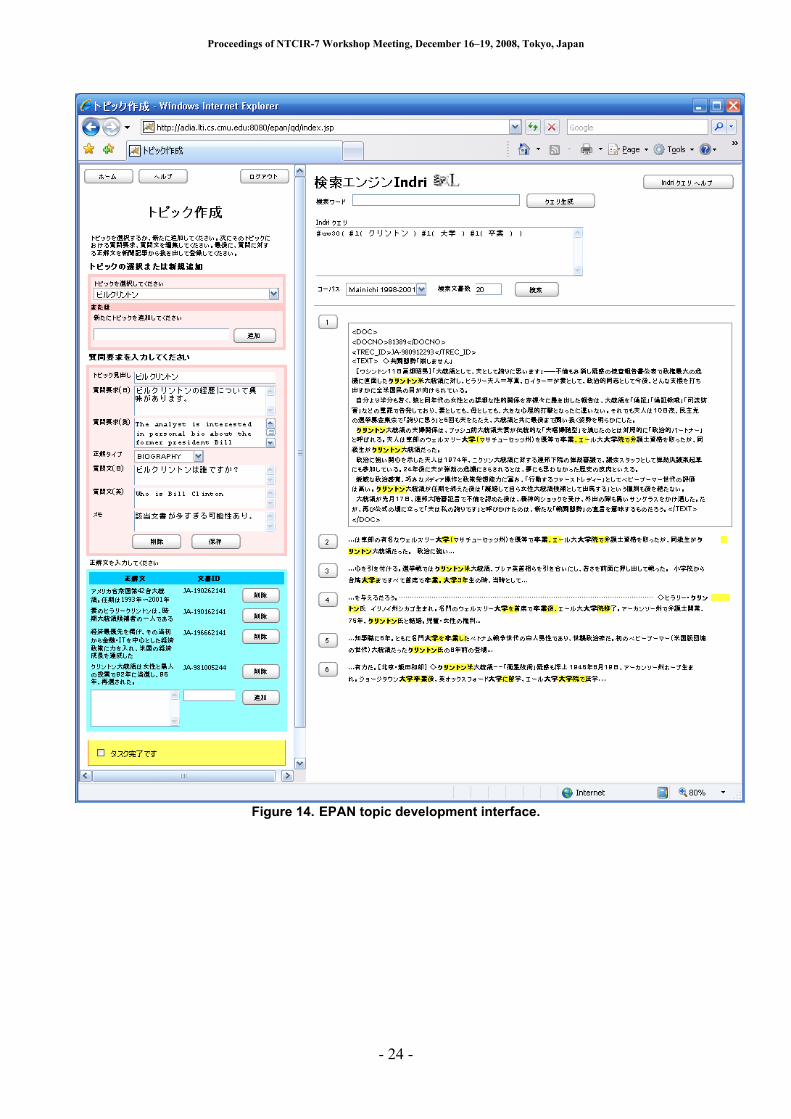
5.1.1 . Topic Development Figure 14 shows the topic development interface.
The left side is the topic creation form, and the right side
is an interface to the Lemur/Indri search engine [7],
which is used by the topic developer to search for
documents relevant to each topic. Topic developers
follow these steps:
1. If the developer wishes to modify an existing topic,
they can select a topic title from a pull-down list.
Topics marked [x] are completed topics. If the
developer wishes to start creating a new topic, they
can type in the corresponding data and click the
“Add” button.
2. Once the developer has created a topic, then they
can provide additional information related to the
topic: an associated question, a question type, a
scenario describing the information need, and a
memo containing any extra notes about the topic.
3. In order to search for documents relevant to the
topic being created, the developer may directly
enter an Indri query, or enter key terms and use the
“Generate Query” button to generate an Indri query
automatically. When the use is satisfied with the
query, it is sent to the Indri retrieval engine.
4. A ranked list of retrieved documents is displayed.
The developer can click on a rank number to
browse the corresponding full document. When the
developer selects a passage which satisfies the
information need, the corresponding information is
automatically copied into the “Answer Text” and
“Doc ID” fields in the Answer data section. The
characteristics of the answer-bearing sentences
extracted during the ACLIA evaluation are
summarized in Section 3.1.1.
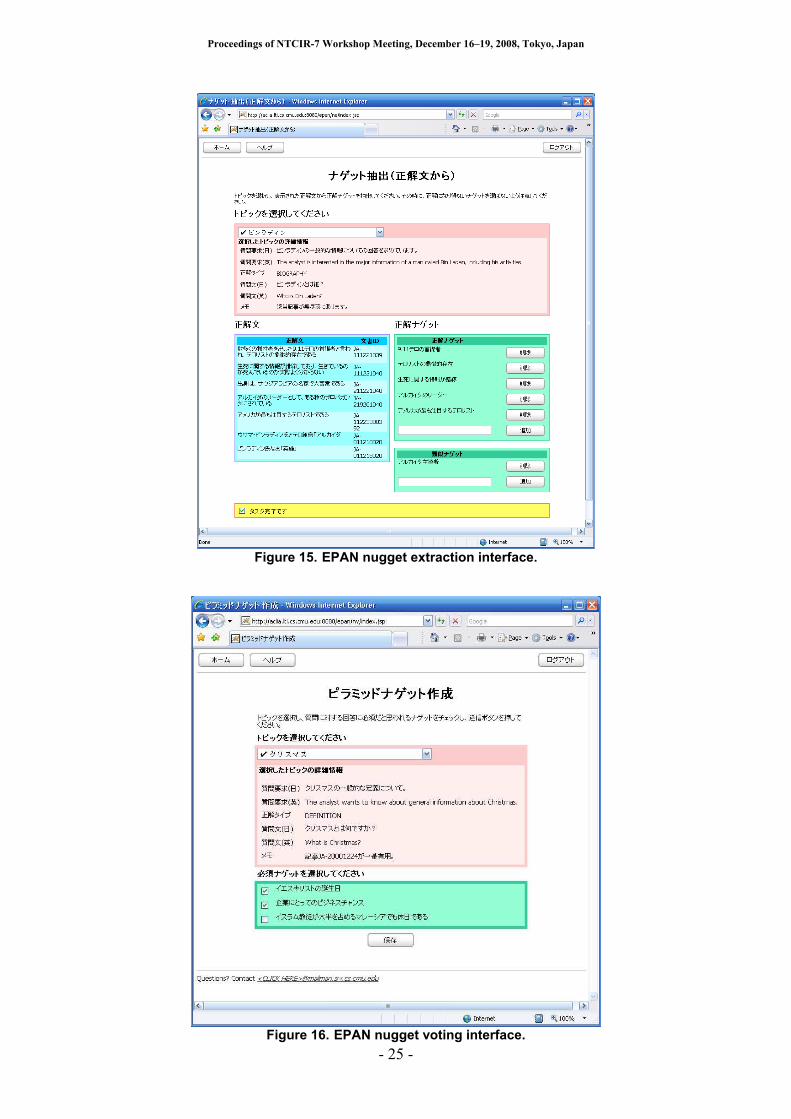
5.1.2 . Nugget Extraction from Answer Text
Figure 15 shows the nugget extraction interface,
which is used to extract nuggets from answer-bearing
sentences. (See details in Section 3.1.2)
The user selects a topic title from a list of previously
completed topics in the Topic Development task. The
user examines the topic data for the selected topic and
Proceedings of NTCIR-7 Workshop Meeting, December 16–19, 2008, Tokyo, Japan
- 17 -
the answer texts for the selected topic. The users type in
the corresponding answer nugget and click “Add” to
save the update.
5.1.3 . Nugget Voting for Pyramid Method
Figure 16 shows the nugget voting interface, which is
used to identify vital nuggets from among the set of
nuggets extracted using the nugget extraction tool. (See
details in Section 3.1.3).
The user first selects a topic title from a list of
previously completed titles in the Topic Development
task. The user examines the topic data for the selected
topic, and toggles the check boxes next to nuggets which
they judge to be vital.
5.2 . Download and Submission
EPAN is used by each participant to upload their
submission file for each run submitted. EPAN is also
used to download intermediate results submitted by
other participants, as part of an embedded evaluation,
For example, ACLIA participants were able to
download the results from Question Analysis and
IR4QA in order to conduct an embedded CLIR
evaluation.
5.3 . Evaluation
EPAN provides interfaces for supporting the core
human-in-the-loop part of evaluation: relevance
judgment for IR4QA and nugget matching for CCLQA.
In each task, items to be evaluated belong to a pool
created by aggregating the system responses from all
systems, based on run priority. For the three runs
submitted by each team in each ACLIA task, we created
three pools of system responses. For the CCLQA task,
the first pool (corresponding to run 1) was evaluated by
independent third-party assessors hired by NII. The
second and third pools (corresponding to runs 2 and 3)
were evaluated by volunteers including members of the
participant teams. Details of the CCLQA results are
provided in Section 6.1. For the embedded IR4QA
collaboration track, the system responses were evaluated
automatically; details are provided in Section 6.2.
6. Evaluation Results In this section, we will present official evaluation
results for the CCLQA main track, IR4QA collaboration
track, and Question Analysis track.
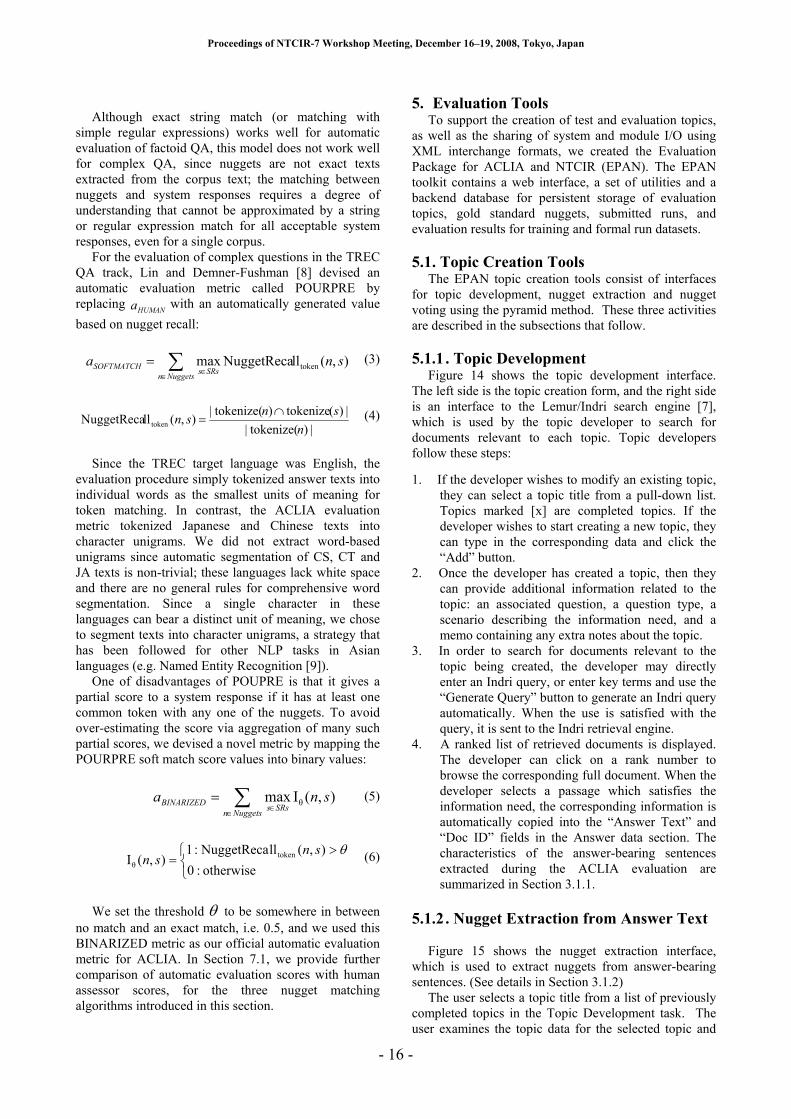
6.1 . CCLQA Main Track
The official human evaluation results for CCLQA are
shown in Table 8 through Table 12 for each language
pair. Runs in Tables 13 through 17 were judged by
volunteers including members of participant teams. We
evaluated up to 50 system responses per run per
question.
Organizer runs are generated from a sentence
extraction baseline system, sharing the same architecture
as CMUJAV but with a minimally implemented
algorithm that does not take into account answer types.
The run has been motivated by the SENT-BASE
algorithm introduced in TREC 2003 definition subtask
as a baseline [4] that worked surprisingly well, i.e.
ranked 2nd out of 16 runs. In the question analysis stage,
the system translates the entire question string with
Google Translate for crosslingual runs. Then, the system
extracts all noun phrases as key terms. Subsequently in
the retrieval stage, the system retrieves documents with
Indri’s simplest query form, “#combine()”. Finally, in
the extraction phrase, starting from the highest ranked
document, the baseline system selects sentences that
contain one of the key terms, until a maximum of 50
system responses have been gathered.
6.1.1 Official Runs
Table 8. EN-CS official human evaluation. EN-CS Runs DEF BIO REL EVE ALL
ATR/NiCT-EN-CS-01-T 0.2216 0.3158 0.2335 0.1454 0.2211
CMUJAV-EN-CS-01-T 0.2129 0.2678 0.1884 0.1346 0.1930
KECIR-EN-CS-01-T 0.2493 0.2563 0.1584 0.1364 0.1895
Apath-EN-CS-01-T 0.1694 0.1165 0.1188 0.0706 0.1140
Organizer-EN-CS-01-T 0.1358 0.1417 0.1052 0.0793 0.1108
Table 9. CS-CS official human evaluation.
CS-CS Runs DEF BIO REL EVE ALL
CSWHU-CS-CS-01-T 0.4752 0.6012 0.4592 0.2662 0.4329
ATR/NiCT-CS-CS-01-T 0.2415 0.3376 0.2429 0.1430 0.2316
IASL-CS-CS-01-T 0.1536 0.3245 0.2548 0.1043 0.2034
CMUJAV-CS-CS-01-T 0.2326 0.2498 0.2321 0.1219 0.2027
Apath-CS-CS-01-T 0.1800 0.1662 0.2067 0.1298 0.1702
Organizer-CS-CS-01-T 0.1360 0.1248 0.1101 0.0640 0.1044
Table 10. CT-CT official human evaluation.
CT-CT Runs DEF BIO REL EVE ALL
IASL-CT-CT-01-T 0.3020 0.4075 0.2509 0.1650 0.2666
Table 11. EN-JA official human evaluation.
EN-JA Runs DEF BIO REL EVE ALL
CMUJAV-EN-JA-01-T 0.3772 0.1250 0.1641 0.0433 0.1627
Organizer-EN-JA-01-T 0.1938 0.1187 0.1253 0.0439 0.1133
Forst-EN-JA-01-T 0.1785 0.1403 0.1103 0.0516 0.1123
NTCQA-EN-JA-01-T 0.1699 0.0932 0.0476 0.0023 0.0676
Table 12. JA-JA official human evaluation.
JA-JA Runs DEF BIO REL EVE ALL
CMUJAV-JA-JA-01-T 0.4201 0.1900 0.2332 0.0937 0.2201
NTCQA-JA-JA-01-T 0.2888 0.1788 0.2209 0.0915 0.1873
Organizer-JA-JA-01-T 0.2537 0.1527 0.1458 0.0916 0.1525
Forst-JA-JA-01-T 0.2313 0.1598 0.1161 0.0786 0.1366
Proceedings of NTCIR-7 Workshop Meeting, December 16–19, 2008, Tokyo, Japan
- 18 -
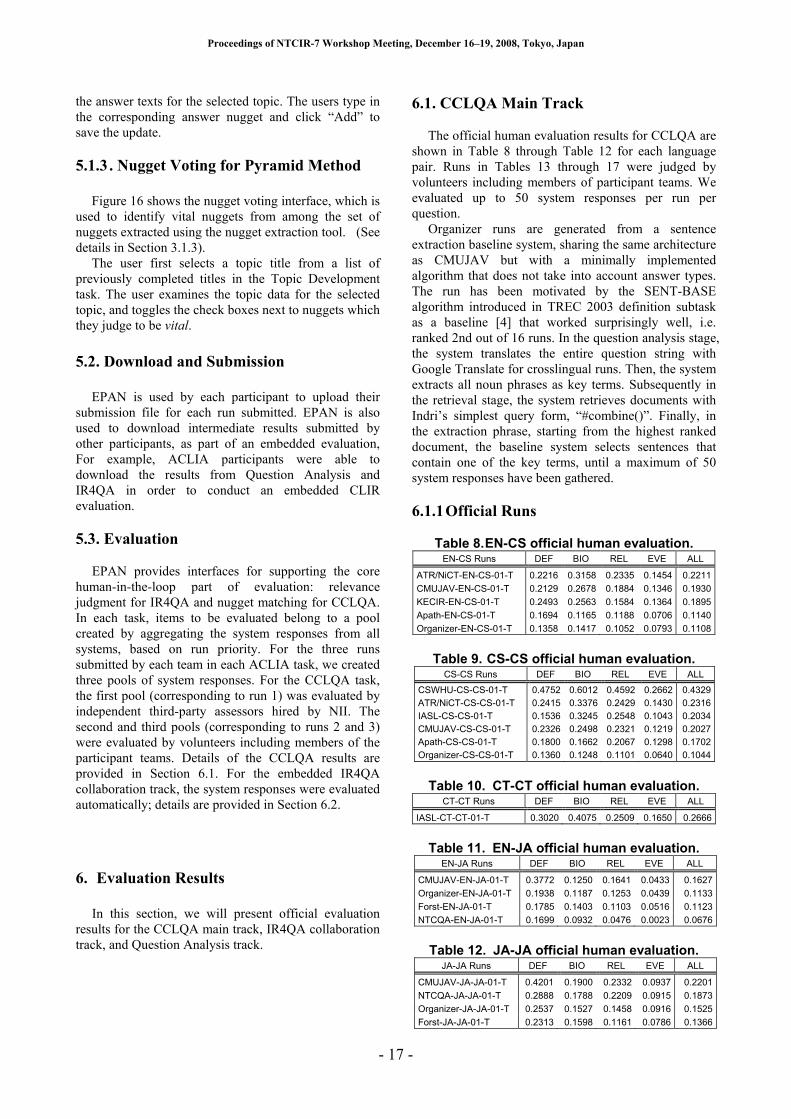
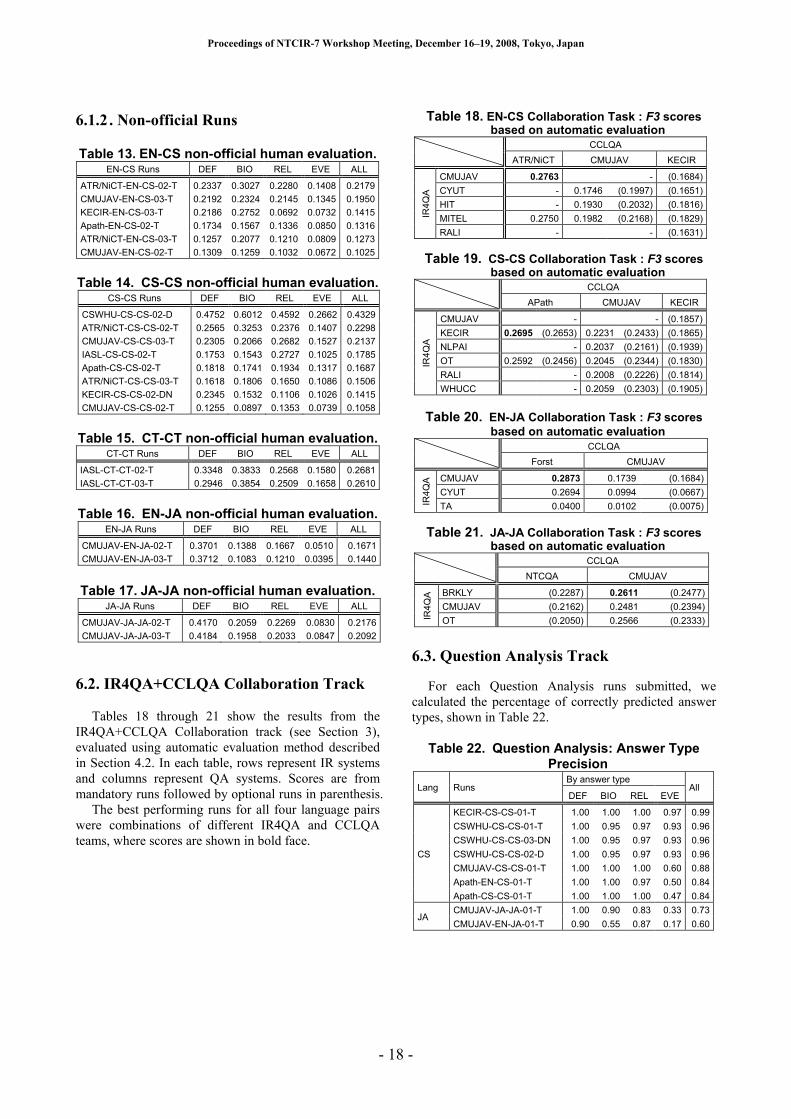
6.1.2 . Non-official Runs Table 13. EN-CS non-official human evaluation.
EN-CS Runs DEF BIO REL EVE ALL
ATR/NiCT-EN-CS-02-T 0.2337 0.3027 0.2280 0.1408 0.2179
CMUJAV-EN-CS-03-T 0.2192 0.2324 0.2145 0.1345 0.1950
KECIR-EN-CS-03-T 0.2186 0.2752 0.0692 0.0732 0.1415
Apath-EN-CS-02-T 0.1734 0.1567 0.1336 0.0850 0.1316
ATR/NiCT-EN-CS-03-T 0.1257 0.2077 0.1210 0.0809 0.1273
CMUJAV-EN-CS-02-T 0.1309 0.1259 0.1032 0.0672 0.1025
Table 14. CS-CS non-official human evaluation.
CS-CS Runs DEF BIO REL EVE ALL
CSWHU-CS-CS-02-D 0.4752 0.6012 0.4592 0.2662 0.4329
ATR/NiCT-CS-CS-02-T 0.2565 0.3253 0.2376 0.1407 0.2298
CMUJAV-CS-CS-03-T 0.2305 0.2066 0.2682 0.1527 0.2137
IASL-CS-CS-02-T 0.1753 0.1543 0.2727 0.1025 0.1785
Apath-CS-CS-02-T 0.1818 0.1741 0.1934 0.1317 0.1687
ATR/NiCT-CS-CS-03-T 0.1618 0.1806 0.1650 0.1086 0.1506
KECIR-CS-CS-02-DN 0.2345 0.1532 0.1106 0.1026 0.1415
CMUJAV-CS-CS-02-T 0.1255 0.0897 0.1353 0.0739 0.1058
Table 15. CT-CT non-official human evaluation.
CT-CT Runs DEF BIO REL EVE ALL
IASL-CT-CT-02-T 0.3348 0.3833 0.2568 0.1580 0.2681
IASL-CT-CT-03-T 0.2946 0.3854 0.2509 0.1658 0.2610
Table 16. EN-JA non-official human evaluation.
EN-JA Runs DEF BIO REL EVE ALL
CMUJAV-EN-JA-02-T 0.3701 0.1388 0.1667 0.0510 0.1671
CMUJAV-EN-JA-03-T 0.3712 0.1083 0.1210 0.0395 0.1440
Table 17. JA-JA non-official human evaluation.
JA-JA Runs DEF BIO REL EVE ALL
CMUJAV-JA-JA-02-T 0.4170 0.2059 0.2269 0.0830 0.2176
CMUJAV-JA-JA-03-T 0.4184 0.1958 0.2033 0.0847 0.2092
6.2 . IR4QA+CCLQA Collaboration Track
Tables 18 through 21 show the results from the
IR4QA+CCLQA Collaboration track (see Section 3),
evaluated using automatic evaluation method described
in Section 4.2. In each table, rows represent IR systems
and columns represent QA systems. Scores are from
mandatory runs followed by optional runs in parenthesis.
The best performing runs for all four language pairs
were combinations of different IR4QA and CCLQA
teams, where scores are shown in bold face.
Table 18. EN-CS Collaboration Task : F3 scores
based on automatic evaluation
CCLQA
ATR/NiCT CMUJAV KECIR
IR4QA
CMUJAV 0.2763 - (0.1684)
CYUT - 0.1746 (0.1997) (0.1651)
HIT - 0.1930 (0.2032) (0.1816)
MITEL 0.2750 0.1982 (0.2168) (0.1829)
RALI - - (0.1631)
Table 19. CS-CS Collaboration Task : F3 scores based on automatic evaluation
CCLQA
APath CMUJAV KECIR
IR4QA
CMUJAV - - (0.1857)
KECIR 0.2695 (0.2653) 0.2231 (0.2433) (0.1865)
NLPAI - 0.2037 (0.2161) (0.1939)
OT 0.2592 (0.2456) 0.2045 (0.2344) (0.1830)
RALI - 0.2008 (0.2226) (0.1814)
WHUCC - 0.2059 (0.2303) (0.1905)
Table 20. EN-JA Collaboration Task : F3 scores based on automatic evaluation
CCLQA
Forst CMUJAV
IR4QA CMUJAV 0.2873 0.1739 (0.1684)
CYUT 0.2694 0.0994 (0.0667)
TA 0.0400 0.0102 (0.0075)
Table 21. JA-JA Collaboration Task : F3 scores based on automatic evaluation
CCLQA
NTCQA CMUJAV
IR4QA BRKLY (0.2287) 0.2611 (0.2477)
CMUJAV (0.2162) 0.2481 (0.2394)
OT (0.2050) 0.2566 (0.2333)
6.3 . Question Analysis Track
For each Question Analysis runs submitted, we
calculated the percentage of correctly predicted answer
types, shown in Table 22.
Table 22. Question Analysis: Answer Type
Precision
Lang Runs By answer type
All DEF BIO REL EVE
CS
KECIR-CS-CS-01-T 1.00 1.00 1.00 0.97 0.99
CSWHU-CS-CS-01-T 1.00 0.95 0.97 0.93 0.96
CSWHU-CS-CS-03-DN 1.00 0.95 0.97 0.93 0.96
CSWHU-CS-CS-02-D 1.00 0.95 0.97 0.93 0.96
CMUJAV-CS-CS-01-T 1.00 1.00 1.00 0.60 0.88
Apath-EN-CS-01-T 1.00 1.00 0.97 0.50 0.84
Apath-CS-CS-01-T 1.00 1.00 1.00 0.47 0.84
JA CMUJAV-JA-JA-01-T 1.00 0.90 0.83 0.33 0.73
CMUJAV-EN-JA-01-T 0.90 0.55 0.87 0.17 0.60
Proceedings of NTCIR-7 Workshop Meeting, December 16–19, 2008, Tokyo, Japan
- 19 -
7. Further Analysis In this section, we present further analysis that was
performed following the human and automatic
evaluations of the run data.
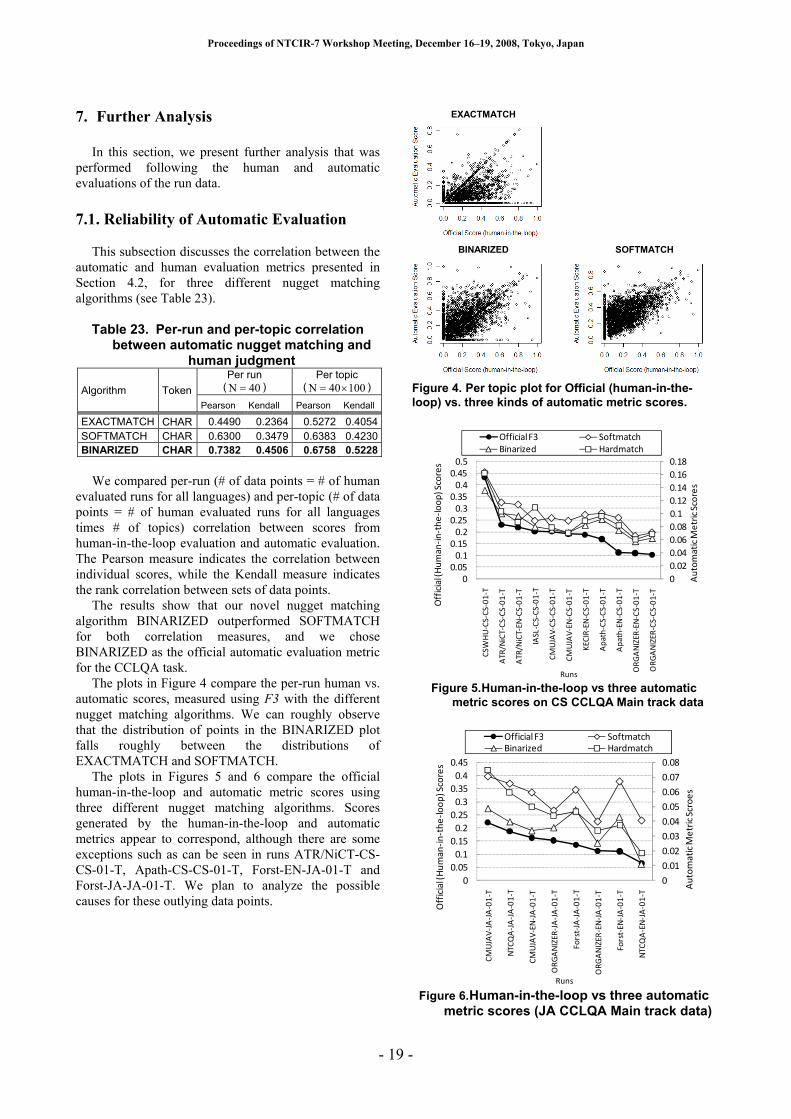
7.1 . Reliability of Automatic Evaluation
This subsection discusses the correlation between the
automatic and human evaluation metrics presented in
Section 4.2, for three different nugget matching
algorithms (see Table 23).
Table 23. Per-run and per-topic correlation
between automatic nugget matching and human judgment
Algorithm Token
Per run ( 40N = )
Per topic ( 10040N ×= )
Pearson Kendall Pearson Kendall
EXACTMATCH CHAR 0.4490 0.2364 0.5272 0.4054
SOFTMATCH CHAR 0.6300 0.3479 0.6383 0.4230
BINARIZED CHAR 0.7382 0.4506 0.6758 0.5228
We compared per-run (# of data points = # of human
evaluated runs for all languages) and per-topic (# of data
points = # of human evaluated runs for all languages
times # of topics) correlation between scores from
human-in-the-loop evaluation and automatic evaluation.
The Pearson measure indicates the correlation between
individual scores, while the Kendall measure indicates
the rank correlation between sets of data points.
The results show that our novel nugget matching
algorithm BINARIZED outperformed SOFTMATCH
for both correlation measures, and we chose
BINARIZED as the official automatic evaluation metric
for the CCLQA task.
The plots in Figure 4 compare the per-run human vs.
automatic scores, measured using F3 with the different
nugget matching algorithms. We can roughly observe
that the distribution of points in the BINARIZED plot
falls roughly between the distributions of
EXACTMATCH and SOFTMATCH.
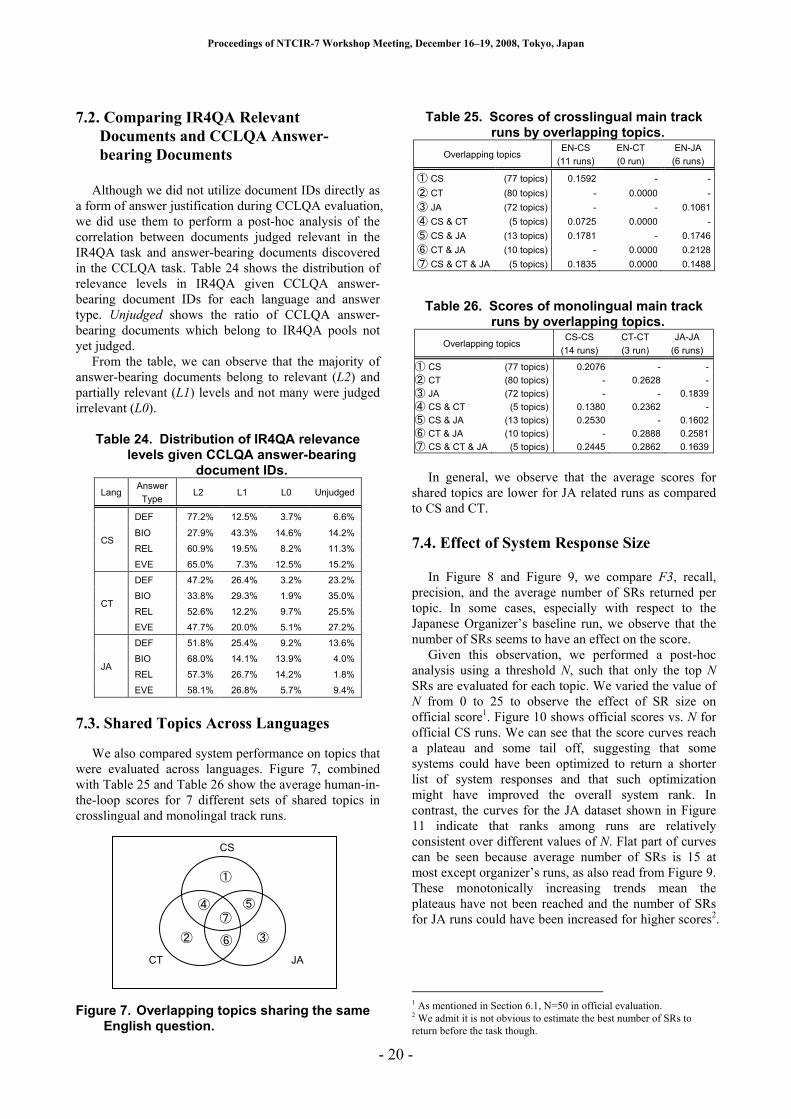
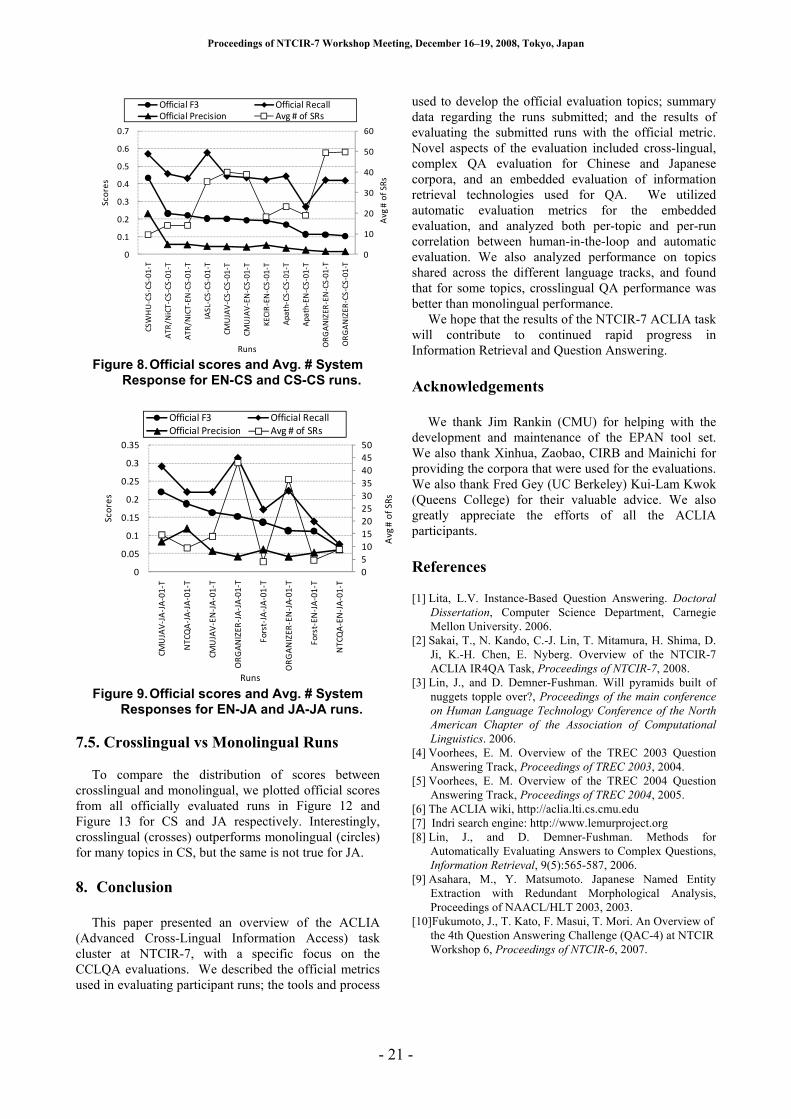
The plots in Figures 5 and 6 compare the official
human-in-the-loop and automatic metric scores using
three different nugget matching algorithms. Scores
generated by the human-in-the-loop and automatic
metrics appear to correspond, although there are some
exceptions such as can be seen in runs ATR/NiCT-CS-
CS-01-T, Apath-CS-CS-01-T, Forst-EN-JA-01-T and
Forst-JA-JA-01-T. We plan to analyze the possible
causes for these outlying data points.
EXACTMATCH
BINARIZED SOFTMATCH
Figure 4. Per topic plot for Official (human-in-the-
loop) vs. three kinds of automatic metric scores.
0
0.02
0.04
0.06
0.08
0.1
0.12
0.14
0.16
0.18
0
0.05
0.1
0.15
0.2
0.25
0.3
0.35
0.4
0.45
0.5
CS
WH
U-C
S-C
S-0
1-T
AT
R/N
iCT
-CS
-CS
-01
-T
AT
R/N
iCT
-EN
-CS
-01
-T
IAS
L-C
S-C
S-0
1-T
CM
UJA
V-C
S-C
S-0
1-T
CM
UJA
V-E
N-C
S-0
1-T
KE
CIR
-EN
-CS
-01
-T
Ap
ath
-CS
-CS
-01
-T
Ap
ath
-EN
-CS
-01
-T
OR
GA
NIZ
ER
-EN
-CS
-01
-T
OR
GA
NIZ
ER
-CS
-CS
-01
-T
Au
tom
ati
c M
etr
ic S
core
s
Off
icia
l (H
um
an
-in
-th
e-l
oo
p)
Sco
res
Runs
Official F3 Softmatch
Binarized Hardmatch
Figure 5. Human-in-the-loop vs three automatic
metric scores on CS CCLQA Main track data
0
0.01
0.02
0.03
0.04
0.05
0.06
0.07
0.08
0
0.05
0.1
0.15
0.2
0.25
0.3
0.35
0.4
0.45
CM
UJA
V-J
A-J
A-0
1-T
NT
CQ
A-J
A-J
A-0
1-T
CM
UJA
V-E
N-J
A-0
1-T
OR
GA
NIZ
ER
-JA
-JA
-01
-T
Fo
rst-
JA-J
A-0
1-T
OR
GA
NIZ
ER
-EN
-JA
-01
-T
Fo
rst-
EN
-JA
-01
-T
NT
CQ
A-E
N-J
A-0
1-T
Au
tom
ati
c M
etr
ic S
cro
es
Off
icia
l (H
um
an
-in
-th
e-l
oo
p)
Sco
res
Runs
Official F3 Softmatch
Binarized Hardmatch
Figure 6. Human-in-the-loop vs three automatic
metric scores (JA CCLQA Main track data)
Proceedings of NTCIR-7 Workshop Meeting, December 16–19, 2008, Tokyo, Japan
- 20 -
7.2 . Comparing IR4QA Relevant
Documents and CCLQA Answer-
bearing Documents
Although we did not utilize document IDs directly as
a form of answer justification during CCLQA evaluation,
we did use them to perform a post-hoc analysis of the
correlation between documents judged relevant in the
IR4QA task and answer-bearing documents discovered
in the CCLQA task. Table 24 shows the distribution of
relevance levels in IR4QA given CCLQA answer-
bearing document IDs for each language and answer
type. Unjudged shows the ratio of CCLQA answer-
bearing documents which belong to IR4QA pools not
yet judged.
From the table, we can observe that the majority of
answer-bearing documents belong to relevant (L2) and
partially relevant (L1) levels and not many were judged
irrelevant (L0).
Table 24. Distribution of IR4QA relevance levels given CCLQA answer-bearing
document IDs.
Lang Answer
Type L2 L1 L0 Unjudged
CS
DEF 77.2% 12.5% 3.7% 6.6%
BIO 27.9% 43.3% 14.6% 14.2%
REL 60.9% 19.5% 8.2% 11.3%
EVE 65.0% 7.3% 12.5% 15.2%
CT
DEF 47.2% 26.4% 3.2% 23.2%
BIO 33.8% 29.3% 1.9% 35.0%
REL 52.6% 12.2% 9.7% 25.5%
EVE 47.7% 20.0% 5.1% 27.2%
JA
DEF 51.8% 25.4% 9.2% 13.6%
BIO 68.0% 14.1% 13.9% 4.0%
REL 57.3% 26.7% 14.2% 1.8%
EVE 58.1% 26.8% 5.7% 9.4%
7.3 . Shared Topics Across Languages
We also compared system performance on topics that
were evaluated across languages. Figure 7, combined
with Table 25 and Table 26 show the average human-in-
the-loop scores for 7 different sets of shared topics in
crosslingual and monolingal track runs.
Figure 7. Overlapping topics sharing the same English question.
Table 25. Scores of crosslingual main track
runs by overlapping topics.
Overlapping topics EN-CS
(11 runs)
EN-CT
(0 run)
EN-JA
(6 runs)
① CS (77 topics) 0.1592 - -
② CT (80 topics) - 0.0000 -
③ JA (72 topics) - - 0.1061
④ CS & CT (5 topics) 0.0725 0.0000 -
⑤ CS & JA (13 topics) 0.1781 - 0.1746
⑥ CT & JA (10 topics) - 0.0000 0.2128
⑦ CS & CT & JA (5 topics) 0.1835 0.0000 0.1488
Table 26. Scores of monolingual main track runs by overlapping topics.
Overlapping topics CS-CS
(14 runs)
CT-CT
(3 run)
JA-JA
(6 runs)
① CS (77 topics) 0.2076 - -
② CT (80 topics) - 0.2628 -
③ JA (72 topics) - - 0.1839
④ CS & CT (5 topics) 0.1380 0.2362 -
⑤ CS & JA (13 topics) 0.2530 - 0.1602
⑥ CT & JA (10 topics) - 0.2888 0.2581
⑦ CS & CT & JA (5 topics) 0.2445 0.2862 0.1639
In general, we observe that the average scores for
shared topics are lower for JA related runs as compared
to CS and CT.
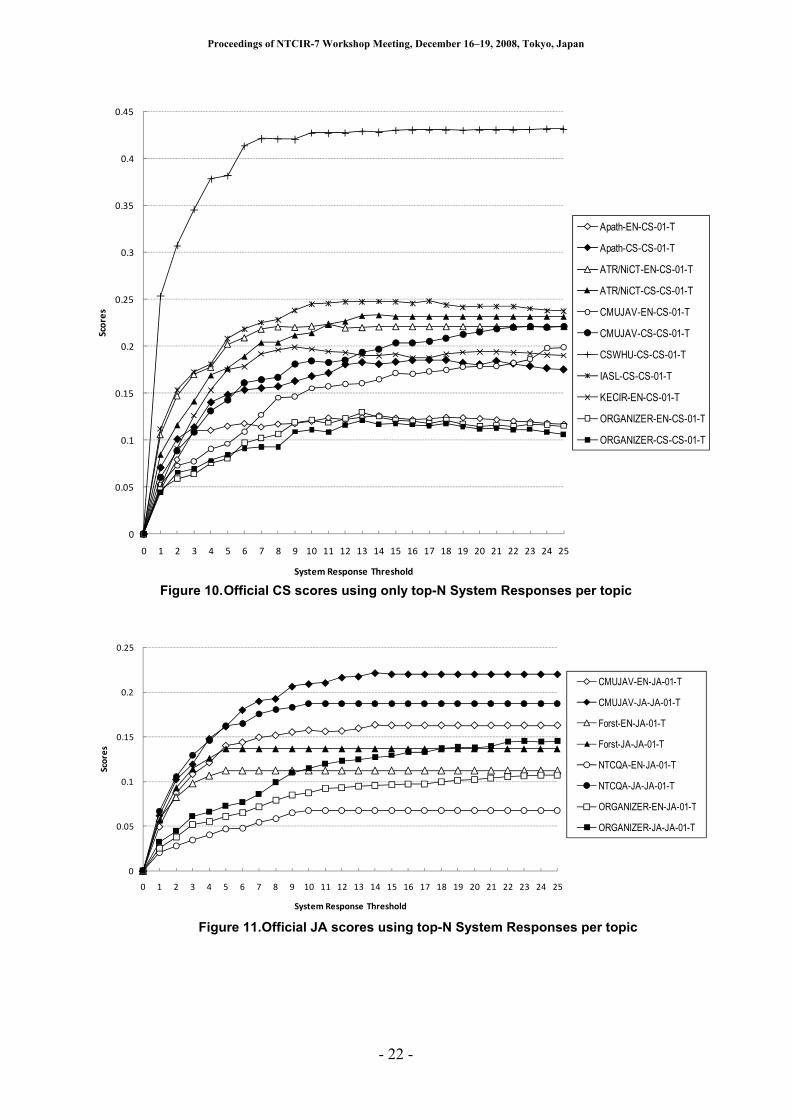
7.4 . Effect of System Response Size In Figure 8 and Figure 9, we compare F3, recall,
precision, and the average number of SRs returned per
topic. In some cases, especially with respect to the
Japanese Organizer’s baseline run, we observe that the
number of SRs seems to have an effect on the score.
Given this observation, we performed a post-hoc
analysis using a threshold N, such that only the top N
SRs are evaluated for each topic. We varied the value of
N from 0 to 25 to observe the effect of SR size on
official score1. Figure 10 shows official scores vs. N for
official CS runs. We can see that the score curves reach
a plateau and some tail off, suggesting that some
systems could have been optimized to return a shorter
list of system responses and that such optimization
might have improved the overall system rank. In
contrast, the curves for the JA dataset shown in Figure
11 indicate that ranks among runs are relatively
consistent over different values of N. Flat part of curves
can be seen because average number of SRs is 15 at
most except organizer’s runs, as also read from Figure 9.
These monotonically increasing trends mean the
plateaus have not been reached and the number of SRs
for JA runs could have been increased for higher scores2.
1 As mentioned in Section 6.1, N=50 in official evaluation. 2 We admit it is not obvious to estimate the best number of SRs to
return before the task though.
CS
CT JA
②
①
③
④ ⑤
⑥
⑦
Proceedings of NTCIR-7 Workshop Meeting, December 16–19, 2008, Tokyo, Japan
- 21 -
0
10
20
30
40
50
60
0
0.1
0.2
0.3
0.4
0.5
0.6
0.7
CS
WH
U-C
S-C
S-0
1-T
AT
R/N
iCT
-CS
-CS
-01
-T
AT
R/N
iCT
-EN
-CS
-01
-T
IAS
L-C
S-C
S-0
1-T
CM
UJA
V-C
S-C
S-0
1-T
CM
UJA
V-E
N-C
S-0
1-T
KE
CIR
-EN
-CS
-01
-T
Ap
ath
-CS
-CS
-01
-T
Ap
ath
-EN
-CS
-01
-T
OR
GA
NIZ
ER
-EN
-CS
-01
-T
OR
GA
NIZ
ER
-CS
-CS
-01
-T
Av
g #
of
SR
s
Sc
ore
s
Runs
Official F3 Official Recall
Official Precision Avg # of SRs
Figure 8. Official scores and Avg. # System
Response for EN-CS and CS-CS runs.
0
5
10
15
20
25
30
35
40
45
50
0
0.05
0.1
0.15
0.2
0.25
0.3
0.35
CM
UJA
V-J
A-J
A-0
1-T
NT
CQ
A-J
A-J
A-0
1-T
CM
UJA
V-E
N-J
A-0
1-T
OR
GA
NIZ
ER
-JA
-JA
-01
-T
Fo
rst-
JA-J
A-0
1-T
OR
GA
NIZ
ER
-EN
-JA
-01
-T
Fo
rst-
EN
-JA
-01
-T
NT
CQ
A-E
N-J
A-0
1-T
Av
g #
of
SR
s
Sc
ore
s
Runs
Official F3 Official Recall
Official Precision Avg # of SRs
Figure 9. Official scores and Avg. # System
Responses for EN-JA and JA-JA runs.
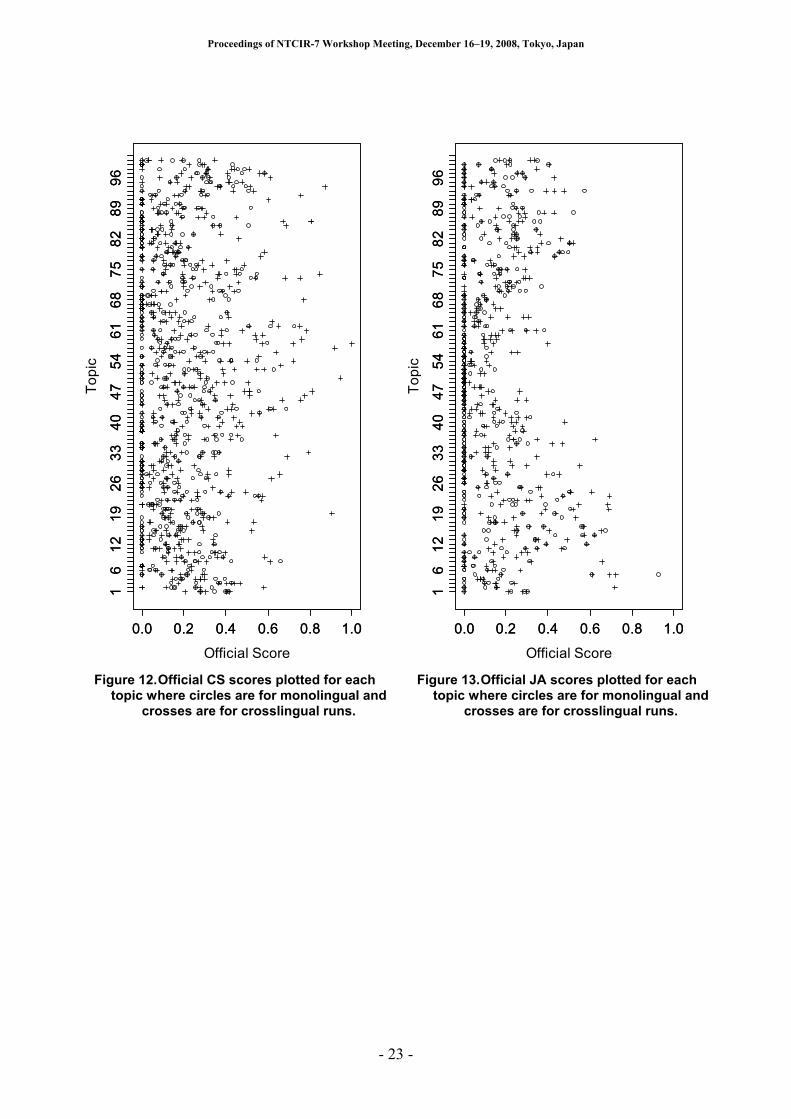
7.5 . Crosslingual vs Monolingual Runs
To compare the distribution of scores between
crosslingual and monolingual, we plotted official scores
from all officially evaluated runs in Figure 12 and
Figure 13 for CS and JA respectively. Interestingly,
crosslingual (crosses) outperforms monolingual (circles)
for many topics in CS, but the same is not true for JA.
8. Conclusion This paper presented an overview of the ACLIA
(Advanced Cross-Lingual Information Access) task
cluster at NTCIR-7, with a specific focus on the
CCLQA evaluations. We described the official metrics
used in evaluating participant runs; the tools and process
used to develop the official evaluation topics; summary
data regarding the runs submitted; and the results of
evaluating the submitted runs with the official metric.
Novel aspects of the evaluation included cross-lingual,
complex QA evaluation for Chinese and Japanese
corpora, and an embedded evaluation of information
retrieval technologies used for QA. We utilized
automatic evaluation metrics for the embedded
evaluation, and analyzed both per-topic and per-run
correlation between human-in-the-loop and automatic
evaluation. We also analyzed performance on topics
shared across the different language tracks, and found
that for some topics, crosslingual QA performance was
better than monolingual performance.
We hope that the results of the NTCIR-7 ACLIA task
will contribute to continued rapid progress in
Information Retrieval and Question Answering.
Acknowledgements
We thank Jim Rankin (CMU) for helping with the
development and maintenance of the EPAN tool set.
We also thank Xinhua, Zaobao, CIRB and Mainichi for
providing the corpora that were used for the evaluations.
We also thank Fred Gey (UC Berkeley) Kui-Lam Kwok
(Queens College) for their valuable advice. We also
greatly appreciate the efforts of all the ACLIA
participants.
References [1] Lita, L.V. Instance-Based Question Answering. Doctoral
Dissertation, Computer Science Department, Carnegie
Mellon University. 2006.
[2] Sakai, T., N. Kando, C.-J. Lin, T. Mitamura, H. Shima, D.
Ji, K.-H. Chen, E. Nyberg. Overview of the NTCIR-7
ACLIA IR4QA Task, Proceedings of NTCIR-7, 2008.
[3] Lin, J., and D. Demner-Fushman. Will pyramids built of
nuggets topple over?, Proceedings of the main conference
on Human Language Technology Conference of the North
American Chapter of the Association of Computational
Linguistics. 2006.
[4] Voorhees, E. M. Overview of the TREC 2003 Question
Answering Track, Proceedings of TREC 2003, 2004.
[5] Voorhees, E. M. Overview of the TREC 2004 Question
Answering Track, Proceedings of TREC 2004, 2005.
[6] The ACLIA wiki, http://aclia.lti.cs.cmu.edu
[7] Indri search engine: http://www.lemurproject.org
[8] Lin, J., and D. Demner-Fushman. Methods for
Automatically Evaluating Answers to Complex Questions,
Information Retrieval, 9(5):565-587, 2006.
[9] Asahara, M., Y. Matsumoto. Japanese Named Entity
Extraction with Redundant Morphological Analysis,
Proceedings of NAACL/HLT 2003, 2003.
[10] Fukumoto, J., T. Kato, F. Masui, T. Mori. An Overview of
the 4th Question Answering Challenge (QAC-4) at NTCIR
Workshop 6, Proceedings of NTCIR-6, 2007.
Proceedings of NTCIR-7 Workshop Meeting, December 16–19, 2008, Tokyo, Japan
- 22 -
0
0.05
0.1
0.15
0.2
0.25
0.3
0.35
0.4
0.45
0 1 2 3 4 5 6 7 8 9 10 11 12 13 14 15 16 17 18 19 20 21 22 23 24 25
Sco
res
System Response Threshold
Apath-EN-CS-01-T
Apath-CS-CS-01-T
ATR/NiCT-EN-CS-01-T
ATR/NiCT-CS-CS-01-T
CMUJAV-EN-CS-01-T
CMUJAV-CS-CS-01-T
CSWHU-CS-CS-01-T
IASL-CS-CS-01-T
KECIR-EN-CS-01-T
ORGANIZER-EN-CS-01-T
ORGANIZER-CS-CS-01-T
Figure 10. Official CS scores using only top-N System Responses per topic
0
0.05
0.1
0.15
0.2
0.25
0 1 2 3 4 5 6 7 8 9 10 11 12 13 14 15 16 17 18 19 20 21 22 23 24 25
Sco
res
System Response Threshold
CMUJAV-EN-JA-01-T
CMUJAV-JA-JA-01-T
Forst-EN-JA-01-T
Forst-JA-JA-01-T
NTCQA-EN-JA-01-T
NTCQA-JA-JA-01-T
ORGANIZER-EN-JA-01-T
ORGANIZER-JA-JA-01-T
Figure 11. Official JA scores using top-N System Responses per topic
Proceedings of NTCIR-7 Workshop Meeting, December 16–19, 2008, Tokyo, Japan
- 23 -
0.0 0.2 0.4 0.6 0.8 1.0
16
12
19
26
33
40
47
54
61
68
75
82
89
96
0.0 0.2 0.4 0.6 0.8 1.0
16
12
19
26
33
40
47
54
61
68
75
82
89
96
Official Score
Topic
0.0 0.2 0.4 0.6 0.8 1.0
16
12
19
26
33
40
47
54
61
68
75
82
89
96
0.0 0.2 0.4 0.6 0.8 1.0
16
12
19
26
33
40
47
54
61
68
75
82
89
96
Official Score
Topic
Figure 12. Official CS scores plotted for each
topic where circles are for monolingual and crosses are for crosslingual runs.
Figure 13. Official JA scores plotted for each topic where circles are for monolingual and
crosses are for crosslingual runs.
Proceedings of NTCIR-7 Workshop Meeting, December 16–19, 2008, Tokyo, Japan
- 24 -
Figure 14. EPAN topic development interface.
Proceedings of NTCIR-7 Workshop Meeting, December 16–19, 2008, Tokyo, Japan
- 25 -
Figure 15. EPAN nugget extraction interface.
Figure 16. EPAN nugget voting interface.