OVERVIEW OF STATE DOMESTIC PRODUCT & ITS RELATED ...
10
1 State Domestic Product & Its Related Aggregates 2011-2012 Series | Directorate of Economics & Statistics, Mizoram OVERVIEW OF STATE DOMESTIC PRODUCT & ITS RELATED AGGREGATES (2011-2012 SERIES)_MIZORAM STATE SN PARAMETERS AND INDICATORS FISCAL YEARS Final Estimates Provisional Estimates 2011- 2012 2012- 2013 2013- 2014 2014- 2015 2015- 2016 2016- 2017 2017-2018 I Gross State Domestic Product (GSDP) at Current Prices - INR Lakhs 725869 836193 1029337 1350940 1513886 1719191 1945730 II Per Capita Income (Net Current Prices) – INR 57654 65013 77584 103049 114055 127107 141210 III Economic Growth Rate (Gross Constant Prices) - in % - 7.15 11.59 15.76 14.15 13.37 12.59 IV Percentage Sectoral Share (Gross Current Prices) - in % (a) Agriculture & Allied Sector 20.12 18.95 18.74 31.49 31.41 30.87 29.57 (b) Industry Sector 20.46 18.91 23.24 20.87 20.74 21.72 23.59 (c) Service Sector 59.43 62.14 58.02 47.63 47.85 47.42 46.84
Transcript of OVERVIEW OF STATE DOMESTIC PRODUCT & ITS RELATED ...

1 State Domestic Product & Its Related Aggregates 2011-2012 Series | Directorate of Economics & Statistics, Mizoram
OVERVIEW OF STATE DOMESTIC PRODUCT & ITS RELATED AGGREGATES (2011-2012 SERIES)_MIZORAM STATE
SN PARAMETERS AND INDICATORS
FISCAL YEARS
Final Estimates Provisional Estimates
2011-2012
2012-2013
2013-2014
2014-2015
2015-2016
2016-2017 2017-2018
I Gross State Domestic Product (GSDP) at Current Prices - INR Lakhs
725869 836193 1029337 1350940 1513886 1719191 1945730
II Per Capita Income (Net Current Prices) – INR 57654 65013 77584 103049 114055 127107 141210
III Economic Growth Rate (Gross Constant Prices) - in % - 7.15 11.59 15.76 14.15 13.37 12.59
IV Percentage Sectoral Share (Gross Current Prices) - in %
(a) Agriculture & Allied Sector 20.12 18.95 18.74 31.49 31.41 30.87 29.57
(b) Industry Sector 20.46 18.91 23.24 20.87 20.74 21.72 23.59
(c) Service Sector 59.43 62.14 58.02 47.63 47.85 47.42 46.84

2 State Domestic Product & Its Related Aggregates 2011-2012 Series | Directorate of Economics & Statistics, Mizoram
GROSS STATE VALUE ADDED BY ECONOMIC ACTIVITY AT CURRENT PRICES
(Base Year : 2011-2012)
MIZORAM STATE
(INR lakhs)
SN Item 2011-12 2012-13 2013-14 2014-15 2015-2016
2016-2017
2017-2018 (P)
1 2 3 4 5 6 7 8 9
1 Agriculture, Forestry & Fishing
149468 161353 189886 420218 465297 515112 560944
1.1 Crops 75876 83792 101131 116034 129484 147435 164929
1.2 Livestock 30336 30843 36832 45847 53661 66166 86814
1.3 Forestry & Logging 38403 40972 45742 251289 274342 292438 299653
1.4 Fishing 4853 5746 6181 7048 7811 9073 9548
2 Mining & Quarrying 5073 4009 12491 8718 8247 4983 6665
Primary 154541 165362 202376 428936 473544 520094 567610
3 Manufacturing 6578 7358 8329 8111 10460 11155 11208
4 Electricity, Gas, Water Supply & Other Utility Services
51024 61109 101365 136540 147465 194817 256585
5 Construction 89328 88507 113326 125175 141137 151505 172984
Secondary 146930 156974 223020 269826 299062 357476 440776
Industry 152003 160983 235511 278544 307308 362459 447442
6 Trade, Hotels & Restaurants
76482 96173 103080 119745 141838 179518 214531
6.1 Trade & Repair Services 74230 93698 100399 116944 138796 176188 210873
6.2 Hotels & Restaurants 2252 2475 2681 2801 3042 3330 3658
7 Transport, Storage, Communication & Services related to Broadcasting
31917 38990 46410 49714 56146 59821 62794
7.1 Railways 30 35 33 34 39 33 40
7.2 Transport by means other than Railways
22092 26880 31102 31567 34430 38055 41038
7.2.1 Road Transport 21376 25853 30356 31180 32588 34847 37578
7.2.2 Water Transport 613 836 580 122 250 403 383
7.2.3 Air Transport 103 191 166 265 1591 1977 2206
7.2.4 Services incidental to Transport
0 0 0 0 0 829 872
7.3 Storage 0 0 0 0 0 0 0
7.4 Communication & Services related to Broadcasting
9795 12075 15275 18113 21678 21733 21716
8 Financial Services 20053 19581 21502 23671 33935 28747 30811
9 Real Estate, Ownership of Dwellings & Professional Services
41471 46544 51036 52747 54137 56627 58880
10 Public Administration 139286 170816 189585 197043 211167 227334 256343
11 Other Services 132328 156875 176398 192708 211593 239262 265169
Tertiary 441537 528979 588011 635628 708816 791309 888528
12 TOTAL GSVA at Basic Prices
743008 851315 1013407 1334390 1481422 1668880 1896913
13 Taxes on Products 23226 27434 35819 36560 52268 64184 65706
14 Subsidies on Products 40365 42556 19889 20010 19804 13873 16889
15 Gross State Domestic Product
725869 836193 1029337 1350940 1513886 1719191 1945730
16 Population ('00) 11108 11345 11586 11710 11920 12140 12360
17 Per Capita (Rs.) 65347 73708 88843 115366 127004 141614 157422

3 State Domestic Product & Its Related Aggregates 2011-2012 Series | Directorate of Economics & Statistics, Mizoram
NET STATE VALUE ADDED BY ECONOMIC ACTIVITY AT CURRENT PRICES
(Base Year : 2011-2012)
MIZORAM STATE
(INR lakhs)
SN Item 2011-12 2012-13 2013-14 2014-2015
2015-2016
2016-2017
2017-2018 (P)
1 2 3 4 5 6 7 8 9
1 Agriculture, Forestry & Fishing
143533 154726 182166 410661 454203 504237 549297
1.1 Crops 71321 78678 95065 110370 122326 139764 156828
1.2 Livestock 29947 30433 36345 45276 53080 65188 85616
1.3 Forestry & Logging 37982 40514 45226 248669 271698 290952 298000
1.4 Fishing 4283 5101 5530 6346 7100 8333 8853
2 Mining & Quarrying 4255 3256 7003 3458 5148 3823 5469
Primary 147788 157982 189169 414119 459351 508059 554767
3 Manufacturing 4968 5930 6760 6512 8935 9592 9531
4 Electricity, Gas, Water Supply & Other Utility Services
33928 39967 67081 92080 97542 127656 175056
5 Construction 85140 83832 106712 118485 133110 142593 162404
Secondary 124036 129729 180553 217077 239586 279840 346990
Industry 128291 132985 187556 220535 244734 283663 352460
6 Trade, Hotels & Restaurants
74526 93778 100249 116589 136495 173261 207077
6.1 Trade & Repair Services 72363 91399 97672 113899 133694 170196 203716
6.2 Hotels & Restaurants 2163 2379 2577 2690 2801 3065 3361
7 Transport, Storage, Communication & Services related to Broadcasting
26425 32596 37549 40841 45896 47842 48693
7.1 Railways 13 16 19 18 19 11 11
7.2 Transport by means other than Railways
18424 22631 26023 26544 28998 31445 33129
7.2.1 Road Transport 17998 22025 25619 26291 27535 28780 30251
7.2.2 Water Transport 398 499 323 77 152 279 256
7.2.3 Air Transport 28 107 81 176 1311 1666 1867
7.2.4 Services incidental to Transport
0 0 0 0 0 721 756
7.3 Storage 0 0 0 0 0 0 0
7.4 Communication & Services related to Broadcasting
7988 9949 11507 14279 16879 16386 15553
8 Financial Services 19736 19248 21143 23249 33241 28113 30132
9 Real Estate, Ownership of Dwellings & Professional Services
33673 37497 40721 41691 43251 45245 46634
10 Public Administration 107886 135009 148275 155643 169279 183981 210856
11 Other Services 123483 146832 165301 180946 199968 226429 251387
Tertiary 385729 464960 513238 558959 628130 704871 794779
12 TOTAL GSVA at Basic Prices
657553 752671 882960 1190155 1327067 1492771 1696535
13 Taxes on Products 23226 27434 35819 36560 52268 64184 65706
14 Subsidies on Products 40365 42556 19889 20010 19804 13873 16889
15 Gross State Domestic Product
640414 737549 898890 1206705 1359531 1543082 1745352
16 Population ('00) 11108 11345 11586 11710 11920 12140 12360
17 Per Capita (Rs.) 57654 65013 77584 103049 114055 127107 141210
4 State Domestic Product & Its Related Aggregates 2011-2012 Series | Directorate of Economics & Statistics, Mizoram
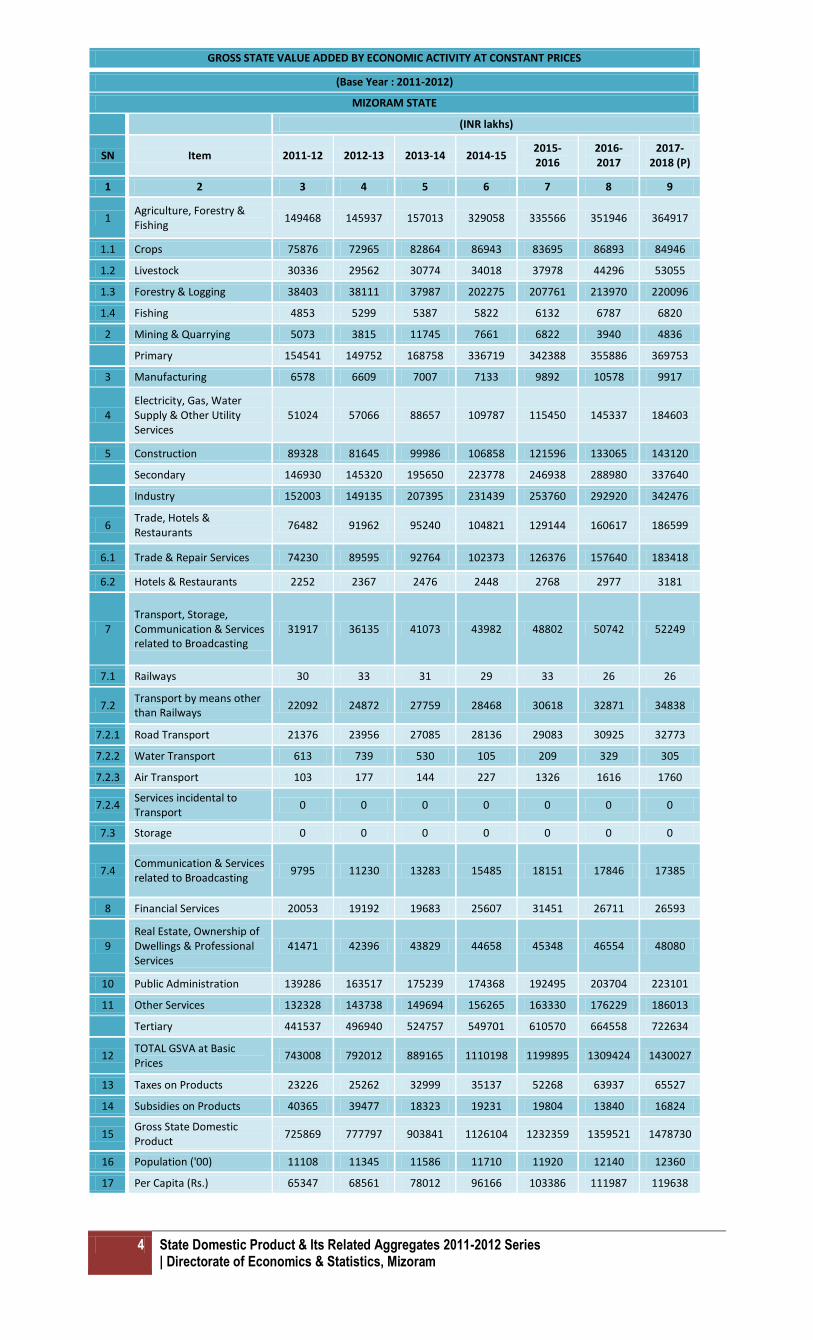
GROSS STATE VALUE ADDED BY ECONOMIC ACTIVITY AT CONSTANT PRICES
(Base Year : 2011-2012)
MIZORAM STATE
(INR lakhs)
SN Item 2011-12 2012-13 2013-14 2014-15 2015-2016
2016-2017
2017-2018 (P)
1 2 3 4 5 6 7 8 9
1 Agriculture, Forestry & Fishing
149468 145937 157013 329058 335566 351946 364917
1.1 Crops 75876 72965 82864 86943 83695 86893 84946
1.2 Livestock 30336 29562 30774 34018 37978 44296 53055
1.3 Forestry & Logging 38403 38111 37987 202275 207761 213970 220096
1.4 Fishing 4853 5299 5387 5822 6132 6787 6820
2 Mining & Quarrying 5073 3815 11745 7661 6822 3940 4836
Primary 154541 149752 168758 336719 342388 355886 369753
3 Manufacturing 6578 6609 7007 7133 9892 10578 9917
4 Electricity, Gas, Water Supply & Other Utility Services
51024 57066 88657 109787 115450 145337 184603
5 Construction 89328 81645 99986 106858 121596 133065 143120
Secondary 146930 145320 195650 223778 246938 288980 337640
Industry 152003 149135 207395 231439 253760 292920 342476
6 Trade, Hotels & Restaurants
76482 91962 95240 104821 129144 160617 186599
6.1 Trade & Repair Services 74230 89595 92764 102373 126376 157640 183418
6.2 Hotels & Restaurants 2252 2367 2476 2448 2768 2977 3181
7 Transport, Storage, Communication & Services related to Broadcasting
31917 36135 41073 43982 48802 50742 52249
7.1 Railways 30 33 31 29 33 26 26
7.2 Transport by means other than Railways
22092 24872 27759 28468 30618 32871 34838
7.2.1 Road Transport 21376 23956 27085 28136 29083 30925 32773
7.2.2 Water Transport 613 739 530 105 209 329 305
7.2.3 Air Transport 103 177 144 227 1326 1616 1760
7.2.4 Services incidental to Transport
0 0 0 0 0 0 0
7.3 Storage 0 0 0 0 0 0 0
7.4 Communication & Services related to Broadcasting
9795 11230 13283 15485 18151 17846 17385
8 Financial Services 20053 19192 19683 25607 31451 26711 26593
9 Real Estate, Ownership of Dwellings & Professional Services
41471 42396 43829 44658 45348 46554 48080
10 Public Administration 139286 163517 175239 174368 192495 203704 223101
11 Other Services 132328 143738 149694 156265 163330 176229 186013
Tertiary 441537 496940 524757 549701 610570 664558 722634
12 TOTAL GSVA at Basic Prices
743008 792012 889165 1110198 1199895 1309424 1430027
13 Taxes on Products 23226 25262 32999 35137 52268 63937 65527
14 Subsidies on Products 40365 39477 18323 19231 19804 13840 16824
15 Gross State Domestic Product
725869 777797 903841 1126104 1232359 1359521 1478730
16 Population ('00) 11108 11345 11586 11710 11920 12140 12360
17 Per Capita (Rs.) 65347 68561 78012 96166 103386 111987 119638

5 State Domestic Product & Its Related Aggregates 2011-2012 Series | Directorate of Economics & Statistics, Mizoram
NET STATE VALUE ADDED BY ECONOMIC ACTIVITY AT CONSTANT PRICES
(Base Year : 2011-2012)
MIZORAM STATE
(INR lakhs)
SN Item 2011-12 2012-13 2013-14 2014-2015
2015-2016
2016-2017
2017-2018 (P)
1 2 3 4 5 6 7 8 9
1 Agriculture, Forestry & Fishing
143533 139809 150416 321170 326590 343479 356128
1.1 Crops 71321 68250 77727 82384 78197 81225 79114
1.2 Livestock 29947 29182 30343 33526 37457 43439 52067
1.3 Forestry & Logging 37982 37686 37530 200026 205425 212687 218747
1.4 Fishing 4283 4691 4815 5234 5511 6128 6200
2 Mining & Quarrying 4255 3098 6720 3019 4228 2985 3877
Primary 147788 142907 157136 324189 330818 346464 360005
3 Manufacturing 4968 5253 5570 5702 8510 9172 8465
4 Electricity, Gas, Water Supply & Other Utility Services
33928 36689 56500 68938 70729 85161 113247
5 Construction 85140 77185 93763 100755 114111 124562 133138
Secondary 124036 119127 155833 175395 193350 218895 254850
Industry 128291 122225 162553 178414 197578 221880 258727
6 Trade, Hotels & Restaurants
74526 89706 92663 102023 124365 155073 180277
6.1 Trade & Repair Services 72363 87430 90283 99674 121812 152330 177347
6.2 Hotels & Restaurants 2163 2276 2380 2349 2553 2743 2930
7 Transport, Storage, Communication & Services related to Broadcasting
26425 29973 32678 35753 39654 40104 39989
7.1 Railways 13 15 18 15 16 7 2
7.2 Transport by means other than Railways
18424 20804 23057 23885 25553 26817 27778
7.2.1 Road Transport 17998 20291 22701 23677 24369 25362 26225
7.2.2 Water Transport 398 416 291 63 117 215 192
7.2.3 Air Transport 28 97 65 145 1067 1333 1459
7.2.4 Services incidental to Transport
0 0 0 0 0 -94 -98
7.3 Storage 0 0 0 0 0 0 0
7.4 Communication & Services related to Broadcasting
7988 9154 9603 11853 14085 13281 12209
8 Financial Services 19736 18870 19341 25215 30849 26156 26014
9 Real Estate, Ownership of Dwellings & Professional Services
33673 34018 34723 35227 35923 36962 38360
10 Public Administration 107886 129109 136710 136649 154353 164321 182984
11 Other Services 123483 134149 139386 145645 153015 164864 174246
Tertiary 385729 435825 455500 480512 538159 587481 641869
12 TOTAL GSVA at Basic Prices
657553 697859 768469 980096 1062326 1152840 1256724
13 Taxes on Products 23226 25262 32999 35137 52268 63937 65527
14 Subsidies on Products 40365 39477 18323 19231 19804 13840 16824
15 Gross State Domestic Product
640414 683644 783145 996002 1094790 1202937 1305427
16 Population ('00) 11108 11345 11586 11710 11920 12140 12360
17 Per Capita (Rs.) 57654 60261 67594 85056 91845 99089 105617

6 State Domestic Product & Its Related Aggregates 2011-2012 Series | Directorate of Economics & Statistics, Mizoram
GROSS STATE VALUE ADDED BY ECONOMIC ACTIVITY AT CURRENT PRICES
(Base Year : 2011-2012)
MIZORAM STATE
PERCENTAGE SECTORAL SHARE
SN Item 2011-12 2012-13 2013-14 2014-15 2015-2016
2016-2017
2017-2018 (P)
1 2 3 4 5 6 7 8 9
1 Agriculture, Forestry & Fishing
20.12 18.95 18.74 31.49 31.41 30.87 29.57
1.1 Crops 10.21 9.84 9.98 8.70 8.74 8.83 8.69
1.2 Livestock 4.08 3.62 3.63 3.44 3.62 3.96 4.58
1.3 Forestry & Logging 5.17 4.81 4.51 18.83 18.52 17.52 15.80
1.4 Fishing 0.65 0.67 0.61 0.53 0.53 0.54 0.50
2 Mining & Quarrying 0.68 0.47 1.23 0.65 0.56 0.30 0.35
Primary 20.80 19.42 19.97 32.14 31.97 31.16 29.92
3 Manufacturing 0.89 0.86 0.82 0.61 0.71 0.67 0.59
4 Electricity, Gas, Water Supply & Other Utility Services
6.87 7.18 10.00 10.23 9.95 11.67 13.53
5 Construction 12.02 10.40 11.18 9.38 9.53 9.08 9.12
Secondary 19.78 18.44 22.01 20.22 20.19 21.42 23.24
Industry 20.46 18.91 23.24 20.87 20.74 21.72 23.59
6 Trade, Hotels & Restaurants
10.29 11.30 10.17 8.97 9.57 10.76 11.31
6.1 Trade & Repair Services 9.99 11.01 9.91 8.76 9.37 10.56 11.12
6.2 Hotels & Restaurants 0.30 0.29 0.26 0.21 0.21 0.20 0.19
7 Transport, Storage, Communication & Services related to Broadcasting
4.30 4.58 4.58 3.73 3.79 3.58 3.31
7.1 Railways 0.00 0.00 0.00 0.00 0.00 0.00 0.00
7.2 Transport by means other than Railways
2.97 3.16 3.07 2.37 2.32 2.28 2.16
7.2.1 Road Transport 2.88 3.04 3.00 2.34 2.20 2.09 1.98
7.2.2 Water Transport 0.08 0.10 0.06 0.01 0.02 0.02 0.02
7.2.3 Air Transport 0.01 0.02 0.02 0.02 0.11 0.12 0.12
7.2.4 Services incidental to Transport
0.00 0.00 0.00 0.00 0.00 0.05 0.05
7.3 Storage 0.00 0.00 0.00 0.00 0.00 0.00 0.00
7.4 Communication & Services related to Broadcasting
1.32 1.42 1.51 1.36 1.46 1.30 1.14
8 Financial Services 2.70 2.30 2.12 1.77 2.29 1.72 1.62
9 Real Estate, Ownership of Dwellings & Professional Services
5.58 5.47 5.04 3.95 3.65 3.39 3.10
10 Public Administration 18.75 20.06 18.71 14.77 14.25 13.62 13.51
11 Other Services 17.81 18.43 17.41 14.44 14.28 14.34 13.98
Tertiary 59.43 62.14 58.02 47.63 47.85 47.42 46.84
12 TOTAL GSVA at Basic Prices
100.00 100.00 100.00 100.00 100.00 100.00 100.00

7 State Domestic Product & Its Related Aggregates 2011-2012 Series | Directorate of Economics & Statistics, Mizoram
GROSS STATE VALUE ADDED BY ECONOMIC ACTIVITY AT CONSTANT PRICES
(Base Year : 2011-2012)
MIZORAM STATE
ECONOMIC GROWTH RATE
SN Item 2012-13 2013-14 2014-15 2015-16 2016-2017
2017-2018 (P)
1 2 3 4 5 6 7 8
1 Agriculture, Forestry & Fishing
-2.36 2.49 30.09 22.41 18.68 16.04
1.1 Crops -3.84 4.50 4.64 2.48 2.75 1.90
1.2 Livestock -2.55 0.72 3.89 5.78 7.87 9.76
1.3 Forestry & Logging -0.76 -0.54 73.99 52.51 40.99 33.77
1.4 Fishing 9.19 5.36 6.26 6.02 6.94 5.83
2 Mining & Quarrying -24.80 52.16 14.73 7.69 -4.93 -0.79
Primary -3.10 4.50 29.64 22.00 18.16 15.65
3 Manufacturing 0.47 3.21 2.74 10.74 9.97 7.08
4 Electricity, Gas, Water Supply & Other Utility Services
11.84 31.82 29.10 22.65 23.29 23.90
5 Construction -8.60 5.80 6.15 8.01 8.30 8.17
Secondary -1.10 15.39 15.05 13.86 14.49 14.87
Industry -1.89 16.81 15.04 13.67 14.02 14.50
6 Trade, Hotels & Restaurants
20.24 11.59 11.08 13.99 16.00 16.03
6.1 Trade & Repair Services 20.70 11.79 11.31 14.23 16.26 16.27
6.2 Hotels & Restaurants 5.11 4.86 2.82 5.29 5.74 5.92
7 Transport, Storage, Communication & Services related to Broadcasting
13.22 13.44 11.28 11.20 9.72 8.56
7.1 Railways 10.00 1.65 -1.12 2.41 -2.82 -2.36
7.2 Transport by means other than Railways
12.58 12.10 8.82 8.50 8.27 7.89
7.2.1 Road Transport 12.07 12.57 9.59 8.00 7.67 7.38
7.2.2 Water Transport 20.55 -7.00 -44.46 -23.59 -11.69 -10.98
7.2.3 Air Transport 71.84 18.15 30.14 89.42 73.44 60.49
7.2.4 Services incidental to Transport
7.3 Storage
7.4 Communication & Services related to Broadcasting
14.65 16.45 16.49 16.67 12.75 10.03
8 Financial Services -4.29 -0.93 8.49 11.91 5.90 4.82
9 Real Estate, Ownership of Dwellings & Professional Services
2.23 2.80 2.50 2.26 2.34 2.49
10 Public Administration 17.40 12.17 7.78 8.42 7.90 8.17
11 Other Services 8.62 6.36 5.70 5.40 5.90 5.84
Tertiary 12.55 9.02 7.58 8.44 8.52 8.56
12 TOTAL GSVA at basic prices
6.60 9.39 14.32 12.73 12.00 11.53
13 Taxes on Products 8.77 19.20 14.80 22.48 22.45 18.87
14 Subsidies on products -2.20 -32.62 -21.90 -16.31 -19.27 -13.57
15 Gross State Domestic Product
7.15 11.59 15.76 14.15 13.37 12.59

8 State Domestic Product & Its Related Aggregates 2011-2012 Series | Directorate of Economics & Statistics, Mizoram
725869 836193
1029337
1350940 1513886
1719191
1945730
2011-2012 2012-2013 2013-2014 2014-2015 2015-2016 2016-2017 2017-2018(P)
I
N
R
L
A
K
H
S
FISCAL YEARS (P stands for Provisional)
Gross State Domestic Product (GSDP) at Current Prices
7.15
11.59
15.76
14.15 13.37
12.59
2012-2013 2013-2014 2014-2015 2015-2016 2016-2017 2017-2018 (P)
C
A
G
R
(
I
N
%)
FISCAL YEARS (P stands for Provisional)
Economic Growth Rate (Gross Constant Prices)
57654 65013 77584
103049 114055
127107 141210 I
N
R
U
P
E
E
S
FISCAL YEARS (P stands for Provisional)
Per Capita Income (Net Current Prices)

9 State Domestic Product & Its Related Aggregates 2011-2012 Series | Directorate of Economics & Statistics, Mizoram
FISCAL VARIABLES AND INDICATORS
ACCUMULATED PUBLIC DEBT / OUTSTANDING DEBT / FISCAL LIABILITIES / DEBT STOCK TO GROSS STATE DOMESTIC PRODUCT@MARKET PRICES (2011-2012 SERIES AT CURRENT PRICES)
MIZORAM STATE
SN ITEMS FISCAL YEARS
2016-2017 2015-2016 2014-2015 2013-2014 2012-2013 2011-2012
1 Accumulated Public Debt/Outstanding Debt/Fiscal Liabilities/Debt Stock (INR lakhs)
672500 640739 655039 561347 511420 454845
2 GSDP (INR lakhs) 1719191 1513886 1350940 1029337 836193 725869
3 Percentage of Accumulated Public Debt/Outstanding Debt/Fiscal Liabilities/Debt Stock to GSDP
39.12 42.32 48.49 54.53 61.16 62.66
Finalised APD/OD/FL/DS & Finalised GSDP upto 2016-2017
FISCAL VARIABLES AND INDICATORS
REVENUE SURPLUS/DEFICIT TO GROSS STATE DOMESTIC PRODUCT@MARKET PRICES (2011-2012 SERIES AT CURRENT PRICES)
MIZORAM STATE
SN ITEMS FISCAL YEARS
2016-2017 2015-2016 2014-2015 2013-2014 2012-2013 2011-2012
1 Revenue Surplus/Deficit (INR lakhs) 116796 110554 -14134 -15213 2783 12757
2 GSDP (INR lakhs) 1719191 1513886 1350940 1029337 836193 725869
3 Percentage of Revenue Surplus/Deficit to GSDP
6.79 7.30 -1.05 -1.48 0.33 1.76
Finalised RS/RD & Finalised GSDP upto 2016-2017
2011-2012
2012-2013
2013-2014
2014-2015
2015-2016
2016-2017
2017-2018 (P)
Agriculture & Allied Sector 20.12 18.95 18.74 31.49 31.41 30.87 29.57
Industry Sector 20.46 18.91 23.24 20.87 20.74 21.72 23.59
Service Sector 59.43 62.14 58.02 47.63 47.85 47.42 46.84
I
N
%
FISCAL YEARS (P stands for Provisional)
Percentage Sectoral Share (Gross Current Prices)

10 State Domestic Product & Its Related Aggregates 2011-2012 Series | Directorate of Economics & Statistics, Mizoram
FISCAL VARIABLES AND INDICATORS
GROSS FISCAL DEFICIT TO GROSS STATE DOMESTIC PRODUCT@MARKET PRICES (2011-2012 SERIES AT CURRENT PRICES)
MIZORAM STATE
SN ITEMS FISCAL YEARS
2016-2017 2015-2016 2014-2015 2013-2014 2012-2013 2011-2012
1 Gross Fiscal Deficit (INR lakhs) 25195 41328 -103965 -74913 -58049 -47842
2 GSDP (INR lakhs) 1719191 1513886 1350940 1029337 836193 725869
3 Percentage of Gross Fiscal Deficit to GSDP 1.47 2.73 -7.70 -7.28 -6.94 -6.59
Finalised GFD & Finalised GSDP upto 2016-2017