
Overview of results 01 - FirstRand
168
analysis of financial results for the year ended 30 June 18 ’
Transcript of Overview of results 01 - FirstRand
analysis of financial resultsfor the year ended 30 June18’
about this report This report covers the audited summary consolidated financial results of FirstRand Limited (FirstRand or the group) based on International Financial Reporting Standards (IFRS) for the year ended 30 June 2018.
The primary results and accompanying commentary are presented on a normalised basis as the group believes this most accurately reflects its economic performance. The normalised results have been derived from the IFRS financial results.
Normalised results include a summary consolidated income statement, statement of comprehensive income, statement of financial position and a statement of changes in equity. A detailed description of the difference between normalised and IFRS results is provided on pages 115 and 116. Detailed reconciliations of normalised to IFRS results are provided on pages 126 to 131. Commentary is based on normalised results, unless indicated otherwise.
Jaco van Wyk, CA(SA), supervised the preparation of the consolidated financial statements and the summary consolidated financial results.
contentsOverview of results 01p03 Simplified group and shareholding structure
p05 Track record
p06 Key financial results, ratios and statistics – normalised
p08 Flow of funds analysis – normalised
p09 Summary consolidated financial statements – normalised
p15 Overview of results
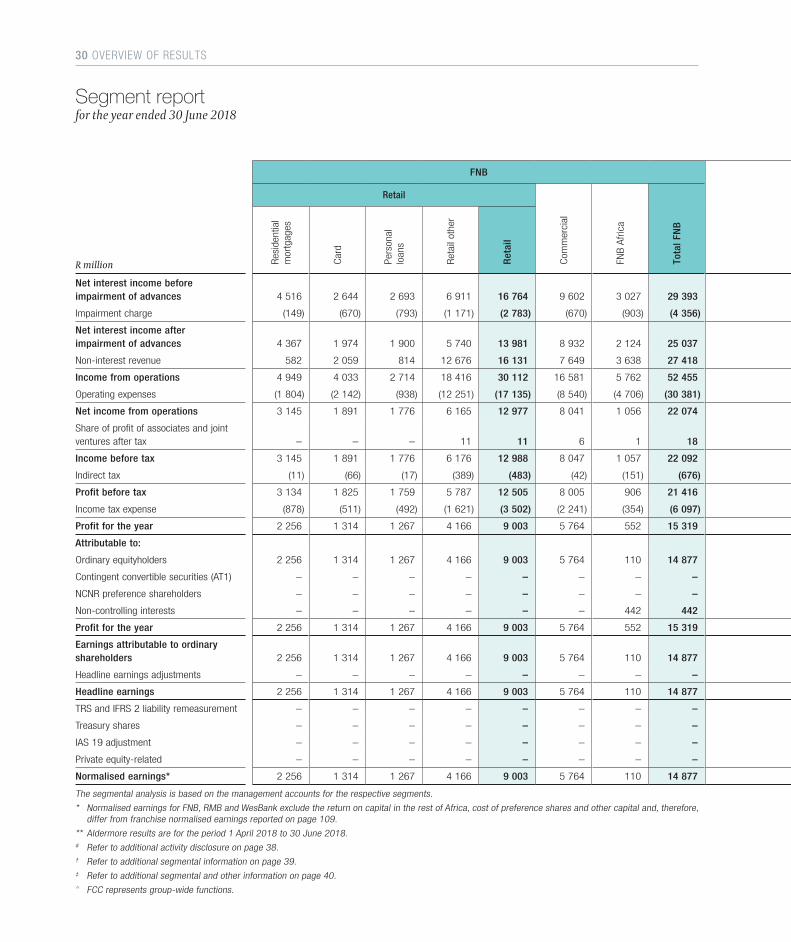
p30 Segment report
p38 Additional activity and business unit disclosure – RMB
p39 Additional segmental disclosure – WesBank
p40 Additional segmental disclosure – Aldermore
Income statement analysis 02p46 Net interest income (before impairment of advances)
p51 Credit highlights
p56 Non-interest revenue
p64 Operating expenses
1966/010753/06 Certain entities within the FirstRand
group are Authorised Financial Services and Credit Providers.
This analysis is available on the group’s website:
www.firstrand.co.za
Email questions to [email protected]
Balance sheet analysis and financial resource management 03p68 Economic view of the balance sheet
p69 Gross advances
p71 Credit
p90 Deposits
p91 Funding and liquidity risk
p99 Capital
p105 Common disclosures
p106 Regulatory update
p107 Performance measurement
p111 Credit ratings
IFRS information 04p114 Presentation
p117 Independent auditors’ report on summary consolidated financial statements
p118 Summary consolidated financial statements
p124 Statement of headline earnings
p125 Reconciliation from headline to normalised earnings
p126 Reconciliation of normalised to IFRS summary income statement and statement of financial position
p132 Acquisition of Aldermore
p134 Fair value measurements
p151 Contingencies and commitments
p151 Events after reporting period
p152 Summary segment report
Supplementary information 05p154 Headline earnings additional disclosure
p155 Number of ordinary shares in issue
p156 Key market indicators and share statistics
p157 Company information
p158 Listed financial instruments of the group
p161 Definitions
p162 Abbreviations

overview of results03 – 43
01
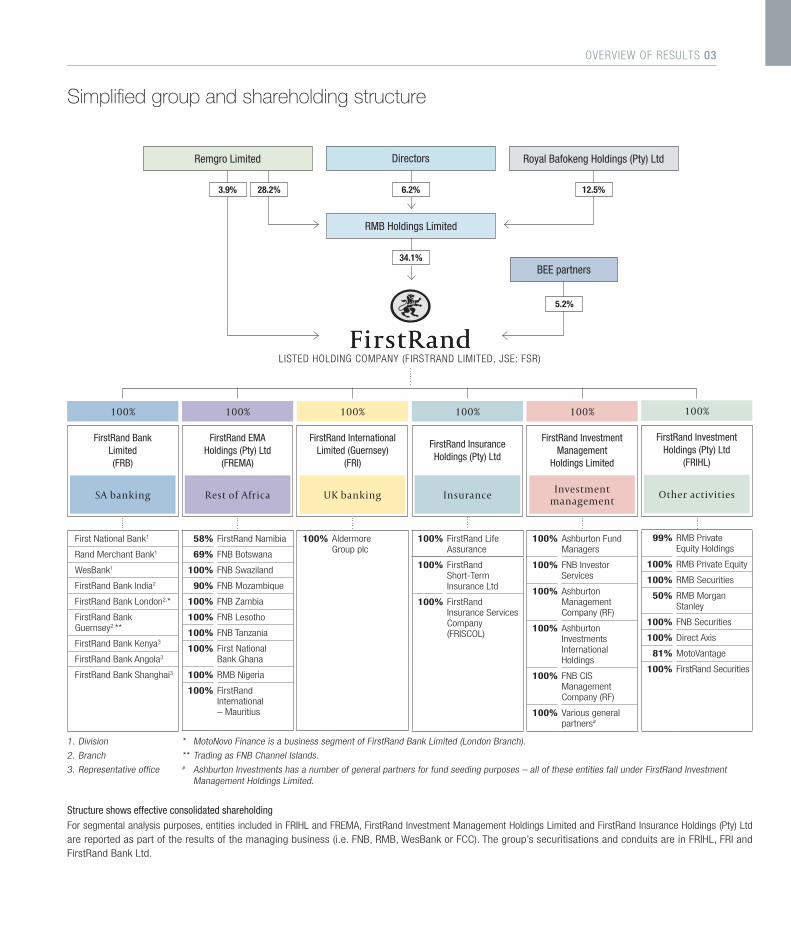
Simplified group and shareholding structure
LISTED HOLDING COMPANY (FIRSTRAND LIMITED, JSE: FSR)
FirstRand Bank Limited (FRB)
SA banking
100%
First National Bank1
Rand Merchant Bank1
WesBank1
FirstRand Bank India2
FirstRand Bank London2,*
FirstRand Bank Guernsey2,**
FirstRand Bank Kenya3
FirstRand Bank Angola3
FirstRand Bank Shanghai3
100%
FirstRand Investment Holdings (Pty) Ltd
(FRIHL)
Other activities
99% RMB Private Equity Holdings
100% RMB Private Equity
100% RMB Securities
50% RMB Morgan Stanley
100% FNB Securities
100% Direct Axis
81% MotoVantage
100% FirstRand Securities
34.1%
28.2%
Royal Bafokeng Holdings (Pty) LtdDirectors
RMB Holdings Limited
Remgro Limited
BEE partners
5.2%
6.2% 12.5%3.9%
Structure shows effective consolidated shareholdingFor segmental analysis purposes, entities included in FRIHL and FREMA, FirstRand Investment Management Holdings Limited and FirstRand Insurance Holdings (Pty) Ltd are reported as part of the results of the managing business (i.e. FNB, RMB, WesBank or FCC). The group’s securitisations and conduits are in FRIHL, FRI and FirstRand Bank Ltd.
100% FirstRand Life Assurance
100% FirstRand Short-Term Insurance Ltd
100% FirstRand Insurance Services Company (FRISCOL)
Insurance
100%
FirstRand Insurance Holdings (Pty) Ltd
100%
58% FirstRand Namibia
69% FNB Botswana
100% FNB Swaziland
90% FNB Mozambique
100% FNB Zambia
100% FNB Lesotho
100% FNB Tanzania
100% First National Bank Ghana
100% RMB Nigeria
100% FirstRand International – Mauritius
Rest of Africa
FirstRand EMA Holdings (Pty) Ltd
(FREMA)
100%
100% Aldermore Group plc
UK banking
FirstRand International Limited (Guernsey)
(FRI)
1. Division
2. Branch
3. Representative office
* MotoNovo Finance is a business segment of FirstRand Bank Limited (London Branch).
** Trading as FNB Channel Islands.# Ashburton Investments has a number of general partners for fund seeding purposes – all of these entities fall under FirstRand Investment
Management Holdings Limited.
100% Ashburton Fund Managers
100% FNB Investor Services
100% Ashburton Management Company (RF)
100% Ashburton Investments International Holdings
100% FNB CIS Management Company (RF)
100% Various general partners#
Investment management
100%
FirstRand Investment Management
Holdings Limited
overview of results
OVERVIEW OF RESULTS 03
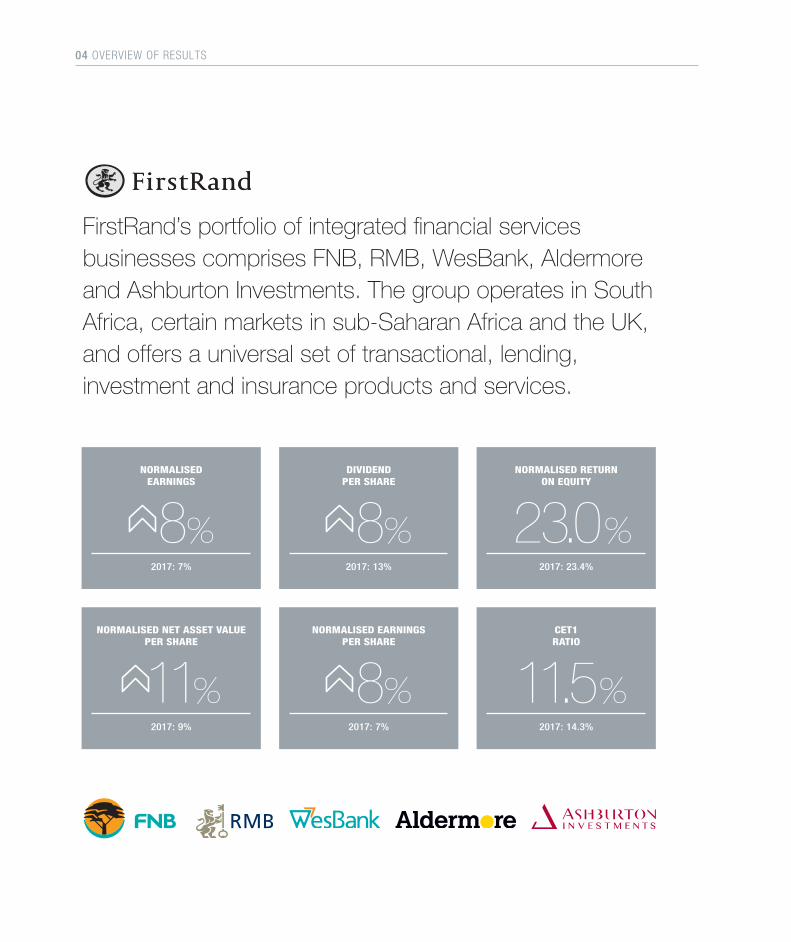
FirstRand’s portfolio of integrated financial services businesses comprises FNB, RMB, WesBank, Aldermore and Ashburton Investments. The group operates in South Africa, certain markets in sub-Saharan Africa and the UK, and offers a universal set of transactional, lending, investment and insurance products and services.
NORMALISED EARNINGS PER SHARE
8%2017: 7%
CET1 RATIO 11.5%
2017: 14.3%
DIVIDEND PER SHARE
8%2017: 13%
NORMALISED RETURN ON EQUITY 23.0%2017: 23.4%
NORMALISED EARNINGS
8%2017: 7%
NORMALISED NET ASSET VALUE PER SHARE
11%2017: 9%
04 OVERVIEW OF RESULTS
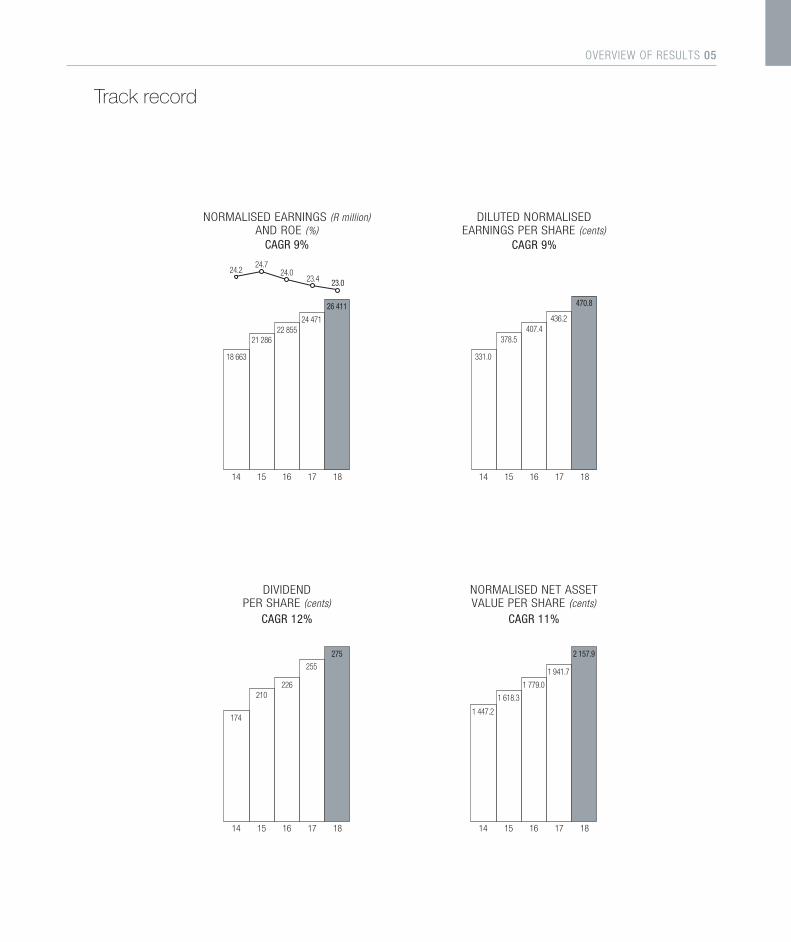
Track record
23.0
18 663
21 28622 855
24 471
15 16 17 18 14
NORMALISED EARNINGS (R million)AND ROE (%)
CAGR 9%
26 411
23.424.0
24.724.2
331.0
378.5407.4
436.2
15 16 17 18 14
DILUTED NORMALISEDEARNINGS PER SHARE (cents)
CAGR 9%
470.8
174
210226
255
15 16 17 18 14
DIVIDENDPER SHARE (cents)
CAGR 12%
275
1 447.2
1 618.3
1 779.0
1 941.7
15 16 17 18 14
NORMALISED NET ASSETVALUE PER SHARE (cents)
CAGR 11%
2 157.9
OVERVIEW OF RESULTS 05
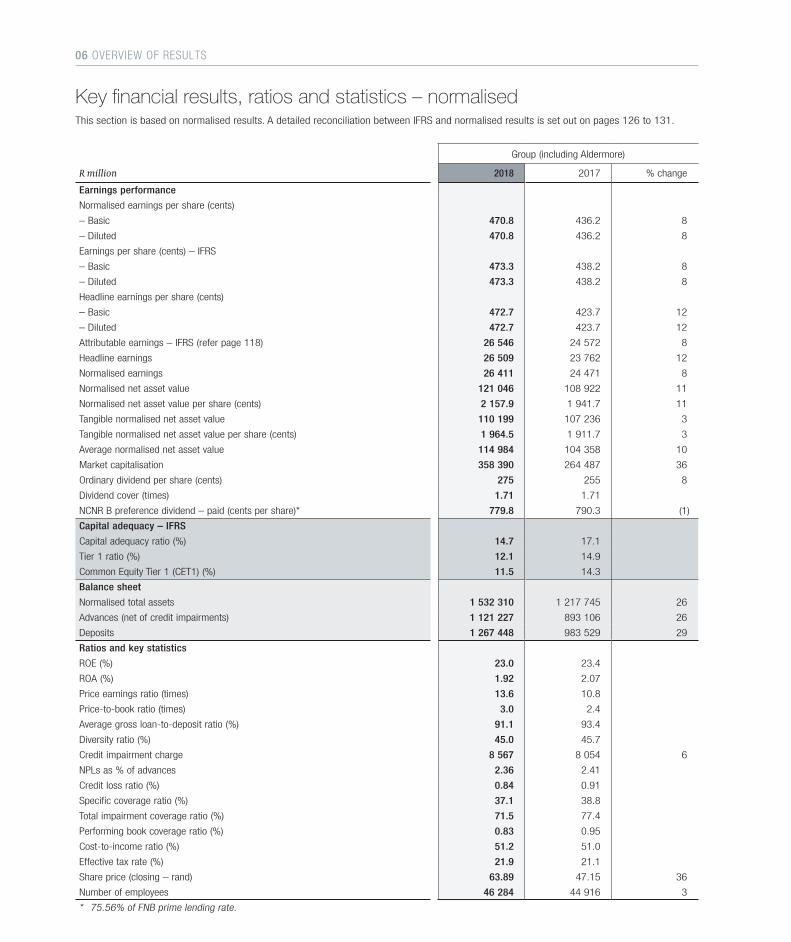
Key financial results, ratios and statistics – normalised
Group (including Aldermore)
R million 2018 2017 % change
Earnings performance
Normalised earnings per share (cents)
– Basic 470.8 436.2 8
– Diluted 470.8 436.2 8
Earnings per share (cents) – IFRS
– Basic 473.3 438.2 8
– Diluted 473.3 438.2 8
Headline earnings per share (cents)
– Basic 472.7 423.7 12
– Diluted 472.7 423.7 12
Attributable earnings – IFRS (refer page 118) 26 546 24 572 8
Headline earnings 26 509 23 762 12
Normalised earnings 26 411 24 471 8
Normalised net asset value 121 046 108 922 11
Normalised net asset value per share (cents) 2 157.9 1 941.7 11
Tangible normalised net asset value 110 199 107 236 3
Tangible normalised net asset value per share (cents) 1 964.5 1 911.7 3
Average normalised net asset value 114 984 104 358 10
Market capitalisation 358 390 264 487 36
Ordinary dividend per share (cents) 275 255 8
Dividend cover (times) 1.71 1.71
NCNR B preference dividend – paid (cents per share)* 779.8 790.3 (1)
Capital adequacy – IFRS
Capital adequacy ratio (%) 14.7 17.1
Tier 1 ratio (%) 12.1 14.9
Common Equity Tier 1 (CET1) (%) 11.5 14.3
Balance sheet
Normalised total assets 1 532 310 1 217 745 26
Advances (net of credit impairments) 1 121 227 893 106 26
Deposits 1 267 448 983 529 29
Ratios and key statistics
ROE (%) 23.0 23.4
ROA (%) 1.92 2.07
Price earnings ratio (times) 13.6 10.8
Price-to-book ratio (times) 3.0 2.4
Average gross loan-to-deposit ratio (%) 91.1 93.4
Diversity ratio (%) 45.0 45.7
Credit impairment charge 8 567 8 054 6
NPLs as % of advances 2.36 2.41
Credit loss ratio (%) 0.84 0.91
Specific coverage ratio (%) 37.1 38.8
Total impairment coverage ratio (%) 71.5 77.4
Performing book coverage ratio (%) 0.83 0.95
Cost-to-income ratio (%) 51.2 51.0
Effective tax rate (%) 21.9 21.1
Share price (closing – rand) 63.89 47.15 36
Number of employees 46 284 44 916 3
* 75.56% of FNB prime lending rate.
This section is based on normalised results. A detailed reconciliation between IFRS and normalised results is set out on pages 126 to 131.
06 OVERVIEW OF RESULTS
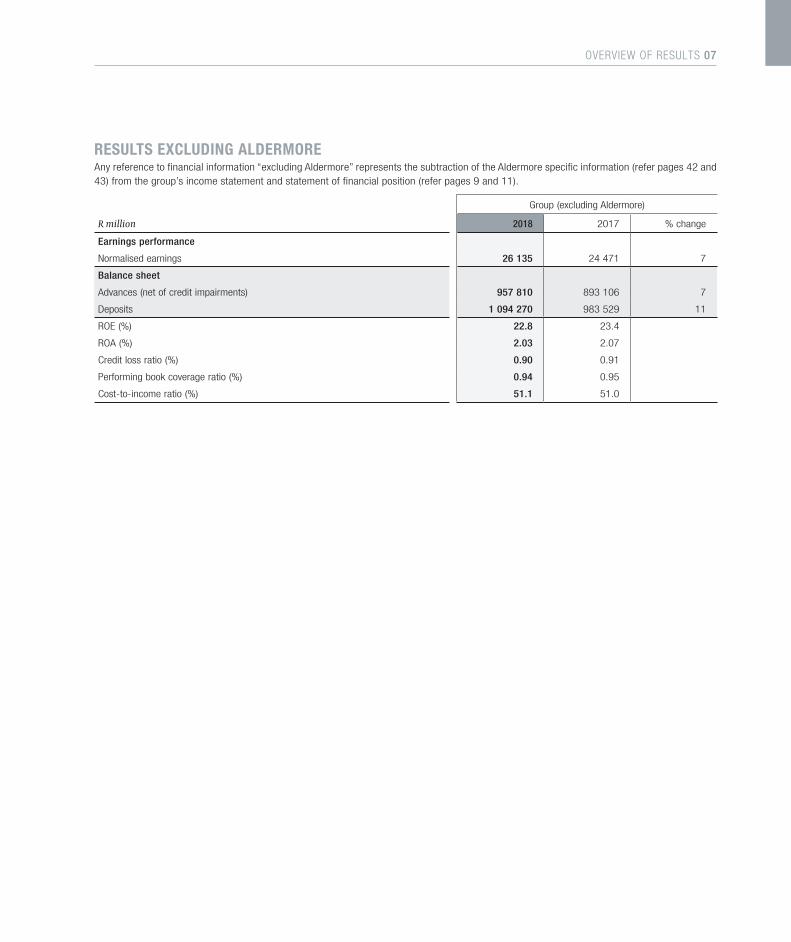
RESULTS EXCLUDING ALDERMOREAny reference to financial information “excluding Aldermore” represents the subtraction of the Aldermore specific information (refer pages 42 and 43) from the group’s income statement and statement of financial position (refer pages 9 and 11).
Group (excluding Aldermore)
R million 2018 2017 % change
Earnings performance
Normalised earnings 26 135 24 471 7
Balance sheet
Advances (net of credit impairments) 957 810 893 106 7
Deposits 1 094 270 983 529 11
ROE (%) 22.8 23.4
ROA (%) 2.03 2.07
Credit loss ratio (%) 0.90 0.91
Performing book coverage ratio (%) 0.94 0.95
Cost-to-income ratio (%) 51.1 51.0
OVERVIEW OF RESULTS 07
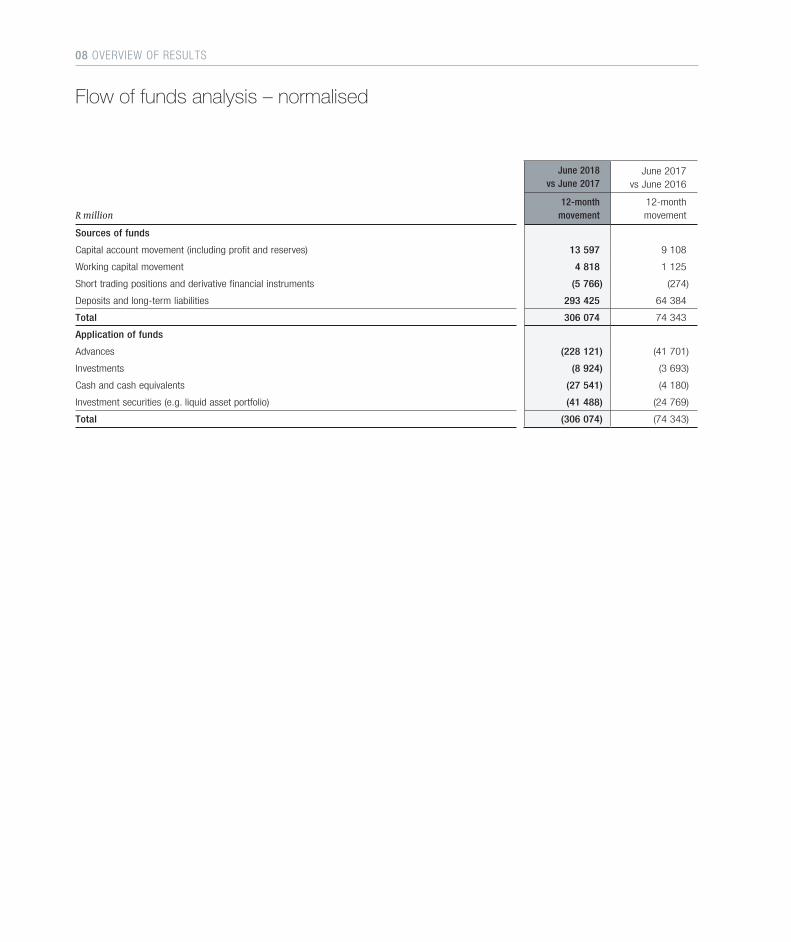
June 2018vs June 2017
June 2017vs June 2016
R million12-month
movement12-monthmovement
Sources of funds
Capital account movement (including profit and reserves) 13 597 9 108
Working capital movement 4 818 1 125
Short trading positions and derivative financial instruments (5 766) (274)
Deposits and long-term liabilities 293 425 64 384
Total 306 074 74 343
Application of funds
Advances (228 121) (41 701)
Investments (8 924) (3 693)
Cash and cash equivalents (27 541) (4 180)
Investment securities (e.g. liquid asset portfolio) (41 488) (24 769)
Total (306 074) (74 343)
Flow of funds analysis – normalised
08 OVERVIEW OF RESULTS

Summary consolidated income statement – normalised for the year ended 30 June
R million 2018 2017 % change
Net interest income before impairment of advances 51 254 46 626 10
Impairment charge (8 567) (8 054) 6
Net interest income after impairment of advances 42 687 38 572 11
Total non-interest revenue 41 926 39 268 7
– Operational non-interest revenue 41 012 38 227 7
– Fee and commission income 28 250 25 598 10
– Insurance income 4 197 3 967 6
– Markets, client and other fair value income 4 165 4 255 (2)
– Investment income 1 959 2 178 (10)
– Other non-interest revenue 2 441 2 229 10
– Share of profit of associates and joint ventures after tax 914 1 041 (12)
Income from operations 84 613 77 840 9
Operating expenses (47 664) (43 773) 9
Income before tax 36 949 34 067 8
Indirect tax (1 077) (1 081) –
Profit before tax 35 872 32 986 9
Income tax expense (7 865) (6 951) 13
Profit for the year 28 007 26 035 8
Contingent convertible securities (AT1) (115) – –
NCNR preference shareholders (351) (356) (1)
Non-controlling interests (1 130) (1 208) (6)
Normalised earnings attributable to ordinary equityholders of the group 26 411 24 471 8
OVERVIEW OF RESULTS 09
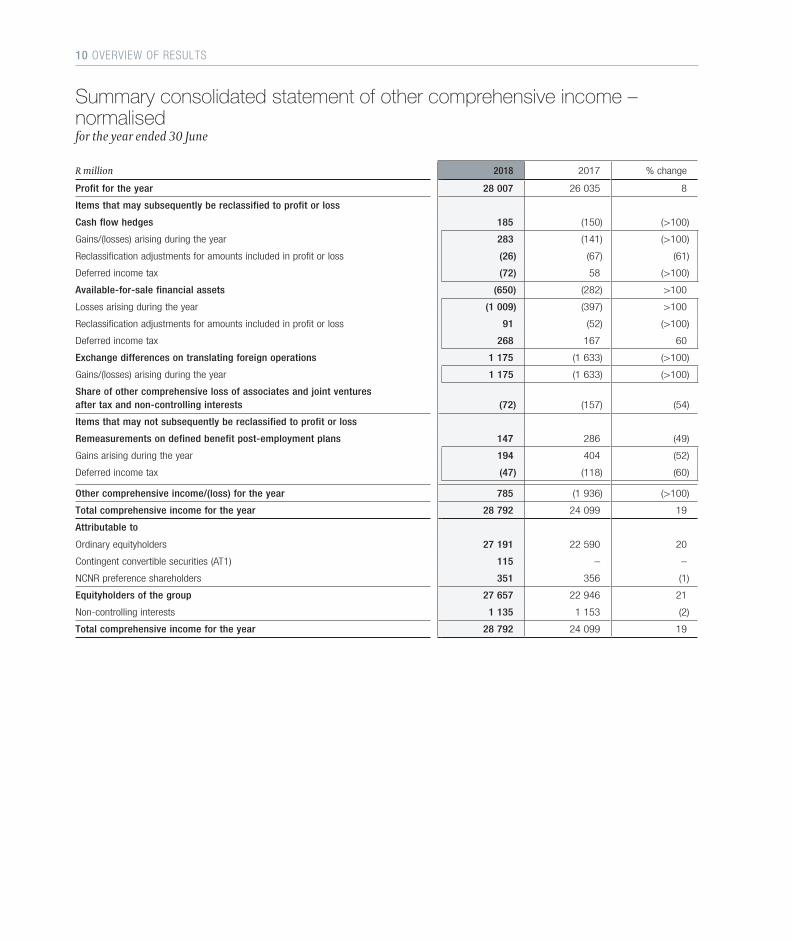
R million 2018 2017 % change
Profit for the year 28 007 26 035 8
Items that may subsequently be reclassified to profit or loss
Cash flow hedges 185 (150) (>100)
Gains/(losses) arising during the year 283 (141) (>100)
Reclassification adjustments for amounts included in profit or loss (26) (67) (61)
Deferred income tax (72) 58 (>100)
Available-for-sale financial assets (650) (282) >100
Losses arising during the year (1 009) (397) >100
Reclassification adjustments for amounts included in profit or loss 91 (52) (>100)
Deferred income tax 268 167 60
Exchange differences on translating foreign operations 1 175 (1 633) (>100)
Gains/(losses) arising during the year 1 175 (1 633) (>100)
Share of other comprehensive loss of associates and joint ventures after tax and non-controlling interests (72) (157) (54)
Items that may not subsequently be reclassified to profit or loss
Remeasurements on defined benefit post-employment plans 147 286 (49)
Gains arising during the year 194 404 (52)
Deferred income tax (47) (118) (60)
Other comprehensive income/(loss) for the year 785 (1 936) (>100)
Total comprehensive income for the year 28 792 24 099 19
Attributable to
Ordinary equityholders 27 191 22 590 20
Contingent convertible securities (AT1) 115 – –
NCNR preference shareholders 351 356 (1)
Equityholders of the group 27 657 22 946 21
Non-controlling interests 1 135 1 153 (2)
Total comprehensive income for the year 28 792 24 099 19
Summary consolidated statement of other comprehensive income – normalised for the year ended 30 June
10 OVERVIEW OF RESULTS
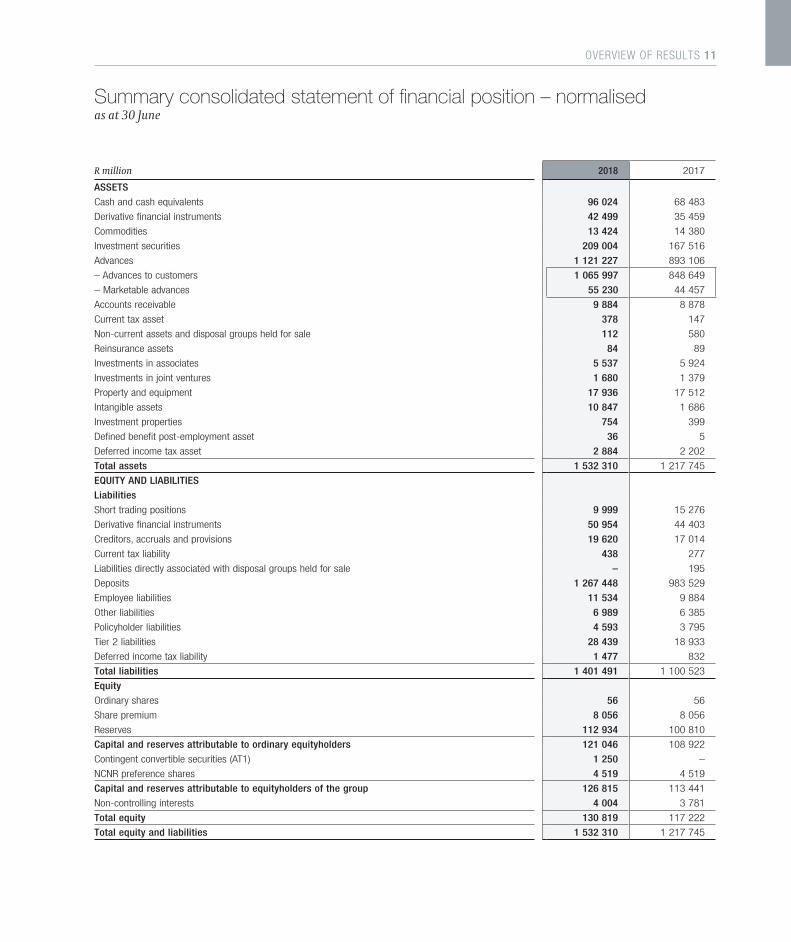
R million 2018 2017
ASSETS
Cash and cash equivalents 96 024 68 483
Derivative financial instruments 42 499 35 459
Commodities 13 424 14 380
Investment securities 209 004 167 516
Advances 1 121 227 893 106
– Advances to customers 1 065 997 848 649
– Marketable advances 55 230 44 457
Accounts receivable 9 884 8 878
Current tax asset 378 147
Non-current assets and disposal groups held for sale 112 580
Reinsurance assets 84 89
Investments in associates 5 537 5 924
Investments in joint ventures 1 680 1 379
Property and equipment 17 936 17 512
Intangible assets 10 847 1 686
Investment properties 754 399
Defined benefit post-employment asset 36 5
Deferred income tax asset 2 884 2 202
Total assets 1 532 310 1 217 745
EQUITY AND LIABILITIES
Liabilities
Short trading positions 9 999 15 276
Derivative financial instruments 50 954 44 403
Creditors, accruals and provisions 19 620 17 014
Current tax liability 438 277
Liabilities directly associated with disposal groups held for sale – 195
Deposits 1 267 448 983 529
Employee liabilities 11 534 9 884
Other liabilities 6 989 6 385
Policyholder liabilities 4 593 3 795
Tier 2 liabilities 28 439 18 933
Deferred income tax liability 1 477 832
Total liabilities 1 401 491 1 100 523
Equity
Ordinary shares 56 56
Share premium 8 056 8 056
Reserves 112 934 100 810
Capital and reserves attributable to ordinary equityholders 121 046 108 922
Contingent convertible securities (AT1) 1 250 –
NCNR preference shares 4 519 4 519
Capital and reserves attributable to equityholders of the group 126 815 113 441
Non-controlling interests 4 004 3 781
Total equity 130 819 117 222
Total equity and liabilities 1 532 310 1 217 745
Summary consolidated statement of financial position – normalised as at 30 June
OVERVIEW OF RESULTS 11
Ordinary share capital and ordinary equityholders' funds Ordinary share capital and ordinary equityholders’ funds
R millionShare
capitalShare
premium
Share capitaland sharepremium
Definedbenefit post-employment
reserve
Cash flowhedge
reserve
Share-based
paymentreserve
Available-for-salereserve
Foreigncurrency
translationreserve
Otherreserves
Retainedearnings
Reservesattributableto ordinary
equityholders
NCNRpreferenceshares andcontingentconvertible
securities**
Non-controlling
interestsTotal
equity
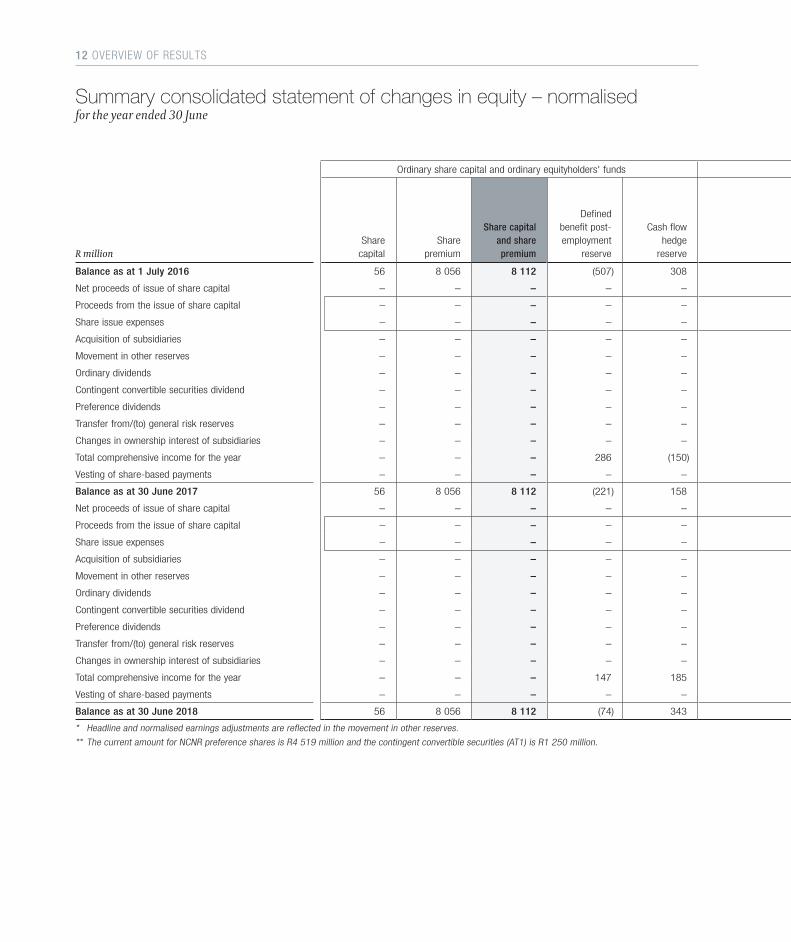
Balance as at 1 July 2016 56 8 056 8 112 (507) 308 9 (441) 3 310 374 88 629 91 682 4 519 3 801 108 114
Net proceeds of issue of share capital – – – – – – – – – – – – – –
Proceeds from the issue of share capital – – – – – – – – – – – – – –
Share issue expenses – – – – – – – – – – – – – –
Acquisition of subsidiaries – – – – – – – – – – – – 8 8
Movement in other reserves – – – – – 3 – – 195 (194)* 4 – 84* 88
Ordinary dividends – – – – – – – – – (13 294) (13 294) – (1 099) (14 393)
Contingent convertible securities dividend – – – – – – – – – – – – – –
Preference dividends – – – – – – – – – – – (356) – (356)
Transfer from/(to) general risk reserves – – – – – – – – 16 (16) – – – –
Changes in ownership interest of subsidiaries – – – – – – – – – (175) (175) – (166) (341)
Total comprehensive income for the year – – – 286 (150) – (274) (1 620) (123) 24 471 22 590 356 1 153 24 099
Vesting of share-based payments – – – – – (3) – – – 6 3 – – 3
Balance as at 30 June 2017 56 8 056 8 112 (221) 158 9 (715) 1 690 462 99 427 100 810 4 519 3 781 117 222
Net proceeds of issue of share capital – – – – – – – – – – – – 14 14
Proceeds from the issue of share capital – – – – – – – – – – – – 14 14
Share issue expenses – – – – – – – – – – – – – –
Acquisition of subsidiaries – – – – – – – (24) – – (24) 1 250 (22) 1 204
Movement in other reserves – – – – – 7 – – 191 (181)* 17 – 14* 31
Ordinary dividends – – – – – – – – – (14 921) (14 921) – (923) (15 844)
Contingent convertible securities dividend – – – – – – – – – – – (115) – (115)
Preference dividends – – – – – – – – – – – (351) – (351)
Transfer from/(to) general risk reserves – – – – – – – – 18 (18) – – – –
Changes in ownership interest of subsidiaries – – – – – – – – – (139) (139) – 5 (134)
Total comprehensive income for the year – – – 147 185 – (646) 1 166 (72) 26 411 27 191 466 1 135 28 792
Vesting of share-based payments – – – – – (12) – – – 12 – – – –
Balance as at 30 June 2018 56 8 056 8 112 (74) 343 4 (1 361) 2 832 599 110 591 112 934 5 769 4 004 130 819
* Headline and normalised earnings adjustments are reflected in the movement in other reserves.
** The current amount for NCNR preference shares is R4 519 million and the contingent convertible securities (AT1) is R1 250 million.
Summary consolidated statement of changes in equity – normalised for the year ended 30 June
12 OVERVIEW OF RESULTS
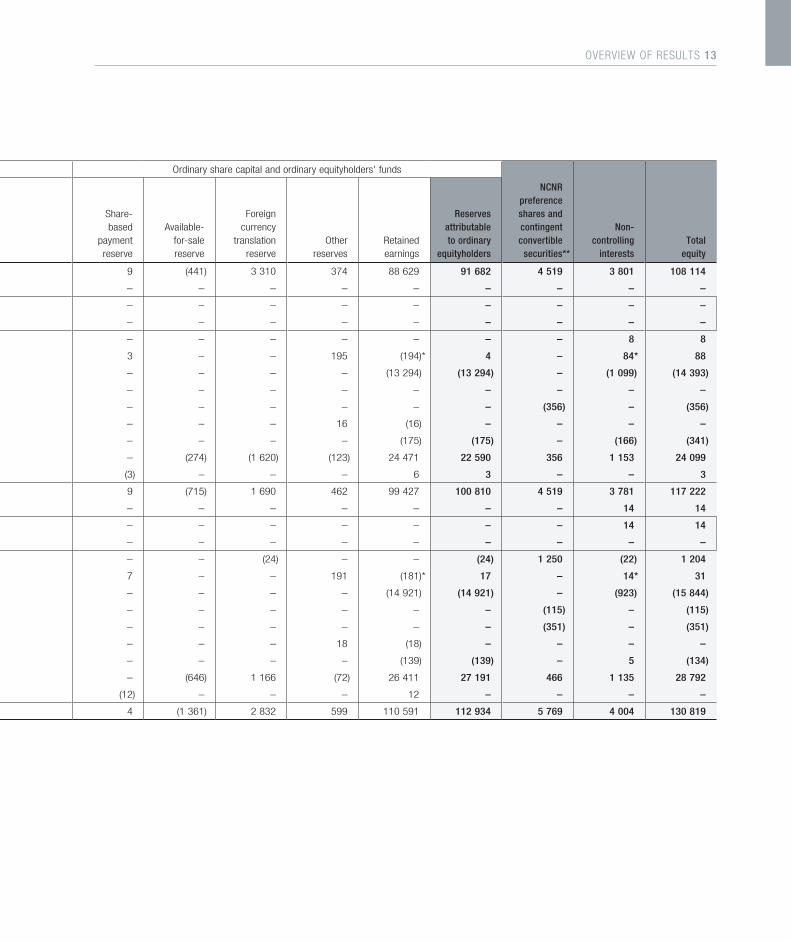
Ordinary share capital and ordinary equityholders' funds Ordinary share capital and ordinary equityholders’ funds
R millionShare
capitalShare
premium
Share capitaland sharepremium
Definedbenefit post-employment
reserve
Cash flowhedge
reserve
Share-based
paymentreserve
Available-for-salereserve
Foreigncurrency
translationreserve
Otherreserves
Retainedearnings
Reservesattributableto ordinary
equityholders
NCNRpreferenceshares andcontingentconvertible
securities**
Non-controlling
interestsTotal
equity
Balance as at 1 July 2016 56 8 056 8 112 (507) 308 9 (441) 3 310 374 88 629 91 682 4 519 3 801 108 114
Net proceeds of issue of share capital – – – – – – – – – – – – – –
Proceeds from the issue of share capital – – – – – – – – – – – – – –
Share issue expenses – – – – – – – – – – – – – –
Acquisition of subsidiaries – – – – – – – – – – – – 8 8
Movement in other reserves – – – – – 3 – – 195 (194)* 4 – 84* 88
Ordinary dividends – – – – – – – – – (13 294) (13 294) – (1 099) (14 393)
Contingent convertible securities dividend – – – – – – – – – – – – – –
Preference dividends – – – – – – – – – – – (356) – (356)
Transfer from/(to) general risk reserves – – – – – – – – 16 (16) – – – –
Changes in ownership interest of subsidiaries – – – – – – – – – (175) (175) – (166) (341)
Total comprehensive income for the year – – – 286 (150) – (274) (1 620) (123) 24 471 22 590 356 1 153 24 099
Vesting of share-based payments – – – – – (3) – – – 6 3 – – 3
Balance as at 30 June 2017 56 8 056 8 112 (221) 158 9 (715) 1 690 462 99 427 100 810 4 519 3 781 117 222
Net proceeds of issue of share capital – – – – – – – – – – – – 14 14
Proceeds from the issue of share capital – – – – – – – – – – – – 14 14
Share issue expenses – – – – – – – – – – – – – –
Acquisition of subsidiaries – – – – – – – (24) – – (24) 1 250 (22) 1 204
Movement in other reserves – – – – – 7 – – 191 (181)* 17 – 14* 31
Ordinary dividends – – – – – – – – – (14 921) (14 921) – (923) (15 844)
Contingent convertible securities dividend – – – – – – – – – – – (115) – (115)
Preference dividends – – – – – – – – – – – (351) – (351)
Transfer from/(to) general risk reserves – – – – – – – – 18 (18) – – – –
Changes in ownership interest of subsidiaries – – – – – – – – – (139) (139) – 5 (134)
Total comprehensive income for the year – – – 147 185 – (646) 1 166 (72) 26 411 27 191 466 1 135 28 792
Vesting of share-based payments – – – – – (12) – – – 12 – – – –
Balance as at 30 June 2018 56 8 056 8 112 (74) 343 4 (1 361) 2 832 599 110 591 112 934 5 769 4 004 130 819
* Headline and normalised earnings adjustments are reflected in the movement in other reserves.
** The current amount for NCNR preference shares is R4 519 million and the contingent convertible securities (AT1) is R1 250 million.
OVERVIEW OF RESULTS 13

14 OVERVIEW OF RESULTS
“FirstRand’s portfolio of businesses once again produced quality topline growth and a superior ROE. FNB’s results reflect another strong performance from its South African business, growing earnings 16% on the back of growth in customers, volumes and balance sheet, and successful cross-sell strategies. RMB’s diversified corporate and investment banking portfolio delivered a solid performance in a challenging market. WesBank had a tough year, however, it still delivered an acceptable return on equity. The recently acquired UK bank, Aldermore, enhanced group earnings and ROE.
These results represent another year of high quality earnings and sustainable returns for shareholders.”
ALAN PULLINGER CEO
OVERVIEW OF RESULTS 15
INTRODUCTIONFirstRand Limited is a portfolio of integrated financial services businesses operating in South Africa, certain markets in sub-Saharan Africa and the UK. Many of these businesses are leaders in their respective segments and markets, and offer a universal set of transactional, lending, investment and insurance products and services.
FirstRand can provide its customers with differentiated and competitive value propositions due to its unique and highly flexible model of leveraging the most appropriate brand, distribution channel, licence and operating platform available within the portfolio. This approach, which is underpinned by the disciplined allocation of financial resources and enabled by disruptive digital and data platforms, allows the group to fully optimise the franchise value of its portfolio. This has resulted in a long track record of consistent growth in high quality earnings, and superior and sustainable returns for shareholders.
GROUP STRATEGYFirstRand’s strategy accommodates a broad set of growth opportunities across the entire financial services universe from a product, market, segment and geographic perspective.
Currently group earnings are tilted towards South Africa and are generated by FirstRand’s large lending and transactional franchises, which have resulted in deep and loyal customer and client bases, and the group remains focused on protecting and growing these valuable banking businesses. FirstRand also believes that through the utilisation of the origination capabilities, operating platforms and
distribution networks of these businesses, it can diversify through capturing a larger share of profits from providing savings, insurance and investment products.
The growth opportunity is significant given the annual flows to other providers from FNB’s customer base alone. Through the manufacture and sale of its own insurance, savings and investment products, the group will, over time, offer differentiated value propositions for customers and generate new and potentially meaningful revenue streams.
The group’s strategy outside of its domestic market includes growing its presence and offerings in nine markets in the rest of Africa where it believes it can organically build competitive advantage and scale over time.
In the UK, the group has, over the past eight years, focused on organically transforming its existing business, MotoNovo, into the UK’s third-largest independent used vehicle financier. In the year under review, the group took the decision to acquire Aldermore Group plc (Aldermore), a UK specialist lender, and is in the process of integrating the two businesses. FirstRand believes this will result in an appropriately diversified UK business, with an established and scalable local funding platform, that represents a more sustainable and less volatile business model. The group can also extract additional value for shareholders over the medium to longer term through introducing its successful financial resource management methodology, unlocking synergies between MotoNovo and Aldermore, and over the longer term, potentially building a transactional offering.
16 OVERVIEW OF RESULTS
THE MACROECONOMIC ENVIRONMENTSouth Africa’s macroeconomic operating environment for the year to June 2018 was characterised by two distinctly different six-month periods.
In the first half of the group’s financial year, policy ambiguity and political uncertainty weighed on domestic risk appetite, economic activity, and investor and consumer sentiment. This was particularly acute following the medium-term budget policy statement in October 2017, and the resultant S&P downgrade of South Africa’s local currency sovereign rating to below investment grade.
The macroeconomic environment in the second half of the group’s financial year started more positively following the change in leadership of the ruling party, the appointment of President Ramaphosa as head of the government and a relatively investor-friendly cabinet reshuffle in February 2018. These changes allowed the country to avoid further downgrades and were followed by new board and management appointments at key state-owned enterprises (SOEs) and other government agencies. This resulted in improved foreign and domestic confidence.
It is clear, however, that progress on meaningful structural reform will be difficult and slow. GDP expanded only 1% over the first three quarters of the group’s financial year, credit growth remained in the mid-single digits and the unemployment rate remained static.
Relatively muted inflation did provide some support to household finances and this allowed the South African Reserve Bank (SARB) to cut interest rates 50 bps over the course of the year.
In the rest of the sub-Saharan region, conditions remained mixed. Economic activity in Namibia and Botswana was subdued mainly on the back of South African macroeconomic weakness. The Nigerian economy continued to recover and the macroeconomic outlook will improve on the strength of supportive oil prices.
In the UK, macroeconomic uncertainty continued to be driven by Brexit (which will formally take effect at the end of March 2019). This has weighed somewhat on UK economic activity, although unemployment continued to drift lower and wages trended upwards, resulting in consumer demand and house prices holding up reasonably well.
OVERVIEW OF RESULTSAgainst this mixed economic backdrop, FirstRand’s portfolio of businesses once again produced quality topline growth. The group continued to strengthen its balance sheet and protect its return profile. Normalised earnings for the year to 30 June 2018 increased 8% with a normalised ROE of 23.0%.
The table below shows a breakdown of sources of normalised earnings from the portfolio.
SOURCES OF NORMALISED EARNINGS
Year ended 30 June
R million 2018 % composition 2017 % composition % change
FNB 14 877 56 12 801 53 16
– FNB SA 14 767 12 776
– FNB Africa 110 25
RMB 7 327 28 6 918 28 6
WesBank 3 626 14 3 996 16 (9)
Aldermore* 276 1 – – –
FCC (including Group Treasury) and other**,#,† 656 2 1 112 4 (41)
NCNR preference dividend (351) (1) (356) (1) (1)
Normalised earnings 26 411 100 24 471 100 8
* After the dividend on the contingent convertible securities (AT1) of R115 million.
** Includes FirstRand Limited (company).# Includes capital endowment, the impact of accounting mismatches, interest rate management and foreign currency liquidity management.† FCC represents group-wide functions.
OVERVIEW OF RESULTS 17
FNB’s results reflect another strong operating performance from its domestic franchise, driven by strong non-interest revenue (NIR) growth on the back of ongoing customer gains and increased transactional volumes, and high quality net interest income (NII) growth, particularly from deposit generation. FNB’s rest of Africa portfolio showed an improved performance year-on-year.
RMB’s portfolio also delivered a strong performance driven by good growth in high quality earnings and solid operational leverage.
WesBank’s performance remained mixed with both the South African retail and UK VAF businesses posting declines in profits, whilst the personal loans business performed strongly and corporate delivered a solid performance.
The group’s performance includes a three-month profit contribution from Aldermore, which was acquired by FirstRand effective 1 April 2018. The contribution to group earnings was R276 million post the AT1 dividend payment.
FCC’s performance was negatively affected by lower central credit overlay releases, the first-time inclusion of the amortisation of the intangible assets associated with the acquisition of Aldermore, Aldermore deal fees and an increase in operational expenses.
Total group NII increased 10% (7% excluding Aldermore), underpinned by strong growth in deposits (+29% total, +11% excluding Aldermore) and solid advances growth (+25% total, +7% excluding Aldermore), offset by negative capital and deposit rate endowment following the 25 bps cuts in the repo rate in July 2017 and March 2018. Lending margins at FNB benefited from repricing new residential mortgage business and lower funding costs. Lending margins at RMB, however, remained under pressure from competition, particularly in investment-grade lending, and ongoing term funding pressures and liquidity costs. Both RMB and WesBank’s corporate business continued to exercise discipline in origination to preserve returns.
Group NIR increased 7% (6% excluding Aldermore) and reflects strong fee and commission income growth of 10%, supported by higher volumes across FNB’s digital and electronic channels and increased customer numbers. Private equity realisations also supported group NIR, albeit at lower levels than the previous year. Insurance revenue increased 6%, benefiting from strong volume growth of 20% and 8%, respectively, in funeral and credit life policies, resulting in annual premium income increasing 35% year-on-year. Fee, commission and insurance income represents 79% of group operational NIR.
Total cost growth of 9% reflects the inclusion of Aldermore from 1 April 2018. Excluding Aldermore, operating cost growth (7%) was slightly lower than the first half of the year, but continues to trend
above inflation due to ongoing investment in insurance and asset management activities, platforms to extract further efficiencies and the build-out of the group’s footprint in the rest of Africa. Despite these cost pressures, the group’s cost-to-income ratio only increased marginally from 51.0% to 51.2% due to the resilient topline growth.
The group’s credit loss ratio of 90 bps (84 bps including Aldermore) is marginally down year-on-year and remains well below the group’s through-the-cycle threshold, reflecting the positive impact of the group’s origination strategies and provisioning policies over the past two financial years. Many of the group’s lending books are trending in line or better than expectations, particularly unsecured and corporate credit. The credit impairment charge, however, increased 6% and was driven by the following factors:
> a continued deterioration in WesBank’s SA VAF charge, mainly due to ongoing elevated arrears and NPLs and an increase in the emergence period;
> continued normalisation of the MotoNovo impairment charge, reflecting new business strain given strong book growth over multiple periods, the impact of business written prior to the risk cuts in the previous year and continued conservatism in portfolio impairments;
> an increase in FNB’s commercial segment, reflecting new business strain which was expected given the continued growth in new customers, cross-sell and up-sell strategies and the impact of the ongoing drought in certain areas of South Africa;
> higher NPLs in FNB card and personal loans, but in line with expectations given the strong book growth in the prior year, however, the charge benefited from active collection strategies;
> a further increase in FNB’s and WesBank’s rest of Africa charge, reflecting the ongoing tough macros in various of the jurisdictions the group operates in and increased conservatism in provisions;
> an increase in corporate NPLs due to the migration of certain secured counterparties. The impairment charge benefited from the proactive provisioning in prior years; and
> a lower charge in residential mortgages, due to loss given default credit model recalibrations, despite higher NPL formation given cycle-driven normalisation.
Overall portfolio provisions increased 6% and reflect continued conservative provisioning on the back of book growth, and the still constrained macroeconomic operating environment in South Africa and many of the African jurisdictions the group operates in.
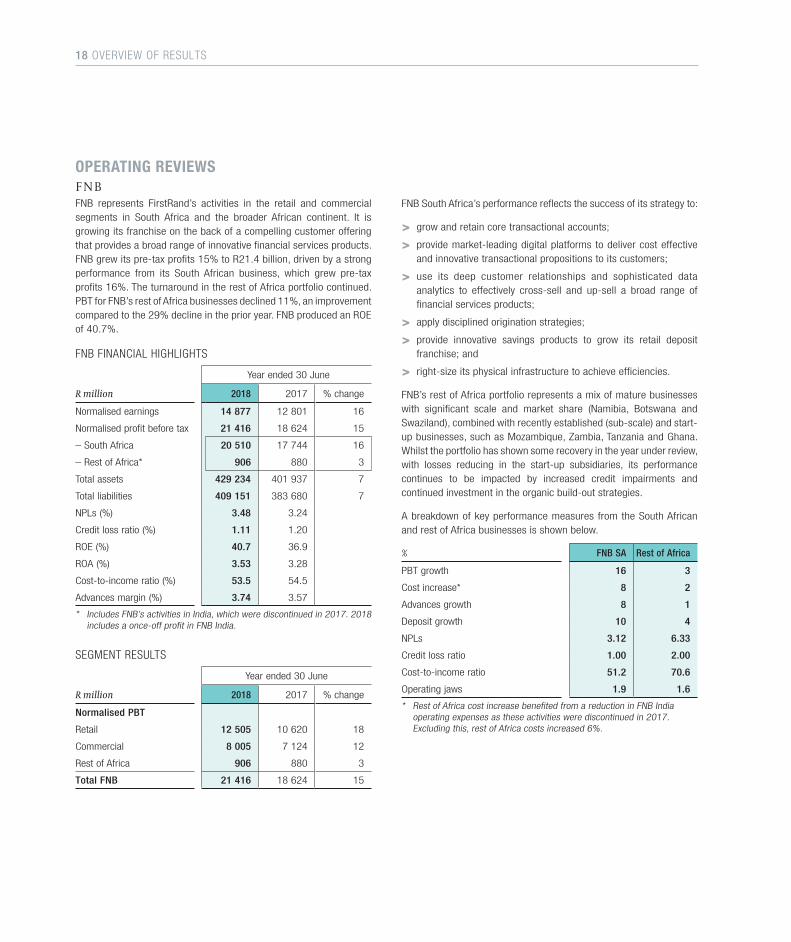
OPERATING REVIEWSF N B FNB represents FirstRand’s activities in the retail and commercial segments in South Africa and the broader African continent. It is growing its franchise on the back of a compelling customer offering that provides a broad range of innovative financial services products. FNB grew its pre-tax profits 15% to R21.4 billion, driven by a strong performance from its South African business, which grew pre-tax profits 16%. The turnaround in the rest of Africa portfolio continued. PBT for FNB’s rest of Africa businesses declined 11%, an improvement compared to the 29% decline in the prior year. FNB produced an ROE of 40.7%.
FNB FINANCIAL HIGHLIGHTS
Year ended 30 June
R million 2018 2017 % change
Normalised earnings 14 877 12 801 16
Normalised profit before tax 21 416 18 624 15
– South Africa 20 510 17 744 16
– Rest of Africa* 906 880 3
Total assets 429 234 401 937 7
Total liabilities 409 151 383 680 7
NPLs (%) 3.48 3.24
Credit loss ratio (%) 1.11 1.20
ROE (%) 40.7 36.9
ROA (%) 3.53 3.28
Cost-to-income ratio (%) 53.5 54.5
Advances margin (%) 3.74 3.57
* Includes FNB’s activities in India, which were discontinued in 2017. 2018 includes a once-off profit in FNB India.
SEGMENT RESULTS
Year ended 30 June
R million 2018 2017 % change
Normalised PBT
Retail 12 505 10 620 18
Commercial 8 005 7 124 12
Rest of Africa 906 880 3
Total FNB 21 416 18 624 15
FNB South Africa’s performance reflects the success of its strategy to:
> grow and retain core transactional accounts;
> provide market-leading digital platforms to deliver cost effective and innovative transactional propositions to its customers;
> use its deep customer relationships and sophisticated data analytics to effectively cross-sell and up-sell a broad range of financial services products;
> apply disciplined origination strategies;
> provide innovative savings products to grow its retail deposit franchise; and
> right-size its physical infrastructure to achieve efficiencies.
FNB’s rest of Africa portfolio represents a mix of mature businesses with significant scale and market share (Namibia, Botswana and Swaziland), combined with recently established (sub-scale) and start-up businesses, such as Mozambique, Zambia, Tanzania and Ghana. Whilst the portfolio has shown some recovery in the year under review, with losses reducing in the start-up subsidiaries, its performance continues to be impacted by increased credit impairments and continued investment in the organic build-out strategies.
A breakdown of key performance measures from the South African and rest of Africa businesses is shown below.
% FNB SA Rest of Africa
PBT growth 16 3
Cost increase* 8 2
Advances growth 8 1
Deposit growth 10 4
NPLs 3.12 6.33
Credit loss ratio 1.00 2.00
Cost-to-income ratio 51.2 70.6
Operating jaws 1.9 1.6
* Rest of Africa cost increase benefited from a reduction in FNB India operating expenses as these activities were discontinued in 2017. Excluding this, rest of Africa costs increased 6%.
18 OVERVIEW OF RESULTS
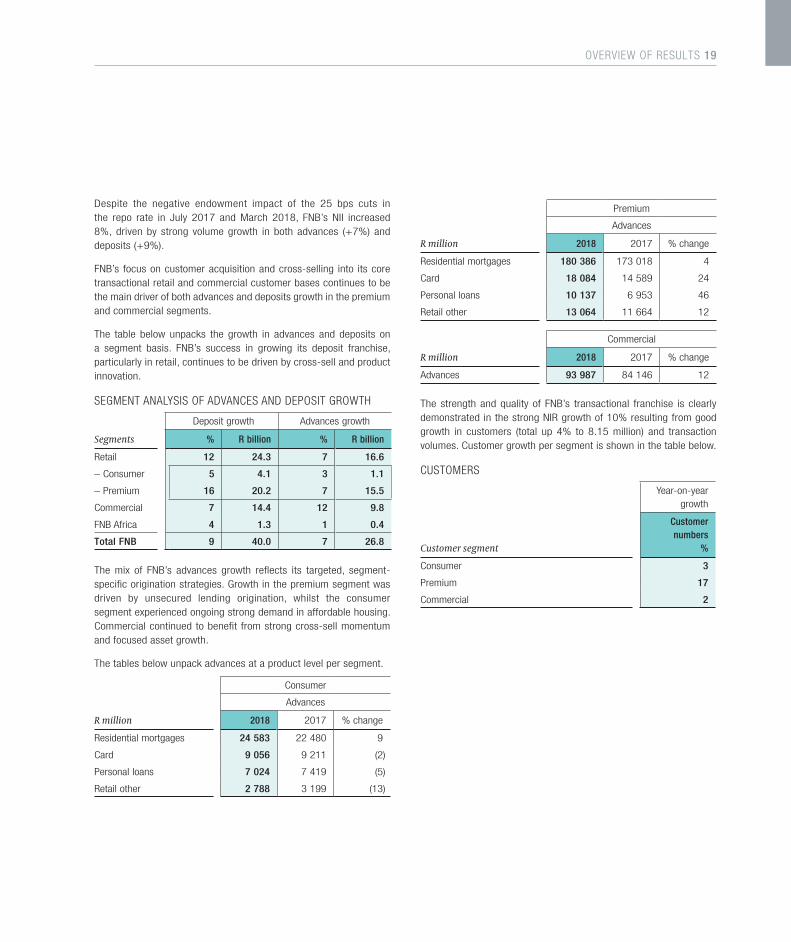
Despite the negative endowment impact of the 25 bps cuts in the repo rate in July 2017 and March 2018, FNB’s NII increased 8%, driven by strong volume growth in both advances (+7%) and deposits (+9%).
FNB’s focus on customer acquisition and cross-selling into its core transactional retail and commercial customer bases continues to be the main driver of both advances and deposits growth in the premium and commercial segments.
The table below unpacks the growth in advances and deposits on a segment basis. FNB’s success in growing its deposit franchise, particularly in retail, continues to be driven by cross-sell and product innovation.
SEGMENT ANALYSIS OF ADVANCES AND DEPOSIT GROWTH
Deposit growth Advances growth
Segments % R billion % R billion
Retail 12 24.3 7 16.6
– Consumer 5 4.1 3 1.1
– Premium 16 20.2 7 15.5
Commercial 7 14.4 12 9.8
FNB Africa 4 1.3 1 0.4
Total FNB 9 40.0 7 26.8
The mix of FNB’s advances growth reflects its targeted, segment-specific origination strategies. Growth in the premium segment was driven by unsecured lending origination, whilst the consumer segment experienced ongoing strong demand in affordable housing. Commercial continued to benefit from strong cross-sell momentum and focused asset growth.
The tables below unpack advances at a product level per segment.
Consumer
Advances
R million 2018 2017 % change
Residential mortgages 24 583 22 480 9
Card 9 056 9 211 (2)
Personal loans 7 024 7 419 (5)
Retail other 2 788 3 199 (13)
Premium
Advances
R million 2018 2017 % change
Residential mortgages 180 386 173 018 4
Card 18 084 14 589 24
Personal loans 10 137 6 953 46
Retail other 13 064 11 664 12
Commercial
R million 2018 2017 % change
Advances 93 987 84 146 12
The strength and quality of FNB’s transactional franchise is clearly demonstrated in the strong NIR growth of 10% resulting from good growth in customers (total up 4% to 8.15 million) and transaction volumes. Customer growth per segment is shown in the table below.
CUSTOMERS
Year-on-yeargrowth
Customer segment
Customer numbers
%
Consumer 3
Premium 17
Commercial 2
OVERVIEW OF RESULTS 19
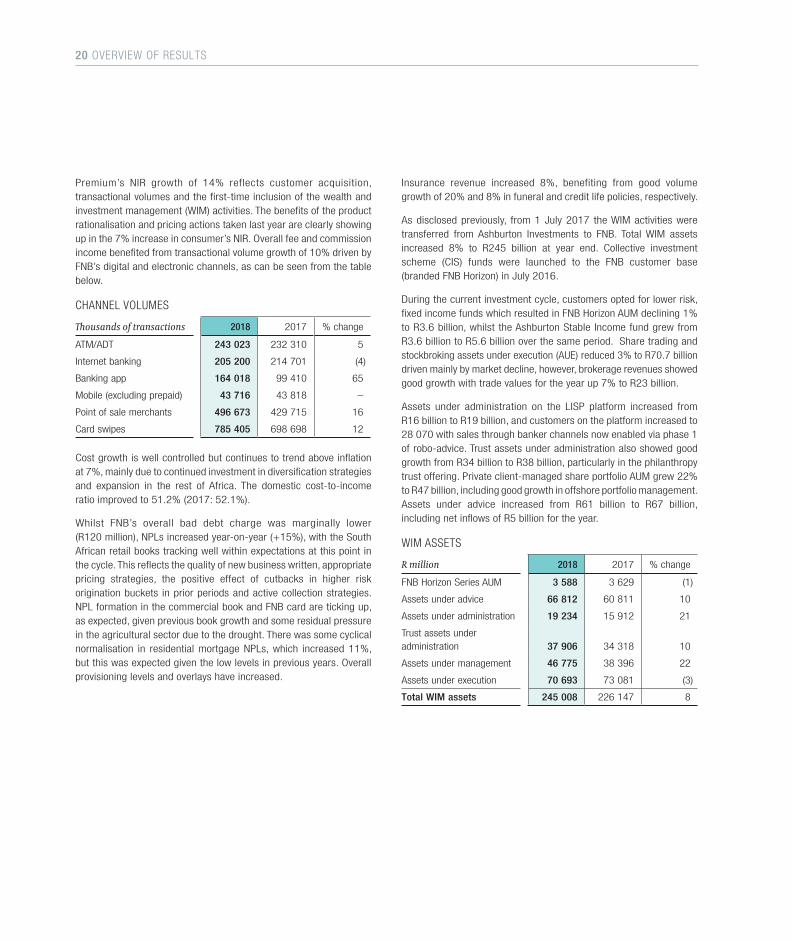
Premium’s NIR growth of 14% reflects customer acquisition, transactional volumes and the first-time inclusion of the wealth and investment management (WIM) activities. The benefits of the product rationalisation and pricing actions taken last year are clearly showing up in the 7% increase in consumer’s NIR. Overall fee and commission income benefited from transactional volume growth of 10% driven by FNB’s digital and electronic channels, as can be seen from the table below.
CHANNEL VOLUMES
Thousands of transactions 2018 2017 % change
ATM/ADT 243 023 232 310 5
Internet banking 205 200 214 701 (4)
Banking app 164 018 99 410 65
Mobile (excluding prepaid) 43 716 43 818 –
Point of sale merchants 496 673 429 715 16
Card swipes 785 405 698 698 12
Cost growth is well controlled but continues to trend above inflation at 7%, mainly due to continued investment in diversification strategies and expansion in the rest of Africa. The domestic cost-to-income ratio improved to 51.2% (2017: 52.1%).
Whilst FNB’s overall bad debt charge was marginally lower (R120 million), NPLs increased year-on-year (+15%), with the South African retail books tracking well within expectations at this point in the cycle. This reflects the quality of new business written, appropriate pricing strategies, the positive effect of cutbacks in higher risk origination buckets in prior periods and active collection strategies. NPL formation in the commercial book and FNB card are ticking up, as expected, given previous book growth and some residual pressure in the agricultural sector due to the drought. There was some cyclical normalisation in residential mortgage NPLs, which increased 11%, but this was expected given the low levels in previous years. Overall provisioning levels and overlays have increased.
Insurance revenue increased 8%, benefiting from good volume growth of 20% and 8% in funeral and credit life policies, respectively.
As disclosed previously, from 1 July 2017 the WIM activities were transferred from Ashburton Investments to FNB. Total WIM assets increased 8% to R245 billion at year end. Collective investment scheme (CIS) funds were launched to the FNB customer base (branded FNB Horizon) in July 2016.
During the current investment cycle, customers opted for lower risk, fixed income funds which resulted in FNB Horizon AUM declining 1% to R3.6 billion, whilst the Ashburton Stable Income fund grew from R3.6 billion to R5.6 billion over the same period. Share trading and stockbroking assets under execution (AUE) reduced 3% to R70.7 billion driven mainly by market decline, however, brokerage revenues showed good growth with trade values for the year up 7% to R23 billion.
Assets under administration on the LISP platform increased from R16 billion to R19 billion, and customers on the platform increased to 28 070 with sales through banker channels now enabled via phase 1 of robo-advice. Trust assets under administration also showed good growth from R34 billion to R38 billion, particularly in the philanthropy trust offering. Private client-managed share portfolio AUM grew 22% to R47 billion, including good growth in offshore portfolio management. Assets under advice increased from R61 billion to R67 billion, including net inflows of R5 billion for the year.
WIM ASSETS
R million 2018 2017 % change
FNB Horizon Series AUM 3 588 3 629 (1)
Assets under advice 66 812 60 811 10
Assets under administration 19 234 15 912 21
Trust assets under administration 37 906 34 318 10
Assets under management 46 775 38 396 22
Assets under execution 70 693 73 081 (3)
Total WIM assets 245 008 226 147 8
20 OVERVIEW OF RESULTS
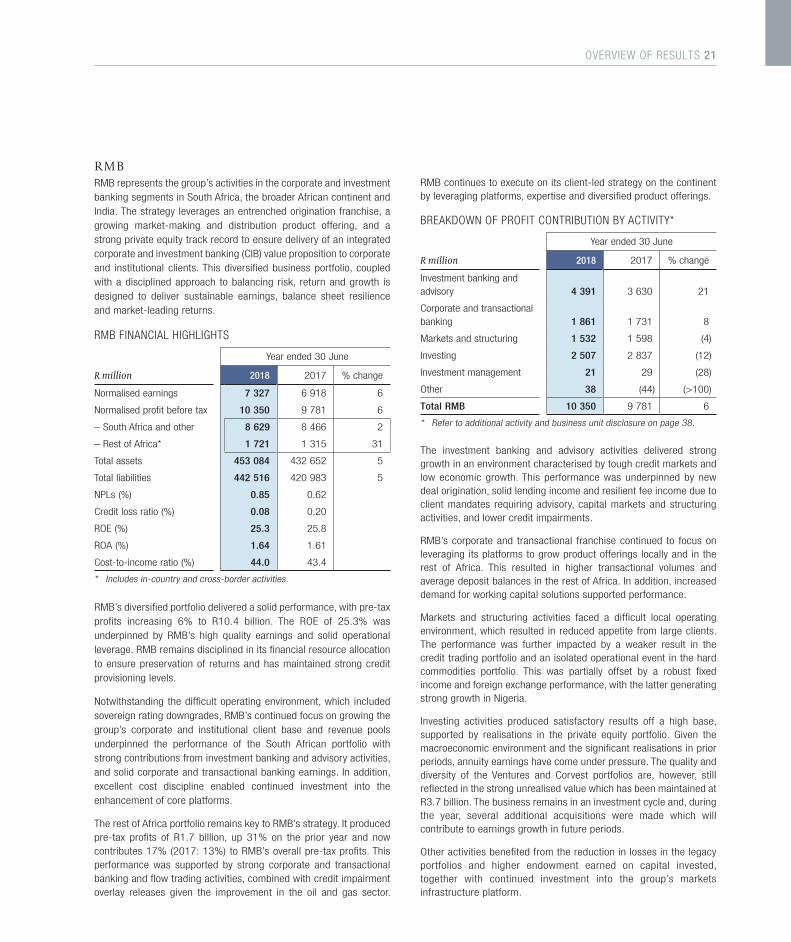
R M B RMB represents the group’s activities in the corporate and investment banking segments in South Africa, the broader African continent and India. The strategy leverages an entrenched origination franchise, a growing market-making and distribution product offering, and a strong private equity track record to ensure delivery of an integrated corporate and investment banking (CIB) value proposition to corporate and institutional clients. This diversified business portfolio, coupled with a disciplined approach to balancing risk, return and growth is designed to deliver sustainable earnings, balance sheet resilience and market-leading returns.
RMB FINANCIAL HIGHLIGHTS
Year ended 30 June
R million 2018 2017 % change
Normalised earnings 7 327 6 918 6
Normalised profit before tax 10 350 9 781 6
– South Africa and other 8 629 8 466 2
– Rest of Africa* 1 721 1 315 31
Total assets 453 084 432 652 5
Total liabilities 442 516 420 983 5
NPLs (%) 0.85 0.62
Credit loss ratio (%) 0.08 0.20
ROE (%) 25.3 25.8
ROA (%) 1.64 1.61
Cost-to-income ratio (%) 44.0 43.4
* Includes in-country and cross-border activities.
RMB’s diversified portfolio delivered a solid performance, with pre-tax profits increasing 6% to R10.4 billion. The ROE of 25.3% was underpinned by RMB’s high quality earnings and solid operational leverage. RMB remains disciplined in its financial resource allocation to ensure preservation of returns and has maintained strong credit provisioning levels.
Notwithstanding the difficult operating environment, which included sovereign rating downgrades, RMB’s continued focus on growing the group’s corporate and institutional client base and revenue pools underpinned the performance of the South African portfolio with strong contributions from investment banking and advisory activities, and solid corporate and transactional banking earnings. In addition, excellent cost discipline enabled continued investment into the enhancement of core platforms.
The rest of Africa portfolio remains key to RMB’s strategy. It produced pre-tax profits of R1.7 billion, up 31% on the prior year and now contributes 17% (2017: 13%) to RMB’s overall pre-tax profits. This performance was supported by strong corporate and transactional banking and flow trading activities, combined with credit impairment overlay releases given the improvement in the oil and gas sector.
RMB continues to execute on its client-led strategy on the continent by leveraging platforms, expertise and diversified product offerings.
BREAKDOWN OF PROFIT CONTRIBUTION BY ACTIVITY*
Year ended 30 June
R million 2018 2017 % change
Investment banking and advisory 4 391 3 630 21
Corporate and transactional banking 1 861 1 731 8
Markets and structuring 1 532 1 598 (4)
Investing 2 507 2 837 (12)
Investment management 21 29 (28)
Other 38 (44) (>100)
Total RMB 10 350 9 781 6
* Refer to additional activity and business unit disclosure on page 38.
The investment banking and advisory activities delivered strong growth in an environment characterised by tough credit markets and low economic growth. This performance was underpinned by new deal origination, solid lending income and resilient fee income due to client mandates requiring advisory, capital markets and structuring activities, and lower credit impairments.
RMB’s corporate and transactional franchise continued to focus on leveraging its platforms to grow product offerings locally and in the rest of Africa. This resulted in higher transactional volumes and average deposit balances in the rest of Africa. In addition, increased demand for working capital solutions supported performance.
Markets and structuring activities faced a difficult local operating environment, which resulted in reduced appetite from large clients. The performance was further impacted by a weaker result in the credit trading portfolio and an isolated operational event in the hard commodities portfolio. This was partially offset by a robust fixed income and foreign exchange performance, with the latter generating strong growth in Nigeria.
Investing activities produced satisfactory results off a high base, supported by realisations in the private equity portfolio. Given the macroeconomic environment and the significant realisations in prior periods, annuity earnings have come under pressure. The quality and diversity of the Ventures and Corvest portfolios are, however, still reflected in the strong unrealised value which has been maintained at R3.7 billion. The business remains in an investment cycle and, during the year, several additional acquisitions were made which will contribute to earnings growth in future periods.
Other activities benefited from the reduction in losses in the legacy portfolios and higher endowment earned on capital invested, together with continued investment into the group’s markets infrastructure platform.
OVERVIEW OF RESULTS 21
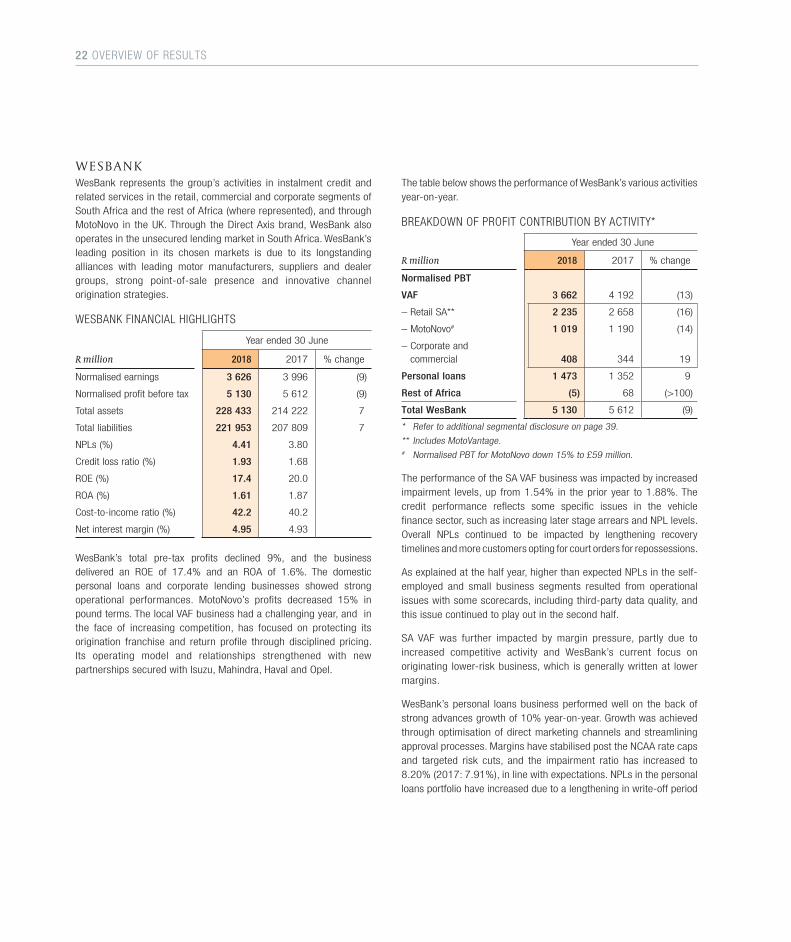
W E S B A N KWesBank represents the group’s activities in instalment credit and related services in the retail, commercial and corporate segments of South Africa and the rest of Africa (where represented), and through MotoNovo in the UK. Through the Direct Axis brand, WesBank also operates in the unsecured lending market in South Africa. WesBank’s leading position in its chosen markets is due to its longstanding alliances with leading motor manufacturers, suppliers and dealer groups, strong point-of-sale presence and innovative channel origination strategies.
WESBANK FINANCIAL HIGHLIGHTS
Year ended 30 June
R million 2018 2017 % change
Normalised earnings 3 626 3 996 (9)
Normalised profit before tax 5 130 5 612 (9)
Total assets 228 433 214 222 7
Total liabilities 221 953 207 809 7
NPLs (%) 4.41 3.80
Credit loss ratio (%) 1.93 1.68
ROE (%) 17.4 20.0
ROA (%) 1.61 1.87
Cost-to-income ratio (%) 42.2 40.2
Net interest margin (%) 4.95 4.93
WesBank’s total pre-tax profits declined 9%, and the business delivered an ROE of 17.4% and an ROA of 1.6%. The domestic personal loans and corporate lending businesses showed strong operational performances. MotoNovo’s profits decreased 15% in pound terms. The local VAF business had a challenging year, and in the face of increasing competition, has focused on protecting its origination franchise and return profile through disciplined pricing. Its operating model and relationships strengthened with new partnerships secured with Isuzu, Mahindra, Haval and Opel.
The table below shows the performance of WesBank’s various activities year-on-year.
BREAKDOWN OF PROFIT CONTRIBUTION BY ACTIVITY*
Year ended 30 June
R million 2018 2017 % change
Normalised PBT
VAF 3 662 4 192 (13)
– Retail SA** 2 235 2 658 (16)
– MotoNovo# 1 019 1 190 (14)
– Corporate and commercial 408 344 19
Personal loans 1 473 1 352 9
Rest of Africa (5) 68 (>100)
Total WesBank 5 130 5 612 (9)
* Refer to additional segmental disclosure on page 39.
** Includes MotoVantage.# Normalised PBT for MotoNovo down 15% to £59 million.
The performance of the SA VAF business was impacted by increased impairment levels, up from 1.54% in the prior year to 1.88%. The credit performance reflects some specific issues in the vehicle finance sector, such as increasing later stage arrears and NPL levels. Overall NPLs continued to be impacted by lengthening recovery timelines and more customers opting for court orders for repossessions.
As explained at the half year, higher than expected NPLs in the self-employed and small business segments resulted from operational issues with some scorecards, including third-party data quality, and this issue continued to play out in the second half.
SA VAF was further impacted by margin pressure, partly due to increased competitive activity and WesBank’s current focus on originating lower-risk business, which is generally written at lower margins.
WesBank’s personal loans business performed well on the back of strong advances growth of 10% year-on-year. Growth was achieved through optimisation of direct marketing channels and streamlining approval processes. Margins have stabilised post the NCAA rate caps and targeted risk cuts, and the impairment ratio has increased to 8.20% (2017: 7.91%), in line with expectations. NPLs in the personal loans portfolio have increased due to a lengthening in write-off period
22 OVERVIEW OF RESULTS
in anticipation of the adoption of IFRS 9. Similar impairment increases and higher provisions also impacted associate earnings.
The local corporate business posted a strong operational performance, albeit off a low base and despite a general slowdown in the sectors served. Volumes have grown strongly in the SME and business segment due to greater collaboration with FNB commercial. Impairments reduced 28% year-on-year on the back of a 5% improvement in NPLs.
MotoNovo’s performance was impacted primarily by increased investment spend, margin pressure and rising credit impairments.
The lending margin pressure resulted from competitors benefiting from lower cost of funding. In addition, MotoNovo incurred costs related to building the online platform (findandfundmycar.com) and experienced some strain in the personal loans book due to its previous strategy of diversification.
FirstRand believes that some of these pressures will be alleviated when MotoNovo is integrated into Aldermore as it will no longer be disadvantaged from a cost of funds perspective and will not require further investment in diversification strategies given the mix of the Aldermore portfolio.
The MotoNovo credit performance is in line with expectations, particularly following a number of years of strong book growth. The business has taken specific actions regarding origination; these actions included targeted risk cuts and termination of certain origination relationships, which were resulting in higher risk new business. These actions also resulted in MotoNovo’s new business production contracting 4% in pound terms (7% in rand terms). Increased NPLs and ongoing prudent provisioning resulted in an increase in the pound impairment ratio of 1.56% for the year under review (2017: 1.46%).
Total WesBank NIR growth continues to largely track growth in new units, which declined year-on-year and reflects subdued insurance revenues. Other NIR decreased as a result of the sale of RentWorks in November 2017, and the prior year also included a once-off credit of R68 million relating to the release of certain reserves. Excluding the effect of this, NIR increased 6% year-on-year.
WesBank continues to control operational expenditure and improve efficiencies. Its cost-to-income ratio has, however, increased mainly due to increased investment.
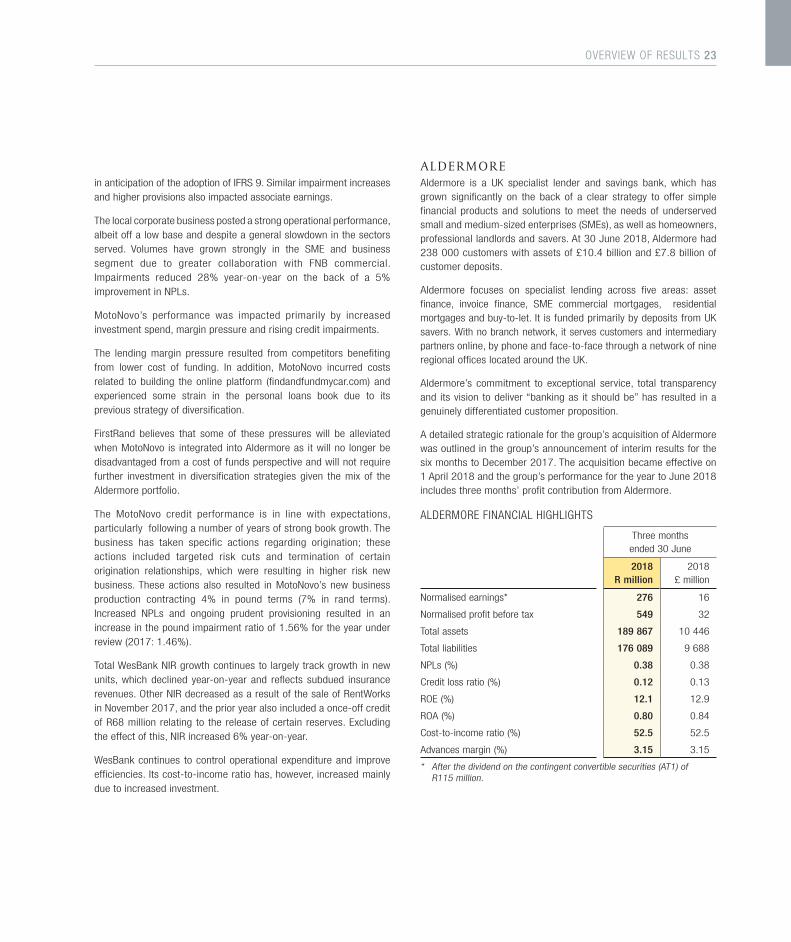
A L D E R M O R E Aldermore is a UK specialist lender and savings bank, which has grown significantly on the back of a clear strategy to offer simple financial products and solutions to meet the needs of underserved small and medium-sized enterprises (SMEs), as well as homeowners, professional landlords and savers. At 30 June 2018, Aldermore had 238 000 customers with assets of £10.4 billion and £7.8 billion of customer deposits.
Aldermore focuses on specialist lending across five areas: asset finance, invoice finance, SME commercial mortgages, residential mortgages and buy-to-let. It is funded primarily by deposits from UK savers. With no branch network, it serves customers and intermediary partners online, by phone and face-to-face through a network of nine regional offices located around the UK.
Aldermore’s commitment to exceptional service, total transparency and its vision to deliver “banking as it should be” has resulted in a genuinely differentiated customer proposition.
A detailed strategic rationale for the group’s acquisition of Aldermore was outlined in the group’s announcement of interim results for the six months to December 2017. The acquisition became effective on 1 April 2018 and the group’s performance for the year to June 2018 includes three months’ profit contribution from Aldermore.
ALDERMORE FINANCIAL HIGHLIGHTS
Three months ended 30 June
2018R million
2018£ million
Normalised earnings* 276 16
Normalised profit before tax 549 32
Total assets 189 867 10 446
Total liabilities 176 089 9 688
NPLs (%) 0.38 0.38
Credit loss ratio (%) 0.12 0.13
ROE (%) 12.1 12.9
ROA (%) 0.80 0.84
Cost-to-income ratio (%) 52.5 52.5
Advances margin (%) 3.15 3.15
* After the dividend on the contingent convertible securities (AT1) of R115 million.
OVERVIEW OF RESULTS 23
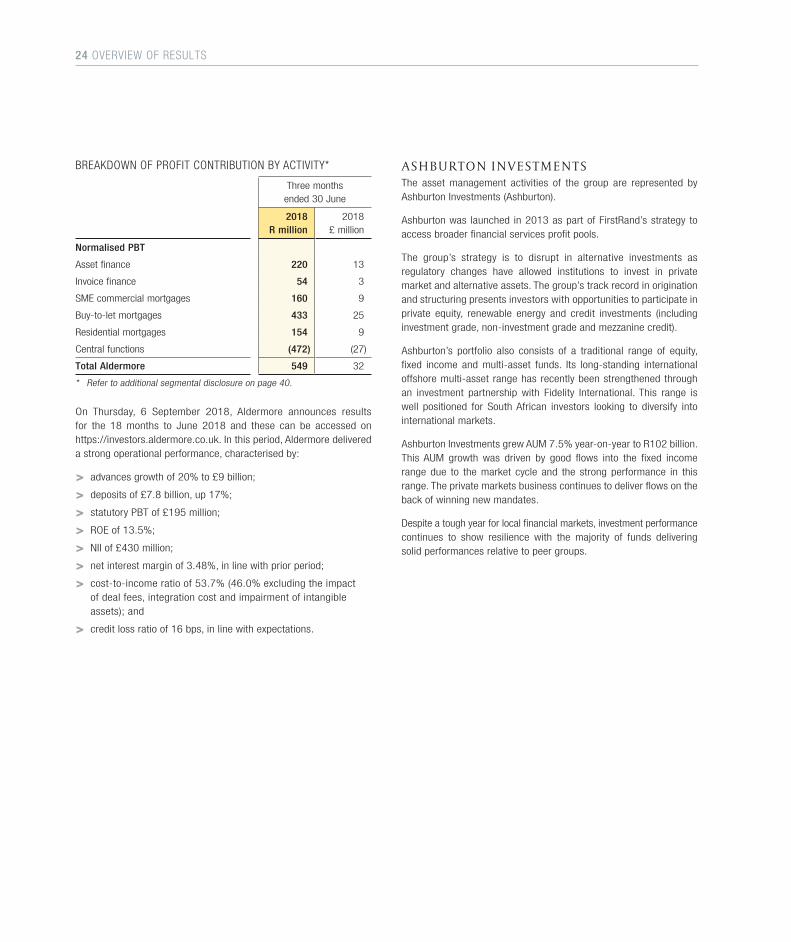
BREAKDOWN OF PROFIT CONTRIBUTION BY ACTIVITY*
Three months ended 30 June
2018R million
2018£ million
Normalised PBT
Asset finance 220 13
Invoice finance 54 3
SME commercial mortgages 160 9
Buy-to-let mortgages 433 25
Residential mortgages 154 9
Central functions (472) (27)
Total Aldermore 549 32
* Refer to additional segmental disclosure on page 40.
On Thursday, 6 September 2018, Aldermore announces results for the 18 months to June 2018 and these can be accessed on https://investors.aldermore.co.uk. In this period, Aldermore delivered a strong operational performance, characterised by:
> advances growth of 20% to £9 billion;
> deposits of £7.8 billion, up 17%;
> statutory PBT of £195 million;
> ROE of 13.5%;
> NII of £430 million;
> net interest margin of 3.48%, in line with prior period;
> cost-to-income ratio of 53.7% (46.0% excluding the impact of deal fees, integration cost and impairment of intangible assets); and
> credit loss ratio of 16 bps, in line with expectations.
A S H B U RT O N I N V E S T M E N T SThe asset management activities of the group are represented by Ashburton Investments (Ashburton).
Ashburton was launched in 2013 as part of FirstRand’s strategy to access broader financial services profit pools.
The group’s strategy is to disrupt in alternative investments as regulatory changes have allowed institutions to invest in private market and alternative assets. The group’s track record in origination and structuring presents investors with opportunities to participate in private equity, renewable energy and credit investments (including investment grade, non-investment grade and mezzanine credit).
Ashburton’s portfolio also consists of a traditional range of equity, fixed income and multi-asset funds. Its long-standing international offshore multi-asset range has recently been strengthened through an investment partnership with Fidelity International. This range is well positioned for South African investors looking to diversify into international markets.
Ashburton Investments grew AUM 7.5% year-on-year to R102 billion. This AUM growth was driven by good flows into the fixed income range due to the market cycle and the strong performance in this range. The private markets business continues to deliver flows on the back of winning new mandates.
Despite a tough year for local financial markets, investment performance continues to show resilience with the majority of funds delivering solid performances relative to peer groups.
24 OVERVIEW OF RESULTS
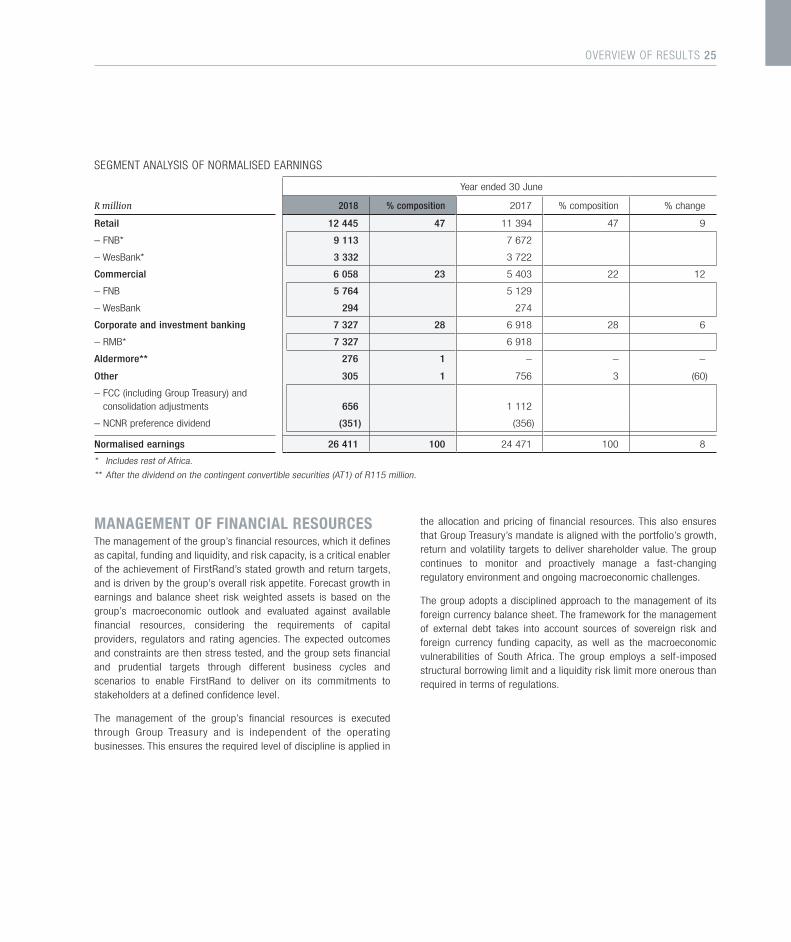
SEGMENT ANALYSIS OF NORMALISED EARNINGS
Year ended 30 June
R million 2018 % composition 2017 % composition % change
Retail 12 445 47 11 394 47 9
– FNB* 9 113 7 672
– WesBank* 3 332 3 722
Commercial 6 058 23 5 403 22 12
– FNB 5 764 5 129
– WesBank 294 274
Corporate and investment banking 7 327 28 6 918 28 6
– RMB* 7 327 6 918
Aldermore** 276 1 – – –
Other 305 1 756 3 (60)
– FCC (including Group Treasury) and consolidation adjustments 656 1 112
– NCNR preference dividend (351) (356)
Normalised earnings 26 411 100 24 471 100 8
* Includes rest of Africa.
** After the dividend on the contingent convertible securities (AT1) of R115 million.
MANAGEMENT OF FINANCIAL RESOURCES The management of the group’s financial resources, which it defines as capital, funding and liquidity, and risk capacity, is a critical enabler of the achievement of FirstRand’s stated growth and return targets, and is driven by the group’s overall risk appetite. Forecast growth in earnings and balance sheet risk weighted assets is based on the group’s macroeconomic outlook and evaluated against available financial resources, considering the requirements of capital providers, regulators and rating agencies. The expected outcomes and constraints are then stress tested, and the group sets financial and prudential targets through different business cycles and scenarios to enable FirstRand to deliver on its commitments to stakeholders at a defined confidence level.
The management of the group’s financial resources is executed through Group Treasury and is independent of the operating businesses. This ensures the required level of discipline is applied in
the allocation and pricing of financial resources. This also ensures that Group Treasury’s mandate is aligned with the portfolio’s growth, return and volatility targets to deliver shareholder value. The group continues to monitor and proactively manage a fast-changing regulatory environment and ongoing macroeconomic challenges.
The group adopts a disciplined approach to the management of its foreign currency balance sheet. The framework for the management of external debt takes into account sources of sovereign risk and foreign currency funding capacity, as well as the macroeconomic vulnerabilities of South Africa. The group employs a self-imposed structural borrowing limit and a liquidity risk limit more onerous than required in terms of regulations.
OVERVIEW OF RESULTS 25
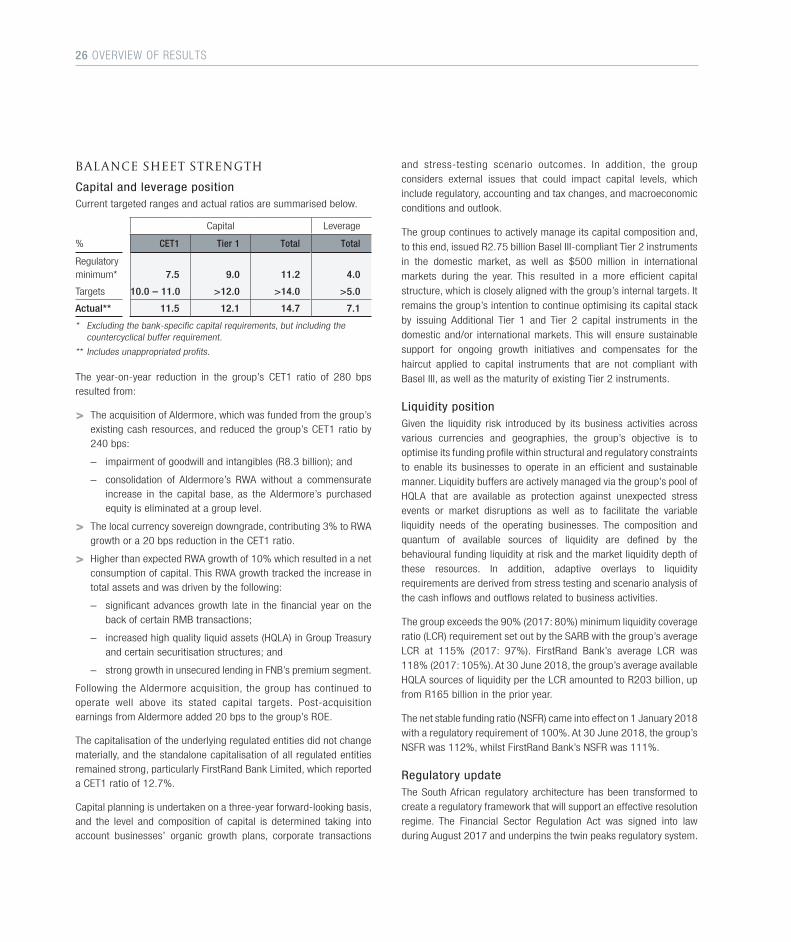
B A L A N C E S H E E T S T R E N G T HCapital and leverage positionCurrent targeted ranges and actual ratios are summarised below.
Capital Leverage
% CET1 Tier 1 Total Total
Regulatory minimum* 7.5 9.0 11.2 4.0
Targets 10.0 – 11.0 >12.0 >14.0 >5.0
Actual** 11.5 12.1 14.7 7.1
* Excluding the bank-specific capital requirements, but including the countercyclical buffer requirement.
** Includes unappropriated profits.
The year-on-year reduction in the group’s CET1 ratio of 280 bps resulted from:
> The acquisition of Aldermore, which was funded from the group’s existing cash resources, and reduced the group’s CET1 ratio by 240 bps:
– impairment of goodwill and intangibles (R8.3 billion); and
– consolidation of Aldermore’s RWA without a commensurate increase in the capital base, as the Aldermore’s purchased equity is eliminated at a group level.
> The local currency sovereign downgrade, contributing 3% to RWA growth or a 20 bps reduction in the CET1 ratio.
> Higher than expected RWA growth of 10% which resulted in a net consumption of capital. This RWA growth tracked the increase in total assets and was driven by the following:
– significant advances growth late in the financial year on the back of certain RMB transactions;
– increased high quality liquid assets (HQLA) in Group Treasury and certain securitisation structures; and
– strong growth in unsecured lending in FNB’s premium segment.
Following the Aldermore acquisition, the group has continued to operate well above its stated capital targets. Post-acquisition earnings from Aldermore added 20 bps to the group’s ROE.
The capitalisation of the underlying regulated entities did not change materially, and the standalone capitalisation of all regulated entities remained strong, particularly FirstRand Bank Limited, which reported a CET1 ratio of 12.7%.
Capital planning is undertaken on a three-year forward-looking basis, and the level and composition of capital is determined taking into account businesses’ organic growth plans, corporate transactions
and stress-testing scenario outcomes. In addition, the group considers external issues that could impact capital levels, which include regulatory, accounting and tax changes, and macroeconomic conditions and outlook.
The group continues to actively manage its capital composition and, to this end, issued R2.75 billion Basel III-compliant Tier 2 instruments in the domestic market, as well as $500 million in international markets during the year. This resulted in a more efficient capital structure, which is closely aligned with the group’s internal targets. It remains the group’s intention to continue optimising its capital stack by issuing Additional Tier 1 and Tier 2 capital instruments in the domestic and/or international markets. This will ensure sustainable support for ongoing growth initiatives and compensates for the haircut applied to capital instruments that are not compliant with Basel III, as well as the maturity of existing Tier 2 instruments.
Liquidity positionGiven the liquidity risk introduced by its business activities across various currencies and geographies, the group’s objective is to optimise its funding profile within structural and regulatory constraints to enable its businesses to operate in an efficient and sustainable manner. Liquidity buffers are actively managed via the group’s pool of HQLA that are available as protection against unexpected stress events or market disruptions as well as to facilitate the variable liquidity needs of the operating businesses. The composition and quantum of available sources of liquidity are defined by the behavioural funding liquidity at risk and the market liquidity depth of these resources. In addition, adaptive overlays to liquidity requirements are derived from stress testing and scenario analysis of the cash inflows and outflows related to business activities.
The group exceeds the 90% (2017: 80%) minimum liquidity coverage ratio (LCR) requirement set out by the SARB with the group’s average LCR at 115% (2017: 97%). FirstRand Bank’s average LCR was 118% (2017: 105%). At 30 June 2018, the group’s average available HQLA sources of liquidity per the LCR amounted to R203 billion, up from R165 billion in the prior year.
The net stable funding ratio (NSFR) came into effect on 1 January 2018 with a regulatory requirement of 100%. At 30 June 2018, the group’s NSFR was 112%, whilst FirstRand Bank’s NSFR was 111%.
Regulatory updateThe South African regulatory architecture has been transformed to create a regulatory framework that will support an effective resolution regime. The Financial Sector Regulation Act was signed into law during August 2017 and underpins the twin peaks regulatory system.
26 OVERVIEW OF RESULTS
The twin peaks supervisory framework model reduces the number of agencies involved in supervision, with the establishment of two new regulatory agencies on 1 April 2018: the Prudential Authority (PA) in the SARB and a Financial Sector Conduct Authority (FSCA). Whilst the PA/SARB is responsible for monitoring and enhancing financial stability as part of its explicit financial stability mandate, the SARB will also be responsible for assisting with the prevention of systemic events by means of its designation as the Resolution Authority (RA).
In January 2018, a draft resolution framework was released to the banking industry for initial review following which it will be released to the public for general comment. This draft framework sets out the broad principles for the resolution of banks, systemically important non-bank financial institutions and holding companies of banks, and highlights the various legislative amendments required to ensure the framework is enforceable. Detailed definitions of key elements of the resolution framework are subject to finalisation, and directives or addendums to this framework will be published once finalised. The resolution plans will allow the PA to prepare for an event from which the group’s recovery actions have failed or are deemed likely to fail. Bank resolution plans will be owned and maintained by the RA, but will require a significant amount of bilateral engagement and input from the individual banks to enable the RA to develop a customised plan that is most appropriate to each bank.
The Financial Sector Regulation Act further empowers the PA to designate a group of companies as a financial conglomerate as well as to regulate and supervise such designated financial conglomerates. The PA has released the following:
> draft set of financial conglomerate supervision prudential standards;
> draft criteria for the designation of financial conglomerates, and
> draft reporting template for an informal consultation process with the industry.
The draft standards provide an early signal to the industry and affected stakeholders on the approach to the regulation and supervision of designated financial conglomerates. Comments were due by the end of August 2018 and standards are expected to be implemented during the first half of 2019.
In addition, the Basel Committee on Banking Supervision (BCBS) finalised the Basel III reforms in December 2017, with specific focus on reducing the variability of risk weighted assets. The BCBS has agreed on a lengthy five-year transitional period, starting 1 January 2022. The PA has confirmed a similar transitional period for banks in South Africa. The 2017 reforms aim to address weaknesses identified during the global financial crisis, such as the credibility of the risk-
based capital framework and to introduce constraints on the estimates banks use in the internal models for regulatory capital purposes. The impact on the group capital position depends on the final implementation by the SARB given a level of national discretion, however, the group continues to participate in the BCBS quantitative impact studies to assess and understand the impact of such reforms. Based on the Basel guidelines, the group is expected to comfortably meet these requirements over the transitional period.
I F R S 9 A N D I F R S 15The group adopted IFRS 9 and IFRS 15, retrospectively, with effect from 1 July 2018. The IFRS 9 programme is at present in the process of final internal approval and external audit validation.
The group will provide detailed audited transitional disclosure regarding the impact of the adoption of IFRS 9 and IFRS 15 during November 2018.
At present, the group believes the impact of adopting IFRS 9 and IFRS 15 will reduce the group’s CET 1 ratio at 30 June 2018 by between 47 and 57 bps, on a fully loaded basis.
DIVIDEND STRATEGYGiven the group’s high return profile and strong capital generation, the board remains comfortable with a dividend cover of 1.7x which continues to track below its stated long-term cover range of 1.8x to 2.2x.
As previously communicated, however, should capital demand increase to support sustainable balance sheet growth, the board will revisit whether it should migrate back into the stated long-term cover range.
PROSPECTSFollowing the outcome of the ANC elective conference in December 2017 sentiment and markets staged a recovery and the outlook for South Africa remains more positive than it has been for some time. Given, however, the structural nature of many of South Africa’s challenges the group believes that domestic fundamentals will not change quickly.
Global financial conditions will prevent the SARB from easing monetary policy despite the low growth outlook. This, combined with lower commodity prices and prospects of a slowdown in global growth next year, means that domestic economic activity will remain subdued in 2019. Against this backdrop, private sector activities such as corporate investment and household consumption will most likely remain under pressure.
OVERVIEW OF RESULTS 27
In the medium to longer term, given the market leading positions of its businesses in South Africa and the growth strategies it is executing on, FirstRand considers itself strategically well positioned to benefit from renewed system growth. FNB’s momentum is expected to continue on the back of customer and volume growth, and cross-sell and up-sell strategies will deliver higher insurance revenues and good deposit and advances growth. RMB’s private equity realisations are expected to be lower in the current year compared to previous financial years.
With regard to the rest of Africa, there are signs that economic activity in most of the other sub-Saharan African countries that FirstRand operates in are picking up. The Nigerian economy is experiencing an oil price-induced lift and growth rates in Namibia and Botswana are also expected to improve. The group expects its portfolio to continue to show an improved performance.
In the UK, uncertainty over the outcome of Brexit continues to dominate the macroeconomic outlook and will continue to weigh on business and consumer confidence, which in turn will suppress investment spending to a certain degree. These ongoing headwinds were all anticipated when FirstRand acquired Aldermore and, as indicated previously, the group expects the growth trajectory to slow relative to the previous year, owing to competitive margin pressure and normalisation of credit costs.
The group expects to continue to deliver real growth in earnings and superior returns to shareholders.
EVENTS AFTER REPORTING PERIODD I S COV E RY C A R DSubsequent to the year end, the group concluded a transaction with Discovery, through the issuance of preference shares, for the ultimate transfer and disposal of its remaining effective 25.01% interest in Discovery Card and Discovery Bank, respectively. The consideration of this transaction is R1.8 billion, which together with the preference share issuance of R1.3 billion in 2016, results in a total value unlock for FirstRand shareholders of approximately R3 billion. This transaction is expected to be concluded during the financial year ending 30 June 2019.
At 30 June 2018, FNB includes Discovery Card advances with a gross value of R4.3 billion which will also be transferred at carrying value.
F N B S WA Z I L A N DDuring the next financial year, a minority interest in FNB Swaziland will be offered to local investors through a listing.
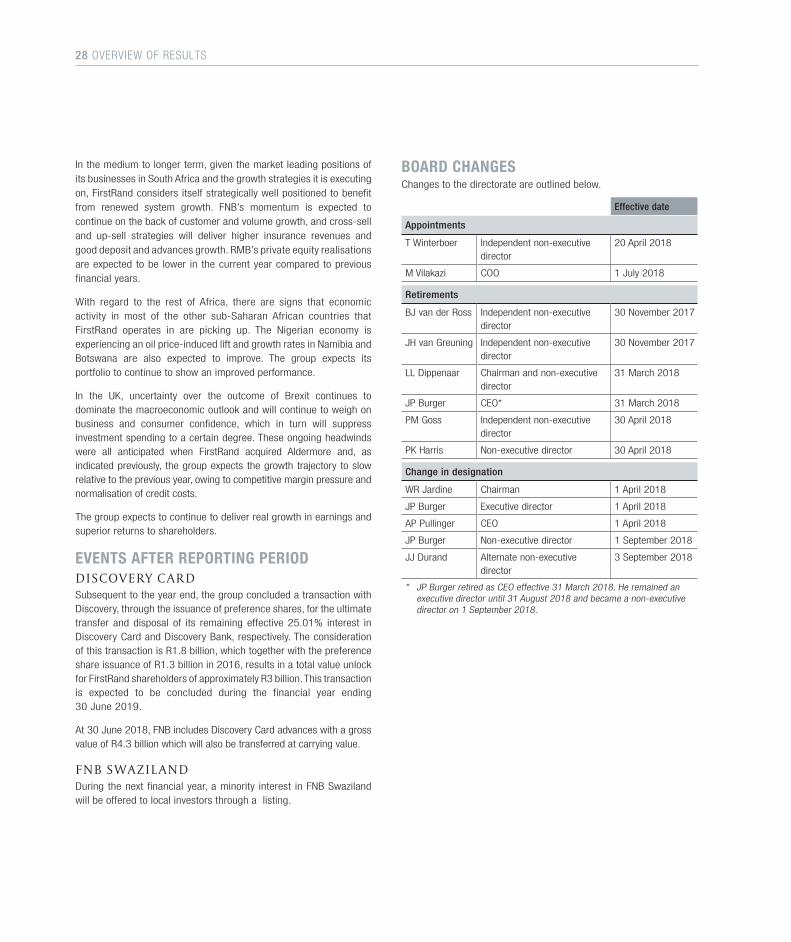
BOARD CHANGESChanges to the directorate are outlined below.
Effective date
Appointments
T Winterboer Independent non-executive director
20 April 2018
M Vilakazi COO 1 July 2018
Retirements
BJ van der Ross Independent non-executive director
30 November 2017
JH van Greuning Independent non-executive director
30 November 2017
LL Dippenaar Chairman and non-executive director
31 March 2018
JP Burger CEO* 31 March 2018
PM Goss Independent non-executive director
30 April 2018
PK Harris Non-executive director 30 April 2018
Change in designation
WR Jardine Chairman 1 April 2018
JP Burger Executive director 1 April 2018
AP Pullinger CEO 1 April 2018
JP Burger Non-executive director 1 September 2018
JJ Durand Alternate non-executive director
3 September 2018
* JP Burger retired as CEO effective 31 March 2018. He remained an executive director until 31 August 2018 and became a non-executive director on 1 September 2018.
28 OVERVIEW OF RESULTS
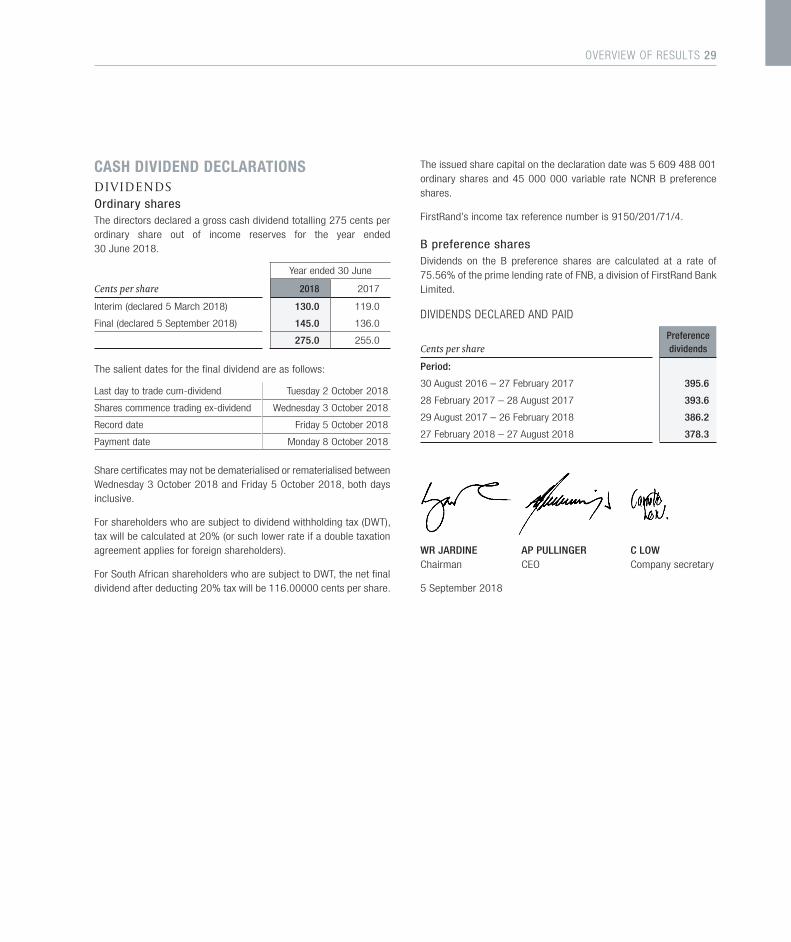
CASH DIVIDEND DECLARATIONSD I V I D E N DS Ordinary sharesThe directors declared a gross cash dividend totalling 275 cents per ordinary share out of income reserves for the year ended 30 June 2018.
Year ended 30 June
Cents per share 2018 2017
Interim (declared 5 March 2018) 130.0 119.0
Final (declared 5 September 2018) 145.0 136.0
275.0 255.0
The salient dates for the final dividend are as follows:
Last day to trade cum-dividend Tuesday 2 October 2018
Shares commence trading ex-dividend Wednesday 3 October 2018
Record date Friday 5 October 2018
Payment date Monday 8 October 2018
Share certificates may not be dematerialised or rematerialised between Wednesday 3 October 2018 and Friday 5 October 2018, both days inclusive.
For shareholders who are subject to dividend withholding tax (DWT), tax will be calculated at 20% (or such lower rate if a double taxation agreement applies for foreign shareholders).
For South African shareholders who are subject to DWT, the net final dividend after deducting 20% tax will be 116.00000 cents per share.
The issued share capital on the declaration date was 5 609 488 001 ordinary shares and 45 000 000 variable rate NCNR B preference shares.
FirstRand’s income tax reference number is 9150/201/71/4.
B preference sharesDividends on the B preference shares are calculated at a rate of 75.56% of the prime lending rate of FNB, a division of FirstRand Bank Limited.
DIVIDENDS DECLARED AND PAID
Cents per sharePreference dividends
Period:
30 August 2016 – 27 February 2017 395.6
28 February 2017 – 28 August 2017 393.6
29 August 2017 – 26 February 2018 386.2
27 February 2018 – 27 August 2018 378.3
WR JARDINE AP PULLINGER C LOWChairman CEO Company secretary
5 September 2018
OVERVIEW OF RESULTS 29
FNB RMB
Wes
Ban
k†
Ald
erm
ore*
*,‡
FCC
^ (i
nclu
ding
G
roup
Tre
asur
y)
and
othe
r
Firs
tRan
d gr
oup
– no
rmal
ised
Nor
mal
ised
ad
just
men
ts
Firs
tRan
d gr
oup
– IF
RS
Retail
Com
mer
cial
FNB
Afr
ica
Tota
l FN
B
Inve
stm
ent
ba
nkin
g
Cor
pora
te
bank
ing
Tota
l RM
B#
R million Res
iden
tial
mor
tgag
es
Car
d
Pers
onal
lo
ans
Ret
ail o
ther
Ret
ail
Net interest income before impairment of advances 4 516 2 644 2 693 6 911 16 764 9 602 3 027 29 393 4 726 2 189 6 915 11 193 1 224 2 529 51 254 (2 156) 49 098
Impairment charge (149) (670) (793) (1 171) (2 783) (670) (903) (4 356) (235) (8) (243) (4 154) (46) 232 (8 567) – (8 567)
Net interest income after impairment of advances 4 367 1 974 1 900 5 740 13 981 8 932 2 124 25 037 4 491 2 181 6 672 7 039 1 178 2 761 42 687 (2 156) 40 531
Non-interest revenue 582 2 059 814 12 676 16 131 7 649 3 638 27 418 8 974 2 352 11 326 4 734 118 (2 584) 41 012 3 181 44 193
Income from operations 4 949 4 033 2 714 18 416 30 112 16 581 5 762 52 455 13 465 4 533 17 998 11 773 1 296 177 83 699 1 025 84 724
Operating expenses (1 804) (2 142) (938) (12 251) (17 135) (8 540) (4 706) (30 381) (5 755) (2 662) (8 417) (6 895) (706) (1 265) (47 664) (798) (48 462)
Net income from operations 3 145 1 891 1 776 6 165 12 977 8 041 1 056 22 074 7 710 1 871 9 581 4 878 590 (1 088) 36 035 227 36 262
Share of profit of associates and joint ventures after tax – – – 11 11 6 1 18 901 – 901 409 2 (416) 914 (5) 909
Income before tax 3 145 1 891 1 776 6 176 12 988 8 047 1 057 22 092 8 611 1 871 10 482 5 287 592 (1 504) 36 949 222 37 171
Indirect tax (11) (66) (17) (389) (483) (42) (151) (676) (122) (10) (132) (157) (43) (69) (1 077) – (1 077)
Profit before tax 3 134 1 825 1 759 5 787 12 505 8 005 906 21 416 8 489 1 861 10 350 5 130 549 (1 573) 35 872 222 36 094
Income tax expense (878) (511) (492) (1 621) (3 502) (2 241) (354) (6 097) (2 379) (521) (2 900) (1 447) (158) 2 737 (7 865) (85) (7 950)
Profit for the year 2 256 1 314 1 267 4 166 9 003 5 764 552 15 319 6 110 1 340 7 450 3 683 391 1 164 28 007 137 28 144
Attributable to:
Ordinary equityholders 2 256 1 314 1 267 4 166 9 003 5 764 110 14 877 6 095 1 232 7 327 3 626 276 305 26 411 135 26 546
Contingent convertible securities (AT1) – – – – – – – – – – – – 115 – 115 – 115
NCNR preference shareholders – – – – – – – – – – – – – 351 351 – 351
Non-controlling interests – – – – – – 442 442 15 108 123 57 – 508 1 130 2 1 132
Profit for the year 2 256 1 314 1 267 4 166 9 003 5 764 552 15 319 6 110 1 340 7 450 3 683 391 1 164 28 007 137 28 144
Earnings attributable to ordinary shareholders 2 256 1 314 1 267 4 166 9 003 5 764 110 14 877 6 095 1 232 7 327 3 626 276 305 26 411 135 26 546
Headline earnings adjustments – – – – – – – – – – – – – – – (37) (37)
Headline earnings 2 256 1 314 1 267 4 166 9 003 5 764 110 14 877 6 095 1 232 7 327 3 626 276 305 26 411 98 26 509
TRS and IFRS 2 liability remeasurement – – – – – – – – – – – – – – – (54) (54)
Treasury shares – – – – – – – – – – – – – – – 18 18
IAS 19 adjustment – – – – – – – – – – – – – – – (109) (109)
Private equity-related – – – – – – – – – – – – – – – 47 47
Normalised earnings* 2 256 1 314 1 267 4 166 9 003 5 764 110 14 877 6 095 1 232 7 327 3 626 276 305 26 411 – 26 411
The segmental analysis is based on the management accounts for the respective segments.
* Normalised earnings for FNB, RMB and WesBank exclude the return on capital in the rest of Africa, cost of preference shares and other capital and, therefore, differ from franchise normalised earnings reported on page 109.
** Aldermore results are for the period 1 April 2018 to 30 June 2018.
# Refer to additional activity disclosure on page 38.† Refer to additional segmental information on page 39.‡ Refer to additional segmental and other information on page 40.^ FCC represents group-wide functions.
Segment report for the year ended 30 June 2018
30 OVERVIEW OF RESULTS
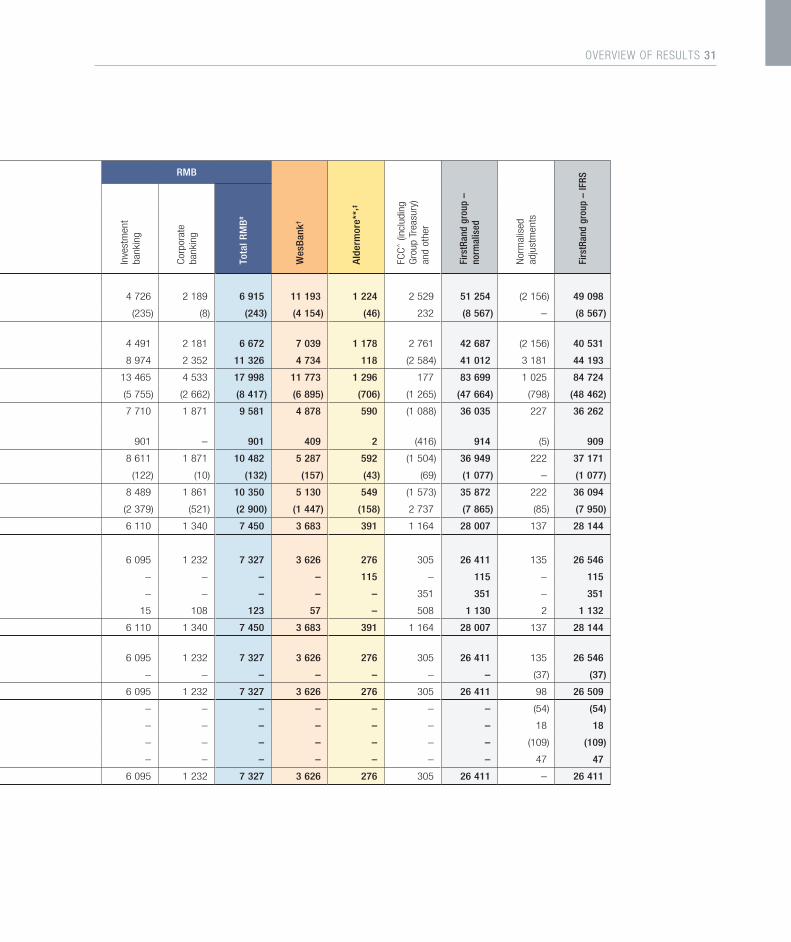
FNB RMB
Wes
Ban
k†
Ald
erm
ore*
*,‡
FCC
^ (i
nclu
ding
G
roup
Tre
asur
y)
and
othe
r
Firs
tRan
d gr
oup
– no
rmal
ised
Nor
mal
ised
ad
just
men
ts
Firs
tRan
d gr
oup
– IF
RS
Retail
Com
mer
cial
FNB
Afr
ica
Tota
l FN
B
Inve
stm
ent
ba
nkin
g
Cor
pora
te
bank
ing
Tota
l RM
B#
R million Res
iden
tial
mor
tgag
es
Car
d
Pers
onal
lo
ans
Ret
ail o
ther
Ret
ail
Net interest income before impairment of advances 4 516 2 644 2 693 6 911 16 764 9 602 3 027 29 393 4 726 2 189 6 915 11 193 1 224 2 529 51 254 (2 156) 49 098
Impairment charge (149) (670) (793) (1 171) (2 783) (670) (903) (4 356) (235) (8) (243) (4 154) (46) 232 (8 567) – (8 567)
Net interest income after impairment of advances 4 367 1 974 1 900 5 740 13 981 8 932 2 124 25 037 4 491 2 181 6 672 7 039 1 178 2 761 42 687 (2 156) 40 531
Non-interest revenue 582 2 059 814 12 676 16 131 7 649 3 638 27 418 8 974 2 352 11 326 4 734 118 (2 584) 41 012 3 181 44 193
Income from operations 4 949 4 033 2 714 18 416 30 112 16 581 5 762 52 455 13 465 4 533 17 998 11 773 1 296 177 83 699 1 025 84 724
Operating expenses (1 804) (2 142) (938) (12 251) (17 135) (8 540) (4 706) (30 381) (5 755) (2 662) (8 417) (6 895) (706) (1 265) (47 664) (798) (48 462)
Net income from operations 3 145 1 891 1 776 6 165 12 977 8 041 1 056 22 074 7 710 1 871 9 581 4 878 590 (1 088) 36 035 227 36 262
Share of profit of associates and joint ventures after tax – – – 11 11 6 1 18 901 – 901 409 2 (416) 914 (5) 909
Income before tax 3 145 1 891 1 776 6 176 12 988 8 047 1 057 22 092 8 611 1 871 10 482 5 287 592 (1 504) 36 949 222 37 171
Indirect tax (11) (66) (17) (389) (483) (42) (151) (676) (122) (10) (132) (157) (43) (69) (1 077) – (1 077)
Profit before tax 3 134 1 825 1 759 5 787 12 505 8 005 906 21 416 8 489 1 861 10 350 5 130 549 (1 573) 35 872 222 36 094
Income tax expense (878) (511) (492) (1 621) (3 502) (2 241) (354) (6 097) (2 379) (521) (2 900) (1 447) (158) 2 737 (7 865) (85) (7 950)
Profit for the year 2 256 1 314 1 267 4 166 9 003 5 764 552 15 319 6 110 1 340 7 450 3 683 391 1 164 28 007 137 28 144
Attributable to:
Ordinary equityholders 2 256 1 314 1 267 4 166 9 003 5 764 110 14 877 6 095 1 232 7 327 3 626 276 305 26 411 135 26 546
Contingent convertible securities (AT1) – – – – – – – – – – – – 115 – 115 – 115
NCNR preference shareholders – – – – – – – – – – – – – 351 351 – 351
Non-controlling interests – – – – – – 442 442 15 108 123 57 – 508 1 130 2 1 132
Profit for the year 2 256 1 314 1 267 4 166 9 003 5 764 552 15 319 6 110 1 340 7 450 3 683 391 1 164 28 007 137 28 144
Earnings attributable to ordinary shareholders 2 256 1 314 1 267 4 166 9 003 5 764 110 14 877 6 095 1 232 7 327 3 626 276 305 26 411 135 26 546
Headline earnings adjustments – – – – – – – – – – – – – – – (37) (37)
Headline earnings 2 256 1 314 1 267 4 166 9 003 5 764 110 14 877 6 095 1 232 7 327 3 626 276 305 26 411 98 26 509
TRS and IFRS 2 liability remeasurement – – – – – – – – – – – – – – – (54) (54)
Treasury shares – – – – – – – – – – – – – – – 18 18
IAS 19 adjustment – – – – – – – – – – – – – – – (109) (109)
Private equity-related – – – – – – – – – – – – – – – 47 47
Normalised earnings* 2 256 1 314 1 267 4 166 9 003 5 764 110 14 877 6 095 1 232 7 327 3 626 276 305 26 411 – 26 411
The segmental analysis is based on the management accounts for the respective segments.
* Normalised earnings for FNB, RMB and WesBank exclude the return on capital in the rest of Africa, cost of preference shares and other capital and, therefore, differ from franchise normalised earnings reported on page 109.
** Aldermore results are for the period 1 April 2018 to 30 June 2018.
# Refer to additional activity disclosure on page 38.† Refer to additional segmental information on page 39.‡ Refer to additional segmental and other information on page 40.^ FCC represents group-wide functions.
OVERVIEW OF RESULTS 31
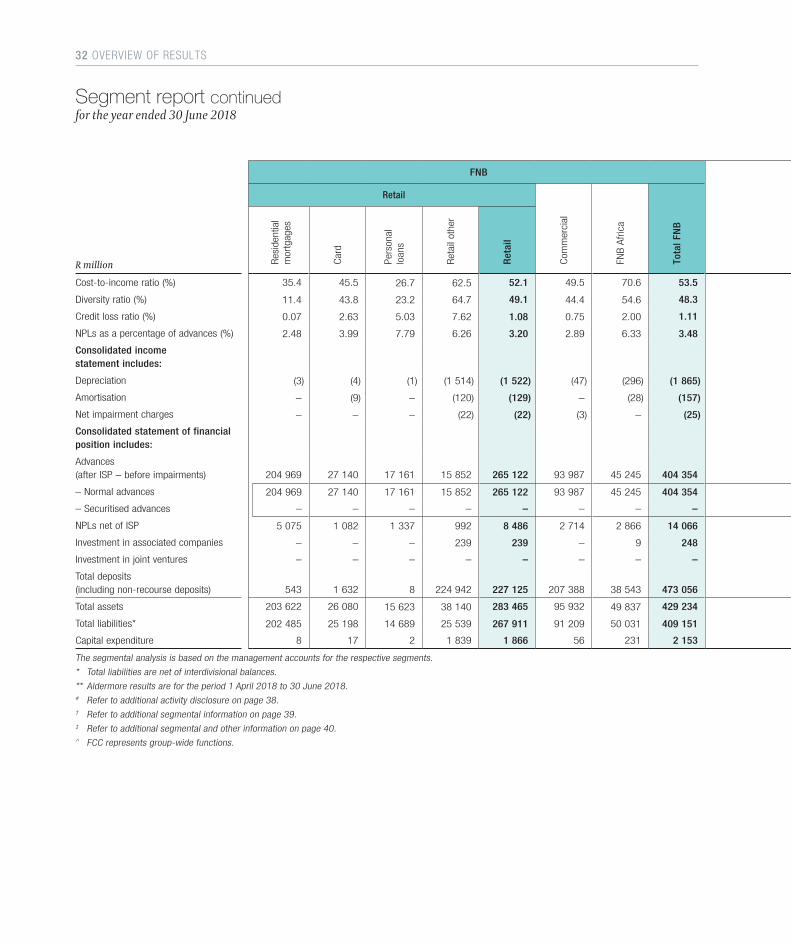
FNB RMB
Wes
Ban
k†
Ald
erm
ore*
*,‡
FCC
^ (i
nclu
ding
G
roup
Tre
asur
y)
and
othe
r
Firs
tRan
d gr
oup
– no
rmal
ised
Nor
mal
ised
ad
just
men
ts
Firs
tRan
d gr
oup
– IF
RS
Retail
Com
mer
cial
FNB
Afr
ica
Tota
l FN
B
Inve
stm
ent
ba
nkin
g
Cor
pora
te
bank
ing
Tota
l RM
B#
R million Res
iden
tial
mor
tgag
es
Car
d
Pers
onal
lo
ans
Ret
ail o
ther
Ret
ail
Cost-to-income ratio (%) 35.4 45.5 26.7 62.5 52.1 49.5 70.6 53.5 39.4 58.6 44.0 42.2 52.5 (>100) 51.2 – 51.4
Diversity ratio (%) 11.4 43.8 23.2 64.7 49.1 44.4 54.6 48.3 67.6 51.8 63.9 31.5 8.9 >100 45.0 – 47.9
Credit loss ratio (%) 0.07 2.63 5.03 7.62 1.08 0.75 2.00 1.11 0.10 0.02 0.08 1.93 0.12 (0.02) 0.84 – 0.84
NPLs as a percentage of advances (%) 2.48 3.99 7.79 6.26 3.20 2.89 6.33 3.48 0.94 0.41 0.85 4.41 0.38 – 2.36 – 2.36
Consolidated income statement includes:
Depreciation (3) (4) (1) (1 514) (1 522) (47) (296) (1 865) (135) (10) (145) (726) (6) (88) (2 830) – (2 830)
Amortisation – (9) – (120) (129) – (28) (157) (40) – (40) (51) (10) (104) (362) – (362)
Net impairment charges – – – (22) (22) (3) – (25) – (11) (11) (13) – – (49) (61) (110)
Consolidated statement of financial position includes:
Advances (after ISP – before impairments) 204 969 27 140 17 161 15 852 265 122 93 987 45 245 404 354 245 514 49 807 295 321 221 233 163 876 55 698 1 140 482 (420) 1 140 062
– Normal advances 204 969 27 140 17 161 15 852 265 122 93 987 45 245 404 354 245 514 49 807 295 321 174 667 162 001 55 698 1 092 041 (420) 1 091 621
– Securitised advances – – – – – – – – – – – 46 566 1 875 – 48 441 – 48 441
NPLs net of ISP 5 075 1 082 1 337 992 8 486 2 714 2 866 14 066 2 299 206 2 505 9 760 616 – 26 947 – 26 947
Investment in associated companies – – – 239 239 – 9 248 2 657 – 2 657 2 539 92 1 5 537 – 5 537
Investment in joint ventures – – – – – – – – 1 693 – 1 693 3 – (16) 1 680 46 1 726
Total deposits (including non-recourse deposits) 543 1 632 8 224 942 227 125 207 388 38 543 473 056 81 782 133 017 214 799 53 173 178 406 362 1 267 448 – 1 267 448
Total assets 203 622 26 080 15 623 38 140 283 465 95 932 49 837 429 234 399 444 53 640 453 084 228 433 189 867 231 692 1 532 310 (21) 1 532 289
Total liabilities* 202 485 25 198 14 689 25 539 267 911 91 209 50 031 409 151 390 143 52 373 442 516 221 953 176 089 151 782 1 401 491 – 1 401 491
Capital expenditure 8 17 2 1 839 1 866 56 231 2 153 341 31 372 1 593 1 23 4 142 – 4 142
The segmental analysis is based on the management accounts for the respective segments.
* Total liabilities are net of interdivisional balances.
** Aldermore results are for the period 1 April 2018 to 30 June 2018.
# Refer to additional activity disclosure on page 38.† Refer to additional segmental information on page 39.‡ Refer to additional segmental and other information on page 40.^ FCC represents group-wide functions.
Segment report continued for the year ended 30 June 2018
32 OVERVIEW OF RESULTS
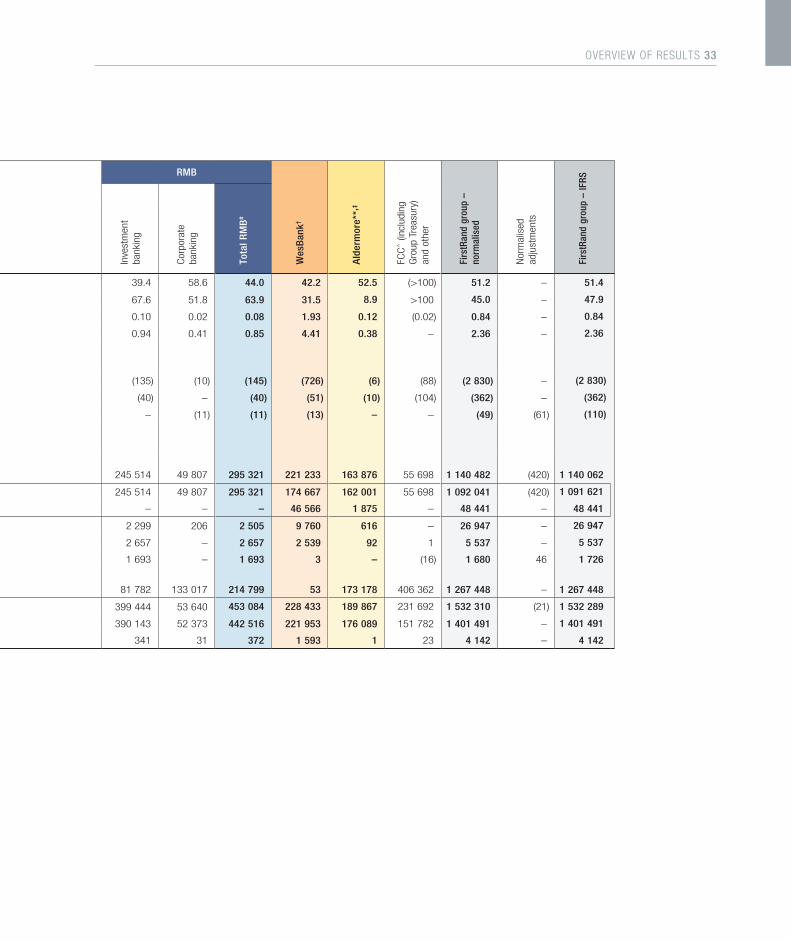
FNB RMB
Wes
Ban
k†
Ald
erm
ore*
*,‡
FCC
^ (i
nclu
ding
G
roup
Tre
asur
y)
and
othe
r
Firs
tRan
d gr
oup
– no
rmal
ised
Nor
mal
ised
ad
just
men
ts
Firs
tRan
d gr
oup
– IF
RS
Retail
Com
mer
cial
FNB
Afr
ica
Tota
l FN
B
Inve
stm
ent
ba
nkin
g
Cor
pora
te
bank
ing
Tota
l RM
B#
R million Res
iden
tial
mor
tgag
es
Car
d
Pers
onal
lo
ans
Ret
ail o
ther
Ret
ail
Cost-to-income ratio (%) 35.4 45.5 26.7 62.5 52.1 49.5 70.6 53.5 39.4 58.6 44.0 42.2 52.5 (>100) 51.2 – 51.4
Diversity ratio (%) 11.4 43.8 23.2 64.7 49.1 44.4 54.6 48.3 67.6 51.8 63.9 31.5 8.9 >100 45.0 – 47.9
Credit loss ratio (%) 0.07 2.63 5.03 7.62 1.08 0.75 2.00 1.11 0.10 0.02 0.08 1.93 0.12 (0.02) 0.84 – 0.84
NPLs as a percentage of advances (%) 2.48 3.99 7.79 6.26 3.20 2.89 6.33 3.48 0.94 0.41 0.85 4.41 0.38 – 2.36 – 2.36
Consolidated income statement includes:
Depreciation (3) (4) (1) (1 514) (1 522) (47) (296) (1 865) (135) (10) (145) (726) (6) (88) (2 830) – (2 830)
Amortisation – (9) – (120) (129) – (28) (157) (40) – (40) (51) (10) (104) (362) – (362)
Net impairment charges – – – (22) (22) (3) – (25) – (11) (11) (13) – – (49) (61) (110)
Consolidated statement of financial position includes:
Advances (after ISP – before impairments) 204 969 27 140 17 161 15 852 265 122 93 987 45 245 404 354 245 514 49 807 295 321 221 233 163 876 55 698 1 140 482 (420) 1 140 062
– Normal advances 204 969 27 140 17 161 15 852 265 122 93 987 45 245 404 354 245 514 49 807 295 321 174 667 162 001 55 698 1 092 041 (420) 1 091 621
– Securitised advances – – – – – – – – – – – 46 566 1 875 – 48 441 – 48 441
NPLs net of ISP 5 075 1 082 1 337 992 8 486 2 714 2 866 14 066 2 299 206 2 505 9 760 616 – 26 947 – 26 947
Investment in associated companies – – – 239 239 – 9 248 2 657 – 2 657 2 539 92 1 5 537 – 5 537
Investment in joint ventures – – – – – – – – 1 693 – 1 693 3 – (16) 1 680 46 1 726
Total deposits (including non-recourse deposits) 543 1 632 8 224 942 227 125 207 388 38 543 473 056 81 782 133 017 214 799 53 173 178 406 362 1 267 448 – 1 267 448
Total assets 203 622 26 080 15 623 38 140 283 465 95 932 49 837 429 234 399 444 53 640 453 084 228 433 189 867 231 692 1 532 310 (21) 1 532 289
Total liabilities* 202 485 25 198 14 689 25 539 267 911 91 209 50 031 409 151 390 143 52 373 442 516 221 953 176 089 151 782 1 401 491 – 1 401 491
Capital expenditure 8 17 2 1 839 1 866 56 231 2 153 341 31 372 1 593 1 23 4 142 – 4 142
The segmental analysis is based on the management accounts for the respective segments.
* Total liabilities are net of interdivisional balances.
** Aldermore results are for the period 1 April 2018 to 30 June 2018.
# Refer to additional activity disclosure on page 38.† Refer to additional segmental information on page 39.‡ Refer to additional segmental and other information on page 40.^ FCC represents group-wide functions.
OVERVIEW OF RESULTS 33
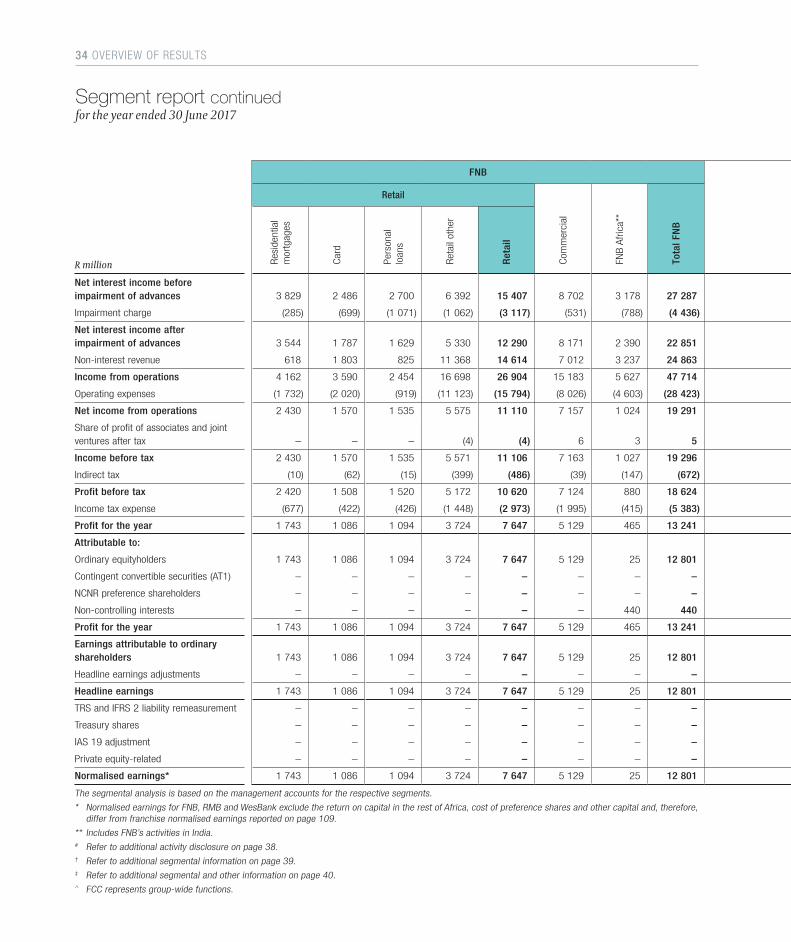
FNB RMB
Wes
Ban
k†
Ald
erm
ore‡
FCC
^ (i
nclu
ding
G
roup
Tre
asur
y)
and
othe
r
Firs
tRan
d gr
oup
– no
rmal
ised
Nor
mal
ised
ad
just
men
ts
Firs
tRan
d gr
oup
– IF
RS
Retail
Com
mer
cial
FNB
Afr
ica*
*
Tota
l FN
B
Inve
stm
ent
ba
nkin
g
Cor
pora
te
bank
ing
Tota
l RM
B#
R million Res
iden
tial
mor
tgag
es
Car
d
Pers
onal
lo
ans
Ret
ail o
ther
Ret
ail
Net interest income before impairment of advances 3 829 2 486 2 700 6 392 15 407 8 702 3 178 27 287 4 466 2 023 6 489 10 510 – 2 340 46 626 (1 709) 44 917
Impairment charge (285) (699) (1 071) (1 062) (3 117) (531) (788) (4 436) (400) (137) (537) (3 431) – 350 (8 054) – (8 054)
Net interest income after impairment of advances 3 544 1 787 1 629 5 330 12 290 8 171 2 390 22 851 4 066 1 886 5 952 7 079 – 2 690 38 572 (1 709) 36 863
Non-interest revenue 618 1 803 825 11 368 14 614 7 012 3 237 24 863 8 623 2 325 10 948 4 552 – (2 136) 38 227 2 695 40 922
Income from operations 4 162 3 590 2 454 16 698 26 904 15 183 5 627 47 714 12 689 4 211 16 900 11 631 – 554 76 799 986 77 785
Operating expenses (1 732) (2 020) (919) (11 123) (15 794) (8 026) (4 603) (28 423) (5 544) (2 468) (8 012) (6 225) – (1 113) (43 773) (812) (44 585)
Net income from operations 2 430 1 570 1 535 5 575 11 110 7 157 1 024 19 291 7 145 1 743 8 888 5 406 – (559) 33 026 174 33 200
Share of profit of associates and joint ventures after tax – – – (4) (4) 6 3 5 1 020 – 1 020 439 – (423) 1 041 (3) 1 038
Income before tax 2 430 1 570 1 535 5 571 11 106 7 163 1 027 19 296 8 165 1 743 9 908 5 845 – (982) 34 067 171 34 238
Indirect tax (10) (62) (15) (399) (486) (39) (147) (672) (115) (12) (127) (233) – (49) (1 081) – (1 081)
Profit before tax 2 420 1 508 1 520 5 172 10 620 7 124 880 18 624 8 050 1 731 9 781 5 612 – (1 031) 32 986 171 33 157
Income tax expense (677) (422) (426) (1 448) (2 973) (1 995) (415) (5 383) (2 258) (485) (2 743) (1 543) – 2 718 (6 951) (67) (7 018)
Profit for the year 1 743 1 086 1 094 3 724 7 647 5 129 465 13 241 5 792 1 246 7 038 4 069 – 1 687 26 035 104 26 139
Attributable to:
Ordinary equityholders 1 743 1 086 1 094 3 724 7 647 5 129 25 12 801 5 769 1 149 6 918 3 996 – 756 24 471 101 24 572
Contingent convertible securities (AT1) – – – – – – – – – – – – – – – – –
NCNR preference shareholders – – – – – – – – – – – – – 356 356 – 356
Non-controlling interests – – – – – – 440 440 23 97 120 73 – 575 1 208 3 1 211
Profit for the year 1 743 1 086 1 094 3 724 7 647 5 129 465 13 241 5 792 1 246 7 038 4 069 – 1 687 26 035 104 26 139
Earnings attributable to ordinary shareholders 1 743 1 086 1 094 3 724 7 647 5 129 25 12 801 5 769 1 149 6 918 3 996 – 756 24 471 101 24 572
Headline earnings adjustments – – – – – – – – – – – – – – – (810) (810)
Headline earnings 1 743 1 086 1 094 3 724 7 647 5 129 25 12 801 5 769 1 149 6 918 3 996 – 756 24 471 (709) 23 762
TRS and IFRS 2 liability remeasurement – – – – – – – – – – – – – – – (63) (63)
Treasury shares – – – – – – – – – – – – – – – (12) (12)
IAS 19 adjustment – – – – – – – – – – – – – – – (117) (117)
Private equity-related – – – – – – – – – – – – – – – 901 901
Normalised earnings* 1 743 1 086 1 094 3 724 7 647 5 129 25 12 801 5 769 1 149 6 918 3 996 – 756 24 471 – 24 471
The segmental analysis is based on the management accounts for the respective segments.
* Normalised earnings for FNB, RMB and WesBank exclude the return on capital in the rest of Africa, cost of preference shares and other capital and, therefore, differ from franchise normalised earnings reported on page 109.
** Includes FNB’s activities in India.
# Refer to additional activity disclosure on page 38.† Refer to additional segmental information on page 39.‡ Refer to additional segmental and other information on page 40.^ FCC represents group-wide functions.
Segment report continued for the year ended 30 June 2017
34 OVERVIEW OF RESULTS
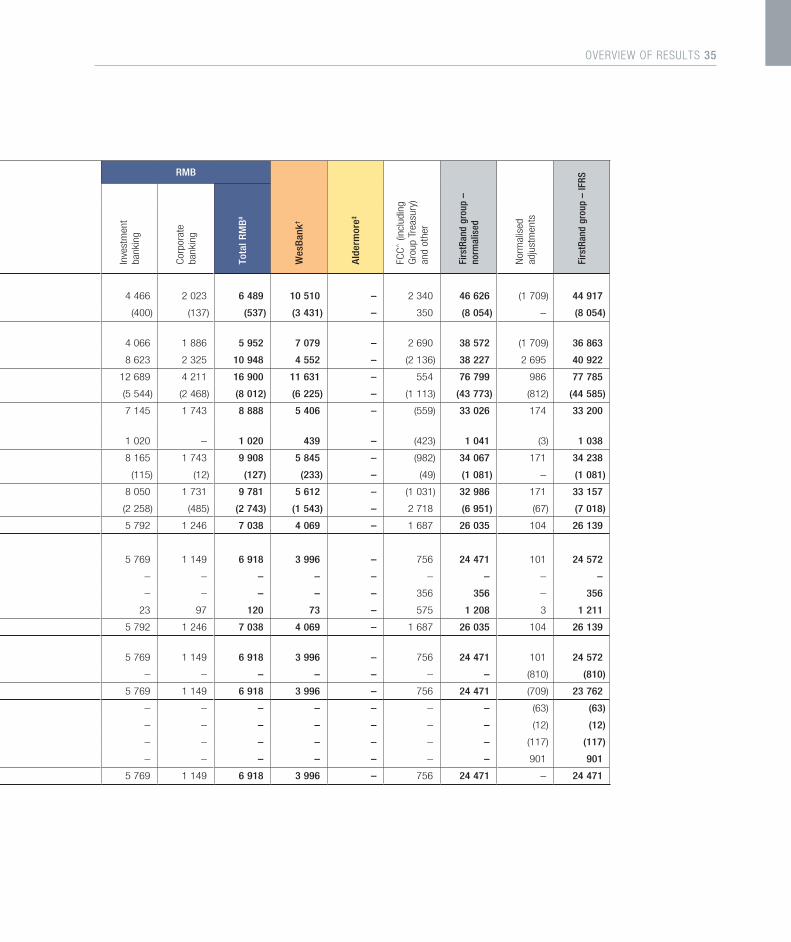
FNB RMB
Wes
Ban
k†
Ald
erm
ore‡
FCC
^ (i
nclu
ding
G
roup
Tre
asur
y)
and
othe
r
Firs
tRan
d gr
oup
– no
rmal
ised
Nor
mal
ised
ad
just
men
ts
Firs
tRan
d gr
oup
– IF
RS
Retail
Com
mer
cial
FNB
Afr
ica*
*
Tota
l FN
B
Inve
stm
ent
ba
nkin
g
Cor
pora
te
bank
ing
Tota
l RM
B#
R million Res
iden
tial
mor
tgag
es
Car
d
Pers
onal
lo
ans
Ret
ail o
ther
Ret
ail
Net interest income before impairment of advances 3 829 2 486 2 700 6 392 15 407 8 702 3 178 27 287 4 466 2 023 6 489 10 510 – 2 340 46 626 (1 709) 44 917
Impairment charge (285) (699) (1 071) (1 062) (3 117) (531) (788) (4 436) (400) (137) (537) (3 431) – 350 (8 054) – (8 054)
Net interest income after impairment of advances 3 544 1 787 1 629 5 330 12 290 8 171 2 390 22 851 4 066 1 886 5 952 7 079 – 2 690 38 572 (1 709) 36 863
Non-interest revenue 618 1 803 825 11 368 14 614 7 012 3 237 24 863 8 623 2 325 10 948 4 552 – (2 136) 38 227 2 695 40 922
Income from operations 4 162 3 590 2 454 16 698 26 904 15 183 5 627 47 714 12 689 4 211 16 900 11 631 – 554 76 799 986 77 785
Operating expenses (1 732) (2 020) (919) (11 123) (15 794) (8 026) (4 603) (28 423) (5 544) (2 468) (8 012) (6 225) – (1 113) (43 773) (812) (44 585)
Net income from operations 2 430 1 570 1 535 5 575 11 110 7 157 1 024 19 291 7 145 1 743 8 888 5 406 – (559) 33 026 174 33 200
Share of profit of associates and joint ventures after tax – – – (4) (4) 6 3 5 1 020 – 1 020 439 – (423) 1 041 (3) 1 038
Income before tax 2 430 1 570 1 535 5 571 11 106 7 163 1 027 19 296 8 165 1 743 9 908 5 845 – (982) 34 067 171 34 238
Indirect tax (10) (62) (15) (399) (486) (39) (147) (672) (115) (12) (127) (233) – (49) (1 081) – (1 081)
Profit before tax 2 420 1 508 1 520 5 172 10 620 7 124 880 18 624 8 050 1 731 9 781 5 612 – (1 031) 32 986 171 33 157
Income tax expense (677) (422) (426) (1 448) (2 973) (1 995) (415) (5 383) (2 258) (485) (2 743) (1 543) – 2 718 (6 951) (67) (7 018)
Profit for the year 1 743 1 086 1 094 3 724 7 647 5 129 465 13 241 5 792 1 246 7 038 4 069 – 1 687 26 035 104 26 139
Attributable to:
Ordinary equityholders 1 743 1 086 1 094 3 724 7 647 5 129 25 12 801 5 769 1 149 6 918 3 996 – 756 24 471 101 24 572
Contingent convertible securities (AT1) – – – – – – – – – – – – – – – – –
NCNR preference shareholders – – – – – – – – – – – – – 356 356 – 356
Non-controlling interests – – – – – – 440 440 23 97 120 73 – 575 1 208 3 1 211
Profit for the year 1 743 1 086 1 094 3 724 7 647 5 129 465 13 241 5 792 1 246 7 038 4 069 – 1 687 26 035 104 26 139
Earnings attributable to ordinary shareholders 1 743 1 086 1 094 3 724 7 647 5 129 25 12 801 5 769 1 149 6 918 3 996 – 756 24 471 101 24 572
Headline earnings adjustments – – – – – – – – – – – – – – – (810) (810)
Headline earnings 1 743 1 086 1 094 3 724 7 647 5 129 25 12 801 5 769 1 149 6 918 3 996 – 756 24 471 (709) 23 762
TRS and IFRS 2 liability remeasurement – – – – – – – – – – – – – – – (63) (63)
Treasury shares – – – – – – – – – – – – – – – (12) (12)
IAS 19 adjustment – – – – – – – – – – – – – – – (117) (117)
Private equity-related – – – – – – – – – – – – – – – 901 901
Normalised earnings* 1 743 1 086 1 094 3 724 7 647 5 129 25 12 801 5 769 1 149 6 918 3 996 – 756 24 471 – 24 471
The segmental analysis is based on the management accounts for the respective segments.
* Normalised earnings for FNB, RMB and WesBank exclude the return on capital in the rest of Africa, cost of preference shares and other capital and, therefore, differ from franchise normalised earnings reported on page 109.
** Includes FNB’s activities in India.
# Refer to additional activity disclosure on page 38.† Refer to additional segmental information on page 39.‡ Refer to additional segmental and other information on page 40.^ FCC represents group-wide functions.
OVERVIEW OF RESULTS 35
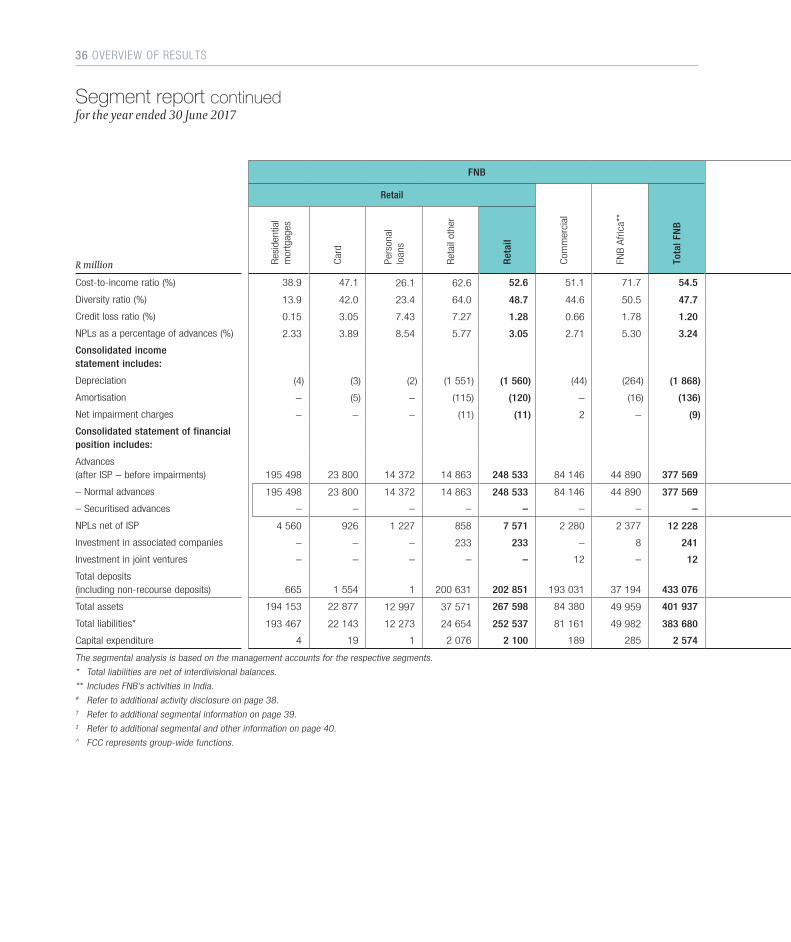
FNB RMB
Wes
Ban
k†
Ald
erm
ore‡
FCC
^ (i
nclu
ding
G
roup
Tre
asur
y)
and
othe
r
Firs
tRan
d gr
oup
– no
rmal
ised
Nor
mal
ised
ad
just
men
ts
Firs
tRan
d gr
oup
– IF
RS
Retail
Com
mer
cial
FNB
Afr
ica*
*
Tota
l FN
B
Inve
stm
ent
ba
nkin
g
Cor
pora
te
bank
ing
Tota
l RM
B#
R million Res
iden
tial
mor
tgag
es
Car
d
Pers
onal
lo
ans
Ret
ail o
ther
Ret
ail
Cost-to-income ratio (%) 38.9 47.1 26.1 62.6 52.6 51.1 71.7 54.5 39.3 56.8 43.4 40.2 – (>100) 51.0 – 51.3
Diversity ratio (%) 13.9 42.0 23.4 64.0 48.7 44.6 50.5 47.7 68.3 53.5 64.8 32.2 – >100 45.7 – 48.3
Credit loss ratio (%) 0.15 3.05 7.43 7.27 1.28 0.66 1.78 1.20 0.17 0.35 0.20 1.68 – (0.04) 0.91 – 0.91
NPLs as a percentage of advances (%) 2.33 3.89 8.54 5.77 3.05 2.71 5.30 3.24 0.71 0.09 0.62 3.80 – – 2.41 – 2.41
Consolidated income statement includes:
Depreciation (4) (3) (2) (1 551) (1 560) (44) (264) (1 868) (127) (5) (132) (671) – (19) (2 690) (38) (2 728)
Amortisation – (5) – (115) (120) – (16) (136) (47) – (47) (60) – (4) (247) (2) (249)
Net impairment charges – – – (11) (11) 2 – (9) (1) (9) (10) (1) – (17) (37) (586) (623)
Consolidated statement of financial position includes:
Advances (after ISP – before impairments) 195 498 23 800 14 372 14 863 248 533 84 146 44 890 377 569 240 725 42 236 282 961 208 470 – 41 066 910 066 (420) 909 646
– Normal advances 195 498 23 800 14 372 14 863 248 533 84 146 44 890 377 569 240 725 42 236 282 961 178 204 – 41 066 879 800 (420) 879 380
– Securitised advances – – – – – – – – – – – 30 266 – – 30 266 – 30 266
NPLs net of ISP 4 560 926 1 227 858 7 571 2 280 2 377 12 228 1 706 40 1 746 7 931 – – 21 905 – 21 905
Investment in associated companies – – – 233 233 – 8 241 2 851 – 2 851 2 238 – 594 5 924 – 5 924
Investment in joint ventures – – – – – 12 – 12 1 384 – 1 384 – – (17) 1 379 51 1 430
Total deposits (including non-recourse deposits) 665 1 554 1 200 631 202 851 193 031 37 194 433 076 87 374 122 348 209 722 41 – 340 690 983 529 – 983 529
Total assets 194 153 22 877 12 997 37 571 267 598 84 380 49 959 401 937 386 780 45 872 432 652 214 222 – 168 934 1 217 745 (38) 1 217 707
Total liabilities* 193 467 22 143 12 273 24 654 252 537 81 161 49 982 383 680 377 349 43 634 420 983 207 809 – 88 051 1 100 523 – 1 100 523
Capital expenditure 4 19 1 2 076 2 100 189 285 2 574 893 15 908 1 440 – 7 4 929 – 4 929
The segmental analysis is based on the management accounts for the respective segments.
* Total liabilities are net of interdivisional balances.
** Includes FNB’s activities in India.
# Refer to additional activity disclosure on page 38.† Refer to additional segmental information on page 39.‡ Refer to additional segmental and other information on page 40.^ FCC represents group-wide functions.
Segment report continued for the year ended 30 June 2017
36 OVERVIEW OF RESULTS
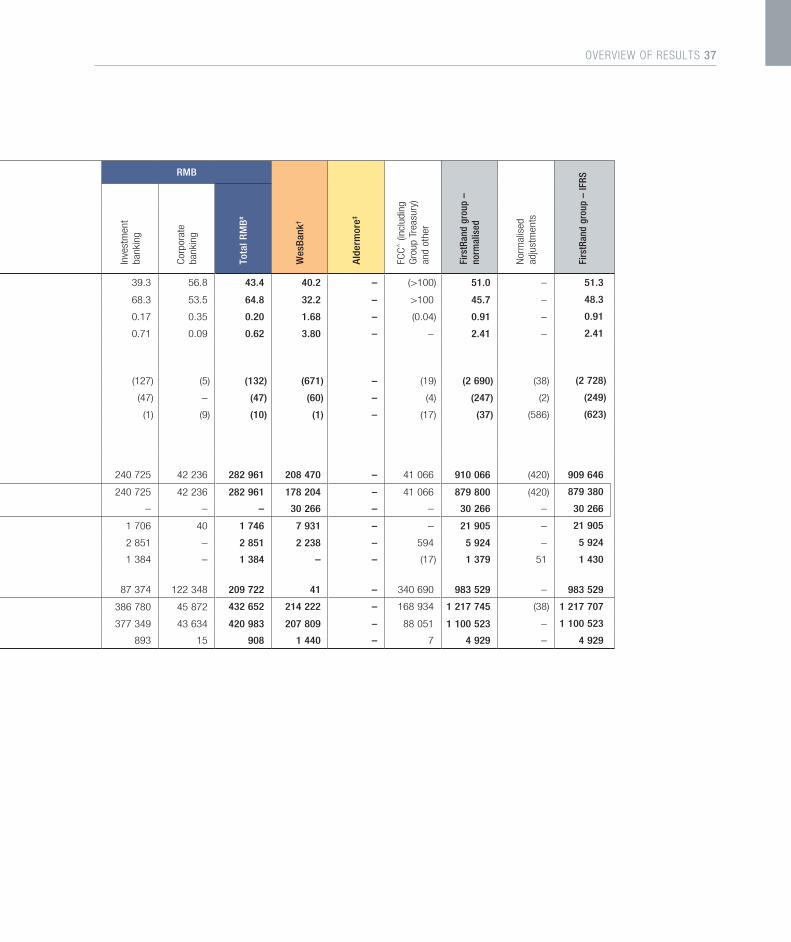
FNB RMB
Wes
Ban
k†
Ald
erm
ore‡
FCC
^ (i
nclu
ding
G
roup
Tre
asur
y)
and
othe
r
Firs
tRan
d gr
oup
– no
rmal
ised
Nor
mal
ised
ad
just
men
ts
Firs
tRan
d gr
oup
– IF
RS
Retail
Com
mer
cial
FNB
Afr
ica*
*
Tota
l FN
B
Inve
stm
ent
ba
nkin
g
Cor
pora
te
bank
ing
Tota
l RM
B#
R million Res
iden
tial
mor
tgag
es
Car
d
Pers
onal
lo
ans
Ret
ail o
ther
Ret
ail
Cost-to-income ratio (%) 38.9 47.1 26.1 62.6 52.6 51.1 71.7 54.5 39.3 56.8 43.4 40.2 – (>100) 51.0 – 51.3
Diversity ratio (%) 13.9 42.0 23.4 64.0 48.7 44.6 50.5 47.7 68.3 53.5 64.8 32.2 – >100 45.7 – 48.3
Credit loss ratio (%) 0.15 3.05 7.43 7.27 1.28 0.66 1.78 1.20 0.17 0.35 0.20 1.68 – (0.04) 0.91 – 0.91
NPLs as a percentage of advances (%) 2.33 3.89 8.54 5.77 3.05 2.71 5.30 3.24 0.71 0.09 0.62 3.80 – – 2.41 – 2.41
Consolidated income statement includes:
Depreciation (4) (3) (2) (1 551) (1 560) (44) (264) (1 868) (127) (5) (132) (671) – (19) (2 690) (38) (2 728)
Amortisation – (5) – (115) (120) – (16) (136) (47) – (47) (60) – (4) (247) (2) (249)
Net impairment charges – – – (11) (11) 2 – (9) (1) (9) (10) (1) – (17) (37) (586) (623)
Consolidated statement of financial position includes:
Advances (after ISP – before impairments) 195 498 23 800 14 372 14 863 248 533 84 146 44 890 377 569 240 725 42 236 282 961 208 470 – 41 066 910 066 (420) 909 646
– Normal advances 195 498 23 800 14 372 14 863 248 533 84 146 44 890 377 569 240 725 42 236 282 961 178 204 – 41 066 879 800 (420) 879 380
– Securitised advances – – – – – – – – – – – 30 266 – – 30 266 – 30 266
NPLs net of ISP 4 560 926 1 227 858 7 571 2 280 2 377 12 228 1 706 40 1 746 7 931 – – 21 905 – 21 905
Investment in associated companies – – – 233 233 – 8 241 2 851 – 2 851 2 238 – 594 5 924 – 5 924
Investment in joint ventures – – – – – 12 – 12 1 384 – 1 384 – – (17) 1 379 51 1 430
Total deposits (including non-recourse deposits) 665 1 554 1 200 631 202 851 193 031 37 194 433 076 87 374 122 348 209 722 41 – 340 690 983 529 – 983 529
Total assets 194 153 22 877 12 997 37 571 267 598 84 380 49 959 401 937 386 780 45 872 432 652 214 222 – 168 934 1 217 745 (38) 1 217 707
Total liabilities* 193 467 22 143 12 273 24 654 252 537 81 161 49 982 383 680 377 349 43 634 420 983 207 809 – 88 051 1 100 523 – 1 100 523
Capital expenditure 4 19 1 2 076 2 100 189 285 2 574 893 15 908 1 440 – 7 4 929 – 4 929
The segmental analysis is based on the management accounts for the respective segments.
* Total liabilities are net of interdivisional balances.
** Includes FNB’s activities in India.
# Refer to additional activity disclosure on page 38.† Refer to additional segmental information on page 39.‡ Refer to additional segmental and other information on page 40.^ FCC represents group-wide functions.
OVERVIEW OF RESULTS 37
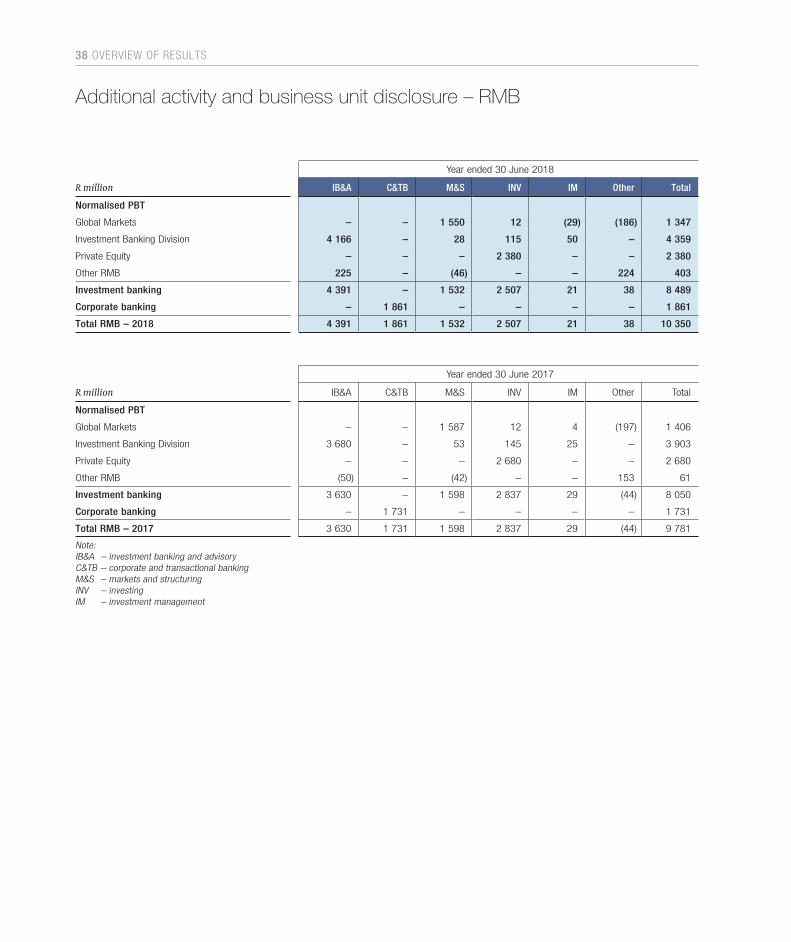
Year ended 30 June 2018
R million IB&A C&TB M&S INV IM Other Total
Normalised PBT
Global Markets – – 1 550 12 (29) (186) 1 347
Investment Banking Division 4 166 – 28 115 50 – 4 359
Private Equity – – – 2 380 – – 2 380
Other RMB 225 – (46) – – 224 403
Investment banking 4 391 – 1 532 2 507 21 38 8 489
Corporate banking – 1 861 – – – – 1 861
Total RMB – 2018 4 391 1 861 1 532 2 507 21 38 10 350
Year ended 30 June 2017
R million IB&A C&TB M&S INV IM Other Total
Normalised PBT
Global Markets – – 1 587 12 4 (197) 1 406
Investment Banking Division 3 680 – 53 145 25 – 3 903
Private Equity – – – 2 680 – – 2 680
Other RMB (50) – (42) – – 153 61
Investment banking 3 630 – 1 598 2 837 29 (44) 8 050
Corporate banking – 1 731 – – – – 1 731
Total RMB – 2017 3 630 1 731 1 598 2 837 29 (44) 9 781
Note: IB&A – investment banking and advisory C&TB – corporate and transactional banking M&S – markets and structuring INV – investing IM – investment management
Additional activity and business unit disclosure – RMB
38 OVERVIEW OF RESULTS
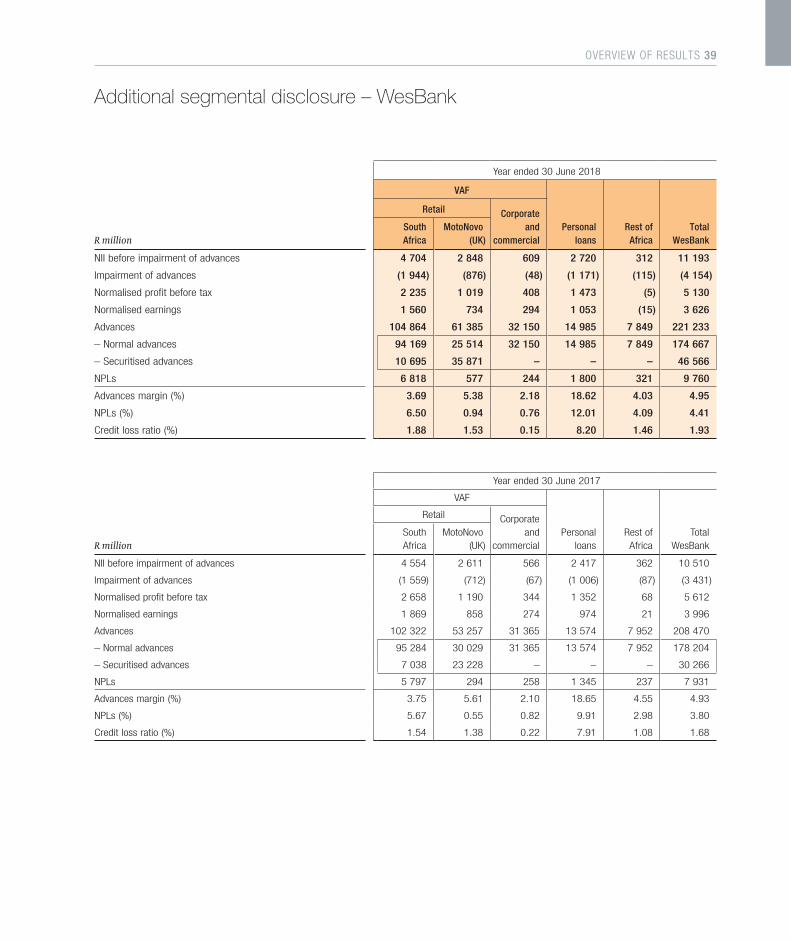
R million
Year ended 30 June 2018
VAF
Retail Corporateand
commercialPersonal
loansRest of
AfricaTotal
WesBankSouth Africa
MotoNovo(UK)
NII before impairment of advances 4 704 2 848 609 2 720 312 11 193
Impairment of advances (1 944) (876) (48) (1 171) (115) (4 154)
Normalised profit before tax 2 235 1 019 408 1 473 (5) 5 130
Normalised earnings 1 560 734 294 1 053 (15) 3 626
Advances 104 864 61 385 32 150 14 985 7 849 221 233
– Normal advances 94 169 25 514 32 150 14 985 7 849 174 667
– Securitised advances 10 695 35 871 – – – 46 566
NPLs 6 818 577 244 1 800 321 9 760
Advances margin (%) 3.69 5.38 2.18 18.62 4.03 4.95
NPLs (%) 6.50 0.94 0.76 12.01 4.09 4.41
Credit loss ratio (%) 1.88 1.53 0.15 8.20 1.46 1.93
Year ended 30 June 2017
VAF
Personalloans
Rest of Africa
TotalWesBank
Retail Corporateand
commercialR millionSouth Africa
MotoNovo(UK)
NII before impairment of advances 4 554 2 611 566 2 417 362 10 510
Impairment of advances (1 559) (712) (67) (1 006) (87) (3 431)
Normalised profit before tax 2 658 1 190 344 1 352 68 5 612
Normalised earnings 1 869 858 274 974 21 3 996
Advances 102 322 53 257 31 365 13 574 7 952 208 470
– Normal advances 95 284 30 029 31 365 13 574 7 952 178 204
– Securitised advances 7 038 23 228 – – – 30 266
NPLs 5 797 294 258 1 345 237 7 931
Advances margin (%) 3.75 5.61 2.10 18.65 4.55 4.93
NPLs (%) 5.67 0.55 0.82 9.91 2.98 3.80
Credit loss ratio (%) 1.54 1.38 0.22 7.91 1.08 1.68
Additional segmental disclosure – WesBank
OVERVIEW OF RESULTS 39
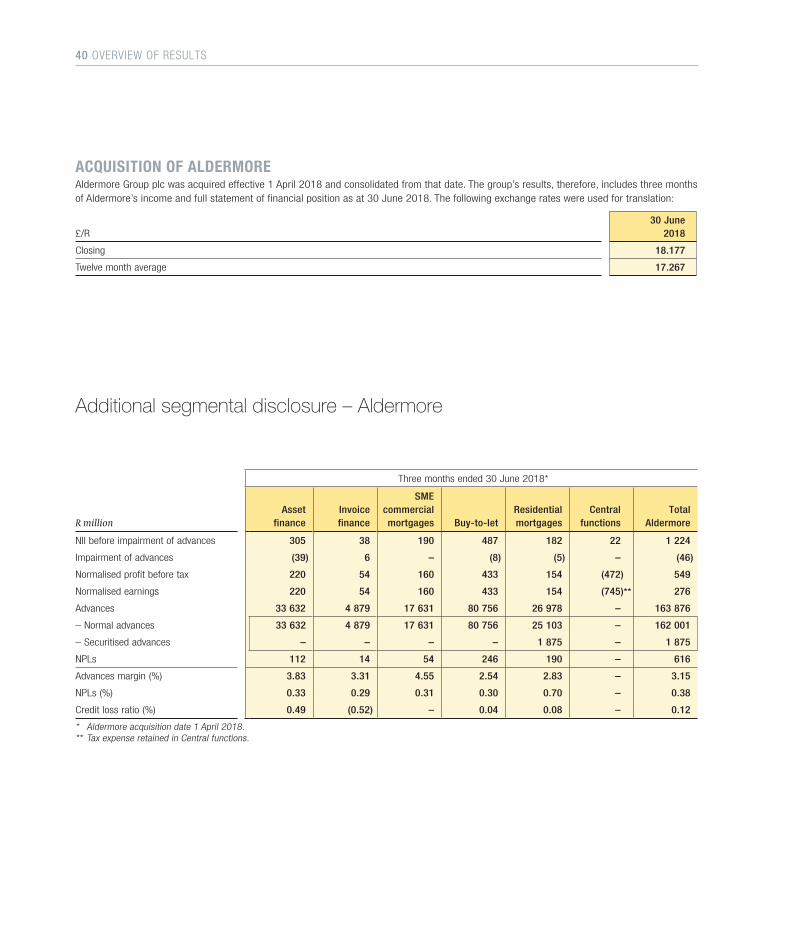
ACQUISITION OF ALDERMOREAldermore Group plc was acquired effective 1 April 2018 and consolidated from that date. The group’s results, therefore, includes three months of Aldermore’s income and full statement of financial position as at 30 June 2018. The following exchange rates were used for translation:
£/R30 June
2018
Closing 18.177
Twelve month average 17.267
Additional segmental disclosure – Aldermore
Three months ended 30 June 2018*
R millionAsset
financeInvoice
finance
SME commercial mortgages Buy-to-let
Residential mortgages
Central functions
Total Aldermore
NII before impairment of advances 305 38 190 487 182 22 1 224
Impairment of advances (39) 6 – (8) (5) – (46)
Normalised profit before tax 220 54 160 433 154 (472) 549
Normalised earnings 220 54 160 433 154 (745)** 276
Advances 33 632 4 879 17 631 80 756 26 978 – 163 876
– Normal advances 33 632 4 879 17 631 80 756 25 103 – 162 001
– Securitised advances – – – – 1 875 – 1 875
NPLs 112 14 54 246 190 – 616
Advances margin (%) 3.83 3.31 4.55 2.54 2.83 – 3.15
NPLs (%) 0.33 0.29 0.31 0.30 0.70 – 0.38
Credit loss ratio (%) 0.49 (0.52) – 0.04 0.08 – 0.12
* Aldermore acquisition date 1 April 2018.** Tax expense retained in Central functions.
40 OVERVIEW OF RESULTS
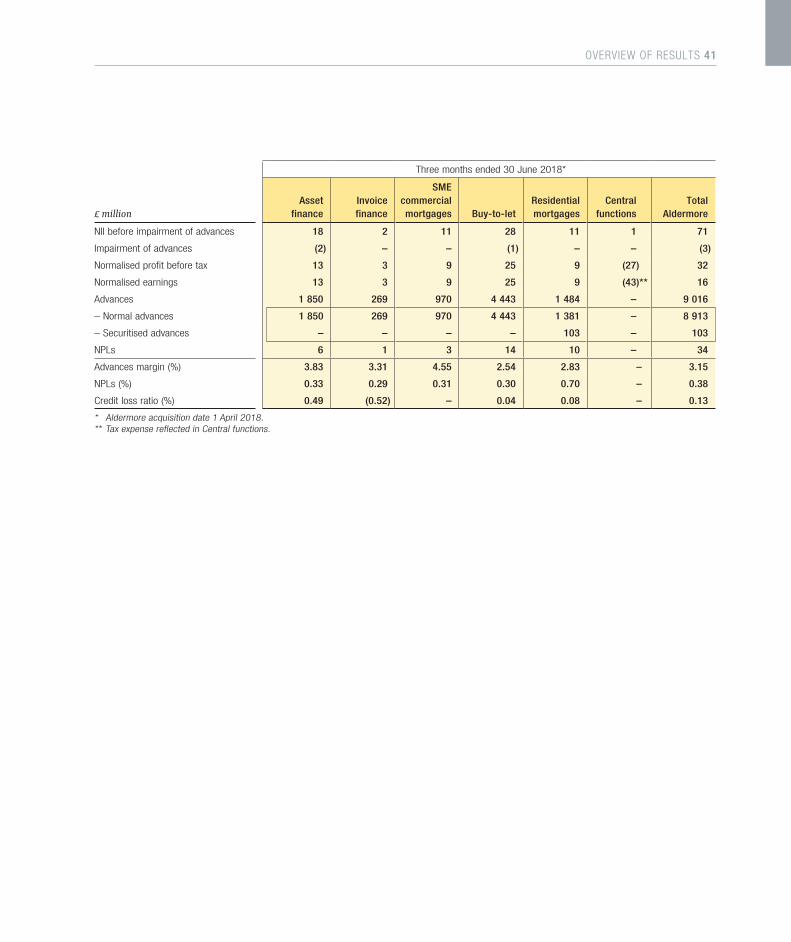
Three months ended 30 June 2018*
£ millionAsset
financeInvoice
finance
SME commercial mortgages Buy-to-let
Residential mortgages
Central functions
Total Aldermore
NII before impairment of advances 18 2 11 28 11 1 71
Impairment of advances (2) – – (1) – – (3)
Normalised profit before tax 13 3 9 25 9 (27) 32
Normalised earnings 13 3 9 25 9 (43)** 16
Advances 1 850 269 970 4 443 1 484 – 9 016
– Normal advances 1 850 269 970 4 443 1 381 – 8 913
– Securitised advances – – – – 103 – 103
NPLs 6 1 3 14 10 – 34
Advances margin (%) 3.83 3.31 4.55 2.54 2.83 – 3.15
NPLs (%) 0.33 0.29 0.31 0.30 0.70 – 0.38
Credit loss ratio (%) 0.49 (0.52) – 0.04 0.08 – 0.13
* Aldermore acquisition date 1 April 2018. ** Tax expense reflected in Central functions.
OVERVIEW OF RESULTS 41
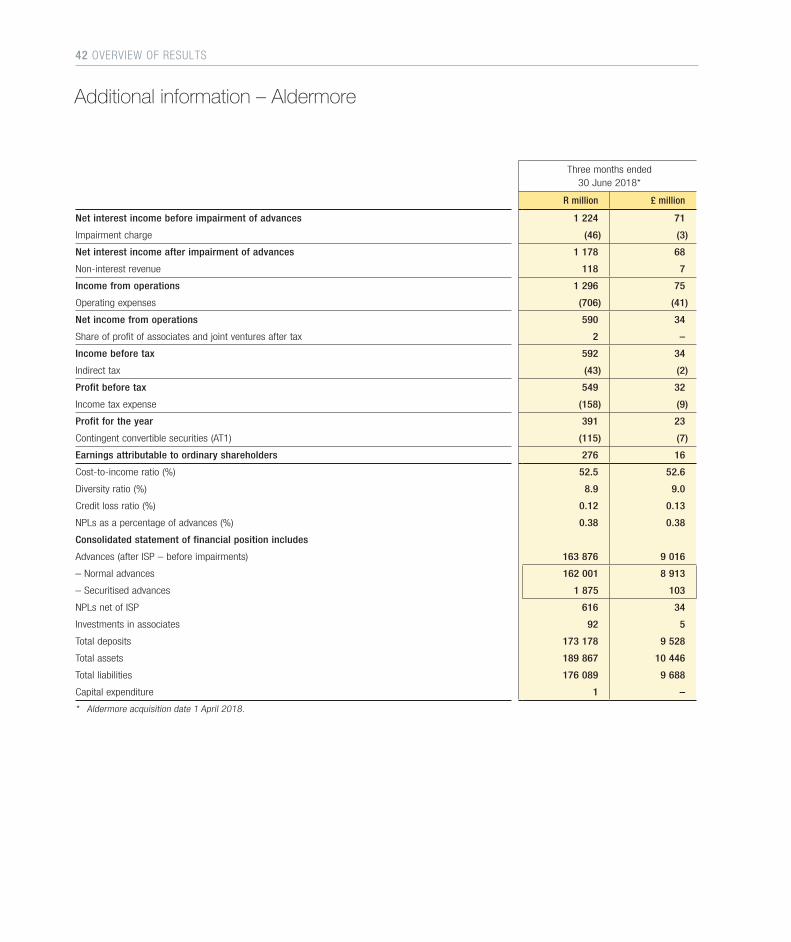
Additional information – Aldermore
Three months ended30 June 2018*
R million £ million
Net interest income before impairment of advances 1 224 71
Impairment charge (46) (3)
Net interest income after impairment of advances 1 178 68
Non-interest revenue 118 7
Income from operations 1 296 75
Operating expenses (706) (41)
Net income from operations 590 34
Share of profit of associates and joint ventures after tax 2 –
Income before tax 592 34
Indirect tax (43) (2)
Profit before tax 549 32
Income tax expense (158) (9)
Profit for the year 391 23
Contingent convertible securities (AT1) (115) (7)
Earnings attributable to ordinary shareholders 276 16
Cost-to-income ratio (%) 52.5 52.6
Diversity ratio (%) 8.9 9.0
Credit loss ratio (%) 0.12 0.13
NPLs as a percentage of advances (%) 0.38 0.38
Consolidated statement of financial position includes
Advances (after ISP – before impairments) 163 876 9 016
– Normal advances 162 001 8 913
– Securitised advances 1 875 103
NPLs net of ISP 616 34
Investments in associates 92 5
Total deposits 173 178 9 528
Total assets 189 867 10 446
Total liabilities 176 089 9 688
Capital expenditure 1 –
* Aldermore acquisition date 1 April 2018.
42 OVERVIEW OF RESULTS
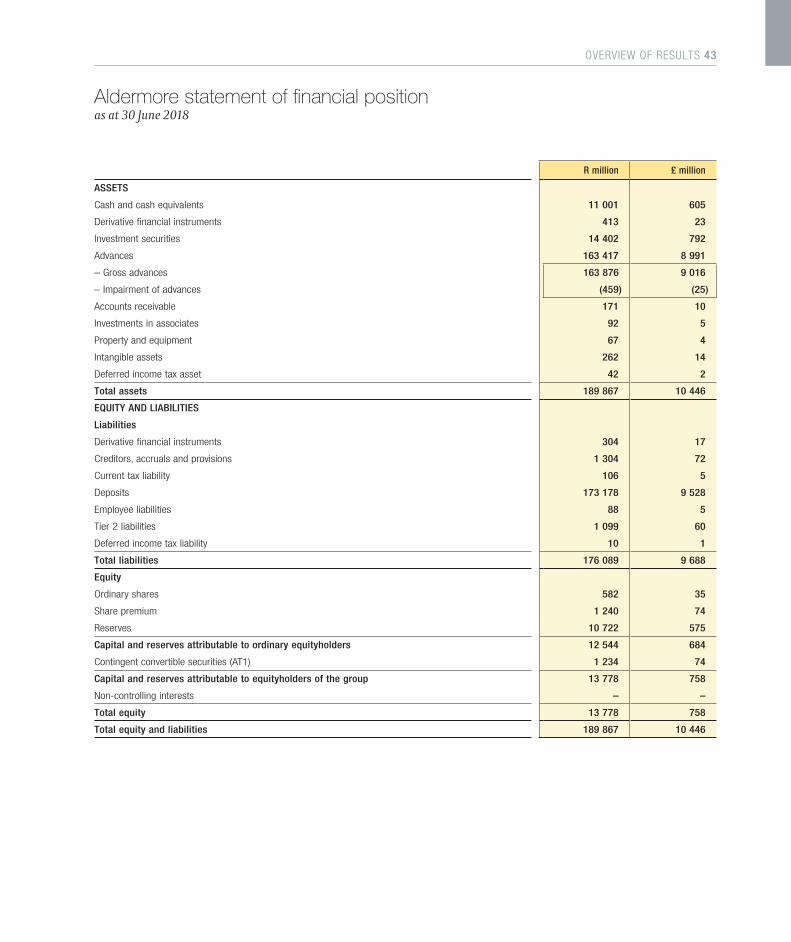
R million £ million
ASSETS
Cash and cash equivalents 11 001 605
Derivative financial instruments 413 23
Investment securities 14 402 792
Advances 163 417 8 991
– Gross advances 163 876 9 016
– Impairment of advances (459) (25)
Accounts receivable 171 10
Investments in associates 92 5
Property and equipment 67 4
Intangible assets 262 14
Deferred income tax asset 42 2
Total assets 189 867 10 446
EQUITY AND LIABILITIES
Liabilities
Derivative financial instruments 304 17
Creditors, accruals and provisions 1 304 72
Current tax liability 106 5
Deposits 173 178 9 528
Employee liabilities 88 5
Tier 2 liabilities 1 099 60
Deferred income tax liability 10 1
Total liabilities 176 089 9 688
Equity
Ordinary shares 582 35
Share premium 1 240 74
Reserves 10 722 575
Capital and reserves attributable to ordinary equityholders 12 544 684
Contingent convertible securities (AT1) 1 234 74
Capital and reserves attributable to equityholders of the group 13 778 758
Non-controlling interests – –
Total equity 13 778 758
Total equity and liabilities 189 867 10 446
Aldermore statement of financial positionas at 30 June 2018
OVERVIEW OF RESULTS 43

income statement analysis46 – 66
02
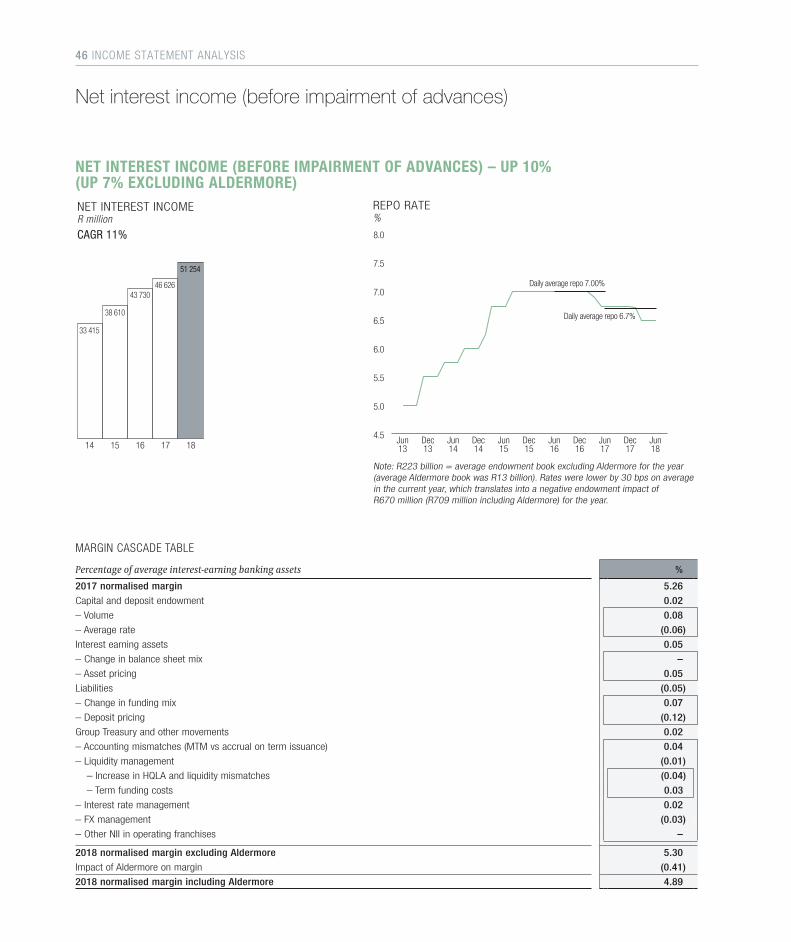
NET INTEREST INCOME (BEFORE IMPAIRMENT OF ADVANCES) – UP 10% (UP 7% EXCLUDING ALDERMORE)
8.0
7.5
7.0
6.5
6.0
5.5
5.0
4.5
Daily average repo 6.7%
Daily average repo 7.00%
Jun13
Dec13
Jun14
Dec14
Jun15
Jun17
Dec16
Jun16
Dec15
Dec17
Jun18
REPO RATE%
33 415
38 610
43 73046 626
15 16 17 18 14
NET INTEREST INCOMER million
CAGR 11%
51 254
Note: R223 billion = average endowment book excluding Aldermore for the year (average Aldermore book was R13 billion). Rates were lower by 30 bps on average in the current year, which translates into a negative endowment impact of R670 million (R709 million including Aldermore) for the year.
MARGIN CASCADE TABLE
Percentage of average interest-earning banking assets %
2017 normalised margin 5.26
Capital and deposit endowment 0.02
– Volume 0.08
– Average rate (0.06)
Interest earning assets 0.05
– Change in balance sheet mix –
– Asset pricing 0.05
Liabilities (0.05)
– Change in funding mix 0.07
– Deposit pricing (0.12)
Group Treasury and other movements 0.02
– Accounting mismatches (MTM vs accrual on term issuance) 0.04
– Liquidity management (0.01)
– Increase in HQLA and liquidity mismatches (0.04)
– Term funding costs 0.03
– Interest rate management 0.02
– FX management (0.03)
– Other NII in operating franchises –
2018 normalised margin excluding Aldermore 5.30
Impact of Aldermore on margin (0.41)
2018 normalised margin including Aldermore 4.89
Net interest income (before impairment of advances)
46 INCOME STATEMENT ANALYSIS
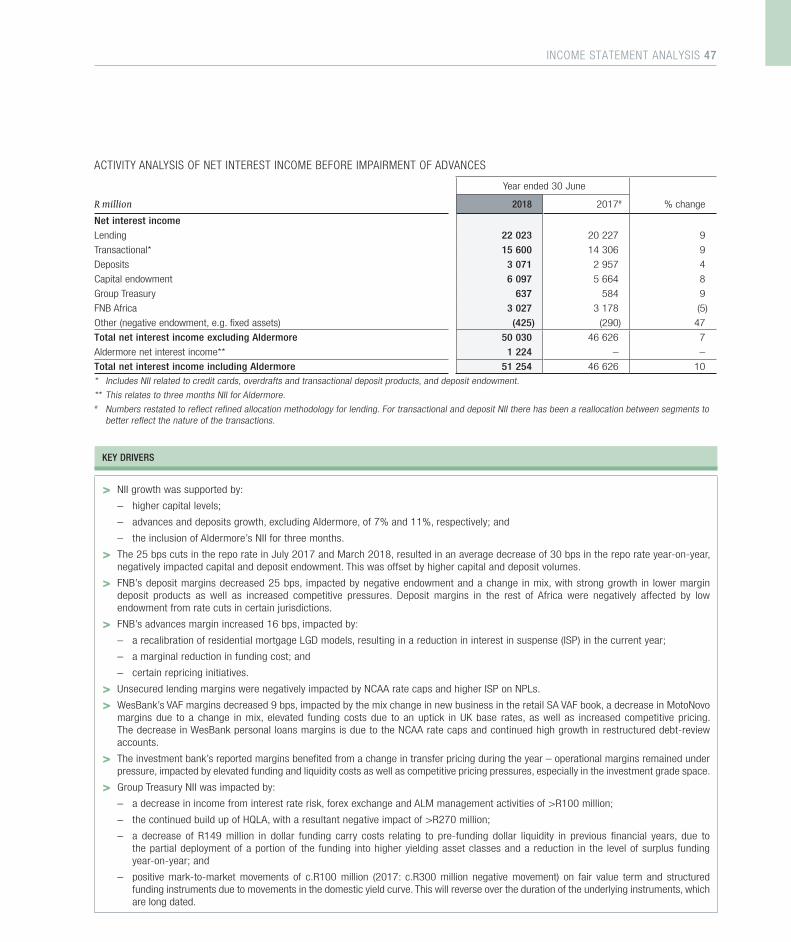
ACTIVITY ANALYSIS OF NET INTEREST INCOME BEFORE IMPAIRMENT OF ADVANCES
Year ended 30 June
R million 2018 2017# % change
Net interest income
Lending 22 023 20 227 9
Transactional* 15 600 14 306 9
Deposits 3 071 2 957 4
Capital endowment 6 097 5 664 8
Group Treasury 637 584 9
FNB Africa 3 027 3 178 (5)
Other (negative endowment, e.g. fixed assets) (425) (290) 47
Total net interest income excluding Aldermore 50 030 46 626 7
Aldermore net interest income** 1 224 – –
Total net interest income including Aldermore 51 254 46 626 10
* Includes NII related to credit cards, overdrafts and transactional deposit products, and deposit endowment.
** This relates to three months NII for Aldermore.# Numbers restated to reflect refined allocation methodology for lending. For transactional and deposit NII there has been a reallocation between segments to
better reflect the nature of the transactions.
KEY DRIVERS
> NII growth was supported by:
– higher capital levels;
– advances and deposits growth, excluding Aldermore, of 7% and 11%, respectively; and
– the inclusion of Aldermore’s NII for three months.
> The 25 bps cuts in the repo rate in July 2017 and March 2018, resulted in an average decrease of 30 bps in the repo rate year-on-year, negatively impacted capital and deposit endowment. This was offset by higher capital and deposit volumes.
> FNB’s deposit margins decreased 25 bps, impacted by negative endowment and a change in mix, with strong growth in lower margin deposit products as well as increased competitive pressures. Deposit margins in the rest of Africa were negatively affected by low endowment from rate cuts in certain jurisdictions.
> FNB’s advances margin increased 16 bps, impacted by:
– a recalibration of residential mortgage LGD models, resulting in a reduction in interest in suspense (ISP) in the current year;
– a marginal reduction in funding cost; and
– certain repricing initiatives.
> Unsecured lending margins were negatively impacted by NCAA rate caps and higher ISP on NPLs.
> WesBank’s VAF margins decreased 9 bps, impacted by the mix change in new business in the retail SA VAF book, a decrease in MotoNovo margins due to a change in mix, elevated funding costs due to an uptick in UK base rates, as well as increased competitive pricing. The decrease in WesBank personal loans margins is due to the NCAA rate caps and continued high growth in restructured debt-review accounts.
> The investment bank’s reported margins benefited from a change in transfer pricing during the year – operational margins remained under pressure, impacted by elevated funding and liquidity costs as well as competitive pricing pressures, especially in the investment grade space.
> Group Treasury NII was impacted by:
– a decrease in income from interest rate risk, forex exchange and ALM management activities of >R100 million;
– the continued build up of HQLA, with a resultant negative impact of >R270 million;
– a decrease of R149 million in dollar funding carry costs relating to pre-funding dollar liquidity in previous financial years, due to the partial deployment of a portion of the funding into higher yielding asset classes and a reduction in the level of surplus funding year-on-year; and
– positive mark-to-market movements of c.R100 million (2017: c.R300 million negative movement) on fair value term and structured funding instruments due to movements in the domestic yield curve. This will reverse over the duration of the underlying instruments, which are long dated.
INCOME STATEMENT ANALYSIS 47
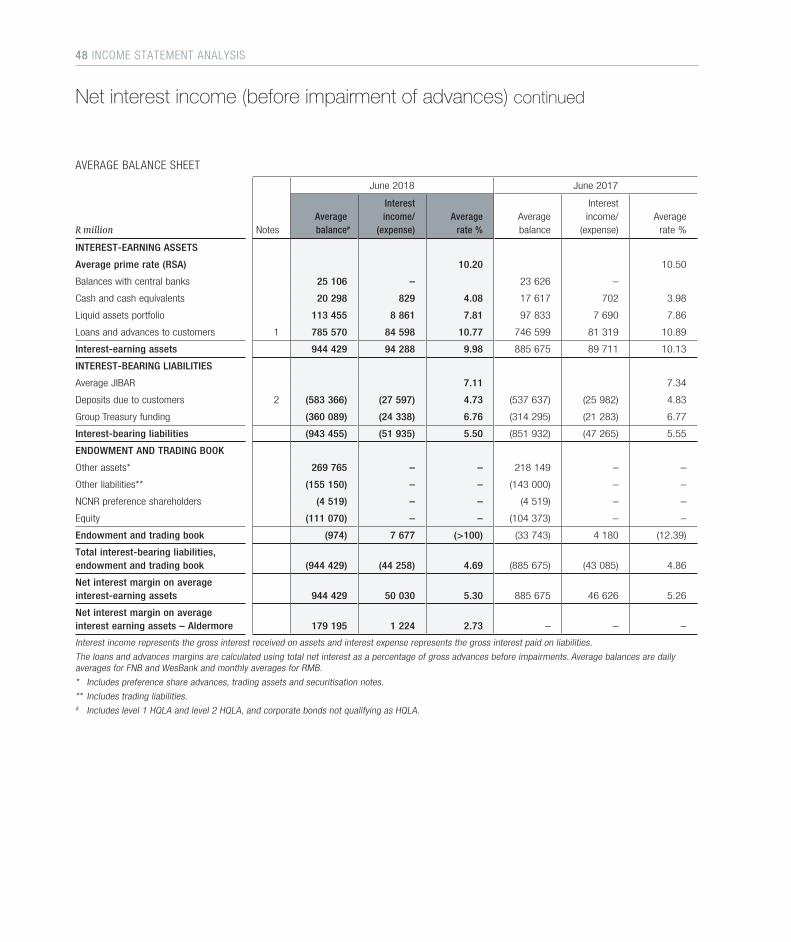
Net interest income (before impairment of advances) continued
AVERAGE BALANCE SHEET
June 2018 June 2017
R million NotesAverage balance#
Interest income/
(expense)Average
rate % Average balance
Interest income/
(expense) Average
rate %
INTEREST-EARNING ASSETS
Average prime rate (RSA) 10.20 10.50
Balances with central banks 25 106 – 23 626 –
Cash and cash equivalents 20 298 829 4.08 17 617 702 3.98
Liquid assets portfolio 113 455 8 861 7.81 97 833 7 690 7.86
Loans and advances to customers 1 785 570 84 598 10.77 746 599 81 319 10.89
Interest-earning assets 944 429 94 288 9.98 885 675 89 711 10.13
INTEREST-BEARING LIABILITIES
Average JIBAR 7.11 7.34
Deposits due to customers 2 (583 366) (27 597) 4.73 (537 637) (25 982) 4.83
Group Treasury funding (360 089) (24 338) 6.76 (314 295) (21 283) 6.77
Interest-bearing liabilities (943 455) (51 935) 5.50 (851 932) (47 265) 5.55
ENDOWMENT AND TRADING BOOK
Other assets* 269 765 – – 218 149 – –
Other liabilities** (155 150) – – (143 000) – –
NCNR preference shareholders (4 519) – – (4 519) – –
Equity (111 070) – – (104 373) – –
Endowment and trading book (974) 7 677 (>100) (33 743) 4 180 (12.39)
Total interest-bearing liabilities, endowment and trading book (944 429) (44 258) 4.69 (885 675) (43 085) 4.86
Net interest margin on average interest-earning assets 944 429 50 030 5.30 885 675 46 626 5.26
Net interest margin on average interest earning assets – Aldermore 179 195 1 224 2.73 – – –
Interest income represents the gross interest received on assets and interest expense represents the gross interest paid on liabilities.
The loans and advances margins are calculated using total net interest as a percentage of gross advances before impairments. Average balances are daily averages for FNB and WesBank and monthly averages for RMB.
* Includes preference share advances, trading assets and securitisation notes.
** Includes trading liabilities.# Includes level 1 HQLA and level 2 HQLA, and corporate bonds not qualifying as HQLA.
48 INCOME STATEMENT ANALYSIS
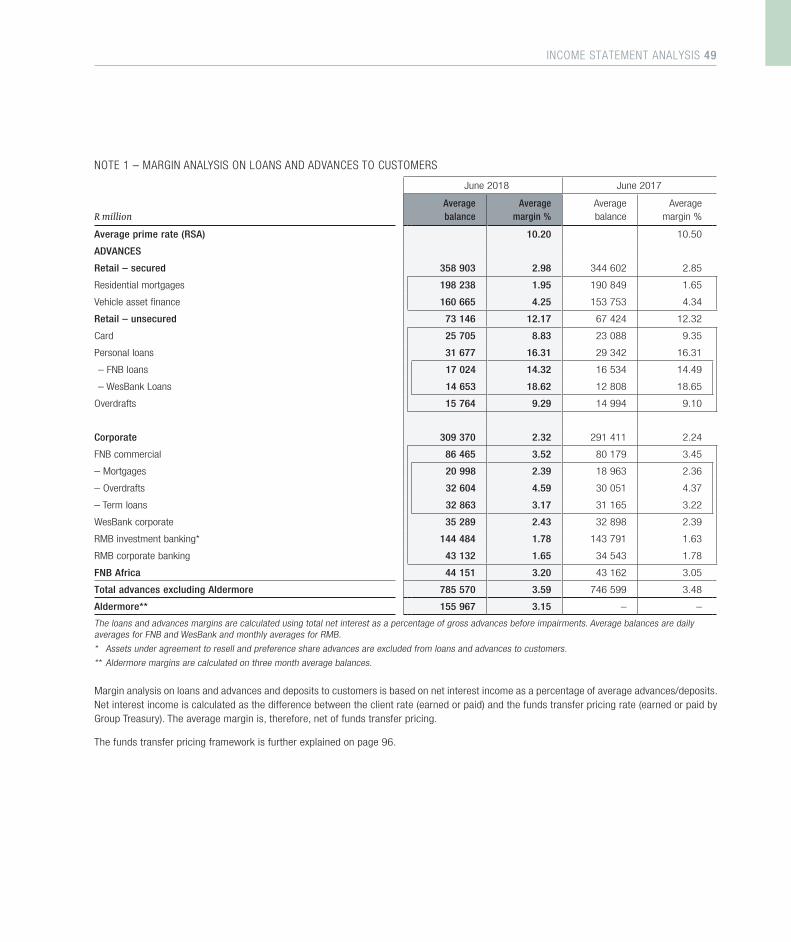
NOTE 1 – MARGIN ANALYSIS ON LOANS AND ADVANCES TO CUSTOMERS
June 2018 June 2017
R millionAverage balance
Average margin %
Average balance
Average margin %
Average prime rate (RSA) 10.20 10.50
ADVANCES
Retail – secured 358 903 2.98 344 602 2.85
Residential mortgages 198 238 1.95 190 849 1.65
Vehicle asset finance 160 665 4.25 153 753 4.34
Retail – unsecured 73 146 12.17 67 424 12.32
Card 25 705 8.83 23 088 9.35
Personal loans 31 677 16.31 29 342 16.31
– FNB loans 17 024 14.32 16 534 14.49
– WesBank Loans 14 653 18.62 12 808 18.65
Overdrafts 15 764 9.29 14 994 9.10
Corporate 309 370 2.32 291 411 2.24
FNB commercial 86 465 3.52 80 179 3.45
– Mortgages 20 998 2.39 18 963 2.36
– Overdrafts 32 604 4.59 30 051 4.37
– Term loans 32 863 3.17 31 165 3.22
WesBank corporate 35 289 2.43 32 898 2.39
RMB investment banking* 144 484 1.78 143 791 1.63
RMB corporate banking 43 132 1.65 34 543 1.78
FNB Africa 44 151 3.20 43 162 3.05
Total advances excluding Aldermore 785 570 3.59 746 599 3.48
Aldermore** 155 967 3.15 – –
The loans and advances margins are calculated using total net interest as a percentage of gross advances before impairments. Average balances are daily averages for FNB and WesBank and monthly averages for RMB.
* Assets under agreement to resell and preference share advances are excluded from loans and advances to customers.
** Aldermore margins are calculated on three month average balances.
Margin analysis on loans and advances and deposits to customers is based on net interest income as a percentage of average advances/deposits. Net interest income is calculated as the difference between the client rate (earned or paid) and the funds transfer pricing rate (earned or paid by Group Treasury). The average margin is, therefore, net of funds transfer pricing.
The funds transfer pricing framework is further explained on page 96.
INCOME STATEMENT ANALYSIS 49
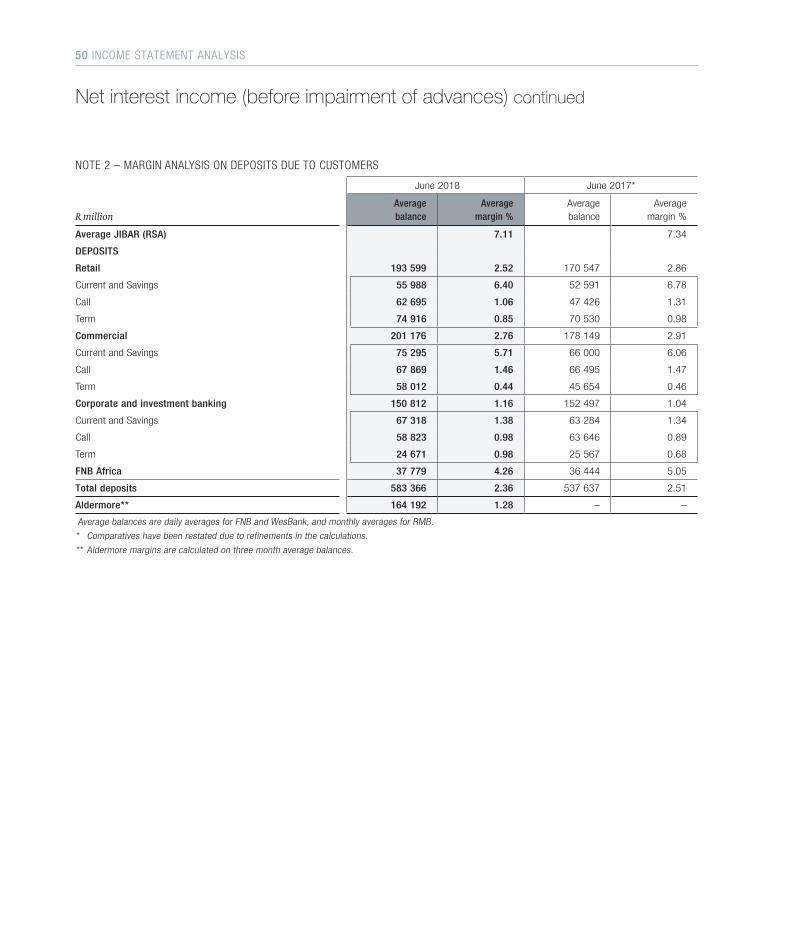
NOTE 2 – MARGIN ANALYSIS ON DEPOSITS DUE TO CUSTOMERS
June 2018 June 2017*
R millionAverage balance
Average margin %
Average balance
Average margin %
Average JIBAR (RSA) 7.11 7.34
DEPOSITS
Retail 193 599 2.52 170 547 2.86
Current and Savings 55 988 6.40 52 591 6.78
Call 62 695 1.06 47 426 1.31
Term 74 916 0.85 70 530 0.98
Commercial 201 176 2.76 178 149 2.91
Current and Savings 75 295 5.71 66 000 6.06
Call 67 869 1.46 66 495 1.47
Term 58 012 0.44 45 654 0.46
Corporate and investment banking 150 812 1.16 152 497 1.04
Current and Savings 67 318 1.38 63 284 1.34
Call 58 823 0.98 63 646 0.89
Term 24 671 0.98 25 567 0.68
FNB Africa 37 779 4.26 36 444 5.05
Total deposits 583 366 2.36 537 637 2.51
Aldermore** 164 192 1.28 – –
Average balances are daily averages for FNB and WesBank, and monthly averages for RMB.
* Comparatives have been restated due to refinements in the calculations.
** Aldermore margins are calculated on three month average balances.
Net interest income (before impairment of advances) continued
50 INCOME STATEMENT ANALYSIS
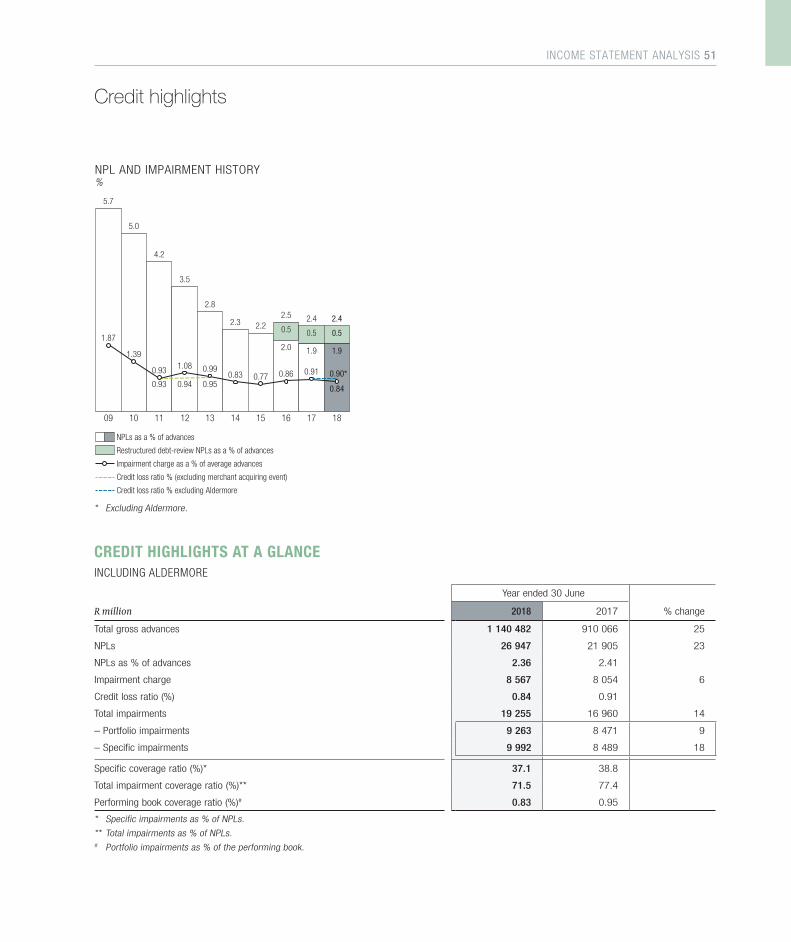
1311 121009 14 15
2.8
3.5
4.2
5.0
5.7
2.3 2.22.5
16
2.0
18
1.9
17
2.4 2.4
0.50.5 0.5
0.991.08
0.94 0.95
1.39
1.87
0.83 0.770.91
0.84
0.86
NPLs as a % of advances
Restructured debt-review NPLs as a % of advances
Impairment charge as a % of average advances
Credit loss ratio % (excluding merchant acquiring event)
Credit loss ratio % excluding Aldermore
NPL AND IMPAIRMENT HISTORY%
0.93
0.93
1.9
0.90*
* Excluding Aldermore.
CREDIT HIGHLIGHTS AT A GLANCEINCLUDING ALDERMORE
Year ended 30 June
R million 2018 2017 % change
Total gross advances 1 140 482 910 066 25
NPLs 26 947 21 905 23
NPLs as % of advances 2.36 2.41
Impairment charge 8 567 8 054 6
Credit loss ratio (%) 0.84 0.91
Total impairments 19 255 16 960 14
– Portfolio impairments 9 263 8 471 9
– Specific impairments 9 992 8 489 18
Specific coverage ratio (%)* 37.1 38.8
Total impairment coverage ratio (%)** 71.5 77.4
Performing book coverage ratio (%)# 0.83 0.95
* Specific impairments as % of NPLs.
** Total impairments as % of NPLs.# Portfolio impairments as % of the performing book.
Credit highlights
INCOME STATEMENT ANALYSIS 51
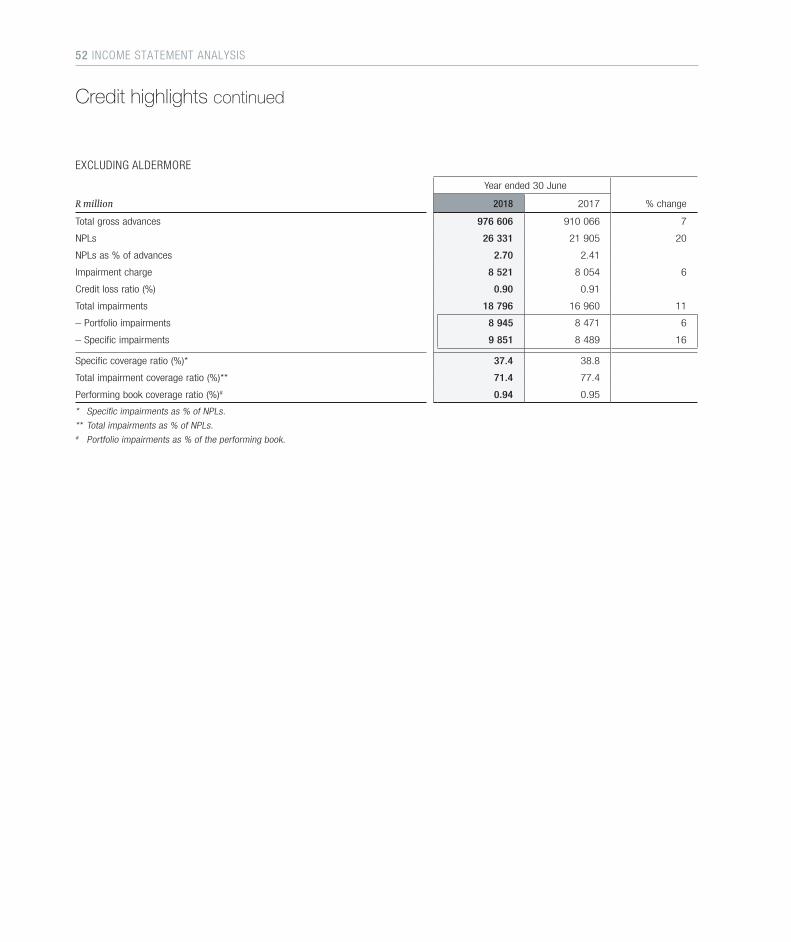
EXCLUDING ALDERMORE
Year ended 30 June
R million 2018 2017 % change
Total gross advances 976 606 910 066 7
NPLs 26 331 21 905 20
NPLs as % of advances 2.70 2.41
Impairment charge 8 521 8 054 6
Credit loss ratio (%) 0.90 0.91
Total impairments 18 796 16 960 11
– Portfolio impairments 8 945 8 471 6
– Specific impairments 9 851 8 489 16
Specific coverage ratio (%)* 37.4 38.8
Total impairment coverage ratio (%)** 71.4 77.4
Performing book coverage ratio (%)# 0.94 0.95
* Specific impairments as % of NPLs.
** Total impairments as % of NPLs.# Portfolio impairments as % of the performing book.
Credit highlights continued
52 INCOME STATEMENT ANALYSIS
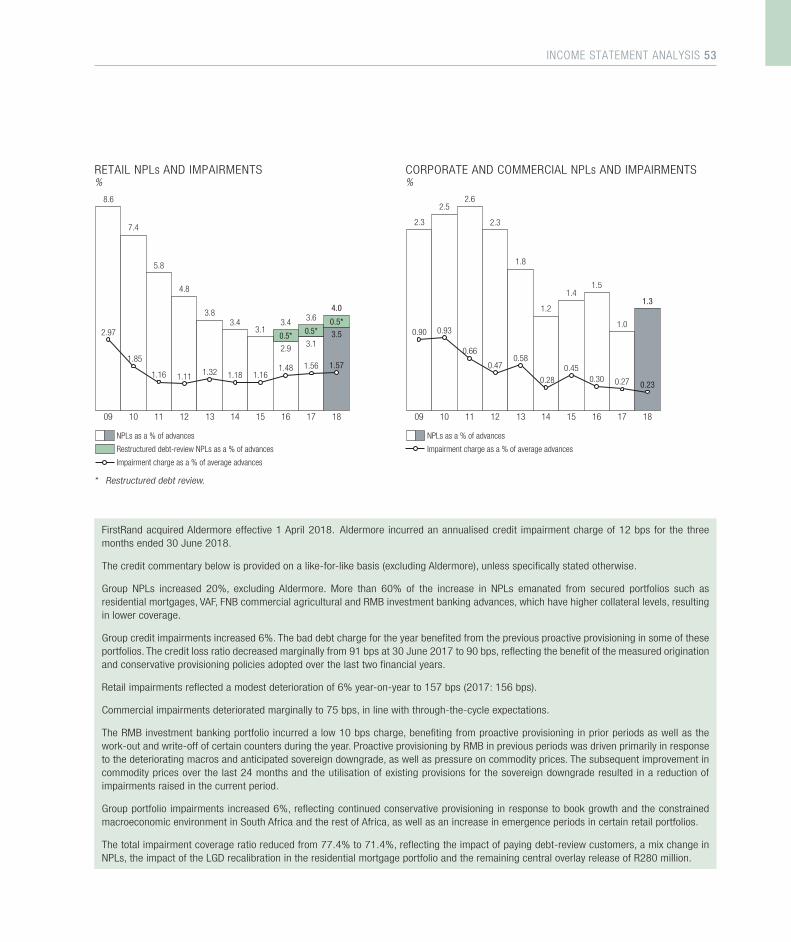
1412 13111009 15
3.43.8
4.8
5.8
7.4
8.6
3.13.4
16 1817
3.64.0
0.5*0.5*
1.181.321.16
1.85
2.97
1.161.56 1.571.48
RETAIL NPLs AND IMPAIRMENTS%
1.11
0.5*
2.9 3.13.5
NPLs as a % of advances
Restructured debt-review NPLs as a % of advances
Impairment charge as a % of average advances
1412 13111009 15
1.2
1.8
2.3
2.62.5
2.3
1.41.5
16 1817
1.0
1.3
0.28
0.580.66
0.930.90
0.45
0.27 0.230.30
NPLs as a % of advances
Impairment charge as a % of average advances
0.47
CORPORATE AND COMMERCIAL NPLs AND IMPAIRMENTS%
* Restructured debt review.
FirstRand acquired Aldermore effective 1 April 2018. Aldermore incurred an annualised credit impairment charge of 12 bps for the three months ended 30 June 2018.
The credit commentary below is provided on a like-for-like basis (excluding Aldermore), unless specifically stated otherwise.
Group NPLs increased 20%, excluding Aldermore. More than 60% of the increase in NPLs emanated from secured portfolios such as residential mortgages, VAF, FNB commercial agricultural and RMB investment banking advances, which have higher collateral levels, resulting in lower coverage.
Group credit impairments increased 6%. The bad debt charge for the year benefited from the previous proactive provisioning in some of these portfolios. The credit loss ratio decreased marginally from 91 bps at 30 June 2017 to 90 bps, reflecting the benefit of the measured origination and conservative provisioning policies adopted over the last two financial years.
Retail impairments reflected a modest deterioration of 6% year-on-year to 157 bps (2017: 156 bps).
Commercial impairments deteriorated marginally to 75 bps, in line with through-the-cycle expectations.
The RMB investment banking portfolio incurred a low 10 bps charge, benefiting from proactive provisioning in prior periods as well as the work-out and write-off of certain counters during the year. Proactive provisioning by RMB in previous periods was driven primarily in response to the deteriorating macros and anticipated sovereign downgrade, as well as pressure on commodity prices. The subsequent improvement in commodity prices over the last 24 months and the utilisation of existing provisions for the sovereign downgrade resulted in a reduction of impairments raised in the current period.
Group portfolio impairments increased 6%, reflecting continued conservative provisioning in response to book growth and the constrained macroeconomic environment in South Africa and the rest of Africa, as well as an increase in emergence periods in certain retail portfolios.
The total impairment coverage ratio reduced from 77.4% to 71.4%, reflecting the impact of paying debt-review customers, a mix change in NPLs, the impact of the LGD recalibration in the residential mortgage portfolio and the remaining central overlay release of R280 million.
INCOME STATEMENT ANALYSIS 53
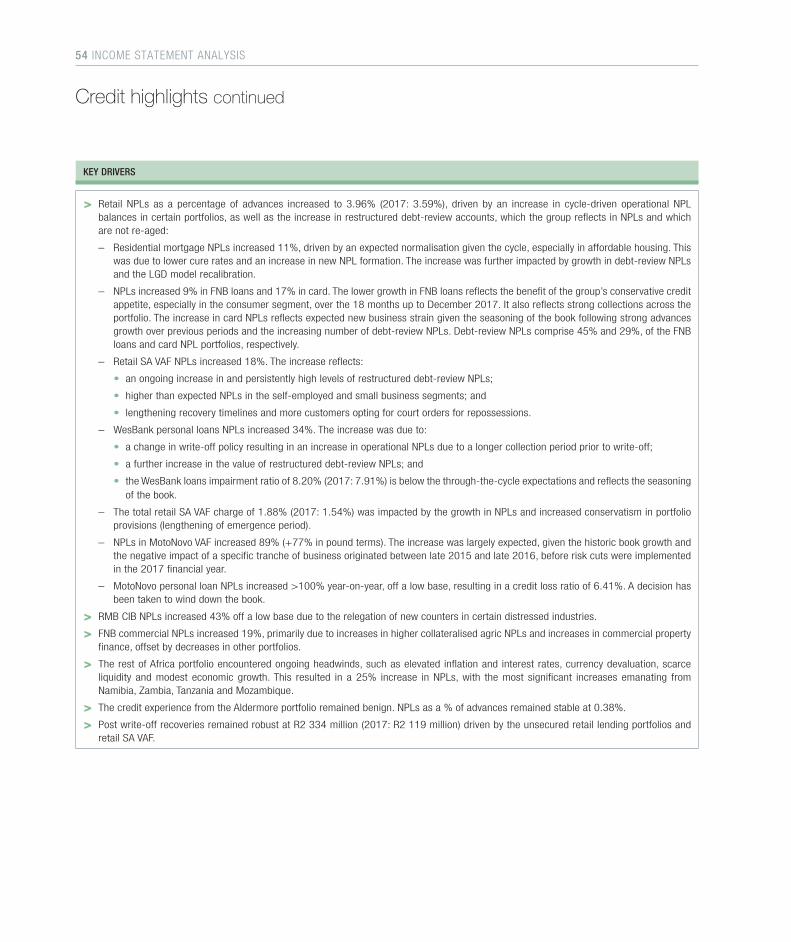
KEY DRIVERS
> Retail NPLs as a percentage of advances increased to 3.96% (2017: 3.59%), driven by an increase in cycle-driven operational NPL balances in certain portfolios, as well as the increase in restructured debt-review accounts, which the group reflects in NPLs and which are not re-aged:
– Residential mortgage NPLs increased 11%, driven by an expected normalisation given the cycle, especially in affordable housing. This was due to lower cure rates and an increase in new NPL formation. The increase was further impacted by growth in debt-review NPLs and the LGD model recalibration.
– NPLs increased 9% in FNB loans and 17% in card. The lower growth in FNB loans reflects the benefit of the group’s conservative credit appetite, especially in the consumer segment, over the 18 months up to December 2017. It also reflects strong collections across the portfolio. The increase in card NPLs reflects expected new business strain given the seasoning of the book following strong advances growth over previous periods and the increasing number of debt-review NPLs. Debt-review NPLs comprise 45% and 29%, of the FNB loans and card NPL portfolios, respectively.
– Retail SA VAF NPLs increased 18%. The increase reflects:
• an ongoing increase in and persistently high levels of restructured debt-review NPLs;
• higher than expected NPLs in the self-employed and small business segments; and
• lengthening recovery timelines and more customers opting for court orders for repossessions.
– WesBank personal loans NPLs increased 34%. The increase was due to:
• a change in write-off policy resulting in an increase in operational NPLs due to a longer collection period prior to write-off;
• a further increase in the value of restructured debt-review NPLs; and
• the WesBank loans impairment ratio of 8.20% (2017: 7.91%) is below the through-the-cycle expectations and reflects the seasoning of the book.
– The total retail SA VAF charge of 1.88% (2017: 1.54%) was impacted by the growth in NPLs and increased conservatism in portfolio provisions (lengthening of emergence period).
– NPLs in MotoNovo VAF increased 89% (+77% in pound terms). The increase was largely expected, given the historic book growth and the negative impact of a specific tranche of business originated between late 2015 and late 2016, before risk cuts were implemented in the 2017 financial year.
– MotoNovo personal loan NPLs increased >100% year-on-year, off a low base, resulting in a credit loss ratio of 6.41%. A decision has been taken to wind down the book.
> RMB CIB NPLs increased 43% off a low base due to the relegation of new counters in certain distressed industries.
> FNB commercial NPLs increased 19%, primarily due to increases in higher collateralised agric NPLs and increases in commercial property finance, offset by decreases in other portfolios.
> The rest of Africa portfolio encountered ongoing headwinds, such as elevated inflation and interest rates, currency devaluation, scarce liquidity and modest economic growth. This resulted in a 25% increase in NPLs, with the most significant increases emanating from Namibia, Zambia, Tanzania and Mozambique.
> The credit experience from the Aldermore portfolio remained benign. NPLs as a % of advances remained stable at 0.38%.
> Post write-off recoveries remained robust at R2 334 million (2017: R2 119 million) driven by the unsecured retail lending portfolios and retail SA VAF.
Credit highlights continued
54 INCOME STATEMENT ANALYSIS
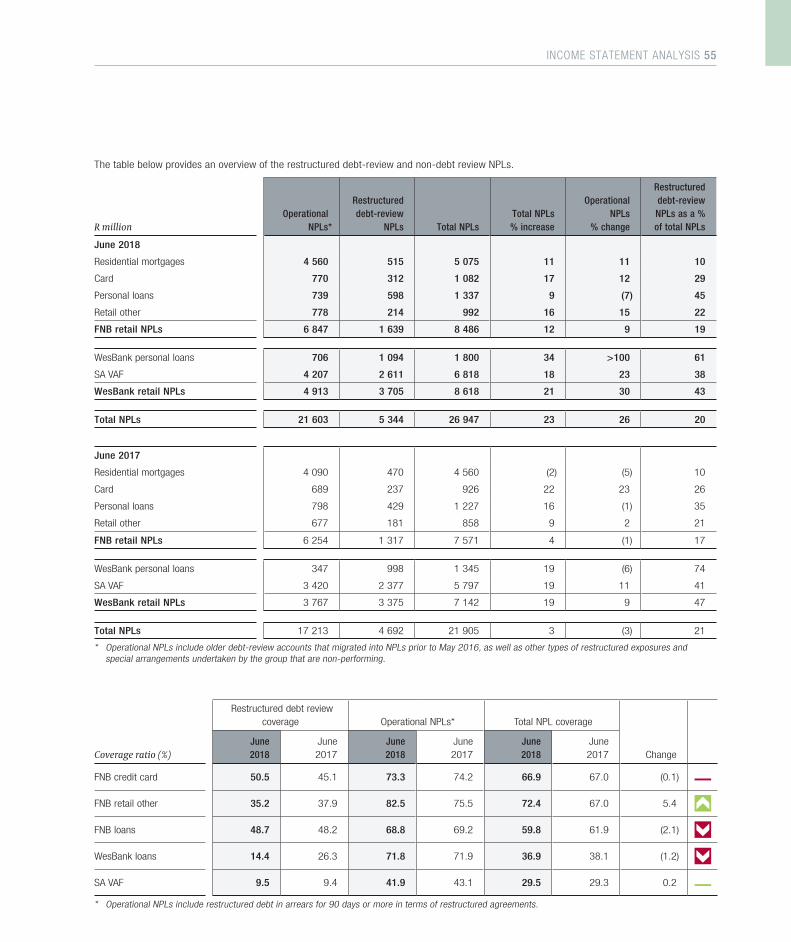
The table below provides an overview of the restructured debt-review and non-debt review NPLs.
R millionOperational
NPLs*
Restructureddebt-review
NPLs Total NPLsTotal NPLs % increase
Operational NPLs
% change
Restructured debt-review NPLs as a % of total NPLs
June 2018
Residential mortgages 4 560 515 5 075 11 11 10
Card 770 312 1 082 17 12 29
Personal loans 739 598 1 337 9 (7) 45
Retail other 778 214 992 16 15 22
FNB retail NPLs 6 847 1 639 8 486 12 9 19
WesBank personal loans 706 1 094 1 800 34 >100 61
SA VAF 4 207 2 611 6 818 18 23 38
WesBank retail NPLs 4 913 3 705 8 618 21 30 43
Total NPLs 21 603 5 344 26 947 23 26 20
June 2017
Residential mortgages 4 090 470 4 560 (2) (5) 10
Card 689 237 926 22 23 26
Personal loans 798 429 1 227 16 (1) 35
Retail other 677 181 858 9 2 21
FNB retail NPLs 6 254 1 317 7 571 4 (1) 17
WesBank personal loans 347 998 1 345 19 (6) 74
SA VAF 3 420 2 377 5 797 19 11 41
WesBank retail NPLs 3 767 3 375 7 142 19 9 47
Total NPLs 17 213 4 692 21 905 3 (3) 21
* Operational NPLs include older debt-review accounts that migrated into NPLs prior to May 2016, as well as other types of restructured exposures and special arrangements undertaken by the group that are non-performing.
Restructured debt review coverage Operational NPLs* Total NPL coverage
Coverage ratio (%)June2018
June2017
June2018
June2017
June2018
June2017 Change
FNB credit card 50.5 45.1 73.3 74.2 66.9 67.0 (0.1)
FNB retail other 35.2 37.9 82.5 75.5 72.4 67.0 5.4
FNB loans 48.7 48.2 68.8 69.2 59.8 61.9 (2.1)
WesBank loans 14.4 26.3 71.8 71.9 36.9 38.1 (1.2)
SA VAF 9.5 9.4 41.9 43.1 29.5 29.3 0.2
* Operational NPLs include restructured debt in arrears for 90 days or more in terms of restructured agreements.
INCOME STATEMENT ANALYSIS 55
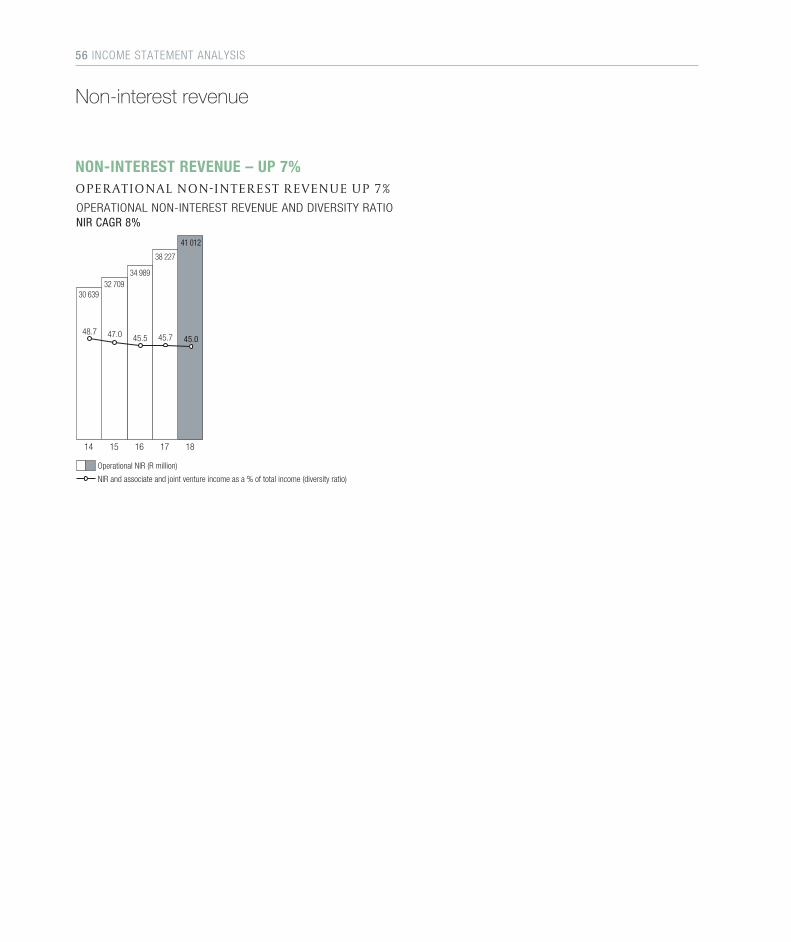
Non-interest revenue
NON-INTEREST REVENUE – UP 7%O P E R AT I O N A L N O N- I N T E R E S T R E V E N U E U P 7%
47.0 45.5 45.7
30 63932 709
34 989
38 227
41 012
48.745.0
15 16 17 18 14
Operational NIR (R million)
NIR and associate and joint venture income as a % of total income (diversity ratio)
OPERATIONAL NON-INTEREST REVENUE AND DIVERSITY RATIONIR CAGR 8%
56 INCOME STATEMENT ANALYSIS
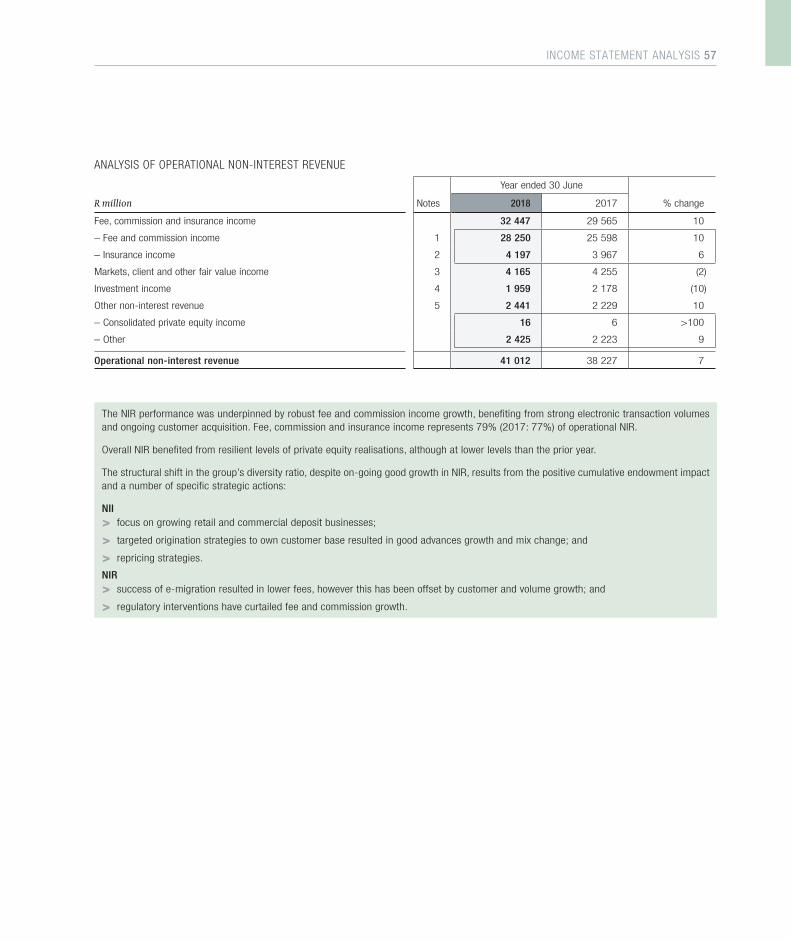
ANALYSIS OF OPERATIONAL NON-INTEREST REVENUE
Year ended 30 June
R million Notes 2018 2017 % change
Fee, commission and insurance income 32 447 29 565 10
– Fee and commission income 1 28 250 25 598 10
– Insurance income 2 4 197 3 967 6
Markets, client and other fair value income 3 4 165 4 255 (2)
Investment income 4 1 959 2 178 (10)
Other non-interest revenue 5 2 441 2 229 10
– Consolidated private equity income 16 6 >100
– Other 2 425 2 223 9
Operational non-interest revenue 41 012 38 227 7
The NIR performance was underpinned by robust fee and commission income growth, benefiting from strong electronic transaction volumes and ongoing customer acquisition. Fee, commission and insurance income represents 79% (2017: 77%) of operational NIR.
Overall NIR benefited from resilient levels of private equity realisations, although at lower levels than the prior year.
The structural shift in the group’s diversity ratio, despite on-going good growth in NIR, results from the positive cumulative endowment impact and a number of specific strategic actions:
NII
> focus on growing retail and commercial deposit businesses;
> targeted origination strategies to own customer base resulted in good advances growth and mix change; and
> repricing strategies.
NIR
> success of e-migration resulted in lower fees, however this has been offset by customer and volume growth; and
> regulatory interventions have curtailed fee and commission growth.
INCOME STATEMENT ANALYSIS 57
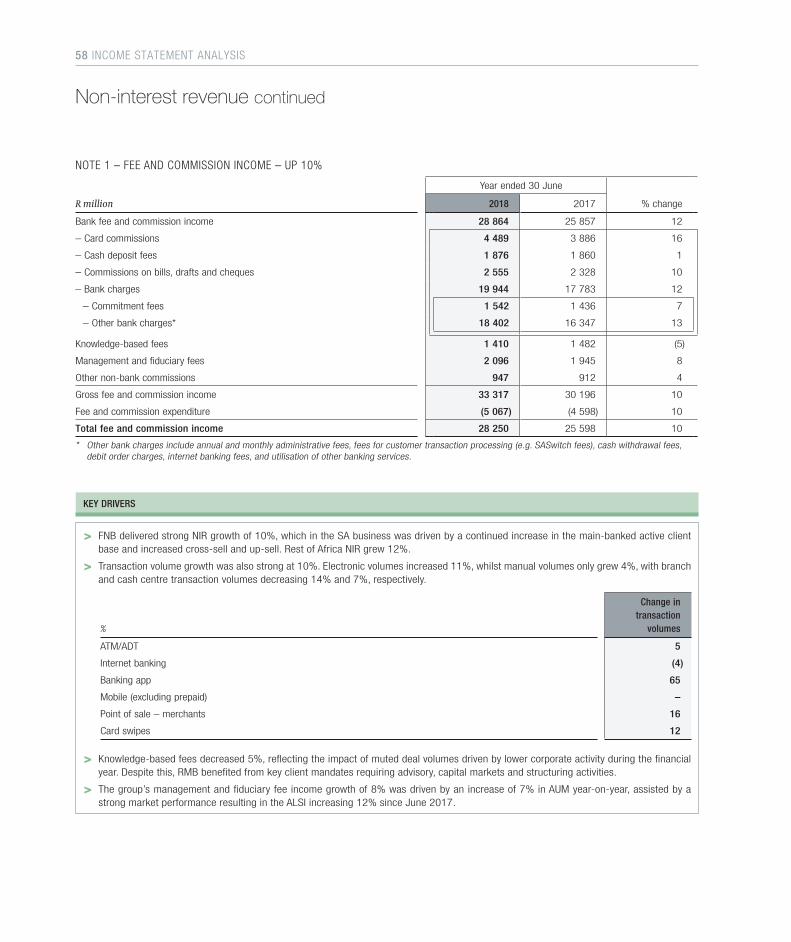
NOTE 1 – FEE AND COMMISSION INCOME – UP 10%
Year ended 30 June
R million 2018 2017 % change
Bank fee and commission income 28 864 25 857 12
– Card commissions 4 489 3 886 16
– Cash deposit fees 1 876 1 860 1
– Commissions on bills, drafts and cheques 2 555 2 328 10
– Bank charges 19 944 17 783 12
– Commitment fees 1 542 1 436 7
– Other bank charges* 18 402 16 347 13
Knowledge-based fees 1 410 1 482 (5)
Management and fiduciary fees 2 096 1 945 8
Other non-bank commissions 947 912 4
Gross fee and commission income 33 317 30 196 10
Fee and commission expenditure (5 067) (4 598) 10
Total fee and commission income 28 250 25 598 10
* Other bank charges include annual and monthly administrative fees, fees for customer transaction processing (e.g. SASwitch fees), cash withdrawal fees, debit order charges, internet banking fees, and utilisation of other banking services.
KEY DRIVERS
> FNB delivered strong NIR growth of 10%, which in the SA business was driven by a continued increase in the main-banked active client base and increased cross-sell and up-sell. Rest of Africa NIR grew 12%.
> Transaction volume growth was also strong at 10%. Electronic volumes increased 11%, whilst manual volumes only grew 4%, with branch and cash centre transaction volumes decreasing 14% and 7%, respectively.
%
Change in transaction
volumes
ATM/ADT 5
Internet banking (4)
Banking app 65
Mobile (excluding prepaid) –
Point of sale – merchants 16
Card swipes 12
> Knowledge-based fees decreased 5%, reflecting the impact of muted deal volumes driven by lower corporate activity during the financial year. Despite this, RMB benefited from key client mandates requiring advisory, capital markets and structuring activities.
> The group’s management and fiduciary fee income growth of 8% was driven by an increase of 7% in AUM year-on-year, assisted by a strong market performance resulting in the ALSI increasing 12% since June 2017.
Non-interest revenue continued
58 INCOME STATEMENT ANALYSIS
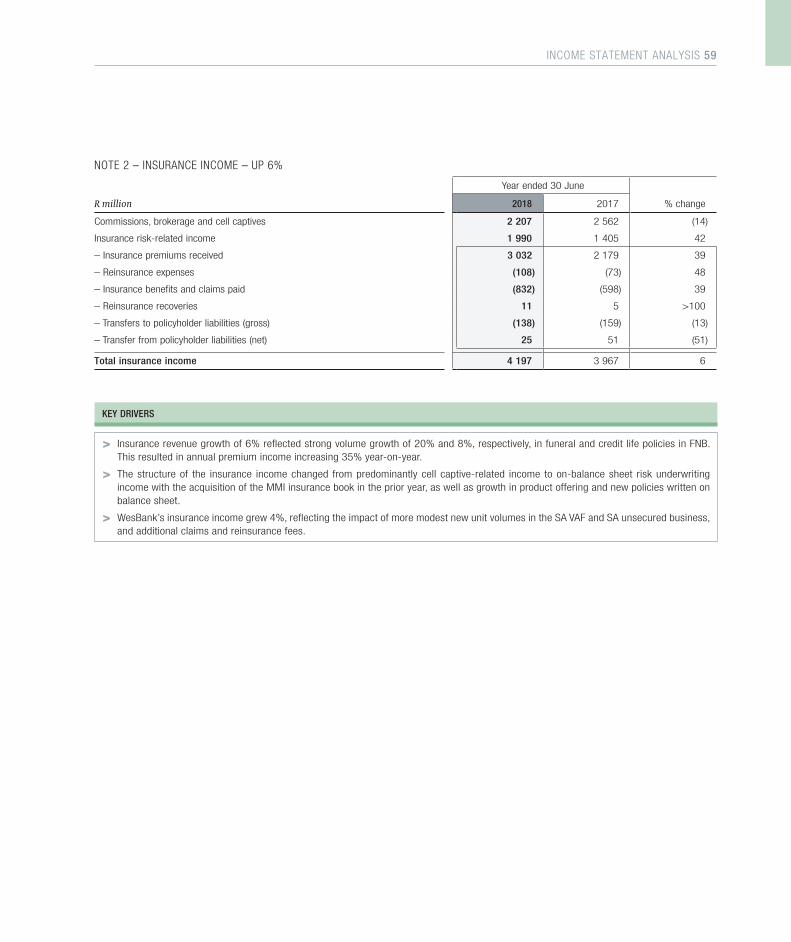
NOTE 2 – INSURANCE INCOME – UP 6%
Year ended 30 June
R million 2018 2017 % change
Commissions, brokerage and cell captives 2 207 2 562 (14)
Insurance risk-related income 1 990 1 405 42
– Insurance premiums received 3 032 2 179 39
– Reinsurance expenses (108) (73) 48
– Insurance benefits and claims paid (832) (598) 39
– Reinsurance recoveries 11 5 >100
– Transfers to policyholder liabilities (gross) (138) (159) (13)
– Transfer from policyholder liabilities (net) 25 51 (51)
Total insurance income 4 197 3 967 6
KEY DRIVERS
> Insurance revenue growth of 6% reflected strong volume growth of 20% and 8%, respectively, in funeral and credit life policies in FNB. This resulted in annual premium income increasing 35% year-on-year.
> The structure of the insurance income changed from predominantly cell captive-related income to on-balance sheet risk underwriting income with the acquisition of the MMI insurance book in the prior year, as well as growth in product offering and new policies written on balance sheet.
> WesBank’s insurance income grew 4%, reflecting the impact of more modest new unit volumes in the SA VAF and SA unsecured business, and additional claims and reinsurance fees.
INCOME STATEMENT ANALYSIS 59
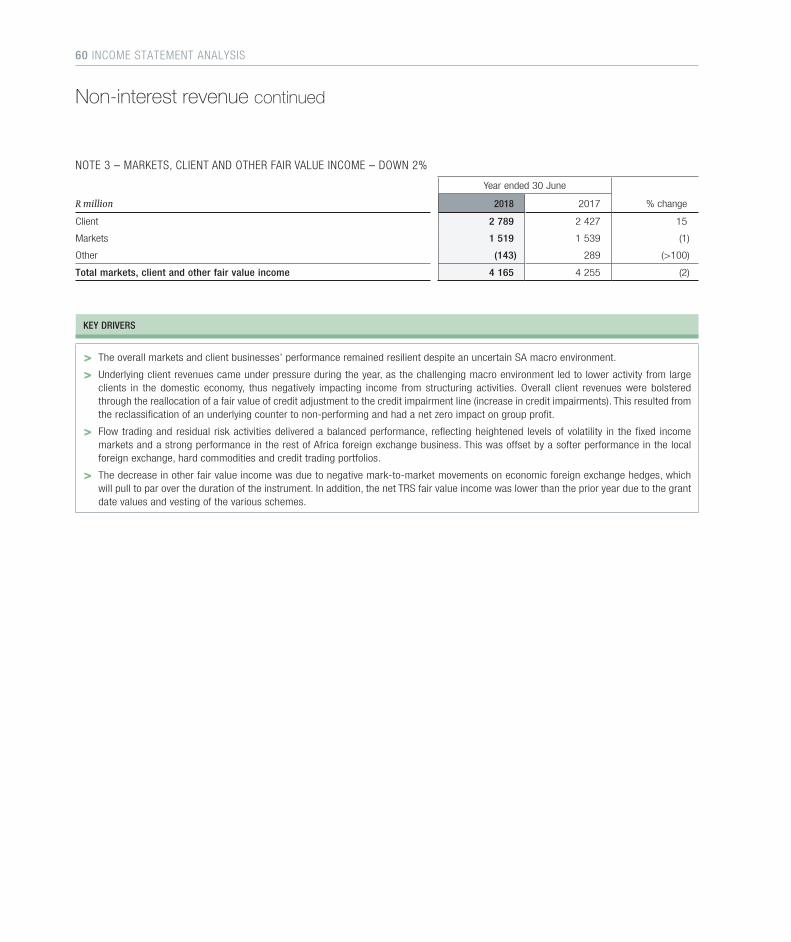
NOTE 3 – MARKETS, CLIENT AND OTHER FAIR VALUE INCOME – DOWN 2%
Year ended 30 June
R million 2018 2017 % change
Client 2 789 2 427 15
Markets 1 519 1 539 (1)
Other (143) 289 (>100)
Total markets, client and other fair value income 4 165 4 255 (2)
KEY DRIVERS
> The overall markets and client businesses’ performance remained resilient despite an uncertain SA macro environment.
> Underlying client revenues came under pressure during the year, as the challenging macro environment led to lower activity from large clients in the domestic economy, thus negatively impacting income from structuring activities. Overall client revenues were bolstered through the reallocation of a fair value of credit adjustment to the credit impairment line (increase in credit impairments). This resulted from the reclassification of an underlying counter to non-performing and had a net zero impact on group profit.
> Flow trading and residual risk activities delivered a balanced performance, reflecting heightened levels of volatility in the fixed income markets and a strong performance in the rest of Africa foreign exchange business. This was offset by a softer performance in the local foreign exchange, hard commodities and credit trading portfolios.
> The decrease in other fair value income was due to negative mark-to-market movements on economic foreign exchange hedges, which will pull to par over the duration of the instrument. In addition, the net TRS fair value income was lower than the prior year due to the grant date values and vesting of the various schemes.
Non-interest revenue continued
60 INCOME STATEMENT ANALYSIS
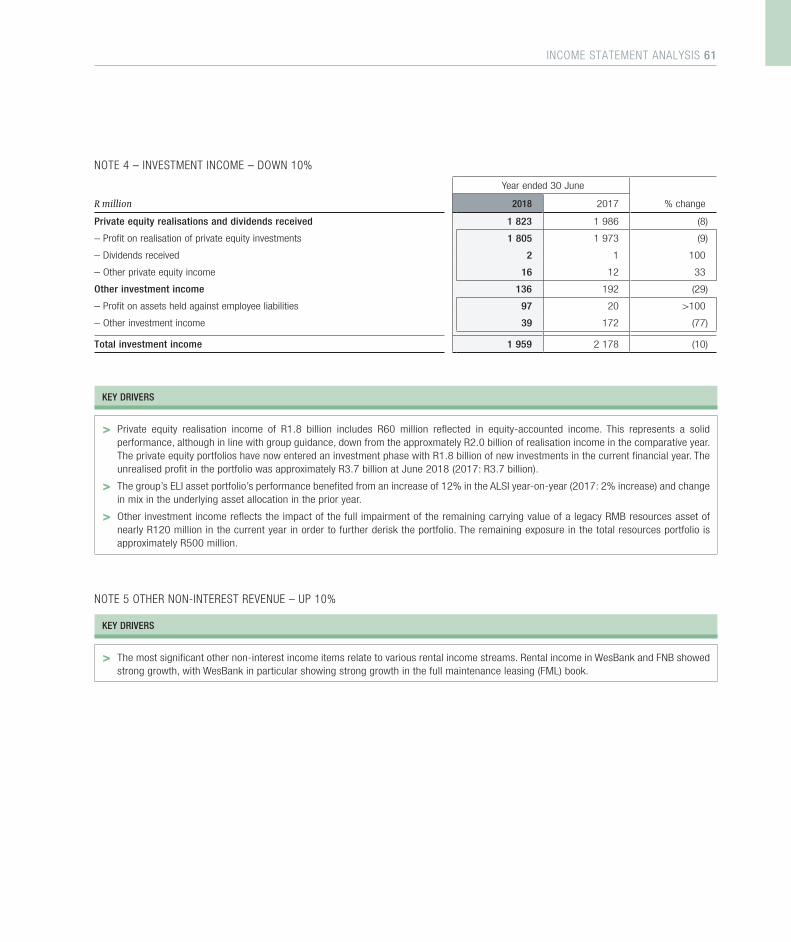
NOTE 4 – INVESTMENT INCOME – DOWN 10%
Year ended 30 June
R million 2018 2017 % change
Private equity realisations and dividends received 1 823 1 986 (8)
– Profit on realisation of private equity investments 1 805 1 973 (9)
– Dividends received 2 1 100
– Other private equity income 16 12 33
Other investment income 136 192 (29)
– Profit on assets held against employee liabilities 97 20 >100
– Other investment income 39 172 (77)
Total investment income 1 959 2 178 (10)
KEY DRIVERS
> Private equity realisation income of R1.8 billion includes R60 million reflected in equity-accounted income. This represents a solid performance, although in line with group guidance, down from the approxmately R2.0 billion of realisation income in the comparative year. The private equity portfolios have now entered an investment phase with R1.8 billion of new investments in the current financial year. The unrealised profit in the portfolio was approximately R3.7 billion at June 2018 (2017: R3.7 billion).
> The group’s ELI asset portfolio’s performance benefited from an increase of 12% in the ALSI year-on-year (2017: 2% increase) and change in mix in the underlying asset allocation in the prior year.
> Other investment income reflects the impact of the full impairment of the remaining carrying value of a legacy RMB resources asset of nearly R120 million in the current year in order to further derisk the portfolio. The remaining exposure in the total resources portfolio is approximately R500 million.
NOTE 5 OTHER NON-INTEREST REVENUE – UP 10%
KEY DRIVERS
> The most significant other non-interest income items relate to various rental income streams. Rental income in WesBank and FNB showed strong growth, with WesBank in particular showing strong growth in the full maintenance leasing (FML) book.
INCOME STATEMENT ANALYSIS 61
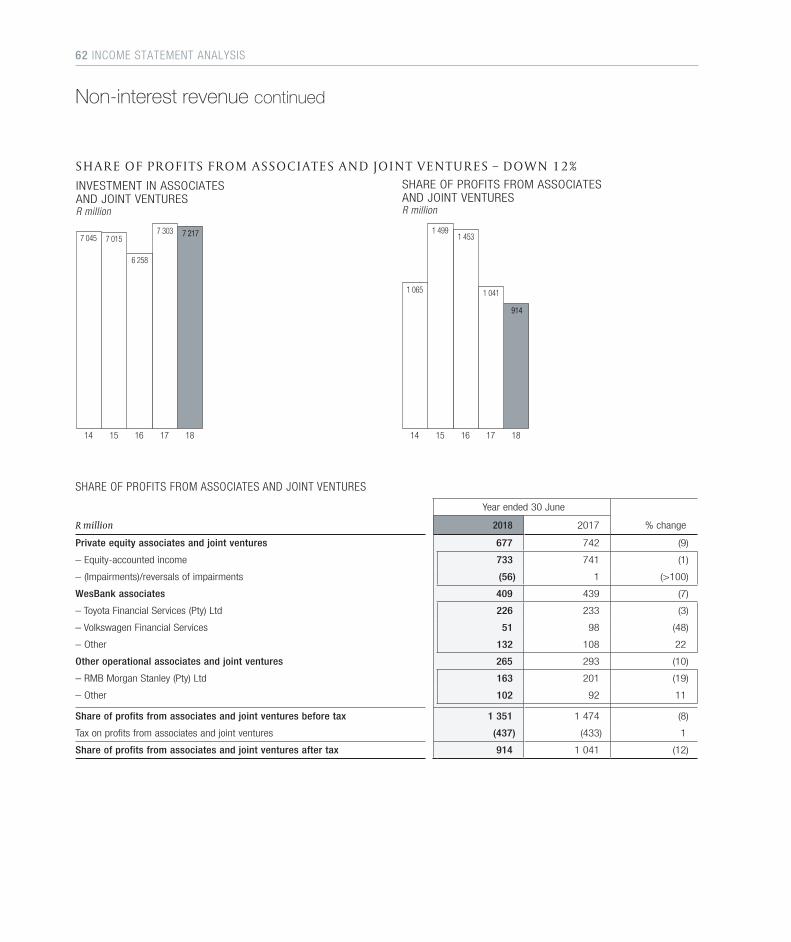
Non-interest revenue continued
S H A R E O F P RO F I T S F RO M A S S O C I AT E S A N D J O I N T V E N T U R E S – D OW N 12%
1 065
1 4991 453
1 041
914
15 16 17 18 14
SHARE OF PROFITS FROM ASSOCIATESAND JOINT VENTURESR million
7 045 7 015
6 258
7 303 7 217
15 16 17 18 14
INVESTMENT IN ASSOCIATESAND JOINT VENTURESR million
SHARE OF PROFITS FROM ASSOCIATES AND JOINT VENTURES
Year ended 30 June
R million 2018 2017 % change
Private equity associates and joint ventures 677 742 (9)
– Equity-accounted income 733 741 (1)
– (Impairments)/reversals of impairments (56) 1 (>100)
WesBank associates 409 439 (7)
– Toyota Financial Services (Pty) Ltd 226 233 (3)
– Volkswagen Financial Services 51 98 (48)
– Other 132 108 22
Other operational associates and joint ventures 265 293 (10)
– RMB Morgan Stanley (Pty) Ltd 163 201 (19)
– Other 102 92 11
Share of profits from associates and joint ventures before tax 1 351 1 474 (8)
Tax on profits from associates and joint ventures (437) (433) 1
Share of profits from associates and joint ventures after tax 914 1 041 (12)
62 INCOME STATEMENT ANALYSIS
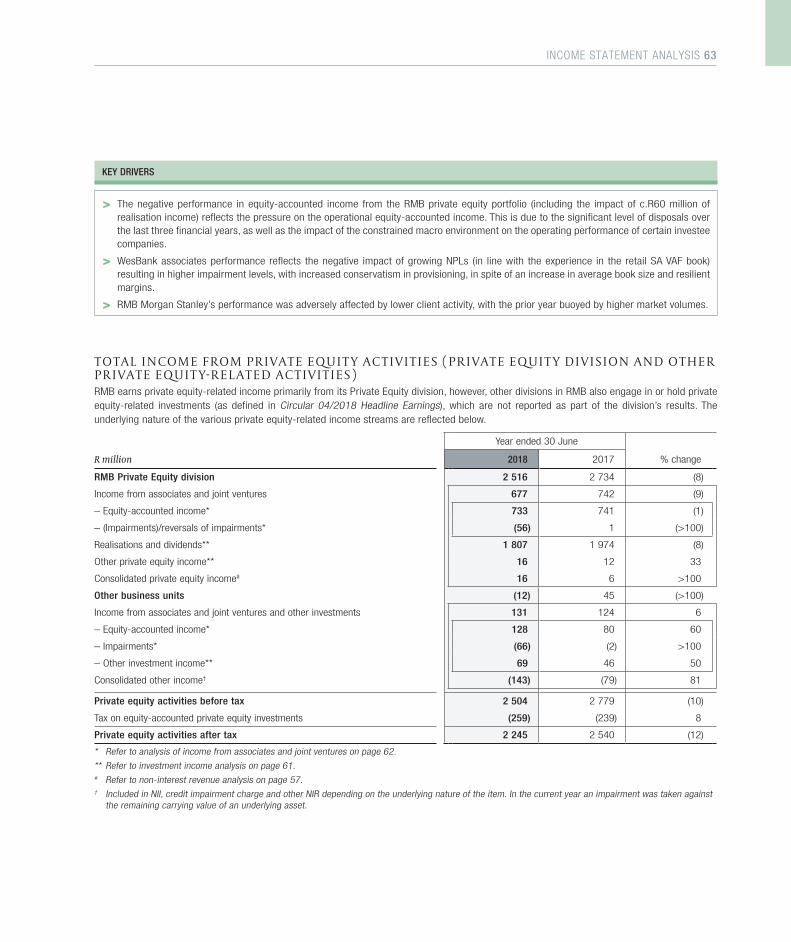
KEY DRIVERS
> The negative performance in equity-accounted income from the RMB private equity portfolio (including the impact of c.R60 million of realisation income) reflects the pressure on the operational equity-accounted income. This is due to the significant level of disposals over the last three financial years, as well as the impact of the constrained macro environment on the operating performance of certain investee companies.
> WesBank associates performance reflects the negative impact of growing NPLs (in line with the experience in the retail SA VAF book) resulting in higher impairment levels, with increased conservatism in provisioning, in spite of an increase in average book size and resilient margins.
> RMB Morgan Stanley’s performance was adversely affected by lower client activity, with the prior year buoyed by higher market volumes.
T O TA L I N CO M E F RO M P R I VAT E E Q U I T Y A C T I V I T I E S ( P R I VAT E E Q U I T Y D I V I S I O N A N D O T H E R P R I VAT E E Q U I T Y- R E L AT E D A C T I V I T I E S)RMB earns private equity-related income primarily from its Private Equity division, however, other divisions in RMB also engage in or hold private equity-related investments (as defined in Circular 04/2018 Headline Earnings), which are not reported as part of the division’s results. The underlying nature of the various private equity-related income streams are reflected below.
Year ended 30 June
R million 2018 2017 % change
RMB Private Equity division 2 516 2 734 (8)
Income from associates and joint ventures 677 742 (9)
– Equity-accounted income* 733 741 (1)
– (Impairments)/reversals of impairments* (56) 1 (>100)
Realisations and dividends** 1 807 1 974 (8)
Other private equity income** 16 12 33
Consolidated private equity income# 16 6 >100
Other business units (12) 45 (>100)
Income from associates and joint ventures and other investments 131 124 6
– Equity-accounted income* 128 80 60
– Impairments* (66) (2) >100
– Other investment income** 69 46 50
Consolidated other income† (143) (79) 81
Private equity activities before tax 2 504 2 779 (10)
Tax on equity-accounted private equity investments (259) (239) 8
Private equity activities after tax 2 245 2 540 (12)
* Refer to analysis of income from associates and joint ventures on page 62.
** Refer to investment income analysis on page 61.# Refer to non-interest revenue analysis on page 57.† Included in NII, credit impairment charge and other NIR depending on the underlying nature of the item. In the current year an impairment was taken against
the remaining carrying value of an underlying asset.
INCOME STATEMENT ANALYSIS 63
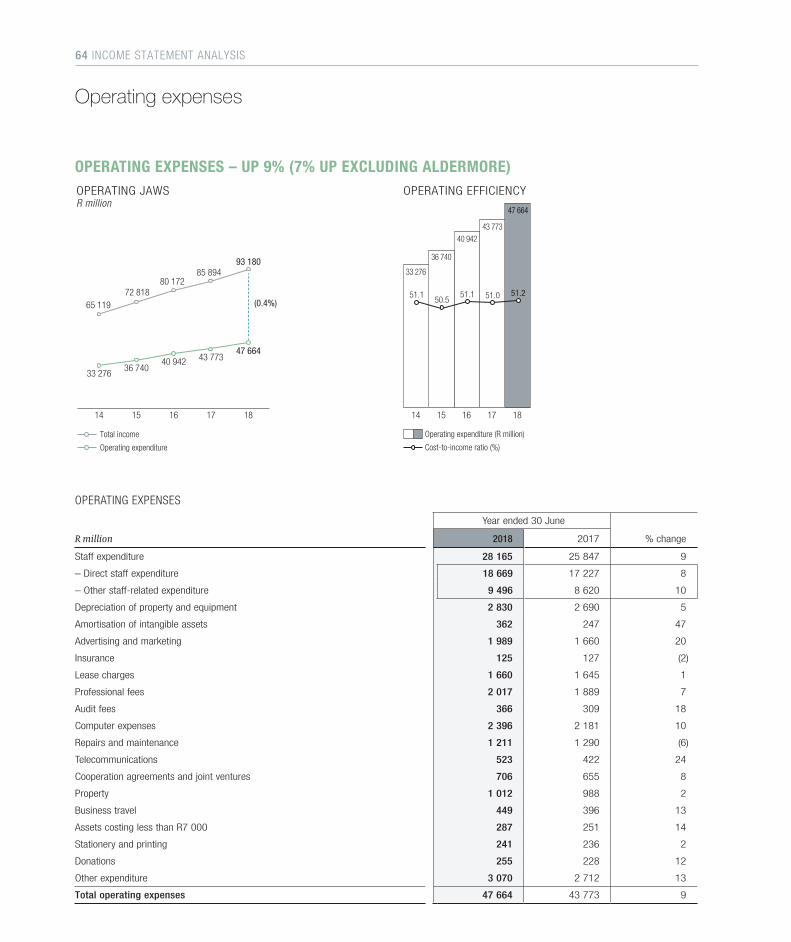
OPERATING EXPENSES – UP 9% (7% UP EXCLUDING ALDERMORE)
33 27636 740
40 942 43 77347 664
65 11972 818
80 17285 894
93 180
15 16 17 1814
Total income
Operating expenditure
(0.4%)
OPERATING JAWSR million
50.551.1 51.0
33 276
36 740
40 94243 773
47 664
51.1 51.2
15 16 17 18 14
Operating expenditure (R million)
Cost-to-income ratio (%)
OPERATING EFFICIENCY
OPERATING EXPENSES
Year ended 30 June
R million 2018 2017 % change
Staff expenditure 28 165 25 847 9
– Direct staff expenditure 18 669 17 227 8
– Other staff-related expenditure 9 496 8 620 10
Depreciation of property and equipment 2 830 2 690 5
Amortisation of intangible assets 362 247 47
Advertising and marketing 1 989 1 660 20
Insurance 125 127 (2)
Lease charges 1 660 1 645 1
Professional fees 2 017 1 889 7
Audit fees 366 309 18
Computer expenses 2 396 2 181 10
Repairs and maintenance 1 211 1 290 (6)
Telecommunications 523 422 24
Cooperation agreements and joint ventures 706 655 8
Property 1 012 988 2
Business travel 449 396 13
Assets costing less than R7 000 287 251 14
Stationery and printing 241 236 2
Donations 255 228 12
Other expenditure 3 070 2 712 13
Total operating expenses 47 664 43 773 9
Operating expenses
64 INCOME STATEMENT ANALYSIS
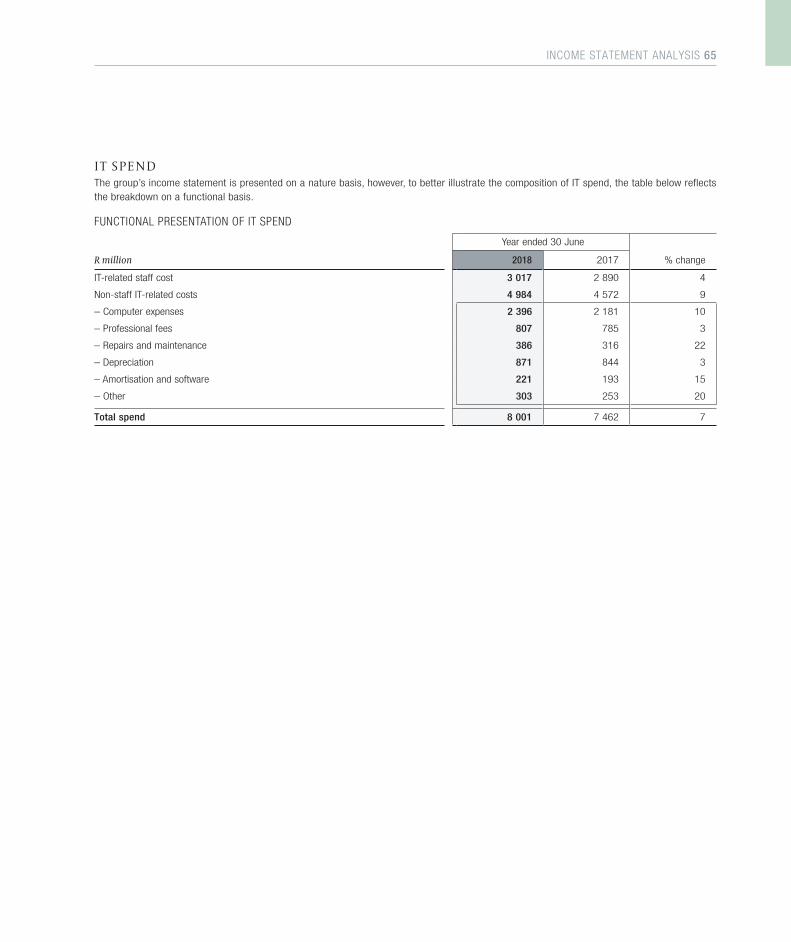
I T S P E N D The group’s income statement is presented on a nature basis, however, to better illustrate the composition of IT spend, the table below reflects the breakdown on a functional basis.
FUNCTIONAL PRESENTATION OF IT SPEND
Year ended 30 June
R million 2018 2017 % change
IT-related staff cost 3 017 2 890 4
Non-staff IT-related costs 4 984 4 572 9
– Computer expenses 2 396 2 181 10
– Professional fees 807 785 3
– Repairs and maintenance 386 316 22
– Depreciation 871 844 3
– Amortisation and software 221 193 15
– Other 303 253 20
Total spend 8 001 7 462 7
INCOME STATEMENT ANALYSIS 65
Operating expenses continued
KEY DRIVERS
> Cost growth of 9% reflects the impact of continuing investment spend on new initiatives and platforms as well as the impact of including Aldermore from 1 April 2018. Excluding Aldermore, costs increased 7% year-on-year.
> Staff costs, which comprise 59% of the group’s total operating expenses, increased 9%.
% CHANGE REASONS
Direct staff costs 8 Impacted by unionised increases at an average of 7.8% in August 2017 and a 3% increase in staff complement across the group (Aldermore represents 2% of the 3% increase).
Other staff-related expenditure
10 The increase in variable costs reflects the strong growth in earnings and NIACC (in particular from FNB and RMB) in the current year. Normalised share-based payment expenses increased, given the higher increase in the group’s share price, relative to the prior year’s share price growth, resulting in higher grant values.
> The 5% increase in depreciation was driven by strong growth in WesBank’s FML book, continuing investment in infrastructure (e.g. ATMs/ADTs), ongoing investment in electronic platforms and commissioning of new premises over the previous three financial years.
> The 47% increase in amortisation of intangible assets is due to software capitalisation across the franchises and amortisation of the intangible assets identified on the acquisition of Aldermore.
> Advertising and marketing cost growth of 20% (15% excluding Aldermore) reflect market segment-focused advertising, specifically focusing on new products.
> The 7% growth in professional fees reflects the impact of including Aldermore. The 1% growth, excluding Aldermore, reflects the maturing of projects resulting in an increase of costs being capitalised.
> Lease charges increased 1% year-on-year, down from the 8% in 2017. The slowdown in the growth of lease charges reflects the acquisition of office buildings previously leased, which further contributed to the increase in depreciation and property expenses.
> Computer expenses growth slowed to 10% from 19% in the prior year, despite continued spend on projects related to various electronic platforms and infrastructure upgrades, both domestically and in the rest of Africa. The slowdown in cost growth reflects the maturing of certain projects resulting in an increase in the component of costs being capitalised as these projects enter the implementation and go-live phase.
> Repairs and maintenance decreased 6% due to base adjustments in the FML book in the prior year, which have now stabilised.
> The 24% increase in telecommunications was driven by increased bandwidth and related costs emanating from the use of different channels for advertising, marketing and communications.
> Cooperation agreements and joint venture costs increased 8%, driven by a strong performance in the Discovery card book and improved performance in the underlying alliances within the WesBank portfolio.
> Other expenses includes various items, such as entertainment, bank charges, movements in provisions, subscriptions and memberships. The biggest increase related to legal fees resulting from Aldermore transaction.
66 INCOME STATEMENT ANALYSIS

balance sheet analysis andfinancial resourcemanagement68 – 111
03
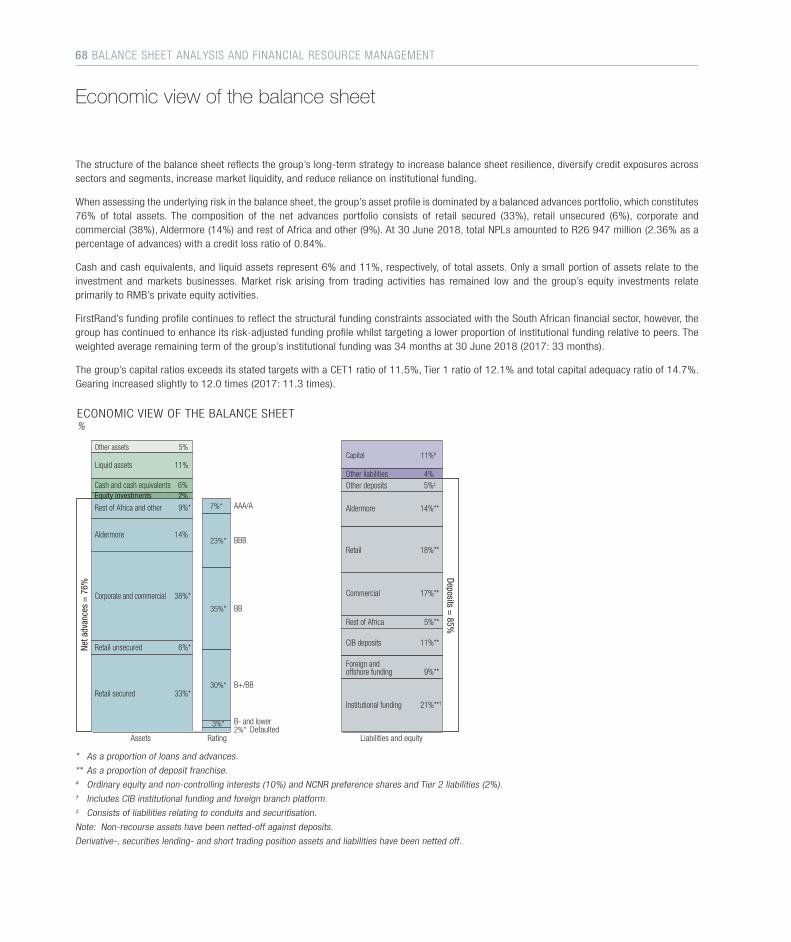
The structure of the balance sheet reflects the group’s long-term strategy to increase balance sheet resilience, diversify credit exposures across sectors and segments, increase market liquidity, and reduce reliance on institutional funding.
When assessing the underlying risk in the balance sheet, the group’s asset profile is dominated by a balanced advances portfolio, which constitutes 76% of total assets. The composition of the net advances portfolio consists of retail secured (33%), retail unsecured (6%), corporate and commercial (38%), Aldermore (14%) and rest of Africa and other (9%). At 30 June 2018, total NPLs amounted to R26 947 million (2.36% as a percentage of advances) with a credit loss ratio of 0.84%.
Cash and cash equivalents, and liquid assets represent 6% and 11%, respectively, of total assets. Only a small portion of assets relate to the investment and markets businesses. Market risk arising from trading activities has remained low and the group’s equity investments relate primarily to RMB’s private equity activities.
FirstRand’s funding profile continues to reflect the structural funding constraints associated with the South African financial sector, however, the group has continued to enhance its risk-adjusted funding profile whilst targeting a lower proportion of institutional funding relative to peers. The weighted average remaining term of the group’s institutional funding was 34 months at 30 June 2018 (2017: 33 months).
The group’s capital ratios exceeds its stated targets with a CET1 ratio of 11.5%, Tier 1 ratio of 12.1% and total capital adequacy ratio of 14.7%. Gearing increased slightly to 12.0 times (2017: 11.3 times).
Retail secured 33%*
Retail unsecured 6%*
Corporate and commercial 38%*
Rest of Africa and other 9%*
Equity investments 2%Cash and cash equivalents 6%
Liquid assets 11%
Other assets 5%
Foreign andoffshore funding 9%**
Retail 18%**
Other deposits 5%‡
Other liabilities 4%
Capital 11%#
Commercial 17%**
Assets
AAA/A7%*
3%*
23%* BBB
BB35%*
B- and lowerDefaulted
Deposits = 85%
Rating
Net a
dvan
ces
= 7
6%
Liabilities and equity
B+/BB30%*
CIB deposits 11%**
Aldermore 14%
Institutional funding 21%**†
Rest of Africa 5%**
Aldermore 14%**
2%*
ECONOMIC VIEW OF THE BALANCE SHEET%
* As a proportion of loans and advances.
** As a proportion of deposit franchise.# Ordinary equity and non-controlling interests (10%) and NCNR preference shares and Tier 2 liabilities (2%).† Includes CIB institutional funding and foreign branch platform. ‡ Consists of liabilities relating to conduits and securitisation.
Note: Non-recourse assets have been netted-off against deposits.
Derivative-, securities lending- and short trading position assets and liabilities have been netted off.
Economic view of the balance sheet
68 BALANCE SHEET ANALYSIS AND FINANCIAL RESOURCE MANAGEMENT
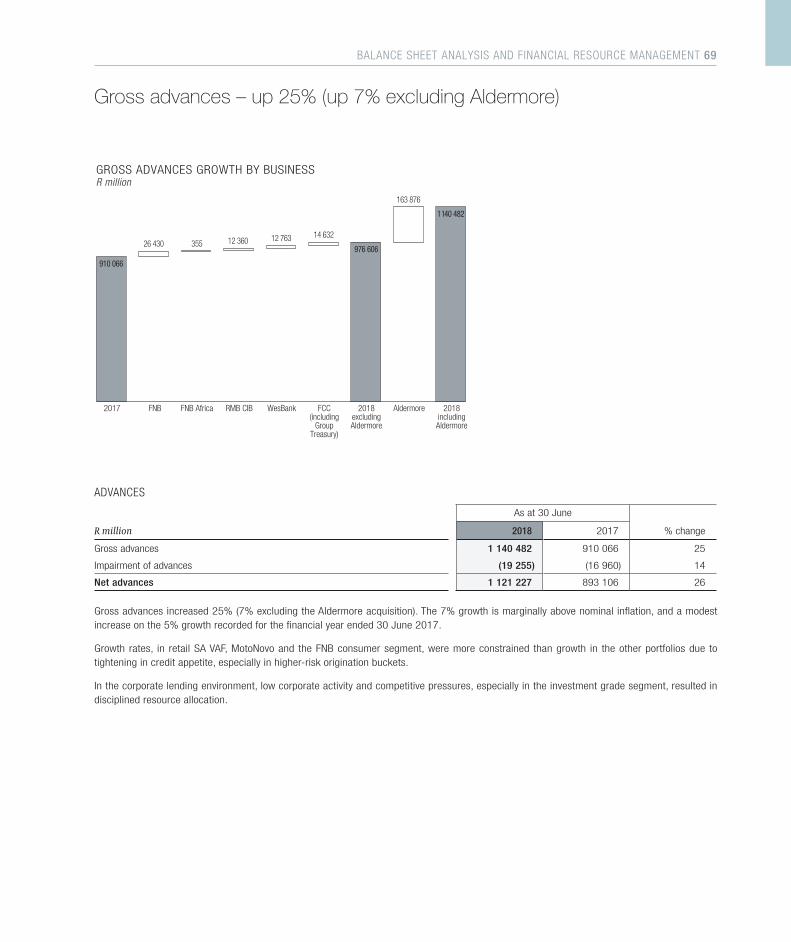
26 430 12 360
2017 FNB FNB Africa WesBank 2018excludingAldermore
Aldermore
GROSS ADVANCES GROWTH BY BUSINESSR million
355
RMB CIB
12 763 14 632
976 606
FCC(including
GroupTreasury)
910 066
163 876
2018includingAldermore
1 140 482
ADVANCES
As at 30 June
R million 2018 2017 % change
Gross advances 1 140 482 910 066 25
Impairment of advances (19 255) (16 960) 14
Net advances 1 121 227 893 106 26
Gross advances increased 25% (7% excluding the Aldermore acquisition). The 7% growth is marginally above nominal inflation, and a modest increase on the 5% growth recorded for the financial year ended 30 June 2017.
Growth rates, in retail SA VAF, MotoNovo and the FNB consumer segment, were more constrained than growth in the other portfolios due to tightening in credit appetite, especially in higher-risk origination buckets.
In the corporate lending environment, low corporate activity and competitive pressures, especially in the investment grade segment, resulted in disciplined resource allocation.
Gross advances – up 25% (up 7% excluding Aldermore)
BALANCE SHEET ANALYSIS AND FINANCIAL RESOURCE MANAGEMENT 69
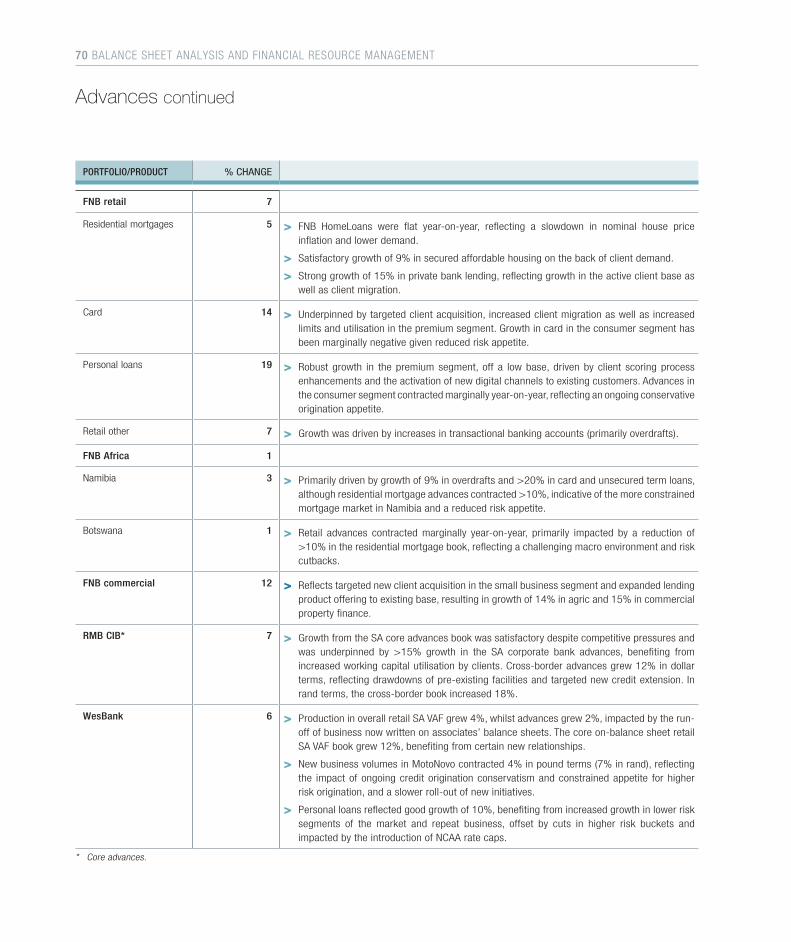
PORTFOLIO/PRODUCT % CHANGE
FNB retail 7
Residential mortgages 5 > FNB HomeLoans were flat year-on-year, reflecting a slowdown in nominal house price inflation and lower demand.
> Satisfactory growth of 9% in secured affordable housing on the back of client demand.
> Strong growth of 15% in private bank lending, reflecting growth in the active client base as well as client migration.
Card 14 > Underpinned by targeted client acquisition, increased client migration as well as increased limits and utilisation in the premium segment. Growth in card in the consumer segment has been marginally negative given reduced risk appetite.
Personal loans 19 > Robust growth in the premium segment, off a low base, driven by client scoring process enhancements and the activation of new digital channels to existing customers. Advances in the consumer segment contracted marginally year-on-year, reflecting an ongoing conservative origination appetite.
Retail other 7 > Growth was driven by increases in transactional banking accounts (primarily overdrafts).
FNB Africa 1
Namibia 3 > Primarily driven by growth of 9% in overdrafts and >20% in card and unsecured term loans, although residential mortgage advances contracted >10%, indicative of the more constrained mortgage market in Namibia and a reduced risk appetite.
Botswana 1 > Retail advances contracted marginally year-on-year, primarily impacted by a reduction of >10% in the residential mortgage book, reflecting a challenging macro environment and risk cutbacks.
FNB commercial 12 > Reflects targeted new client acquisition in the small business segment and expanded lending product offering to existing base, resulting in growth of 14% in agric and 15% in commercial property finance.
RMB CIB* 7 > Growth from the SA core advances book was satisfactory despite competitive pressures and was underpinned by >15% growth in the SA corporate bank advances, benefiting from increased working capital utilisation by clients. Cross-border advances grew 12% in dollar terms, reflecting drawdowns of pre-existing facilities and targeted new credit extension. In rand terms, the cross-border book increased 18%.
WesBank 6 > Production in overall retail SA VAF grew 4%, whilst advances grew 2%, impacted by the run-off of business now written on associates’ balance sheets. The core on-balance sheet retail SA VAF book grew 12%, benefiting from certain new relationships.
> New business volumes in MotoNovo contracted 4% in pound terms (7% in rand), reflecting the impact of ongoing credit origination conservatism and constrained appetite for higher risk origination, and a slower roll-out of new initiatives.
> Personal loans reflected good growth of 10%, benefiting from increased growth in lower risk segments of the market and repeat business, offset by cuts in higher risk buckets and impacted by the introduction of NCAA rate caps.
* Core advances.
Advances continued
70 BALANCE SHEET ANALYSIS AND FINANCIAL RESOURCE MANAGEMENT
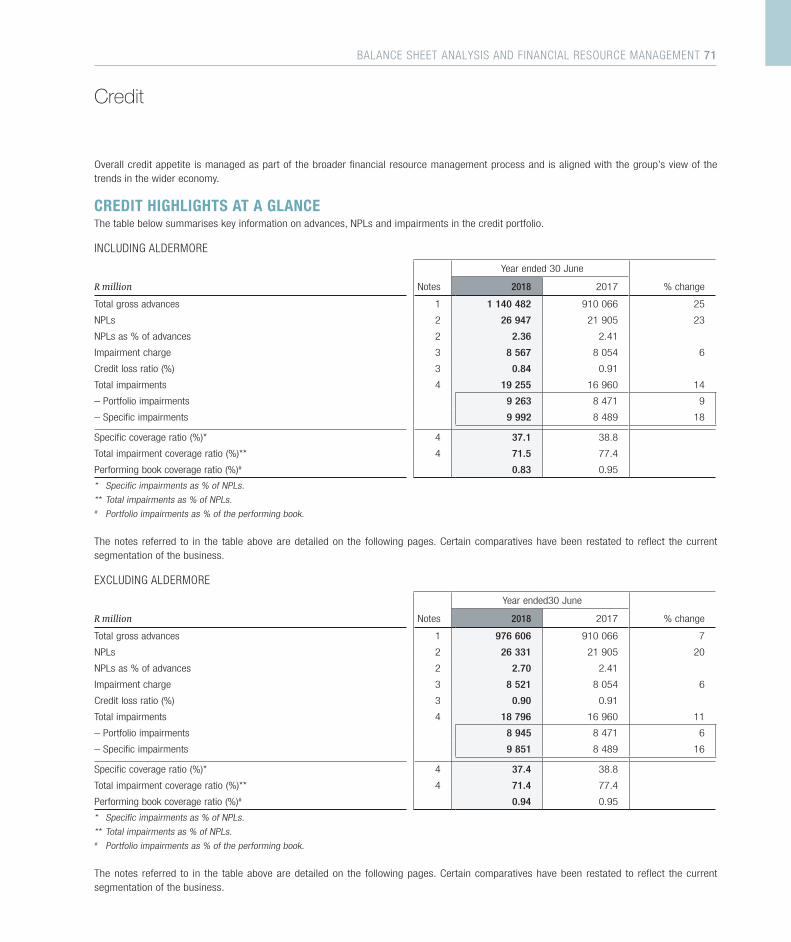
Overall credit appetite is managed as part of the broader financial resource management process and is aligned with the group’s view of the trends in the wider economy.
CREDIT HIGHLIGHTS AT A GLANCEThe table below summarises key information on advances, NPLs and impairments in the credit portfolio.
INCLUDING ALDERMORE
Year ended 30 June
R million Notes 2018 2017 % change
Total gross advances 1 1 140 482 910 066 25
NPLs 2 26 947 21 905 23
NPLs as % of advances 2 2.36 2.41
Impairment charge 3 8 567 8 054 6
Credit loss ratio (%) 3 0.84 0.91
Total impairments 4 19 255 16 960 14
– Portfolio impairments 9 263 8 471 9
– Specific impairments 9 992 8 489 18
Specific coverage ratio (%)* 4 37.1 38.8
Total impairment coverage ratio (%)** 4 71.5 77.4
Performing book coverage ratio (%)# 0.83 0.95
* Specific impairments as % of NPLs.
** Total impairments as % of NPLs.# Portfolio impairments as % of the performing book.
The notes referred to in the table above are detailed on the following pages. Certain comparatives have been restated to reflect the current segmentation of the business.
EXCLUDING ALDERMORE
Year ended30 June
R million Notes 2018 2017 % change
Total gross advances 1 976 606 910 066 7
NPLs 2 26 331 21 905 20
NPLs as % of advances 2 2.70 2.41
Impairment charge 3 8 521 8 054 6
Credit loss ratio (%) 3 0.90 0.91
Total impairments 4 18 796 16 960 11
– Portfolio impairments 8 945 8 471 6
– Specific impairments 9 851 8 489 16
Specific coverage ratio (%)* 4 37.4 38.8
Total impairment coverage ratio (%)** 4 71.4 77.4
Performing book coverage ratio (%)# 0.94 0.95
* Specific impairments as % of NPLs.
** Total impairments as % of NPLs.# Portfolio impairments as % of the performing book.
The notes referred to in the table above are detailed on the following pages. Certain comparatives have been restated to reflect the current segmentation of the business.
Credit
BALANCE SHEET ANALYSIS AND FINANCIAL RESOURCE MANAGEMENT 71
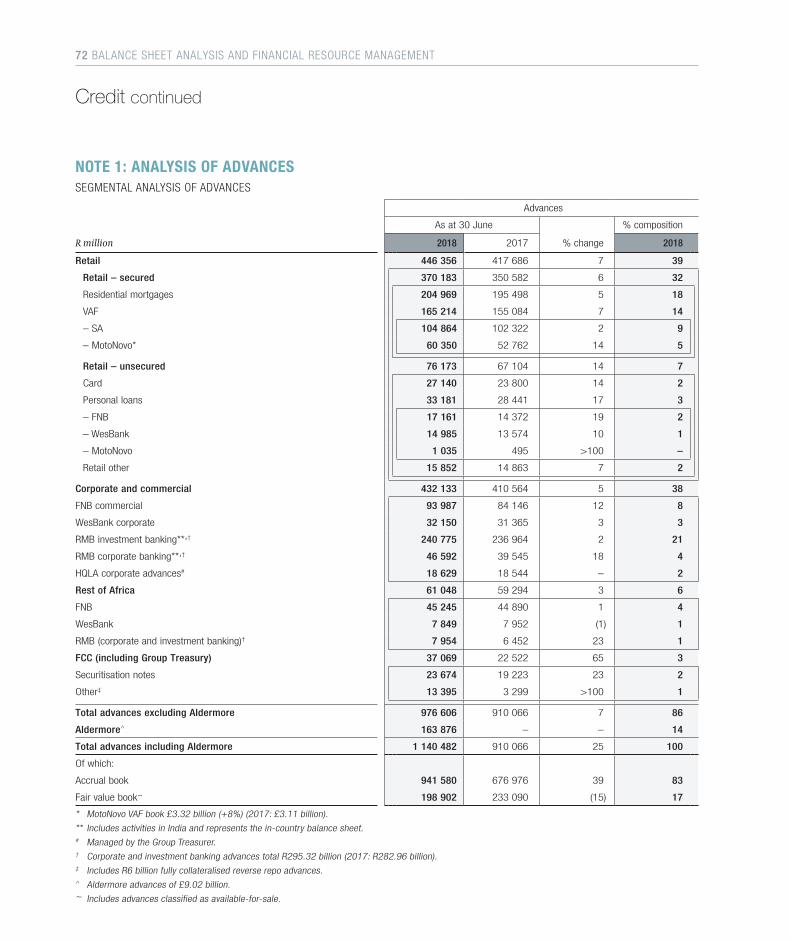
NOTE 1: ANALYSIS OF ADVANCESSEGMENTAL ANALYSIS OF ADVANCES
Advances
As at 30 June % composition
R million 2018 2017 % change 2018
Retail 446 356 417 686 7 39
Retail – secured 370 183 350 582 6 32
Residential mortgages 204 969 195 498 5 18
VAF 165 214 155 084 7 14
– SA 104 864 102 322 2 9
– MotoNovo* 60 350 52 762 14 5
Retail – unsecured 76 173 67 104 14 7
Card 27 140 23 800 14 2
Personal loans 33 181 28 441 17 3
– FNB 17 161 14 372 19 2
– WesBank 14 985 13 574 10 1
– MotoNovo 1 035 495 >100 –
Retail other 15 852 14 863 7 2
Corporate and commercial 432 133 410 564 5 38
FNB commercial 93 987 84 146 12 8
WesBank corporate 32 150 31 365 3 3
RMB investment banking**,† 240 775 236 964 2 21
RMB corporate banking**,† 46 592 39 545 18 4
HQLA corporate advances# 18 629 18 544 – 2
Rest of Africa 61 048 59 294 3 6
FNB 45 245 44 890 1 4
WesBank 7 849 7 952 (1) 1
RMB (corporate and investment banking)† 7 954 6 452 23 1
FCC (including Group Treasury) 37 069 22 522 65 3
Securitisation notes 23 674 19 223 23 2
Other‡ 13 395 3 299 >100 1
Total advances excluding Aldermore 976 606 910 066 7 86
Aldermore^ 163 876 – – 14
Total advances including Aldermore 1 140 482 910 066 25 100
Of which:
Accrual book 941 580 676 976 39 83
Fair value book~ 198 902 233 090 (15) 17
* MotoNovo VAF book £3.32 billion (+8%) (2017: £3.11 billion).
** Includes activities in India and represents the in-country balance sheet.# Managed by the Group Treasurer.† Corporate and investment banking advances total R295.32 billion (2017: R282.96 billion).‡ Includes R6 billion fully collateralised reverse repo advances.^ Aldermore advances of £9.02 billion. ~ Includes advances classified as available-for-sale.
Credit continued
72 BALANCE SHEET ANALYSIS AND FINANCIAL RESOURCE MANAGEMENT
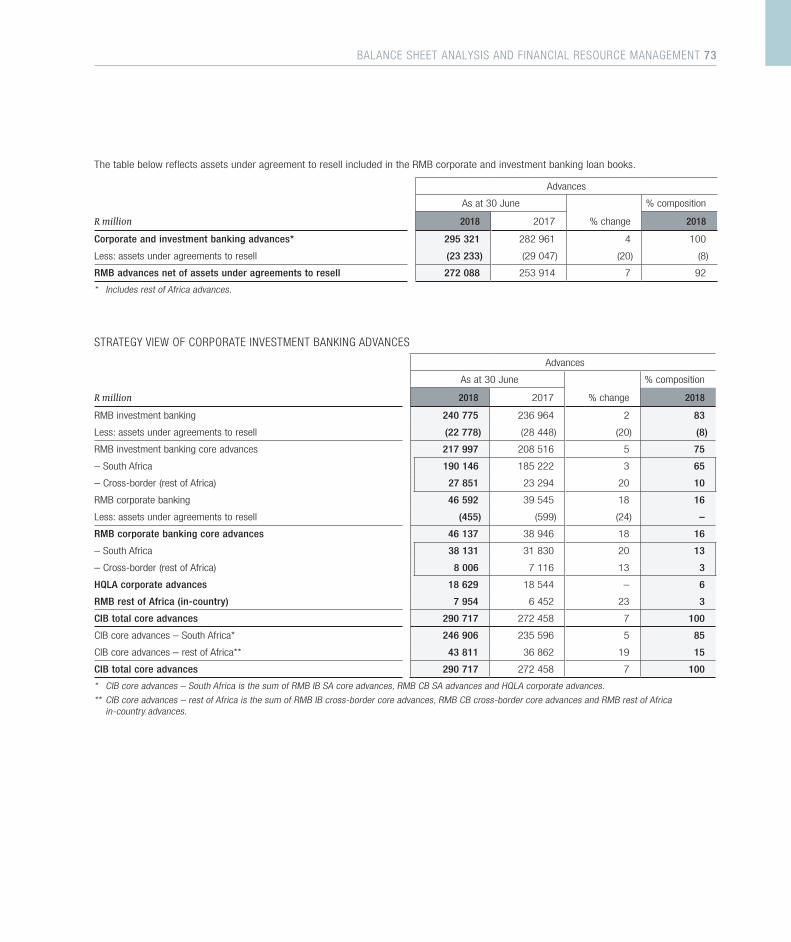
The table below reflects assets under agreement to resell included in the RMB corporate and investment banking loan books.
Advances
As at 30 June % composition
R million 2018 2017 % change 2018
Corporate and investment banking advances* 295 321 282 961 4 100
Less: assets under agreements to resell (23 233) (29 047) (20) (8)
RMB advances net of assets under agreements to resell 272 088 253 914 7 92
* Includes rest of Africa advances.
STRATEGY VIEW OF CORPORATE INVESTMENT BANKING ADVANCES
Advances
As at 30 June % composition
R million 2018 2017 % change 2018
RMB investment banking 240 775 236 964 2 83
Less: assets under agreements to resell (22 778) (28 448) (20) (8)
RMB investment banking core advances 217 997 208 516 5 75
– South Africa 190 146 185 222 3 65
– Cross-border (rest of Africa) 27 851 23 294 20 10
RMB corporate banking 46 592 39 545 18 16
Less: assets under agreements to resell (455) (599) (24) –
RMB corporate banking core advances 46 137 38 946 18 16
– South Africa 38 131 31 830 20 13
– Cross-border (rest of Africa) 8 006 7 116 13 3
HQLA corporate advances 18 629 18 544 – 6
RMB rest of Africa (in-country) 7 954 6 452 23 3
CIB total core advances 290 717 272 458 7 100
CIB core advances – South Africa* 246 906 235 596 5 85
CIB core advances – rest of Africa** 43 811 36 862 19 15
CIB total core advances 290 717 272 458 7 100
* CIB core advances – South Africa is the sum of RMB IB SA core advances, RMB CB SA advances and HQLA corporate advances.
** CIB core advances – rest of Africa is the sum of RMB IB cross-border core advances, RMB CB cross-border core advances and RMB rest of Africa in-country advances.
BALANCE SHEET ANALYSIS AND FINANCIAL RESOURCE MANAGEMENT 73
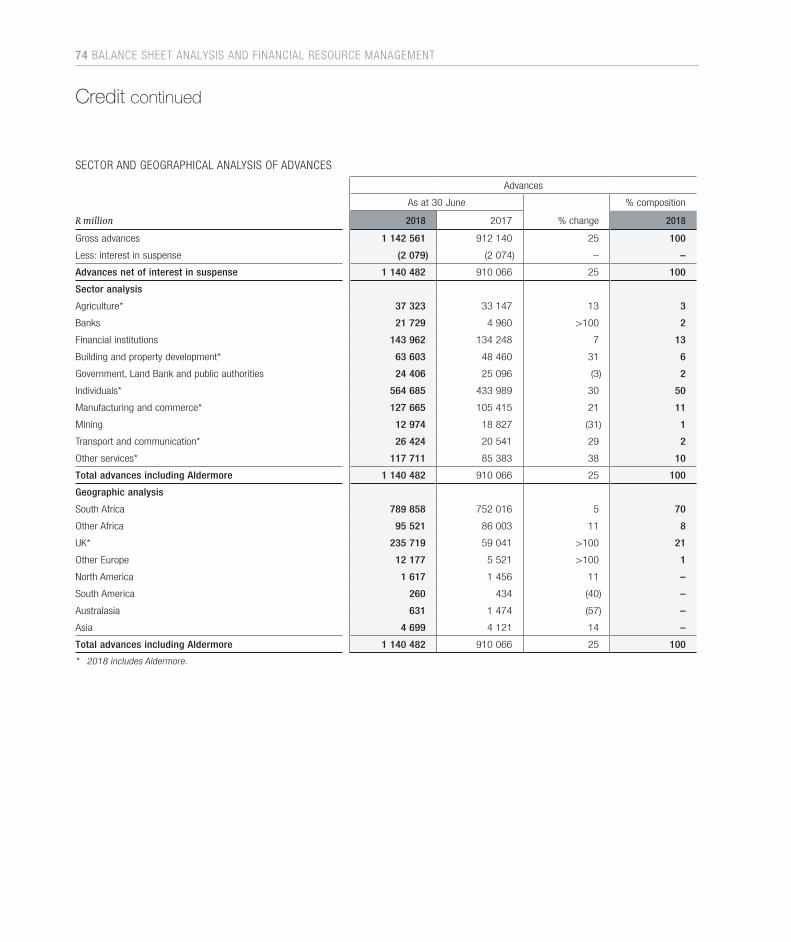
SECTOR AND GEOGRAPHICAL ANALYSIS OF ADVANCES
Advances
As at 30 June % composition
R million 2018 2017 % change 2018
Gross advances 1 142 561 912 140 25 100
Less: interest in suspense (2 079) (2 074) – –
Advances net of interest in suspense 1 140 482 910 066 25 100
Sector analysis
Agriculture* 37 323 33 147 13 3
Banks 21 729 4 960 >100 2
Financial institutions 143 962 134 248 7 13
Building and property development* 63 603 48 460 31 6
Government, Land Bank and public authorities 24 406 25 096 (3) 2
Individuals* 564 685 433 989 30 50
Manufacturing and commerce* 127 665 105 415 21 11
Mining 12 974 18 827 (31) 1
Transport and communication* 26 424 20 541 29 2
Other services* 117 711 85 383 38 10
Total advances including Aldermore 1 140 482 910 066 25 100
Geographic analysis
South Africa 789 858 752 016 5 70
Other Africa 95 521 86 003 11 8
UK* 235 719 59 041 >100 21
Other Europe 12 177 5 521 >100 1
North America 1 617 1 456 11 –
South America 260 434 (40) –
Australasia 631 1 474 (57) –
Asia 4 699 4 121 14 –
Total advances including Aldermore 1 140 482 910 066 25 100
* 2018 includes Aldermore.
Credit continued
74 BALANCE SHEET ANALYSIS AND FINANCIAL RESOURCE MANAGEMENT
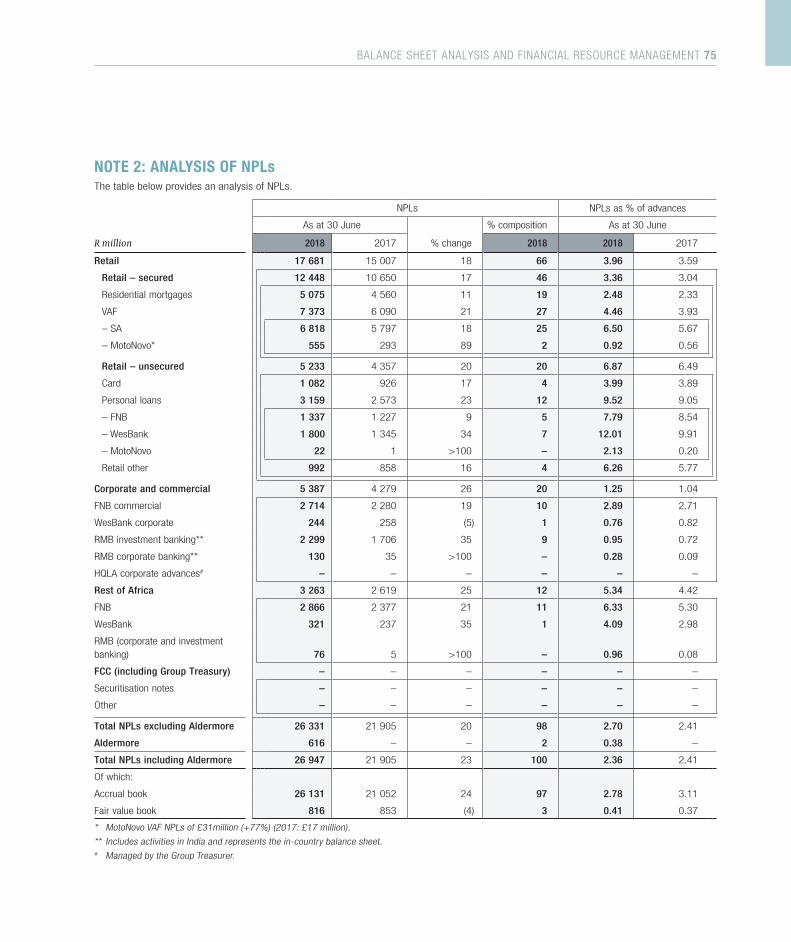
NOTE 2: ANALYSIS OF NPLsThe table below provides an analysis of NPLs.
NPLs NPLs as % of advances
As at 30 June % composition As at 30 June
R million 2018 2017 % change 2018 2018 2017
Retail 17 681 15 007 18 66 3.96 3.59
Retail – secured 12 448 10 650 17 46 3.36 3.04
Residential mortgages 5 075 4 560 11 19 2.48 2.33
VAF 7 373 6 090 21 27 4.46 3.93
– SA 6 818 5 797 18 25 6.50 5.67
– MotoNovo* 555 293 89 2 0.92 0.56
Retail – unsecured 5 233 4 357 20 20 6.87 6.49
Card 1 082 926 17 4 3.99 3.89
Personal loans 3 159 2 573 23 12 9.52 9.05
– FNB 1 337 1 227 9 5 7.79 8.54
– WesBank 1 800 1 345 34 7 12.01 9.91
– MotoNovo 22 1 >100 – 2.13 0.20
Retail other 992 858 16 4 6.26 5.77
Corporate and commercial 5 387 4 279 26 20 1.25 1.04
FNB commercial 2 714 2 280 19 10 2.89 2.71
WesBank corporate 244 258 (5) 1 0.76 0.82
RMB investment banking** 2 299 1 706 35 9 0.95 0.72
RMB corporate banking** 130 35 >100 – 0.28 0.09
HQLA corporate advances# – – – – – –
Rest of Africa 3 263 2 619 25 12 5.34 4.42
FNB 2 866 2 377 21 11 6.33 5.30
WesBank 321 237 35 1 4.09 2.98
RMB (corporate and investment banking) 76 5 >100 – 0.96 0.08
FCC (including Group Treasury) – – – – – –
Securitisation notes – – – – – –
Other – – – – – –
Total NPLs excluding Aldermore 26 331 21 905 20 98 2.70 2.41
Aldermore 616 – – 2 0.38 –
Total NPLs including Aldermore 26 947 21 905 23 100 2.36 2.41
Of which:
Accrual book 26 131 21 052 24 97 2.78 3.11
Fair value book 816 853 (4) 3 0.41 0.37
* MotoNovo VAF NPLs of £31million (+77%) (2017: £17 million).
** Includes activities in India and represents the in-country balance sheet.# Managed by the Group Treasurer.
BALANCE SHEET ANALYSIS AND FINANCIAL RESOURCE MANAGEMENT 75
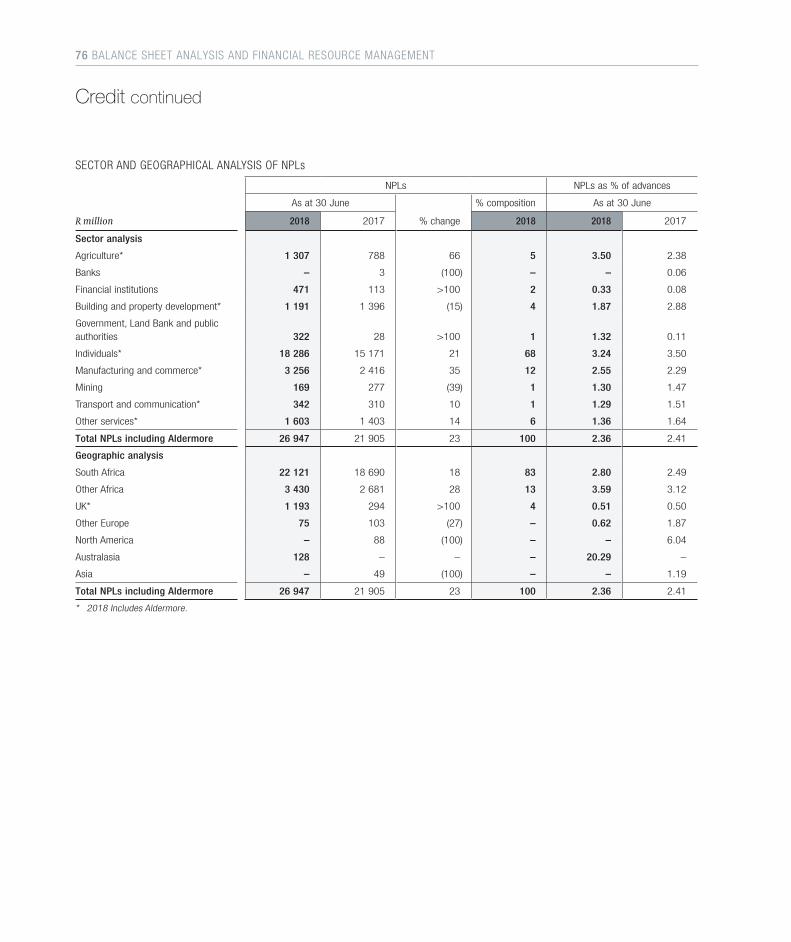
SECTOR AND GEOGRAPHICAL ANALYSIS OF NPLs
NPLs NPLs as % of advances
As at 30 June % composition As at 30 June
R million 2018 2017 % change 2018 2018 2017
Sector analysis
Agriculture* 1 307 788 66 5 3.50 2.38
Banks – 3 (100) – – 0.06
Financial institutions 471 113 >100 2 0.33 0.08
Building and property development* 1 191 1 396 (15) 4 1.87 2.88
Government, Land Bank and public authorities 322 28 >100 1 1.32 0.11
Individuals* 18 286 15 171 21 68 3.24 3.50
Manufacturing and commerce* 3 256 2 416 35 12 2.55 2.29
Mining 169 277 (39) 1 1.30 1.47
Transport and communication* 342 310 10 1 1.29 1.51
Other services* 1 603 1 403 14 6 1.36 1.64
Total NPLs including Aldermore 26 947 21 905 23 100 2.36 2.41
Geographic analysis
South Africa 22 121 18 690 18 83 2.80 2.49
Other Africa 3 430 2 681 28 13 3.59 3.12
UK* 1 193 294 >100 4 0.51 0.50
Other Europe 75 103 (27) – 0.62 1.87
North America – 88 (100) – – 6.04
Australasia 128 – – – 20.29 –
Asia – 49 (100) – – 1.19
Total NPLs including Aldermore 26 947 21 905 23 100 2.36 2.41
* 2018 Includes Aldermore.
Credit continued
76 BALANCE SHEET ANALYSIS AND FINANCIAL RESOURCE MANAGEMENT
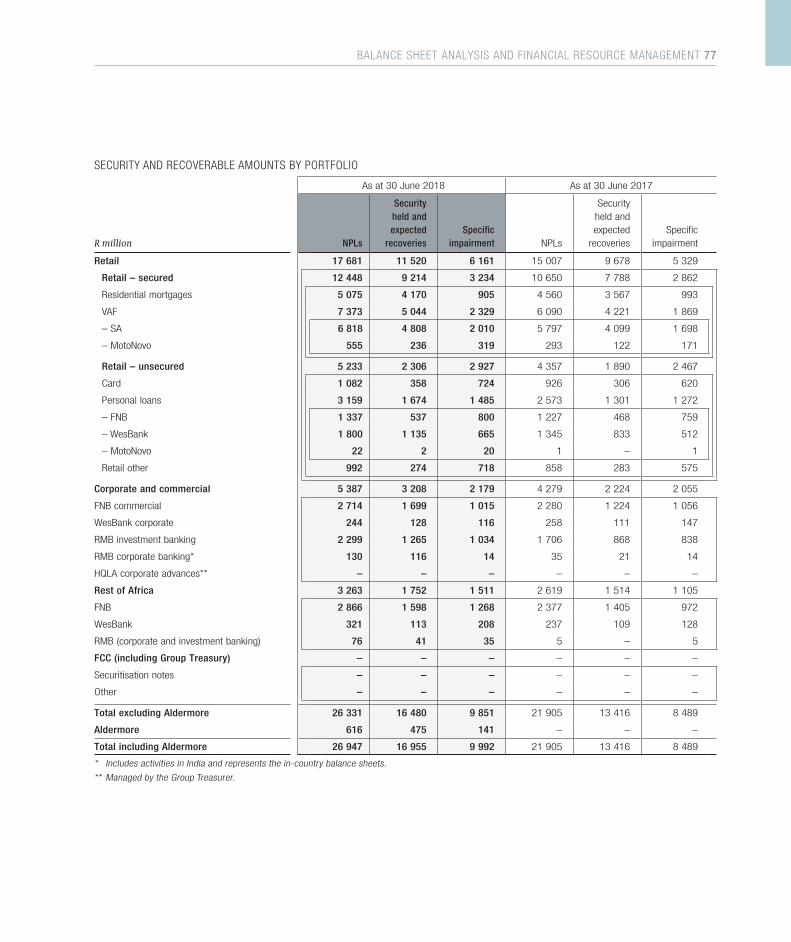
SECURITY AND RECOVERABLE AMOUNTS BY PORTFOLIO
As at 30 June 2018 As at 30 June 2017
R million NPLs
Security held and expected
recoveriesSpecific
impairment NPLs
Security held and expected
recoveriesSpecific
impairment
Retail 17 681 11 520 6 161 15 007 9 678 5 329
Retail – secured 12 448 9 214 3 234 10 650 7 788 2 862
Residential mortgages 5 075 4 170 905 4 560 3 567 993
VAF 7 373 5 044 2 329 6 090 4 221 1 869
– SA 6 818 4 808 2 010 5 797 4 099 1 698
– MotoNovo 555 236 319 293 122 171
Retail – unsecured 5 233 2 306 2 927 4 357 1 890 2 467
Card 1 082 358 724 926 306 620
Personal loans 3 159 1 674 1 485 2 573 1 301 1 272
– FNB 1 337 537 800 1 227 468 759
– WesBank 1 800 1 135 665 1 345 833 512
– MotoNovo 22 2 20 1 – 1
Retail other 992 274 718 858 283 575
Corporate and commercial 5 387 3 208 2 179 4 279 2 224 2 055
FNB commercial 2 714 1 699 1 015 2 280 1 224 1 056
WesBank corporate 244 128 116 258 111 147
RMB investment banking 2 299 1 265 1 034 1 706 868 838
RMB corporate banking* 130 116 14 35 21 14
HQLA corporate advances** – – – – – –
Rest of Africa 3 263 1 752 1 511 2 619 1 514 1 105
FNB 2 866 1 598 1 268 2 377 1 405 972
WesBank 321 113 208 237 109 128
RMB (corporate and investment banking) 76 41 35 5 – 5
FCC (including Group Treasury) – – – – – –
Securitisation notes – – – – – –
Other – – – – – –
Total excluding Aldermore 26 331 16 480 9 851 21 905 13 416 8 489
Aldermore 616 475 141 – – –
Total including Aldermore 26 947 16 955 9 992 21 905 13 416 8 489
* Includes activities in India and represents the in-country balance sheets.
** Managed by the Group Treasurer.
BALANCE SHEET ANALYSIS AND FINANCIAL RESOURCE MANAGEMENT 77
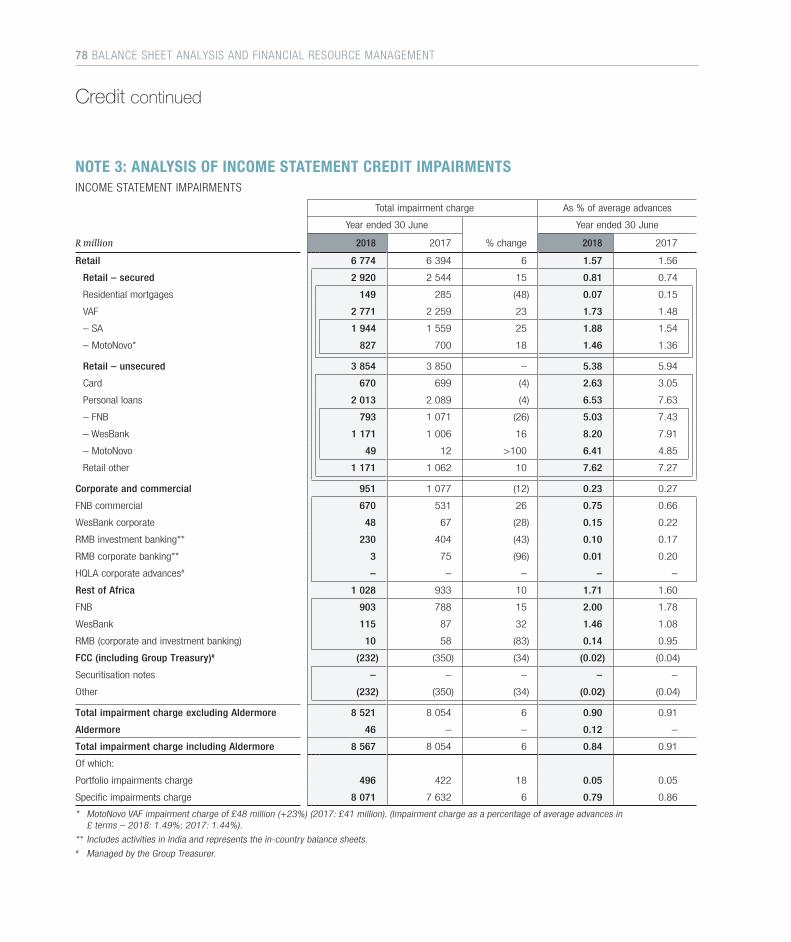
NOTE 3: ANALYSIS OF INCOME STATEMENT CREDIT IMPAIRMENTSINCOME STATEMENT IMPAIRMENTS
Total impairment charge As % of average advances
Year ended 30 June Year ended 30 June
R million 2018 2017 % change 2018 2017
Retail 6 774 6 394 6 1.57 1.56
Retail – secured 2 920 2 544 15 0.81 0.74
Residential mortgages 149 285 (48) 0.07 0.15
VAF 2 771 2 259 23 1.73 1.48
– SA 1 944 1 559 25 1.88 1.54
– MotoNovo* 827 700 18 1.46 1.36
Retail – unsecured 3 854 3 850 – 5.38 5.94
Card 670 699 (4) 2.63 3.05
Personal loans 2 013 2 089 (4) 6.53 7.63
– FNB 793 1 071 (26) 5.03 7.43
– WesBank 1 171 1 006 16 8.20 7.91
– MotoNovo 49 12 >100 6.41 4.85
Retail other 1 171 1 062 10 7.62 7.27
Corporate and commercial 951 1 077 (12) 0.23 0.27
FNB commercial 670 531 26 0.75 0.66
WesBank corporate 48 67 (28) 0.15 0.22
RMB investment banking** 230 404 (43) 0.10 0.17
RMB corporate banking** 3 75 (96) 0.01 0.20
HQLA corporate advances# – – – – –
Rest of Africa 1 028 933 10 1.71 1.60
FNB 903 788 15 2.00 1.78
WesBank 115 87 32 1.46 1.08
RMB (corporate and investment banking) 10 58 (83) 0.14 0.95
FCC (including Group Treasury)# (232) (350) (34) (0.02) (0.04)
Securitisation notes – – – – –
Other (232) (350) (34) (0.02) (0.04)
Total impairment charge excluding Aldermore 8 521 8 054 6 0.90 0.91
Aldermore 46 – – 0.12 –
Total impairment charge including Aldermore 8 567 8 054 6 0.84 0.91
Of which:
Portfolio impairments charge 496 422 18 0.05 0.05
Specific impairments charge 8 071 7 632 6 0.79 0.86
* MotoNovo VAF impairment charge of £48 million (+23%) (2017: £41 million). (Impairment charge as a percentage of average advances in £ terms – 2018: 1.49%; 2017: 1.44%).
** Includes activities in India and represents the in-country balance sheets.# Managed by the Group Treasurer.
Credit continued
78 BALANCE SHEET ANALYSIS AND FINANCIAL RESOURCE MANAGEMENT
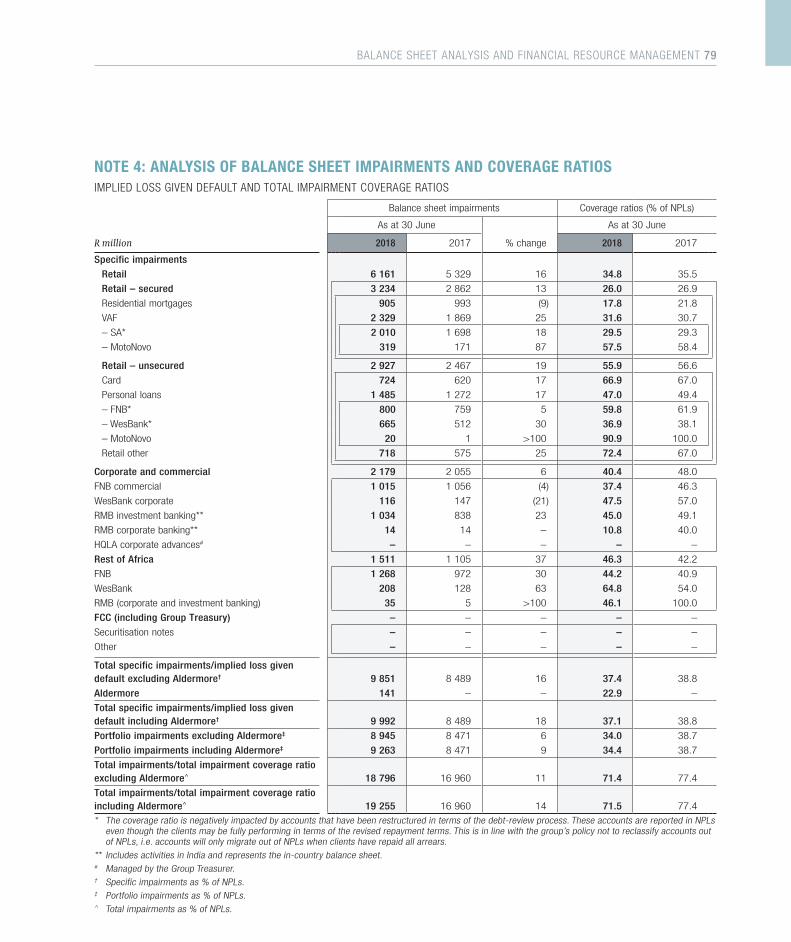
NOTE 4: ANALYSIS OF BALANCE SHEET IMPAIRMENTS AND COVERAGE RATIOSIMPLIED LOSS GIVEN DEFAULT AND TOTAL IMPAIRMENT COVERAGE RATIOS
Balance sheet impairments Coverage ratios (% of NPLs)
As at 30 June As at 30 June
R million 2018 2017 % change 2018 2017
Specific impairments
Retail 6 161 5 329 16 34.8 35.5
Retail – secured 3 234 2 862 13 26.0 26.9
Residential mortgages 905 993 (9) 17.8 21.8
VAF 2 329 1 869 25 31.6 30.7
– SA* 2 010 1 698 18 29.5 29.3
– MotoNovo 319 171 87 57.5 58.4
Retail – unsecured 2 927 2 467 19 55.9 56.6
Card 724 620 17 66.9 67.0
Personal loans 1 485 1 272 17 47.0 49.4
– FNB* 800 759 5 59.8 61.9
– WesBank* 665 512 30 36.9 38.1
– MotoNovo 20 1 >100 90.9 100.0
Retail other 718 575 25 72.4 67.0
Corporate and commercial 2 179 2 055 6 40.4 48.0
FNB commercial 1 015 1 056 (4) 37.4 46.3
WesBank corporate 116 147 (21) 47.5 57.0
RMB investment banking** 1 034 838 23 45.0 49.1
RMB corporate banking** 14 14 – 10.8 40.0
HQLA corporate advances# – – – – –
Rest of Africa 1 511 1 105 37 46.3 42.2
FNB 1 268 972 30 44.2 40.9
WesBank 208 128 63 64.8 54.0
RMB (corporate and investment banking) 35 5 >100 46.1 100.0
FCC (including Group Treasury) – – – – –
Securitisation notes – – – – –
Other – – – – –
Total specific impairments/implied loss given default excluding Aldermore† 9 851 8 489 16 37.4 38.8
Aldermore 141 – – 22.9 –
Total specific impairments/implied loss given default including Aldermore† 9 992 8 489 18 37.1 38.8
Portfolio impairments excluding Aldermore‡ 8 945 8 471 6 34.0 38.7
Portfolio impairments including Aldermore‡ 9 263 8 471 9 34.4 38.7
Total impairments/total impairment coverage ratio excluding Aldermore^ 18 796 16 960 11 71.4 77.4
Total impairments/total impairment coverage ratio including Aldermore^ 19 255 16 960 14 71.5 77.4
* The coverage ratio is negatively impacted by accounts that have been restructured in terms of the debt-review process. These accounts are reported in NPLs even though the clients may be fully performing in terms of the revised repayment terms. This is in line with the group’s policy not to reclassify accounts out of NPLs, i.e. accounts will only migrate out of NPLs when clients have repaid all arrears.
** Includes activities in India and represents the in-country balance sheet.# Managed by the Group Treasurer.† Specific impairments as % of NPLs.‡ Portfolio impairments as % of NPLs.^ Total impairments as % of NPLs.
BALANCE SHEET ANALYSIS AND FINANCIAL RESOURCE MANAGEMENT 79
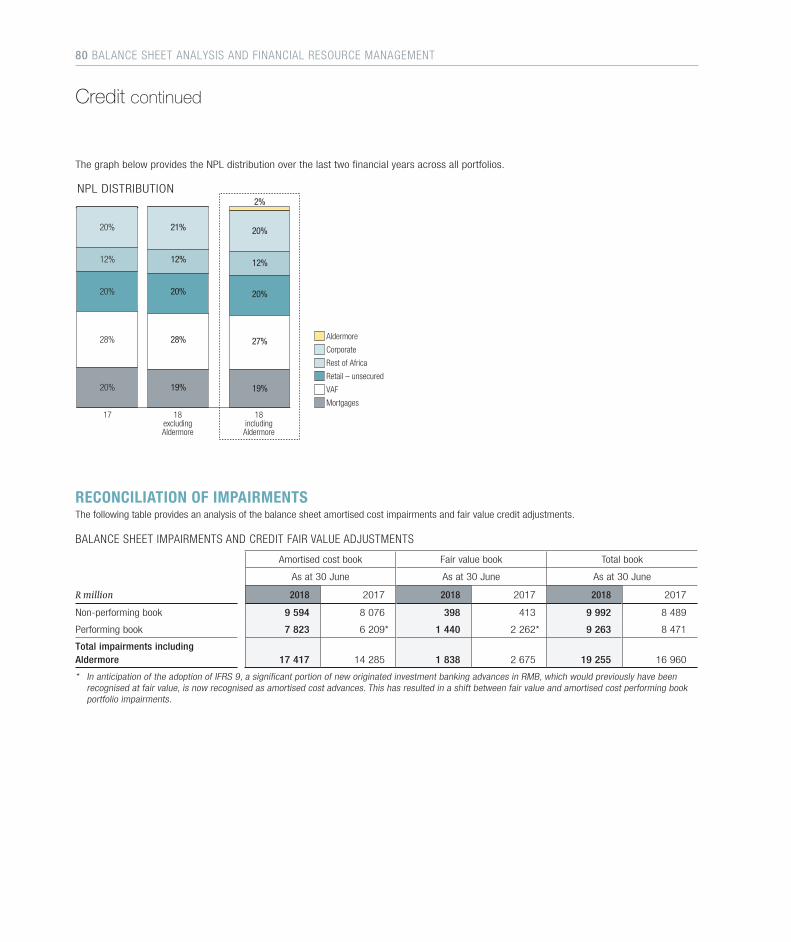
The graph below provides the NPL distribution over the last two financial years across all portfolios.
18includingAldermore
17
20%
12%
28%
20%
20%
Aldermore
Corporate
Rest of Africa
Retail – unsecured
VAF
Mortgages
12%
27%
19%
NPL DISTRIBUTION
20% 20%
2%
21%
12%
28%
19%
20%
18excludingAldermore
RECONCILIATION OF IMPAIRMENTSThe following table provides an analysis of the balance sheet amortised cost impairments and fair value credit adjustments.
BALANCE SHEET IMPAIRMENTS AND CREDIT FAIR VALUE ADJUSTMENTS
Amortised cost book Fair value book Total book
As at 30 June As at 30 June As at 30 June
R million 2018 2017 2018 2017 2018 2017
Non-performing book 9 594 8 076 398 413 9 992 8 489
Performing book 7 823 6 209* 1 440 2 262* 9 263 8 471
Total impairments including Aldermore 17 417 14 285 1 838 2 675 19 255 16 960
* In anticipation of the adoption of IFRS 9, a significant portion of new originated investment banking advances in RMB, which would previously have been recognised at fair value, is now recognised as amortised cost advances. This has resulted in a shift between fair value and amortised cost performing book portfolio impairments.
Credit continued
80 BALANCE SHEET ANALYSIS AND FINANCIAL RESOURCE MANAGEMENT

The following table provides an analysis of the amortised cost specific impairments.
TOTAL BALANCE SHEET IMPAIRMENTS
As at 30 June
R million 2018 2017 % change
Opening balance 16 960 16 577 2
Reclassifications and transfers 39 (40) (>100)
Acquisitions 466 – –
Exchange rate difference 167 (149) (>100)
Unwinding and discounted present value on NPLs (124) (97) 28
Bad debts written off (9 154) (9 504) (4)
Net new impairments created 10 901 10 173 7
Closing balance 19 255 16 960 14
INCOME STATEMENT IMPAIRMENTS
The following table provides an analysis of the income statement impact of amortised cost impairments and credit fair value adjustments.
As at 30 June
R million 2018 2017 % change
Specific impairment charge 10 405 9 751 7
Specific impairment charge – amortised cost 10 194 9 621 6
Credit fair value adjustments – non-performing book 211 130 62
Portfolio impairment charge 496 422 18
Portfolio impairment charge – amortised cost 1 293 408* >100
Credit fair value adjustments – performing book (797) 14* (>100)
Total impairments before recoveries 10 901 10 173 7
Recoveries of bad debts written off (2 334) (2 119) 10
Total impairments including Aldermore 8 567 8 054 6
* In anticipation of the adoption of IFRS 9, a significant portion of new originated investment banking advances in RMB, which would previously have been recognised at fair value, is now recognised as amortised cost advances. This has resulted in a shift between fair value and amortised cost performing book portfolio impairments.
BALANCE SHEET ANALYSIS AND FINANCIAL RESOURCE MANAGEMENT 81
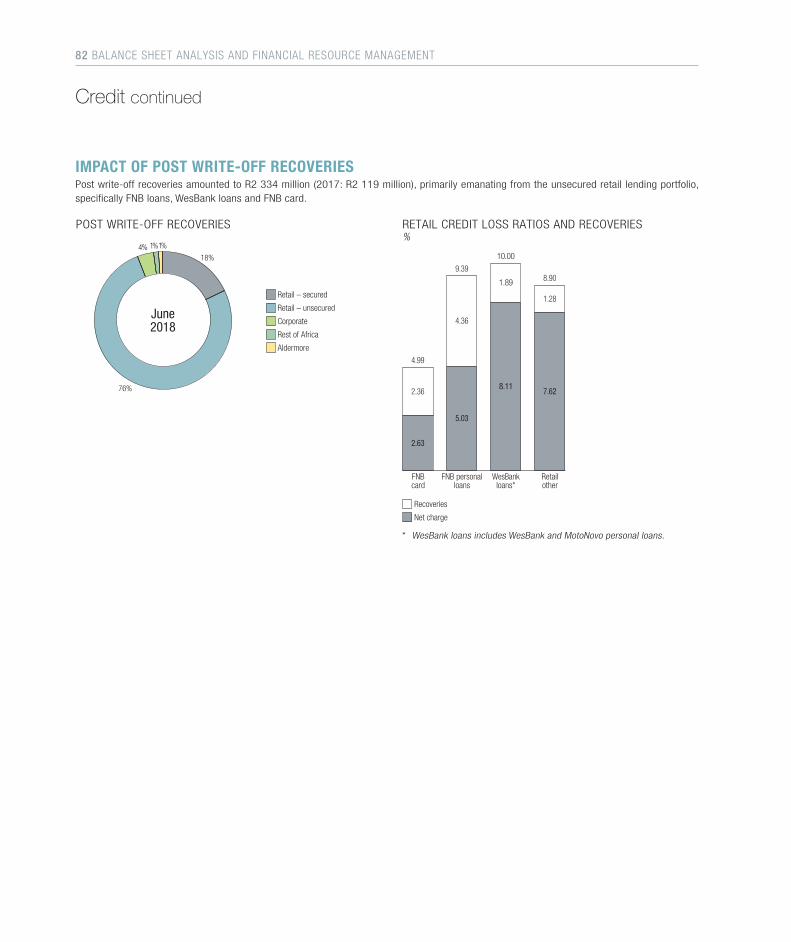
IMPACT OF POST WRITE-OFF RECOVERIESPost write-off recoveries amounted to R2 334 million (2017: R2 119 million), primarily emanating from the unsecured retail lending portfolio, specifically FNB loans, WesBank loans and FNB card.
POST WRITE-OFF RECOVERIES
4%
76%
1%
18%
Retail – secured
Retail – unsecured
Corporate
Rest of Africa
Aldermore
1%
June2018
FNB personalloans
Retailother
2.36
4.99
4.36
9.39
1.89
10.00
FNBcard
WesBankloans*
Recoveries
Net charge
7.62
1.28
8.90
8.11
5.03
2.63
RETAIL CREDIT LOSS RATIOS AND RECOVERIES%
* WesBank loans includes WesBank and MotoNovo personal loans.
Credit continued
82 BALANCE SHEET ANALYSIS AND FINANCIAL RESOURCE MANAGEMENT
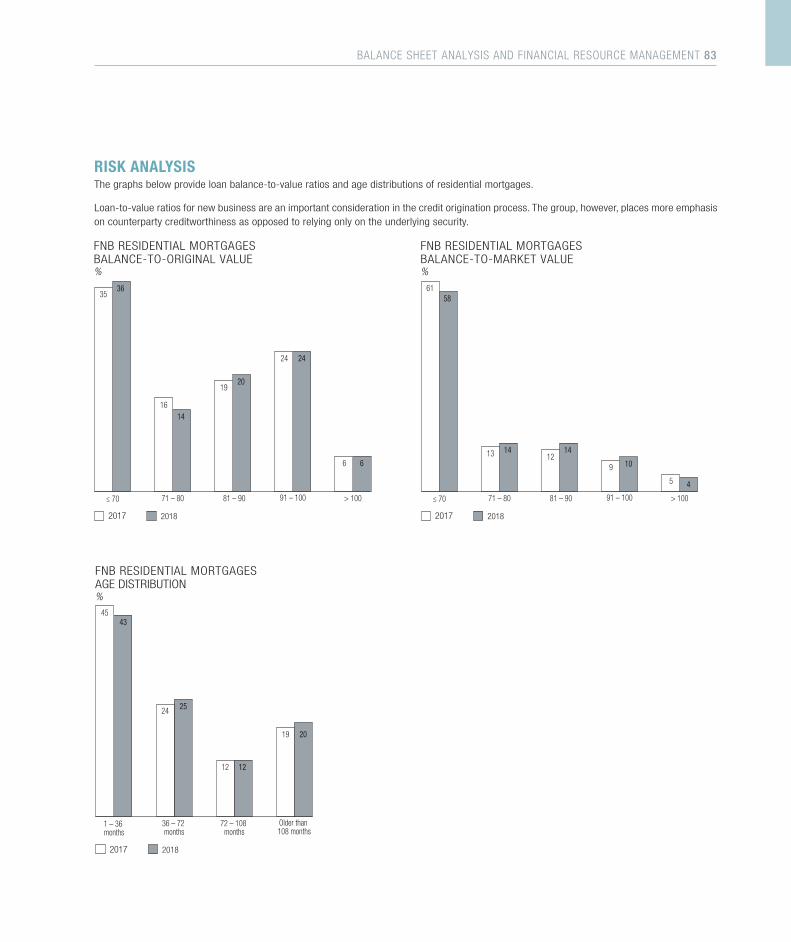
RISK ANALYSISThe graphs below provide loan balance-to-value ratios and age distributions of residential mortgages.
Loan-to-value ratios for new business are an important consideration in the credit origination process. The group, however, places more emphasis on counterparty creditworthiness as opposed to relying only on the underlying security.
2017 2018
≤ 70 71 – 80 81 – 90 91 – 100 > 100
36
14
20
24
6
35
16
19
24
6
FNB RESIDENTIAL MORTGAGESBALANCE-TO-ORIGINAL VALUE%
2017 2018
≤ 70 71 – 80 81 – 90 91 – 100 > 100
58
14 14
10
4
61
13 129
5
FNB RESIDENTIAL MORTGAGESBALANCE-TO-MARKET VALUE%
2017 2018
1 – 36 months
36 – 72 months
72 – 108 months
Older than 108 months
43
25
12
20
45
24
12
19
FNB RESIDENTIAL MORTGAGESAGE DISTRIBUTION%
BALANCE SHEET ANALYSIS AND FINANCIAL RESOURCE MANAGEMENT 83
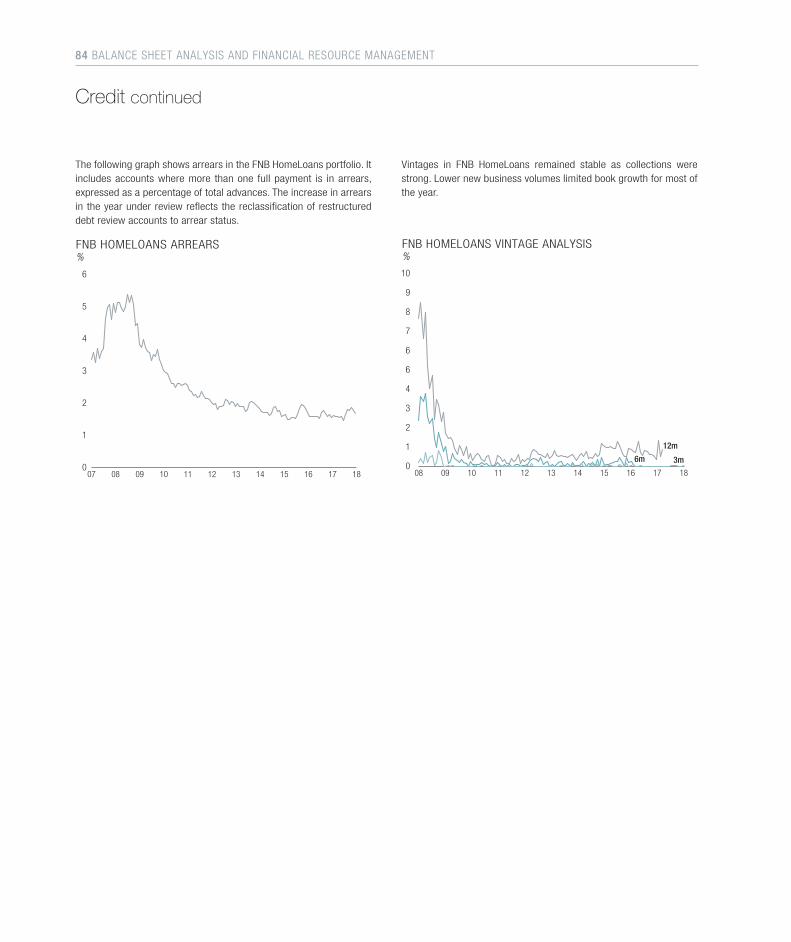
The following graph shows arrears in the FNB HomeLoans portfolio. It includes accounts where more than one full payment is in arrears, expressed as a percentage of total advances. The increase in arrears in the year under review reflects the reclassification of restructured debt review accounts to arrear status.
6
5
4
3
2
1
007 10 11 12 13 15 1814 160908
FNB HOMELOANS ARREARS%
17
Credit continued
Vintages in FNB HomeLoans remained stable as collections were strong. Lower new business volumes limited book growth for most of the year.
10
9
8
7
6
6
4
3
2
1
0
12m
6m 3m
08 11 12 13 14 16 1815 171009
FNB HOMELOANS VINTAGE ANALYSIS%
84 BALANCE SHEET ANALYSIS AND FINANCIAL RESOURCE MANAGEMENT
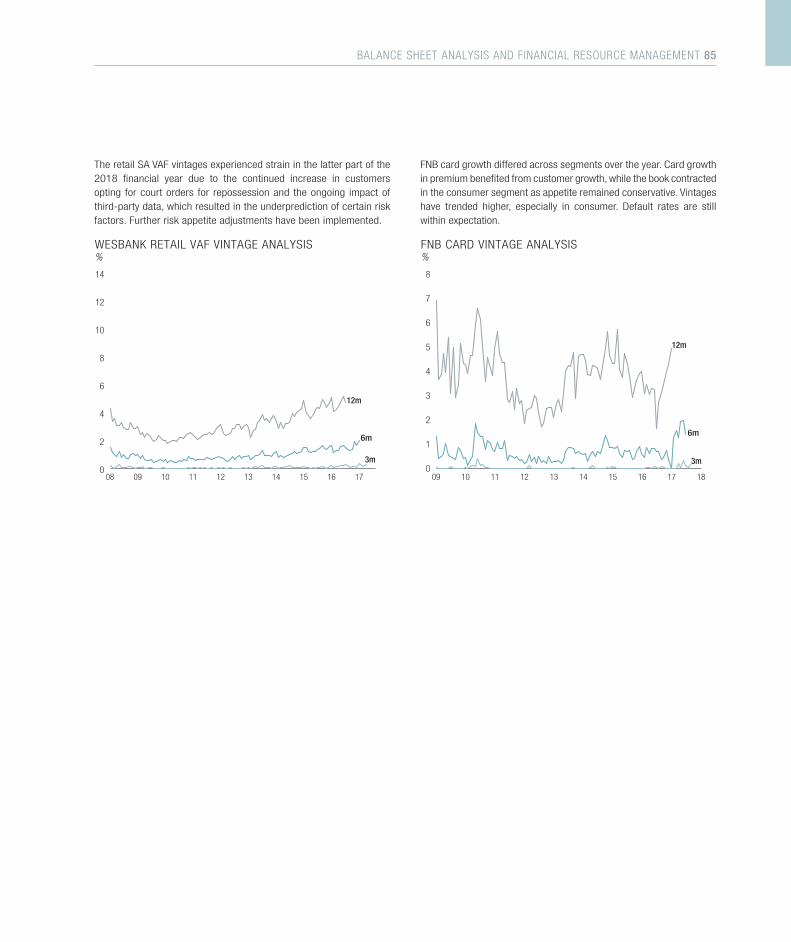
The retail SA VAF vintages experienced strain in the latter part of the 2018 financial year due to the continued increase in customers opting for court orders for repossession and the ongoing impact of third-party data, which resulted in the underprediction of certain risk factors. Further risk appetite adjustments have been implemented.
14
12
10
8
6
4
2
0
12m
3m
08 14 15 16 1709
6m
10 11 12 13
WESBANK RETAIL VAF VINTAGE ANALYSIS%
FNB card growth differed across segments over the year. Card growth in premium benefited from customer growth, while the book contracted in the consumer segment as appetite remained conservative. Vintages have trended higher, especially in consumer. Default rates are still within expectation.
8
7
6
5
4
3
2
1
0
12m
6m
3m
09 11 12 13 14 16 1815 1710
FNB CARD VINTAGE ANALYSIS%
BALANCE SHEET ANALYSIS AND FINANCIAL RESOURCE MANAGEMENT 85
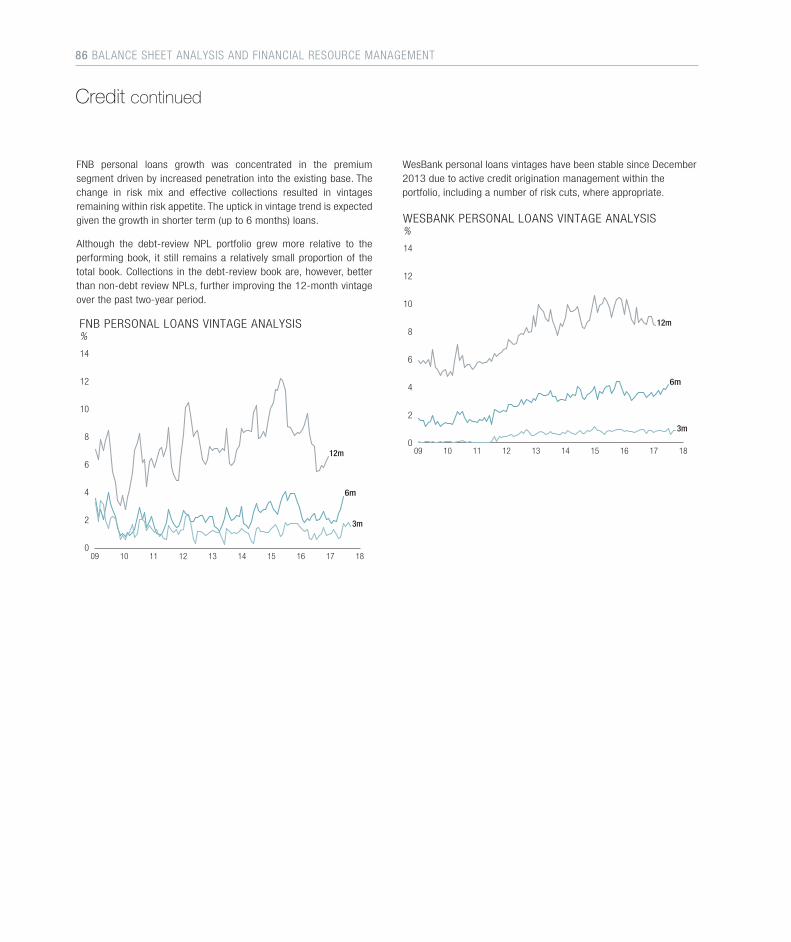
Credit continued
FNB personal loans growth was concentrated in the premium segment driven by increased penetration into the existing base. The change in risk mix and effective collections resulted in vintages remaining within risk appetite. The uptick in vintage trend is expected given the growth in shorter term (up to 6 months) loans.
Although the debt-review NPL portfolio grew more relative to the performing book, it still remains a relatively small proportion of the total book. Collections in the debt-review book are, however, better than non-debt review NPLs, further improving the 12-month vintage over the past two-year period.
14
12
10
8
6
4
2
0
12m
6m
3m
09 11 12 13 14 16 1815 1710
FNB PERSONAL LOANS VINTAGE ANALYSIS%
WesBank personal loans vintages have been stable since December 2013 due to active credit origination management within the portfolio, including a number of risk cuts, where appropriate.
14
12
10
8
6
4
2
0
12m
3m
09 14 15 1816
WESBANK PERSONAL LOANS VINTAGE ANALYSIS%
13
6m
10 11 12 17
86 BALANCE SHEET ANALYSIS AND FINANCIAL RESOURCE MANAGEMENT
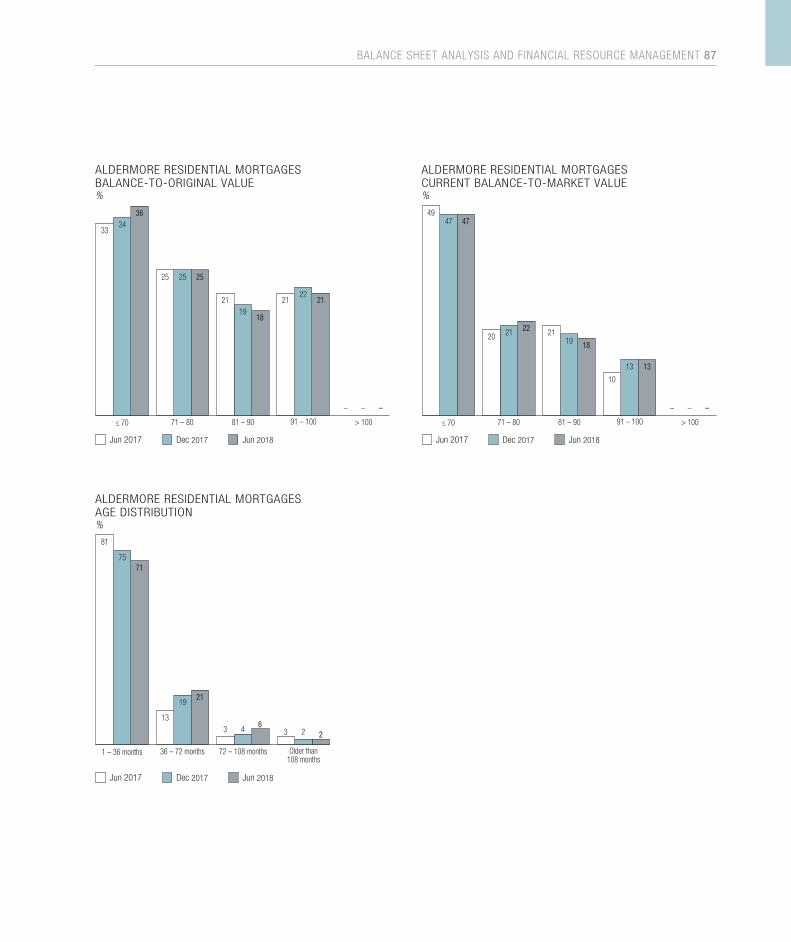
Jun 2017 Dec 2017 Jun 2018
≤ 70 71 – 80 81 – 90 91 – 100 > 100
47
2119
13
–
47
22
18
13
–
49
20 21
10
–
ALDERMORE RESIDENTIAL MORTGAGESCURRENT BALANCE-TO-MARKET VALUE%
Jun 2017 Dec 2017 Jun 2018
≤ 70 71 – 80 81 – 90 91 – 100 > 100
34
25
19
22
–
36
25
18
21
–
33
25
21 21
–
ALDERMORE RESIDENTIAL MORTGAGESBALANCE-TO-ORIGINAL VALUE%
Jun 2017 Dec 2017 Jun 2018
1 – 36 months 36 – 72 months 72 – 108 months Older than108 months
75
19
4 2
71
21
62
81
133 3
ALDERMORE RESIDENTIAL MORTGAGESAGE DISTRIBUTION%
BALANCE SHEET ANALYSIS AND FINANCIAL RESOURCE MANAGEMENT 87
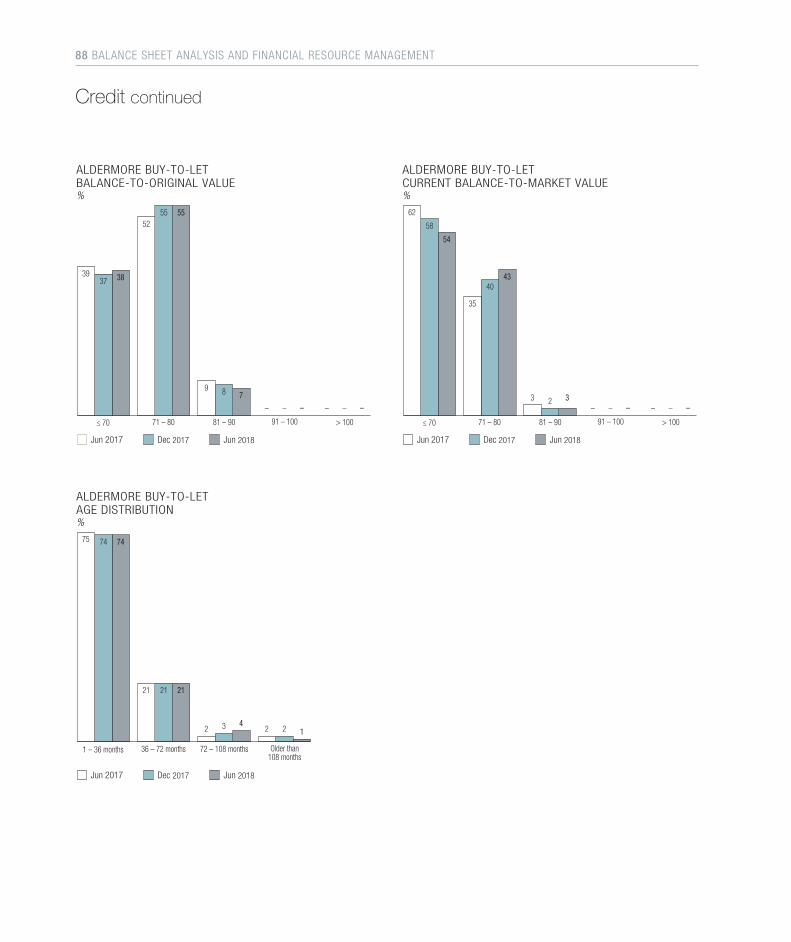
Jun 2017 Dec 2017 Jun 2018
≤ 70 71 – 80 81 – 90 91 – 100 > 100
37
55
8
– –
38
55
7– –
39
52
9
– –
ALDERMORE BUY-TO-LETBALANCE-TO-ORIGINAL VALUE%
Jun 2017 Dec 2017 Jun 2018
≤ 70 71 – 80 81 – 90 91 – 100 > 100
58
40
2– –
54
43
3– –
62
35
3– –
ALDERMORE BUY-TO-LETCURRENT BALANCE-TO-MARKET VALUE%
Jun 2017 Dec 2017 Jun 2018
1 – 36 months 36 – 72 months 72 – 108 months Older than108 months
74
21
3 2
74
21
41
75
21
2 2
ALDERMORE BUY-TO-LETAGE DISTRIBUTION%
Credit continued
88 BALANCE SHEET ANALYSIS AND FINANCIAL RESOURCE MANAGEMENT
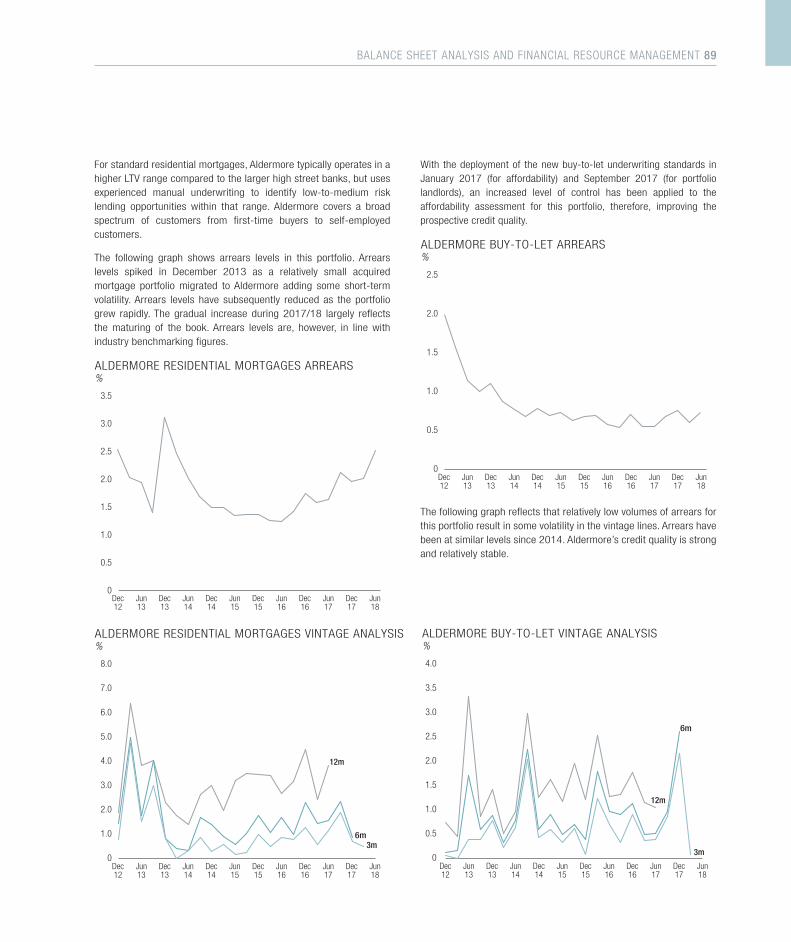
For standard residential mortgages, Aldermore typically operates in a higher LTV range compared to the larger high street banks, but uses experienced manual underwriting to identify low-to-medium risk lending opportunities within that range. Aldermore covers a broad spectrum of customers from first-time buyers to self-employed customers.
The following graph shows arrears levels in this portfolio. Arrears levels spiked in December 2013 as a relatively small acquired mortgage portfolio migrated to Aldermore adding some short-term volatility. Arrears levels have subsequently reduced as the portfolio grew rapidly. The gradual increase during 2017/18 largely reflects the maturing of the book. Arrears levels are, however, in line with industry benchmarking figures.
3.5
3.0
2.5
2.0
1.5
1.0
0.5
0Dec12
Jun14
Dec14
Dec15
Jun16
Jun17
Jun18
Dec16
Dec17
Jun13
ALDERMORE RESIDENTIAL MORTGAGES ARREARS%
Jun15
Dec13
12m
3m
Dec12
Jun14
Dec14
Dec15
Jun16
Jun17
Jun18
Dec16
Dec17
Jun13
ALDERMORE RESIDENTIAL MORTGAGES VINTAGE ANALYSIS%
Jun15
Dec13
6m
8.0
7.0
6.0
5.0
4.0
3.0
2.0
1.0
0
With the deployment of the new buy-to-let underwriting standards in January 2017 (for affordability) and September 2017 (for portfolio landlords), an increased level of control has been applied to the affordability assessment for this portfolio, therefore, improving the prospective credit quality.
2.5
2.0
1.5
1.0
0.5
0Dec12
Jun14
Dec14
Dec15
Jun16
Jun17
Jun18
Dec16
Dec17
Jun13
Jun15
Dec13
ALDERMORE BUY-TO-LET ARREARS%
The following graph reflects that relatively low volumes of arrears for this portfolio result in some volatility in the vintage lines. Arrears have been at similar levels since 2014. Aldermore’s credit quality is strong and relatively stable.
4.0
3.5
3.0
2.5
2.0
1.5
1.0
0.5
0
12m
3m
Dec12
Jun14
Dec14
Dec15
Jun16
Jun17
Jun18
Dec16
Dec17
Jun13
Jun15
Dec13
6m
ALDERMORE BUY-TO-LET VINTAGE ANALYSIS%
BALANCE SHEET ANALYSIS AND FINANCIAL RESOURCE MANAGEMENT 89
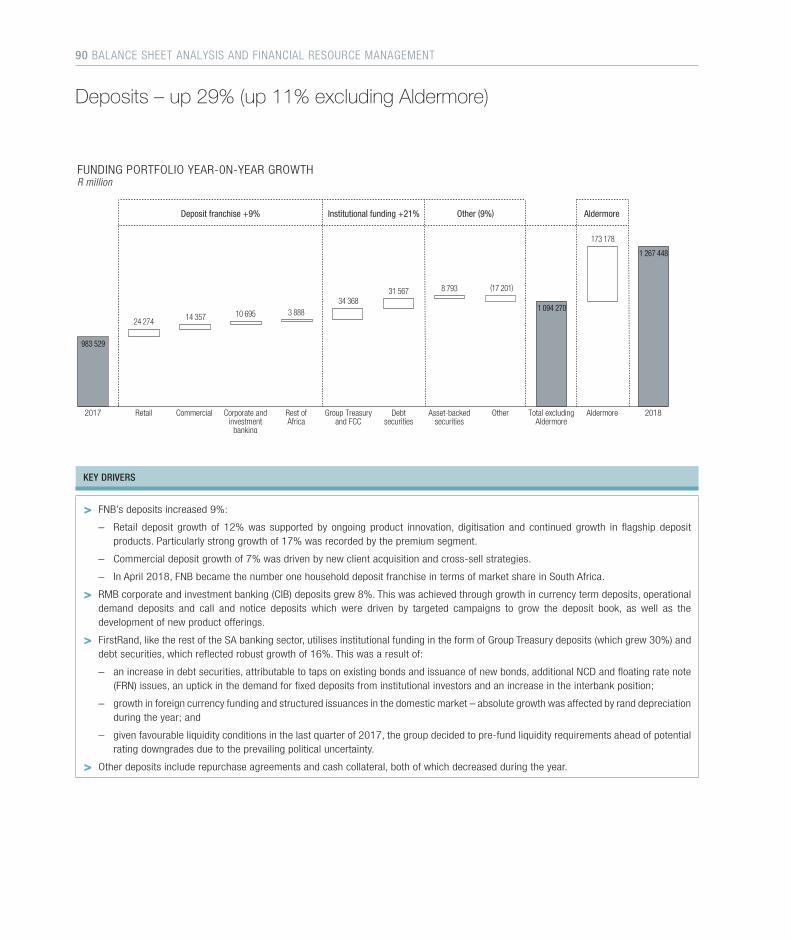
983 529
24 274
34 36831 567
10 69514 357
2017
8 793
1 267 448
Retail Commercial Corporate andinvestment
banking
Group Treasuryand FCC
Debtsecurities
Asset-backedsecurities
2018
Deposit franchise +9% Institutional funding +21% Other (9%)
3 888
Rest ofAfrica
(17 201)
Other
173 178
Aldermore
1 094 270
Total excludingAldermore
Aldermore
FUNDING PORTFOLIO YEAR-0N-YEAR GROWTHR million
KEY DRIVERS
> FNB’s deposits increased 9%:
– Retail deposit growth of 12% was supported by ongoing product innovation, digitisation and continued growth in flagship deposit products. Particularly strong growth of 17% was recorded by the premium segment.
– Commercial deposit growth of 7% was driven by new client acquisition and cross-sell strategies.
– In April 2018, FNB became the number one household deposit franchise in terms of market share in South Africa.
> RMB corporate and investment banking (CIB) deposits grew 8%. This was achieved through growth in currency term deposits, operational demand deposits and call and notice deposits which were driven by targeted campaigns to grow the deposit book, as well as the development of new product offerings.
> FirstRand, like the rest of the SA banking sector, utilises institutional funding in the form of Group Treasury deposits (which grew 30%) and debt securities, which reflected robust growth of 16%. This was a result of:
– an increase in debt securities, attributable to taps on existing bonds and issuance of new bonds, additional NCD and floating rate note (FRN) issues, an uptick in the demand for fixed deposits from institutional investors and an increase in the interbank position;
– growth in foreign currency funding and structured issuances in the domestic market – absolute growth was affected by rand depreciation during the year; and
– given favourable liquidity conditions in the last quarter of 2017, the group decided to pre-fund liquidity requirements ahead of potential rating downgrades due to the prevailing political uncertainty.
> Other deposits include repurchase agreements and cash collateral, both of which decreased during the year.
Deposits – up 29% (up 11% excluding Aldermore)
90 BALANCE SHEET ANALYSIS AND FINANCIAL RESOURCE MANAGEMENT
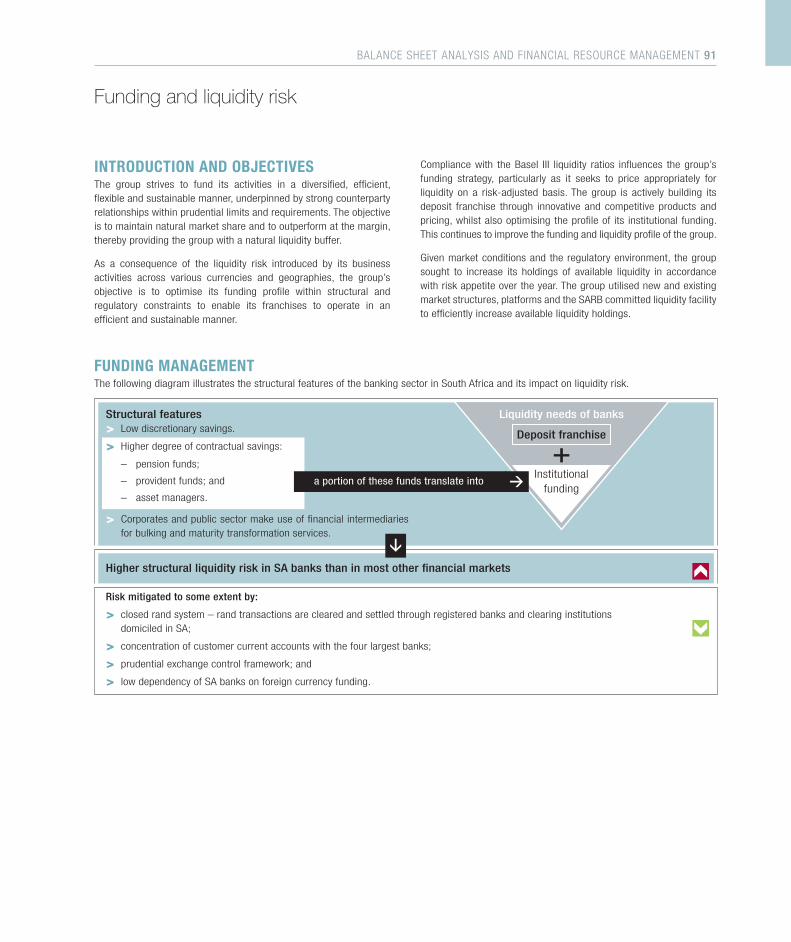
INTRODUCTION AND OBJECTIVESThe group strives to fund its activities in a diversified, efficient, flexible and sustainable manner, underpinned by strong counterparty relationships within prudential limits and requirements. The objective is to maintain natural market share and to outperform at the margin, thereby providing the group with a natural liquidity buffer.
As a consequence of the liquidity risk introduced by its business activities across various currencies and geographies, the group’s objective is to optimise its funding profile within structural and regulatory constraints to enable its franchises to operate in an efficient and sustainable manner.
Funding and liquidity risk
Compliance with the Basel III liquidity ratios influences the group’s funding strategy, particularly as it seeks to price appropriately for liquidity on a risk-adjusted basis. The group is actively building its deposit franchise through innovative and competitive products and pricing, whilst also optimising the profile of its institutional funding. This continues to improve the funding and liquidity profile of the group.
Given market conditions and the regulatory environment, the group sought to increase its holdings of available liquidity in accordance with risk appetite over the year. The group utilised new and existing market structures, platforms and the SARB committed liquidity facility to efficiently increase available liquidity holdings.
FUNDING MANAGEMENTThe following diagram illustrates the structural features of the banking sector in South Africa and its impact on liquidity risk.
Structural features> Low discretionary savings.
> Higher degree of contractual savings:
– pension funds;
– provident funds; and
– asset managers.
> Corporates and public sector make use of financial intermediaries for bulking and maturity transformation services.
Risk mitigated to some extent by:
> closed rand system – rand transactions are cleared and settled through registered banks and clearing institutions domiciled in SA;
> concentration of customer current accounts with the four largest banks;
> prudential exchange control framework; and
> low dependency of SA banks on foreign currency funding.
Liquidity needs of banks
Deposit franchise
Institutional funding
a portion of these funds translate into
Higher structural liquidity risk in SA banks than in most other financial markets
+
BALANCE SHEET ANALYSIS AND FINANCIAL RESOURCE MANAGEMENT 91
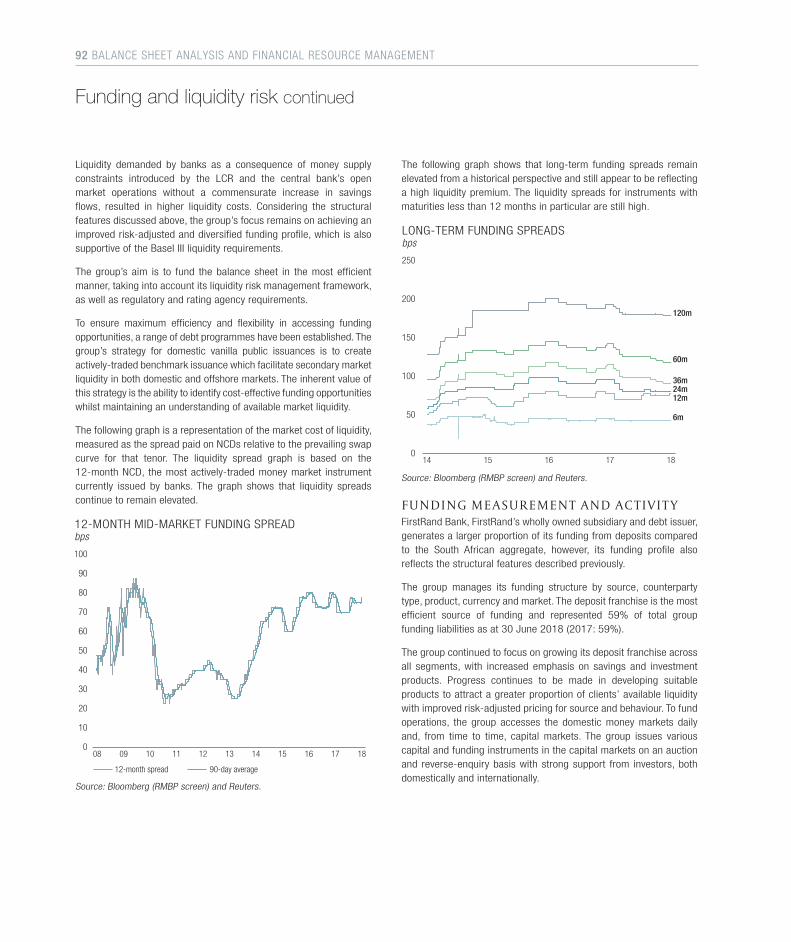
Liquidity demanded by banks as a consequence of money supply constraints introduced by the LCR and the central bank’s open market operations without a commensurate increase in savings flows, resulted in higher liquidity costs. Considering the structural features discussed above, the group’s focus remains on achieving an improved risk-adjusted and diversified funding profile, which is also supportive of the Basel III liquidity requirements.
The group’s aim is to fund the balance sheet in the most efficient manner, taking into account its liquidity risk management framework, as well as regulatory and rating agency requirements.
To ensure maximum efficiency and flexibility in accessing funding opportunities, a range of debt programmes have been established. The group’s strategy for domestic vanilla public issuances is to create actively-traded benchmark issuance which facilitate secondary market liquidity in both domestic and offshore markets. The inherent value of this strategy is the ability to identify cost-effective funding opportunities whilst maintaining an understanding of available market liquidity.
The following graph is a representation of the market cost of liquidity, measured as the spread paid on NCDs relative to the prevailing swap curve for that tenor. The liquidity spread graph is based on the 12-month NCD, the most actively-traded money market instrument currently issued by banks. The graph shows that liquidity spreads continue to remain elevated.
100
90
80
70
60
50
40
30
20
10
01808 09 10 11 12 13 14 15 16 17
12-month spread 90-day average
12-MONTH MID-MARKET FUNDING SPREADbps
Source: Bloomberg (RMBP screen) and Reuters.
The following graph shows that long-term funding spreads remain elevated from a historical perspective and still appear to be reflecting a high liquidity premium. The liquidity spreads for instruments with maturities less than 12 months in particular are still high.
120m
250
200
150
100
50
014 16 1715
60m
36m
12m
6m
24m
18
LONG-TERM FUNDING SPREADSbps
Source: Bloomberg (RMBP screen) and Reuters.
F U N D I N G M E A S U R E M E N T A N D A C T I V I T YFirstRand Bank, FirstRand’s wholly owned subsidiary and debt issuer, generates a larger proportion of its funding from deposits compared to the South African aggregate, however, its funding profile also reflects the structural features described previously.
The group manages its funding structure by source, counterparty type, product, currency and market. The deposit franchise is the most efficient source of funding and represented 59% of total group funding liabilities as at 30 June 2018 (2017: 59%).
The group continued to focus on growing its deposit franchise across all segments, with increased emphasis on savings and investment products. Progress continues to be made in developing suitable products to attract a greater proportion of clients’ available liquidity with improved risk-adjusted pricing for source and behaviour. To fund operations, the group accesses the domestic money markets daily and, from time to time, capital markets. The group issues various capital and funding instruments in the capital markets on an auction and reverse-enquiry basis with strong support from investors, both domestically and internationally.
Funding and liquidity risk continued
92 BALANCE SHEET ANALYSIS AND FINANCIAL RESOURCE MANAGEMENT

The following graph provides a segmental analysis of the group’s funding base and illustrates the success of its deposit franchise focus.
Deposit franchise +31%(+9% excluding Aldermore)
Institutional funding +35%(+21% excluding Aldermore)
+12%
Retail Commercial Corporateand
investmentbanking
2017 2018
+7%
203193
127
GroupTreasurydeposits
Debtsecurities
Otherfunding (9%)
Asset-backedsecurities
+16%
118
152
195
226227
207
138
+29%
+7%
57 61
(31%)
3544
5639
+25%
Otherdeposit
Restof Africa
+8%
130
43
Subordinateddebt
1928
50%
Aldermoreinstitutional
Aldermoredeposit
franchise
FUNDING PORTFOLIO GROWTHR billion
Subordinateddebt
+50%
Note 1: Percentage growth is based on actual, rather than rounded numbers shown in the bar graphs.
Note 2: The graph above is completed using the group segmental reporting split based on the funding product type. The deposit franchise as reported in the above finance segment and product view differs from the risk counterparty view on page 90, which is segment and product agnostic. These views primarily highlight the group’s strength in raising deposits across segments, as well as the diversification of funding from a counterparty perspective.
The graphs below show that the group’s funding mix has remained stable over the last 12 months.
Deposit franchise Group Treasury deposits Debt securities Asset-backed securities Other Subordinated debt
GROUP’S FUNDING MIX
59%
4%
12%
18%
2%
2017
59%
3%
15%
18%
2%
2018
5% 3%
BALANCE SHEET ANALYSIS AND FINANCIAL RESOURCE MANAGEMENT 93
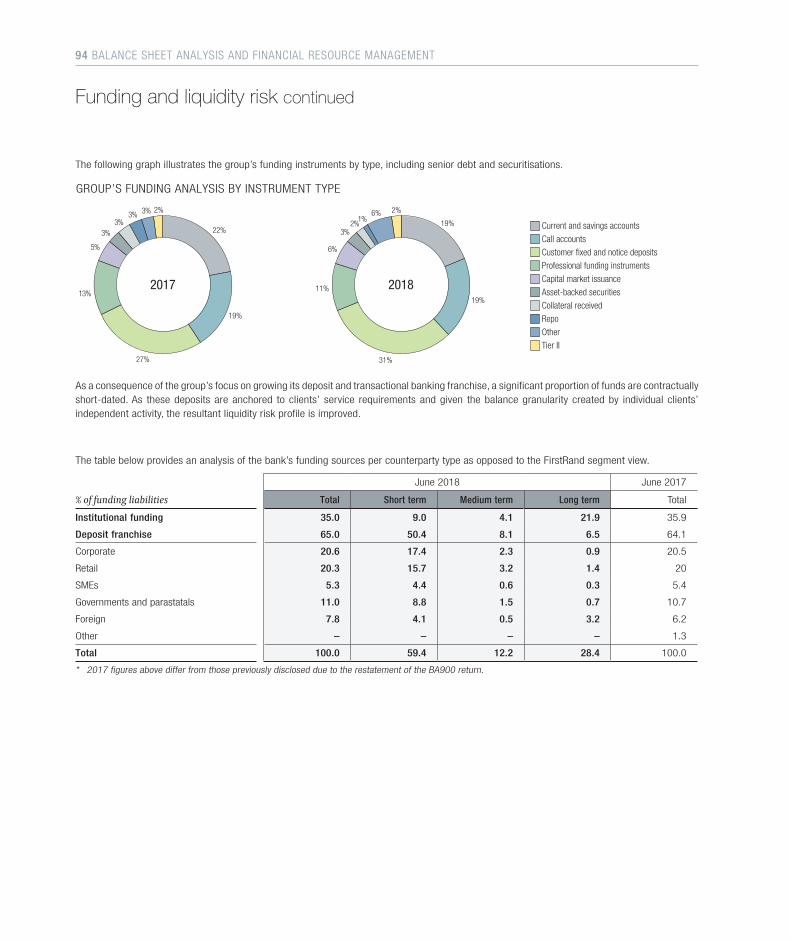
Funding and liquidity risk continued
The following graph illustrates the group’s funding instruments by type, including senior debt and securitisations.
GROUP’S FUNDING ANALYSIS BY INSTRUMENT TYPE
19%
3%
27%
13%
2%
2017
1%
11%
6%
6%
2018
3%3%
5%
22%2%
3%
31%
19%
19%3% 2%
Current and savings accounts Call accounts Customer fixed and notice deposits Professional funding instruments Capital market issuance Asset-backed securities Collateral received Repo Other Tier II
As a consequence of the group’s focus on growing its deposit and transactional banking franchise, a significant proportion of funds are contractually short-dated. As these deposits are anchored to clients’ service requirements and given the balance granularity created by individual clients’ independent activity, the resultant liquidity risk profile is improved.
The table below provides an analysis of the bank’s funding sources per counterparty type as opposed to the FirstRand segment view.
% of funding liabilities
June 2018 June 2017
Total Short term Medium term Long term Total
Institutional funding 35.0 9.0 4.1 21.9 35.9
Deposit franchise 65.0 50.4 8.1 6.5 64.1
Corporate 20.6 17.4 2.3 0.9 20.5
Retail 20.3 15.7 3.2 1.4 20
SMEs 5.3 4.4 0.6 0.3 5.4
Governments and parastatals 11.0 8.8 1.5 0.7 10.7
Foreign 7.8 4.1 0.5 3.2 6.2
Other – – – – 1.3
Total 100.0 59.4 12.2 28.4 100.0
* 2017 figures above differ from those previously disclosed due to the restatement of the BA900 return.
94 BALANCE SHEET ANALYSIS AND FINANCIAL RESOURCE MANAGEMENT
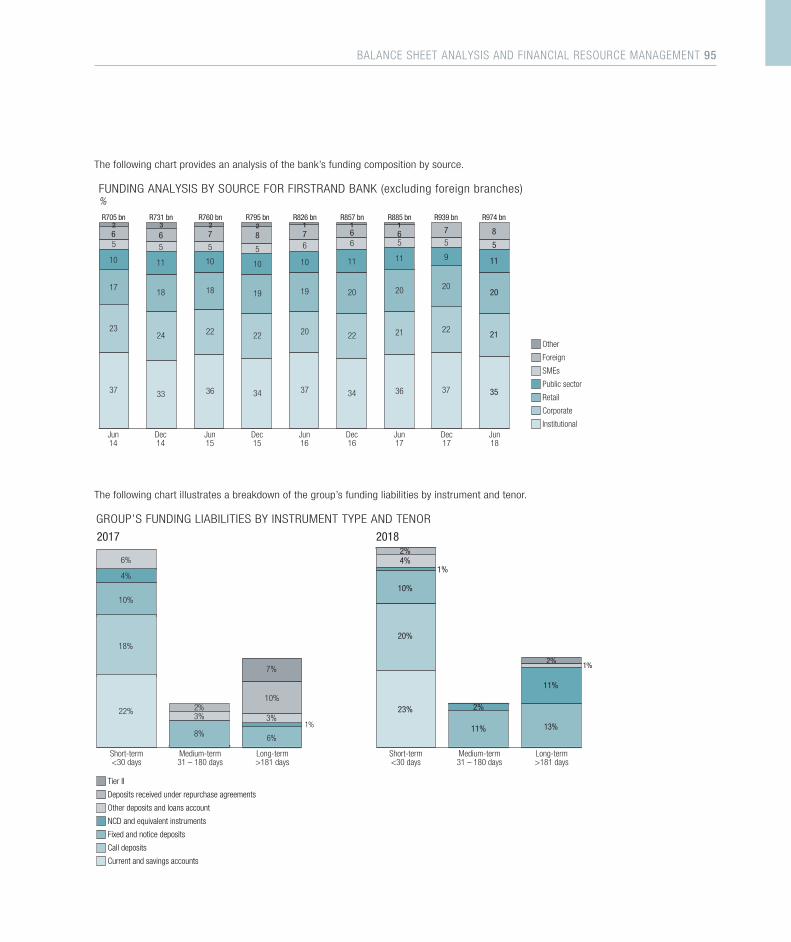
The following chart provides an analysis of the bank’s funding composition by source.
Other
Foreign
SMEs
Public sector
Retail
Corporate
InstitutionalJun17
Dec16
Dec15
Jun16
Jun15
2
56
11
20
21
36
Dec17
7
5
9
20
22
37
R939 bn
Jun18
8
5
11
20
21
35
R974 bn
7
5
10
18
22
36
R760 bn
Dec14
3
65
11
18
24
33
R731 bn
Jun14
265
10
17
23
37
R705 bn
8
5
10
2
19
22
34
R795 bn
76
10
1
19
20
37
R826 bn
66
11
1 1
20
22
34
R857 bn R885 bn
FUNDING ANALYSIS BY SOURCE FOR FIRSTRAND BANK (excluding foreign branches)%
The following chart illustrates a breakdown of the group’s funding liabilities by instrument and tenor.
6%
4%
10%
18%
22%3%
8% 6%
10%
3%
7%
1%
2%
GROUP’S FUNDING LIABILITIES BY INSTRUMENT TYPE AND TENOR
Tier II
Deposits received under repurchase agreements
Other deposits and loans account
NCD and equivalent instruments
Fixed and notice deposits
Call deposits
Current and savings accounts
Short-term<30 days
Medium-term31 – 180 days
Long-term>181 days
2017
4%2%
10%
20%
23% 2%
11%
11%
2%1%
13%
2018
Short-term<30 days
Medium-term31 – 180 days
Long-term>181 days
1%
BALANCE SHEET ANALYSIS AND FINANCIAL RESOURCE MANAGEMENT 95
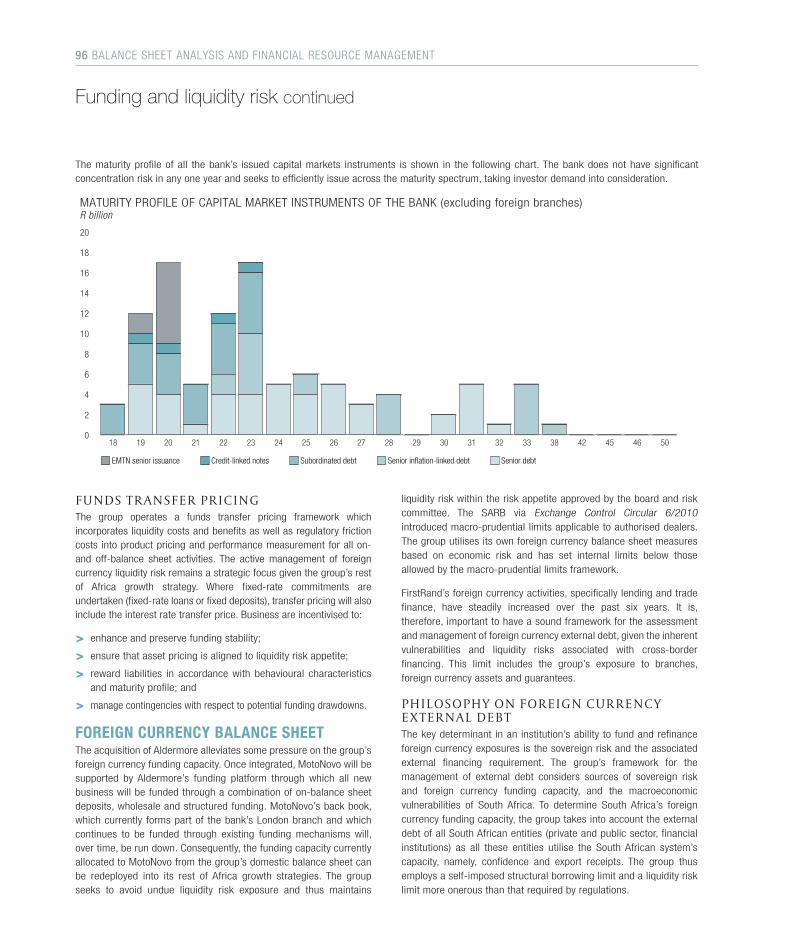
Funding and liquidity risk continued
The maturity profile of all the bank’s issued capital markets instruments is shown in the following chart. The bank does not have significant concentration risk in any one year and seeks to efficiently issue across the maturity spectrum, taking investor demand into consideration.
20
18
16
14
12
10
8
6
4
2
0
EMTN senior issuance Credit-linked notes Subordinated debt Senior inflation-linked debt Senior debt
18 19 20 21 22 23 24 25 26 27 28 29 30 31 32 33 38
MATURITY PROFILE OF CAPITAL MARKET INSTRUMENTS OF THE BANK (excluding foreign branches)R billion
42 45 46 50
F U N DS T R A N S F E R P R I C I N GThe group operates a funds transfer pricing framework which incorporates liquidity costs and benefits as well as regulatory friction costs into product pricing and performance measurement for all on- and off-balance sheet activities. The active management of foreign currency liquidity risk remains a strategic focus given the group’s rest of Africa growth strategy. Where fixed-rate commitments are undertaken (fixed-rate loans or fixed deposits), transfer pricing will also include the interest rate transfer price. Business are incentivised to:
> enhance and preserve funding stability;
> ensure that asset pricing is aligned to liquidity risk appetite;
> reward liabilities in accordance with behavioural characteristics and maturity profile; and
> manage contingencies with respect to potential funding drawdowns.
FOREIGN CURRENCY BALANCE SHEETThe acquisition of Aldermore alleviates some pressure on the group’s foreign currency funding capacity. Once integrated, MotoNovo will be supported by Aldermore’s funding platform through which all new business will be funded through a combination of on-balance sheet deposits, wholesale and structured funding. MotoNovo’s back book, which currently forms part of the bank’s London branch and which continues to be funded through existing funding mechanisms will, over time, be run down. Consequently, the funding capacity currently allocated to MotoNovo from the group’s domestic balance sheet can be redeployed into its rest of Africa growth strategies. The group seeks to avoid undue liquidity risk exposure and thus maintains
liquidity risk within the risk appetite approved by the board and risk committee. The SARB via Exchange Control Circular 6/2010 introduced macro-prudential limits applicable to authorised dealers. The group utilises its own foreign currency balance sheet measures based on economic risk and has set internal limits below those allowed by the macro-prudential limits framework.
FirstRand’s foreign currency activities, specifically lending and trade finance, have steadily increased over the past six years. It is, therefore, important to have a sound framework for the assessment and management of foreign currency external debt, given the inherent vulnerabilities and liquidity risks associated with cross-border financing. This limit includes the group’s exposure to branches, foreign currency assets and guarantees.
P H I L OS O P H Y O N F O R E I G N C U R R E N C Y E X T E R N A L D E B T The key determinant in an institution’s ability to fund and refinance foreign currency exposures is the sovereign risk and the associated external financing requirement. The group’s framework for the management of external debt considers sources of sovereign risk and foreign currency funding capacity, and the macroeconomic vulnerabilities of South Africa. To determine South Africa’s foreign currency funding capacity, the group takes into account the external debt of all South African entities (private and public sector, financial institutions) as all these entities utilise the South African system’s capacity, namely, confidence and export receipts. The group thus employs a self-imposed structural borrowing limit and a liquidity risk limit more onerous than that required by regulations.
96 BALANCE SHEET ANALYSIS AND FINANCIAL RESOURCE MANAGEMENT
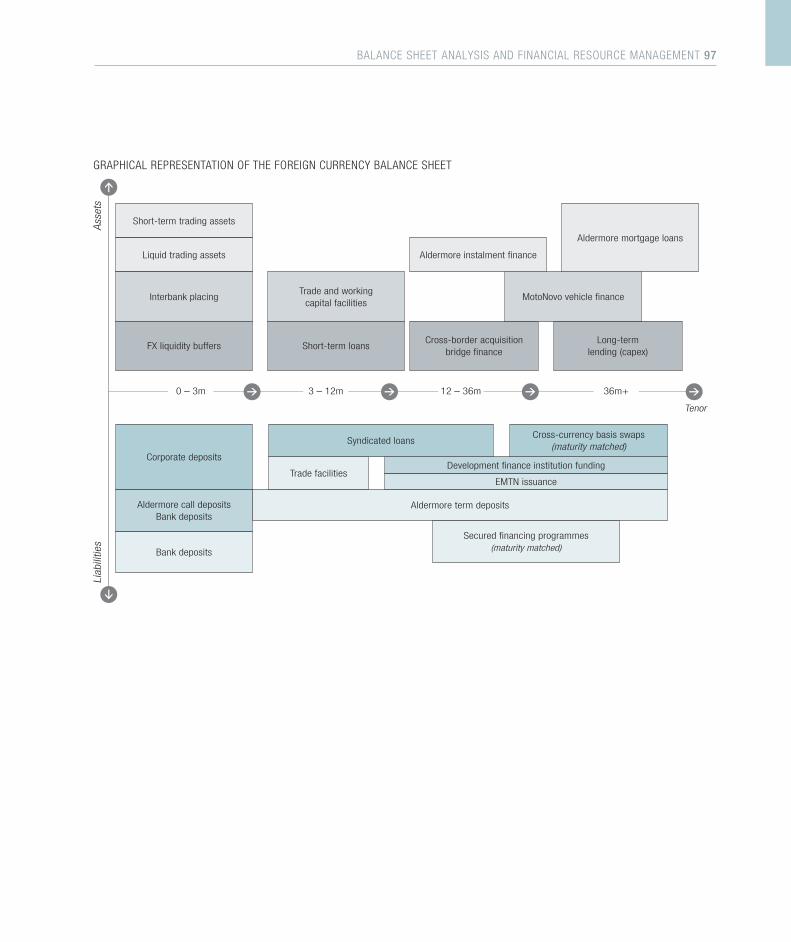
GRAPHICAL REPRESENTATION OF THE FOREIGN CURRENCY BALANCE SHEET
Aldermore term deposits
Secured financing programmes(maturity matched)
Development finance institution funding
EMTN issuanceTrade facilities
Bank deposits
Short-term trading assets
Liquid trading assets
Interbank placing
FX liquidity buffers Short-term loansLong-term
lending (capex)Cross-border acquisition
bridge finance
Corporate deposits
Trade and working capital facilities
MotoNovo vehicle finance
0 – 3m 3 – 12m 12 – 36m 36m+
Asse
ts
Tenor
Liab
ilitie
s
Aldermore instalment finance
Aldermore mortgage loans
Aldermore call deposits Bank deposits
Syndicated loansCross-currency basis swaps
(maturity matched)
BALANCE SHEET ANALYSIS AND FINANCIAL RESOURCE MANAGEMENT 97
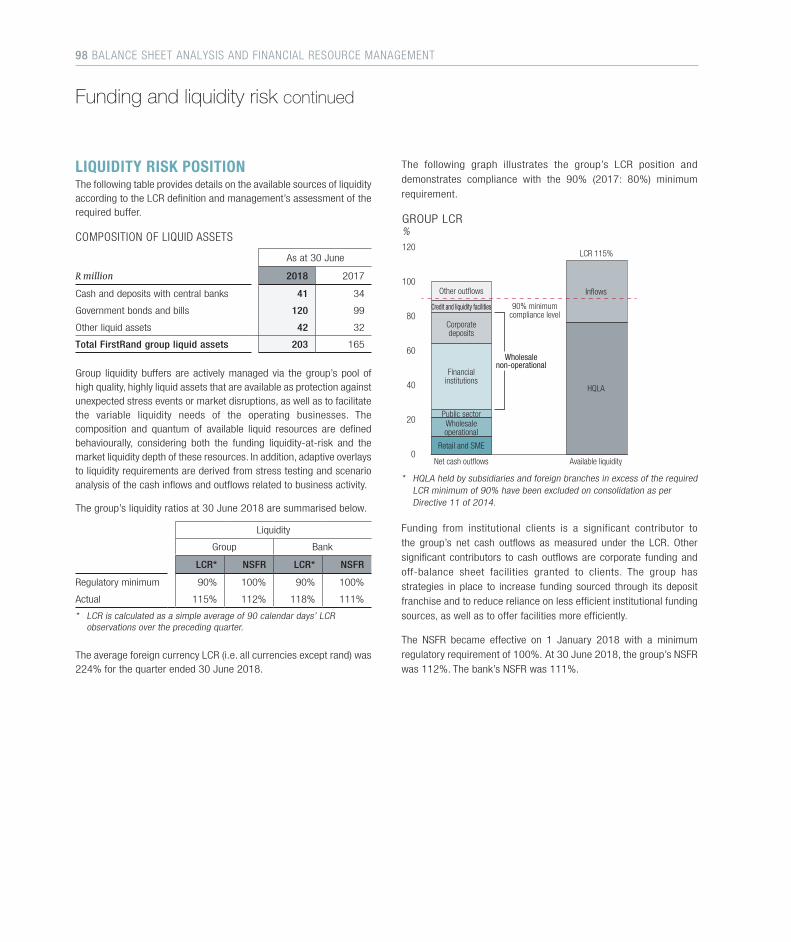
Funding and liquidity risk continued
LIQUIDITY RISK POSITIONThe following table provides details on the available sources of liquidity according to the LCR definition and management’s assessment of the required buffer.
COMPOSITION OF LIQUID ASSETS
As at 30 June
R million 2018 2017
Cash and deposits with central banks 41 34
Government bonds and bills 120 99
Other liquid assets 42 32
Total FirstRand group liquid assets 203 165
Group liquidity buffers are actively managed via the group’s pool of high quality, highly liquid assets that are available as protection against unexpected stress events or market disruptions, as well as to facilitate the variable liquidity needs of the operating businesses. The composition and quantum of available liquid resources are defined behaviourally, considering both the funding liquidity-at-risk and the market liquidity depth of these resources. In addition, adaptive overlays to liquidity requirements are derived from stress testing and scenario analysis of the cash inflows and outflows related to business activity.
The group’s liquidity ratios at 30 June 2018 are summarised below.
Liquidity
Group Bank
LCR* NSFR LCR* NSFR
Regulatory minimum 90% 100% 90% 100%
Actual 115% 112% 118% 111%
* LCR is calculated as a simple average of 90 calendar days’ LCR observations over the preceding quarter.
The average foreign currency LCR (i.e. all currencies except rand) was 224% for the quarter ended 30 June 2018.
The following graph illustrates the group’s LCR position and
demonstrates compliance with the 90% (2017: 80%) minimum
requirement.
Other outflows
Corporatedeposits
Wholesaleoperational
Financialinstitutions
Retail and SME
HQLA
Inflows
Available liquidity Net cash outflows
120
100
80
60
40
20
0
90% minimumcompliance level
LCR 115%
Public sector
Credit and liquidity facilities
Wholesalenon-operational
GROUP LCR%
* HQLA held by subsidiaries and foreign branches in excess of the required LCR minimum of 90% have been excluded on consolidation as per Directive 11 of 2014.
Funding from institutional clients is a significant contributor to the group’s net cash outflows as measured under the LCR. Other significant contributors to cash outflows are corporate funding and off-balance sheet facilities granted to clients. The group has strategies in place to increase funding sourced through its deposit franchise and to reduce reliance on less efficient institutional funding sources, as well as to offer facilities more efficiently.
The NSFR became effective on 1 January 2018 with a minimum regulatory requirement of 100%. At 30 June 2018, the group’s NSFR was 112%. The bank’s NSFR was 111%.
98 BALANCE SHEET ANALYSIS AND FINANCIAL RESOURCE MANAGEMENT
Capital
The group actively manages its capital base commensurate with its strategy, risk appetite and risk profile. The optimal level and composition of capital and leverage is determined after taking the following into account.
> Prudential requirements
> Rating agencies’ considerations
> Investor expectations
> Peer comparison
> Strategic and organic growth
> Economic and regulatory capital requirements
> Proposed regulatory, tax and accounting changes
> Macro environment and stress test impacts
> Issuance of capital instruments
The capital planning process ensures that the total capital adequacy and CET1 ratios remain within or above targets across economic and business cycles. Capital is managed on a forward-looking basis and the group remains appropriately capitalised under a range of normal and severe stress scenarios, which include expansion initiatives, corporate transactions, as well as ongoing regulatory, accounting and tax developments. The group aims to back all economic risk with loss-absorbing capital and remains well capitalised in the current environment. FirstRand’s internal targets have been aligned to the PA end-state minimum capital requirements and are subject to ongoing review and consideration of various stakeholder expectations. No changes were made to the internal targets during the year.
The group is currently subject to the PA transitional minimum capital requirements, which include a 75% phased-in requirement for the capital conservation, countercyclical (CCyB) and domestic systemically important banks (D-SIB) buffer add-ons. The PA has not implemented any CCyB requirement for South African exposures, however, the group is required to calculate the CCyB requirement on private sector exposures in foreign jurisdictions where these buffers are applicable. Effective 27 June 2018, the Prudential Regulatory Authority implemented a 0.5% countercyclical buffer requirement for UK exposures. The CCyB requirement for the group as at 30 June 2018 was 8 bps and is included in the disclosed minimum requirement.
The PA issued Directive 5/2017, Regulatory treatment of accounting provisions – interim approach and transitional arrangements including disclosure and auditing aspects, which allows banks to apply a transitional phase-in of the IFRS 9 impact for regulatory capital purposes. The transitional arrangements will only apply to incremental provisions that arise upon the adoption of IFRS 9 on 1 July 2018. The group has adopted the transitional phase-in. Once implemented, both the phased-in and fully-loaded impact on capital will be disclosed on a quarterly basis.
The PA further issued Guidance Note 3 of 2018, Proposed implementation dates in respect of the specified regulatory reforms, which includes the Basel reforms finalised by the BCBS in December 2017. The impact on the group’s capital position depends on the final implementation by the PA given the level of national discretion. The group continues to participate in the BCBS quantitative impact studies to assess and understand the impact of such reforms.
The Basel III leverage ratio is a supplementary measure to the risk-based capital ratios and greater emphasis has been placed on monitoring the interplay between capital and leverage.
BALANCE SHEET ANALYSIS AND FINANCIAL RESOURCE MANAGEMENT 99

YEAR UNDER REVIEWThe acquisition of Aldermore reduced the group’s CET1 ratio by 240 bps, and the capitalisation of the underlying regulated entities did not change materially. The decrease in the CET1 position of the group relates mainly to the payment of goodwill and identified intangible assets, as well as the consolidation of Aldermore RWA (without a commensurate increase in the capital base as this is eliminated at group level from an IFRS perspective). Post the Aldermore acquisition, the group operated above its internal capital targets.
FRB’s capital position was also impacted by the Aldermore acquisition, reducing its CET1 ratio by 110 bps. The reduction relates to the payment of a dividend to the legal entity which acquired Aldermore to fund the goodwill and intangibles, as well as providing funding for the net asset value acquired.
One of the group’s key principles is that entities must be adequately capitalised on a standalone basis. As at 30 June 2018, the standalone capitalisation of all regulated entities remained strong, with FRB’s CET1 ratio of 12.7% well in excess of the internal targets.
The capital and leverage positions as at 30 June 2018 are summarised in the following table.
CAPITAL ADEQUACY AND LEVERAGE POSITIONS
Capital Leverage
% CET 1 Tier 1 Total Total
Regulatory minimum* 7.5 9.0 11.2 4.0
Internal target 10.0 – 11.0 >12.0 >14.0 >5.0
Actual
– Including unappropriated profits 11.5 12.1 14.7 7.1
– Excluding unappropriated profits 11.0 11.6 14.2 6.9
* Excluding the bank-specific capital requirements, however, includes the countercyclical buffer requirement.
Capital continued
100 BALANCE SHEET ANALYSIS AND FINANCIAL RESOURCE MANAGEMENT
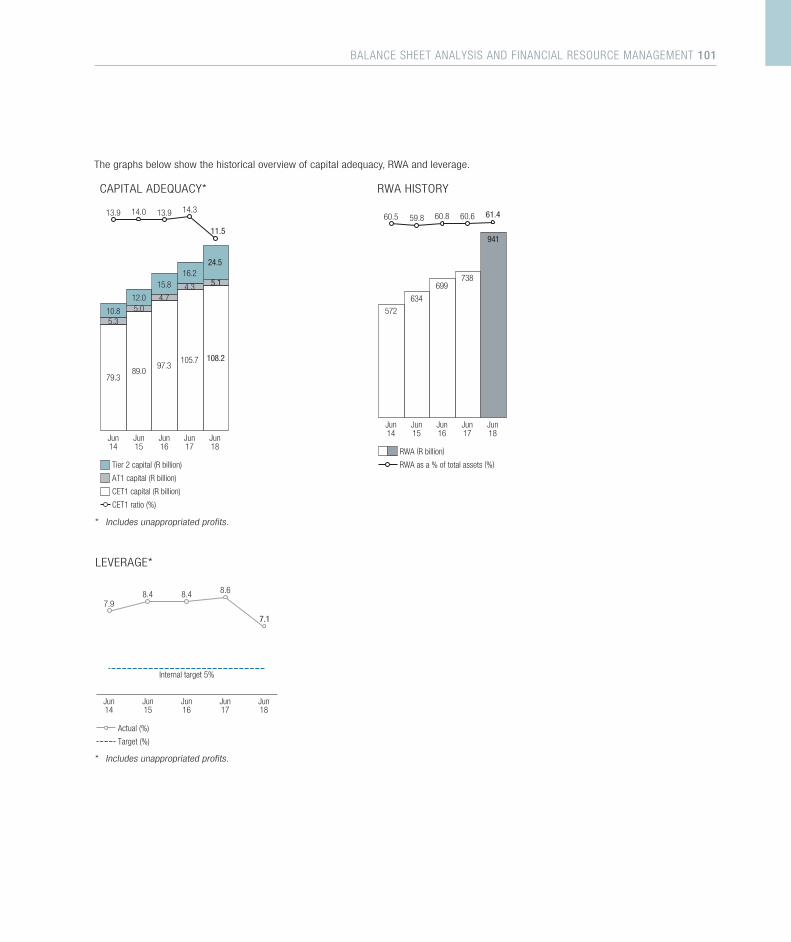
The graphs below show the historical overview of capital adequacy, RWA and leverage.
Jun15
Jun16
Jun17
Jun14
Tier 2 capital (R billion)
AT1 capital (R billion)
CET1 capital (R billion)
CET1 ratio (%)
Jun18
5.3
16.2
79.389.0
105.7
14.0 14.3
11.5
13.913.9
15.8
97.3
12.05.0
24.5
108.2
5.1
4.74.3
10.8
CAPITAL ADEQUACY*
Jun15
Jun16
Jun17
Jun14
RWA (R billion)
RWA as a % of total assets (%)
Jun18
572
634
738
59.8 60.6 61.460.860.5
699
941
RWA HISTORY
* Includes unappropriated profits.
Jun15
Jun16
Jun17
Jun14
Jun18
8.4 8.6
7.1
8.47.9
LEVERAGE*
Actual (%)
Target (%)
Internal target 5%
* Includes unappropriated profits.
BALANCE SHEET ANALYSIS AND FINANCIAL RESOURCE MANAGEMENT 101
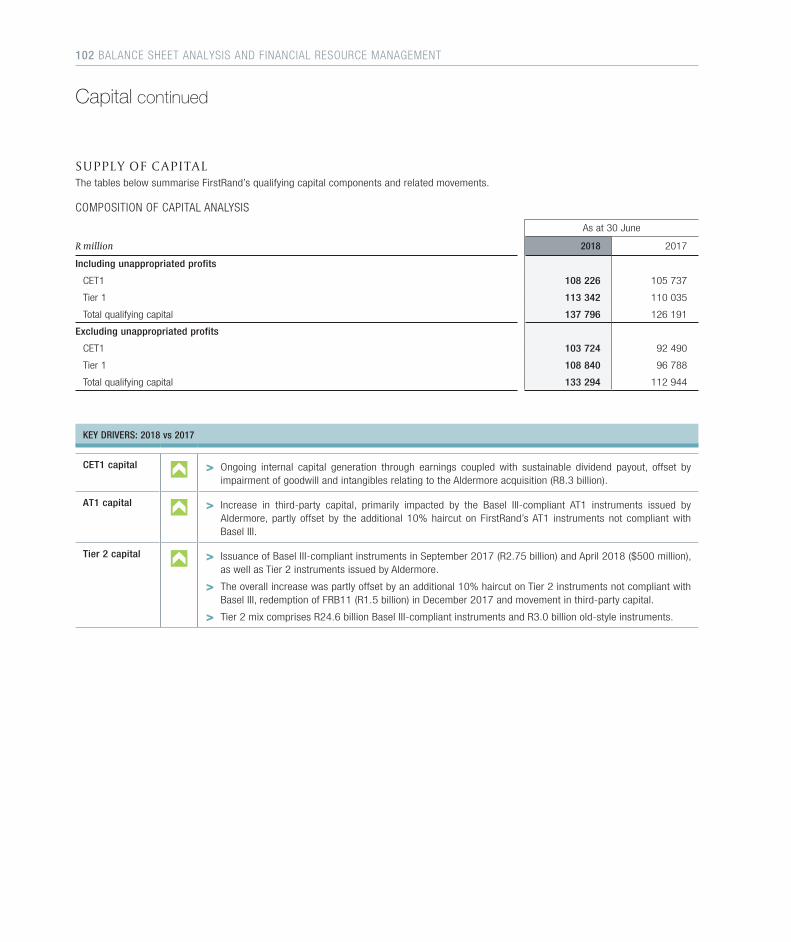
Capital continued
S U P P LY O F C A P I TA LThe tables below summarise FirstRand’s qualifying capital components and related movements.
COMPOSITION OF CAPITAL ANALYSIS
As at 30 June
R million 2018 2017
Including unappropriated profits
CET1 108 226 105 737
Tier 1 113 342 110 035
Total qualifying capital 137 796 126 191
Excluding unappropriated profits
CET1 103 724 92 490
Tier 1 108 840 96 788
Total qualifying capital 133 294 112 944
KEY DRIVERS: 2018 vs 2017
CET1 capital > Ongoing internal capital generation through earnings coupled with sustainable dividend payout, offset by impairment of goodwill and intangibles relating to the Aldermore acquisition (R8.3 billion).
AT1 capital > Increase in third-party capital, primarily impacted by the Basel III-compliant AT1 instruments issued by Aldermore, partly offset by the additional 10% haircut on FirstRand’s AT1 instruments not compliant with Basel III.
Tier 2 capital > Issuance of Basel III-compliant instruments in September 2017 (R2.75 billion) and April 2018 ($500 million), as well as Tier 2 instruments issued by Aldermore.
> The overall increase was partly offset by an additional 10% haircut on Tier 2 instruments not compliant with Basel III, redemption of FRB11 (R1.5 billion) in December 2017 and movement in third-party capital.
> Tier 2 mix comprises R24.6 billion Basel III-compliant instruments and R3.0 billion old-style instruments.
102 BALANCE SHEET ANALYSIS AND FINANCIAL RESOURCE MANAGEMENT

D E M A N D F O R C A P I TA L RWA as at 30 June 2018 was impacted by the take-on of RWA relating to Aldermore. The table below summarises the year-on-year movements.
RWA ANALYSIS
514
29
16
14
17
18
25
1072721
117
29
25
596
RWA growth excluding Aldermore: +13%RWA growth including Aldermore: +28%
124
Credit Counterparty credit Operational Market Equity investment Other Threshold items Aldermore
2017R738 billion
2018R941 billion
KEY DRIVERS: 2018 vs 2017
Credit > Organic growth, model recalibrations and exchange rate movements.
> Incorporates the impact of the downgrade of the South African sovereign, state-owned entities and large corporates.
Counterparty credit > Volumes and mark-to-market movements, a well as data refinement.
> Incorporates the impact of the downgrade of the South African sovereign, state-owned entities and large corporates.
Operational > Recalibration of risk scenarios subject to the advanced measurement approach.
> Increase in gross income for entities on the standardised approach.
Market > Volume and mark-to-market movements.
Equity investment > Disposal of investments.
Threshold items > Movement in deferred tax assets and investments in financial, banking and insurance entities (subject to
250% risk weighting).
Aldermore > Relates to the Aldermore Bank (regulated bank) RWA and includes credit risk, operational risk and other risks.
BALANCE SHEET ANALYSIS AND FINANCIAL RESOURCE MANAGEMENT 103
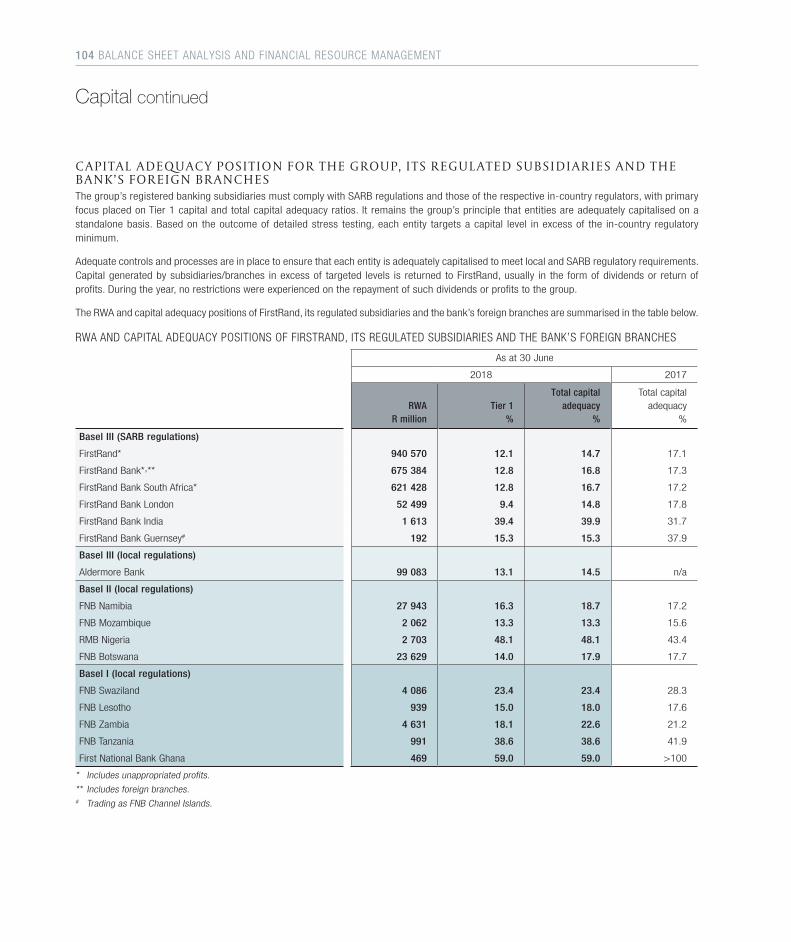
Capital continued
C A P I TA L A D E Q U A C Y P OS I T I O N F O R T H E G RO U P, I T S R E G U L AT E D S U B S I D I A R I E S A N D T H E B A N K’ S F O R E I G N B R A N C H E SThe group’s registered banking subsidiaries must comply with SARB regulations and those of the respective in-country regulators, with primary focus placed on Tier 1 capital and total capital adequacy ratios. It remains the group’s principle that entities are adequately capitalised on a standalone basis. Based on the outcome of detailed stress testing, each entity targets a capital level in excess of the in-country regulatory minimum.
Adequate controls and processes are in place to ensure that each entity is adequately capitalised to meet local and SARB regulatory requirements. Capital generated by subsidiaries/branches in excess of targeted levels is returned to FirstRand, usually in the form of dividends or return of profits. During the year, no restrictions were experienced on the repayment of such dividends or profits to the group.
The RWA and capital adequacy positions of FirstRand, its regulated subsidiaries and the bank’s foreign branches are summarised in the table below.
RWA AND CAPITAL ADEQUACY POSITIONS OF FIRSTRAND, ITS REGULATED SUBSIDIARIES AND THE BANK’S FOREIGN BRANCHES
As at 30 June
2018 2017
RWAR million
Tier 1%
Total capital adequacy
%
Total capital adequacy
%
Basel III (SARB regulations)
FirstRand* 940 570 12.1 14.7 17.1
FirstRand Bank*,** 675 384 12.8 16.8 17.3
FirstRand Bank South Africa* 621 428 12.8 16.7 17.2
FirstRand Bank London 52 499 9.4 14.8 17.8
FirstRand Bank India 1 613 39.4 39.9 31.7
FirstRand Bank Guernsey# 192 15.3 15.3 37.9
Basel III (local regulations)
Aldermore Bank 99 083 13.1 14.5 n/a
Basel II (local regulations)
FNB Namibia 27 943 16.3 18.7 17.2
FNB Mozambique 2 062 13.3 13.3 15.6
RMB Nigeria 2 703 48.1 48.1 43.4
FNB Botswana 23 629 14.0 17.9 17.7
Basel I (local regulations)
FNB Swaziland 4 086 23.4 23.4 28.3
FNB Lesotho 939 15.0 18.0 17.6
FNB Zambia 4 631 18.1 22.6 21.2
FNB Tanzania 991 38.6 38.6 41.9
First National Bank Ghana 469 59.0 59.0 >100
* Includes unappropriated profits.
** Includes foreign branches.# Trading as FNB Channel Islands.
104 BALANCE SHEET ANALYSIS AND FINANCIAL RESOURCE MANAGEMENT

Common disclosures
In terms of Regulation 43 of the Regulations relating to Banks and BCBS, the following additional capital, leverage and liquidity common disclosures are required:
> Key prudential supervisory measures:
– key metrics (at consolidated level).
> Capital:
– composition of regulatory capital;
– reconciliation of regulatory capital to balance sheet; and
– main features of regulatory capital instruments.
> Macroprudential supervisory measures:
– geographical distribution of credit exposures used in the countercyclical capital buffer.
> Leverage
– summary comparison of accounting assets vs leverage ratio exposure measure; and
– leverage ratio common disclosure template.
> Liquidity
– LCR; and
– NSFR.
Refer to www.firstrand.co.za/investorcentre/pages/commondisclosures.aspx.
Scan with your smart device’s QR code reader to access the common disclosure templates on the group’s website.
BALANCE SHEET ANALYSIS AND FINANCIAL RESOURCE MANAGEMENT 105
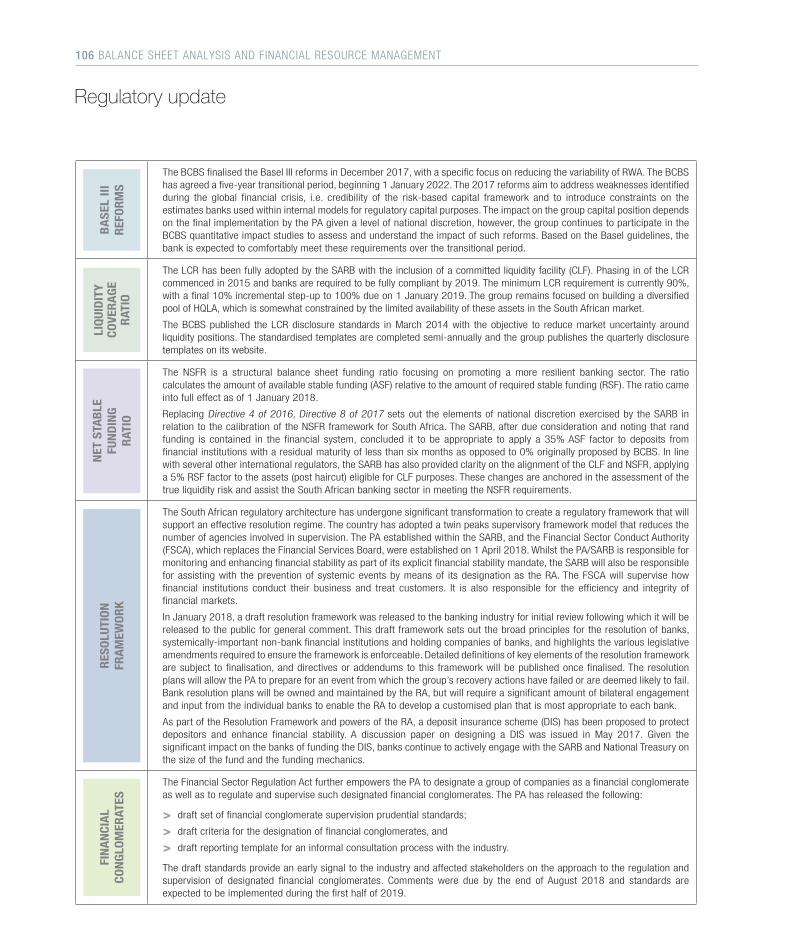
Regulatory update B
ASE
L II
I R
EFO
RM
S
The BCBS finalised the Basel III reforms in December 2017, with a specific focus on reducing the variability of RWA. The BCBS has agreed a five-year transitional period, beginning 1 January 2022. The 2017 reforms aim to address weaknesses identified during the global financial crisis, i.e. credibility of the risk-based capital framework and to introduce constraints on the estimates banks used within internal models for regulatory capital purposes. The impact on the group capital position depends on the final implementation by the PA given a level of national discretion, however, the group continues to participate in the BCBS quantitative impact studies to assess and understand the impact of such reforms. Based on the Basel guidelines, the bank is expected to comfortably meet these requirements over the transitional period.
LIQ
UID
ITY
CO
VER
AG
E
RAT
IO
The LCR has been fully adopted by the SARB with the inclusion of a committed liquidity facility (CLF). Phasing in of the LCR commenced in 2015 and banks are required to be fully compliant by 2019. The minimum LCR requirement is currently 90%, with a final 10% incremental step-up to 100% due on 1 January 2019. The group remains focused on building a diversified pool of HQLA, which is somewhat constrained by the limited availability of these assets in the South African market.
The BCBS published the LCR disclosure standards in March 2014 with the objective to reduce market uncertainty around liquidity positions. The standardised templates are completed semi-annually and the group publishes the quarterly disclosure templates on its website.
NET
STA
BLE
FU
ND
ING
R
ATIO
The NSFR is a structural balance sheet funding ratio focusing on promoting a more resilient banking sector. The ratio calculates the amount of available stable funding (ASF) relative to the amount of required stable funding (RSF). The ratio came into full effect as of 1 January 2018.
Replacing Directive 4 of 2016, Directive 8 of 2017 sets out the elements of national discretion exercised by the SARB in relation to the calibration of the NSFR framework for South Africa. The SARB, after due consideration and noting that rand funding is contained in the financial system, concluded it to be appropriate to apply a 35% ASF factor to deposits from financial institutions with a residual maturity of less than six months as opposed to 0% originally proposed by BCBS. In line with several other international regulators, the SARB has also provided clarity on the alignment of the CLF and NSFR, applying a 5% RSF factor to the assets (post haircut) eligible for CLF purposes. These changes are anchored in the assessment of the true liquidity risk and assist the South African banking sector in meeting the NSFR requirements.
RES
OLU
TIO
N
FRA
MEW
OR
K
The South African regulatory architecture has undergone significant transformation to create a regulatory framework that will support an effective resolution regime. The country has adopted a twin peaks supervisory framework model that reduces the number of agencies involved in supervision. The PA established within the SARB, and the Financial Sector Conduct Authority (FSCA), which replaces the Financial Services Board, were established on 1 April 2018. Whilst the PA/SARB is responsible for monitoring and enhancing financial stability as part of its explicit financial stability mandate, the SARB will also be responsible for assisting with the prevention of systemic events by means of its designation as the RA. The FSCA will supervise how financial institutions conduct their business and treat customers. It is also responsible for the efficiency and integrity of financial markets.
In January 2018, a draft resolution framework was released to the banking industry for initial review following which it will be released to the public for general comment. This draft framework sets out the broad principles for the resolution of banks, systemically-important non-bank financial institutions and holding companies of banks, and highlights the various legislative amendments required to ensure the framework is enforceable. Detailed definitions of key elements of the resolution framework are subject to finalisation, and directives or addendums to this framework will be published once finalised. The resolution plans will allow the PA to prepare for an event from which the group’s recovery actions have failed or are deemed likely to fail. Bank resolution plans will be owned and maintained by the RA, but will require a significant amount of bilateral engagement and input from the individual banks to enable the RA to develop a customised plan that is most appropriate to each bank.
As part of the Resolution Framework and powers of the RA, a deposit insurance scheme (DIS) has been proposed to protect depositors and enhance financial stability. A discussion paper on designing a DIS was issued in May 2017. Given the significant impact on the banks of funding the DIS, banks continue to actively engage with the SARB and National Treasury on the size of the fund and the funding mechanics.
FIN
AN
CIA
L
CON
GLO
MER
ATES
The Financial Sector Regulation Act further empowers the PA to designate a group of companies as a financial conglomerate as well as to regulate and supervise such designated financial conglomerates. The PA has released the following:
> draft set of financial conglomerate supervision prudential standards;
> draft criteria for the designation of financial conglomerates, and
> draft reporting template for an informal consultation process with the industry.
The draft standards provide an early signal to the industry and affected stakeholders on the approach to the regulation and supervision of designated financial conglomerates. Comments were due by the end of August 2018 and standards are expected to be implemented during the first half of 2019.
106 BALANCE SHEET ANALYSIS AND FINANCIAL RESOURCE MANAGEMENT
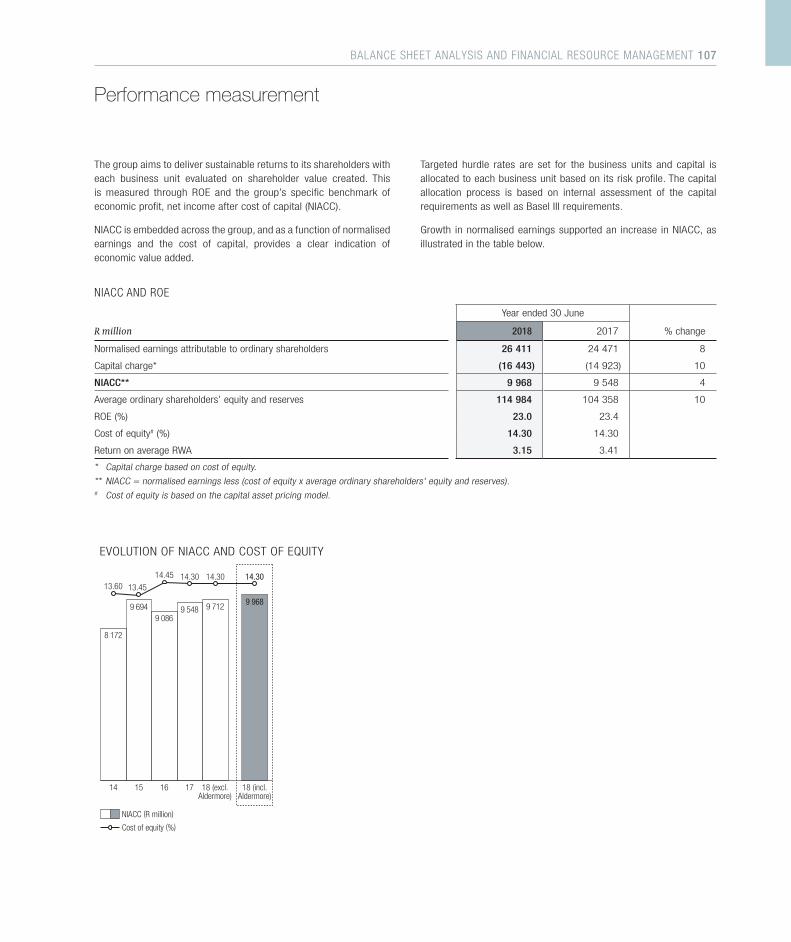
The group aims to deliver sustainable returns to its shareholders with each business unit evaluated on shareholder value created. This is measured through ROE and the group’s specific benchmark of economic profit, net income after cost of capital (NIACC).
NIACC is embedded across the group, and as a function of normalised earnings and the cost of capital, provides a clear indication of economic value added.
Performance measurement
Targeted hurdle rates are set for the business units and capital is allocated to each business unit based on its risk profile. The capital allocation process is based on internal assessment of the capital requirements as well as Basel III requirements.
Growth in normalised earnings supported an increase in NIACC, as illustrated in the table below.
NIACC AND ROE
Year ended 30 June
R million 2018 2017 % change
Normalised earnings attributable to ordinary shareholders 26 411 24 471 8
Capital charge* (16 443) (14 923) 10
NIACC** 9 968 9 548 4
Average ordinary shareholders’ equity and reserves 114 984 104 358 10
ROE (%) 23.0 23.4
Cost of equity# (%) 14.30 14.30
Return on average RWA 3.15 3.41
* Capital charge based on cost of equity.
** NIACC = normalised earnings less (cost of equity x average ordinary shareholders' equity and reserves).# Cost of equity is based on the capital asset pricing model.
15 16 1714
NIACC (R million)
Cost of equity (%)
18 (excl.Aldermore)
8 172
9 694 9 548
13.4514.30 14.3014.45
13.60
9 086
9 968
EVOLUTION OF NIACC AND COST OF EQUITY
18 (incl.Aldermore)
9 712
14.30
BALANCE SHEET ANALYSIS AND FINANCIAL RESOURCE MANAGEMENT 107
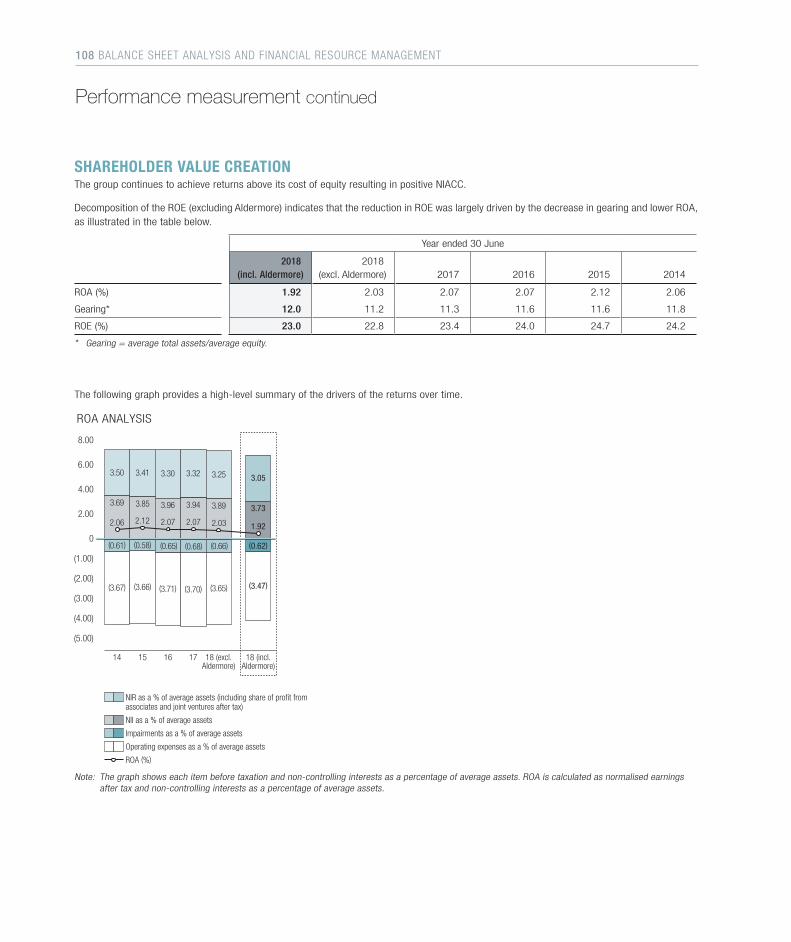
SHAREHOLDER VALUE CREATIONThe group continues to achieve returns above its cost of equity resulting in positive NIACC.
Decomposition of the ROE (excluding Aldermore) indicates that the reduction in ROE was largely driven by the decrease in gearing and lower ROA, as illustrated in the table below.
Year ended 30 June
2018 (incl. Aldermore)
2018 (excl. Aldermore) 2017 2016 2015 2014
ROA (%) 1.92 2.03 2.07 2.07 2.12 2.06
Gearing* 12.0 11.2 11.3 11.6 11.6 11.8
ROE (%) 23.0 22.8 23.4 24.0 24.7 24.2
* Gearing = average total assets/average equity.
The following graph provides a high-level summary of the drivers of the returns over time.
15 16 1714
NIR as a % of average assets (including share of profit from associates and joint ventures after tax)
NII as a % of average assets
Impairments as a % of average assets
Operating expenses as a % of average assets
ROA (%)
18 (excl.Aldermore)
ROA ANALYSIS
18 (incl.Aldermore)
8.00
6.00
4.00
2.00
0
(1.00)
(2.00)
(3.00)
(4.00)
(5.00)
3.50 3.41 3.323.30 3.25
3.69 3.943.96 3.89
(3.67) (3.66) (3.70)(3.71) (3.65)
(0.61) (0.68)(0.65) (0.66)
3.05
3.73
(3.47)
(0.62)
3.85
(0.58)
2.12 2.07 2.032.072.06 1.92
Note: The graph shows each item before taxation and non-controlling interests as a percentage of average assets. ROA is calculated as normalised earnings after tax and non-controlling interests as a percentage of average assets.
Performance measurement continued
108 BALANCE SHEET ANALYSIS AND FINANCIAL RESOURCE MANAGEMENT
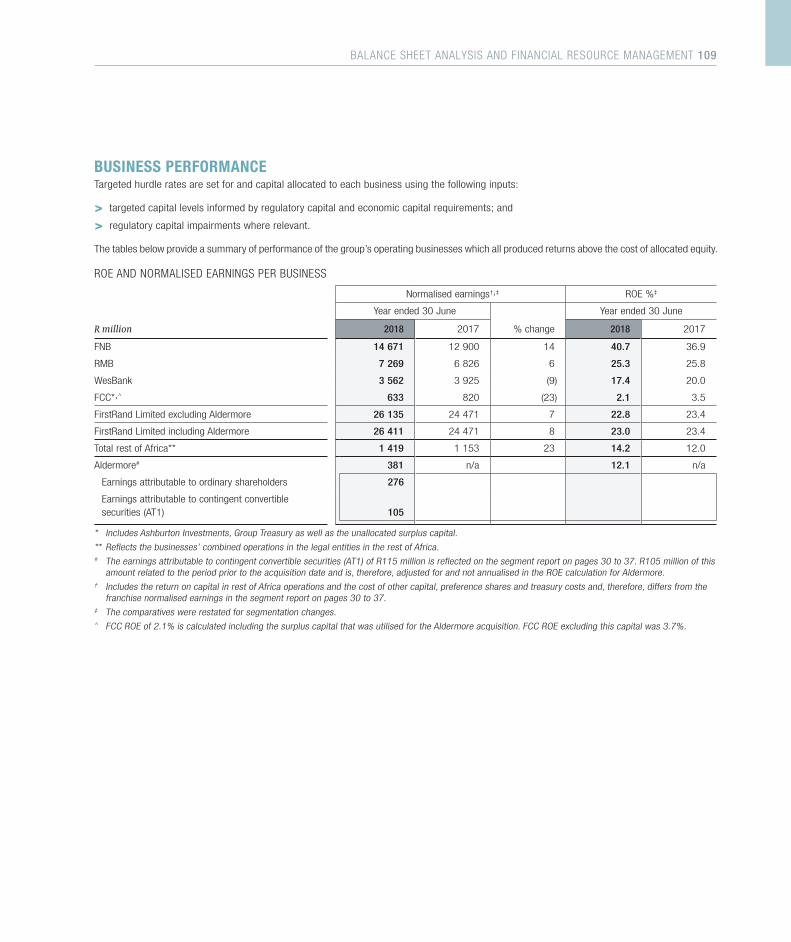
BUSINESS PERFORMANCE Targeted hurdle rates are set for and capital allocated to each business using the following inputs:
> targeted capital levels informed by regulatory capital and economic capital requirements; and
> regulatory capital impairments where relevant.
The tables below provide a summary of performance of the group’s operating businesses which all produced returns above the cost of allocated equity.
ROE AND NORMALISED EARNINGS PER BUSINESS
Normalised earnings†,‡ ROE %‡
Year ended 30 June Year ended 30 June
R million 2018 2017 % change 2018 2017
FNB 14 671 12 900 14 40.7 36.9
RMB 7 269 6 826 6 25.3 25.8
WesBank 3 562 3 925 (9) 17.4 20.0
FCC*,^ 633 820 (23) 2.1 3.5
FirstRand Limited excluding Aldermore 26 135 24 471 7 22.8 23.4
FirstRand Limited including Aldermore 26 411 24 471 8 23.0 23.4
Total rest of Africa** 1 419 1 153 23 14.2 12.0
Aldermore# 381 n/a 12.1 n/a
Earnings attributable to ordinary shareholders 276
Earnings attributable to contingent convertible securities (AT1) 105
* Includes Ashburton Investments, Group Treasury as well as the unallocated surplus capital.
** Reflects the businesses’ combined operations in the legal entities in the rest of Africa.# The earnings attributable to contingent convertible securities (AT1) of R115 million is reflected on the segment report on pages 30 to 37. R105 million of this
amount related to the period prior to the acquisition date and is, therefore, adjusted for and not annualised in the ROE calculation for Aldermore.† Includes the return on capital in rest of Africa operations and the cost of other capital, preference shares and treasury costs and, therefore, differs from the
franchise normalised earnings in the segment report on pages 30 to 37. ‡ The comparatives were restated for segmentation changes.^ FCC ROE of 2.1% is calculated including the surplus capital that was utilised for the Aldermore acquisition. FCC ROE excluding this capital was 3.7%.
BALANCE SHEET ANALYSIS AND FINANCIAL RESOURCE MANAGEMENT 109
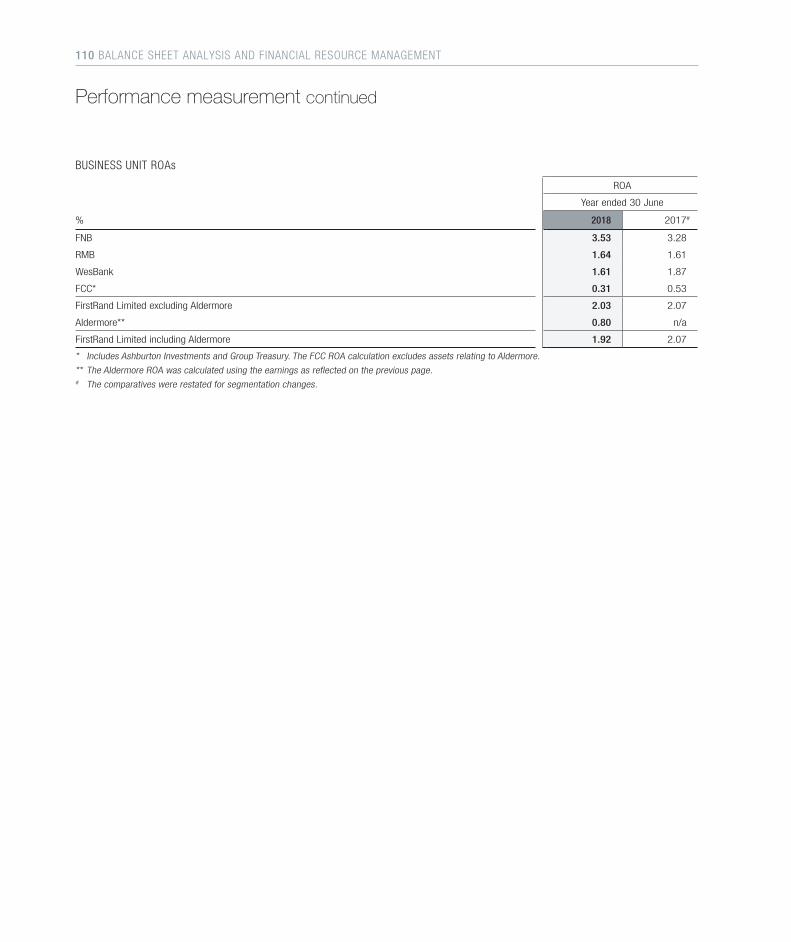
BUSINESS UNIT ROAs
ROA
Year ended 30 June
% 2018 2017#
FNB 3.53 3.28
RMB 1.64 1.61
WesBank 1.61 1.87
FCC* 0.31 0.53
FirstRand Limited excluding Aldermore 2.03 2.07
Aldermore** 0.80 n/a
FirstRand Limited including Aldermore 1.92 2.07
* Includes Ashburton Investments and Group Treasury. The FCC ROA calculation excludes assets relating to Aldermore.
** The Aldermore ROA was calculated using the earnings as reflected on the previous page. # The comparatives were restated for segmentation changes.
Performance measurement continued
110 BALANCE SHEET ANALYSIS AND FINANCIAL RESOURCE MANAGEMENT
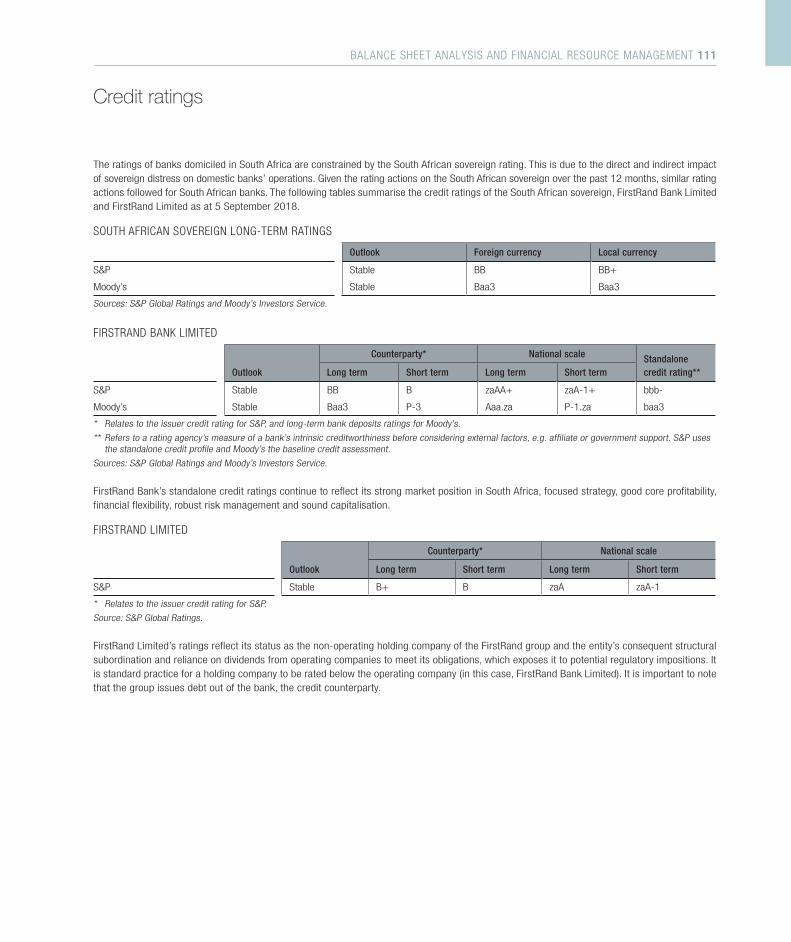
The ratings of banks domiciled in South Africa are constrained by the South African sovereign rating. This is due to the direct and indirect impact of sovereign distress on domestic banks’ operations. Given the rating actions on the South African sovereign over the past 12 months, similar rating actions followed for South African banks. The following tables summarise the credit ratings of the South African sovereign, FirstRand Bank Limited and FirstRand Limited as at 5 September 2018.
SOUTH AFRICAN SOVEREIGN LONG-TERM RATINGS
Outlook Foreign currency Local currency
S&P Stable BB BB+
Moody’s Stable Baa3 Baa3
Sources: S&P Global Ratings and Moody’s Investors Service.
FIRSTRAND BANK LIMITED
Outlook
Counterparty* National scale Standalone credit rating**Long term Short term Long term Short term
S&P Stable BB B zaAA+ zaA-1+ bbb-
Moody’s Stable Baa3 P-3 Aaa.za P-1.za baa3
* Relates to the issuer credit rating for S&P, and long-term bank deposits ratings for Moody’s.
** Refers to a rating agency’s measure of a bank’s intrinsic creditworthiness before considering external factors, e.g. affiliate or government support. S&P uses the standalone credit profile and Moody’s the baseline credit assessment.
Sources: S&P Global Ratings and Moody’s Investors Service.
FirstRand Bank’s standalone credit ratings continue to reflect its strong market position in South Africa, focused strategy, good core profitability, financial flexibility, robust risk management and sound capitalisation.
FIRSTRAND LIMITED
Outlook
Counterparty* National scale
Long term Short term Long term Short term
S&P Stable B+ B zaA zaA-1
* Relates to the issuer credit rating for S&P.
Source: S&P Global Ratings.
FirstRand Limited’s ratings reflect its status as the non-operating holding company of the FirstRand group and the entity’s consequent structural subordination and reliance on dividends from operating companies to meet its obligations, which exposes it to potential regulatory impositions. It is standard practice for a holding company to be rated below the operating company (in this case, FirstRand Bank Limited). It is important to note that the group issues debt out of the bank, the credit counterparty.
Credit ratings
BALANCE SHEET ANALYSIS AND FINANCIAL RESOURCE MANAGEMENT 111

IFRSinformation114 – 152
04
BASIS OF PRESENTATIONThe summary consolidated financial statements contained in this Analysis of financial results booklet are prepared in accordance with the JSE Listings Requirements and are derived from a complete set of the consolidated financial statements.
FirstRand prepares its summary consolidated financial results in accordance with:
> the framework concepts and the recognition and measurement requirements of International Financial Reporting Standards (IFRS);
> Financial Reporting Pronouncements as issued by Financial Reporting Standards Council;
> SAICA Financial Reporting Guide as issued by the Accounting Practices Committee;
> IAS 34 Interim Financial Reporting; and
> requirements of the Companies Act, no 71 of 2008, applicable to summary financial statements.
The directors take full responsibility and confirm that this information has been correctly extracted from the annual financial statements from which the summary consolidated financial statements were derived.
ACCOUNTING POLICIES The accounting policies applied in the preparation of the consolidated financial statements from which the summary financial statements were derived, are in terms of IFRS.
The consolidated financial statements, from which these summary consolidated financial statements are extracted, are prepared in accordance with the going concern principle under the historical cost basis as modified by the fair value accounting of certain assets and liabilities where required or permitted by IFRS.
The accounting policies are consistent with those applied for the year ended 30 June 2017. Amendments to IAS 7 and IAS 12 became effective in the current year. These amendments have not had an impact on the group’s reported earnings, financial position or reserves, or on the accounting policies.
The amendments to IAS 7 introduces additional disclosures in the statement of cash flows and notes to the annual financial statements that will enable the users of the financial statements to evaluate changes in liabilities arising from financing activities. This amendment has been applied retrospectively on a voluntary basis and comparative information has been presented in line with the amended disclosure requirements. The amendment to IAS 12 relates to the recognition of a deferred tax asset for unrealised losses on debt instruments that are measured at fair value for accounting purposes but considered at
Presentation
cost for tax purposes. The group is accounting for deferred tax on these assets in line with the amendments and the adoption of these amendments had no impact on the group.
NORMALISED RESULTS The group believes normalised earnings more accurately reflect operational performance. Consequently, headline earnings have been adjusted to take into account non-operational and accounting anomalies, which, in terms of the JSE Listings Requirements, constitute pro forma financial information.
This pro forma financial information, which is the responsibility of the group’s directors, has been prepared for illustrative purposes to more accurately reflect operational performance and because of its nature may not fairly present in terms of IFRS, the group’s financial position, changes in equity, and results of operations or cash flows. Details of the nature of these adjustments and reasons thereof can be found on pages 115 to 116 of this Analysis of financial results booklet. The pro forma financial information should be read in conjunction with the unmodified Deloitte & Touche and PricewaterhouseCoopers Inc. independent reporting accountants’ report, which is available for inspection at the registered office.
AUDITORS’ REPORT The summary consolidated financial statements for the year ended 30 June 2018 contained in this booklet have been audited by Deloitte & Touche and PricewaterhouseCoopers Inc. who expressed an unmodified opinion thereon in terms of ISA 810 (Revised). Refer to page 117.
The auditors also expressed an unmodified opinion on the consolidated financial statements from which the summary consolidated financial statements were derived. Unless the financial information is specifically stated as audited, it should be assumed it is unaudited.
A copy of the auditors’ report on the annual consolidated financial statements is available for inspection at FirstRand’s registered office, 4 Merchant Place, corner Fredman Drive and Rivonia Road, Sandton, together with the consolidated financial statements identified in the respective auditors’ reports.
The auditors’ report does not necessarily report on all of the information contained in these summary consolidated financial statements. Shareholders are, therefore, advised that in order to obtain a full understanding of the nature of the auditors’ engagement they should review the auditors’ report together with the accompanying financial information from the issuer’s registered office.
The forward-looking information has not been commented or reported on by the group’s external auditors. FirstRand’s board of directors take full responsibility for the preparation of this Analysis of financial results booklet.
114 IFRS INFORMATION
DESCRIPTION OF DIFFERENCE BETWEEN NORMALISED AND IFRS RESULTSThe group believes normalised earnings more accurately reflect its economic performance. Headline earnings are adjusted to take into account non-operational items and accounting anomalies.
CO N S O L I DAT E D P R I VAT E E Q U I T Y S U B S I D I A R I E SIn accordance with IFRS, operating costs of consolidated private equity subsidiaries are included in profit or loss as part of operating expenses. When calculating normalised results, these operating costs are reclassified to NIR, where income earned from these entities is included. This presentation of net income earned from consolidated private equity subsidiaries more accurately reflects the underlying economic substance of the group’s relationship with these entities.
F I R S T R A N D S H A R E S H E L D F O R C L I E N T T R A D I N G A C T I V I T I E SThe group invests in FirstRand shares to offset its exposure as a result of client trading positions. Depending on the nature of the client trading position and resulting risks, FirstRand shares may be held long or sold short by the group.
In terms of IAS 32 Financial Instruments: Presentation, FirstRand shares held by the group are deemed to be treasury shares for accounting purposes. For the statement of financial position, the cost price of FirstRand shares held long is deducted from equity and the consideration received from selling FirstRand shares short is added back to equity. All gains and losses on FirstRand shares are reversed to profit or loss.
In addition, one of the group’s joint ventures also holds FirstRand shares for client trading activities. In terms of IAS 32, profits or losses cannot be recognised on an entity’s own equity instruments. The group’s portion of the fair value change in the FirstRand shares is, therefore, deducted from equity-accounted earnings and the carrying value of the investment recognised using the equity-accounted method. The shares held by the joint venture are not deducted from equity.
Changes in the fair value of FirstRand shares and dividends declared on these shares affect the fair value of client trading positions reflected in the statement of financial position, unless the client trading position is itself an equity instrument. The change in the fair value of client trading positions is recognised in profit or loss. However, because of the rules relating to treasury shares the corresponding fair value changes (or the group’s portion of the fair value changes) in the FirstRand shares held to match client trading positions are reversed or eliminated. This results in a mismatch in the overall equity and profit or loss of the group.
For purposes of calculating normalised results, the adjustments described above are reversed and FirstRand shares held for client trading positions are treated as issued to parties external to the group.
Where the client trading position is itself an equity instrument, then neither gains nor losses on client trading positions or FirstRand shares held to hedge these are reflected in profit or loss or on the statement of financial position.
M A RG I N- R E L AT E D I T E M S I N C L U D E D I N FA I R VA L U E I N CO M E In terms of IFRS the group is required to or has elected to measure certain financial assets and liabilities at fair value through profit or loss. In terms of the group’s IFRS accounting policies, the gains or losses on these assets and liabilities are included in fair value income within NIR. This results in NIR including gains or losses that are related to lending, borrowing and economic interest rate hedges. In order to reflect the economic substance of these amounts, the amount of fair value income that relates to margin is presented in NII in the normalised results.
The amount reclassified from NIR to NII includes the following items:
> The margin on the wholesale advances book in RMB;
> Fair value gains on derivatives that are used as interest rate hedges but which do not qualify for hedge accounting; and
> Currency translations and associated costs inherent to the dollar funding and liquidity pool.
C L A S S I F I C AT I O N O F I M PA I R M E N T O N R E S T RU C T U R E D A DVA N C E Included in gross advances and impairment of advances is an amount in respect of an advance that was restructured to an equity investment. The restructure resulted in the group having significant influence over the counterparty and an investment in an associate was recognised. The group believes that the circumstances that led to the impairment arose prior to the restructure. For normalised reporting, therefore, the group retained the gross advance and impairment. This amount is classified in advances rather than investments in associates as this more accurately reflects the economic nature of the transaction.
I A S 19 R E M E A S U R E M E N T O F P L A N A S S E T S In terms of IAS 19 Employee Benefits, interest income is recognised on the plan assets and set off against staff costs in the income statement. All other re-measurements of plan assets are recognised in other comprehensive income. In instances where the plan asset is a qualifying insurance policy, which has a limit of indemnity, the fair
IFRS INFORMATION 115
value of the plan asset is limited to that limit of indemnity. The limit of indemnity continually reduces as payments are made in terms of the insurance policy. After the recognition of interest income on the plan asset, any further adjustment required to revalue the plan asset to the limit of indemnity is recognised in other comprehensive income. To the extent, therefore, that interest income on plan assets results in an increase in the fair value of the plan asset above the limit of indemnity, a downward fair value measurement is recognised in other comprehensive income. Economically, the value of the plan asset has simply reduced with claims paid. Normalised results are adjusted to reflect this by increasing staff costs for the value of the interest on the plan assets and increasing other comprehensive income.
R E A L I S AT I O N O N T H E S A L E O F P R I VAT E E Q U I T Y S U B S I D I A R I E SIn terms of Circular 4/2018 Headline Earnings, gains or losses from the sale of subsidiaries are excluded from headline earnings.
The circular includes specific industry rules. Rule 1 allows entities to include in headline earnings gains or losses associated with private equity investments that are associates or joint ventures, which form part of trading or operating activities. This exclusion, however, does not apply to gains or losses associated with private equity investments that are subsidiaries. The group includes gains or losses on the sale of private equity subsidiaries in normalised results to reflect the nature of these investments.
Presentation continued
C A S H- S E T T L E D S H A R E- B A S E D PAY M E N T S A N D T H E E CO N O M I C H E D G EThe group entered into a total return swap (TRS) with external parties to economically hedge itself against the exposure to changes in the FirstRand share price associated with the group’s share schemes.
In terms of IAS 39 Financial Instruments: Recognition and Measurement, the TRS is accounted for as a derivative instrument at fair value with the full fair value change recognised in NIR.
In accordance with IFRS 2 Share-based Payments, the expense resulting from these option schemes is recognised over the vesting period of the schemes. This leads to a mismatch in the recognition of the profit or loss of the hedge and the share-based payment expense.
When calculating normalised results, the group defers the recognition of the fair value gain or loss on the hedging instrument for the specific reporting period to the period in which the IFRS 2 impact will manifest in the group’s results. This reflects the economic substance of the hedge and associated IFRS 2 impact for the group.
In addition, the portion of the share-based payment expense which relates to the re-measurement of the liability arising from changes in the share price is reclassified from operating expenses into NIR in accordance with the economics of the transaction. The share-based payment expense included in operating expenses is equal to the grant date fair value of the awards given.
H E A D L I N E E A R N I N G S A D J U S T M E N T SAll adjustments required by Circular 4/2018 Headline Earnings in calculating headline earnings are included in normalised earnings on a line-by-line basis based on the nature of the adjustment.
The description and the amount of these adjustments are provided in the reconciliation between headline earnings and IFRS profit on page 124.
116 IFRS INFORMATION
TO THE SHAREHOLDERS OF FIRSTRAND LIMITED O P I N I O NThe summary consolidated financial statements of FirstRand Limited, set out on pages 118 to 152, indicated as such and contained in the accompanying analysis of financial results, which comprise the summary consolidated statement of financial position as at 30 June 2018, the summary consolidated income statement, the summary consolidated statements of other comprehensive income, changes in equity and cash flows for the year then ended, and related notes, are derived from the audited consolidated financial statements of FirstRand Limited for the year ended 30 June 2018.
In our opinion, the accompanying summary consolidated financial statements are consistent, in all material respects, with the audited consolidated financial statements, in accordance with the requirements of the JSE Limited’s (JSE) Listings Requirements for provisional reports, set out in the basis of presentation to the summary consolidated financial statements, and the requirements of the Companies Act of South Africa as applicable to summary financial statements.
S U M M A RY CO N S O L I DAT E D F I N A N C I A L S TAT E M E N T SThe summary consolidated financial statements do not contain all the disclosures required by the International Financial Reporting Standards and the requirements of the Companies Act of South Africa as applicable to annual financial statements. Reading the summary consolidated financial statements and the auditors’ report thereon, therefore, is not a substitute for reading the audited consolidated financial statements and the auditors’ report thereon.
T H E AU D I T E D CO N S O L I DAT E D F I N A N C I A L S TAT E M E N T S A N D O U R R E P O RT T H E R E O NWe expressed an unmodified audit opinion on the audited consolidated financial statements in our report dated 5 September 2018. That report also includes the communication of key audit matters. Key audit matters are those matters that, in our professional judgement, were of most significance in our audit of the consolidated financial statements of the current period.
D I R E C T O R S’ R E S P O N S I B I L I T Y F O R T H E S U M M A RY CO N S O L I DAT E D F I N A N C I A L S TAT E M E N T SThe directors are responsible for the preparation of the summary consolidated financial statements in accordance with the requirements of the JSE Listings Requirements for provisional reports, set out in the basis of presentation to the summary consolidated financial statements, and the requirements of the Companies Act of South Africa as applicable to summary financial statements.
AU D I T O R S’ R E S P O N S I B I L I T YOur responsibility is to express an opinion on whether the summary consolidated financial statements are consistent, in all material respects, with the audited consolidated financial statements based on our procedures, which were conducted in accordance with International Standard on Auditing (ISA) 810 (Revised), Engagements to Report on Summary Financial Statements.
Deloitte & Touche PricewaterhouseCoopers Inc.Registered auditor Registered auditorPer partner: Darren Shipp Director: Francois Prinsloo
Woodlands Office Park 4 Lisbon laneJohannesburg Johannesburg5 September 2018 5 September 2018
Independent auditors’ report on summary consolidated financial statements
IFRS INFORMATION 117
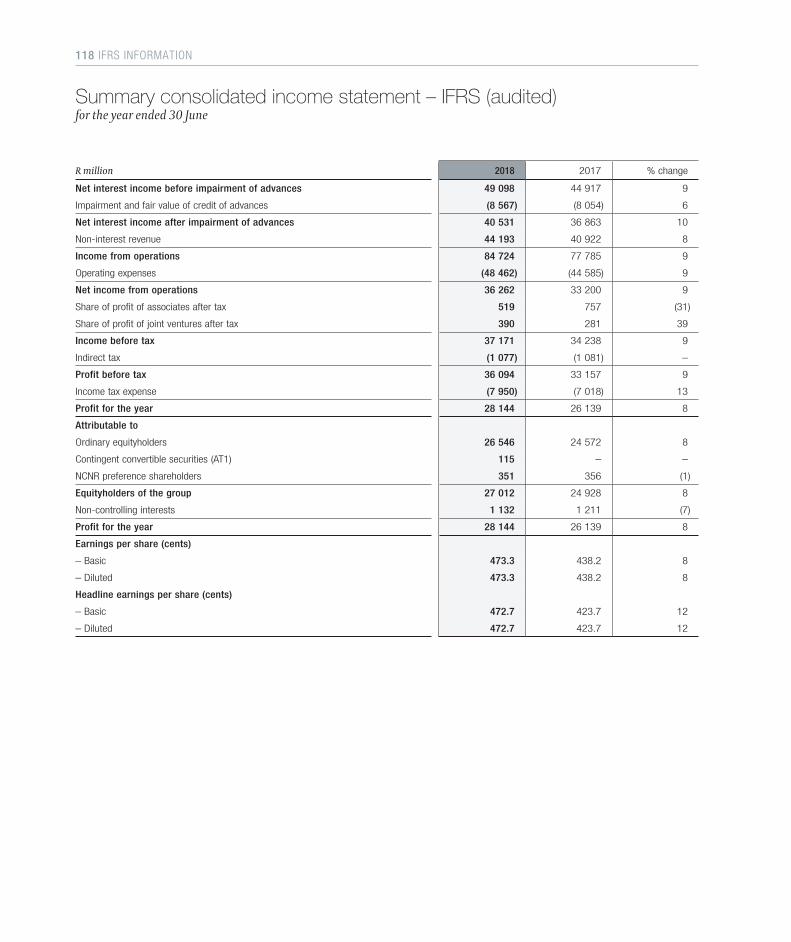
R million 2018 2017 % change
Net interest income before impairment of advances 49 098 44 917 9
Impairment and fair value of credit of advances (8 567) (8 054) 6
Net interest income after impairment of advances 40 531 36 863 10
Non-interest revenue 44 193 40 922 8
Income from operations 84 724 77 785 9
Operating expenses (48 462) (44 585) 9
Net income from operations 36 262 33 200 9
Share of profit of associates after tax 519 757 (31)
Share of profit of joint ventures after tax 390 281 39
Income before tax 37 171 34 238 9
Indirect tax (1 077) (1 081) –
Profit before tax 36 094 33 157 9
Income tax expense (7 950) (7 018) 13
Profit for the year 28 144 26 139 8
Attributable to
Ordinary equityholders 26 546 24 572 8
Contingent convertible securities (AT1) 115 – –
NCNR preference shareholders 351 356 (1)
Equityholders of the group 27 012 24 928 8
Non-controlling interests 1 132 1 211 (7)
Profit for the year 28 144 26 139 8
Earnings per share (cents)
– Basic 473.3 438.2 8
– Diluted 473.3 438.2 8
Headline earnings per share (cents)
– Basic 472.7 423.7 12
– Diluted 472.7 423.7 12
Summary consolidated income statement – IFRS (audited)for the year ended 30 June
118 IFRS INFORMATION
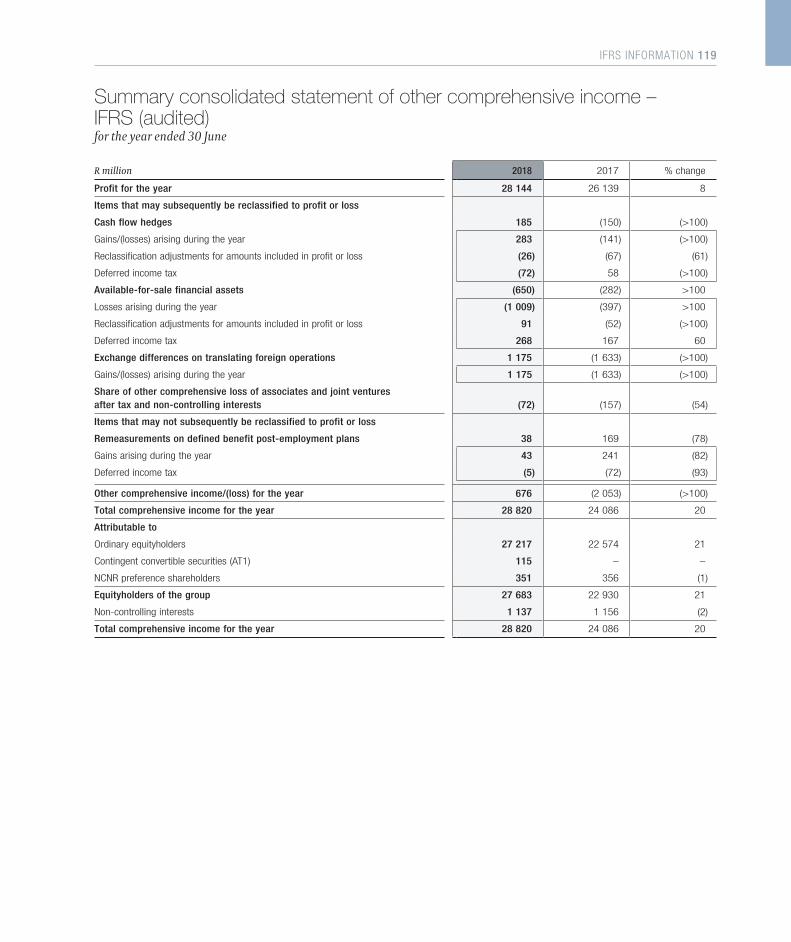
R million 2018 2017 % change
Profit for the year 28 144 26 139 8
Items that may subsequently be reclassified to profit or loss
Cash flow hedges 185 (150) (>100)
Gains/(losses) arising during the year 283 (141) (>100)
Reclassification adjustments for amounts included in profit or loss (26) (67) (61)
Deferred income tax (72) 58 (>100)
Available-for-sale financial assets (650) (282) >100
Losses arising during the year (1 009) (397) >100
Reclassification adjustments for amounts included in profit or loss 91 (52) (>100)
Deferred income tax 268 167 60
Exchange differences on translating foreign operations 1 175 (1 633) (>100)
Gains/(losses) arising during the year 1 175 (1 633) (>100)
Share of other comprehensive loss of associates and joint ventures after tax and non-controlling interests (72) (157) (54)
Items that may not subsequently be reclassified to profit or loss
Remeasurements on defined benefit post-employment plans 38 169 (78)
Gains arising during the year 43 241 (82)
Deferred income tax (5) (72) (93)
Other comprehensive income/(loss) for the year 676 (2 053) (>100)
Total comprehensive income for the year 28 820 24 086 20
Attributable to
Ordinary equityholders 27 217 22 574 21
Contingent convertible securities (AT1) 115 – –
NCNR preference shareholders 351 356 (1)
Equityholders of the group 27 683 22 930 21
Non-controlling interests 1 137 1 156 (2)
Total comprehensive income for the year 28 820 24 086 20
Summary consolidated statement of other comprehensive income – IFRS (audited)for the year ended 30 June
IFRS INFORMATION 119
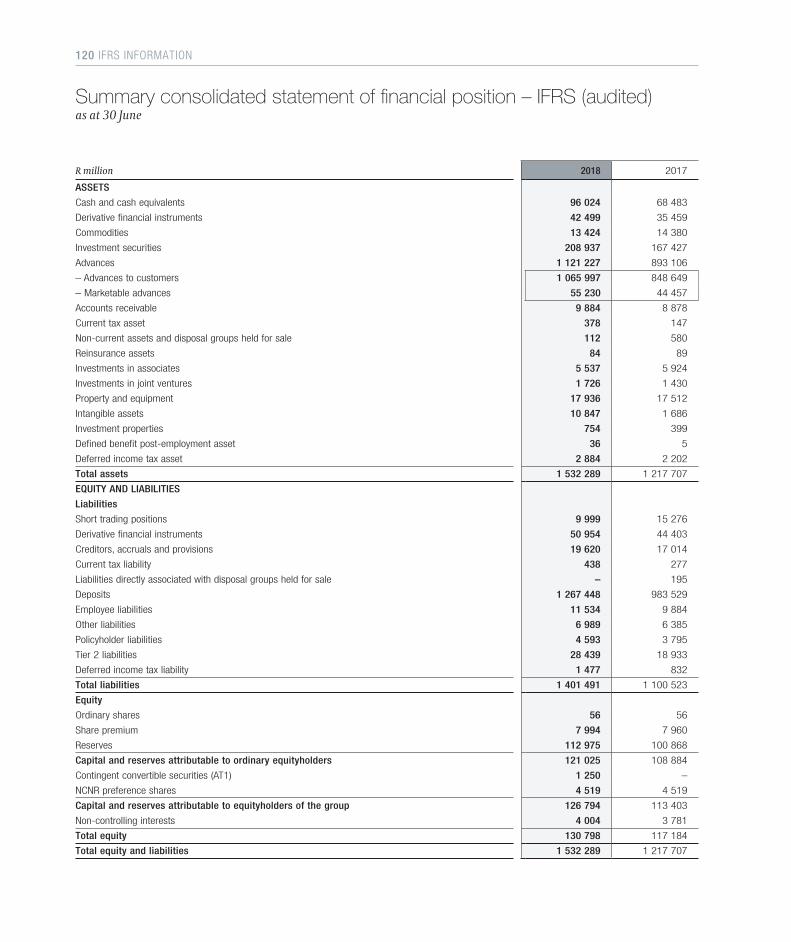
R million 2018 2017
ASSETS
Cash and cash equivalents 96 024 68 483
Derivative financial instruments 42 499 35 459
Commodities 13 424 14 380
Investment securities 208 937 167 427
Advances 1 121 227 893 106
– Advances to customers 1 065 997 848 649
– Marketable advances 55 230 44 457
Accounts receivable 9 884 8 878
Current tax asset 378 147
Non-current assets and disposal groups held for sale 112 580
Reinsurance assets 84 89
Investments in associates 5 537 5 924
Investments in joint ventures 1 726 1 430
Property and equipment 17 936 17 512
Intangible assets 10 847 1 686
Investment properties 754 399
Defined benefit post-employment asset 36 5
Deferred income tax asset 2 884 2 202
Total assets 1 532 289 1 217 707
EQUITY AND LIABILITIES
Liabilities
Short trading positions 9 999 15 276
Derivative financial instruments 50 954 44 403
Creditors, accruals and provisions 19 620 17 014
Current tax liability 438 277
Liabilities directly associated with disposal groups held for sale – 195
Deposits 1 267 448 983 529
Employee liabilities 11 534 9 884
Other liabilities 6 989 6 385
Policyholder liabilities 4 593 3 795
Tier 2 liabilities 28 439 18 933
Deferred income tax liability 1 477 832
Total liabilities 1 401 491 1 100 523
Equity
Ordinary shares 56 56
Share premium 7 994 7 960
Reserves 112 975 100 868
Capital and reserves attributable to ordinary equityholders 121 025 108 884
Contingent convertible securities (AT1) 1 250 –
NCNR preference shares 4 519 4 519
Capital and reserves attributable to equityholders of the group 126 794 113 403
Non-controlling interests 4 004 3 781
Total equity 130 798 117 184
Total equity and liabilities 1 532 289 1 217 707
Summary consolidated statement of financial position – IFRS (audited)as at 30 June
120 IFRS INFORMATION
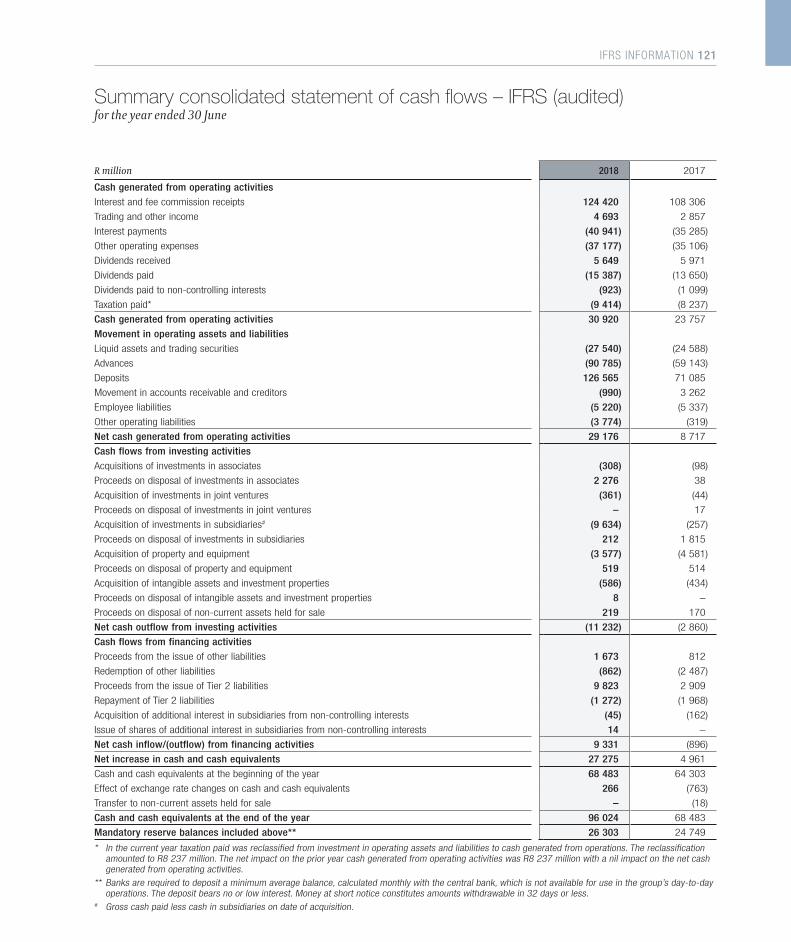
R million 2018 2017
Cash generated from operating activities
Interest and fee commission receipts 124 420 108 306
Trading and other income 4 693 2 857
Interest payments (40 941) (35 285)
Other operating expenses (37 177) (35 106)
Dividends received 5 649 5 971
Dividends paid (15 387) (13 650)
Dividends paid to non-controlling interests (923) (1 099)
Taxation paid* (9 414) (8 237)
Cash generated from operating activities 30 920 23 757
Movement in operating assets and liabilities
Liquid assets and trading securities (27 540) (24 588)
Advances (90 785) (59 143)
Deposits 126 565 71 085
Movement in accounts receivable and creditors (990) 3 262
Employee liabilities (5 220) (5 337)
Other operating liabilities (3 774) (319)
Net cash generated from operating activities 29 176 8 717
Cash flows from investing activities
Acquisitions of investments in associates (308) (98)
Proceeds on disposal of investments in associates 2 276 38
Acquisition of investments in joint ventures (361) (44)
Proceeds on disposal of investments in joint ventures – 17
Acquisition of investments in subsidiaries# (9 634) (257)
Proceeds on disposal of investments in subsidiaries 212 1 815
Acquisition of property and equipment (3 577) (4 581)
Proceeds on disposal of property and equipment 519 514
Acquisition of intangible assets and investment properties (586) (434)
Proceeds on disposal of intangible assets and investment properties 8 –
Proceeds on disposal of non-current assets held for sale 219 170
Net cash outflow from investing activities (11 232) (2 860)
Cash flows from financing activities
Proceeds from the issue of other liabilities 1 673 812
Redemption of other liabilities (862) (2 487)
Proceeds from the issue of Tier 2 liabilities 9 823 2 909
Repayment of Tier 2 liabilities (1 272) (1 968)
Acquisition of additional interest in subsidiaries from non-controlling interests (45) (162)
Issue of shares of additional interest in subsidiaries from non-controlling interests 14 –
Net cash inflow/(outflow) from financing activities 9 331 (896)
Net increase in cash and cash equivalents 27 275 4 961
Cash and cash equivalents at the beginning of the year 68 483 64 303
Effect of exchange rate changes on cash and cash equivalents 266 (763)
Transfer to non-current assets held for sale – (18)
Cash and cash equivalents at the end of the year 96 024 68 483
Mandatory reserve balances included above** 26 303 24 749
* In the current year taxation paid was reclassified from investment in operating assets and liabilities to cash generated from operations. The reclassification amounted to R8 237 million. The net impact on the prior year cash generated from operating activities was R8 237 million with a nil impact on the net cash generated from operating activities.
** Banks are required to deposit a minimum average balance, calculated monthly with the central bank, which is not available for use in the group’s day-to-day operations. The deposit bears no or low interest. Money at short notice constitutes amounts withdrawable in 32 days or less.
# Gross cash paid less cash in subsidiaries on date of acquisition.
Summary consolidated statement of cash flows – IFRS (audited)for the year ended 30 June
IFRS INFORMATION 121
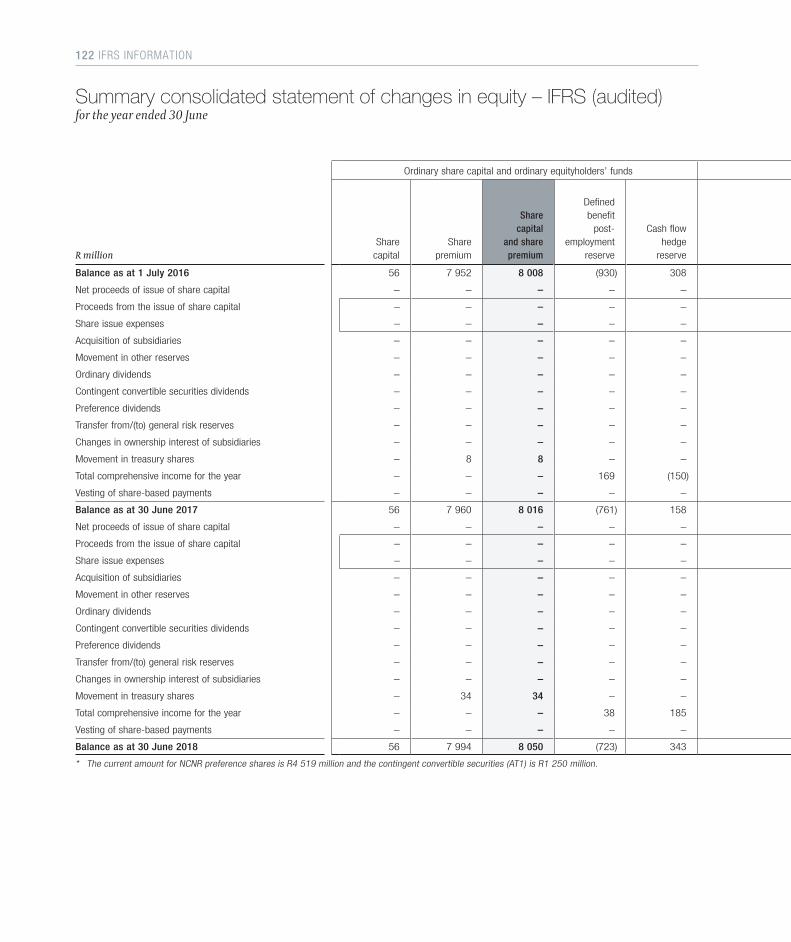
Ordinary share capital and ordinary equityholders’ funds Ordinary share capital and ordinary equityholders’ funds
R millionShare
capitalShare
premium
Sharecapital
and sharepremium
Definedbenefit
post-employment
reserve
Cash flowhedge
reserve
Share-based
paymentreserve
Available-for-salereserve
Foreigncurrency
translationreserve
Otherreserves
Retainedearnings
Reservesattributableto ordinary
equity-holders
NCNRpreferenceshares andcontingentconvertible
securities*
Non-controlling
interestsTotal
equity
Balance as at 1 July 2016 56 7 952 8 008 (930) 308 9 (441) 3 310 374 89 107 91 737 4 519 3 801 108 065
Net proceeds of issue of share capital – – – – – – – – – – – – – –
Proceeds from the issue of share capital – – – – – – – – – – – – – –
Share issue expenses – – – – – – – – – – – – – –
Acquisition of subsidiaries – – – – – – – – – – – – 8 8
Movement in other reserves – – – – – 3 – – 195 (167) 31 – 81 112
Ordinary dividends – – – – – – – – – (13 294) (13 294) – (1 099) (14 393)
Contingent convertible securities dividends – – – – – – – – – – – – – –
Preference dividends – – – – – – – – – – – (356) – (356)
Transfer from/(to) general risk reserves – – – – – – – – 16 (16) – – – –
Changes in ownership interest of subsidiaries – – – – – – – – – (175) (175) – (166) (341)
Movement in treasury shares – 8 8 – – – – – – (8) (8) – – –
Total comprehensive income for the year – – – 169 (150) – (274) (1 620) (123) 24 572 22 574 356 1 156 24 086
Vesting of share-based payments – – – – – (3) – – – 6 3 – – 3
Balance as at 30 June 2017 56 7 960 8 016 (761) 158 9 (715) 1 690 462 100 025 100 868 4 519 3 781 117 184
Net proceeds of issue of share capital – – – – – – – – – – – – 14 14
Proceeds from the issue of share capital – – – – – – – – – – – – 14 14
Share issue expenses – – – – – – – – – – – – – –
Acquisition of subsidiaries – – – – – – – (24) – – (24) 1 250 (22) 1 204
Movement in other reserves – – – – – 7 – – 191 (226) (28) – 12 (16)
Ordinary dividends – – – – – – – – – (14 921) (14 921) – (923) (15 844)
Contingent convertible securities dividends – – – – – – – – – – – (115) – (115)
Preference dividends – – – – – – – – – – – (351) – (351)
Transfer from/(to) general risk reserves – – – – – – – – 18 (18) – – – –
Changes in ownership interest of subsidiaries – – – – – – – – – (139) (139) – 5 (134)
Movement in treasury shares – 34 34 – – – – – – 2 2 – – 36
Total comprehensive income for the year – – – 38 185 – (646) 1 166 (72) 26 546 27 217 466 1 137 28 820
Vesting of share-based payments – – – – – (12) – – – 12 – – – –
Balance as at 30 June 2018 56 7 994 8 050 (723) 343 4 (1 361) 2 832 599 111 281 112 975 5 769 4 004 130 798
* The current amount for NCNR preference shares is R4 519 million and the contingent convertible securities (AT1) is R1 250 million.
Summary consolidated statement of changes in equity – IFRS (audited)for the year ended 30 June
122 IFRS INFORMATION
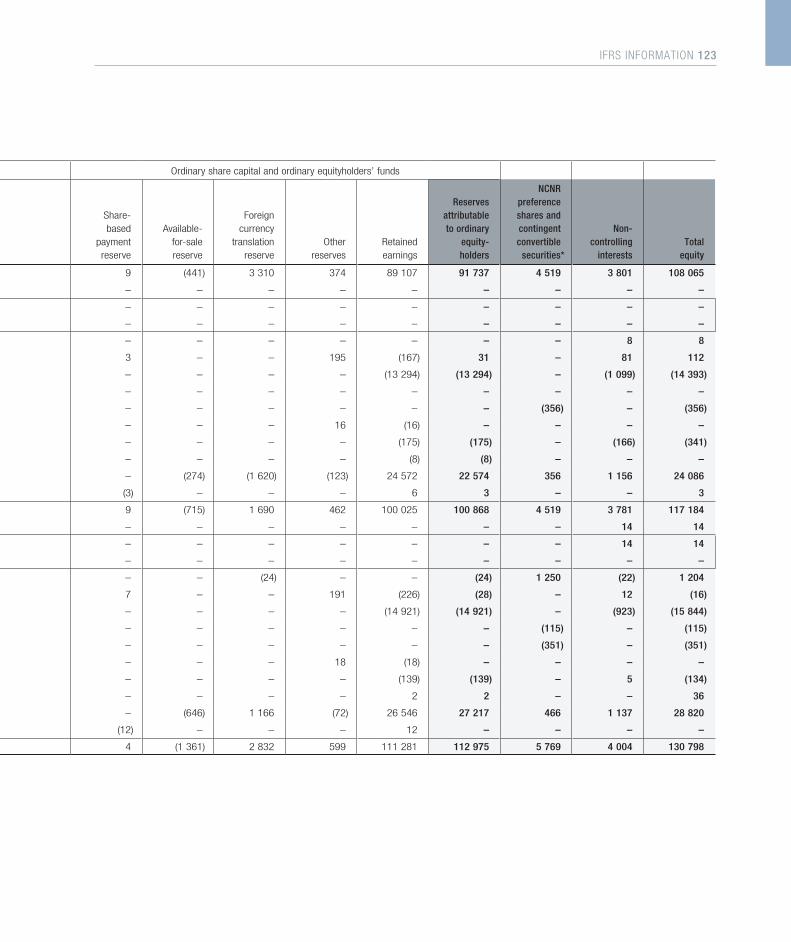
Ordinary share capital and ordinary equityholders’ funds Ordinary share capital and ordinary equityholders’ funds
R millionShare
capitalShare
premium
Sharecapital
and sharepremium
Definedbenefit
post-employment
reserve
Cash flowhedge
reserve
Share-based
paymentreserve
Available-for-salereserve
Foreigncurrency
translationreserve
Otherreserves
Retainedearnings
Reservesattributableto ordinary
equity-holders
NCNRpreferenceshares andcontingentconvertible
securities*
Non-controlling
interestsTotal
equity
Balance as at 1 July 2016 56 7 952 8 008 (930) 308 9 (441) 3 310 374 89 107 91 737 4 519 3 801 108 065
Net proceeds of issue of share capital – – – – – – – – – – – – – –
Proceeds from the issue of share capital – – – – – – – – – – – – – –
Share issue expenses – – – – – – – – – – – – – –
Acquisition of subsidiaries – – – – – – – – – – – – 8 8
Movement in other reserves – – – – – 3 – – 195 (167) 31 – 81 112
Ordinary dividends – – – – – – – – – (13 294) (13 294) – (1 099) (14 393)
Contingent convertible securities dividends – – – – – – – – – – – – – –
Preference dividends – – – – – – – – – – – (356) – (356)
Transfer from/(to) general risk reserves – – – – – – – – 16 (16) – – – –
Changes in ownership interest of subsidiaries – – – – – – – – – (175) (175) – (166) (341)
Movement in treasury shares – 8 8 – – – – – – (8) (8) – – –
Total comprehensive income for the year – – – 169 (150) – (274) (1 620) (123) 24 572 22 574 356 1 156 24 086
Vesting of share-based payments – – – – – (3) – – – 6 3 – – 3
Balance as at 30 June 2017 56 7 960 8 016 (761) 158 9 (715) 1 690 462 100 025 100 868 4 519 3 781 117 184
Net proceeds of issue of share capital – – – – – – – – – – – – 14 14
Proceeds from the issue of share capital – – – – – – – – – – – – 14 14
Share issue expenses – – – – – – – – – – – – – –
Acquisition of subsidiaries – – – – – – – (24) – – (24) 1 250 (22) 1 204
Movement in other reserves – – – – – 7 – – 191 (226) (28) – 12 (16)
Ordinary dividends – – – – – – – – – (14 921) (14 921) – (923) (15 844)
Contingent convertible securities dividends – – – – – – – – – – – (115) – (115)
Preference dividends – – – – – – – – – – – (351) – (351)
Transfer from/(to) general risk reserves – – – – – – – – 18 (18) – – – –
Changes in ownership interest of subsidiaries – – – – – – – – – (139) (139) – 5 (134)
Movement in treasury shares – 34 34 – – – – – – 2 2 – – 36
Total comprehensive income for the year – – – 38 185 – (646) 1 166 (72) 26 546 27 217 466 1 137 28 820
Vesting of share-based payments – – – – – (12) – – – 12 – – – –
Balance as at 30 June 2018 56 7 994 8 050 (723) 343 4 (1 361) 2 832 599 111 281 112 975 5 769 4 004 130 798
* The current amount for NCNR preference shares is R4 519 million and the contingent convertible securities (AT1) is R1 250 million.
IFRS INFORMATION 123
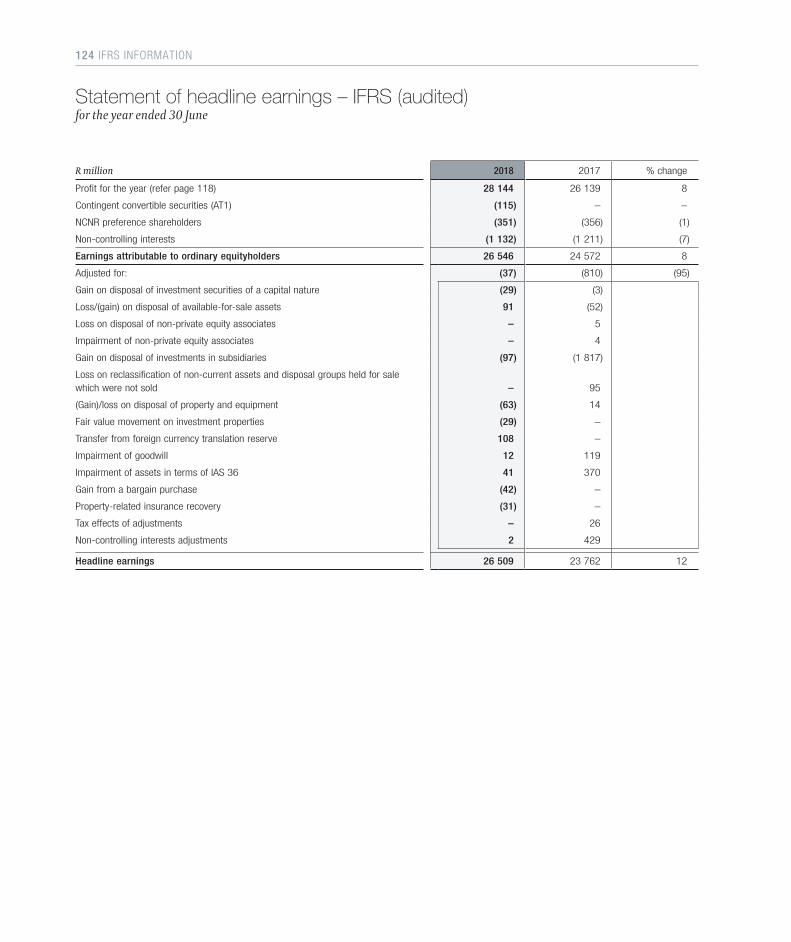
R million 2018 2017 % change
Profit for the year (refer page 118) 28 144 26 139 8
Contingent convertible securities (AT1) (115) – –
NCNR preference shareholders (351) (356) (1)
Non-controlling interests (1 132) (1 211) (7)
Earnings attributable to ordinary equityholders 26 546 24 572 8
Adjusted for: (37) (810) (95)
Gain on disposal of investment securities of a capital nature (29) (3)
Loss/(gain) on disposal of available-for-sale assets 91 (52)
Loss on disposal of non-private equity associates – 5
Impairment of non-private equity associates – 4
Gain on disposal of investments in subsidiaries (97) (1 817)
Loss on reclassification of non-current assets and disposal groups held for sale which were not sold – 95
(Gain)/loss on disposal of property and equipment (63) 14
Fair value movement on investment properties (29) –
Transfer from foreign currency translation reserve 108 –
Impairment of goodwill 12 119
Impairment of assets in terms of IAS 36 41 370
Gain from a bargain purchase (42) –
Property-related insurance recovery (31) –
Tax effects of adjustments – 26
Non-controlling interests adjustments 2 429
Headline earnings 26 509 23 762 12
Statement of headline earnings – IFRS (audited)for the year ended 30 June
124 IFRS INFORMATION
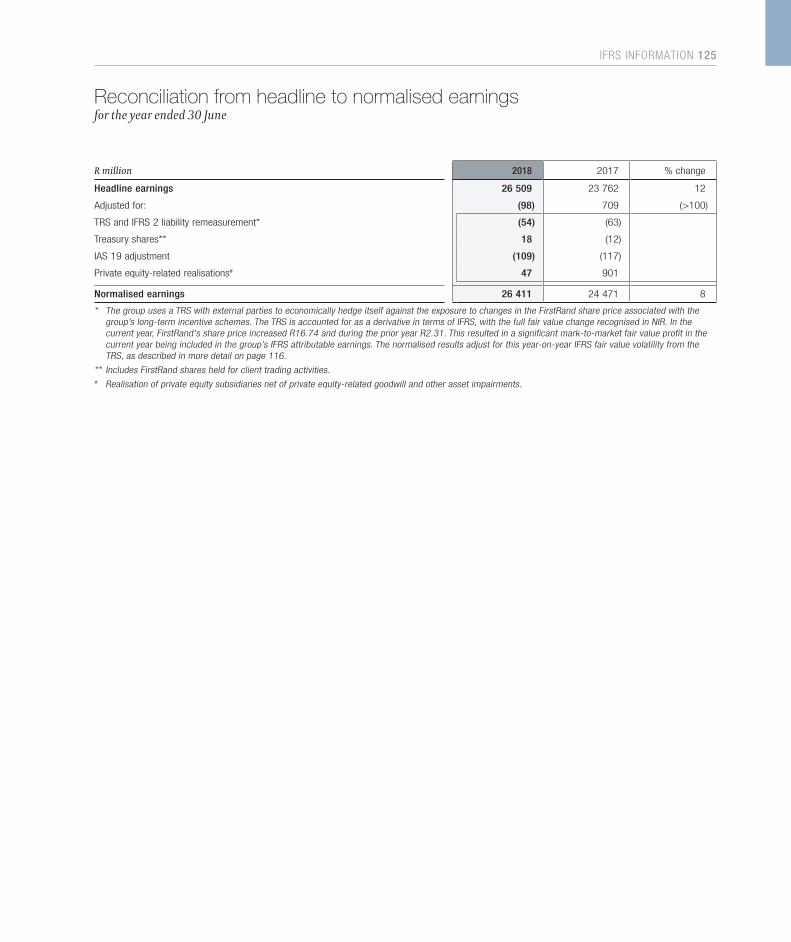
R million 2018 2017 % change
Headline earnings 26 509 23 762 12
Adjusted for: (98) 709 (>100)
TRS and IFRS 2 liability remeasurement* (54) (63)
Treasury shares** 18 (12)
IAS 19 adjustment (109) (117)
Private equity-related realisations# 47 901
Normalised earnings 26 411 24 471 8
* The group uses a TRS with external parties to economically hedge itself against the exposure to changes in the FirstRand share price associated with the group’s long-term incentive schemes. The TRS is accounted for as a derivative in terms of IFRS, with the full fair value change recognised in NIR. In the current year, FirstRand's share price increased R16.74 and during the prior year R2.31. This resulted in a significant mark-to-market fair value profit in the current year being included in the group’s IFRS attributable earnings. The normalised results adjust for this year-on-year IFRS fair value volatility from the TRS, as described in more detail on page 116.
** Includes FirstRand shares held for client trading activities.# Realisation of private equity subsidiaries net of private equity-related goodwill and other asset impairments.
Reconciliation from headline to normalised earnings for the year ended 30 June
IFRS INFORMATION 125
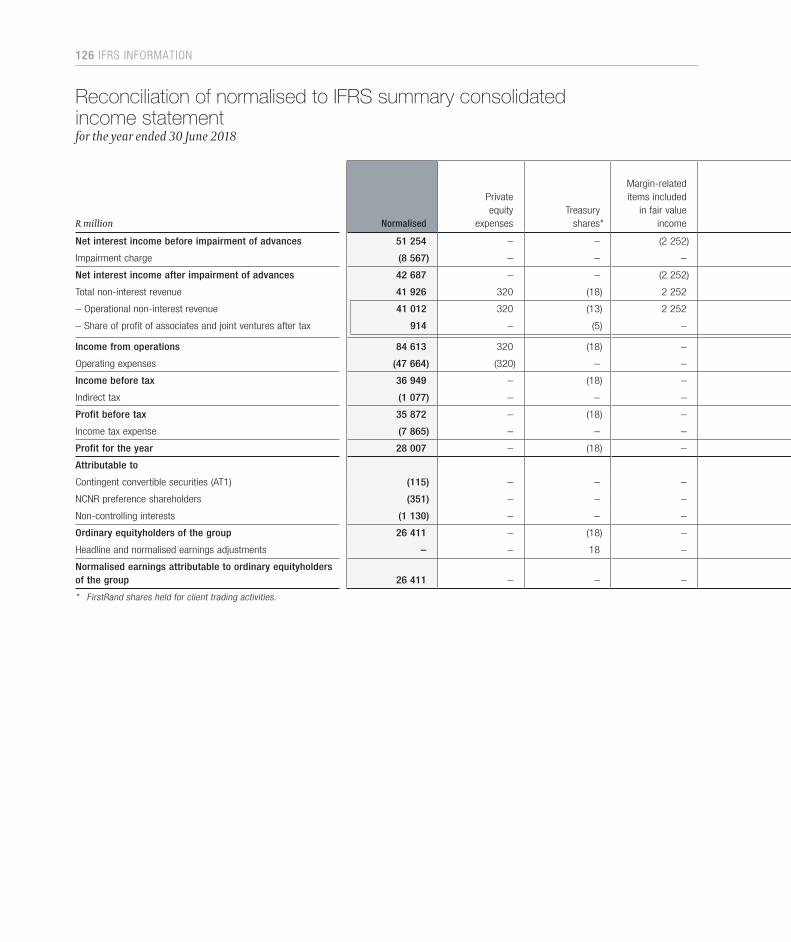
R million Normalised
Privateequity
expensesTreasury
shares*
Margin-relateditems included
in fair valueincome
IAS 19adjustment
Privateequity
subsidiaryrealisations
Otherheadlineearnings
adjustments
TRS andIFRS 2liability
remeasure-ment IFRS
Net interest income before impairment of advances 51 254 – – (2 252) – – – 96 49 098
Impairment charge (8 567) – – – – – – – (8 567)
Net interest income after impairment of advances 42 687 – – (2 252) – – – 96 40 531
Total non-interest revenue 41 926 320 (18) 2 252 – (27) 92 557 45 102
– Operational non-interest revenue 41 012 320 (13) 2 252 – (27) 92 557 44 193
– Share of profit of associates and joint ventures after tax 914 – (5) – – – – – 909
Income from operations 84 613 320 (18) – – (27) 92 653 85 633
Operating expenses (47 664) (320) – – 151 – (53) (576) (48 462)
Income before tax 36 949 – (18) – 151 (27) 39 77 37 171
Indirect tax (1 077) – – – – – – – (1 077)
Profit before tax 35 872 – (18) – 151 (27) 39 77 36 094
Income tax expense (7 865) – – – (42) (20) – (23) (7 950)
Profit for the year 28 007 – (18) – 109 (47) 39 54 28 144
Attributable to
Contingent convertible securities (AT1) (115) – – – – – – – (115)
NCNR preference shareholders (351) – – – – – – – (351)
Non-controlling interests (1 130) – – – – – (2) – (1 132)
Ordinary equityholders of the group 26 411 – (18) – 109 (47) 37 54 26 546
Headline and normalised earnings adjustments – – 18 – (109) 47 (37) (54) (135)
Normalised earnings attributable to ordinary equityholders of the group 26 411 – – – – – – – 26 411
* FirstRand shares held for client trading activities.
Reconciliation of normalised to IFRS summary consolidated income statement for the year ended 30 June 2018
126 IFRS INFORMATION
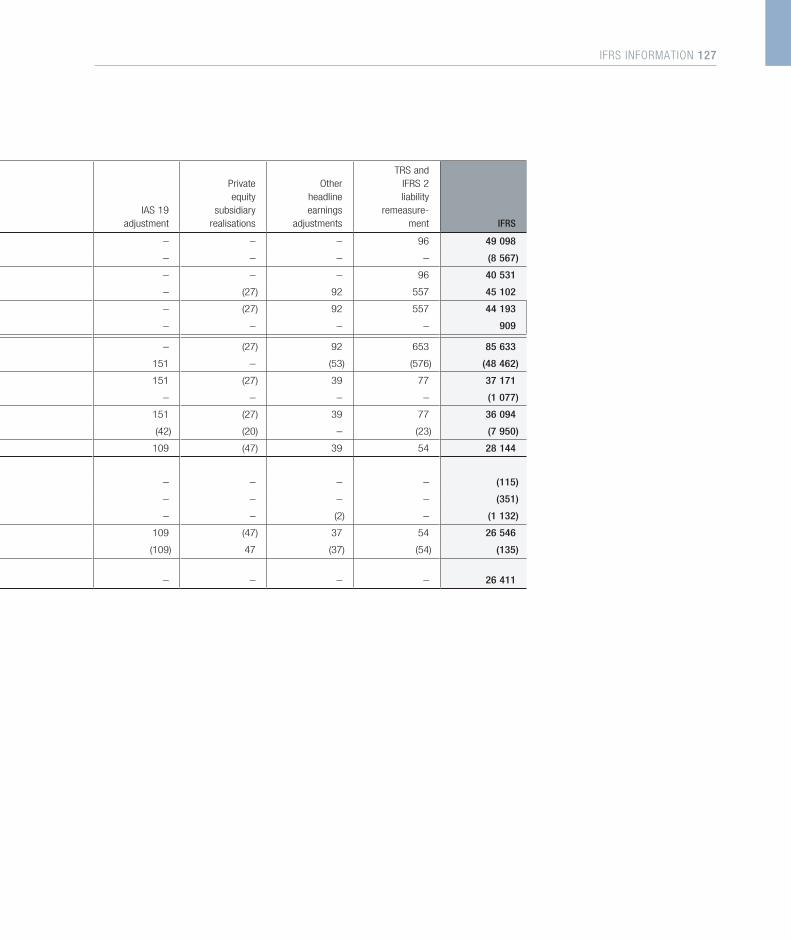
R million Normalised
Privateequity
expensesTreasury
shares*
Margin-relateditems included
in fair valueincome
IAS 19adjustment
Privateequity
subsidiaryrealisations
Otherheadlineearnings
adjustments
TRS andIFRS 2liability
remeasure-ment IFRS
Net interest income before impairment of advances 51 254 – – (2 252) – – – 96 49 098
Impairment charge (8 567) – – – – – – – (8 567)
Net interest income after impairment of advances 42 687 – – (2 252) – – – 96 40 531
Total non-interest revenue 41 926 320 (18) 2 252 – (27) 92 557 45 102
– Operational non-interest revenue 41 012 320 (13) 2 252 – (27) 92 557 44 193
– Share of profit of associates and joint ventures after tax 914 – (5) – – – – – 909
Income from operations 84 613 320 (18) – – (27) 92 653 85 633
Operating expenses (47 664) (320) – – 151 – (53) (576) (48 462)
Income before tax 36 949 – (18) – 151 (27) 39 77 37 171
Indirect tax (1 077) – – – – – – – (1 077)
Profit before tax 35 872 – (18) – 151 (27) 39 77 36 094
Income tax expense (7 865) – – – (42) (20) – (23) (7 950)
Profit for the year 28 007 – (18) – 109 (47) 39 54 28 144
Attributable to
Contingent convertible securities (AT1) (115) – – – – – – – (115)
NCNR preference shareholders (351) – – – – – – – (351)
Non-controlling interests (1 130) – – – – – (2) – (1 132)
Ordinary equityholders of the group 26 411 – (18) – 109 (47) 37 54 26 546
Headline and normalised earnings adjustments – – 18 – (109) 47 (37) (54) (135)
Normalised earnings attributable to ordinary equityholders of the group 26 411 – – – – – – – 26 411
* FirstRand shares held for client trading activities.
IFRS INFORMATION 127

R million Normalised
Privateequity
expensesTreasury
shares*
Margin-relateditems included
in fair valueincome
IAS 19adjustment
Privateequity
subsidiaryrealisations
Otherheadlineearnings
adjustments
TRS andIFRS 2liability
remeasure-ment IFRS
Net interest income before impairment of advances 46 626 – – (1 796) – – – 87 44 917
Impairment charge (8 054) – – – – – – – (8 054)
Net interest income after impairment of advances 38 572 – – (1 796) – – – 87 36 863
Total non-interest revenue 39 268 745 12 1 796 – (1 788) 1 849 78 41 960
– Operational non-interest revenue 38 227 745 11 1 796 – (1 788) 1 853 78 40 922
– Share of profit of associates and joint ventures after tax 1 041 – 1 – – – (4) – 1 038
Income from operations 77 840 745 12 – – (1 788) 1 849 165 78 823
Operating expenses (43 773) (314) – – 163 – (584) (77) (44 585)
Income before tax 34 067 431 12 – 163 (1 788) 1 265 88 34 238
Indirect tax (1 081) – – – – – – – (1 081)
Profit before tax 32 986 431 12 – 163 (1 788) 1 265 88 33 157
Income tax expense (6 951) – – – (46) 30 (26) (25) (7 018)
Profit for the year 26 035 431 12 – 117 (1 758) 1 239 63 26 139
Attributable to
Contingent convertible securities (AT1) – – – – – – – – –
NCNR preference shareholders (356) – – – – – – – (356)
Non-controlling interests (1 208) – – – – 426 (429) – (1 211)
Ordinary equityholders of the group 24 471 431 12 – 117 (1 332) 810 63 24 572
Headline and normalised earnings adjustments – (431)** (12) – (117) 1 332 (810) (63) (101)
Normalised earnings attributable to ordinary equityholders of the group 24 471 – – – – – – – 24 471
* FirstRand shares held for client trading activities.
** Private equity-related goodwill and other assessment impairments.
Reconciliation of normalised to IFRS summary consolidated income statement for the year ended 30 June 2017
128 IFRS INFORMATION

R million Normalised
Privateequity
expensesTreasury
shares*
Margin-relateditems included
in fair valueincome
IAS 19adjustment
Privateequity
subsidiaryrealisations
Otherheadlineearnings
adjustments
TRS andIFRS 2liability
remeasure-ment IFRS
Net interest income before impairment of advances 46 626 – – (1 796) – – – 87 44 917
Impairment charge (8 054) – – – – – – – (8 054)
Net interest income after impairment of advances 38 572 – – (1 796) – – – 87 36 863
Total non-interest revenue 39 268 745 12 1 796 – (1 788) 1 849 78 41 960
– Operational non-interest revenue 38 227 745 11 1 796 – (1 788) 1 853 78 40 922
– Share of profit of associates and joint ventures after tax 1 041 – 1 – – – (4) – 1 038
Income from operations 77 840 745 12 – – (1 788) 1 849 165 78 823
Operating expenses (43 773) (314) – – 163 – (584) (77) (44 585)
Income before tax 34 067 431 12 – 163 (1 788) 1 265 88 34 238
Indirect tax (1 081) – – – – – – – (1 081)
Profit before tax 32 986 431 12 – 163 (1 788) 1 265 88 33 157
Income tax expense (6 951) – – – (46) 30 (26) (25) (7 018)
Profit for the year 26 035 431 12 – 117 (1 758) 1 239 63 26 139
Attributable to
Contingent convertible securities (AT1) – – – – – – – – –
NCNR preference shareholders (356) – – – – – – – (356)
Non-controlling interests (1 208) – – – – 426 (429) – (1 211)
Ordinary equityholders of the group 24 471 431 12 – 117 (1 332) 810 63 24 572
Headline and normalised earnings adjustments – (431)** (12) – (117) 1 332 (810) (63) (101)
Normalised earnings attributable to ordinary equityholders of the group 24 471 – – – – – – – 24 471
* FirstRand shares held for client trading activities.
** Private equity-related goodwill and other assessment impairments.
IFRS INFORMATION 129
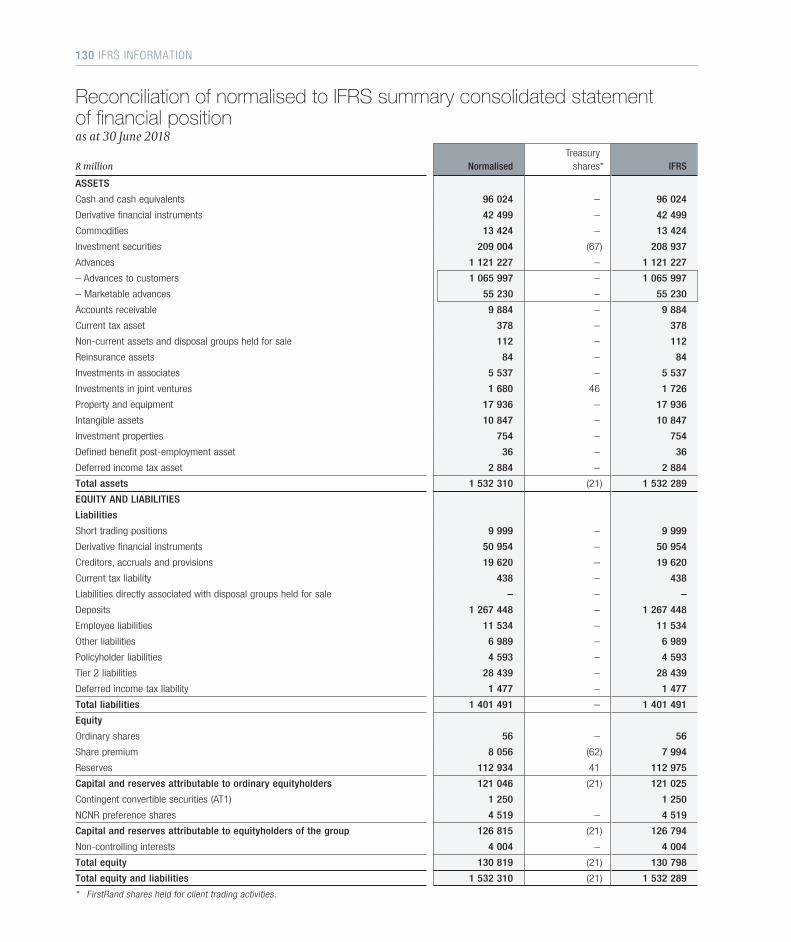
R million NormalisedTreasury
shares* IFRS
ASSETS
Cash and cash equivalents 96 024 – 96 024
Derivative financial instruments 42 499 – 42 499
Commodities 13 424 – 13 424
Investment securities 209 004 (67) 208 937
Advances 1 121 227 – 1 121 227
– Advances to customers 1 065 997 – 1 065 997
– Marketable advances 55 230 – 55 230
Accounts receivable 9 884 – 9 884
Current tax asset 378 – 378
Non-current assets and disposal groups held for sale 112 – 112
Reinsurance assets 84 – 84
Investments in associates 5 537 – 5 537
Investments in joint ventures 1 680 46 1 726
Property and equipment 17 936 – 17 936
Intangible assets 10 847 – 10 847
Investment properties 754 – 754
Defined benefit post-employment asset 36 – 36
Deferred income tax asset 2 884 – 2 884
Total assets 1 532 310 (21) 1 532 289
EQUITY AND LIABILITIES
Liabilities
Short trading positions 9 999 – 9 999
Derivative financial instruments 50 954 – 50 954
Creditors, accruals and provisions 19 620 – 19 620
Current tax liability 438 – 438
Liabilities directly associated with disposal groups held for sale – – –
Deposits 1 267 448 – 1 267 448
Employee liabilities 11 534 – 11 534
Other liabilities 6 989 – 6 989
Policyholder liabilities 4 593 – 4 593
Tier 2 liabilities 28 439 – 28 439
Deferred income tax liability 1 477 – 1 477
Total liabilities 1 401 491 – 1 401 491
Equity
Ordinary shares 56 – 56
Share premium 8 056 (62) 7 994
Reserves 112 934 41 112 975
Capital and reserves attributable to ordinary equityholders 121 046 (21) 121 025
Contingent convertible securities (AT1) 1 250 1 250
NCNR preference shares 4 519 – 4 519
Capital and reserves attributable to equityholders of the group 126 815 (21) 126 794
Non-controlling interests 4 004 – 4 004
Total equity 130 819 (21) 130 798
Total equity and liabilities 1 532 310 (21) 1 532 289
* FirstRand shares held for client trading activities.
Reconciliation of normalised to IFRS summary consolidated statement of financial position as at 30 June 2018
130 IFRS INFORMATION
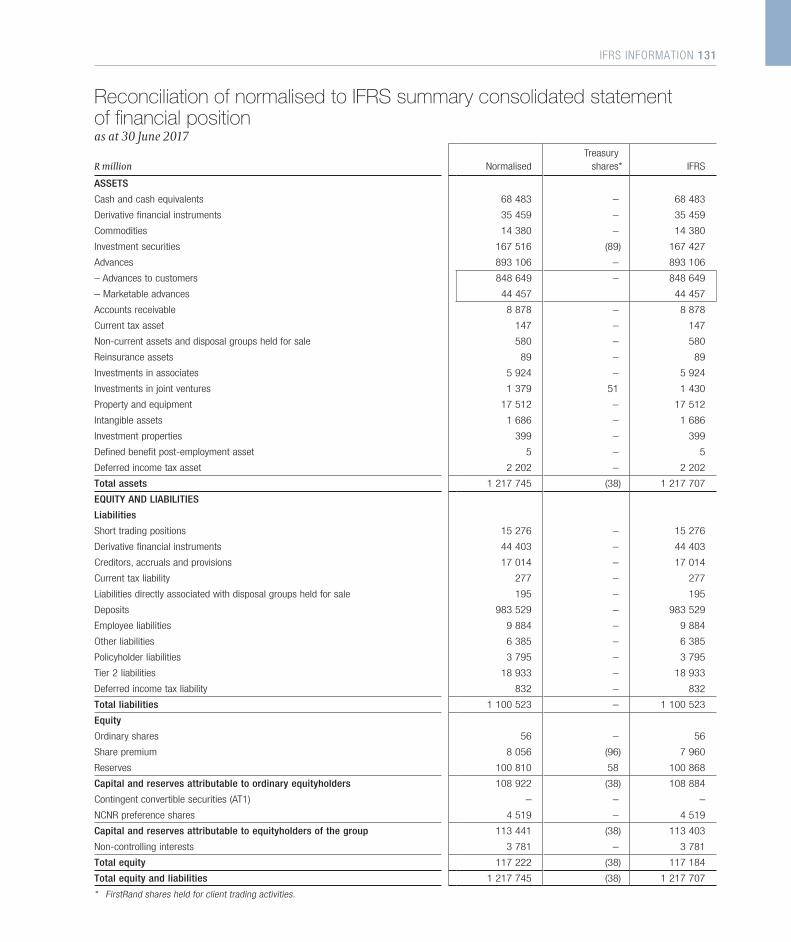
R million NormalisedTreasury
shares* IFRS
ASSETS
Cash and cash equivalents 68 483 – 68 483
Derivative financial instruments 35 459 – 35 459
Commodities 14 380 – 14 380
Investment securities 167 516 (89) 167 427
Advances 893 106 – 893 106
– Advances to customers 848 649 – 848 649
– Marketable advances 44 457 44 457
Accounts receivable 8 878 – 8 878
Current tax asset 147 – 147
Non-current assets and disposal groups held for sale 580 – 580
Reinsurance assets 89 – 89
Investments in associates 5 924 – 5 924
Investments in joint ventures 1 379 51 1 430
Property and equipment 17 512 – 17 512
Intangible assets 1 686 – 1 686
Investment properties 399 – 399
Defined benefit post-employment asset 5 – 5
Deferred income tax asset 2 202 – 2 202
Total assets 1 217 745 (38) 1 217 707
EQUITY AND LIABILITIES
Liabilities
Short trading positions 15 276 – 15 276
Derivative financial instruments 44 403 – 44 403
Creditors, accruals and provisions 17 014 – 17 014
Current tax liability 277 – 277
Liabilities directly associated with disposal groups held for sale 195 – 195
Deposits 983 529 – 983 529
Employee liabilities 9 884 – 9 884
Other liabilities 6 385 – 6 385
Policyholder liabilities 3 795 – 3 795
Tier 2 liabilities 18 933 – 18 933
Deferred income tax liability 832 – 832
Total liabilities 1 100 523 – 1 100 523
Equity
Ordinary shares 56 – 56
Share premium 8 056 (96) 7 960
Reserves 100 810 58 100 868
Capital and reserves attributable to ordinary equityholders 108 922 (38) 108 884
Contingent convertible securities (AT1) – – –
NCNR preference shares 4 519 – 4 519
Capital and reserves attributable to equityholders of the group 113 441 (38) 113 403
Non-controlling interests 3 781 – 3 781
Total equity 117 222 (38) 117 184
Total equity and liabilities 1 217 745 (38) 1 217 707
* FirstRand shares held for client trading activities.
Reconciliation of normalised to IFRS summary consolidated statement of financial position as at 30 June 2017
IFRS INFORMATION 131
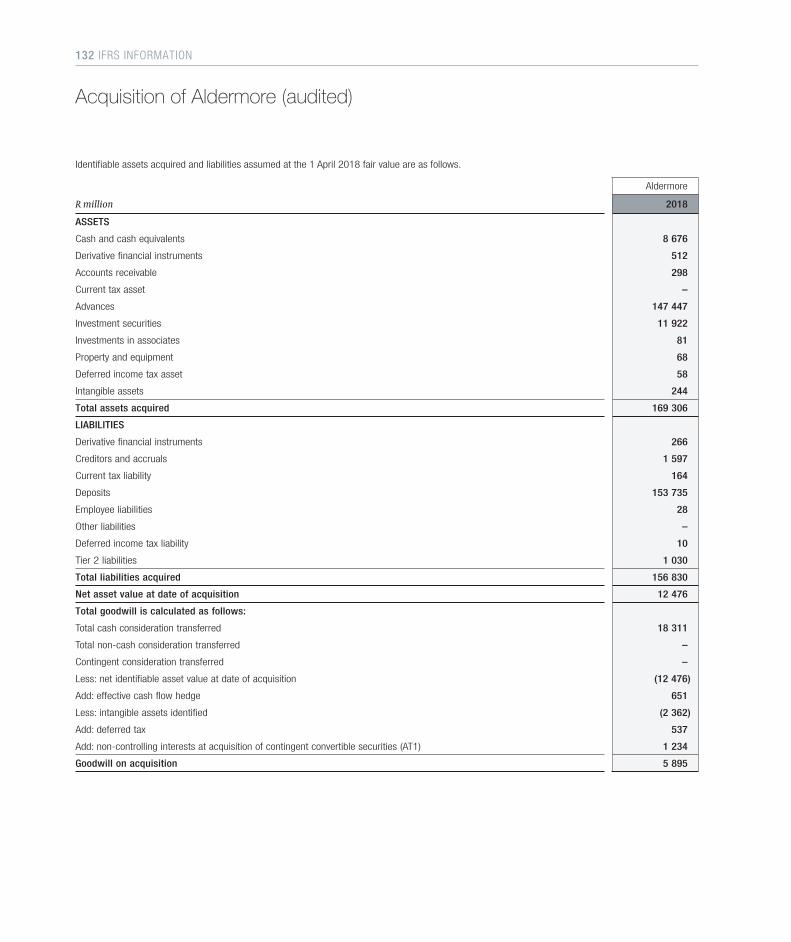
Acquisition of Aldermore (audited)
Identifiable assets acquired and liabilities assumed at the 1 April 2018 fair value are as follows.
Aldermore
R million 2018
ASSETS
Cash and cash equivalents 8 676
Derivative financial instruments 512
Accounts receivable 298
Current tax asset –
Advances 147 447
Investment securities 11 922
Investments in associates 81
Property and equipment 68
Deferred income tax asset 58
Intangible assets 244
Total assets acquired 169 306
LIABILITIES
Derivative financial instruments 266
Creditors and accruals 1 597
Current tax liability 164
Deposits 153 735
Employee liabilities 28
Other liabilities –
Deferred income tax liability 10
Tier 2 liabilities 1 030
Total liabilities acquired 156 830
Net asset value at date of acquisition 12 476
Total goodwill is calculated as follows:
Total cash consideration transferred 18 311
Total non-cash consideration transferred –
Contingent consideration transferred –
Less: net identifiable asset value at date of acquisition (12 476)
Add: effective cash flow hedge 651
Less: intangible assets identified (2 362)
Add: deferred tax 537
Add: non-controlling interests at acquisition of contingent convertible securities (AT1) 1 234
Goodwill on acquisition 5 895
132 IFRS INFORMATION
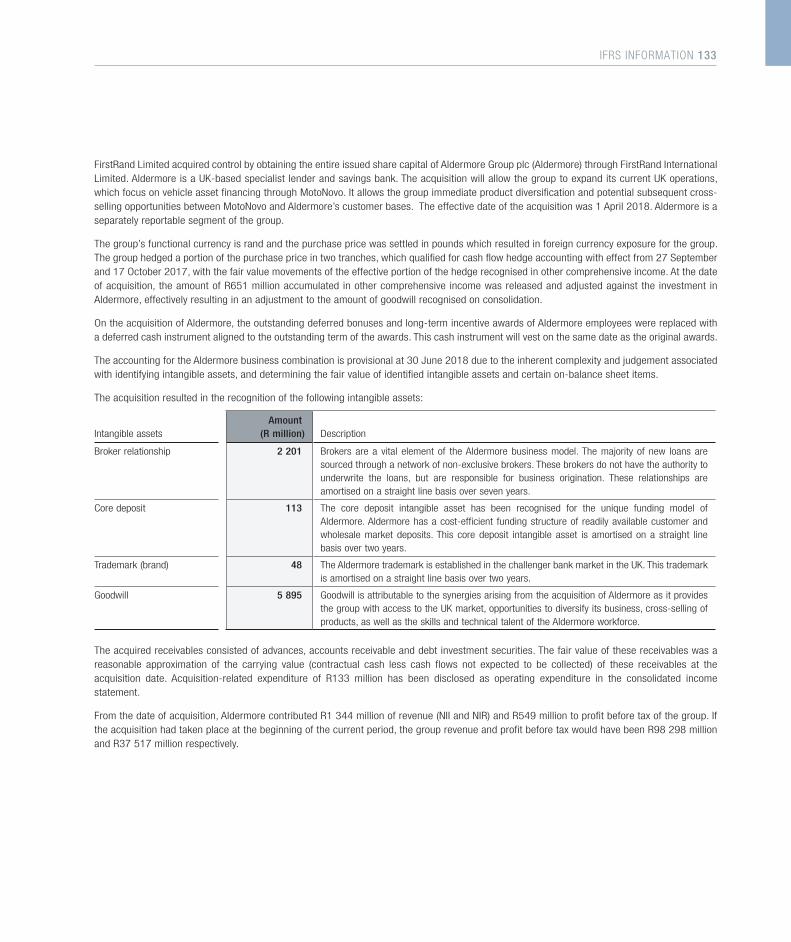
FirstRand Limited acquired control by obtaining the entire issued share capital of Aldermore Group plc (Aldermore) through FirstRand International Limited. Aldermore is a UK-based specialist lender and savings bank. The acquisition will allow the group to expand its current UK operations, which focus on vehicle asset financing through MotoNovo. It allows the group immediate product diversification and potential subsequent cross-selling opportunities between MotoNovo and Aldermore’s customer bases. The effective date of the acquisition was 1 April 2018. Aldermore is a separately reportable segment of the group.
The group’s functional currency is rand and the purchase price was settled in pounds which resulted in foreign currency exposure for the group. The group hedged a portion of the purchase price in two tranches, which qualified for cash flow hedge accounting with effect from 27 September and 17 October 2017, with the fair value movements of the effective portion of the hedge recognised in other comprehensive income. At the date of acquisition, the amount of R651 million accumulated in other comprehensive income was released and adjusted against the investment in Aldermore, effectively resulting in an adjustment to the amount of goodwill recognised on consolidation.
On the acquisition of Aldermore, the outstanding deferred bonuses and long-term incentive awards of Aldermore employees were replaced with a deferred cash instrument aligned to the outstanding term of the awards. This cash instrument will vest on the same date as the original awards.
The accounting for the Aldermore business combination is provisional at 30 June 2018 due to the inherent complexity and judgement associated with identifying intangible assets, and determining the fair value of identified intangible assets and certain on-balance sheet items.
The acquisition resulted in the recognition of the following intangible assets:
Intangible assetsAmount
(R million) Description
Broker relationship 2 201 Brokers are a vital element of the Aldermore business model. The majority of new loans are sourced through a network of non-exclusive brokers. These brokers do not have the authority to underwrite the loans, but are responsible for business origination. These relationships are amortised on a straight line basis over seven years.
Core deposit 113 The core deposit intangible asset has been recognised for the unique funding model of Aldermore. Aldermore has a cost-efficient funding structure of readily available customer and wholesale market deposits. This core deposit intangible asset is amortised on a straight line basis over two years.
Trademark (brand) 48 The Aldermore trademark is established in the challenger bank market in the UK. This trademark is amortised on a straight line basis over two years.
Goodwill 5 895 Goodwill is attributable to the synergies arising from the acquisition of Aldermore as it provides the group with access to the UK market, opportunities to diversify its business, cross-selling of products, as well as the skills and technical talent of the Aldermore workforce.
The acquired receivables consisted of advances, accounts receivable and debt investment securities. The fair value of these receivables was a reasonable approximation of the carrying value (contractual cash less cash flows not expected to be collected) of these receivables at the acquisition date. Acquisition-related expenditure of R133 million has been disclosed as operating expenditure in the consolidated income statement.
From the date of acquisition, Aldermore contributed R1 344 million of revenue (NII and NIR) and R549 million to profit before tax of the group. If the acquisition had taken place at the beginning of the current period, the group revenue and profit before tax would have been R98 298 million and R37 517 million respectively.
IFRS INFORMATION 133
VALUATION METHODOLOGYIn terms of IFRS, the group is required to or elects to measure and/or disclose certain assets and liabilities at fair value. The group has established control frameworks and processes at a franchise level to independently validate its valuation techniques and inputs used to determine its fair value measurements. At a franchise level, valuation specialists are responsible for the selection, implementation and any changes to the valuation techniques used to determine fair value measurements. Valuation committees comprising representatives from key management have been established within each franchise and at an overall group level and are responsible for overseeing the valuation control process and considering the appropriateness of the valuation techniques applied in fair value measurement. The valuation models and methodologies are subject to independent review and approval at a franchise level by the required valuation specialists, valuation committees and relevant risk committees annually or more frequently if considered appropriate.
Fair value measurements are determined by the group on both a recurring and non-recurring basis.
N O N- R E C U R R I N G FA I R VA L U E M E A S U R E M E N T SNon-recurring fair value measurements are those triggered by particular circumstances and include:
> the classification of assets and liabilities as non-current assets or disposal groups held for sale under IFRS 5 where the recoverable amount is based on the fair value less costs to sell; and
> IAS 36 where the recoverable amount is based on the fair value less costs to sell.
These fair value measurements are determined on a case by case basis as they occur within each reporting period.
F I N A N C I A L I N S T RU M E N T S When determining the fair value of a financial instrument, where the financial instrument has a bid or ask price (e.g. in a dealer market), the group uses a price within the bid-ask spread that is most representative of fair value in the circumstances.
Where the group has any financial liability with a demand feature, such as demand deposits, the fair value is not less than the amount payable on demand, discounted from the first date that the amount could be required to be paid where the time value of money is significant.
Fair value measurements (audited)
F I N A N C I A L I N S T RU M E N T S N O T M E A S U R E D AT FA I R VA L U EThis category includes assets and liabilities not measured at fair value but for which fair value disclosures are required under another IFRS e.g. financial instruments at amortised cost. Except for the amounts included on page 150, for all other financial instruments at amortised cost the carrying value is equal to or a reasonable approximation of the fair value.
FAIR VALUE HIERARCHY AND MEASUREMENTSThe group classifies assets and liabilities measured at fair value using a fair value hierarchy that reflects whether observable or unobservable inputs are used in determining the fair value of the item. Fair value may be determined using unadjusted quoted prices in active markets for identical assets or liabilities where this is readily available and the price represents actual and regularly occurring market transactions. If this information is not available, fair value is measured using another valuation technique that maximises the use of relevant observable inputs and minimises the use of unobservable inputs.
Where a valuation model is applied and the group cannot mark-to-market, it applies a mark-to-model approach, subject to valuation adjustments. Mark-to-model is defined as any valuation which has to be benchmarked, extrapolated or otherwise calculated from a market input. The group will consider the following in assessing whether a mark-to-model valuation is appropriate:
> as far as possible, market inputs are sourced in line with market prices;
> generally accepted valuation methodologies are consistently used for particular products unless deemed inappropriate by the relevant governance forums;
> where a model has been developed in-house, it is based on appropriate assumptions, which have been assessed and challenged by suitably qualified parties independent of the development process;
> formal change control procedures are in place;
> awareness of the weaknesses of the models used and appropriate reflection in the valuation output;
> the model is subject to periodic review to determine the accuracy of its performance; and
> valuation adjustments are only made when appropriate, for example, to cover the uncertainty of the model valuation. The group considers factors such as counterparty and own credit risk when making appropriate valuation adjustments.
134 IFRS INFORMATION
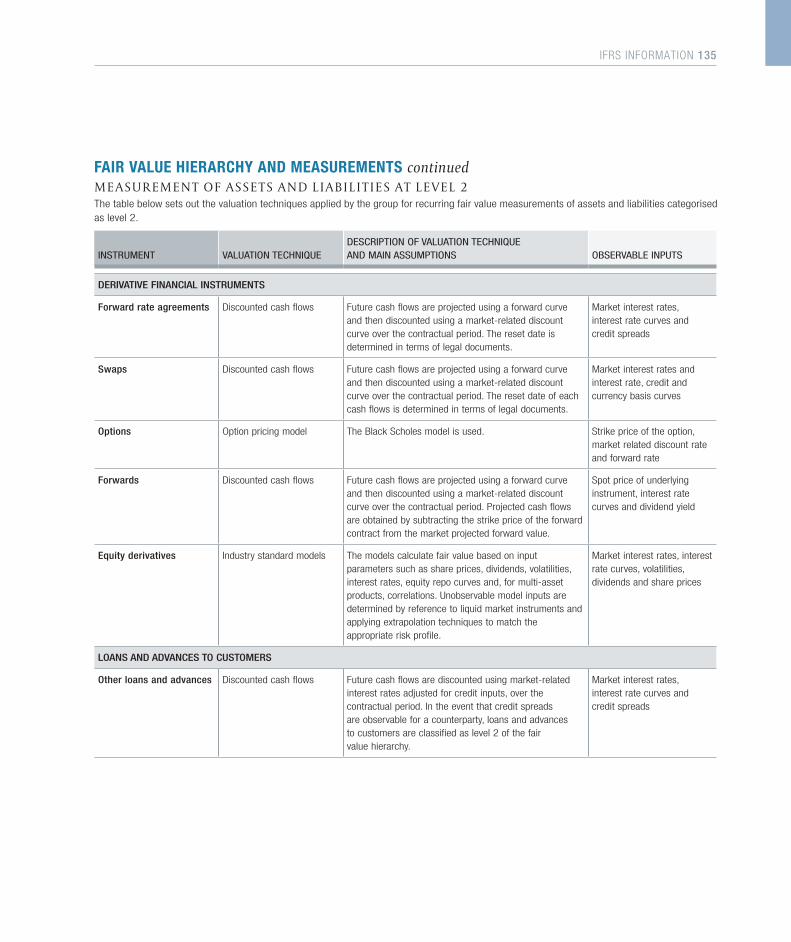
FAIR VALUE HIERARCHY AND MEASUREMENTS continuedM E A S U R E M E N T O F A S S E T S A N D L I A B I L I T I E S AT L E V E L 2The table below sets out the valuation techniques applied by the group for recurring fair value measurements of assets and liabilities categorised as level 2.
INSTRUMENT VALUATION TECHNIQUEDESCRIPTION OF VALUATION TECHNIQUE AND MAIN ASSUMPTIONS OBSERVABLE INPUTS
DERIVATIVE FINANCIAL INSTRUMENTS
Forward rate agreements Discounted cash flows Future cash flows are projected using a forward curve and then discounted using a market-related discount curve over the contractual period. The reset date is determined in terms of legal documents.
Market interest rates, interest rate curves and credit spreads
Swaps Discounted cash flows Future cash flows are projected using a forward curve and then discounted using a market-related discount curve over the contractual period. The reset date of each cash flows is determined in terms of legal documents.
Market interest rates and interest rate, credit and currency basis curves
Options Option pricing model The Black Scholes model is used. Strike price of the option, market related discount rate and forward rate
Forwards Discounted cash flows Future cash flows are projected using a forward curve and then discounted using a market-related discount curve over the contractual period. Projected cash flows are obtained by subtracting the strike price of the forward contract from the market projected forward value.
Spot price of underlying instrument, interest rate curves and dividend yield
Equity derivatives Industry standard models The models calculate fair value based on input parameters such as share prices, dividends, volatilities, interest rates, equity repo curves and, for multi-asset products, correlations. Unobservable model inputs are determined by reference to liquid market instruments and applying extrapolation techniques to match the appropriate risk profile.
Market interest rates, interest rate curves, volatilities, dividends and share prices
LOANS AND ADVANCES TO CUSTOMERS
Other loans and advances Discounted cash flows Future cash flows are discounted using market-related interest rates adjusted for credit inputs, over the contractual period. In the event that credit spreads are observable for a counterparty, loans and advances to customers are classified as level 2 of the fair value hierarchy.
Market interest rates, interest rate curves and credit spreads
IFRS INFORMATION 135
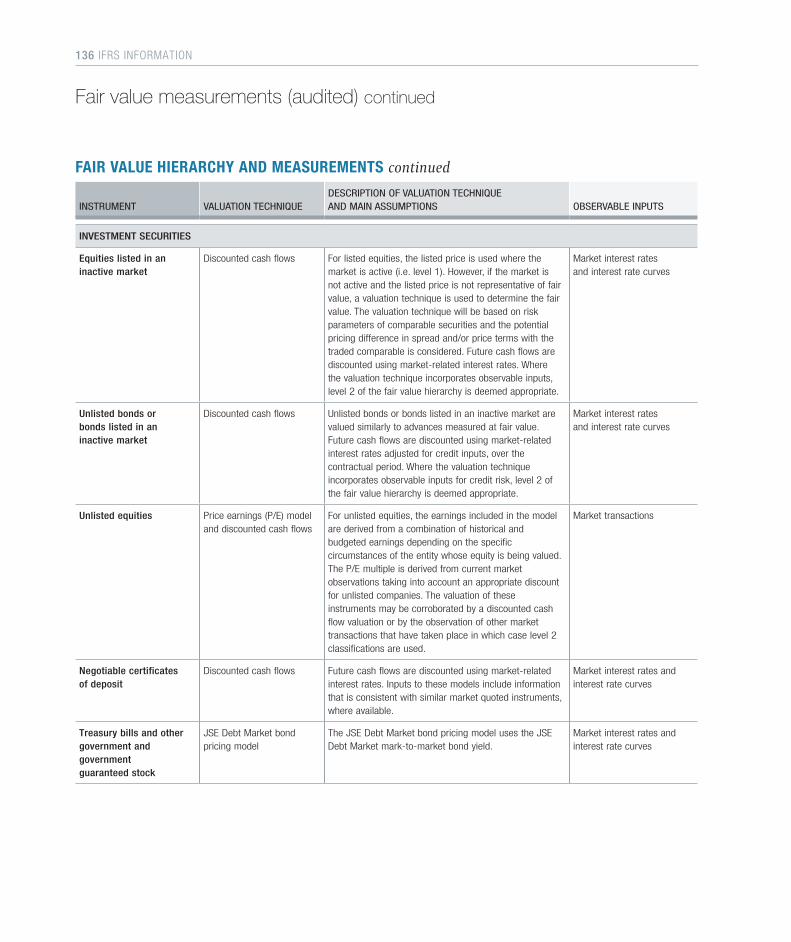
FAIR VALUE HIERARCHY AND MEASUREMENTS continued
INSTRUMENT VALUATION TECHNIQUEDESCRIPTION OF VALUATION TECHNIQUE AND MAIN ASSUMPTIONS OBSERVABLE INPUTS
INVESTMENT SECURITIES
Equities listed in an inactive market
Discounted cash flows For listed equities, the listed price is used where the market is active (i.e. level 1). However, if the market is not active and the listed price is not representative of fair value, a valuation technique is used to determine the fair value. The valuation technique will be based on risk parameters of comparable securities and the potential pricing difference in spread and/or price terms with the traded comparable is considered. Future cash flows are discounted using market-related interest rates. Where the valuation technique incorporates observable inputs, level 2 of the fair value hierarchy is deemed appropriate.
Market interest rates and interest rate curves
Unlisted bonds or bonds listed in an inactive market
Discounted cash flows Unlisted bonds or bonds listed in an inactive market are valued similarly to advances measured at fair value. Future cash flows are discounted using market-related interest rates adjusted for credit inputs, over the contractual period. Where the valuation technique incorporates observable inputs for credit risk, level 2 of the fair value hierarchy is deemed appropriate.
Market interest rates and interest rate curves
Unlisted equities Price earnings (P/E) model and discounted cash flows
For unlisted equities, the earnings included in the model are derived from a combination of historical and budgeted earnings depending on the specific circumstances of the entity whose equity is being valued. The P/E multiple is derived from current market observations taking into account an appropriate discount for unlisted companies. The valuation of these instruments may be corroborated by a discounted cash flow valuation or by the observation of other market transactions that have taken place in which case level 2 classifications are used.
Market transactions
Negotiable certificates of deposit
Discounted cash flows Future cash flows are discounted using market-related interest rates. Inputs to these models include information that is consistent with similar market quoted instruments, where available.
Market interest rates and interest rate curves
Treasury bills and other government and government guaranteed stock
JSE Debt Market bond pricing model
The JSE Debt Market bond pricing model uses the JSE Debt Market mark-to-market bond yield.
Market interest rates and interest rate curves
Fair value measurements (audited) continued
136 IFRS INFORMATION
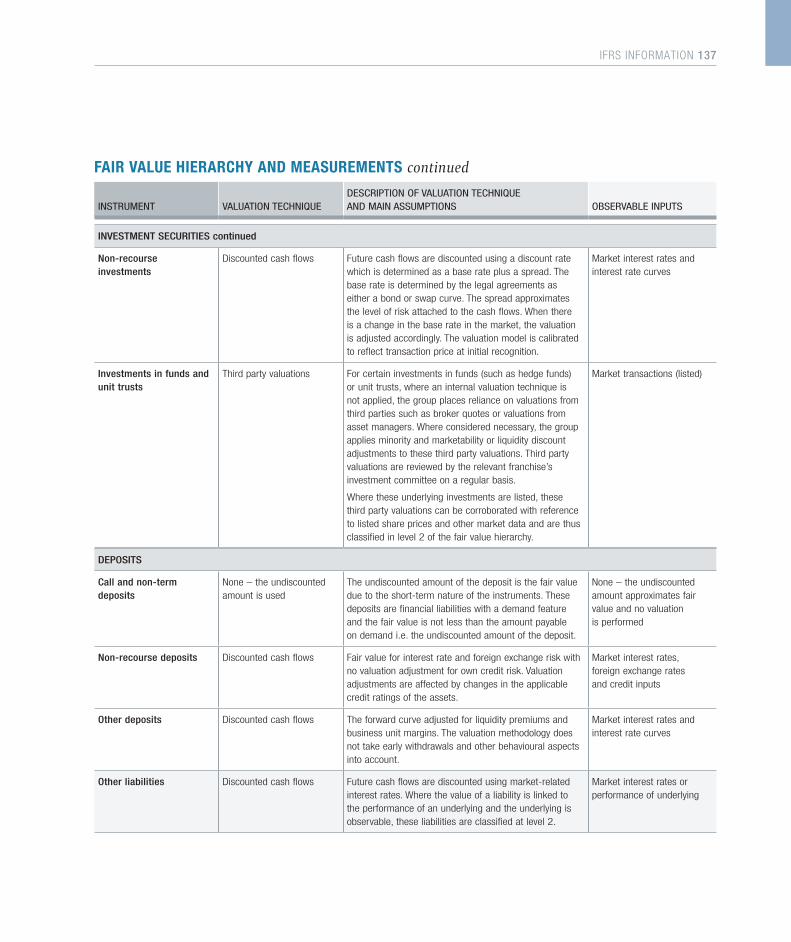
FAIR VALUE HIERARCHY AND MEASUREMENTS continued
INSTRUMENT VALUATION TECHNIQUEDESCRIPTION OF VALUATION TECHNIQUE AND MAIN ASSUMPTIONS OBSERVABLE INPUTS
INVESTMENT SECURITIES continued
Non-recourse investments
Discounted cash flows Future cash flows are discounted using a discount rate which is determined as a base rate plus a spread. The base rate is determined by the legal agreements as either a bond or swap curve. The spread approximates the level of risk attached to the cash flows. When there is a change in the base rate in the market, the valuation is adjusted accordingly. The valuation model is calibrated to reflect transaction price at initial recognition.
Market interest rates and interest rate curves
Investments in funds and unit trusts
Third party valuations For certain investments in funds (such as hedge funds) or unit trusts, where an internal valuation technique is not applied, the group places reliance on valuations from third parties such as broker quotes or valuations from asset managers. Where considered necessary, the group applies minority and marketability or liquidity discount adjustments to these third party valuations. Third party valuations are reviewed by the relevant franchise’s investment committee on a regular basis.
Where these underlying investments are listed, these third party valuations can be corroborated with reference to listed share prices and other market data and are thus classified in level 2 of the fair value hierarchy.
Market transactions (listed)
DEPOSITS
Call and non-term deposits
None – the undiscounted amount is used
The undiscounted amount of the deposit is the fair value due to the short-term nature of the instruments. These deposits are financial liabilities with a demand feature and the fair value is not less than the amount payable on demand i.e. the undiscounted amount of the deposit.
None – the undiscounted amount approximates fair value and no valuation is performed
Non-recourse deposits Discounted cash flows Fair value for interest rate and foreign exchange risk with no valuation adjustment for own credit risk. Valuation adjustments are affected by changes in the applicable credit ratings of the assets.
Market interest rates, foreign exchange rates and credit inputs
Other deposits Discounted cash flows The forward curve adjusted for liquidity premiums and business unit margins. The valuation methodology does not take early withdrawals and other behavioural aspects into account.
Market interest rates and interest rate curves
Other liabilities Discounted cash flows Future cash flows are discounted using market-related interest rates. Where the value of a liability is linked to the performance of an underlying and the underlying is observable, these liabilities are classified at level 2.
Market interest rates or performance of underlying
IFRS INFORMATION 137
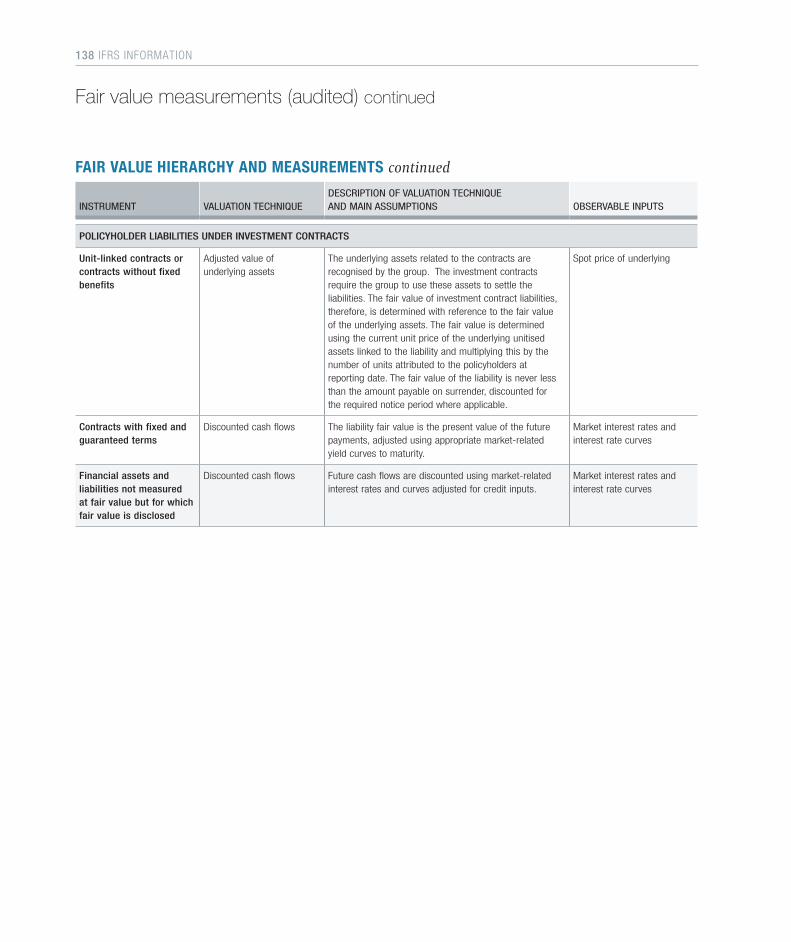
FAIR VALUE HIERARCHY AND MEASUREMENTS continued
INSTRUMENT VALUATION TECHNIQUEDESCRIPTION OF VALUATION TECHNIQUE AND MAIN ASSUMPTIONS OBSERVABLE INPUTS
POLICYHOLDER LIABILITIES UNDER INVESTMENT CONTRACTS
Unit-linked contracts or contracts without fixed benefits
Adjusted value of underlying assets
The underlying assets related to the contracts are recognised by the group. The investment contracts require the group to use these assets to settle the liabilities. The fair value of investment contract liabilities, therefore, is determined with reference to the fair value of the underlying assets. The fair value is determined using the current unit price of the underlying unitised assets linked to the liability and multiplying this by the number of units attributed to the policyholders at reporting date. The fair value of the liability is never less than the amount payable on surrender, discounted for the required notice period where applicable.
Spot price of underlying
Contracts with fixed and guaranteed terms
Discounted cash flows The liability fair value is the present value of the future payments, adjusted using appropriate market-related yield curves to maturity.
Market interest rates and interest rate curves
Financial assets and liabilities not measured at fair value but for which fair value is disclosed
Discounted cash flows Future cash flows are discounted using market-related interest rates and curves adjusted for credit inputs.
Market interest rates and interest rate curves
Fair value measurements (audited) continued
138 IFRS INFORMATION
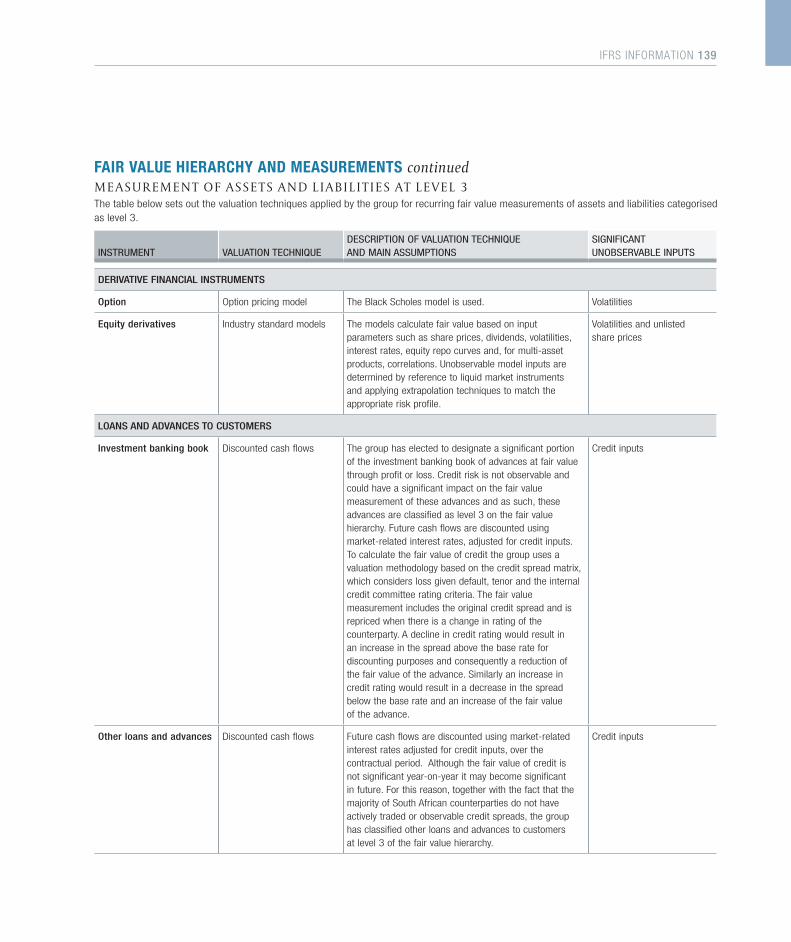
FAIR VALUE HIERARCHY AND MEASUREMENTS continuedM E A S U R E M E N T O F A S S E T S A N D L I A B I L I T I E S AT L E V E L 3The table below sets out the valuation techniques applied by the group for recurring fair value measurements of assets and liabilities categorised as level 3.
INSTRUMENT VALUATION TECHNIQUEDESCRIPTION OF VALUATION TECHNIQUE AND MAIN ASSUMPTIONS
SIGNIFICANT UNOBSERVABLE INPUTS
DERIVATIVE FINANCIAL INSTRUMENTS
Option Option pricing model The Black Scholes model is used. Volatilities
Equity derivatives Industry standard models The models calculate fair value based on input parameters such as share prices, dividends, volatilities, interest rates, equity repo curves and, for multi-asset products, correlations. Unobservable model inputs are determined by reference to liquid market instruments and applying extrapolation techniques to match the appropriate risk profile.
Volatilities and unlisted share prices
LOANS AND ADVANCES TO CUSTOMERS
Investment banking book Discounted cash flows The group has elected to designate a significant portion of the investment banking book of advances at fair value through profit or loss. Credit risk is not observable and could have a significant impact on the fair value measurement of these advances and as such, these advances are classified as level 3 on the fair value hierarchy. Future cash flows are discounted using market-related interest rates, adjusted for credit inputs. To calculate the fair value of credit the group uses a valuation methodology based on the credit spread matrix, which considers loss given default, tenor and the internal credit committee rating criteria. The fair value measurement includes the original credit spread and is repriced when there is a change in rating of the counterparty. A decline in credit rating would result in an increase in the spread above the base rate for discounting purposes and consequently a reduction of the fair value of the advance. Similarly an increase in credit rating would result in a decrease in the spread below the base rate and an increase of the fair value of the advance.
Credit inputs
Other loans and advances Discounted cash flows Future cash flows are discounted using market-related interest rates adjusted for credit inputs, over the contractual period. Although the fair value of credit is not significant year-on-year it may become significant in future. For this reason, together with the fact that the majority of South African counterparties do not have actively traded or observable credit spreads, the group has classified other loans and advances to customers at level 3 of the fair value hierarchy.
Credit inputs
IFRS INFORMATION 139
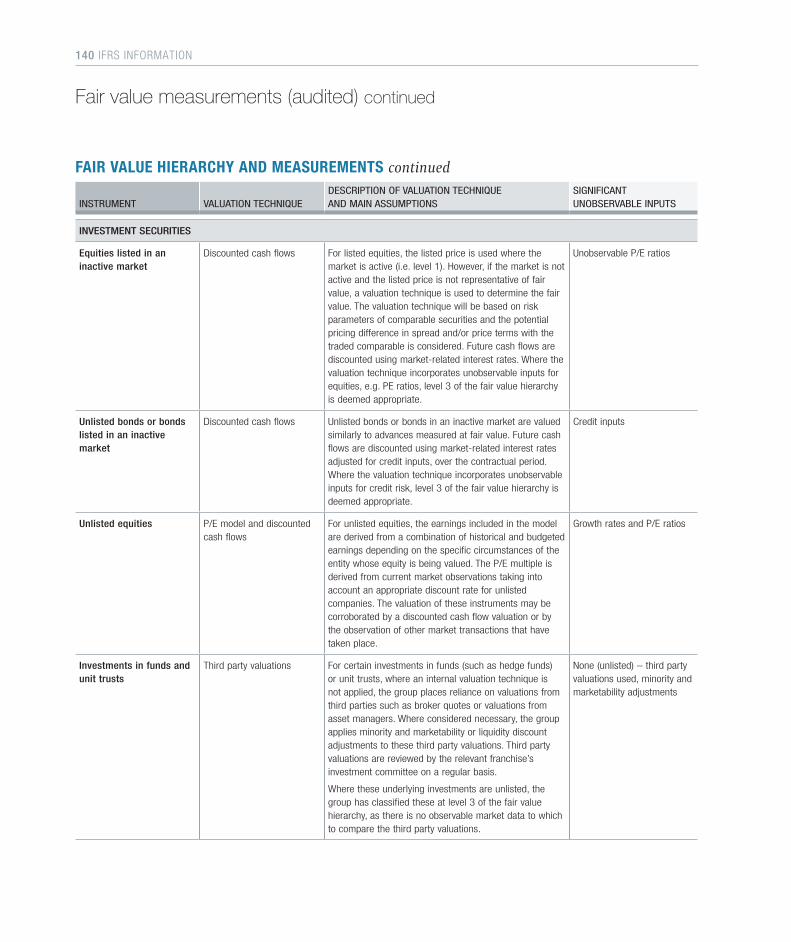
FAIR VALUE HIERARCHY AND MEASUREMENTS continued
INSTRUMENT VALUATION TECHNIQUEDESCRIPTION OF VALUATION TECHNIQUE AND MAIN ASSUMPTIONS
SIGNIFICANT UNOBSERVABLE INPUTS
INVESTMENT SECURITIES
Equities listed in an inactive market
Discounted cash flows For listed equities, the listed price is used where the market is active (i.e. level 1). However, if the market is not active and the listed price is not representative of fair value, a valuation technique is used to determine the fair value. The valuation technique will be based on risk parameters of comparable securities and the potential pricing difference in spread and/or price terms with the traded comparable is considered. Future cash flows are discounted using market-related interest rates. Where the valuation technique incorporates unobservable inputs for equities, e.g. PE ratios, level 3 of the fair value hierarchy is deemed appropriate.
Unobservable P/E ratios
Unlisted bonds or bonds listed in an inactive market
Discounted cash flows Unlisted bonds or bonds in an inactive market are valued similarly to advances measured at fair value. Future cash flows are discounted using market-related interest rates adjusted for credit inputs, over the contractual period. Where the valuation technique incorporates unobservable inputs for credit risk, level 3 of the fair value hierarchy is deemed appropriate.
Credit inputs
Unlisted equities P/E model and discounted cash flows
For unlisted equities, the earnings included in the model are derived from a combination of historical and budgeted earnings depending on the specific circumstances of the entity whose equity is being valued. The P/E multiple is derived from current market observations taking into account an appropriate discount rate for unlisted companies. The valuation of these instruments may be corroborated by a discounted cash flow valuation or by the observation of other market transactions that have taken place.
Growth rates and P/E ratios
Investments in funds and unit trusts
Third party valuations For certain investments in funds (such as hedge funds) or unit trusts, where an internal valuation technique is not applied, the group places reliance on valuations from third parties such as broker quotes or valuations from asset managers. Where considered necessary, the group applies minority and marketability or liquidity discount adjustments to these third party valuations. Third party valuations are reviewed by the relevant franchise’s investment committee on a regular basis.
Where these underlying investments are unlisted, the group has classified these at level 3 of the fair value hierarchy, as there is no observable market data to which to compare the third party valuations.
None (unlisted) – third party valuations used, minority and marketability adjustments
Fair value measurements (audited) continued
140 IFRS INFORMATION
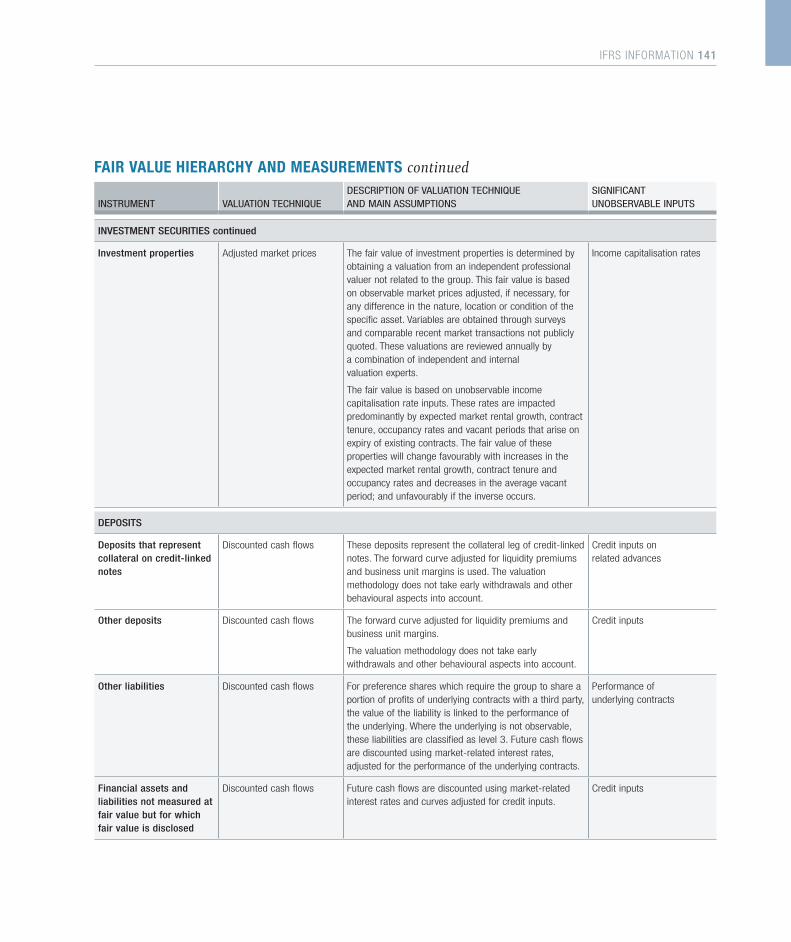
FAIR VALUE HIERARCHY AND MEASUREMENTS continued
INSTRUMENT VALUATION TECHNIQUEDESCRIPTION OF VALUATION TECHNIQUE AND MAIN ASSUMPTIONS
SIGNIFICANT UNOBSERVABLE INPUTS
INVESTMENT SECURITIES continued
Investment properties Adjusted market prices The fair value of investment properties is determined by obtaining a valuation from an independent professional valuer not related to the group. This fair value is based on observable market prices adjusted, if necessary, for any difference in the nature, location or condition of the specific asset. Variables are obtained through surveys and comparable recent market transactions not publicly quoted. These valuations are reviewed annually by a combination of independent and internal valuation experts.
The fair value is based on unobservable income capitalisation rate inputs. These rates are impacted predominantly by expected market rental growth, contract tenure, occupancy rates and vacant periods that arise on expiry of existing contracts. The fair value of these properties will change favourably with increases in the expected market rental growth, contract tenure and occupancy rates and decreases in the average vacant period; and unfavourably if the inverse occurs.
Income capitalisation rates
DEPOSITS
Deposits that represent collateral on credit-linked notes
Discounted cash flows These deposits represent the collateral leg of credit-linked notes. The forward curve adjusted for liquidity premiums and business unit margins is used. The valuation methodology does not take early withdrawals and other behavioural aspects into account.
Credit inputs on related advances
Other deposits Discounted cash flows The forward curve adjusted for liquidity premiums and business unit margins.
The valuation methodology does not take early withdrawals and other behavioural aspects into account.
Credit inputs
Other liabilities Discounted cash flows For preference shares which require the group to share a portion of profits of underlying contracts with a third party, the value of the liability is linked to the performance of the underlying. Where the underlying is not observable, these liabilities are classified as level 3. Future cash flows are discounted using market-related interest rates, adjusted for the performance of the underlying contracts.
Performance of underlying contracts
Financial assets and liabilities not measured at fair value but for which fair value is disclosed
Discounted cash flows Future cash flows are discounted using market-related interest rates and curves adjusted for credit inputs.
Credit inputs
IFRS INFORMATION 141
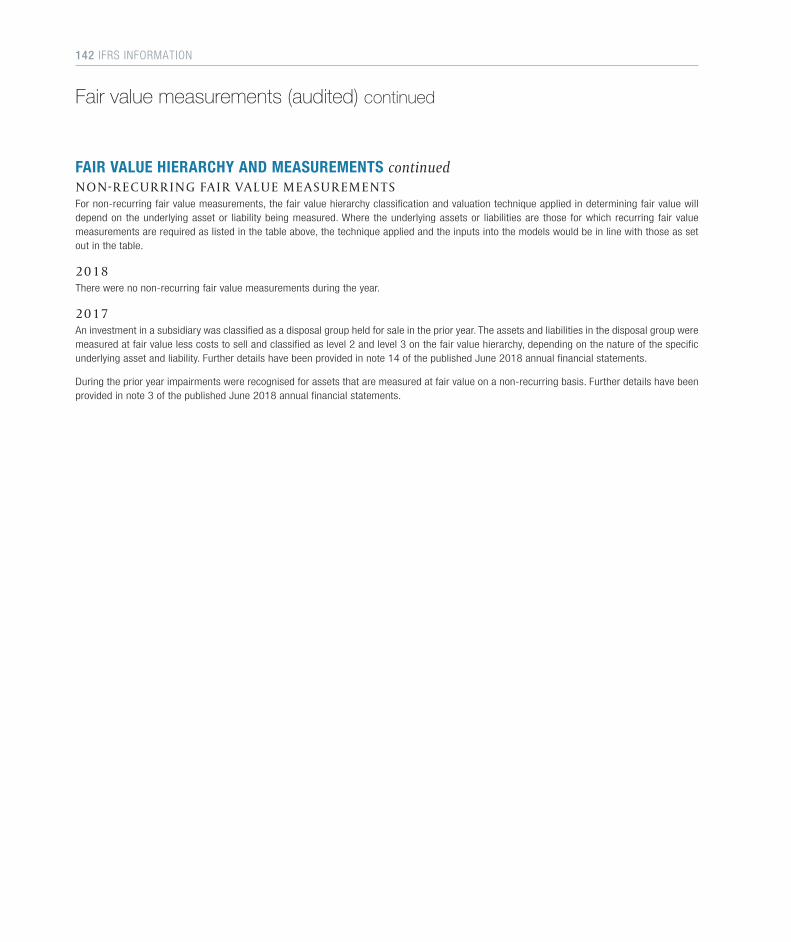
FAIR VALUE HIERARCHY AND MEASUREMENTS continuedN O N- R E C U R R I N G FA I R VA L U E M E A S U R E M E N T SFor non-recurring fair value measurements, the fair value hierarchy classification and valuation technique applied in determining fair value will depend on the underlying asset or liability being measured. Where the underlying assets or liabilities are those for which recurring fair value measurements are required as listed in the table above, the technique applied and the inputs into the models would be in line with those as set out in the table.
2018There were no non-recurring fair value measurements during the year.
2017An investment in a subsidiary was classified as a disposal group held for sale in the prior year. The assets and liabilities in the disposal group were measured at fair value less costs to sell and classified as level 2 and level 3 on the fair value hierarchy, depending on the nature of the specific underlying asset and liability. Further details have been provided in note 14 of the published June 2018 annual financial statements.
During the prior year impairments were recognised for assets that are measured at fair value on a non-recurring basis. Further details have been provided in note 3 of the published June 2018 annual financial statements.
Fair value measurements (audited) continued
142 IFRS INFORMATION
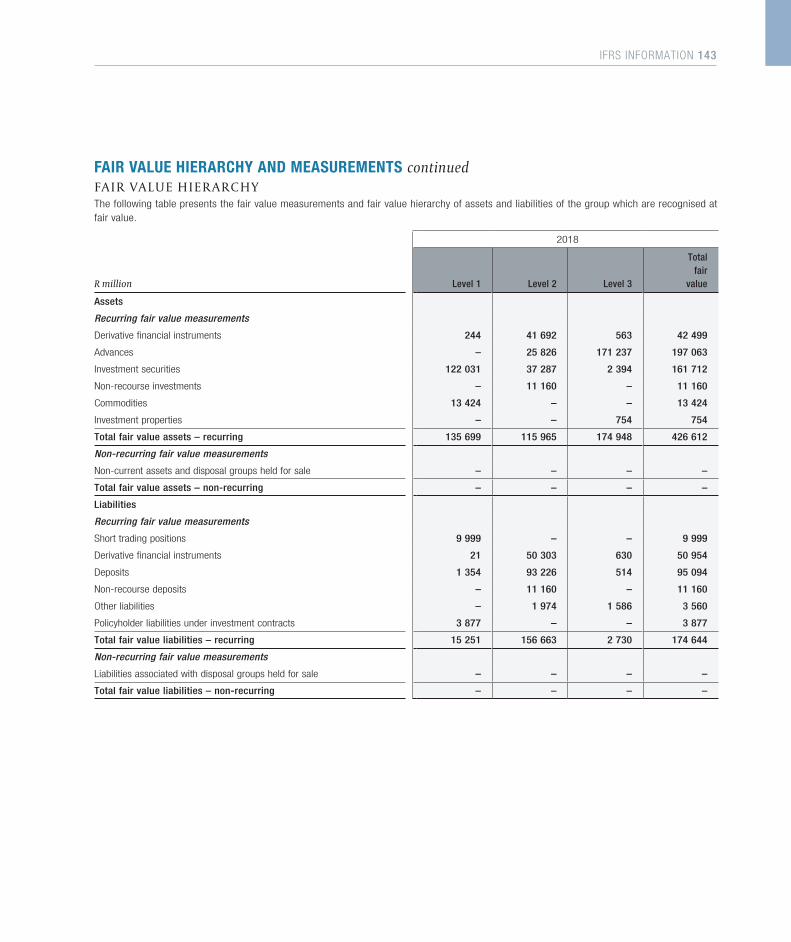
FAIR VALUE HIERARCHY AND MEASUREMENTS continuedFA I R VA L U E H I E R A RC H YThe following table presents the fair value measurements and fair value hierarchy of assets and liabilities of the group which are recognised at fair value.
2018
R million Level 1 Level 2 Level 3
Total fair
value
Assets
Recurring fair value measurements
Derivative financial instruments 244 41 692 563 42 499
Advances – 25 826 171 237 197 063
Investment securities 122 031 37 287 2 394 161 712
Non-recourse investments – 11 160 – 11 160
Commodities 13 424 – – 13 424
Investment properties – – 754 754
Total fair value assets – recurring 135 699 115 965 174 948 426 612
Non-recurring fair value measurements
Non-current assets and disposal groups held for sale – – – –
Total fair value assets – non-recurring – – – –
Liabilities
Recurring fair value measurements
Short trading positions 9 999 – – 9 999
Derivative financial instruments 21 50 303 630 50 954
Deposits 1 354 93 226 514 95 094
Non-recourse deposits – 11 160 – 11 160
Other liabilities – 1 974 1 586 3 560
Policyholder liabilities under investment contracts 3 877 – – 3 877
Total fair value liabilities – recurring 15 251 156 663 2 730 174 644
Non-recurring fair value measurements
Liabilities associated with disposal groups held for sale – – – –
Total fair value liabilities – non-recurring – – – –
IFRS INFORMATION 143
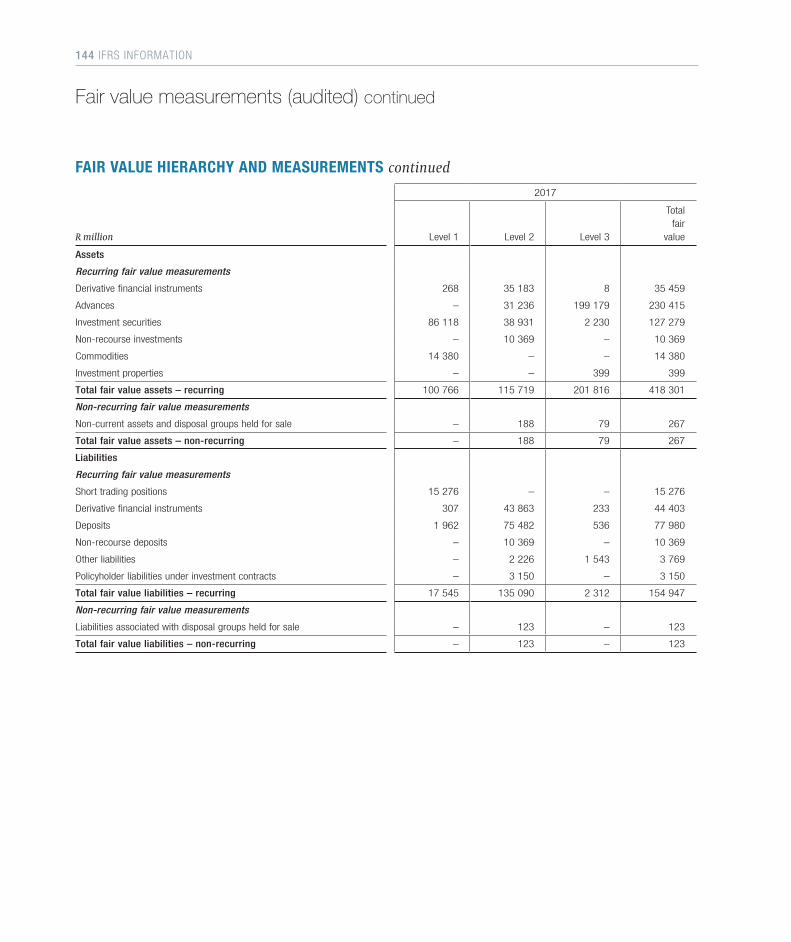
FAIR VALUE HIERARCHY AND MEASUREMENTS continued2017
R million Level 1 Level 2 Level 3
Total fair
value
Assets
Recurring fair value measurements
Derivative financial instruments 268 35 183 8 35 459
Advances – 31 236 199 179 230 415
Investment securities 86 118 38 931 2 230 127 279
Non-recourse investments – 10 369 – 10 369
Commodities 14 380 – – 14 380
Investment properties – – 399 399
Total fair value assets – recurring 100 766 115 719 201 816 418 301
Non-recurring fair value measurements
Non-current assets and disposal groups held for sale – 188 79 267
Total fair value assets – non-recurring – 188 79 267
Liabilities
Recurring fair value measurements
Short trading positions 15 276 – – 15 276
Derivative financial instruments 307 43 863 233 44 403
Deposits 1 962 75 482 536 77 980
Non-recourse deposits – 10 369 – 10 369
Other liabilities – 2 226 1 543 3 769
Policyholder liabilities under investment contracts – 3 150 – 3 150
Total fair value liabilities – recurring 17 545 135 090 2 312 154 947
Non-recurring fair value measurements
Liabilities associated with disposal groups held for sale – 123 – 123
Total fair value liabilities – non-recurring – 123 – 123
Fair value measurements (audited) continued
144 IFRS INFORMATION
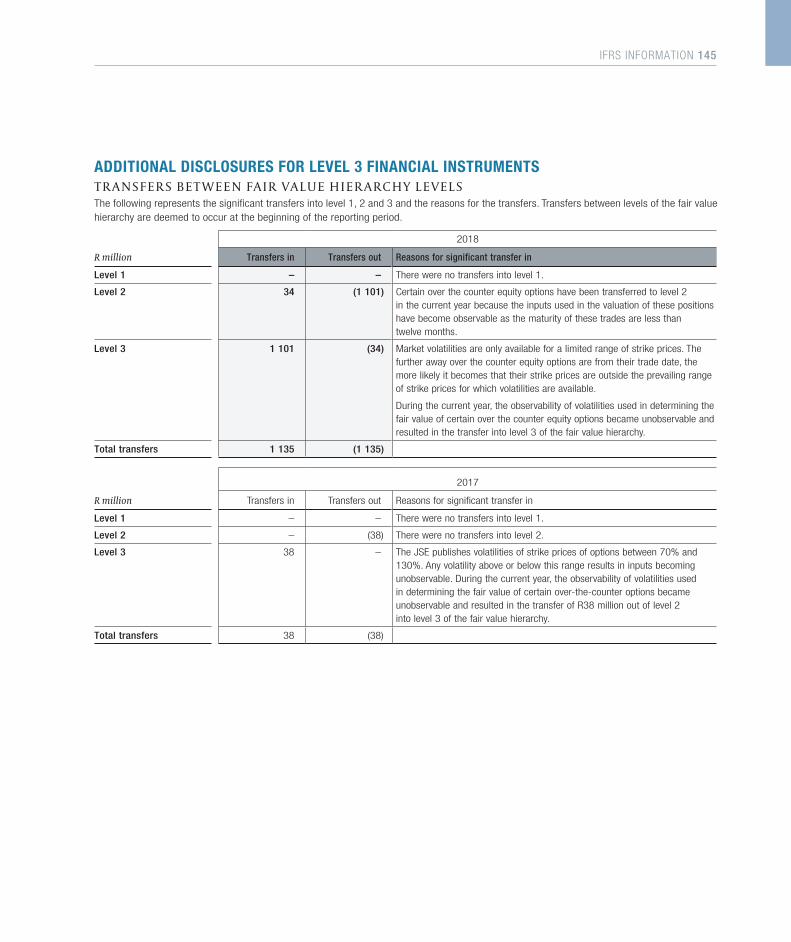
ADDITIONAL DISCLOSURES FOR LEVEL 3 FINANCIAL INSTRUMENTST R A N S F E R S B E T W E E N FA I R VA L U E H I E R A RC H Y L E V E L SThe following represents the significant transfers into level 1, 2 and 3 and the reasons for the transfers. Transfers between levels of the fair value hierarchy are deemed to occur at the beginning of the reporting period.
2018
R million Transfers in Transfers out Reasons for significant transfer in
Level 1 – – There were no transfers into level 1.
Level 2 34 (1 101) Certain over the counter equity options have been transferred to level 2 in the current year because the inputs used in the valuation of these positions have become observable as the maturity of these trades are less than twelve months.
Level 3 1 101 (34) Market volatilities are only available for a limited range of strike prices. The further away over the counter equity options are from their trade date, the more likely it becomes that their strike prices are outside the prevailing range of strike prices for which volatilities are available.
During the current year, the observability of volatilities used in determining the fair value of certain over the counter equity options became unobservable and resulted in the transfer into level 3 of the fair value hierarchy.
Total transfers 1 135 (1 135)
2017
R million Transfers in Transfers out Reasons for significant transfer in
Level 1 – – There were no transfers into level 1.
Level 2 – (38) There were no transfers into level 2.
Level 3 38 – The JSE publishes volatilities of strike prices of options between 70% and 130%. Any volatility above or below this range results in inputs becoming unobservable. During the current year, the observability of volatilities used in determining the fair value of certain over-the-counter options became unobservable and resulted in the transfer of R38 million out of level 2 into level 3 of the fair value hierarchy.
Total transfers 38 (38)
IFRS INFORMATION 145
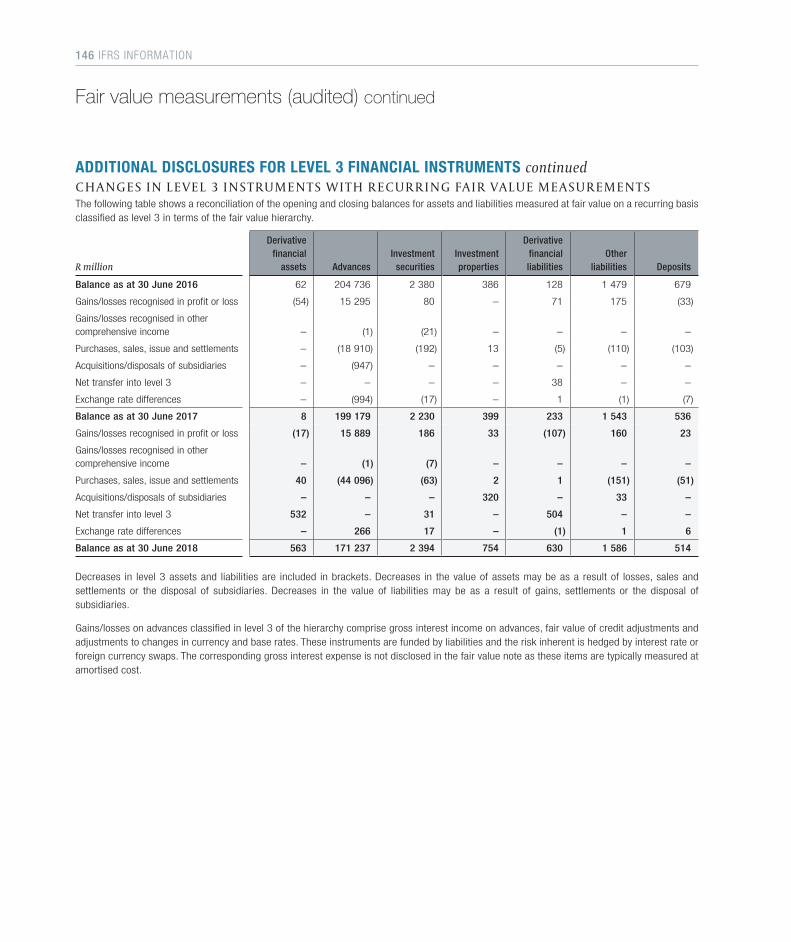
ADDITIONAL DISCLOSURES FOR LEVEL 3 FINANCIAL INSTRUMENTS continuedC H A N G E S I N L E V E L 3 I N S T RU M E N T S W I T H R E C U R R I N G FA I R VA L U E M E A S U R E M E N T SThe following table shows a reconciliation of the opening and closing balances for assets and liabilities measured at fair value on a recurring basis classified as level 3 in terms of the fair value hierarchy.
R million
Derivativefinancial
assets AdvancesInvestment
securitiesInvestment properties
Derivativefinancialliabilities
Otherliabilities Deposits
Balance as at 30 June 2016 62 204 736 2 380 386 128 1 479 679
Gains/losses recognised in profit or loss (54) 15 295 80 – 71 175 (33)
Gains/losses recognised in other comprehensive income – (1) (21) – – – –
Purchases, sales, issue and settlements – (18 910) (192) 13 (5) (110) (103)
Acquisitions/disposals of subsidiaries – (947) – – – – –
Net transfer into level 3 – – – – 38 – –
Exchange rate differences – (994) (17) – 1 (1) (7)
Balance as at 30 June 2017 8 199 179 2 230 399 233 1 543 536
Gains/losses recognised in profit or loss (17) 15 889 186 33 (107) 160 23
Gains/losses recognised in other comprehensive income – (1) (7) – – – –
Purchases, sales, issue and settlements 40 (44 096) (63) 2 1 (151) (51)
Acquisitions/disposals of subsidiaries – – – 320 – 33 –
Net transfer into level 3 532 – 31 – 504 – –
Exchange rate differences – 266 17 – (1) 1 6
Balance as at 30 June 2018 563 171 237 2 394 754 630 1 586 514
Decreases in level 3 assets and liabilities are included in brackets. Decreases in the value of assets may be as a result of losses, sales and settlements or the disposal of subsidiaries. Decreases in the value of liabilities may be as a result of gains, settlements or the disposal of subsidiaries.
Gains/losses on advances classified in level 3 of the hierarchy comprise gross interest income on advances, fair value of credit adjustments and adjustments to changes in currency and base rates. These instruments are funded by liabilities and the risk inherent is hedged by interest rate or foreign currency swaps. The corresponding gross interest expense is not disclosed in the fair value note as these items are typically measured at amortised cost.
Fair value measurements (audited) continued
146 IFRS INFORMATION
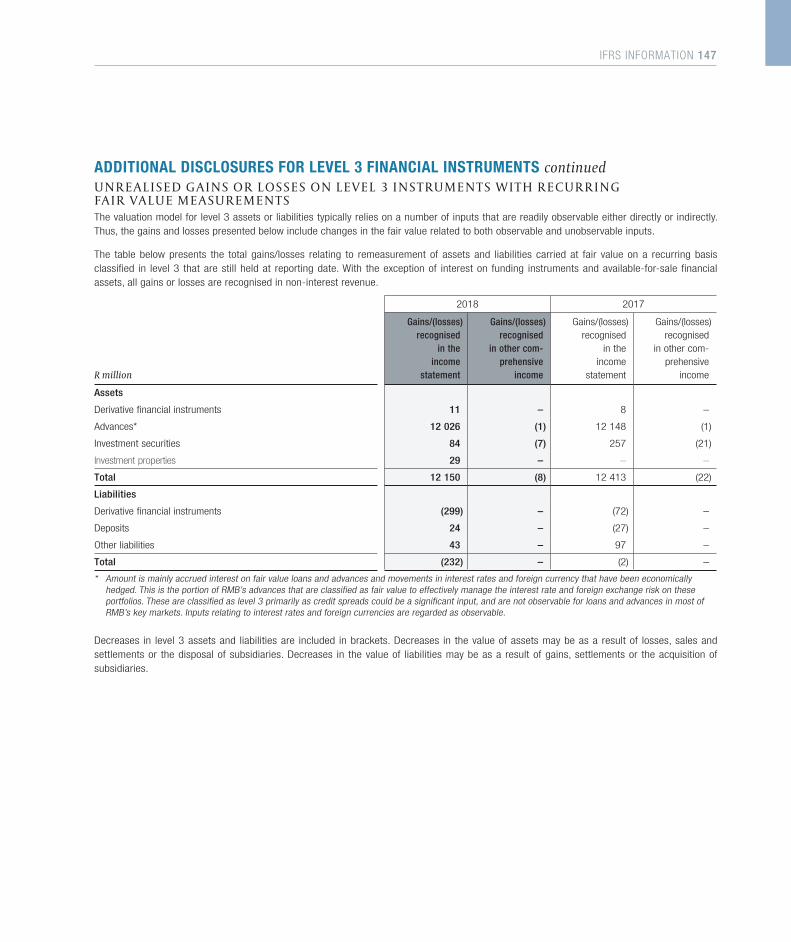
ADDITIONAL DISCLOSURES FOR LEVEL 3 FINANCIAL INSTRUMENTS continuedU N R E A L I S E D G A I N S O R L OS S E S O N L E V E L 3 I N S T RU M E N T S W I T H R E C U R R I N G FA I R VA L U E M E A S U R E M E N T SThe valuation model for level 3 assets or liabilities typically relies on a number of inputs that are readily observable either directly or indirectly. Thus, the gains and losses presented below include changes in the fair value related to both observable and unobservable inputs.
The table below presents the total gains/losses relating to remeasurement of assets and liabilities carried at fair value on a recurring basis classified in level 3 that are still held at reporting date. With the exception of interest on funding instruments and available-for-sale financial assets, all gains or losses are recognised in non-interest revenue.
2018 2017
R million
Gains/(losses)recognised
in theincome
statement
Gains/(losses)recognised
in other com-prehensive
income
Gains/(losses)recognised
in theincome
statement
Gains/(losses)recognised
in other com-prehensive
income
Assets
Derivative financial instruments 11 – 8 –
Advances* 12 026 (1) 12 148 (1)
Investment securities 84 (7) 257 (21)
Investment properties 29 – – –
Total 12 150 (8) 12 413 (22)
Liabilities
Derivative financial instruments (299) – (72) –
Deposits 24 – (27) –
Other liabilities 43 – 97 –
Total (232) – (2) –
* Amount is mainly accrued interest on fair value loans and advances and movements in interest rates and foreign currency that have been economically hedged. This is the portion of RMB’s advances that are classified as fair value to effectively manage the interest rate and foreign exchange risk on these portfolios. These are classified as level 3 primarily as credit spreads could be a significant input, and are not observable for loans and advances in most of RMB’s key markets. Inputs relating to interest rates and foreign currencies are regarded as observable.
Decreases in level 3 assets and liabilities are included in brackets. Decreases in the value of assets may be as a result of losses, sales and settlements or the disposal of subsidiaries. Decreases in the value of liabilities may be as a result of gains, settlements or the acquisition of subsidiaries.
IFRS INFORMATION 147
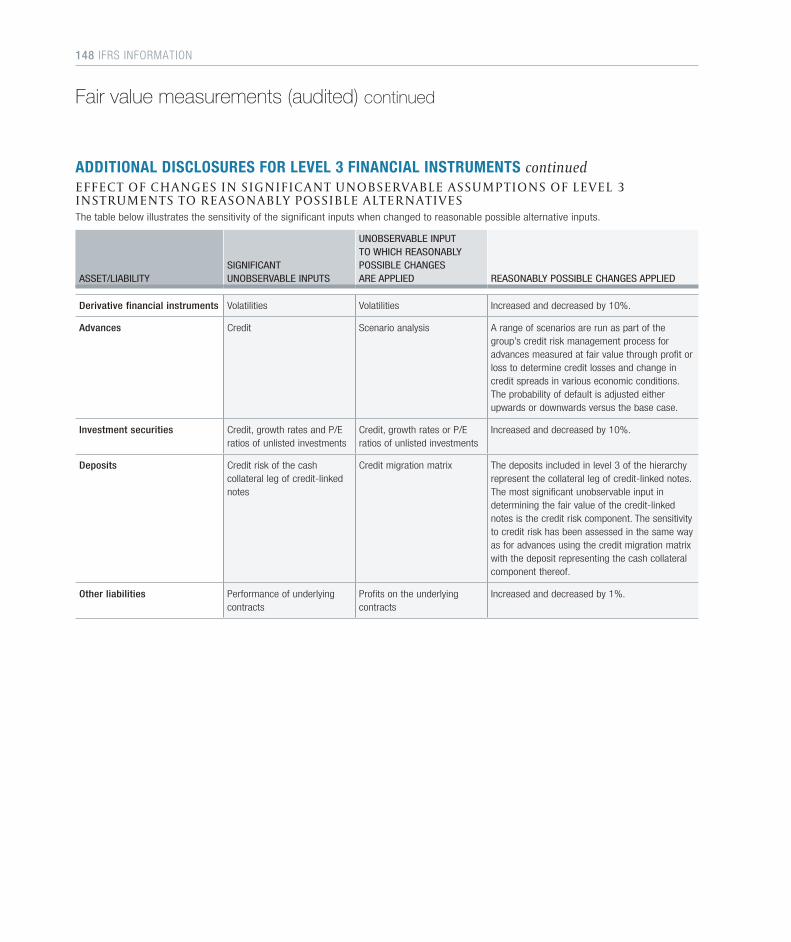
ADDITIONAL DISCLOSURES FOR LEVEL 3 FINANCIAL INSTRUMENTS continuedE F F E C T O F C H A N G E S I N S I G N I F I C A N T U N O B S E RVA B L E A S S U M P T I O N S O F L E V E L 3 I N S T RU M E N T S TO R E A S O N A B LY P OS S I B L E A LT E R N AT I V E SThe table below illustrates the sensitivity of the significant inputs when changed to reasonable possible alternative inputs.
ASSET/LIABILITYSIGNIFICANT UNOBSERVABLE INPUTS
UNOBSERVABLE INPUT TO WHICH REASONABLY POSSIBLE CHANGES ARE APPLIED REASONABLY POSSIBLE CHANGES APPLIED
Derivative financial instruments Volatilities Volatilities Increased and decreased by 10%.
Advances Credit Scenario analysis A range of scenarios are run as part of the group’s credit risk management process for advances measured at fair value through profit or loss to determine credit losses and change in credit spreads in various economic conditions. The probability of default is adjusted either upwards or downwards versus the base case.
Investment securities Credit, growth rates and P/E ratios of unlisted investments
Credit, growth rates or P/E ratios of unlisted investments
Increased and decreased by 10%.
Deposits Credit risk of the cash collateral leg of credit-linked notes
Credit migration matrix The deposits included in level 3 of the hierarchy represent the collateral leg of credit-linked notes. The most significant unobservable input in determining the fair value of the credit-linked notes is the credit risk component. The sensitivity to credit risk has been assessed in the same way as for advances using the credit migration matrix with the deposit representing the cash collateral component thereof.
Other liabilities Performance of underlying contracts
Profits on the underlying contracts
Increased and decreased by 1%.
Fair value measurements (audited) continued
148 IFRS INFORMATION
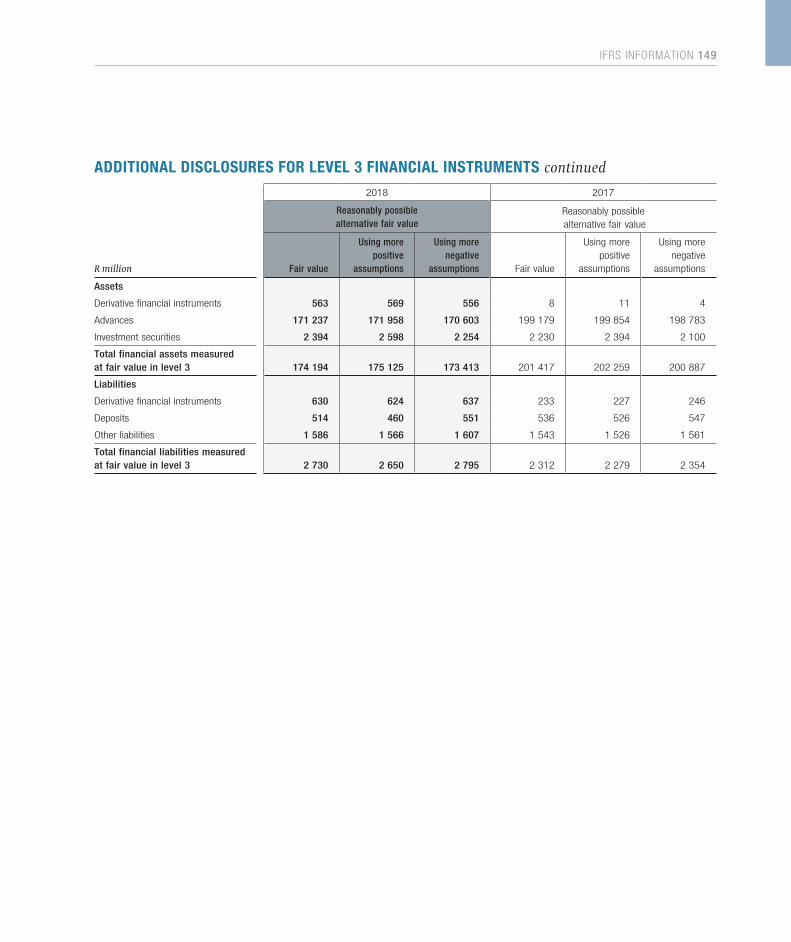
ADDITIONAL DISCLOSURES FOR LEVEL 3 FINANCIAL INSTRUMENTS continued2018 2017
Reasonably possiblealternative fair value
Reasonably possible alternative fair value
R million Fair value
Using morepositive
assumptions
Using morenegative
assumptions Fair value
Using morepositive
assumptions
Using morenegative
assumptions
Assets
Derivative financial instruments 563 569 556 8 11 4
Advances 171 237 171 958 170 603 199 179 199 854 198 783
Investment securities 2 394 2 598 2 254 2 230 2 394 2 100
Total financial assets measured at fair value in level 3 174 194 175 125 173 413 201 417 202 259 200 887
Liabilities
Derivative financial instruments 630 624 637 233 227 246
Deposits 514 460 551 536 526 547
Other liabilities 1 586 1 566 1 607 1 543 1 526 1 561
Total financial liabilities measured at fair value in level 3 2 730 2 650 2 795 2 312 2 279 2 354
IFRS INFORMATION 149
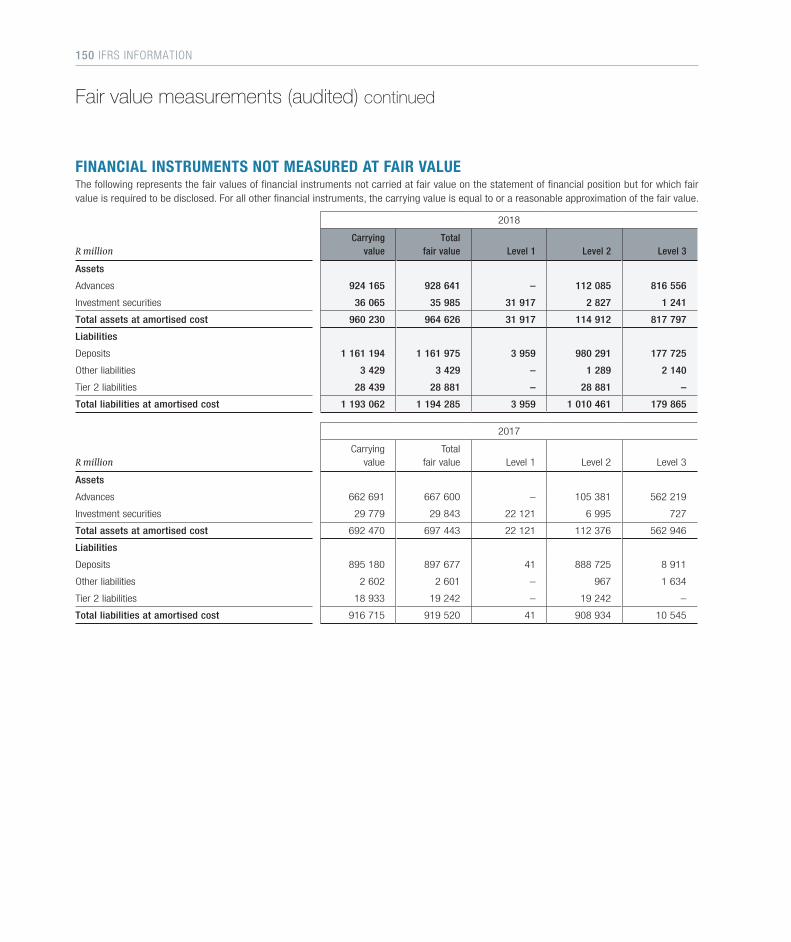
Fair value measurements (audited) continued
FINANCIAL INSTRUMENTS NOT MEASURED AT FAIR VALUEThe following represents the fair values of financial instruments not carried at fair value on the statement of financial position but for which fair value is required to be disclosed. For all other financial instruments, the carrying value is equal to or a reasonable approximation of the fair value.
2018
R millionCarrying
valueTotal
fair value Level 1 Level 2 Level 3
Assets
Advances 924 165 928 641 – 112 085 816 556
Investment securities 36 065 35 985 31 917 2 827 1 241
Total assets at amortised cost 960 230 964 626 31 917 114 912 817 797
Liabilities
Deposits 1 161 194 1 161 975 3 959 980 291 177 725
Other liabilities 3 429 3 429 – 1 289 2 140
Tier 2 liabilities 28 439 28 881 – 28 881 –
Total liabilities at amortised cost 1 193 062 1 194 285 3 959 1 010 461 179 865
2017
R millionCarrying
valueTotal
fair value Level 1 Level 2 Level 3
Assets
Advances 662 691 667 600 – 105 381 562 219
Investment securities 29 779 29 843 22 121 6 995 727
Total assets at amortised cost 692 470 697 443 22 121 112 376 562 946
Liabilities
Deposits 895 180 897 677 41 888 725 8 911
Other liabilities 2 602 2 601 – 967 1 634
Tier 2 liabilities 18 933 19 242 – 19 242 –
Total liabilities at amortised cost 916 715 919 520 41 908 934 10 545
150 IFRS INFORMATION
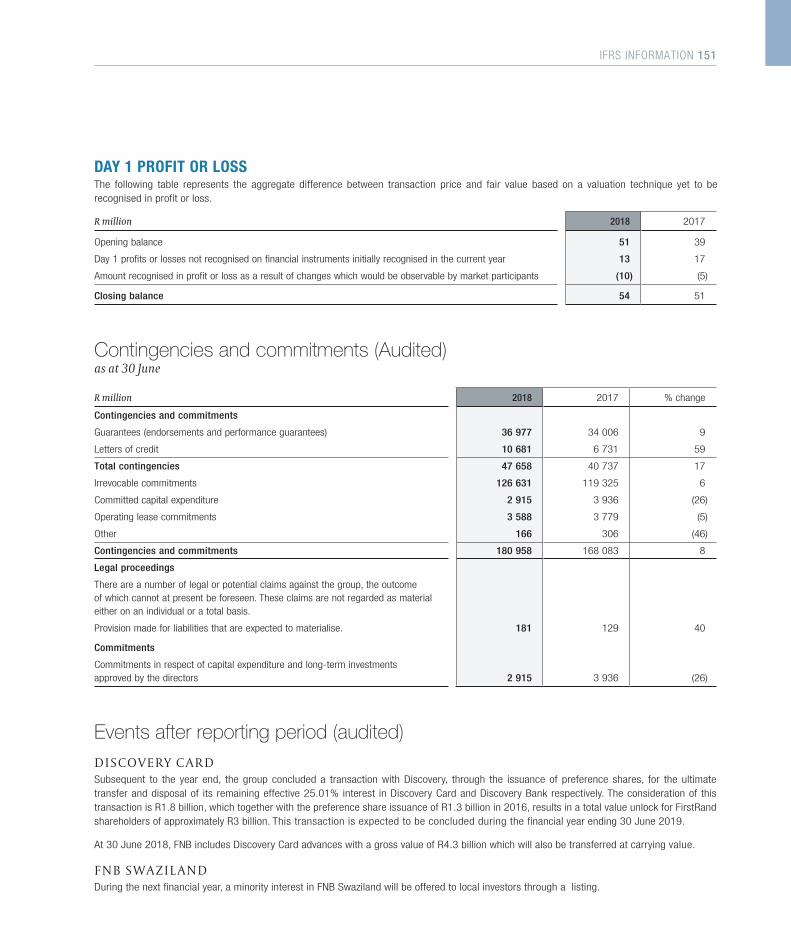
DAY 1 PROFIT OR LOSSThe following table represents the aggregate difference between transaction price and fair value based on a valuation technique yet to be recognised in profit or loss.
R million 2018 2017
Opening balance 51 39
Day 1 profits or losses not recognised on financial instruments initially recognised in the current year 13 17
Amount recognised in profit or loss as a result of changes which would be observable by market participants (10) (5)
Closing balance 54 51
R million 2018 2017 % change
Contingencies and commitments
Guarantees (endorsements and performance guarantees) 36 977 34 006 9
Letters of credit 10 681 6 731 59
Total contingencies 47 658 40 737 17
Irrevocable commitments 126 631 119 325 6
Committed capital expenditure 2 915 3 936 (26)
Operating lease commitments 3 588 3 779 (5)
Other 166 306 (46)
Contingencies and commitments 180 958 168 083 8
Legal proceedings
There are a number of legal or potential claims against the group, the outcome of which cannot at present be foreseen. These claims are not regarded as material either on an individual or a total basis.
Provision made for liabilities that are expected to materialise. 181 129 40
Commitments
Commitments in respect of capital expenditure and long-term investments approved by the directors 2 915 3 936 (26)
Contingencies and commitments (Audited)as at 30 June
Events after reporting period (audited)D I S COV E RY C A R DSubsequent to the year end, the group concluded a transaction with Discovery, through the issuance of preference shares, for the ultimate transfer and disposal of its remaining effective 25.01% interest in Discovery Card and Discovery Bank respectively. The consideration of this transaction is R1.8 billion, which together with the preference share issuance of R1.3 billion in 2016, results in a total value unlock for FirstRand shareholders of approximately R3 billion. This transaction is expected to be concluded during the financial year ending 30 June 2019.
At 30 June 2018, FNB includes Discovery Card advances with a gross value of R4.3 billion which will also be transferred at carrying value.
F N B S WA Z I L A N DDuring the next financial year, a minority interest in FNB Swaziland will be offered to local investors through a listing.
IFRS INFORMATION 151
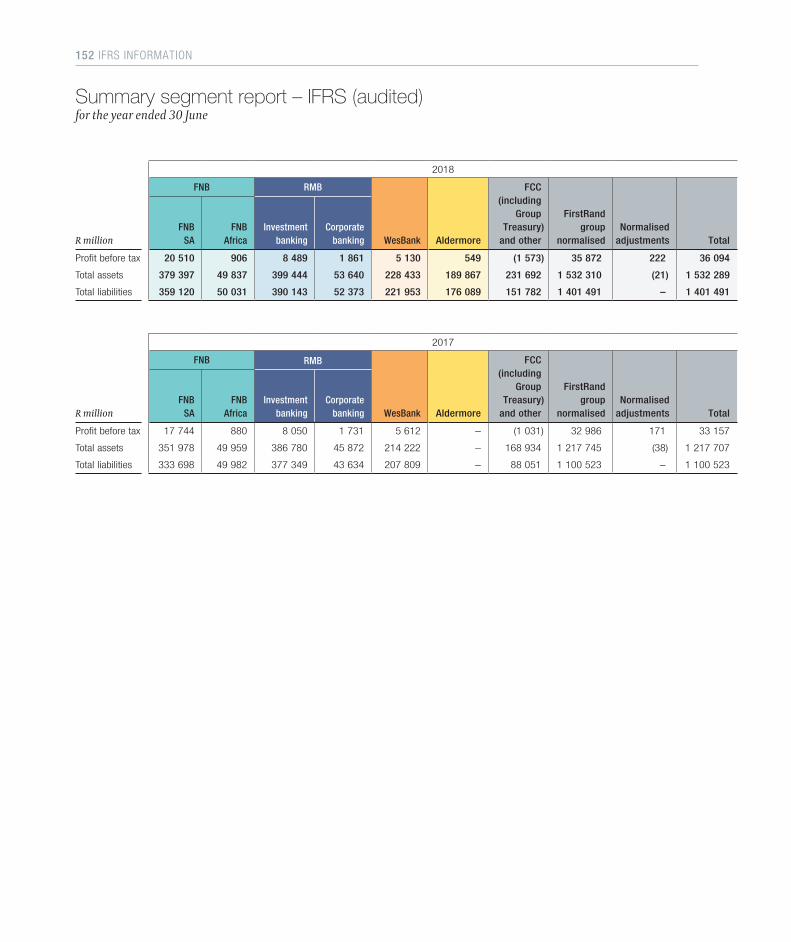
152 IFRS INFORMATION
2018
R million
FNB RMB
WesBank Aldermore
FCC(including
GroupTreasury)
and other
FirstRandgroup
normalisedNormalised
adjustments TotalFNB SA
FNBAfrica
Investmentbanking
Corporatebanking
Profit before tax 20 510 906 8 489 1 861 5 130 549 (1 573) 35 872 222 36 094
Total assets 379 397 49 837 399 444 53 640 228 433 189 867 231 692 1 532 310 (21) 1 532 289
Total liabilities 359 120 50 031 390 143 52 373 221 953 176 089 151 782 1 401 491 – 1 401 491
2017
R million
FNB RMB
WesBank Aldermore
FCC(including
GroupTreasury)
and other
FirstRandgroup
normalisedNormalised
adjustments TotalFNB SA
FNBAfrica
Investmentbanking
Corporatebanking
Profit before tax 17 744 880 8 050 1 731 5 612 – (1 031) 32 986 171 33 157
Total assets 351 978 49 959 386 780 45 872 214 222 – 168 934 1 217 745 (38) 1 217 707
Total liabilities 333 698 49 982 377 349 43 634 207 809 – 88 051 1 100 523 – 1 100 523
Summary segment report – IFRS (audited)for the year ended 30 June

supplementaryinformation154 – 162
05
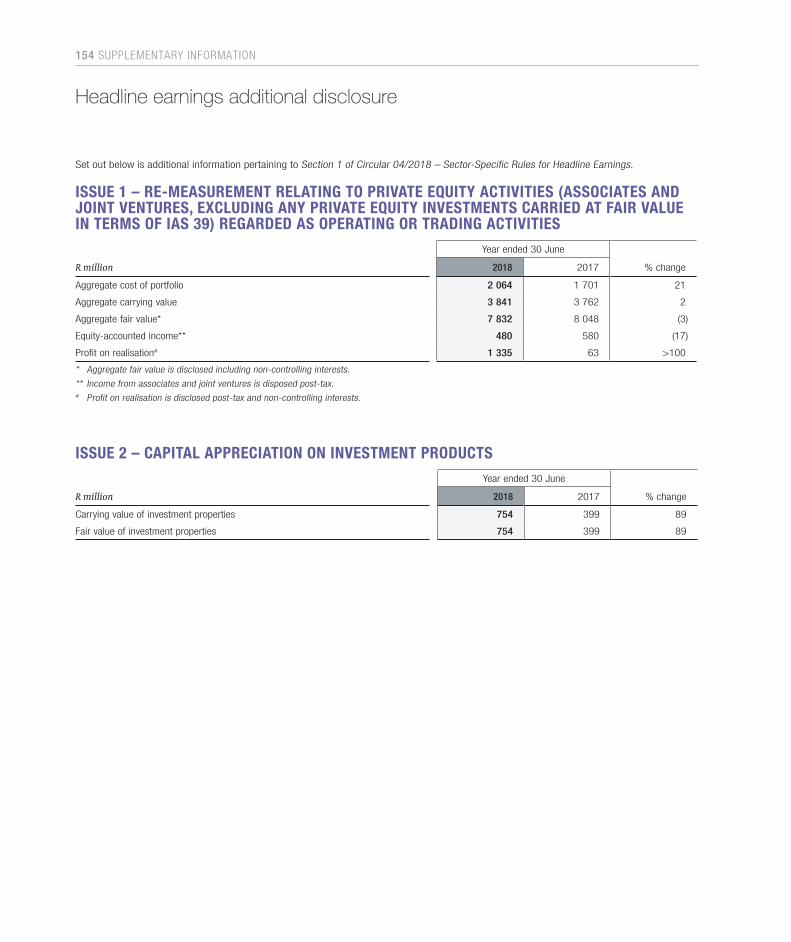
Set out below is additional information pertaining to Section 1 of Circular 04/2018 – Sector-Specific Rules for Headline Earnings.
ISSUE 1 – RE-MEASUREMENT RELATING TO PRIVATE EQUITY ACTIVITIES (ASSOCIATES AND JOINT VENTURES, EXCLUDING ANY PRIVATE EQUITY INVESTMENTS CARRIED AT FAIR VALUE IN TERMS OF IAS 39) REGARDED AS OPERATING OR TRADING ACTIVITIES
Year ended 30 June
R million 2018 2017 % change
Aggregate cost of portfolio 2 064 1 701 21
Aggregate carrying value 3 841 3 762 2
Aggregate fair value* 7 832 8 048 (3)
Equity-accounted income** 480 580 (17)
Profit on realisation# 1 335 63 >100
* Aggregate fair value is disclosed including non-controlling interests.
** Income from associates and joint ventures is disposed post-tax.# Profit on realisation is disclosed post-tax and non-controlling interests.
ISSUE 2 – CAPITAL APPRECIATION ON INVESTMENT PRODUCTSYear ended 30 June
R million 2018 2017 % change
Carrying value of investment properties 754 399 89
Fair value of investment properties 754 399 89
Headline earnings additional disclosure
154 SUPPLEMENTARY INFORMATION
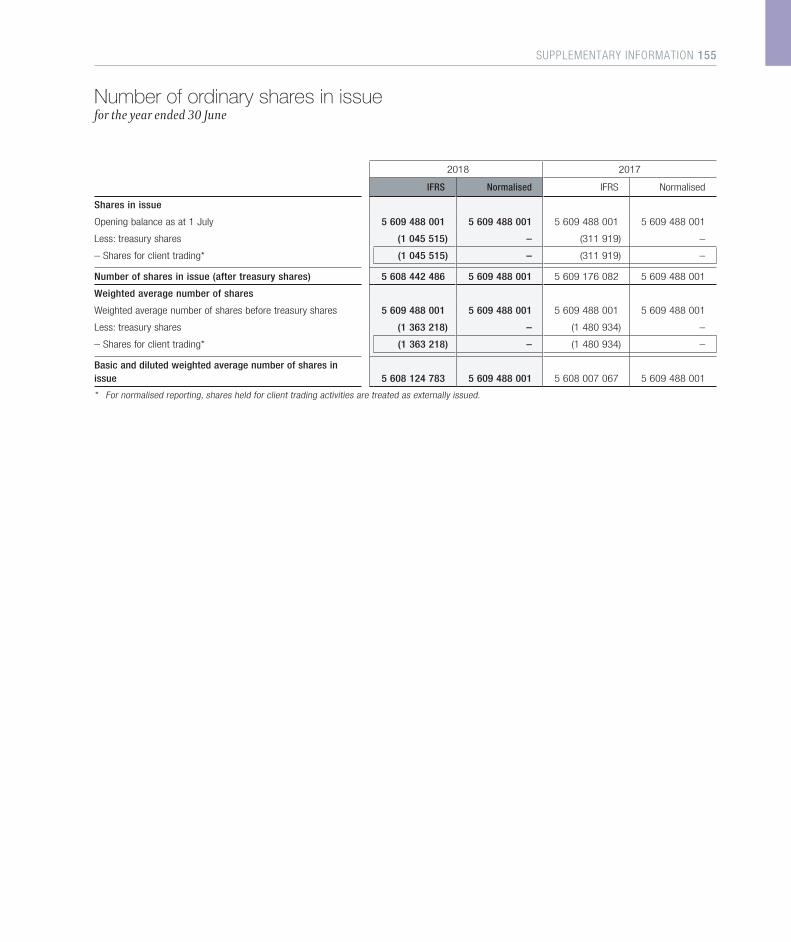
2018 2017
IFRS Normalised IFRS Normalised
Shares in issue
Opening balance as at 1 July 5 609 488 001 5 609 488 001 5 609 488 001 5 609 488 001
Less: treasury shares (1 045 515) – (311 919) –
– Shares for client trading* (1 045 515) – (311 919) –
Number of shares in issue (after treasury shares) 5 608 442 486 5 609 488 001 5 609 176 082 5 609 488 001
Weighted average number of shares
Weighted average number of shares before treasury shares 5 609 488 001 5 609 488 001 5 609 488 001 5 609 488 001
Less: treasury shares (1 363 218) – (1 480 934) –
– Shares for client trading* (1 363 218) – (1 480 934) –
Basic and diluted weighted average number of shares in issue 5 608 124 783 5 609 488 001 5 608 007 067 5 609 488 001
* For normalised reporting, shares held for client trading activities are treated as externally issued.
Number of ordinary shares in issue for the year ended 30 June
SUPPLEMENTARY INFORMATION 155
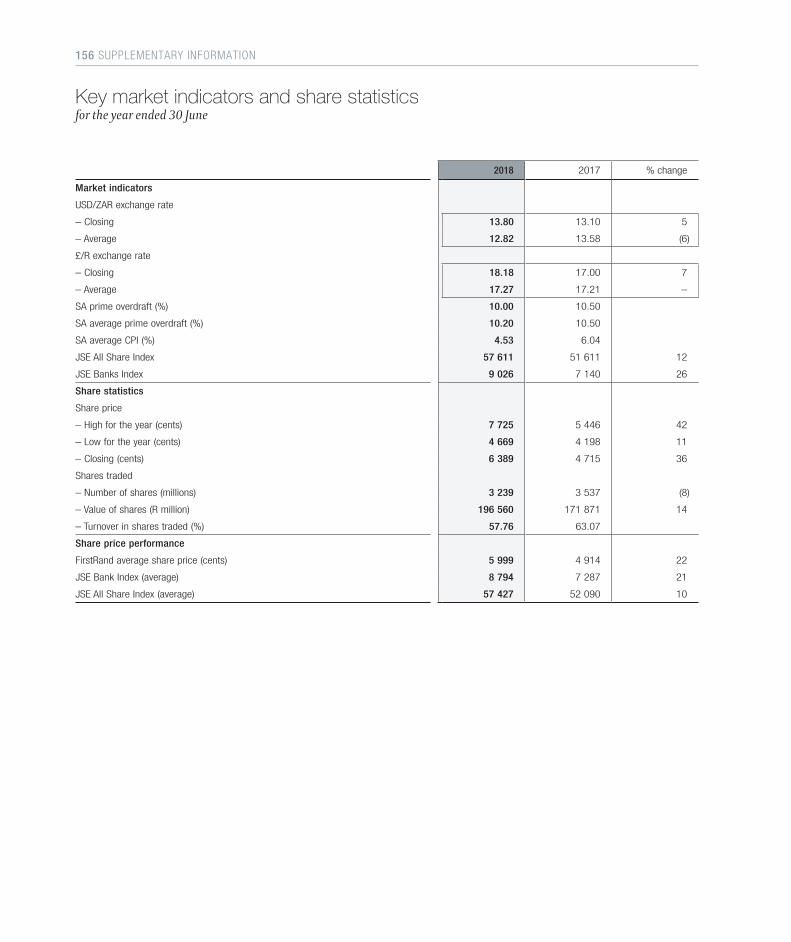
2018 2017 % change
Market indicators
USD/ZAR exchange rate
– Closing 13.80 13.10 5
– Average 12.82 13.58 (6)
£/R exchange rate
– Closing 18.18 17.00 7
– Average 17.27 17.21 –
SA prime overdraft (%) 10.00 10.50
SA average prime overdraft (%) 10.20 10.50
SA average CPI (%) 4.53 6.04
JSE All Share Index 57 611 51 611 12
JSE Banks Index 9 026 7 140 26
Share statistics
Share price
– High for the year (cents) 7 725 5 446 42
– Low for the year (cents) 4 669 4 198 11
– Closing (cents) 6 389 4 715 36
Shares traded
– Number of shares (millions) 3 239 3 537 (8)
– Value of shares (R million) 196 560 171 871 14
– Turnover in shares traded (%) 57.76 63.07
Share price performance
FirstRand average share price (cents) 5 999 4 914 22
JSE Bank Index (average) 8 794 7 287 21
JSE All Share Index (average) 57 427 52 090 10
Key market indicators and share statistics for the year ended 30 June
156 SUPPLEMENTARY INFORMATION

DIRECTORSWR Jardine (chairman), AP Pullinger (CEO), HS Kellan (financial director), M Vilakazi (COO with effect from 1 July 2018), JP Burger (non-executive with effect from 1 September 2018), MS Bomela, HL Bosman, JJ Durand (alternate with effect from 3 September 2018), GG Gelink, NN Gwagwa, F Knoetze, RM Loubser, PJ Makosholo, TS Mashego, EG Matenge-Sebesho, AT Nzimande, T Winterboer
COMPANY SECRETARY AND REGISTERED OFFICEC Low4 Merchant Place, Corner Fredman Drive and Rivonia RoadSandton 2196PO Box 650149, Benmore 2010Tel: +27 11 282 1808Fax: +27 11 282 8088Website: www.firstrand.co.za
JSE SPONSORRand Merchant Bank (a division of FirstRand Bank Limited)Corporate Finance1 Merchant Place, Corner Fredman Drive and Rivonia RoadSandton 2196Tel: +27 11 282 8000 Fax: +27 11 282 4184
NAMIBIAN SPONSORSimonis Storm Securities (Pty) Ltd4 Koch StreetKlein WindhoekNamibia
Company information
TRANSFER SECRETARIES – SOUTH AFRICAComputershare Investor Services (Pty) Ltd1st Floor, Rosebank Towers15 Biermann AvenueRosebank, Johannesburg 2196PO Box 61051, Marshalltown 2107 Tel: +27 11 370 5000Fax: +27 11 688 5248
TRANSFER SECRETARIES – NAMIBIATransfer Secretaries (Pty) Ltd4 Robert Mugabe Avenue, WindhoekPO Box 2401, Windhoek, Namibia Tel: +264 612 27647Fax: +264 612 48531
AUDITORSPricewaterhouseCoopers Inc.4 Lisbon LaneWaterfall CityJukskei View2090
Deloitte & ToucheDeloitte PlaceThe Woodlands20 Woodlands DriveWoodmead, Sandton2052
SUPPLEMENTARY INFORMATION 157
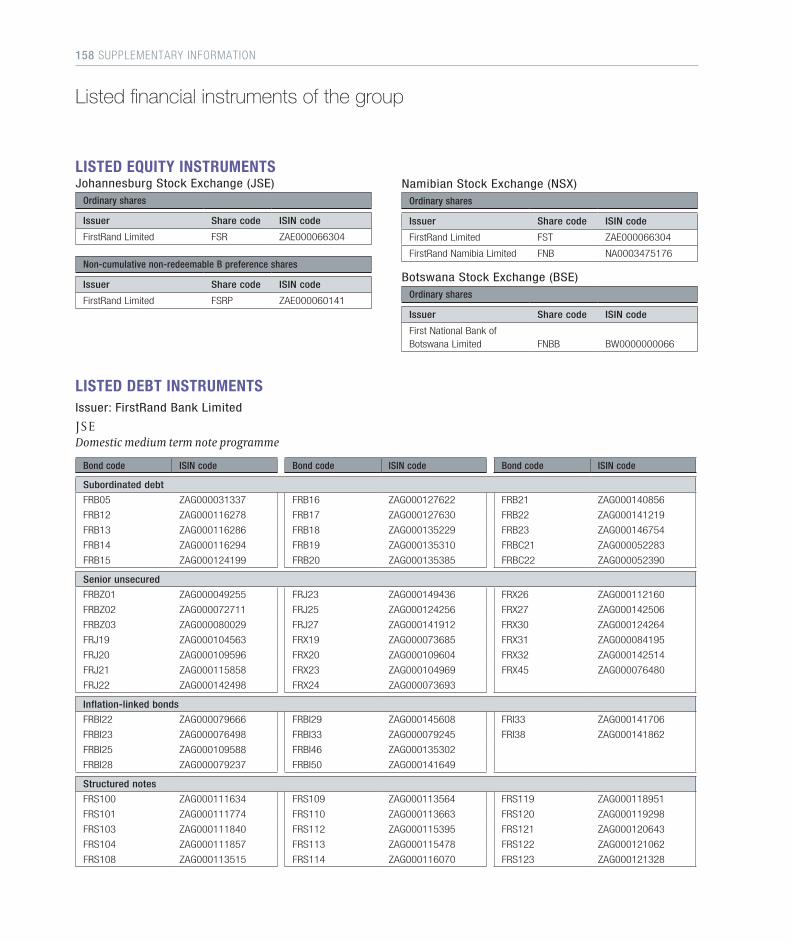
LISTED EQUITY INSTRUMENTSJohannesburg Stock Exchange (JSE)
Ordinary shares
Issuer Share code ISIN code
FirstRand Limited FSR ZAE000066304
Non-cumulative non-redeemable B preference shares
Issuer Share code ISIN code
FirstRand Limited FSRP ZAE000060141
Listed financial instruments of the group
Namibian Stock Exchange (NSX)Ordinary shares
Issuer Share code ISIN code
FirstRand Limited FST ZAE000066304
FirstRand Namibia Limited FNB NA0003475176
Botswana Stock Exchange (BSE)Ordinary shares
Issuer Share code ISIN code
First National Bank of Botswana Limited FNBB BW0000000066
LISTED DEBT INSTRUMENTSIssuer: FirstRand Bank Limited
J S EDomestic medium term note programme
Bond code ISIN code Bond code ISIN code Bond code ISIN code
Subordinated debt
FRB05 ZAG000031337 FRB16 ZAG000127622 FRB21 ZAG000140856
FRB12 ZAG000116278 FRB17 ZAG000127630 FRB22 ZAG000141219
FRB13 ZAG000116286 FRB18 ZAG000135229 FRB23 ZAG000146754
FRB14 ZAG000116294 FRB19 ZAG000135310 FRBC21 ZAG000052283
FRB15 ZAG000124199 FRB20 ZAG000135385 FRBC22 ZAG000052390
Senior unsecured
FRBZ01 ZAG000049255 FRJ23 ZAG000149436 FRX26 ZAG000112160
FRBZ02 ZAG000072711 FRJ25 ZAG000124256 FRX27 ZAG000142506
FRBZ03 ZAG000080029 FRJ27 ZAG000141912 FRX30 ZAG000124264
FRJ19 ZAG000104563 FRX19 ZAG000073685 FRX31 ZAG000084195
FRJ20 ZAG000109596 FRX20 ZAG000109604 FRX32 ZAG000142514
FRJ21 ZAG000115858 FRX23 ZAG000104969 FRX45 ZAG000076480
FRJ22 ZAG000142498 FRX24 ZAG000073693
Inflation-linked bonds
FRBI22 ZAG000079666 FRBI29 ZAG000145608 FRI33 ZAG000141706
FRBI23 ZAG000076498 FRBI33 ZAG000079245 FRI38 ZAG000141862
FRBI25 ZAG000109588 FRBI46 ZAG000135302
FRBI28 ZAG000079237 FRBI50 ZAG000141649
Structured notes
FRS100 ZAG000111634 FRS109 ZAG000113564 FRS119 ZAG000118951
FRS101 ZAG000111774 FRS110 ZAG000113663 FRS120 ZAG000119298
FRS103 ZAG000111840 FRS112 ZAG000115395 FRS121 ZAG000120643
FRS104 ZAG000111857 FRS113 ZAG000115478 FRS122 ZAG000121062
FRS108 ZAG000113515 FRS114 ZAG000116070 FRS123 ZAG000121328
158 SUPPLEMENTARY INFORMATION
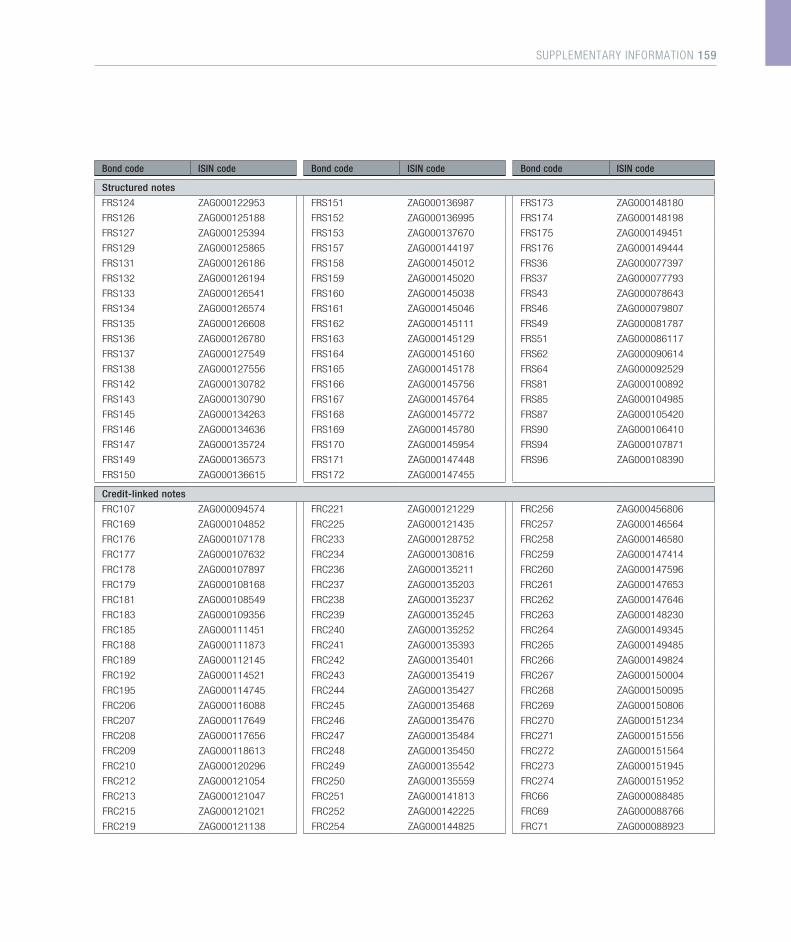
Bond code ISIN code Bond code ISIN code Bond code ISIN code
Structured notes
FRS124 ZAG000122953 FRS151 ZAG000136987 FRS173 ZAG000148180
FRS126 ZAG000125188 FRS152 ZAG000136995 FRS174 ZAG000148198
FRS127 ZAG000125394 FRS153 ZAG000137670 FRS175 ZAG000149451
FRS129 ZAG000125865 FRS157 ZAG000144197 FRS176 ZAG000149444
FRS131 ZAG000126186 FRS158 ZAG000145012 FRS36 ZAG000077397
FRS132 ZAG000126194 FRS159 ZAG000145020 FRS37 ZAG000077793
FRS133 ZAG000126541 FRS160 ZAG000145038 FRS43 ZAG000078643
FRS134 ZAG000126574 FRS161 ZAG000145046 FRS46 ZAG000079807
FRS135 ZAG000126608 FRS162 ZAG000145111 FRS49 ZAG000081787
FRS136 ZAG000126780 FRS163 ZAG000145129 FRS51 ZAG000086117
FRS137 ZAG000127549 FRS164 ZAG000145160 FRS62 ZAG000090614
FRS138 ZAG000127556 FRS165 ZAG000145178 FRS64 ZAG000092529
FRS142 ZAG000130782 FRS166 ZAG000145756 FRS81 ZAG000100892
FRS143 ZAG000130790 FRS167 ZAG000145764 FRS85 ZAG000104985
FRS145 ZAG000134263 FRS168 ZAG000145772 FRS87 ZAG000105420
FRS146 ZAG000134636 FRS169 ZAG000145780 FRS90 ZAG000106410
FRS147 ZAG000135724 FRS170 ZAG000145954 FRS94 ZAG000107871
FRS149 ZAG000136573 FRS171 ZAG000147448 FRS96 ZAG000108390
FRS150 ZAG000136615 FRS172 ZAG000147455
Credit-linked notes
FRC107 ZAG000094574 FRC221 ZAG000121229 FRC256 ZAG000456806
FRC169 ZAG000104852 FRC225 ZAG000121435 FRC257 ZAG000146564
FRC176 ZAG000107178 FRC233 ZAG000128752 FRC258 ZAG000146580
FRC177 ZAG000107632 FRC234 ZAG000130816 FRC259 ZAG000147414
FRC178 ZAG000107897 FRC236 ZAG000135211 FRC260 ZAG000147596
FRC179 ZAG000108168 FRC237 ZAG000135203 FRC261 ZAG000147653
FRC181 ZAG000108549 FRC238 ZAG000135237 FRC262 ZAG000147646
FRC183 ZAG000109356 FRC239 ZAG000135245 FRC263 ZAG000148230
FRC185 ZAG000111451 FRC240 ZAG000135252 FRC264 ZAG000149345
FRC188 ZAG000111873 FRC241 ZAG000135393 FRC265 ZAG000149485
FRC189 ZAG000112145 FRC242 ZAG000135401 FRC266 ZAG000149824
FRC192 ZAG000114521 FRC243 ZAG000135419 FRC267 ZAG000150004
FRC195 ZAG000114745 FRC244 ZAG000135427 FRC268 ZAG000150095
FRC206 ZAG000116088 FRC245 ZAG000135468 FRC269 ZAG000150806
FRC207 ZAG000117649 FRC246 ZAG000135476 FRC270 ZAG000151234
FRC208 ZAG000117656 FRC247 ZAG000135484 FRC271 ZAG000151556
FRC209 ZAG000118613 FRC248 ZAG000135450 FRC272 ZAG000151564
FRC210 ZAG000120296 FRC249 ZAG000135542 FRC273 ZAG000151945
FRC212 ZAG000121054 FRC250 ZAG000135559 FRC274 ZAG000151952
FRC213 ZAG000121047 FRC251 ZAG000141813 FRC66 ZAG000088485
FRC215 ZAG000121021 FRC252 ZAG000142225 FRC69 ZAG000088766
FRC219 ZAG000121138 FRC254 ZAG000144825 FRC71 ZAG000088923
SUPPLEMENTARY INFORMATION 159
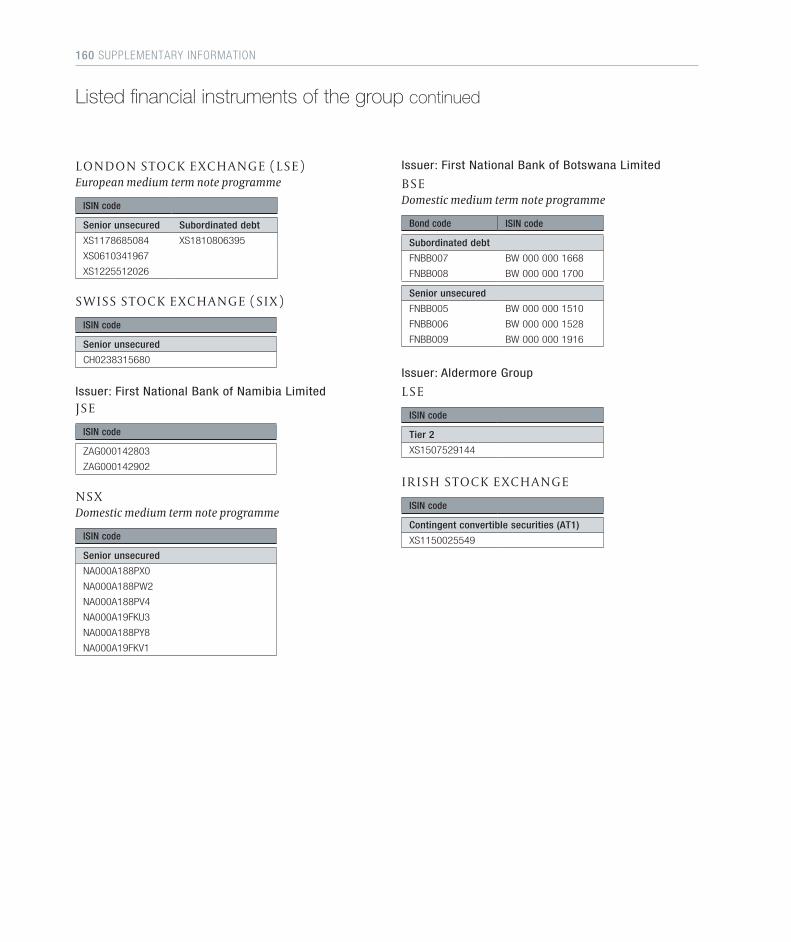
Listed financial instruments of the group continued
L O N D O N S T O C K E XC H A N G E ( L S E)European medium term note programme
ISIN code
Senior unsecured Subordinated debt
XS1178685084 XS1810806395
XS0610341967
XS1225512026
S W I S S S T O C K E XC H A N G E ( S I X)
ISIN code
Senior unsecured
CH0238315680
Issuer: First National Bank of Namibia Limited J S E
ISIN code
ZAG000142803
ZAG000142902
N S XDomestic medium term note programme
ISIN code
Senior unsecured
NA000A188PX0
NA000A188PW2
NA000A188PV4
NA000A19FKU3
NA000A188PY8
NA000A19FKV1
Issuer: First National Bank of Botswana Limited
B S EDomestic medium term note programme
Bond code ISIN code
Subordinated debt
FNBB007 BW 000 000 1668
FNBB008 BW 000 000 1700
Senior unsecured
FNBB005 BW 000 000 1510
FNBB006 BW 000 000 1528
FNBB009 BW 000 000 1916
Issuer: Aldermore Group
L S E
ISIN code
Tier 2
XS1507529144
I R I S H S T O C K E XC H A N G E
ISIN code
Contingent convertible securities (AT1)
XS1150025549
160 SUPPLEMENTARY INFORMATION
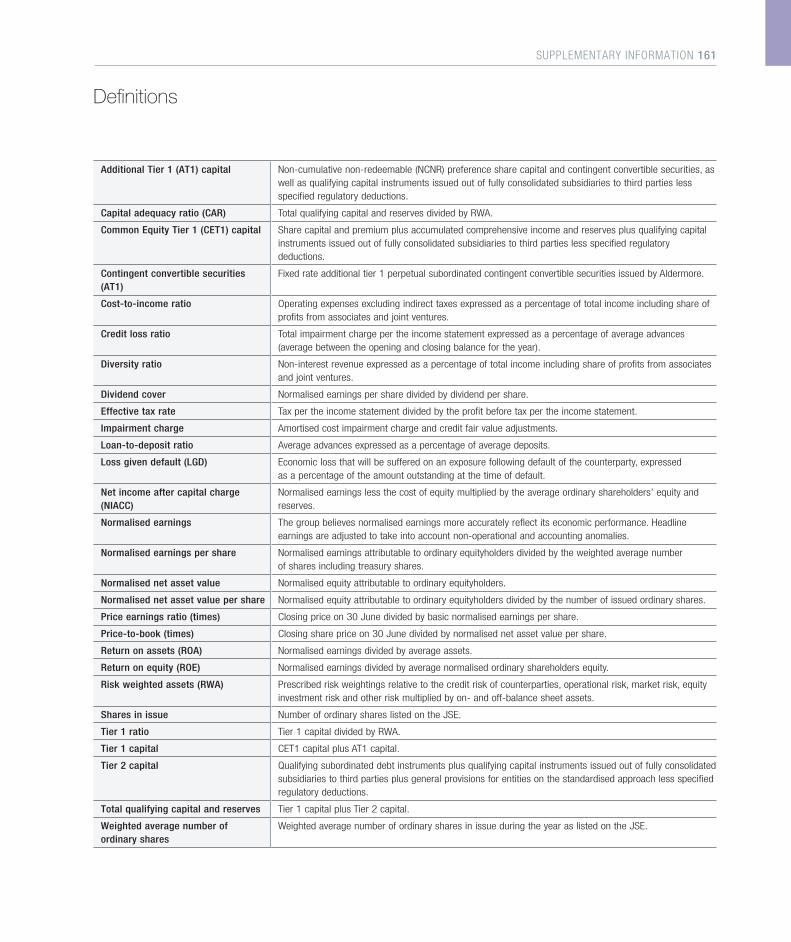
Additional Tier 1 (AT1) capital Non-cumulative non-redeemable (NCNR) preference share capital and contingent convertible securities, as well as qualifying capital instruments issued out of fully consolidated subsidiaries to third parties less specified regulatory deductions.
Capital adequacy ratio (CAR) Total qualifying capital and reserves divided by RWA.
Common Equity Tier 1 (CET1) capital Share capital and premium plus accumulated comprehensive income and reserves plus qualifying capital instruments issued out of fully consolidated subsidiaries to third parties less specified regulatory deductions.
Contingent convertible securities (AT1)
Fixed rate additional tier 1 perpetual subordinated contingent convertible securities issued by Aldermore.
Cost-to-income ratio Operating expenses excluding indirect taxes expressed as a percentage of total income including share of profits from associates and joint ventures.
Credit loss ratio Total impairment charge per the income statement expressed as a percentage of average advances (average between the opening and closing balance for the year).
Diversity ratio Non-interest revenue expressed as a percentage of total income including share of profits from associates and joint ventures.
Dividend cover Normalised earnings per share divided by dividend per share.
Effective tax rate Tax per the income statement divided by the profit before tax per the income statement.
Impairment charge Amortised cost impairment charge and credit fair value adjustments.
Loan-to-deposit ratio Average advances expressed as a percentage of average deposits.
Loss given default (LGD) Economic loss that will be suffered on an exposure following default of the counterparty, expressed as a percentage of the amount outstanding at the time of default.
Net income after capital charge (NIACC)
Normalised earnings less the cost of equity multiplied by the average ordinary shareholders’ equity and reserves.
Normalised earnings The group believes normalised earnings more accurately reflect its economic performance. Headline earnings are adjusted to take into account non-operational and accounting anomalies.
Normalised earnings per share Normalised earnings attributable to ordinary equityholders divided by the weighted average number of shares including treasury shares.
Normalised net asset value Normalised equity attributable to ordinary equityholders.
Normalised net asset value per share Normalised equity attributable to ordinary equityholders divided by the number of issued ordinary shares.
Price earnings ratio (times) Closing price on 30 June divided by basic normalised earnings per share.
Price-to-book (times) Closing share price on 30 June divided by normalised net asset value per share.
Return on assets (ROA) Normalised earnings divided by average assets.
Return on equity (ROE) Normalised earnings divided by average normalised ordinary shareholders equity.
Risk weighted assets (RWA) Prescribed risk weightings relative to the credit risk of counterparties, operational risk, market risk, equity investment risk and other risk multiplied by on- and off-balance sheet assets.
Shares in issue Number of ordinary shares listed on the JSE.
Tier 1 ratio Tier 1 capital divided by RWA.
Tier 1 capital CET1 capital plus AT1 capital.
Tier 2 capital Qualifying subordinated debt instruments plus qualifying capital instruments issued out of fully consolidated subsidiaries to third parties plus general provisions for entities on the standardised approach less specified regulatory deductions.
Total qualifying capital and reserves Tier 1 capital plus Tier 2 capital.
Weighted average number of ordinary shares
Weighted average number of ordinary shares in issue during the year as listed on the JSE.
Definitions
SUPPLEMENTARY INFORMATION 161
ASF Available stable funding.
AT1 Additional Tier 1 capital.
AUA Assets under administration.
AUE Assets under execution.
AUM Assets under management.
BCBS Basel Committee for Banking Supervision.
BEE Black economic empowerment.
BIS Bank of International Settlements.
BSE Botswana Stock Exchange.
C&TB Corporate and transactional banking.
CAGR Compound annual growth rate.
Capex Capital expenditure.
CAR Capital adequacy ratio.
CB RMB corporate banking.
CCyB Capital conservative counter cyclical.
CET1 Common Equity Tier 1 capital.
CIB RMB corporate and investment banking.
CIS Collective investment scheme.
CLF Committed liquidity facility.
DIS Deposit insurance scheme.
D-SIB Domestic systemically important banks.
DWT Dividend withholding tax.
EMTN European medium term note programme.
EPS Earnings per share.
FML Full maintenance leasing.
FNB First National Bank.
FREMA FirstRand EMA Holdings (Pty) Ltd.
FRIHL FirstRand Investment Holdings (Pty) Ltd.
FSB Financial Services Board.
FSR FirstRand Limited.
GBP British Pound.
HQLA High quality liquid assets.
IB RMB investment banking.
IB&A Investment banking and advisory.
IM Investment management.
INV Investing.
ISP Interest in suspense.
JSE Johannesburg Stock Exchange.
Abbreviations
LCR Liquidity coverage ratio.
LGD Loss given default.
LISP Linked investment service provider.
LSE London Stock Exchange.
M&S Markets and structuring.
MCA Market Conduct Authority.
MTM Mark-to-market.
NCAA National Credit Amendment Act.
NCNR Non-cumulative non-redeemable.
NIACC Net income after capital charge.
NII Net interest income.
NIR Non-interest revenue.
NPLs Non-performing loans.
NSFR Net stable funding ratio.
NSX Namibian Stock Exchange.
PA Prudential Authority.
P/E Price earnings.
RA Resolution Authority.
RMB Rand Merchant Bank.
ROA Return on assets.
ROE Return on equity.
RPS Required stable funding.
RWA Risk weighted assets.
S&P S&P Global Ratings.
SAICA South African Institute of Chartered Accountants.
SARB South African Reserve Bank.
SIX Swiss Stock Exchange.
SRB Special Resolution Bill.
TLAC Total loss absorbing capacity.
TRS Total return swap.
UK United Kingdom.
VAF Vehicle asset finance.
VAPS Value added products and services.
WIM Wealth and investment management.
162 SUPPLEMENTARY INFORMATION

163

164


www.firstrand.co.za


![Lodhi 5 Properties Investments CC v FirstRand Bank Limited ... · Lodhi 5 Properties Investments CC v FirstRand Bank Limited [2015] 3 All SA 32 (SCA) and the Enforcement of Islamic](https://static.fdocuments.in/doc/165x107/5e1a6cf4f34a4c6ae529490a/lodhi-5-properties-investments-cc-v-firstrand-bank-limited-lodhi-5-properties.jpg)