Overview of public transport in Sub-Saharan Africa
84
Overview of public transport in Sub-Saharan Africa
Transcript of Overview of public transport in Sub-Saharan Africa

Overview of public transport in Sub-Saharan Africa
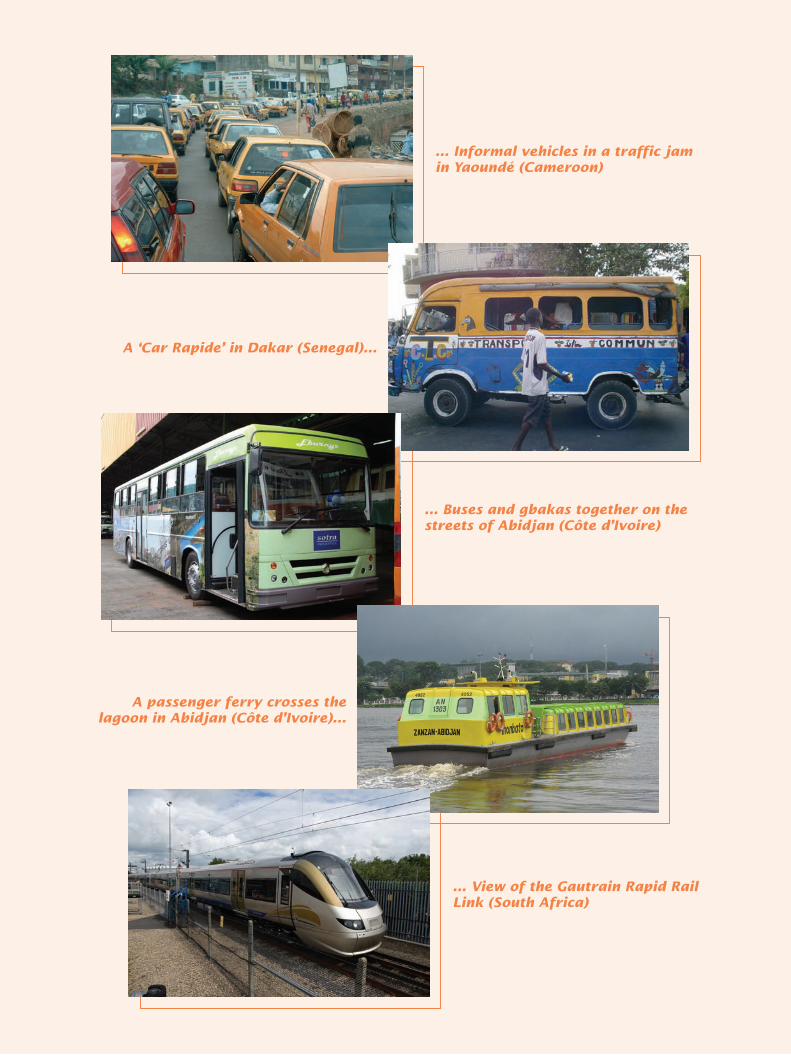
... Informal vehicles in a traffic jam in Yaoundé (Cameroon)
A ‘Car Rapide’ in Dakar (Senegal)...
... Buses and gbakas together on the streets of Abidjan (Côte d’Ivoire)
A passenger ferry crosses the lagoon in Abidjan (Côte d’Ivoire)...
... View of the Gautrain Rapid Rail Link (South Africa)
Overview of public transport in Sub-Saharan Africa

TRANS-AFRICA2
Important notice:
This is a consultation draft of “Overview of public transport in Sub-Saharan Africa”.
The views and interpretations herein are those of the authors and should not be attributed to the European Commis-sion or to UITP, to their affiliated organizations, or to any individual acting on their behalf.
Dépot Légal: D/2008/0105/25
Copyright ©2008 Trans-Africa Consortium
Published by the Trans-Africa Consortium
This study is subject to a disclaimer and copyright.
This study has been carried out for the Directorate-General for Research in the European Commission.
Copyright in this study is held by the TRANS-AFRICA Consortium. Persons wishing to use the contents of this study (in whole or in part) for purposes other than their personal use are invited to submit a written request to the follow-ing address:
UITP - International Association of Public Transport
Rue Sainte-Marie 61080 BrusselsBelgium

TRANS-AFRICA 3
A formerly neglected area, the transport sector is drawing growing attention from the African public authorities, economic analysts and international donors as an essential vector of growth, poverty reduction and sustainable human development. The declarations of the African ministers of trans-
port and infrastructure on 6 April 2005 in Addis-Ababa (Ethiopia) and on 17 November 2005 in Bamako (Mali) provide some perfect examples.
Through this gradual awareness, actions taken so far seem to be mostly oriented towards interregional, interurban and rural transport, found to be more socially and economically effective than urban transport. But given that the majority of Sub-Saharan African inhabitants are expected to be living in urban areas by 2025, it is imperative that measures be conceived and applied to anticipate these major urban mobility challenges, otherwise the precarious socio-economic balance of our African metropolises might again be affected.
It is now unanimously acknowledged that such access for populations to sustainable mobility could not take place without the implementation of bold policies for public transport development.
It is within this dynamic that the Trans-Africa project is conceived, led for two years by the International Association of Public Transport (UITP) and the African Association of Public Transport (UATP) with the financial involvement of the European Commission. This project aims at supporting the African national transport policies by studying different perspectives and feasibilities of sustainable public transport de-velopment on the African continent.
The key outputs expected at the end of this study are an overall review of the state of play of public transport in Africa, the definition of public transport performance indicators in several African cities, the determination of basic technical specifications of vehicles best adapted for public transport operation on the African continent as well as the issuing of recommendations inspired therefrom.
It is clear that the Trans-Africa project represents a unique initiative for the development of the African public transport sector, which all actors should appropriate and develop.
Ousmane Thiam
President of the African Association of Public Transport (UATP)
Vice-President of the International Association of Public Transport (UITP)

TRANS-AFRICA4
This report is part of the findings of the ‘Trans-Africa’ Project supported by the European Commission and with primary aim to promote public transport in Africa. It constitutes a first part and aims at making an inventory of regulatory, operational and technical conditions of public transport activity
in Africa.
It has been performed by a team of two staff members of the Trans-Africa Consortium: Eric Kouakou and Djan Fanny, Project Managers in the International Association of Public Transport (UITP) and the African As-sociation of Public Transport (UATP) respectively, under the technical supervision of Tony Dufays, Regional Development Director at UITP and Trans-Africa Coordinator. The UITP-EuroTeam in the persons of Sebas-tian Emig and Izaskun Arenaza also contributed with regard to the administrative aspects of the project.
This report is mainly based on information collected from different structures responsible for public trans-port management in the African countries such as Ministries for Transport, Organising Authorities and Municipalities, but also public transport operators. Extensive documental research also helped to refine and compare the different pieces of information received.
We would like to express our gratitude to all public transport professionals who cannot be exhaustively named here and who have contributed in some form to the drafting of this report, notably by answering our questionnaire and frequent requests, among them the UATP and UITP members who have been the backbone of this external input.
We would also like to recognize the significant support of UITP and UATP management for their invaluable assistance along with their respective staff, namely:
Hans Rat, Secretary General of UITP
Ousmane Thiam, President of UATP
Joseph Assafoua Aka, Secretary General of UATP
Brigitte Ollier, Director of the UITP-EuroTeam Division
It should be pointed out that this report constitutes only a first approach in our attempt to present an overview of public transport development in Africa and it obviously needs to be enriched, fine-tuned and regularly updated. The project team does not therefore claim to have provided an exhaustive work and your various contributions are greatly welcomed to improve its content.
Acknowledgements

TRANS-AFRICA 5
The Trans-Africa project aims to promote public transport in Sub-Saharan Africa taking into account that this sector remains globally unaddressed throughout the continent. In this perspective, this project is made up of different parts built in a logical succession. This report addresses the first part,
consisting of a global overview of the public transport situation in each Sub-Saharan Africa country.
This project, supported by the European Commission, has been entrusted to UITP and UATP as bodies experienced in the public transport field to carry it out. UITP has over 3,100 members in 90 countries throughout the world and represents the interests of key players in this sector. Its membership includes transport authorities, operators, both private and public, in all modes of collective passenger transport, and the industry. UITP addresses the economic, technical, organisation and management aspects of pas-senger transport, as well as the development of policy for mobility and public transport. UATP was created on 15 November 2002 aiming at gathering all the public transport actors in Sub-Saharan Africa in order to lead the necessary reflections for the development of organized public transport and promotion of better mobility for people and goods in Africa. It has around 50 members. Bound by a protocol agreement, UATP acts as the Sub-Saharan Africa Division of UITP.
Through a large-scale survey with all the public transport actors in Sub-Saharan Africa, authorities as well as operators, this part presents the current public transport environment on the African continent empha-sising notably the level of regulatory and institutional reform, current operational mechanisms and the past and current threats to the proper functioning of the transport system. The report does not intend to give a detailed study of each case but will provide the reader with an overall idea of the level of public transport in Africa.
Besides, this report highlights the technical maintenance issues that African operators specifically face, as an introduction to the second part of the project in which the technical specification for buses to operate in Africa will be defined.
As an introductory stage, this part of the project does not aim at providing solutions but will attempt to outline avenues to be explored later in the course of the project.
It is to be noted that one of main challenges faced by the project team is the lack of available information on the subject. Apart from some few countries where public transport is already monitored and especially where organising authorities have been established, the data were quite difficult to obtain mostly either because they do not exist under the expected form and are scattered among several bodies and not computerised, or because of the slowness of the bureaucracy which does not permit us to obtain them on time. In many African countries also, public transport is still poorly developed and draws a very little interest. The consequence is a lack of reliable information.
Nevertheless, the project team tried to provide an estimation of the public transport market split as close to the reality as possible for each country.
The Project Team
Introduction

TRANS-AFRICA6
The history of public transport development in Sub-Saharan Africa varies from one country to an-other. However, to date we may affirm that it is a sector which remains poorly organised across the continent. Many companies were created in various countries, even several times in the same
country, but the vast majority of them have failed. This part assesses the present organisation of public transport in each country of Sub-Saharan Africa to better understand the current situation and possibly the facts that led to it. Clearly, the disorder that is prevalent in the sector implies poorly reliable statistics and the attempt to evaluate the number of transport units remains everywhere a great challenge, very often for the authorities themselves.
Among others, technical maintenance issues represent an important share of the difficulties of the public transport companies and main source of their failures.
Therefore, the study also reviews the environmental operating conditions for African fleet, outlining their impacts on vehicle operation as well as the key technical features of buses to be able to operate. How-ever, this part will only consist in providing an overview as the second part of the Trans-Africa Project will specifically deal with this aspect.
Generally, public transport operators are confronted with numerous problems, one of the most crucial be-ing the insufficient and inadequate transport infrastructures.
In such a context, the result is a struggle for survival due mainly to the costs to be borne in order to con-tinue the transport activity. The difficulty in securing spare parts combined with recurrent breakdowns fre-quently leads operators to carry out structural modifications to vehicles. Taking into consideration these difficulties and individual or collective measures taken by the operators, working bases will be established within the framework of this project with a view to drawing up specifications for an African bus.
Executive summary

TRANS-AFRICA 7
Table of contents
Central AfricaCameroon ______________________________________________________________________________________________________8Central African Republic ________________________________________________________________________________________9Chad _________________________________________________________________________________________________________ 11Congo Brazzaville ____________________________________________________________________________________________ 12Democratic Republic of Congo ________________________________________________________________________________ 13Equatorial Guinea ____________________________________________________________________________________________ 15Gabon _______________________________________________________________________________________________________ 16
Eastern AfricaBurundi ______________________________________________________________________________________________________ 18Comoros _____________________________________________________________________________________________________ 19Djibouti ______________________________________________________________________________________________________ 20Eritrea _______________________________________________________________________________________________________ 22Ethiopia ______________________________________________________________________________________________________ 23Kenya ________________________________________________________________________________________________________ 25Rwanda ______________________________________________________________________________________________________ 27Seychelles____________________________________________________________________________________________________ 28Somalia ______________________________________________________________________________________________________ 29Tanzania _____________________________________________________________________________________________________ 30Uganda ______________________________________________________________________________________________________ 32
Western AfricaBenin ________________________________________________________________________________________________________ 34Burkina Faso _________________________________________________________________________________________________ 35Cape Verde ___________________________________________________________________________________________________ 37Cote D’Ivoire _________________________________________________________________________________________________ 38Gambia ______________________________________________________________________________________________________ 39Ghana _______________________________________________________________________________________________________ 40Guinea Bissau ________________________________________________________________________________________________ 42Guinea Conakry ______________________________________________________________________________________________ 43Liberia _______________________________________________________________________________________________________ 44Mali __________________________________________________________________________________________________________ 46Niger ________________________________________________________________________________________________________ 47Nigeria _______________________________________________________________________________________________________ 48Senegal ______________________________________________________________________________________________________ 50Sierra Leone __________________________________________________________________________________________________ 51Togo _________________________________________________________________________________________________________ 52
Southern AfricaAngola _______________________________________________________________________________________________________ 54Botswana ____________________________________________________________________________________________________ 55Lesotho ______________________________________________________________________________________________________ 56Madagascar __________________________________________________________________________________________________ 57Malawi _______________________________________________________________________________________________________ 58Mauritius ____________________________________________________________________________________________________ 60Mozambique _________________________________________________________________________________________________ 61Namibia ______________________________________________________________________________________________________ 63South Africa __________________________________________________________________________________________________ 64Swaziland ____________________________________________________________________________________________________ 66Zambia ______________________________________________________________________________________________________ 67Zimbabwe ___________________________________________________________________________________________________ 68
Overview of different actors of the public transport system in Africa _______________________70
Review of operational conditions ______________________________________________________________72A. Operational conditions of public transport vehicles__________________________________________________________ 72B. Impacts of the operating conditions on public transport vehicles _____________________________________________ 74C. Reflections on solutions to be adopted by public transport operators ________________________________________ 76
Conclusions _____________________________________________________________________________________78
Bibliography _____________________________________________________________________________________79
Overview of current institutional and operational conditions for public transport in Sub-Saharan Africa
TRANS-AFRICA8
Public transport in Cameroon
I. BackgroundIn 1973 facing rapid urban growth and a lack of pub-lic transport, the Cameroon State decided to create the limited company SOTUC (Société des Transports Urbains du Cameroun) owned both by central govern-ment and the municipalities of Douala and Yaoundé, the two major cities in Cameroon. The company has since benefited from a public transport service mo-nopoly in these cities for 25 years. SOTUC experi-enced a prosperous period before falling gradually into a deep crisis for various reasons, including mis-management that led to an irreversible bankruptcy. SOTUC was dissolved on 22 February 1995 and the Cameroon government decided to liberalise public transport services in the cities of Douala and Yaoundé in the hope that the competition between operators would foster self-sufficient urban public transport not reliant on the financial intervention of the public authorities.
Since then motorised urban transport in these cities has been characterised by the operation of private vehicles namely shared taxis, minibuses and motor-cycle-taxis which, unfortunately, do not effectively meet demand in quantity and quality, especially dur-ing peak hours.
II. Public transport regulationIn Cameroon, public transport is overseen by the Min-istry of Transport. It includes a Department of Land
Transport involved in issues of urban and interurban transportation. It is responsible for the development and implementation of government policy on land transport, as well as the coordination, conception and implementation of related regulations.
Fares for buses, minibuses and shared taxis are con-trolled by the Government through the Ministries of Transport and Finance, which also decide on matters of routes and licensing.
In an attempt to protect the well organised public transport system and resolve the many negative ex-ternalities caused by the atomised market of small private operators, the government decided on one occasion to ban the operation of minibuses notably in Douala. However, the failure of the bus company to respond to real demand instead led to exponential growth in the use of shared taxis and motorcycle tax-is. Since then, the bulk of public transport in Douala has been provided by the informal sector.
III. Public transport operators
•LargebusesFollowing the bankruptcy of SOTUC in 1995, the vari-ous reforms carried out by the Cameroon government led to the launch of a bidding process for the selec-tion of a conventional large bus company able to op-erate on 15 fixed routes in Douala. Accordingly, a new bus company named SOCATUR (Société Camerounaise de Transport Urbain) owned by Cameroonian private
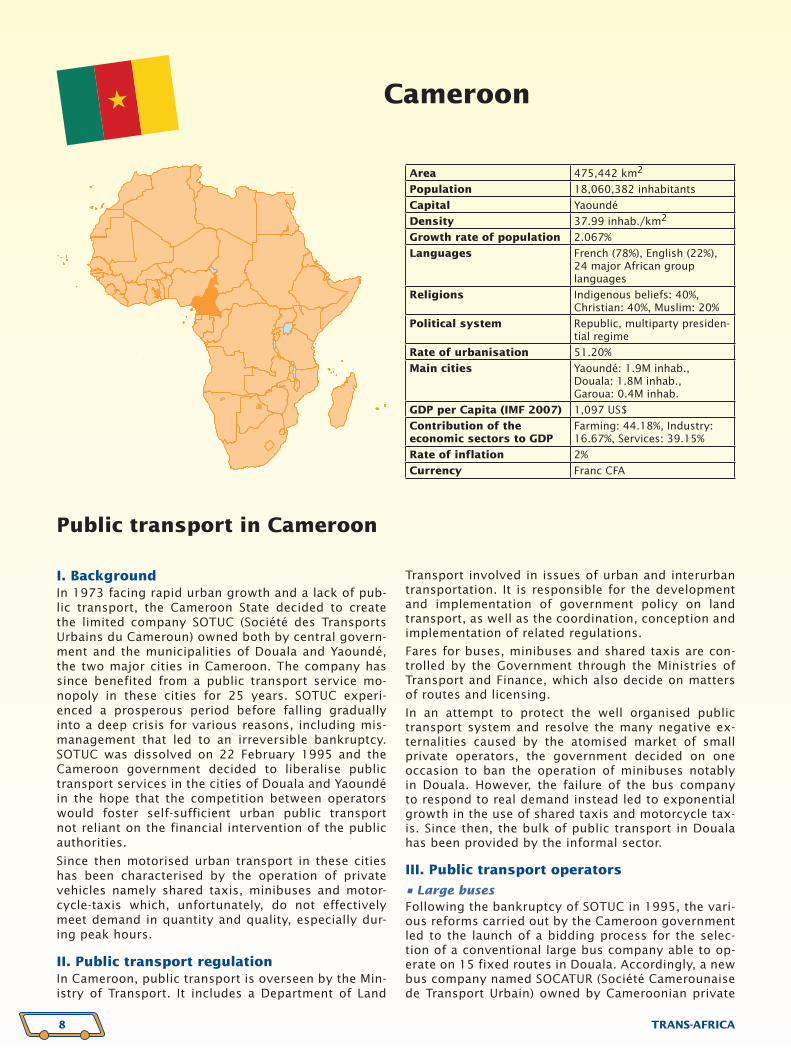
Cameroon
Area 475,442 km2
Population 18,060,382 inhabitants
Capital Yaoundé
Density 37.99 inhab./km2
Growth rate of population 2.067%
Languages French (78%), English (22%), 24 major African group languages
Religions Indigenous beliefs: 40%, Christian: 40%, Muslim: 20%
Political system Republic, multiparty presiden-tial regime
Rate of urbanisation 51.20%
Main cities Yaoundé: 1.9M inhab., Douala: 1.8M inhab., Garoua: 0.4M inhab.
GDP per Capita (IMF 2007) 1,097 US$
Contribution of the economic sectors to GDP
Farming: 44.18%, Industry: 16.67%, Services: 39.15%
Rate of inflation 2%
Currency Franc CFA

TRANS-AFRICA
Cen
tral
Afr
ica
9
investors started operating in January 2001. SOCATUR operated under a concession agreement that gave it the monopoly on public transport service in Douala for an initial five-year period. In addition, SOCATUR also signed a contract with the Urban Community of Douala which is in charge of the local organisation of transport. Presently, SOCATUR runs 70 buses of an av-erage age of 10-15 years providing 10% of daily trips in Douala.
SOCATUR in fact receives no government subsidy and contrary to SOTUC the company is not granted con-cessions on import duties or VAT, though fares are still controlled by the government and set at a low level. Finally, the poor condition of Doualan roads seems to be a major hindrance to the development and expan-sion of this company.
In Yaoundé, on 12 October 2005, the Government of Cameroon and Transnational Industries Cameroon (T.I.C. SA) a subsidiary of Transnational Automotive Group Inc. signed an agreement for TIC to estab-lish and manage the city bus system in Yaoundé and Douala. The company then created - “Le Bus” - subse-quently launched its operations in Yaoundé starting with 20 buses operating on two lines. Around 50 large buses now run, serving five routes.
•TraditionaltaxisIn Cameroon, there are about 9,000 to 10,000 yellow painted taxis in operation; all taxis are second-hand vehicles usually imported from Europe, and are gen-erally in poor condition. The ownership of the taxi fleet is highly dispersed, with very few owners having more than one vehicle; the taxis are legally required to join one of the eight official trade unions set to
defend their interests although some of them known as “clandos” are still reluctant. These traditional taxis operate primarily in two price formulas called “ride” and “course”. The “ride” fares are fixed by agreement between their unions and the government while the “course” (on hire) fares are most of time freely nego-tiated between users and drivers on a case-by-case basis.
•Motorcycle-taxisIn recent years in parallel to the growth in taxi opera-tions, there has been a spectacular growth in the use of motorcycle-taxis locally called “bend-skin” or “ben-sikin”. They are a very popular transport means espe-cially in Douala where they are estimated to number more than 10,000, representing 30% of the total pub-lic transport market in the city. Fares are negotiated between the parties before the trip.
However, the motorcycle-taxi is usually regarded as an unreliable transport means notably due to the bad driving of the drivers, which leads to a high rate of accidents involving motorcycle-taxis. It is estimated that most of the drivers have no driving licence. The attractiveness and reputation of bend-skins among the population appears to stem from their manoeu-vrability even on roads in poor condition.
•Taxi-busesThese are high capacity buses mostly used by em-ployees to go to work. They are also used for long distances journeys, for instance travelling between the towns.
Area 622,984 km2
Population 4,511,488 inhabitants
Capital Bangui
Density 7.24 inhab./km2
Growth rate of population 1.49%
Languages French, Sangho
Religions Indigenous beliefs: 35%, Protestant: 25%, Catholic: 25%, Muslim: 5%
Political system Republic
Rate of urbanisation 38.60%
Main cities Bangui: 0.8M inhab., Berberati: 0.05M inhab., Bouar: 0.04M inhab.
GDP per Capita (IMF 2007) 402 US$
Contribution of the economic sectors to GDP
Farming: 55.83%, Industry: 15.47%, Services: 28.70%
Rate of inflation 4%
Currency Franc CFA
Central African Republic

TRANS-AFRICA10
Public transport in Central African Republic
I. BackgroundThe capital of the Central African Republic, Bangui, has a population of about 800,000, representing 50% of the total urban population of the country which grows at a rate of about 5% per year. Almost all com-mercial and administrative state functions are concen-trated in the city.
In the late 1950s, a core of a well-organised public transport was set up by the French first in the form of large buses called “bus Raymond” and later through TUB (Transport Urbain à Bangui). The latter was trans-formed into a paragovernmental company called “So-ciété des Transports en Centrafrique” (SOTRECA) in 1967. In the 1970s, SOTRECA was nationalized be-coming the ‘Compagnie Nationale des Transports Routiers (CNTR)’. The successive fleets of these com-panies were always between 40 and 60 vehicles. Un-fortunately poor management led the CNTR into fi-nancial difficulties until its complete bankruptcy in September 1979, and CNTR vehicles were also subject to acts of vandalism and looting that took place at the end of the reign of Emperor Bokassa 1st.
Since the failure of this enterprise, the state disen-gaged itself from the public transport activity leaving the informal sector to take over with its minibus and taxi operations.
As a result, until today, Bangui has had no public trans-port by large bus and the sector is largely atomized and essentially based on the low capacity units of the informal sector, a source of much dysfunction.
In addition, the inadequate road infrastructure is un-able to cope with this growing road traffic which re-sults in congestion and various forms of pollution.
II. Public transport regulationThe Ministry of Transport and Civil Aviation is respon-sible for managing all transport activities in the Cen-tral African Republic and particularly public transport. The missions devolved to it are notably to develop and conceive the public transport policy, enforce the legal and regulatory framework for urban transport and issue licences and operating permits. It has also been assigned the responsibility for fares and route decisions.
Drivers and conductors of buses and taxis are grouped under one union called “Syndicat des Conducteurs et Receveurs des Taxis et Bus (SCRTB)” which defends their interests by taking part in consultation meetings and intervenes in cases of harassment or abuse from the authorities.
The City of Bangui also plays a role in public trans-port issues in term of provision of public transport infrastructures and urban equipment. As such, the bus shelters and terminals have been built by the city but in insufficient numbers and are poorly maintained due to a lack of financial resources. Overall, the road network is in a very poor condition and suffers from a
lack of effective maintenance plan. The City of Bangui also receives a quarterly fee for terminal parking from the various public transport operators.
III. Public transport operatorsPublic transport operators are essentially composed of minibuses and taxis with an offer of 15 and 4 seats respectively.
The fleet consists mainly of second-hand vehicles im-ported from Europe, though mostly Japanese brands.
Taxis perform intra-district and interurban (long-dis-tance) transport while the minibus routes generally serve the outskirts of cities.
Motorcycles recently made their appearance in the suburbs of Bangui. They were banned until August 2005 when the City council decided to allow their operation in this specific area. The intention was to enable a kind of collective transport where roads are narrow and in poor condition.

TRANS-AFRICA
Cen
tral
Afr
ica
11
Public transport in Chad
I. BackgroundChad is a landlocked country between Libya in the North, Sudan in the east, Central Africa Republic in the south and Cameroon, Nigeria and Niger in the West. The capital N’Djamena is situated more than 1,700km from the closest sea port implying that the transport sector as facilitator of trade plays an important role in the economy of Chad. Nevertheless, Chad’s history is marked by decades of internal and external conflicts that have delayed its development, and that of public transport in particular.
In Chad, and N’djamena is no exception, public transport is dominated by motorcycle-taxis locally known as “clan-do” that emerged in the late 1990s in the total absence of a formal high capacity bus company or railway serv-ice. This locally given nickname shows that despite their good reputation among the population, the acceptance of the “clando” is resisted by the Chadian authorities.
II. Public transport regulationTransport policy in general and public transport poli-cy in particular is under the responsibility of the Min-istry of Infrastructure through the State Secretariat in charge of Transport. This Ministry drafted a National Strategy of transport (SNT) for the period 2000-2009 with the major objectives of contributing to economic growth and poverty reduction. Since 2003, thanks to oil resources, the SNT has led to significant improve-ments in road transport infrastructure.
Most of the road transporters are registered with the Ministry of Transport in its Directorate of Surface Trans-port. This registration entitles the holder to a transpor-tation permit which must be renewed each year. The transporters are also grouped together in a coopera-tive and a Union of the carriers defending their inter-ests. However, most of the activities are informal.
A ministerial decree in 2002 fixed the terms and con-ditions of motorcycle-taxis’ operation throughout the country which includes for drivers the requirements to wear a helmet and a uniform. But this decree has not been implemented either by the operators or the authorities. In fact the motorcycle-taxi activity is not yet fully authorized and is effectively out of the con-trol of government. Thus in 2008 it was estimated that of the 8,000 motorcycle and taxi cars circulating in N’djamena only around 40 met the regulatory require-ments and had obtained the necessary permits.
III. Public transport operators
•Motorcycle-taxisThere are around 16,000 motorcycle-taxis in Chad as a whole, principally concentrated in the cities of the south. They are very practical given the poor roads of Chad, but offer little safety due to the bad road behav-iour of their drivers.
•TaxisThere are some taxis in N’Djamena but these are rath-er scarce in the evening except in front of the inter-
Chad
Area 1,284,200 km2
Population 10,542,141 inhabitants
Capital N’Djamena
Density 8.21 inhab./km2
Growth rate of population 2.96%
Languages Official languages: French, Arabic; Sara (in south), more than 120 different languages and dialects
Religions Muslim: 51%, Christian: 35%, Animist: 7%, other: 7%
Political system Republic
Rate of urbanisation 25.30%
Main cities N’Djamena: 1.6M inhab., Moundou: 0.2M inhab., Sarh: 0.2M inhab.
GDP per Capita (IMF 2007) 734 US$
Contribution of the economic sectors to GDP
Farming: 22.72%, Industry: 51.20%, Services: 26.08%
Rate of inflation 4%
Currency Franc CFA

TRANS-AFRICA12
national hotels and the best way to find one is to call by telephone.
It is necessary to know that in Chad there are neither regular buses nor bush taxi routes providing regular con-nections between the different cities.
IV. Public transport projectsA project currently under implementation can be men-tioned as having an impact on public transport provi-sion, especially intercity transport:
•TheProjectofsupportfortheNationalProgramoftransport(PAProNAT)
The objective of the ‘National Program of transport’ is to reduce the poverty and isolation of populations through improving access to markets and to social and administrative services, more particularly in rural areas (where 90% of the population still live).
The ‘National Program of transport’ also aims at im-proving food safety, a central problem in Chad where
repeated famines affect various regions of the coun-try. Besides, access to regional markets will contrib-ute to the reduction and the stabilisation of the price of basic goods and the stabilisation of incomes of the agricultural populations (mainly vulnerable and poor).
The PAProNaT project directly supports the implemen-tation of the National Program of transport.
Congo Brazzaville
Area 341,821 km2
Population 3,847,191 inhabitants
Capital Brazzaville
Density 11.25 inhab./km2
Growth rate of population 2.69%
Languages Official language: French; Trade languages: Lingala and Monokutuba
Religions Christian: 50%, Indigenous beliefs: 48%, Muslim: 2%
Political system Republic
Rate of urbanisation 62.20%
Main cities Brazzaville-Kinshasa: 1.3M inhab., Pointe Noire: 1M inhab., Dolisie (formerly Loubomo): 0.2M inhab.
GDP per Capita (IMF 2007) 2,159 US$
Contribution of the economic sectors to GDP
Farming: 5.60%, Industry: 57.10%, Services: 37.30%
Rate of inflation 7%
Currency Franc CFA
Public transport in Congo Brazzaville
I. BackgroundIn Congo, particularly in the capital Brazzaville, the supply of urban transportation has been characterised by an alternation of public management by the munic-ipality and private operations led by the informal sec-tor, although the latter have finally the virtual monop-
oly on the system today. The story of public transport could be summarised as the successive creation and failure of public transport enterprises: SATA founded in 1947 and nationalised into RMTB (1965-1972), STB (1972-1985), STUB (1985-1989), SMT (1991-1992), RATB (1992-1994), STD (1995-), City-Cars (2001-).

TRANS-AFRICA
Cen
tral
Afr
ica
13
This situation has usually been caused by poor man-agement especially in spare parts (inadequate spare parts and long delivery time) and lack of appropriate technical maintenance of these buses, regularly dam-aged by permanent overload due to fleet shortage.
Today, the sector is largely dominated by the private informal sector which accounts for around 95% of the public transport market made up of shared taxis or ‘100-100’ and minibuses also called “foula-foula”. However, these urban transportation operations are far from giving the expected results as the basic rules of public transport are paid very little heed.
II. Public transport regulationThe public transport sector is under the supervision of the Ministry of Transport and Civil Aviation.
III. Public transport operators
•MinibusesThey consist of 35-40 seaters called “Coasters” and “foula-foula” with 12-20 seats, mainly Toyota Hiaces. Approximately 2,000 operate today in Brazzaville.
•Sharedtaxisor‘100-100’These vehicles offer 4 or 6 seats but in reality re-ceive generally between 6 and 10 passengers trav-elling in the same direction for a price shared col-lectively. An estimated 1,000 units are in operation in Brazzaville.
•TaxisThe dominant characteristic is that taxis belong main-ly to private individuals who are generally drivers.
Some of them operate private journeys while others use the collective shared mode.
Regarding the private option, only private clients are taken and because the taxis do not have a meter, the cost is fixed after negotiation between the driver and the customer. The price differs depending on dis-tance, time of day, and sometimes the weather or the situation at any given time (at the end of the month, a delay in wages, shortages of fuel, armed conflict...).
In the case of a collective taxi, the route is usually cho-sen by the taxi driver but in certain cases the customer proposes routes and the driver may accept. Although it is generally considered to be cheap, it could also be seen as somewhat precarious and dangerous.
Democratic Republic of Congo
Area 2,344,798 km2
Populatio 66,514,506 inhabitants
Capital Kinshasa
Density 28.37 inhab./km2
Growth rate of population 3.23%
Languages Official language: French; Trade languages: Lingala, Kingwana, Kikongo, Tshiluba
Religions Catholic: 50%, Protestant: 20%, Kimbanguist: 10%, Muslim: 10%, other: 10%
Political system Republic
Rate of urbanisation 33.55%
Main cities Kinshasa-Brazzaville: 9.9M inhab., Lubumbashi: 1.7M inhab., Kisangani: 1.5M inhab.
GDP per Capita (IMF 2007) 171 US$
Contribution of the economic sectors to GDP
Farming: 45.67%, Industry: 27.73%, Services: 26.60%
Rate of inflation 18.2%
Currency Congolese franc

TRANS-AFRICA14
Public transport in Democratic Republic of Congo
I. BackgroundOne of the biggest challenges faced daily by the popu-lation of the Democratic Republic of Congo (DRC), and especially in Kinshasa, is transportation. Indeed, with its 10 million inhabitants, public transport is a conun-drum in Kinshasa.
However at independence in 1960, people were al-ready benefiting from public transport services previ-ously put in place by the Belgians including the “Trans-port en Commun de Léopoldville” (TCL), the “Office National des Transports” (ONATRA), Railroads Matadi-Léopoldville. But the transport sector rapidly suffered from the lack of skilled Congolese managers prepared to take over the administration left by the Belgians, combined with a lack of spare parts. Broken down vehicles were therefore immobilised and the fleet in operation gradually dwindled until the complete dis-appearance of any formal public transport. And today, with the decay of roads and public arteries, the situ-ation is only getting worse. All this has resulted in a chaotic transport system largely dominated by the informal sector.
In response, the Congolese State firmly pledged a public transport revival with the creation of the STUC SARL in 2006, a paragovernmental large bus company. The most popular transport means however remains the minibus.
II. Public transport regulationIn the Democratic Republic of Congo (DRC), public transport is managed by the Ministry of Transports and Communication Routes. Within this Ministry, the Land Transport Department is the body responsible for implementing the general policy of the govern-ment with regard to transportation by the develop-ment and implementation of the national transport plan and establishment of the related rules and regu-lations. It also supervises matters of road safety and prevention of accidents. As such, it has an oversight responsibility vis-à-vis the National Road Prevention Commission (CNPR) which is in charge of road safety and enforcement of road transport regulations.
In DR Congo, public transport management is devolved to the provinces and the city of Kinshasa having the status of a province, therefore manages public transport activities within this city. It is therefore in charge of issu-ing public transport permits, approving fares as well as collecting revenue from bus and taxi operations.
Indeed, even though fares are left to the discretion of the operators under the constraint of market supply and demand, the Congolese State through the Ministry of Economy and the City of Kinshasa set maximum fares depending on the economic context and the costs.
However the choice of routes is strictly the responsi-bility of operators.
In addition, any operator must be insured by the SONAS (National Insurance Company) and registered with the
DGI (General Directorate of Taxes). However, these meas-ures are largely flouted by the informal sector.
III. Public transport operatorsTransport in Kinshasa is essentially provided by vehi-cles owned by private operators.
•STUCSARLSTUC (Société des Transports Urbains du Congo) was established in June 2006 as a limited liability com-pany with the Congolese state as major shareholder at 96.3% and private entities as other shareholders. In 2005, the Congolese State acquired on behalf of STUC 250 new large buses through a state-to-state credit with India. But because of the poor conditions of roads and excessive overloading during peaks hours, the fleet has been reduced to about 180 large buses (of which 127 are operating).
STUC represents the only organized public transport and strives to remain sustainable yet unsubsidised by the Government.
•InformalsectorThe informal sector operates mainly over short dis-tances using second hand imported vehicles (approxi-mately 1,200 minibuses) with a capacity ranging from 5 to 26 seats but actually carrying double this figure, with a lack of comfort and safety. They are of combi type (Volkswagen former model), in which seats are replaced by wooden benches and they cover approxi-mately 69% of transport services in Kinshasa. They follow their own routes and will stop at some precise stops even though there is no formalised plan. They set their own fares based on the number of zones to be crossed. Those minibuses constitute the most wide-spread means of transport in the provincial towns.
Riding a motorcycle on the main roads of Kinshasa is quite rare. To get around, people prefer the car to two wheels (motorbike or bicycle). However, since 2007, the motorcycle-taxi has made its appearance in cer-tain districts of Kinshasa.
A marginal urban railway in Kinshasa is also operated by “Office National de Transport (ONATRA)”, the na-tional railway company, and carries only approximate-ly 8,000 passengers per day due to the poor condition of the fleet and rail network.

TRANS-AFRICA
Cen
tral
Afr
ica
15
Public transport in Equatorial Guinea
I. BackgroundDue to its geographical situation with an island part and a continental part, the road network of Equato-rial Guinea has been slow to develop. This situation has been especially sensitive on the island of Bioko where distances between the cities are short. This fact contributed to slowing down the development of the road infrastructure. But today with the oil boom and the influx of foreigners, workers and tourists, authori-ties have made it a point of pride to make the various corners of the island accessible. The existing roads began to be rebuilt and several main highways on Bi-oko Island are now in an excellent state. In the con-tinental part of Equatorial Guinea, the situation has always been relatively good; numerous tarred roads connect the main towns in this part of the territory. In addition, roads in perfect condition connect Equato-rial Guinea to its major neighbours.
II. Public transport regulationThe Ministry of Transport, Technologies, Posts and Telecommunication acts as the regulatory authority for public transport in the country through the:
•LandTransportDivision
It is responsible for developing and monitoring the execution of government decisions in the transport field and as such is in charge of the implementation
of the national road transport plan. It also handles the issuing of public transport licences.
•Decentralizedservices
They are composed of the Provincial and the Depart-mental Delegations of Transport which are responsible for the supervision and the coordination of the activi-ties of all Ministry of Transport services respectively within each province and each department.
To succeed in its state mission of regulation, the Min-istry is supported by two national structures which are the:
•NationalBoardofRoadsTransports(CNTR)
The CNTR is an advisory body established in 1999 and placed under the authority of the Minister of Trans-port. It has the responsibility to advise on all mat-ters related to the organization and regulation of road transport as well as to try to harmonize the interests of the different stakeholders in the public transport sector. As such, it advises on the drafting of national transport policy and also drafts the public investment planning for the road transports sector.
•NationalCommitteeforRoadSecurity(CNSR)
The CNSR is a Committee created in 1999 under the authority of the Minister of Transport, which aims to study and propose to the Minister any measures able to optimize road safety.
Equatorial Guinea
Area 28,051 km2
Population 551,201 inhabitants
Capital Malabo
Density 19.65 inhab./km2
Growth rate of population 2.05%
Languages Official languages: French, Spanish; Pidgin English, Fang, Bubi, Ibo
Religions Christian, Indigenous beliefs
Political system Republic
Rate of urbanisation 49.30%
Main cities Malabo: 1M inhab., Bata: 0.8M inhab.
GDP per Capita (IMF 2007) 10,436 US$
Contribution of the economic sectors to GDP
Farming: 4%, Industry: 91.7%, Services: 4.3%
Rate of inflation 5.5%
Currency Franc CFA

TRANS-AFRICA16
III. Public transport operatorsIn Equatorial Guinea, taxis are the most popular mode of transport. Until April 2006, each city council was free to set the characteristics of taxis operating in its area. Thus, for many years, taxis were generally old second-hand vehicles usually imported from Spain with the specific characteristics decided by each municipality.
But since April 2006, the Ministry of Transport and Communications undertook to reorganise the sector and decided that the only authorized taxis would be metallic grey colour Mercedes type. Licences issued to operators before that date were no longer valid.
Officially, a fixed number of licences are annually available for Malabo, likewise for Bata, which may be delivered only against the presentation of a Mer-cedes vehicle corresponding to the new requirements. Despite this, there are numerous illegal taxis, oper-ating with old vehicles, given the low standards of
living. There is no standardised fare and the cost of the taxi trip is negotiated between the driver and the customer.
Public transport in Gabon
I. BackgroundDespite the doubling of its population over the past 30 years, Gabon is still poorly populated. However, some demographic studies show an intensive rural exodus and influx of immigrants. Nearly three quar-
ters of the population of Gabon (70%) live in urban areas and almost the half in the capital Libreville.
In Libreville, for over a decade, residents have expe-rienced many mobility difficulties, in part because of the lack of a strong public transport system. Indeed,
Gabon
Area 267,667 km2
Population 1,514,993 inhabitants
Capital Libreville
Density 5.66 inhab./km2
Growth rate of population 1.93%
Languages Official language: French; Fang, Myene, Nzebi, Bapounou/Eschira, Bandjabi
Religions Christian: 55-75%, Indigenous beliefs, Muslim: -1%
Political system Republic, multiparty presiden-tial regime
Rate of urbanisation 84.97%
Main cities Libreville: 0.8M inhab., Port-Gentil: 0.2M inhab., Masuku (formerly Franceville): 0.1M inhab.
GDP per Capita (IMF 2007) 8,085 US$
Contribution of the economic sectors to GDP
Farming: 60%, Industry: 15%, Services: 25%
Rate of inflation 5%
Currency Franc CFA

TRANS-AFRICA
Cen
tral
Afr
ica
17
about 70% of journeys by households are dependent on public transport in Libreville, which is character-ized at 84% by a pendular movement along its main arteries throughout the day.
Since the “Société des transports des villes (SOTRAVIL)” was dissolved a few years ago, urban transport has been essentially assured by taxis and the “Société Gabonaise de transport” (SOGATRA) a formal state-owned company with large buses. But both types of operators were quickly overwhelmed and this led to the expansion of informal transport.
II. Public transport regulationThe Ministry of Transport and Civil Aviation is respon-sible for all public transport operations in Gabon.
In a first attempt to reorganise the urban transport sector some years ago, the state commissioned a study on a regulatory framework to encourage the market entry of private buses and minibuses on the basis of competitive bidding for operation of routes and with frequencies set by a transport regulatory authority. Moreover, it had been anticipated that this transport reform would encourage the gathering of operators into small business companies. Neverthe-less this study remained at a draft stage.
The bus stations are essentially run by the transport associations and the city council does not receive any daily tax on vehicles parked during idle time. How-ever, all informal operators pay an annual fee to the council that allows them to obtain the identification number officially necessary to operate.
III. Public transport operatorsPublic transport in Libreville is operated by taxis, min-ibuses and buses. Besides this, some illegal transport-ers also operate known as “clandos”. They grew rap-idly in recent years and took on such magnitude that they now represent a subset of land transport.
•SOGATRAUrban public transport by large bus is provided by the “Société Gabonaise de Transport (SOGATRA)” state owned enterprise founded in 1997 with the mission to provide public transport service in Libreville and Owendo urban areas. Unfortunately for several years it faced numerous obstacles limiting its mission.
Out of the official fleet of 94 buses today, SOGATRA has about 15 buses effectively in circulation, the rest being immobilised for various technical reasons, al-though it reached the level of 120 -130 buses in circu-lation a few years ago. Indeed, the problem of vehicle maintenance seems to be a major cause of the com-pany’s difficulties.
With a current staff of 500, this company is virtually in bankruptcy and is solely maintained through a state subsidy allocated for the free transportation of students whom now constitute the bulk of SOGATRA users.
Today, as SOGATRA is facing numerous strikes and a permanent shortage of spare parts, the Gabonese au-thorities are considering the question of privatisation as a means of setting the company on its feet again.
•TaxisandminibusesTaxis and minibuses are the public transportation ve-hicles used inside the city of Libreville or between the city and its neighbourhoods. Cars, minibuses or taxis bear the same colours, which are red and white for Libreville. A taxi-bus offers about 15 seats while the taxi-car can take up to 4 persons.
The taxi is the main mode of transporting persons in Libreville, likewise in the other cities of Gabon. Some of them are used for public transportation outside the city for long distances. Because of poverty, bargaining remains a current practice.
Taxis work throughout the capital, both on the main arteries and on the secondary public road network and can be hailed everywhere. But the number of taxis is relatively insufficient compared with demand. There are nearly 7,000 taxis in Libreville for 700,000 inhabitants. The reasons for this low number can be attributed to the apparent difficulties in acquiring and operating a taxi.
A last type of operator exists called ‘clandos’. Clan-dos refuse to comply with the requirements of the ac-tivity. Paradoxically, though the two types of above-mentioned operators exist, clandos, numbering about 2,000 in Libreville, position themselves as a real solu-tion to the shortage of urban transport provision. In such a context, they seem to be tolerated by the Min-istry of Transport although they compete irregularly with the formal registered operators.

TRANS-AFRICA18
Public transport in Burundi
I. BackgroundBurundi is a landlocked country located about 1800km from the Atlantic Ocean. This implies a strong commitment of its authorities to the enhancement of the transport sector as a key vector for the economic development of the nation and in particular urban transport. The network of paved roads is limited but generally acceptable even though in some parts of the country they are severely damaged and in very poor condition due to 15 years of civil war.
In Bujumbura the capital, the bulk of public transport is provided by private and informal operators which account for around 90% of the public transport market share, the remaining 10% being covered by the State public compa-ny called OTRACO (Office des Transports en Commun).
II. Public transport regulationPublic transport in Burundi is under the responsibility of the Ministry of Transport, Posts and Telecommunica-tions. Its main missions with regard to public transport are to conceive and implement the policy of the State, road safety, the establishment of the regulations in this particular field and the monitoring of their enforcement.
All operators must be registered by the department in charge of transportation within the Transport Ministry and receive the appropriate licences.
The level of public transport fares is set for all operators in Bujumbura by the Ministry of Commerce with the possibility to be revised in a mutual agreement with transporters when
a significant change in fuel price at the pump occurs. But the State does not control fares for intercity transportation and taxis which are decided by their own associations.
Currently, no global legal status regulating public trans-port has been established so far, though legislation on domestic transport was drafted in 2002 but is still await-ing the Burundian parliament approval. Nevertheless, in the meanwhile some ministerial decrees regulate the sec-tor concerning for instance public transport operations, road safety and the mandatory technical inspection.
A police force is dedicated to the prevention of accidents and road safety while Bujumbura City Council is in charge of urban transport order inside its area. The construction of bus stops and bus shelters is also devolved to Bujum-bura City Council which receives for that purpose a quar-terly fee from any vehicle operating the public transport services. However on the ground, the routes are still not fitted with stops, signs and infrastructures.
In 2006, facing a shortage of public transport supply, the Burundian State made substantial tax cuts on commercial vehicles so as to foster the importation of buses but no significant interest from private investors seems to have been roused since then.
III. Public transport operators
•BusesandminibusesOTRACO is a public company established in the 1980s via a donation from the Japan-Burundian bilateral cooperation;
Burundi
Area 27,834 km2
Population 8,691,005 inhabitants
Capital Bujumbura
Density 312.24 inhab./km2
Growth rate of population 3.443%
Languages Official languages: Kirundi, French, Swahili (along Lake Tanganyika and in the Bujum-bura area)
Religions Christian: 67% (Roman Catholic: 62%, Protestant: 5%), Indigenous beliefs: 23%, Muslim: 10%
Political system Republic
Rate of urbanisation 45.14%
Main cities Bujumbura: 0.5M inhab., Muyinga: 0.2M inhab.
GDP per Capita (IMF 2007) 125 US$
Contribution of the economic sectors to GDP
Farming: 34.85%, Industry: 20.01%, Services: 45.14%
Rate of inflation 7%
Currency Burundese Franc

TRANS-AFRICA
Easte
rn A
fric
a
19
it is responsible for public transport throughout the coun-try. OTRACO meets approximately 10% of public transport demand in Bujumbura with a fleet of an average age of 10 years composed of 10 high capacity buses and 30 minibus-es. OTRACO also provides a sub-regional transport service linking Burundi to neighbouring Rwanda. OTRACO serves as both operator and as regulator by performing the techni-cal inspection of all public transport vehicles and by regu-lating the fares inasmuch as it is the first company to apply the fares standardised by the authority.
The public authority grants OTRACO a variable annual compensatory subsidy depending on the financial re-sources of the State and also gives occasional grants for equipment in view of fleet renewal.
Aside OTRACO, about a dozen private companies oper-ate, most of them along the same routes connecting the capital to several towns inside the country with an aver-age fleet of five vehicles each, usually second hand 18 to 30-seater minibuses.
Nevertheless, the most significant transport service in terms of market share is provided by the informal sector with its minibuses accounting for about 70% of all pub-lic transport journeys. An estimated 1,300 buses operate along self-decided routes, characterised by a highly frag-mented ownership pattern.
The public transport market in general suffers from a lack of genuine spare parts, which are pirated on the lo-cal market and lead to more frequent breakdowns.
•TaxisCollective 4-seater taxis number about 1350 in Bujumbu-ra, though passenger overloading is frequent. Fares are based on negotiation before getting into the car.
•Bikeandmotorcycle-taxisTwo-wheeler traffic in Bujumbura has recently grown in impressive numbers, comprising motorcycles and bicycles that are strongly favoured by low-income us-ers. These cycle-taxis are estimated at around 2000 in the city of Bujumbura, and are mostly driven by young unemployed volunteers. Motorcycles usually operate in urban centres while bicycle-taxis serve the cities’ outskirts.
In 2006, the Minister of Transport tried to ban their op-eration but the measure raised anger and social unrest to such an extent that the President of Burundi was forced to cancel it. This activity generates income for many Bu-rundians in a country trying to recover from several years of civil war.
IV. Public transport projectsThe State has significantly invested in substantiallly im-proving the road network and as such around 200km of paved roads were completed from 2005 to 2007.
A project aiming at reviving public transport is also underway, and the feasibility study under completion. This project aims to provide OTRACO with high capac-ity buses to transport urban and rural populations by linking up the major economic centres of the country and opening up Burundi to the vast majority of the population.
Meetings have already been conducted with donors for its implementation, which also includes a refurbish-ment of the OTRACO garage to ensure efficient main-tenance of the new fleet. The project cost is estimated at EUR 8 million.
Area 1,862 km2
Population 731,775 inhabitants
Capital Moroni
Density 393.00 inhab./km2
Growth rate of population 2.803%
Languages Official languages: Arabic, French; Shikomoro (a blend of Swahili and Arabic)
Religions Sunni Muslim: 98%, Roman Catholic: 2%
Political system Republic
Rate of urbanisation 37.00%
Main cities Moroni: 0.1M inhab., Mutsamudu: 0.1M inhab., Fomboni: 0.1M inhab.
GDP per Capita (IMF 2007) 729 US$
Contribution of the economic sectors to GDP
Farming: 50%, Industry: 12%, Services: 38%
Rate of inflation 3%
Currency Comoros Franc
Comoros

TRANS-AFRICA20
Public transport in Comoros
I. BackgroundThe Union of the Comoros is located in the Indian Ocean off the east coast of Africa. Comoros consists of an ar-chipelago of three islands; Grand Comore, Moheli, Anj-ouan, and covers about 900 square miles. Grand Comore is home to the country capital Moroni, and is the most developed of the three islands.
The Union of the Comoros possesses 880km of roads of which 673km are tarred. The longest distance from one point to another within each island does not ex-ceed 100km, which implies poorly developed public transport and the fact that the authorities have not been compelled to undertake an in-depth organisation of this sector. Public transport is thus at an embryonic stage so far, traditionally having been operated by pri-vate truck owners.
II. Public transport regulationPublic transport in Comoros is supervised by the Govern-ment through the Vice-Presidency, which is in charge of the Ministry of Transport, Posts and Telecommunications and Tourism.
The authorities in charge of public transport regulation in each island are the Directorates of transport under the responsibility of the Ministry. In the current situa-tion, there is no specific legal status for public trans-port. Any citizen of Comoros able to obtain a minibus, bus or ordinary five-seater car and who meets the re-quirements could carry passengers. These requirements
relate to the safety and roadworthiness of the vehicle and possession of a driving licence with the category “transport of passengers”.
There is no specialized body in charge of the techni-cal regulation and follow-up of the public transport operators. Their number is therefore unknown. As a consequence, there is also no direct support to these operators from the Government which limits itself to ensuring that transporters meet the required safety conditions.
Besides, the Central Government of the Union of Comoros is also responsible for setting fares. The National Police of each island is the enforcing authority responsible for the application of road safety regulations.
III. Public transport operatorsThe current public transport operators consist of pri-vate owners of fleets of 30-seater buses, 17-seater minibuses and small 5-seater taxis. There is no offi-cial estimate of their numbers, but the market is vis-ibly fragmented. The drivers are usually young peo-ple who have passed all the necessary steps to obtain their driver’s licence. Each owner of a car, bus or small vehicle freely negotiates with a driver his wage and terms of work.
There is one drivers union which often acts as an inter-mediary between owners and authorities. There are no circulation problems in the islands, except in case of oil shortages.
Djibouti
Area 23,200 km2
Population 768,900 inhabitants
Capital Djibouti
Density 33.14 inhab./km2
Growth rate of population 2.097%
Languages Official languages: French, Arabic, Somali, Afar
Religions Muslim: 94%, Christian: 6%
Political system Republic
Rate of urbanisation 84.20%
Main cities Djibouti: 0.7M inhab.
GDP per Capita (IMF 2007) 1,111 US$
Contribution of the economic sectors to GDP
Farming: 3.6%, Industry: 17.1%, Services: 79.3%
Rate of inflation 3%
Currency Djibouti Franc

TRANS-AFRICA
Easte
rn A
fric
a
21
Public transport in Djibouti
I. BackgroundUntil 1999, the Djibouti Republic faced significant re-gional tensions and internal conflicts that explain why until recently there was no appropriate institutional and legal framework to regulate the activity of public transport even though it is by far the most widely used means of transport.
In this context, the same urban and interurban trans-port crisis which occured throughout Sub-Saharan Af-rica cities as of the late 1980s reached a serious level in Djibouti in the 1990s: in the absence of a formal company, the informal sector remained the only means able to cope with public transport demand fuelled by population growth and unchecked urban sprawl.
Accordingly, the public transport system of the City of Djibouti - provided by the informal sector - was oper-ating on a fully deregulated basis.
To overcome this crisis, the government undertook re-forms in urban and intercity transport. The main aim of the raft of measures was to clean up the sector in order to improve its efficiency and sustainability. In this regard the Government also plans to promote public transport using high capacity buses.
II. Public transport regulationThe public transport sector is under the authority of the Ministry of Equipment and Transport. Since 2002 it has undertaken a series of measures for the reor-ganisation of the public transport sector in Djibouti including the creation in 2003 of the “Conseil National des Transports” (CNT), an advisory board comprising all professionals in the sector, users’ associations, government departments and the District of Djibouti. This board aims to create synergy between the key actors in the sector to enable the implementation of the reforms to improve the public transport system. These reforms were carried out in the framework of the professionalization of the informal sector and in-clude since 2002 the establishment of a fee to main-tain and develop the roads network used by public transport vehicles, a compulsory licence prior to any public transport activity enforced since 2006 as well as the reorganisation of routes and stops which re-cently started with the construction of bus shelters and bus stop signs along the routes (2008).
This latest achievement stems from a public-private partnership between the Ministry of Equipment and Transportation and the Chamber of Commerce of Dji-bouti through a concession agreement for the con-struction and operation of certain bus shelters.
The reforms also provide for the establishment of tech-nical inspections of vehicles and the development of a book of specifications setting out the obligations of transporters, conditions and procedures to operate.
This professionalization will lead eventually to creat-ing viable entities operating in a quality environment
with an efficient use of the road network in compli-ance with the specifications set by the authority. Hav-ing a formal status, these entities should benefit from financial facilities for the renewal of their fleet.
The success of these reforms was achieved through regular discussions between the various partners of the public transport system within the national trans-port board. The National Police is responsible for the enforcement of all regulations.
III. Public transport operatorsThe last census conducted by the Ministry of Equip-ment and Transport in 2002 identified a fleet of about 700 buses, 500 taxis and 500 minibuses. Taxis are relatively abundant in the city of Djibouti and rare outside the city. The fare is set by negotiation prior to boarding since the cars are unmetered.
Minibuses serve the city of Djibouti while larger buses connect the city of Djibouti with most of the periph-eral cities and the villages. Minibuses wait until they are full before departure.
The conditions of access to the profession were not regulated until 2002 leaving the field open to any who wanted to enter the business. This deregulated mar-ket implied a rapid growth of the informal sector after 1999 with fierce competition on the street between these informal operators who practised uncontrolled overruns and excessive speeds.
The deregulated market while avoiding a financial commitment of the State in public transport matters caused later multiple negative consequences such as a declining quality of service with poorly maintained vehicles and poorer road safety.
TRANS-AFRICA22
Public transport in Eritrea
I. BackgroundPublic transport in Eritrea evolved during Italian colo-nialism in the 1920s when towns began to emerge. Italian bus companies who provided a transport serv-ice, both urban and inter-urban, laid the premises of a modern day public transport service in Eritrea.
Today there are about 2,000 public transport vehi-cles in the country covering the urban and interur-ban transport market however many are very old and not roadworthy, the situation being worsened by the poor state of the road infrastructure. Public transport within towns and around the country consists mainly of buses and minibuses operated by several private companies.
Since economic activity depends on the smooth and proper networking of roads for the delivery of goods and services, the construction and rehabilitation of railway and road networks damaged by the war against Ethiopia has been one of the priority areas of the Eritrean Government.
II. Public transport regulationThe public transport sector is supervised by the Min-istry of Transport and Communications through its Land Transport Department, which plays a regulatory role. It is responsible for developing public transport rules, regulations, policy and standards; it oversees and controls the implementation of such rules and regulations as well as setting fares.
Public transport management was decentralised by the end of the 1990s so that the regional land trans-port departments and municipalities assume part of the national land transport department power and du-ties by controlling the daily operation of the operators in line with the global policy of the State. All public transport operators are required to be licensed by the Land Department Transport and consequently obliged to comply with regulations in place such as the ban on overloading and fare structure.
In 2000, the Eritrean State issued a proclamation whose main thrust is the development of an efficient public transport system reflected in the taxation pol-icy whereby public transport vehicles have a minimal tax as compared to privately imported vehicles.
Besides, the Eritrean State regulated the importation of motorized vehicles by forbidding any public trans-port vehicle over five years old to be imported given that older vehicles are more polluting. Furthermore, the use of non-motorized transport such as bicycles was encouraged, and to this end roads in bigger cit-ies, such as Asmara, are being constructed to cater for bicycles.
The development and establishment of the land trans-port system in the country is thus fostered, and in-cludes adequate standards and safety requirements that are currently strictly enforced by the Eritrean Traffic Police.
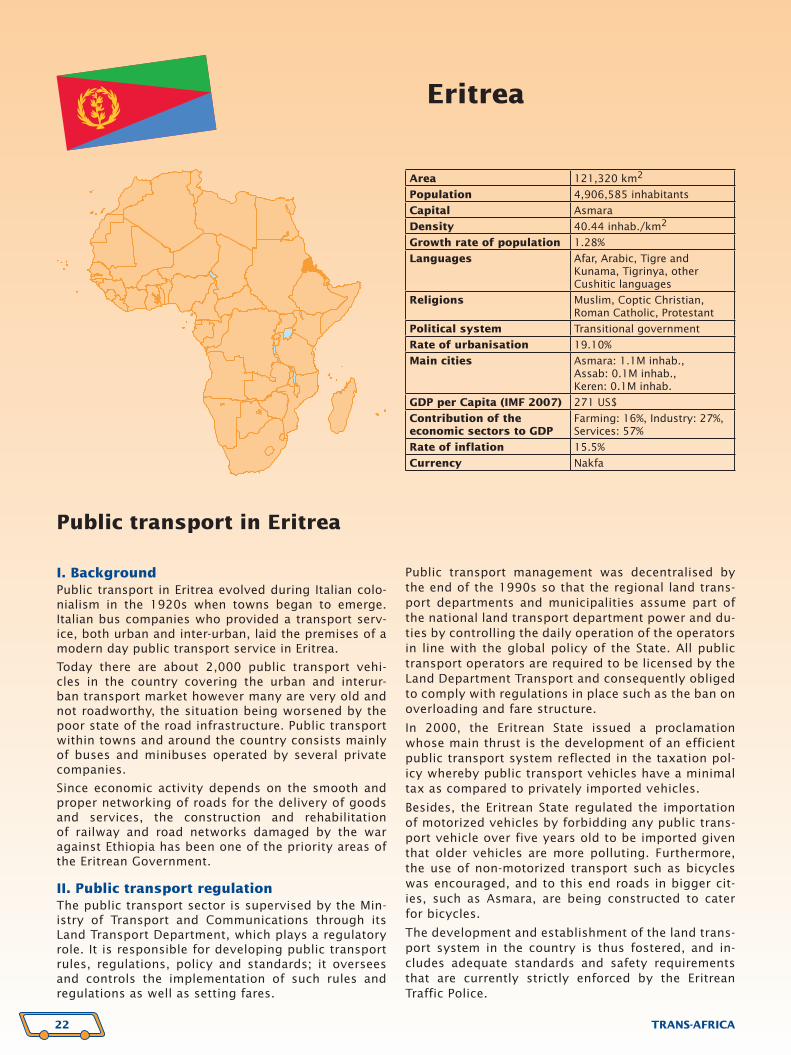
Eritrea
Area 121,320 km2
Population 4,906,585 inhabitants
Capital Asmara
Density 40.44 inhab./km2
Growth rate of population 1.28%
Languages Afar, Arabic, Tigre and Kunama, Tigrinya, other Cushitic languages
Religions Muslim, Coptic Christian, Roman Catholic, Protestant
Political system Transitional government
Rate of urbanisation 19.10%
Main cities Asmara: 1.1M inhab., Assab: 0.1M inhab., Keren: 0.1M inhab.
GDP per Capita (IMF 2007) 271 US$
Contribution of the economic sectors to GDP
Farming: 16%, Industry: 27%, Services: 57%
Rate of inflation 15.5%
Currency Nakfa

TRANS-AFRICA
Easte
rn A
fric
a
23
III. Public transport operatorsNationally, there are four urban transport compa-nies and two inter-urban companies with fleets rang-ing from 10 vehicles to 240, operating in all the six regions across the country besides individually pri-vately owned buses of which there are around 1,500. Asmara public transport consists of buses, minibuses and taxi cabs.
•TaxisTaxis consist of yellow shared 5-seater vehicles which run on fixed routes on the main streets of Asmara and allow people to board or alight all along the route. Many are old and cars from the 1960s are a common sight in Asmara. The price is negotiated because taxis are not metered.
But not all cabs run on fixed routes, some can be used privately; this is called kuntrat (khoon-tratt) and the price has also to be negotiated before the trip.
•BusesandminibusesAsmara has 10 downtown bus lines using distinctive red Mercedes Benz buses. The buses have specific stops where they can be boarded. Their low fare lev-el means that they are often overcrowded and slow. There are also white minibus lines running on the main streets of the city, which also run on fixed routes but without stops or signs though they usually stop at the same bus stops.
Long distance buses operate between Asmara and various other cities in the country. They are reason-ably comfortable and affordable. But there is no set timetable and they wait to be full before they depart.
Area 1,127,127 km2
Population 76,065,271 inhabitants
Capital Addis Ababa
Density 67.49 inhab./km2
Growth rate of population 2.93%
Languages Amharic, Tigrinya, Oromigna, Guaragigna, Somali, Arabic, other local languages, English
Religions Muslim: 45-50%, Ethiopian Orthodox: 35-40%, Animist: 12%, Other: 3-8%
Political system Federal republic
Rate of urbanisation 16.63%
Main cities Addis Ababa: 3.2M inhab., Diré Dawa: 0.4M inhab., Nazret: 0.3M inhab.
GDP per Capita (IMF 2007) 252 US$
Contribution of the economic sectors to GDP
Farming: 80.20%, Industry: 6.60%, Services: 13.20%
Rate of inflation 15.9%
Currency Ethiopian Birr
Ethiopia
Public transport in Ethiopia
I. BackgroundPublic transport in Ethiopia consists of operations to and from the capital Addis Ababa. The transport mo-dal share in the capital can be broadly spilt as: 10% private car, 25% public transport and 60% walking. Contrary to many other African cities, the role of bicy-cles in urban transport is largely insignificant due to
topographical restrictions and there is no rail trans-port within the city.
Public transport mainly consists on the one hand of conventional bus services provided by the publicly owned Anbassa City Bus Enterprise and also taxis, and mini and midibuses operated by the private sector.

TRANS-AFRICA24
The large proportion of walking suggests that pub-lic transport fares are globally unaffordable for the level of income of the city population. Car ownership among residents is very low, so the majority depends on buses and taxis for their day-to-day mobility in terms of motorised transport.
Until 1992, the right to operate large buses within Addis Ababa was exclusively held by Anbassa while minibus ‘taxi’ services were restricted and regulated on a zonal basis by the public authority.
In 1992, the public transport market was deregulated by a transitional political regime through the ‘Procla-mation to Provide for the Regulation of Road Trans-port’ which limited the conditions for running a public transport activity to only two: proven roadworthiness of the vehicle and qualification of the driver. Once his permit was issued, the carrier was then able to oper-ate throughout the city with no exclusion from routes or areas.
II. Public transport regulationThe public transport sector is supervised by the Min-istry of Transport and Communications at the federal level, which has responsibility for formulating policy and issuing directives to give a clear vision of public transport development in the country. It acts through the Ethiopian Road Transport Authority (R.T.A) which was established in 1967 and is responsible for the use of any roads within Ethiopia, the vehicles using these roads and for all road transport activities.
At the Addis Ababa regional level, public transport and infrastructures are managed by the transport au-thority under the auspices of the City Government with the overall mandate to issue route licensing and permits to the operators. The fares are regulated by the city Government with a substantial difference be-tween the minibuses and Anbassa, whose fares are subsidised.
III. Public transport operators
•AnbassaCityBusServiceEnterpriseAnbassa city bus service enterprise is a formal bus company created in 1963 as a private enterprise hold-ing an exclusive franchise for the provision of pas-senger transport services in Addis Ababa, yet was na-tionalized in 1974.
It operates a fleet of 420 conventional large buses, with an average vehicle age of seven years, and provides scheduled services along about 90 routes accounting for about 15% of the public transport market share, that is 153 million passengers carried annually.
Over the past ten years, Anbassa has received regu-lar investment from the State in terms of provision of new vehicles mainly thanks to bilateral cooperation with the Netherlands and Belgium.
Fares are controlled by the City government which compensates with a subsidy per ticket sold. But with a view to affordability for the population, fare levels have not been revised since 1992; fares are still of-ficially set at this level although over the same period State compensation has been progressively reduced.
As a result, Ambassa faced financial difficulties and failed to provide transport to cater for the population sprawl and growth especially in the city outskirts, making the population there more and more depend-ent on walking. Its structural difficulties resulted in a low level of fleet availability, around 80-85% in spite of their relatively young age.
•TaxiThe City of Addis Ababa is also served by minibus-es also known as “taxis” which number an estimat-ed 12,500. They provide 75% of the public transport journeys despite their fares being up to three times more expensive than the bus fares. Basically, they are blue painted minibuses with a white roof - and are thus known as “blue donkeys” - with a seating arrangement of 12 seats. They travel very fast from one part of the city to another. Besides minibuses, about 1,500 4-seater taxi-cars with the same colours also operate. The minibuses are mainly used by Addis Ababa residents to reach their work place, and tend to represent a better quality of service than the con-ventional buses.
There are no restrictions for minibus taxis in terms of routes or areas of operation. In principle, the fares are controlled by the transport Authority though pas-sengers confirm that the actual fares charged vary somewhat arbitrarily depending on circumstances such as congestion or bad weather. Inadequate vehi-cles, loading extra passengers, and bad behaviour of taxi drivers and their assistants make this form of taxi transport difficult.
•MidibusesIn 2008, the City government undertook to purchase 500 midibuses at a cost of about EUR 10 million through a bank loan and distributed them to private operators for a five year repayment period.

TRANS-AFRICA
Easte
rn A
fric
a
25
Public transport in Kenya
I. BackgroundPublic transportation is very extensive in Kenya and particularly in the capital Nairobi. In Nairobi, the public transport system is essentially run by private operator as the City Council opted for a deregulated market in line with national policy.
Along the years, two main types of public transport op-erations emerged out of this deregulated environment: Kenya Bus Services (KBS), formal company with a fleet of large buses and minibuses on the one hand and the matatus minibuses on the other, both often competing along the same routes.
Until 1973 Kenya Bus was granted the public transport service monopoly by the City of Nairobi within its area. But since that date, due to its incapacity to effectively meet the actual demand of the growing city, the mata-tus transportation means was officially recognized by a presidential decree enabling operation without obtaining the formal permits to which KBS are subject. The matatu became then a major competitor in the city to KBS and their number grew significantly.
More recently, as Kenya Bus Services was still encoun-tering financial difficulties, its fleet was progressively reduced encouraging other bus companies with larger buses to form and also enter the market.
II. Public transport regulationThe public transport sector is supervised by the Ministry of Transport.
The Ministry of Transport, as the main player in road transportation, provides policies and regulations gov-erning the entire transport sector and this through several departments among which there is the Trans-port Licensing Board (TLB). TLB is notably responsible for the licensing (issuing of annual licences to the op-erators) and transport services regulation. It is also bestowed with the mandate to allocate routes in the country.
In February 2004, the Ministry of Transport introduced new regulations governing the safety of matatus. Amongst them were the compulsory fitting of safe-ty belts for all passengers, speed governors, tighter control of overloading in minibuses and banning of standing passengers on large buses. Theses measures resulted in resistance and strikes from the matatu side yet now applied they have led to a significant reduc-tion in injuries and fatalities in accidents involving public transport vehicles.
In Nairobi, the deregulated market principle resulted in little public control of route structure, operational practices, timetable or fares. Therefore, the Nairobi city council (NCC) acts as a transport authority with a limited range of intervention.
III. Public transport operatorsThere are several types of public transport opera-tors in Nairobi. These include buses, the train, and matatus.
Kenya
Area 581,787 km2
Population 37,953,838 inhabitants
Capital Nairobi
Density 65.24 inhab./km2
Growth rate of population 2.758%
Languages Official languages: English, Kiswahili and numerous indigenous languages
Religions Protestant: 45%, Roman Cath-olic: 33%, Indigenous beliefs: 10%, Muslim: 10%, other: 2%
Political system Republic
Rate of urbanisation 20.70%
Main cities Nairobi: 4.1M inhab., Mombasa: 0.9M inhab., Nakuru: 0.3M inhab.
GDP per Capita (IMF 2007) 780 US$
Contribution of the economic sectors to GDP
Farming: 27.01%, Industry: 18.55%, Services: 54.44%
Rate of inflation 9.3%
Currency Kenyan Shilling

TRANS-AFRICA26
•BusesKBS was created in 1934 and was granted a monopoly on public transport service in Nairobi by the Nairobi City Council (NCC) in 1966. Until 1973 Kenya Bus re-mained the sole operator of bus transit utilizing high capacity vehicles (double deckers).
In 2003, KBS also launched a premium midibus serv-ice called Metro Shuttle which is to serve high/medi-um income areas in Nairobi. Since 2002, other private company owning large buses have also entered the market such as the Citi Hoppa.
Between 2003 and 2006, KBS encountered multiple financial difficulties, facing a myriad of challenges and was bound for insolvency. The reason seems to be the cost of compliance with the new legal require-ments and the subsequent loss of business. Therefore it evolved in a franchising and Management Company namely KBSM established in June 2006 to take over the operations of Kenya Bus Services (KBS) albeit with-out owning any proper rolling stock.
On July 2006, the first batch of a franchisee’s buses were operated in the new KBSM franchising arrange-ment concept. Actually, KBSM operates 285 buses from 175 investors with nearly 1,050 staff transport-ing 2.95 million of passengers a month.
•Matatus‘Matatus’ are the most common form of transport. The word ‘Matatu’ refers to a minibus with a capacity of up to 25 passengers or a van, a microbus, with a seating capacity of 14 passengers. The latter are also known to as ‘Nisan’, but not referring to the brand of the vehicle. They are known as fastest and most com-fortable than the larger matatus. Matatu fares, routes and stops are not fixed as they depend on many pa-rameters such as passenger demand. Actually most of them will use the same routes as KBS.
Matatus started operating in Nairobi in the 1950s and were considered as illegal commercial entities along-side the legal transport operator KBS. In 1973 they were officially recognized and taking advantage of easier market access, they compete fiercely with the formal established operator. Now they account for up to 75% in the public transport modal split of Nairobi numbered about 16,000 operating on 125 routes. During the years, syndicates or associations emerged and imposed themselves as owners of these routes.
“Box matatus” also exist which are simply 2-wheel drive pick-ups with a shell on the back.
•TaxisTaxis are individually hired transport. Normally, taxis wait at specific places for customers, but can also be flagged down along the road. Taxis are not metered and the fare should be agreed upon before departure. Very few base their charges on time and distance.
•TrainThere is limited travel by train within Nairobi. How-ever, passenger service by train is available between Nairobi and Mombasa.
•Bodaboda&TukTukThe Boda boda is transport by bicycle-taxi available for short trips. There are also three-wheeled motor-cycle scooters vehicles (Tuk Tuk) especially in small towns such as Thika. They operate like taxis but they charge lower rates.
IV. Public transport projects
•BusRapidTransit(BRT)A study has been commissioned to explore the viabil-ity of adopting BRT system for Nairobi city. Proposals have been submitted awaiting funding of the project.
•IntegratedNationalTransportPolicyThe policy was developed in consultation with vari-ous stakeholders with the aim to improve provision of transport services in the country. The policy docu-ment has however not been progressed to obtain the required legislative approval for implementation. The implementation of this Policy would usher in a Trans-port Authority that would assist in the implementa-tion of reforms in Transport like BRT.
•MetropolitanTransportAuthorityThe ministry of Nairobi Metropolitan is proposing the formation of a transport authority to oversee the de-velopment and provision of reliable transport serv-ices focusing on the government objective for vision 2030.

TRANS-AFRICA
Easte
rn A
fric
a
27
Public transport in Rwanda
I. BackgroundRwanda is a landlocked country with a hilly to mountain-ous topography and densely settled population living al-most exclusively from subsistence farming and tea and coffee production. The country has experienced falling per capita income and increasing poverty since the late 1980s.
This rapid decline was due partly to the civil unrest in the country and partly to weak policies and mismanagement of resources. The situation was worsened by the civil war of 1994 which took over 1 million lives and displaced approximately 2 million to neighbouring countries. This has left the economy structurally very fragile.
Sound transport infrastructure is crucial in reducing the isolation of the country from its neighbours, and that of one region of the country from another. Rwanda has a reasonably good network of primary roads and a good base of feeder roads. However, the secondary and feeder roads have suffered from a prolonged pe-riod of poor maintenance due notably to the civil war.
II. Public transport regulationThe public transport sector is supervised by the Ministry of Infrastructure. The mission of the Ministry is to cre-
ate favourable conditions that allow men, women and children equitable and sustainable access to transport infrastructure.
The global vision of the policy for sustainable socio-eco-nomic development draws on the principles of VISION 2020 for Rwanda which focuses on socio-economic inte-gration and sustainable economic growth with priorities being placed on the agriculture sector, rural development as well as infrastructure.
In this last sector the stress is particularly laid on the importance of improving transport infrastructure and services in order to increase mobility and access to efficient transport services, improve road safety, and develop a transport infrastructure network which will allow the opening up of the interior and exterior of the country.
III. Public transport operators
•SharedtaxisShared taxis come in two forms: The main form of pub-lic transport within Rwanda is the shared taxi, known locally simply as “taxi” or colloquially “twegerane” (let us sit together) which are 14-20 seater minibuses esti-mated at 2000. They run between two termini (known
Rwanda
Area 26,338 km2
Population 9,907,509 inhabitants
Capital Kigali
Density 376.17 inhab./km2
Growth rate of population 2.428%
Languages Official languages: Kinyarwanda, French, English; Universal Bantu vernacular, Kiswahili (Swahili) used in commercial centers
Religions Roman Catholic: 56.5%, Protestant: 26%, Adventist: 11.1%, Muslim: 4.6%, Indige-nous beliefs: 0.1%, None 1.7%
Political system Republic; presidential, multi-party system
Rate of urbanisation 16.56%
Main cities Kigali: 1M inhab., Butare: 0.09M inhab., Ruhengeri: 0.09M inhab.
GDP per Capita (IMF 2007) 355 US$
Contribution of the economic sectors to GDP
Farming: 41.63%, Industry: 21.87%, Services: 36.50%
Rate of inflation 8%
Currency Rwandan Franc
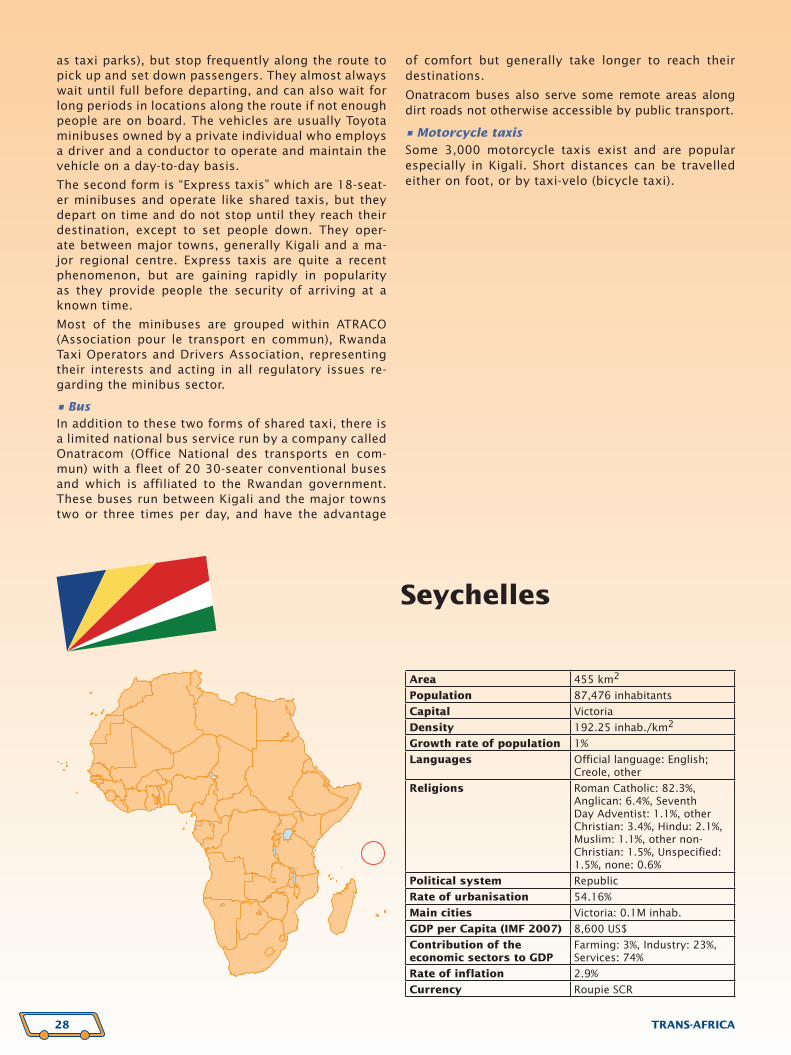
TRANS-AFRICA28
as taxi parks), but stop frequently along the route to pick up and set down passengers. They almost always wait until full before departing, and can also wait for long periods in locations along the route if not enough people are on board. The vehicles are usually Toyota minibuses owned by a private individual who employs a driver and a conductor to operate and maintain the vehicle on a day-to-day basis.
The second form is “Express taxis” which are 18-seat-er minibuses and operate like shared taxis, but they depart on time and do not stop until they reach their destination, except to set people down. They oper-ate between major towns, generally Kigali and a ma-jor regional centre. Express taxis are quite a recent phenomenon, but are gaining rapidly in popularity as they provide people the security of arriving at a known time.
Most of the minibuses are grouped within ATRACO (Association pour le transport en commun), Rwanda Taxi Operators and Drivers Association, representing their interests and acting in all regulatory issues re-garding the minibus sector.
•BusIn addition to these two forms of shared taxi, there is a limited national bus service run by a company called Onatracom (Office National des transports en com-mun) with a fleet of 20 30-seater conventional buses and which is affiliated to the Rwandan government. These buses run between Kigali and the major towns two or three times per day, and have the advantage
of comfort but generally take longer to reach their destinations.
Onatracom buses also serve some remote areas along dirt roads not otherwise accessible by public transport.
•MotorcycletaxisSome 3,000 motorcycle taxis exist and are popular especially in Kigali. Short distances can be travelled either on foot, or by taxi-velo (bicycle taxi).
Seychelles
Area 455 km2
Population 87,476 inhabitants
Capital Victoria
Density 192.25 inhab./km2
Growth rate of population 1%
Languages Official language: English; Creole, other
Religions Roman Catholic: 82.3%, Anglican: 6.4%, Seventh Day Adventist: 1.1%, other Christian: 3.4%, Hindu: 2.1%, Muslim: 1.1%, other non-Christian: 1.5%, Unspecified: 1.5%, none: 0.6%
Political system Republic
Rate of urbanisation 54.16%
Main cities Victoria: 0.1M inhab.
GDP per Capita (IMF 2007) 8,600 US$
Contribution of the economic sectors to GDP
Farming: 3%, Industry: 23%, Services: 74%
Rate of inflation 2.9%
Currency Roupie SCR

TRANS-AFRICA
Easte
rn A
fric
a
29
Public transport in Seychelles
I. BackgroundThe Inner Islands of the Republic of Seychelles consist of the “Mahé”, “Praslin” and “La Digue” islands along with the surrounding smaller islands in the archipela-go. There are paved roads only on La Digue, Mahé and Praslin; elsewhere the roads are sandy tracks.
A parastatal organisation, the Seychelles Public Trans-port Corporation (STPC), was constituted in 1977 to provide organised road passenger transport services on Mahé and Praslin.
II. Public transport regulationThe public transport sector is supervised by the Gov-ernment through its Vice-Presidency in charge of Tour-ism and Transport Transport with the following major responsibilities in this purpose:
•Ensuringthattheroadnetworkismaintainedinanoptimum condition with regular maintenance work of a high standard;
•Ensuringthattheroadsystemisconstructedinhar-mony with the natural environment and is able to contribute to the process of sustainable social and economic development;
•Establishing and monitoring bus fares, bus routesand the bus timetable to ensure that public trans-port organizations provide a fair and decent service to the public.
III. Public transport operators
•BusSeychelles Public Transport Corporation (SPTC) is a parastatal organisation constituted in 1977 for the provision of road passenger transport services in the principal island of Mahé and outer island of Praslin. SPTC currently runs a fleet of custom made vehicles in order to meet the demand of the travelling public. Presently, it has a fleet of over 200 buses and coaches with a capacity varying from 19- to 80-seaters on a network of 41 routes.
The buses cater to more than 16 million passenger journeys per year in Mahé and Praslin including daily provision of transport for around 7,000 students and school children. In addition SPTC handles a fleet of luxury and semi-luxury coaches to meet the demands of tourists.
•TaxisTaxis are plentiful on Mahé and Praslin, and there is a handful on La Digue. Cabs can be hailed on the street, at designated taxi stands or by phoning a driver di-rect. The taxis are metered though the fare can be negotiated.
Somalia
Area 637,657 km2
Population 9,832,017 inhabitants
Capital Mogadishu
Density 15.42 inhab./km2
Growth rate of population 2.81%
Languages Official language: Somali; Arabic, Italian, English
Religions Sunni Muslim
Political system Permanent national govern-ment; transitional, parliamen-tary federal government
Rate of urbanisation 52.63%
Main cities Mogadishu: 2.9M inhab., Hargeysa: 0.6M inhab., Marca: 0.4M inhab.
GDP per Capita (2000) 600 US$
Contribution of the eco-nomic sectors to GDP
Farming: 60%, Industry: 10%, Services: 30%
Rate of inflation 100%
Currency Somalian Shilling

TRANS-AFRICA30
Tanzania
Area 945,088 km2
Population 38,139,640 inhabitants
Capital Dar Es Salaam
Density 40.36 inhab./km2
Growth rate of population 2.827%
Languages Official languages: Kiswahili or Swahili, English; Kiunguja, Arabic, many local languages
Religions Mainland - Christian: 30%, Muslim: 35%, Indigenous beliefs: 35%, Zanzibar - more than: 99% Muslim
Political system Republic
Rate of urbanisation 35.36%
Main cities Dar Es Salaam: 3M inhab.
GDP per Capita (IMF 2007) 428 US$
Contribution of the economic sectors to GDP
Farming: 45.03%, Industry: 16.36%, Services: 38.61%
Rate of inflation 7%
Currency Tanzanian Shilling
Public transport in Somalia
I. BackgroundSomalia has not had an effective government for 15 years; this has had a negative effect on the roads and the transport system in general. Approximate-ly 2,600km of highways is paved out of a total of 22,000km. The few traffic lights that once existed are out of order, and there is no form of traffic police. As a result the few speed limits, signs and road markings are widely ignored.
There is the skeleton of a bus network in the south and no public transportation in the north. Half of the Somali people are nomads, and the camel is the prin-cipal form of transportation in the country, followed by walking.
II. Public transport regulationThe public transport sector is supervised by the Min-istry of Transport, Civil Aviation and Ports.
III. Public transport operatorsPassenger transport is restricted almost entirely to road haulage. The public transport sector is led by the informal transport which includes taxis and mini-buses. These services run in Mogadishu, but their availability may be restricted outside normal working hours. There are reasonably few minibus services be-tween the major centres in the south. Elsewhere there are very few cars and minibuses.
Camels and donkeys are also used extensively in rural and nomadic areas for transportation (35%).

TRANS-AFRICA
Easte
rn A
fric
a
31
Public transport in Tanzania
I. BackgroundLike many cities in developing countries, Dar-es-Sa-laam has a poor public transportation system though a good network of all-weather roads connecting all major towns, built by the public authority.
The dominant mode of public transport in Dar-es-Sa-laam is bus transport, which accounts for about 60% of the modal split. There are over 7,000 minibuses, popularly known as “dala-dala”, which dominate mo-torised public transportation in Dar-es-Salaam. The majority of people in the city depend on this mode of transport.
Nevertheless, the existing public transport system is mainly characterised by congestion and delays, poor vehicle condition and increasing road accidents; in addition, the bus fare level is too low to cover operat-ing costs.
II. Public transport regulationThe public transport sector comes under the author-ity of the Ministry of Infrastructures Development through the Department of Communications and Transport. The Department is responsible for the for-mulation of the sector policies and for the oversight of that policy implementation, the objectives being to ensure enhanced performance of the sector, and also to provide an optimal contribution to national social economic development.
Under its responsibility and according to various sec-tors, this Ministry set some bodies as regulatory au-thorities such as the Surface and Marine Transport Reg-ulatory Authority (SUMATRA) in charge of regulating the road, railway, and marine transport. SUMATRA reg-ulates the urban transport sector through the issuing of a compulsory licence which allows the operator to exercise its activity. The operator is assigned specific routes and must pay an annual licensing fee. Therefore he is required to adhere to the sector legislation.
The fares of services are also set through negotiation between the operators and the Authority.
III. Public transport operators
•UDAHistorically, in Dar es Salaam, public transport firstly consisted of a public transport company UDA (Usafiri Dar es Salaam) created in 1974 (49% central govern-ment and 51% city council - operating 34 midi and large buses. For many years, the UDA was the only le-gal company allowed to operate transport services but it never succeed in coping with the actual demand.
From 1983, the market was deregulated and the UDA market share dwindled as Dala-Dalas benefitted from open access to the market which is now largely in their hands.
•DARCOBOADARCOBOA (Dar Commuter Bus Owners Association) is a union gathering the informal sector and ensur-
ing 43% of the public transport market with a total fleet of around 8,000 mini-vans (16-36 seaters) called Dala dalas. 3,000 owners are members of DARCOBOA, which reflects a highly fragmented market, with most of them owners of just one car. Informal transport is still disorganised: unscheduled services, poor road-worthiness of second hand vehicles and many low-capacity vehicles are the source of much congestion and reckless driving behaviour.
Currently, dala dalas operate 180 routes on which ve-hicles depart only when they are full.
IV. Public transport projectsAs a response to the threat of the increasing conges-tion of its urban traffic, the Dar es Salaam City Council (DCC) decided to embark on the implementation of a bus rapid transit (BRT) system. The system will be regulated and managed by the Dar es Salaam Rapid Transit Agency (DART) which was established by gov-ernment order on May 25, 2007. The buses will be procured and operated by private bus operators that will enter into agreements with the DART agency.

TRANS-AFRICA32
Public transport in Uganda
I. BackgroundIn Kampala, the privately owned Uganda Transport Company (UTC) held the exclusive franchise for bus services until its nationalization in 1972. At that time its only competition came from shared taxis based on saloon or estate cars.
Following its nationalization, and the period of na-tional chaos prior to the establishment of the present Government in 1986, UTC both contracted and focused more closely on its long-distance services. The market for urban transport services in Kampala became open to private sector operators, mostly using small mini-buses though a few Kenyan-sourced midibuses were also deployed. Early market entrants earned high re-turns that then attracted additional investment until the market saturated. At that stage, the Uganda Taxi Operators and Drivers Association (UTODA) emerged to bring order to the market through self-regulation and control of the terminals. The UTODA benefits from strong political patronage.
The rapid development of the bicycle and motorcycle taxi (“boda-boda”) service in recent years is also to be noted. The problem of the use and operation of these small capacity units is that they are inefficient and a major source of traffic congestion in the urban areas - particularly Kampala City - as well as being prone to
high accident rates. Concomitant with the increasing number of boda-boda operators is the escalating pas-senger safety concern.
In early 2007, it was announced that Kampala would remove these small capacity units from its streets and replace them with a comprehensive city bus service covering the greater Kampala metropolitan area. How-ever the decision is yet to be implemented.
Nevertheless, the Government of Uganda has taken significant efforts to promote the use of large buses and the implementation of a good public transport system through the Kampala Urban Traffic Improve-ment Plan studies.
II. Public transport regulationThe public transport sector is supervised by the State Secretariat in charge of Transport. One of the missions of this Secretariat is notably to plan, develop and maintain economic, efficient and effective transport services by road, rail, water, and air. To this end, its Directorate of Transport supervises transport Regula-tion and development.
In Kampala, the licensing authority, the Transport Li-censing Board (TLB), makes no attempt to limit the number of bus or taxi operators, to impose a route structure or to allocate routes. Any operator with
Uganda
Area 241,548 km2
Population 30,262,610 inhabitants
Capital Kampala
Density 125.29 inhab./km2
Growth rate of population 3.37%
Languages Official language: English; Ganda or Luganda, other Niger-Congo languages, Nilo-Saharan languages, Swahili, Arabic
Religions Roman Catholic: 33%, Protestant: 33%, Muslim: 16%, Indigenous beliefs: 18%
Political system Republic
Rate of urbanisation 14.5%
Main cities Kampala: 1.9M inhab., Gulu: 0.2M inhab., Lira: 0.2M inhab.
GDP per Capita (IMF 2007) 381 US$
Contribution of the economic sectors to GDP
Farming: 33%, Industry: 22%, Services: 45%
Rate of inflation 5.8%
Currency Ugandan Shilling

TRANS-AFRICA
Easte
rn A
fric
a
33
a suitable vehicle can obtain a licence defining the route and the fare he will use. The transport operators are permitted to determine their own fares. However, there is some evidence that the operators’ associa-tion (UTODA) have significant influence on the fares charged. For instance, fares can globally increase in peak periods.
III. Public transport operatorsPublic transport plays an extremely important role in the transportation of people in both urban and rural areas due to the low number of private vehicles in the country. Public transport can be classified as follows:
•“Matatus”or“Taxis”These are minibuses with varying capacities. The commonest minibuses have a capacity of up to 14 passengers. There are also bigger medium buses with capacities of up to 25 passengers. This kind of trans-port is used in both urban and rural areas. It is a low capacity collective mode of transport for medium and long distances that can be reached from any point of a public road. The journey has a specific route with in-termediate stages determined according to the user’s destination and request. There is no specific timeta-ble. The method of operation of public transport taxis is basic - the driver has to pay a daily fee to the owner and is responsible for vehicle operating cost (fuel, ter-minal charges).
It is estimated that there are 8,500 in the country. The Matatu services framework is overseen by the “Ugan-da Taxi Operators and Drivers’ Association (UTODA)”. Taxi Operators and Drivers are compulsory members of this association; without UTODA-registration they are legally prohibited from operating. UTODA has been mandated to organise the network of 125 stages around the capital, plus the central taxi park at the root of downtown hill (“Nakasero”), as well as throughout the country. In this role, UTODA is then established as a regulatory authority collaborating with public agen-cies such as the town council, the police, and the min-istry of transports. UTODA charges minibus drivers a fixed daily fee on their first entry into the main taxi terminals and an exit fee on each departure.
This organization was initially set up to protect and promote the interests of owners and drivers. It has become extremely powerful and earns a substantial income from charges levied on minibus operations.
•Bicyclesandmotorbikes(boda-boda)Boda-bodas - local motorcycle transportation - are a popular mode of transport that gives access to many areas within and outside the city. The rapid growth of boda-bodas can be seen as a spontaneous entrepre-neurial response to the increased availability of bicy-cles and motorcycles. They are quite handy for those who do not want to be stuck in traffic for long though they are themselves one source of the congestion. This mode of public transport is available mainly in urban areas, although it is now extending out into rural ar-eas. The boda-boda journey has no determined route and one can go to any requested destination required
of the service provider. It is estimated that there are around 200,000 bicycle boda-bodas et 90,000 motor-cycle boda-bodas in the country.
Both bicycles and motorcycles are used as a mode of “for-hire” transport for both passengers and goods.
•LargebusesBuses with a capacity of more than 25 passengers amount to around 400 in total. No large buses operate within greater Kampala metropolitan area for public transport. They are a high capacity collective mode of transport for medium and long distance journeys (inter-urban and international journeys) with well-es-tablished boarding points (bus parks), routes, inter-mediate stops and timetables.
IV. Public transport projectsMany public transport projects have been running in Uganda these three last years. They aim to improve the mobility conditions in the country and mainly in the biggest cities. The Kampala Institutional and Infrastructure Development Project (KIIDP) aims to improve institutional efficiency of the Kampala City Council (KCC) through implementation of the Strate-gic Framework for Reform (SFR). The project includes the following components: provide city-wide trans-port infrastructure, services improvement and imple-mentation of a comprehensive monitoring and evalu-ation system.

TRANS-AFRICA34
Public transport in Benin
I. BackgroundPublic transport in Benin is largely dominated by the in-formal sector, especially motorcycle-taxis called “Zémid-jan” essentially concentrated in Cotonou and Porto-Novo and providing over 70% of all urban trips.
This type of transport has existed since the end of the 1970s but its expansion really got underway with the economic and unemployment crisis of the 1980s. Since then, many workers have begun to exercise this activity as a way to increase their income. Today, the total number of Zémidjan in Benin is estimated at over 150,000.
Yet until the second half of the 1980s taxi-cars were still playing an important role in Cotonou mobility, but the deterioration of the urban roads coupled with the economic crisis meant they were gradually replaced by motorcycle-taxis which were cheaper and appeared to give greater accessibility to areas with unpaved roads.
Thus, in the absence of conventional public transport, this means of transport has catered for a real mobility need of the population, becoming part of their habits and part of the public transportation landscape. Nev-ertheless, these motorcycle-taxis bring much distur-bance and dysfunction to the public transport system of Cotonou.
II. Public transport regulationPublic transport in Benin is managed by the Ministry in charge of Land Transport, Air Transport and Public
Works. The ministry’s global mission is to elaborate and implement government policy in terms of public works and transport. To this end and specifically in relation to public transport, it is responsible for the development of the regulations and their effective implementation and the design of the transport master plan and assists the local communities in the management of urban and interurban public transport.
In the 1980s, the Beninese authorities unsuccessfully tried to fight against informal transport by prohibiting it, even using repressive measures which did not pro-duce the desired effect; on the contrary, facing a con-stant expansion of this mode of transport, the political authorities were forced to accommodate and therefore tried to regulate with the establishment of minimal con-ditions of exercise such as compulsory licences and monthly taxes. Consequently, today in Cotonou, driv-ers are officially registered and wear a distinctive vest with their identification number. They are grouped into unions that represent their interests and serve as their spokespersons before the authorities.
Now, the main aims of the government are no longer to try to eradicate informal transport but to improve the regulatory and institutional framework of the profes-sion, ensure the capacity-building of operators and pro-mote public transportation with higher capacity units.
III. Public transport operatorsIn Cotonou two-wheeler public transport took off as a real phenomenon in society. The expansion of the Zémid-
Benin
Area 112,622 km2
Population 8,532,547 inhabitants
Capital Cotonou
Density 75.76 inhab./km2
Growth rate of population 3.01%
Languages French
Religions Vaudou: 61%, Catholic: 19%, Muslim: 15%, Protestant: 3%, other: 2%
Political system Republic
Rate of urbanisation 41.33%
Main cities Cotonou: 1.3M inhab., Porto Novo: 0.3M inhab., Djougou: 0.3M inhab.
GDP per Capita (IMF 2007) 709 US$
Contribution of the economic sectors to GDP
Farming: 32.30%, Industry: 13.50%, Services: 54.20%
Rate of inflation 2.5%
Currency Franc CFA

TRANS-AFRICA
Weste
rn A
fric
a
35
jan seems to be the result of a combination of several factors: the formal public transport unable to cope with current mobility demand, the degradation of the urban roads and the high unemployment of young people who find in this activity a way to survive.
It is indeed a source of direct and indirect jobs and gives the State a significant fiscal income from the operators’ expenditures on fuel and lubricants. But the poor condi-tion of motorcycles, the bad behaviour of drivers, the high level of accidents involving the motorcycle-taxis, together with the air pollution from the adulterated fuel they use and diseases arising therefrom are considered much more costly for the community.
Indeed, some studies show that the proportion of ac-cidents involving motorcycle-taxis is up to 40% of the total accidents in the city of Cotonou, yet many of these are not recorded because they are generally set-tled amicably.
The fare is negotiated between the driver and the cus-tomer depending on the distance. It is also common that the vehicle is left in the hands of another driv-er for a day or more, as usual in any other informal transport operations.
IV. Public transport projectsThe development of a national transport policy includ-ing urban and inter urban areas is underway. Neverthe-less, one important aspect of this traffic study applied to the city of Cotonou is the implementation of a modern transport system. Some pre-studies have already been made comprising two parts:
•Theconstructionoffacilitiesandequipmentforpub-lic transport operations including terminals, stations, stops and bus shelters, a garage, rolling stock;
•The strengtheningof the institutional frameworkbythe creation of a public transport authority for urban transport regulation, currently under negotiation with private operators, the improvement of the legislative, regulatory and institutional framework of the motor-cycle taxis profession, the capacity-building of city council staffs in charge of mobility.
Funding sources for the implementation of the project are currently sought.
Burkina Faso
Area 274,200 km2
Population 14,902,785 inhabitants
Capital Ouagadougou
Density 54.35 inhab./km2
Growth rate of population 3.109%
Languages French
Religions Muslim: 52%, Catholic: 30%, Indigenious beliefs
Political system Republic
Rate of urbanisation 19.18%
Main cities Ouagadougou: 1.5M inhab., Bobo Dioulasso: 0.5M inhab., Koudougou: 0.1M inhab.
GDP per Capita (IMF 2007) 492 US$
Contribution of the economic sectors to GDP
Farming: 86.00%, Industry: 2.50%, Services: 11.50%
Rate of inflation 1.2%
Currency Franc CFA
Public transport in Burkina Faso
I. BackgroundAfter Burkina Faso’s independence, the modes of transport used by the population in the city of Ouaga-dougou were dominated by walking and cycling, with
the presence of very few taxis until the early 1980s with the setting up of “Régie Nationale des Transports en Commun (RNTC X9)”, the first organized bus com-pany. Despite this, the taxi market share will continue
TRANS-AFRICA36
to increase in the urban transport supply together with a huge growth in two-wheelers; this trend is still ob-served today as the two-wheelers have remained to date the most widely used mechanized mode of trans-port in Ouagadougou (58% of the population of Ouaga-dougou use motorcycles and 20% use bicycles).
Due to certain significant financial difficulties, RNTC X9 was privatized a decade later, renamed SOTRAO, then fi-nally forced to close in 2000.
In 2003, some private partners, with the help of the Oua-gadougou Council, founded a new company in order to solve the continual dysfunctioning of urban transport in the capital, which was characterized by a high level of serious accidents involving two-wheelers while the level of the air pollution exceeded WHO standards.
In this context the company “Société de Transport en Commun de Ouagadougou (SOTRACO-SA)” began to operate.
II. Public transport regulationThe authority responsible for the management of public transport in Burkina Faso is the Ministry of Transport. Its mission is to organise, regulate and develop the trans-port sector so as to make it a powerful support to the other sectors with a view to the economic empowerment and social development of Burkina Faso.
The Ministry of Transport effectively manages public transport through is Directorate General for land and maritime transports (DGTTM).
For the city of Ouagadougou a structure named the ‘Ex-ecutive Council of Urban Transport in Ouagadougou’ un-der the auspices of the Ministry and in charge of public transport regulation, tried to emerge but with no signifi-cant results to date.
III. Public transport operatorsOuagadougou is one of the cities in Africa well known for its numerous bicycles and motorized two-wheelers. The transport system in Ouagadougou is characterized today by a broad range of mobility modes (walking, bicycles, motorcycles, private cars, taxis and public transport), a high level of mobility (3.7 trips per day and per person older than 14 against an average of 1.2 daily trips in the neighbouring countries) and also an important two-wheeler ownership (150 motorized two-wheelers for 100 households and 79 bicycles for 100 households).
The easy access to purchasing two-wheelers could partly explain the failure of the successive organised public transport companies.
•Urbanbuses:SOTRACOSOTRACO is a private company created in July 2003 operating in the perimeter of the city of Ouagadougou under a concession agreement signed with the Ouaga-dougou Municipality. It serves nine routes limited to the main roads with a fleet of 43 conventional large buses of which only 30 are actually working with an average fleet age of around 12 years.
SOTRACO provides only 6% of the transport market share of Ouagadougou city representing 4 million pas-sengers annually.
The volume of the fleet compared with actual demand is therefore very low and leads to irregularity and long waiting time at bus stops. This fleet is just recovering from a sharp fall in numbers due to long immobilisation of buses caused by a lack of qualified technical staff and unavailability of spare parts.
SOTRACO works in a difficult context marked by the in-tense activity of the two-wheelers which remain the most widely used means of transport at the expense of public transport.
However, there is a clear will by the Burkina Faso State to promote public transport. Therefore, since its incep-tion, SOTRACO has received substantial support from the State in terms of exemption from various taxes and pay-ment of subsidies for its operation.
The other organised operators essentially cover the inter-urban and interregional transport market.
•TaxisIn Ouagadougou, five-seater taxis constitute the most commonly used means of collective transport. Their number is estimated at around 1,500, and their owners are grouped into several unions. However, taxis are usu-ally in poor condition, uncomfortable and unsafe. Most of them are very old and badly driven.
IV. Public transport projectsSeveral projects related to the field of transport have been developed with the aim of improving the sector. The most important are:
•The Second Program of the Transports Sector(PST2)
To promote sustainable economic growth, the Gov-ernment of Burkina Faso adopted a ten-year strategy (2000-2010) in June 2000, following a Round Table on finance. This included the development of the trans-port sector with regard to the institutional reinforce-ment of the road transport sector and the enhance-ment of the network currently implemented by the Sectorial Transport Project (PST).
•The Executive Council of Urban Transports inOuagadougou(CETUO)
At the institutional level, the multiplicity of urban transport decisions-makers for the city of Ouaga-dougou and the overlapping of their responsibilities are regarded as the essential cause of the difficulties in organizing and managing the urban mobility of Ouagadougou.
The Ministry of Transport in partnership with the Mu-nicipality of Ouagadougou has begun to carry out reforms among which are the creation of a single regulatory body, the Executive Council of the Public transports of Ouagadougou (CETUO), is the main ob-jective.

TRANS-AFRICA
Weste
rn A
fric
a
37
Cape Verde
Area 4,033 km2
Population 423,613 inhabitants
Capital Praia
Density 105.04 inhab./km2
Growth rate of population 0.734%
Languages Portuguese, Creole of Cape Verde
Religions Catholic: 93%, Protestant: 7%
Political system Republic unitary, parliamentary
Rate of urbanisation 63.50%
Main cities Praia: 0.1M inhab., Mindelo: 0.07M inhab.
GDP per Capita (IMF 2007) 2,925 US$
Contribution of the economic sectors to GDP
Farming: 11.4%, Industry: 15.2%, Services: 73.4%
Rate of inflation 3%
Currency Escudo of Cape Verde
Public transport in Cape Verde
I. BackgroundThe national road network of Cape Verde covers about 1,500km of which half is paved, located in the islands of Santiago, Sal and Sao Vicente, and which is rela-tively denser in Santiago.
The main urban centres have a collective transport network which provides links between different local-ities through minibuses commonly called Hiace and metered taxis. The Hiace also link the various regions of the island, and are provided by several private companies.
II. Public transport regulationThe Ministry of Infrastructures, Transport and Sea is the ministerial department in charge of the regulation of transport in Cape Verde. It proposes, coordinates and executes the policy of the government in terms of infrastructures, communications, transport, navi-gation, flight and marine safety, ports, airports and fishing.
In coordination with the Secretary of Foreign Affairs, Cooperation and Communities, the Ministry propos-es and executes political measures, actions and pro-grammes and the administration of the relations of Cape Verde with all the specialized organisations in the sphere of its intervention.
III. Public transport operators
•Taxis
There is a very well developed collective taxis network. All taxis are equipped with meters; they constitute a rela-tively comfortable means of transport with high frequen-cies of circulation.
•Aluguer
Literally, “Aluguer” means “for hire”. Aluguer are minibus-es of at least fifteen seats that circulate in the main hubs of the islands, and cross islands in search of customers or of goods to be transported. The trip fare is cheap but it is necessary to take into consideration a certain flex-ibility of schedules and routes while using this means of transport.
•Bus
A national public transport company named TransCor op-erating with conventional large buses within the islands was dissolved in June 2002.

TRANS-AFRICA38
Public transport in Côte d’Ivoire
I. BackgroundThe idea of organizing public transport in Abidjan ap-peared back in the early 1960s. Yet already in 1950 traditional informal transport was operating in Abidjan with traditional small unit boats, small vans of around 6-7 seats with some minibuses called gbakas.
After the independence of Côte d’Ivoire with the crea-tion of a parastatal public transport company called SOTRA (Société des Transports Abidjanais) in 1960, the operational areas of these traditional forms of trans-port were substantially reduced as the Government of Côte d’Ivoire decided to award the official monopoly on public transport in Abidjan to the formal compa-ny. The informal “gbakas” and “woro-woro” were only authorized to serve different markets. But with the strong demand boosted by demographic growth, this market service turned into a fully-fledged urban pub-lic transport service despite several measures taken by the government to prevent it. The combination of this demand and the economic crisis during the 1980s empowered the development of this informal sector despite the monopoly of SOTRA, which in parallel was experiencing a decline in its activities.
The spectacular proliferation of informal transport in a context of an insufficient supply by SOTRA result-ed in the degradation of the urban transport system, causing congestion, unsafe roads and pollution. In this context, the Government of Côte d’Ivoire has en-
forced measures to restore the viability of the trans-port system including creating a transport authority (AGETU) established in 2000.
II. Public transport regulationPublic transport is managed by the State of Côte d’Ivoire through various structures under the author-ity of the Ministry of Transport.
In order to improve the quality of urban transport and to resolve the overlapping of responsibilities between the various entities responsible for public transport, the State of Côte d’Ivoire, with the support of interna-tional donors, set a new institutional and regulatory framework with the establishment in February 2000 of AGETU (Agence des Transports Urbains). AGETU is the organising transport authority of the Abidjan District and its suburbs. Its primary missions are the organisation, coordination and oversight of public ur-ban transport in Abidjan.
In the same period, the Government of Côte d’Ivoire created other institutional structures such as SONATT in charge of issuing driving licences and other forms of public transport authorization.
III. Public transport operators
•TransportservicesundercontractCurrently, there is one service operating under a for-mal contract. It is performed by SOTRA through a con-
Côte d’Ivoire
Area 322,461 km2
Population 20,617,068 inhabitants
Capital Abidjan
Density 63.94 inhab./km2
Growth rate of population 2.13%
Languages French
Religions Muslim: 38.6%, Christian: 35.8%, Indigenous beliefs: 11.9%, no religion 16.7%
Political system Republic
Rate of urbanisation 46.06%
Main cities Abidjan: 5.9M inhab., Bouaké: 1.3M inhab., Daloa: 0.3M inhab.
GDP per Capita (IMF 2007) 1,057 US$
Contribution of the economic sectors to GDP
Farming: 68%, Industry: 10%, Services: 22%
Rate of inflation 1.8%
Currency Franc CFA

TRANS-AFRICA
Weste
rn A
fric
a
39
cession agreement with the State of Côte d’Ivoire. It was signed in 1998 for a period of 15 years and gives SOTRA the monopoly on public transport in Abidjan except in two specific districts. But in reality, SOTRA operates throughout the whole city with a total fleet of about 600 large buses of of which 500 are in daily operation including various makes of vehicles such as Irisbus, Tata, Kia, Iran Qodro. SOTRA receives an annual subsidy for the free transportation of certain social and professional categories (civil servants, pu-pils and students) as well as for the low level of its fares in general.
The SOTRA fleet is largely insufficient to cope with the present mobility needs of the population, who are therefore obliged to use diverse other informal means, which are constantly on the increase. In fact, SOTRA meets no more than 20% of the total demand for public transport in Abidjan.
Nevertheless with the development of lagoon trans-port by boats called “Bateaux-bus”, carrying around 150 persons each, SOTRA intends to reagain its po-sition as the primary means of public transport in Abidjan. To this end in 2007, SOTRA innovated in the Sub-Saharan public transport domain with the launch of a bond issued in the UEMOA sub-regional financial market in order to finance its investments.
•TransportoperatedwithoutformalcontractVarious forms of transport operating without formal contracts with the State exist though some of them are unofficially “recognized” and authorized. These include:
•Theprivatelyowned“Gbakas”minibuseswith14to22-seat capacity connecting a downtown district to the outskirts of the city. They number about 5,000 and represent 27% of the public transport supply in Abidjan and operate on predetermined routes though they stop anywhere along their way. Never-theless, they are quite unsafe.
•The informal 4-seater shared taxis or “woro-woro”are colour-coded according to district. They account for 32% of the public transport market share and number an estimated 11,000 in Abidjan.
•Metered-taxis:4-seatervehiclesestimatedat11,300and allowed to cover the whole area of the Abidjan District. They are fitted with holographic meters.
•Traditional waterborne transport called “pinasses”operating a hundred indigenous boats.
With the exception of the metered taxis, the Authority has no control over the fares of these informal op-erators and therefore no financial support is given to back their operations.
However AGETU intends to implement an investment programme for the renewal of the urban transport public vehicle fleet, especially the minibuses (gbakas) and shared taxis (woro-woro).
Gambia
Area 11,295 km2
Population 1,688,359 inhabitants
Capital Banjul
Density 149.48 inhab./km2
Growth rate of population 2.841%
Languages English
Religions Muslim: 85%, Christian and Indigenous beliefs: 15%
Political system Republic
Rate of urbanisation 60%
Main cities Banjul: 0.8M inhab., Serekunda: 0.3M inhab., Brikama: 0.08M inhab.
GDP per Capita (IMF 2007) 405 US$
Contribution of the economic sectors to GDP
Farming: 30.14%, Industry: 14.64%, Services: 55.22%
Rate of inflation 3.5%
Currency Dalasi

TRANS-AFRICA40
Public transport in Gambia
I. BackgroundThe national road network of Gambia comprises 1,559km of classified roads of which 495km are paved. Around 1,300km of unclassified earth roads also exist, giving ac-cess to rural settlements as well as residential areas in some urban settlements.The road network in and around the capital Banjul is much better developed than in other parts of the country. Road conditions in Gambia are generally poor, as a result of rou-tine under-investment and periodic maintenance.Large buses are run by the Gambian public transport corpo-ration. Some midibuses also operate as public transport to the outer towns and villages.The ferries that cross the Gambia are run by Gambia Public transport, at Banjul. In 2007 the two ferries were working but delays are always possible, some of several hours, espe-cially if crossing with a vehicle.
II. Public transport regulationThe public transport sector is supervised by the State Secretar-iat for Works, Construction and Infrastructure Development.The main aim of Gambia’s government is to contribute to reach-ing the Poverty Reduction Strategy Paper (PRSPII) adopted by the Government of the Gambia as its medium-term strategy for implementing the country’s long-term development framework - VISION 2020 which focuses on transport but with a broad-er emphasis on infrastructure and regional interconnectivity.The Government is also involved in public transport essen-tially through its company the Gambia Public Transport Cor-poration which is closely followed by a special department inside the State Secretariat, dedicated to this task.
III. Public transport operators
•BusesBuses are operated by GPTC (Gambia Public Transport Corporation) and run on a limited number of routes, link-ing Banjul with the countryside.
An act passed by the Banjul based parliament created The Gambia / Libya Arab Public Transport Corporation in 1976. This Act was amended in 1988 and it brought about the establishment of the Gambia Public Transport Corporation (GPTC) with the Gambia Government as sole shareholder. The main aim of the Corporation as prescribed by the legis-lation is to “operate and maintain the public transport serv-ices of The Gambia for the conveyance of passengers and goods.” In 1993, GPTC was merged with the Gambia Ferry Services Ltd and the Corporation objectives amended to in-clude “operating and maintaining ferry services and in-land water-way transportation”, but in 2001 the Ferries Division of GPTC was hived off again and transferred to the Gambia Ports Authority.
GPTC presently has a fleet of 51 large buses, about 50% be-low the minimum number needed to serve current demand.
•TaxiThere are two types of taxis: green taxis (tourist cabs) and yellow taxis (regular cabs). Tourist taxis have higher fares regardless of number of passengers travelling. These taxis must have basics safety requirements such as seat belts and working indicators. The cheaper regular taxis are mainly used by the locals and the price depends on the number of persons in the cab.
Ghana
Area 238,538 km2
Population 23,382,848 inhabitants
Capital Accra
Density 98.03 inhab./km2
Growth rate of population 1.93%
Languages English
Religions Protestant: 29%, Catholic: 14%, Indigenous beliefs: 38%, Muslim: 19%
Political system Republic
Rate of urbanisation 49.42%
Main cities Accra: 4M inhab., Kumasi: 1.8M inhab. Sakondi-Takoradi: 0.6M inhab.
GDP per Capita (IMF 2007) 690 US$
Contribution of the economic sectors to GDP
Farming: 55%, Industry: 14%, Services: 31%
Rate of inflation 10%
Currency Ghanian cedi

TRANS-AFRICA
Weste
rn A
fric
a
41
Public transport in Ghana
I. BackgroundThe problems of Ghanaian public transportation are identical to those observed in developing countries ex-periencing demographic and economic growth, since the improvement of the standard of living is linked to improved mobility of people. The public transport in Accra, Kumasi and other main cities of Ghana is thus characterized by the fundamental paradox of a market with proven excess demand and shortage of supply.
The transport industry is currently dominated by the informal sector which provides about 90% of trans-port services but their services are unreliable, uncom-fortable and unsafe.
IN 1927, the Accra Town Council was already operat-ing bus services in Accra, Kumasi, Sekondi–Takoradi and Obuasi. Over the years, Ghanaian governments have established bus service companies such as the Omnibus Services Authority (OSA), State Transport company (STC), City Express Services (CES), and late-ly Metro Mass Transit (MMT) Ltd. The informal sec-tor also operated and continues to operate transport services alongside the formal sector. But, road trans-port services provided by operators in both the formal and informal sectors have been characterized by very harsh environmental factors which have contributed to the low levels of these services. As a consequence, operators like STC, CES and OSA in the formal sector have not fared well, and this compelled the Ghanaian government to divest STC and CES and to liquidate OSA in the 1990s.
II. Public transport regulationThe public transport sector is supervised by the Min-istry of Transport responsible for formulating policies for the transport sector and establishing the regula-tory framework for transport operations, investments and the development of an integrated road transport system which is modally complementary. In Accra, both trunk roads and urban roads are the responsibili-ty of the Ministry of Transport. Yet some other aspects of transportation such as insurance and transport law enforcement are treated by some other ministries.
For the Ministry to realize its sector objectives, it has an oversight responsibility for several agencies among which are the Driver and Vehicle Licensing Authority (DVLA) and the National Roads Safety Com-mission (NRSC) with the respective responsibilities to ensure good driving standards and promote road safety. There is also a third department under ministry responsibility specifically related to the public trans-port staff training, which is the Government Techni-cal Training Centre (GTTC). Established in 1968, its objective is to train and provide skilled workers for the automobile and allied trade industries in order to supplement the engineering manpower needs of the Road Transport Sector.
Along with this ministry, the Metropolitan, Municipal, and District Assemblies (MMDAs) exist to supervise local public transport but a lack of institutional frame-
work makes them currently inoperative to coordinate those activities. Depending on the size of the commu-nity, local Government Councils are responsible for lo-cal traffic management schemes, parking control and management of public transport terminals.
III. Public transport operatorsWithin the Accra metropolitan area, public transport is provided by a mix of privately owned minibuses (known as tro-tros, minibuses of 18 seats), taxis and large buses.
•MetroMassTransit(MMT)MMT was created in 2003. It is a limited liability com-pany with the Ghanaian state a major shareholder at 45%. As such it receives favourable financial support from the government. These “city metro bus services” were initially met with scepticism by commuters, but have increased in popularity and are mainly used to perform long distance transport. MMT currently oper-ates around 1,024 large buses with an average age of five years made up of various types: VDL buses, semi-low floor single and double-deck built-up buses from China [Yaxing], DAF chassis bodied in Ghana and TATA. MMT operates along the main corridors of the cities and to the outskirts, constituting what is called intra-city mass transport. Out of the car owners, three out of four Ghanaians use public transport to reach their destination in the Greater Accra Region which is the most heavily congested area of Ghana and it has therefore the highest priority to set up an efficient public transport system. To this end, MMT started a pilot project for a bus rapid transit system in Accra in September 2005 to solve the problems of congestion in the streets of Accra and Kumasi, which causes a huge loss of time for all commuters in peak time.
MMT operations are not subsided though since the creation of the company, the Ghanaian State has regu-larly invested for the acquisition of about 900 large buses for MMT, mainly by bilateral cooperation. But due to lack of technical support and spare parts avail-ability, especially for some Chinese buses purchased, MMT registered a low level of availability of its fleet.
•Tro-tro(minibuses)andsharedtaxiservicesTro-tro are managed by unions and cooperatives and offer services along defined routes, usually between terminals or lorry parks.
Tro-tros are the most common way for Ghanaians to travel. They are usually converted minibuses that run a regular, well-known route, are relatively cheap and frequent but often in a poor state of repair and over-crowded. At present some of these vehicles are old, approaching 30 years of age.
A taxi will be shared by 4 or 5 passengers. Private taxis operate in Accra, Kumasi and Tamale. Some oth-er taxis also run regular routes, which cost more but provide for a more comfortable ride.
Their fares are set through a negotiation between the unions and the Ministry of Transportation and on a common basis can be revised in case of a significant change in the costs of transport main inputs.

TRANS-AFRICA42
These operations suffer from a number of quality prob-lems. A significant proportion of taxis operate outside the framework managed by the unions and coopera-tives, and are usually opportunist “floaters” that take passengers that might otherwise use the services of either the tro-tro services or the Metro Mass Transit routes.
IV. Public transport projectsWith the aim to improve public transport in Ghana mainly in the cities of Accra and Kumasi, the govern-ment - assisted by some partners - is conducting urban transport projects including the Ghana Urban Trans-
port Project (started in 2007) backed by the World Bank of which the flagship is the implementation of a Bus Rapid Transit (BRT) system. The outcomes of this BRT corridor are expected to be attractive and sustainable transport.
Guinea Bissau
Area 36,544 km2
Population 1,503,182 inhabitants
Capital Bissau
Density 41.13 inhab./km2
Growth rate of population 2.03%
Languages Portuguese
Religions Muslim: 55%, Christian: 10%, Indigenous beliefs
Political system Republic
Rate of urbanisation 30.17%
Main cities Bissau: 0.6M inhab.
GDP per Capita (IMF 2007) 213 US$
Contribution of the economic sectors to GDP
Farming: 79%, Industry: 8%, Services: 13%
Rate of inflation 4%
Currency Franc CFA
Public transport in Guinea Bissau
I. BackgroundThe surface transport infrastructure in Guinea Bissau is 2,755km in length, of which only 770km is paved. Almost the totality is continental, with the road infra-structure in the islands amounting only to 79km of which 13km is paved. Almost 50% of the national and international grid is tarred while less than 30% of the regional and of 10% local grids are tarred. During the rainy season most parts of the country remain poorly accessible. Furthermore, the lack of bridges on the numerous rivers of the country augments the difficul-ties. The poor state of the transport infrastructures but also the absence of any railway line hamper the commercial interchanges.
In the countryside, walking and cycling remain the main option and collective transport appeared in the modern form of taxis only in Bissau.
II. Public transport regulationPublic transport management is under the responsibil-ity of the Ministry of Transport and Communications.
III. Public transport operatorsIn Bissau, public transport is provided by minibuses called toca-toca operating within the city on fixed routes and regular shared taxis. These taxis are in white and blue five-seater cars, which are not metered and generally in good condition.

TRANS-AFRICA
Weste
rn A
fric
a
43
Guinea Conakry
Area 245,857 km2
Population 9,806,509 inhabitants
Capital Conakry
Density 39.89 inhab./km2
Growth rate of population 2.49%
Languages French
Religions Muslim: 85%, Christian: 8%, Indigenous beliefs: 7%
Political system Republic
Rate of urbanisation 34.02%
Main cities Conakry: 2.2M inhab., Nzérékoré: 0.3M inhab., Guékédou: 0.3M inhab.
GDP per Capita (IMF 2007) 417 US$
Contribution of the economic sectors to GDP
Farming: 76%, Industry: 10%, Services: 14%
Rate of inflation 20%
Currency Guinean Franc
Public transport in Guinea Conakry
I. BackgroundConakry comprises almost one quarter of the total population of Guinea, but also the major share of eco-nomic activity: in the transport sector for example, vehicles circulating in Conakry represent about 90% of the total fleet of the country.
Urban mobility in Conakry is characterized by two major constraints: on the one hand, inadequate roads that are poorly distributed and heavily degraded and on the other, the lack of collective and organised transport. These two constraints, combined with the linear structure of the city, have strongly determined the conditions for urban travel.
Since the cessation of activities of SOGETRAG (former Conakry public transport, in 1990s) the city of Co-nakry lives under the double constraint of shortage of supply and disorganization of the public transport system. The offer is then reduced to collective mini-buses called “magbanas” and shared taxis concentrat-ed on the main roads, in inadequate numbers during the peak hours. A few buses provide connections to and from the port and in the direction of the high suburbs.
In addition to having a more restricted public trans-portation, users must walk a significant distance be-fore and after the public transport trip.
Intercity transport is provided by minibuses, Peuge-ot 504 (bush taxis) of seven-seats, which operate on main roads, and trucks (Candongas). The Candongas are pickup trucks with seats and a roof for luggage carrying ten to twenty passengers. They are averagely safe but very economical and suitable for the rural routes.
There are no timetables in the intercity transport and vehicles leave when they are full.
After the failure of SILO DIATA the former public trans-port company, a new parastatal company with large buses was created called TRANSTER Transportes de
Passageiros SARL, which enjoyed the exclusive right to operate in Bissau. But this status was revoked in 2007, in order to establish a legal framework for com-petition in the urban transport market.

TRANS-AFRICA44
Liberia
Area 111,370 km2
Population 3,441,790 inhabitants
Capital Monrovia
Density 30.90 inhab./km2
Growth rate of population 2.66%
Languages English
Religions Christian: 67%, Traditional religions: 18%, Muslim: 15%
Political system Republic
Rate of urbanisation 60.48%
Main cities Monrovia: 1.8M inhab.
GDP per Capita (IMF 2007) 196 US$
Contribution of the economic sectors to GDP
Farming: 65%, Industry: 10%, Services: 25%
Rate of inflation 15%
Currency Liberian Dollar
II. Public transport regulationThe authority responsible for the management of public transport in Guinea is the Ministry of Transport. Its mis-sion is to design, develop and implement the government policy especially in the sub-sector of road transport.
To carry out its mission, the Ministry of Transport includes a Department of Land transport, public en-terprises, decentralized services and a consultative body. The advisory body is the AGETUC.
The National Department of Land Transport issues an authorization for each public transport vehicle, re-newable each year.
In Conakry, municipalities have decentralised manage-ment; they can manage their own budgets and are man-aged by the elected mayor with their own department of transport. Likewise the City of Conakry has a special de-partment which deals with transport, roads and housing.
III. Public transport operatorsThe public transport service is operated by taxis, min-ibuses and buses.
•UrbanbusesWhilst the linear configuration of the city makes it adapt-ed to a mass transit system along the central corridor, large vehicles can also be found in local areas.
Only the company “Transport Future” (FT) provides some urban lines with a dozen buses of a total fleet of 50 buses (the other being used on intercity and inter-national transport service). The fleet of “Future Trans-port” is very heterogeneous in terms of brands (GMC,
Toyota, Saviem, DAF), and consists essentially of used vehicles. Due to the poor condition of its fleet, FT has a technical maintenance unit that can be considered as overstaffed: 52 out of a total of around 200 people. One of the main problems for their buses is the lack of ad-equate infrastructure, entailing more congestion due to the disorganization of the sector. Thus, it is common for FT buses to make only a single round in the afternoon (from 4:00pm) from the port to the high suburbs.
In a recent initiative in May 2008 the Guinean State es-tablished the “Société Guinéenne de Transport (Soguit-rans)” a parapublic company with a share of 49% for the state of Guinea and 51% held by a private operator. The company currently operates with a fleet of 100 buses purchased in 2007 by the State through a loan from the ECOWAS Bank for Investment and Development. The new operator intends to effectively ensure urban and domestic transportation.
•“Magbana”minibusesMagbanas constitute the second mode of transportation after taxis and generally serve the main corridors of the urban road network. Minibuses number around 1,500. They are vehicles of 15 to 18 places although they are frequently overloaded especially at peak times.
•TaxisFour-seater taxis are the main mode of urban transpor-tation numbering around 5,000-6,000 in Conakry. Taxis operate in all the local areas of the capital. The rest of the market is made up of private sector and individual vehicles that sometimes provide “unregistered” public transport, particularly during peak periods.

TRANS-AFRICA
Weste
rn A
fric
a
45
Public transport in Liberia
I. BackgroundPublic transport, the foremost mode of transportation in the country, is in virtual disarray.
This came about as a result of several years of con-flict in Liberia in which nearly 90% of all private and public transport vehicles were looted or destroyed. Roads and bridges have been severely damaged, leav-ing only about 700km of damaged paved road surface and 1,600km of unpaved road by early 2006.
In Monrovia, the daily movement of about 400,000 commuters to the city centre and its environs remains the challenge for public transport in this crowded city of about 1.2 million people. About 12% of the popula-tion are owners of private cars, 19% are users of NGO or government vehicles, while 69% depend on the grossly inadequate public transport service for mo-bility. The sector is currently unorganized, inefficient and globally inadequate to meet basic accessibility needs (work, school, health care).
The Liberian Government’s foremost objectives have therefore been to quickly embark upon the rehabilita-tion of infrastructure and the rebuilding of systems to deliver basic services, given that the transportation system remains a key factor in the recovery process of Liberia.
II. Public transport regulationPublic transport is under the authority of the Ministry of Transport. Its responsibilities are to establish and implement the overall transportation policy of the Re-public of Liberia, and develop plans for the movement of goods and people in and out of the Republic, to establish rules and procedures and enforce standards for transport services of private and public common carriers and to develop, regulate, control and monitor vehicles and mass transportation.
Entry into the public transport sector is open to any-one with an appropriate driving licence and a vehicle that has passed a roadworthiness test.
The fares and routes of public transport operators are overseen by the government.
III. Public transport operatorsThe yellow taxi-cabs and buses are by far the most popular means of travel.
In 2006, there were 18,788 registered passenger vehi-cles, of which 12,800 were commercial vehicles split into around 350 used buses and the remaining used as taxi-cabs. Both usually make journeys between towns with regular fares. Taxis do not have meters and can carry several passengers whom they pick up and alight en route.
Bus services are provided by The Monrovia Transit Au-thority (MTA). MTA is a public corporation receiving capital subsidies from the government of Liberia in the form of new buses. MTA was set up in 1979 to provide bus services throughout Monrovia and some
inter-city services. The corporation is required to cov-er its operating costs. It ceased its operations prior to the war and resumed them recently little by little by reconstituting a fleet through bilateral cooperation.
IV. Public transport projectsLiberia currently lacks basic Land Transport infra-structure, including roads, bridges, bus shelters and bus terminals. Many highways and key bridges in the country are in a state of disrepair. They require mas-sive rehabilitation/construction to facilitate the full and adequate provision of transport services. The Li-berian Government is formulating a National Trans-port Policy, acknowledging that the enhancement of transport infrastructure should accelerate the devel-opment of other productive sectors. Presently, Liberia State is seeking partnerships to implement the emer-gency pilot urban transportation rehabilitation phase for Monrovia and its environs.
Besides, Liberia’s socio-economic recovery is closely linked to the availability of an organized, effective, ef-ficient, affordable and well-coordinated public trans-port system. The goal of the government is therefore to establish a sound organized, efficient and economi-cal transport system encompassing three integrated components: Monrovia Urban Bus System (MUBS), a school Bus System (SBS) and a regional (inter-city) bus system (RBS).
TRANS-AFRICA46
Public transport in Mali
I. BackgroundThe history of urban public transport in Bamako is very eventful, being characterized by repeated fail-ures of public and private enterprises. A chaotic in-formal sector has overcome the formal companies through its capacity for self-organization.
Until independence in 1960, transportation of people remained rudimentary. At this time, with the growth of the city, the covered pick-up (Peugeot 404) appeared called “duru duruni” coupled with some taxis provid-ing additional transport.
No conventional public or private enterprise has been able to survive and the informal sector still occupies a dominant position.
II. Public transport regulationThe Ministry of Equipment and Transport is responsi-ble for public transport management, yet several ad-ministrative departments of the State and district, as well as professional corporations and unions are also involved. In the case of Bamako, the Regulatory Office of Urban Traffic and Transit of the District (BRCTU), established in 1989, manages transportation and traf-fic including the elaboration of a transport plan. As such, each operator has to sign an agreement with the District of Bamako to be granted the right to operate a specific route.
This liberalised and highly competitive market im-pacted the level and quality of supply by eroding safe-ty and lowering the quality of service for customers. Moreover, in the absence of a regulatory transport authority, conflicts of competence between the State and district and conflicts of interest between profes-sional groups for control of the transport system are common.
III. Public transport operatorsThe public transportation services are provided by two kinds of company:
•Theindividualinformalcompanies“Sotrama” or “duru duruni” are the dominant forms of transport today, numbering around 1,800. They are informal 22-seater mini buses essentially operated by the private sector. They are highly atomised yet very self-organized; their vehicles operate on two for-mulas: on demand or predefined route services. The number of vehicles, their geographical coverage and their regularity are considerable and the trip fare is ac-cessible. However, comfort and safety are limited and these vehicles are a principal cause of traffic jams.
•TheformalcompaniesThe National Public transport Company of Bamako was created in 1962, and collapsed in 1976, leaving the field open for private companies, which were be-coming increasingly organised. The enormous gaps in
Mali
Area 1,240,198 km2
Population 12,666,987 inhabitants
Capital Bamako
Density 10.21 inhab./km2
Growth rate of population 2.76%
Languages French
Religions Muslim: 90%, Indigenous beliefs and Christian: 10%
Political system Republic
Rate of urbanisation 31.78%
Main cities Bamako: 2.3M inhab., Sikasso: 0.2M inhab., Kayes: 0.2M inhab.
GDP per Capita (IMF 2007) 531 US$
Contribution of the economic sectors to GDP
Farming: 41.10%, Industry: 16.60%, Services: 42.30%
Rate of inflation 4.5%
Currency Franc CFA

TRANS-AFRICA
Weste
rn A
fric
a
47
the service, however, led the district to take interest again in the sector, by signing a concession agreement in 1992 with the company Bamabus (Sotraca limited company) and Tababus (STUB). These organised com-panies enjoyed exclusive operation of vehicles over 16 seats on some routes and stops. However, they faced major financial difficulties and fierce competi-tion from the individual companies.
Presently, about 160 large buses of approximately 100 seats each with an average age of 17 years are in oper-
ation owned by a handful of private companies such as Bani Transport (54 buses); DiarraTransport (25 buses and 2 extended buses); Banimonotie (10 buses).
Each company operates routes assigned according to the agreements signed with the district of Bamako with fares determined in accordance with the Government.
Niger
Area 1,186,408 km2
Population 13,272,679 inhabitants
Capital Niamey
Density 11.19 inhab./km2
Growth rate of population 2.87%
Languages French
Religions Muslim: 95%, Christian and Indigenous beliefs: 5%
Political system Republic
Rate of urbanisation 21.10%
Main cities Niamey: 1M inhab., Zinder: 0.3M inhab., Maradi: 0.3M inhab.
GDP per Capita (IMF 2007) 313 US$
Contribution of the economic sectors to GDP
Farming: 39.86%, Industry: 16.76%, Services: 43.38%
Rate of inflation 0.2%
Currency Franc CFA
Public transport in Niger
I. BackgroundIn Niger, most journeys are made by the tarred roads which connect the main cities of the country.
Nevertheless, road public transport is scarcely devel-oped either. The most convenient means of transpor-tation are the taxi vehicles that exist in various states of safety, following the example of the minibuses run-ning throughout the country. The urban areas have denser traffic with a high volume of two-wheeled ve-hicles of unpredictable behaviour. Niger has no public transport by rail.
II. Public transport regulationUnder legislation setting out the fundamental prin-ciples of the transport regime, public transport in Niger is administered by the State through the Min-
istry of Transport and Civil Aviation and especially its Directorate for land transportation. The latter is responsible for transport policy development, the development and implementation of rules and regu-lations of land transport and also for issuing driving licences and permits to operators. It is involved in the conception and coordination of road safety as well.
With a view to efficient management of the Niamey central station and the secondary stations, the Niger State established a public institution namely ECOGAR in February 1988 placed under the responsibility of the Urban Community of Niamey, whose main mission is to ensure the proper functioning of the stations and the regularity of services offered to users.

TRANS-AFRICA48
III. Public transport operators
•Bus
Some buses are operated in Niamey by the “Société des Transports urbains du Niger (SOTRUNI)” a private com-pany founded in 2007 following the privatization of SNTN. At its inception, it served almost the entire Ni-amey urban area and suburbs with 14 routes on which 20 buses operated. But the lack of adequate equipment and scarcity of financial resources have largely cut down this offer, which is scarcely used at present.
In addition, intercity and international transport is provided by the SNTV (ex SNTN) and some independ-ent operators. These regular services are operated by buses in good condition and use stations belonging to the operators all along the routes. In 2003, the fleet of national intercity transport was estimated at 3,087 buses: an increase of 12% compared with 2002.
•Taxisor‘’Talladjé-Talladjé’’They are used mainly in the urban centre and carry pas-sengers from downtown to the periphery and vice versa.
•CitytaxisThe profession of city-taxi operators is strictly regulated and subject to a special authorization. 4-5 seater city taxis are used in large urban centres where they can cir-culate freely, but also along specific routes. Their number has seen a marked increase in recent years. There are now more than 1,000 taxis in the city of Niamey.
•Motorcycle-taxisor“Kabou-Kabou”They are used in several cities or large villages with the ad-vantage that they can enter areas with poor accessibility.
Finally, a liaison between the two banks of the river Niger exists, plied by ferries and motorised and non-motorised indigenous boats. The transport service is relatively broad and river transport activities play a major role in the economies of the river regions.
Nigeria
Area 923,768 km2
Population 146,255,306 inhabitants
Capital Lagos
Density 158.32 inhab./km2
Growth rate of population 2.02%
Languages English
Religions Muslim, Christian, Indigenous beliefs
Political system Federal Republic
Rate of urbanisation 49.50%
Main cities Lagos: 12.6M inhab., Ibadan: 5M inhab., Kano: 4.3M inhab., Benin: 2.3M inhab.
GDP per Capita (IMF 2007) 1,161 US$
Contribution of the economic sectors to GDP
Farming: 65%, Industry: 15%, Services: 20%
Rate of inflation 6.5%
Currency Naira
Public transport in Nigeria
I. BackgroundSince the attainment of independence in 1960, the problems of the Nigerian transport system have included bad roads; inadequate fleets of buses or trucks; irregular, inadequate and overcrowded trains and airplanes and congested ports.
In parallel there are also management problems such as the dearth of suitably-trained transport managers and
planners and serious issues of institutional coordination and ineffective traffic regulations.
Obviously, the former capital of the country, Lagos, considered as the sixth largest city and one of the most rapidly urbanizing metropolitan areas of the world, showed the same dysfunctional features. The rapid urbanization of its metropolitan area combined with

TRANS-AFRICA
Weste
rn A
fric
a
49
inadequate or poorly executed development plans, has given rise to numerous transportation problems in this metropolis. These include increasing traffic conges-tion, the worsening state of disrepair of roads, dete-riorated physical attractiveness and comfort of road-based public transport, rising levels of road accidents and increasing rates of traffic-related emission and at-mospheric pollution alongside the growing menace of “Okada” (motorcycle) transporters.
The Government was due to take measures to ensure an efficient transport infrastructure and services that can sustain the social and economic development of the country.
II. Public transport regulation
•InLagosThe public transport sector is supervised at the fed-eral level by the Federal Ministry of Transport and at the level of Lagos State by the State Ministry of Trans-portation. The State Ministry’s vision is to establish a safe, efficient, affordable and seamless Intermodal Transport System in line with global best practices. In practice, it is responsible for the State road infra-structures network, road traffic and public transport provision within the Lagos State boundaries through a large number of departments and agencies at State level as well as local level.
But in order to provide consistent planning and effi-cient implementation of the policies, the Lagos State government established, with the support of the World Bank, the Lagos Metropolitan Area Transport Author-ity (LAMATA) in 2003. LAMATA has the overall role of coordinating the transport policies, programmes and actions of all transport related agencies and of im-plementing and managing public transport services in the Lagos metropolitan area. As such, it also acts as advisory body to the Governor of Lagos State on pub-lic transportation policy issues.
In 2007, LAMATA was successful in passing the neces-sary regulation through the Lagos State House of Rep-resentative to improve transportation in Metropolitan Lagos such as the franchise regulation. It empowered LAMATA with the tendering of exclusive operating rights for specific transport services on defined routes or within geographical areas. In this framework, a pilot Bus Rapid Transport scheme called “BRT lite” has been designed and was successfully implemented in March 2008. It is known for being the first BRT scheme im-plemented in Sub-Saharan Africa. Generally speaking, the franchise contract stipulates that it is the Lagos Government’s responsibility to provide the operating infrastructures (corridors, terminals, shelters) in good condition while each operator is responsible for the purchase of his own vehicles and for the profitability of their operation. Through this initiative, the road network efficiency of the Lagos metropolitan area has been significantly improved.
•InAbujaThe Transportation Secretariat of the Federal Capital Territory Administration has responsibility for imple-menting the Government’s vision of affordable trans-port for all and managing transport services across the capital. In its bid to do this, the FCT Administra-tion split the city into three operational zones. These
were later concessioned under a Public Private Part-nership initiative to three companies namely Abuja Urban Mass Transport Company Ltd, Sonic Global Re-sources and Nationwide Unity Transport Ltd.
III. Public transport operatorsPublic transport services with large buses operated in Abuja and Port Harcourt are still at an inception stage. In Lagos, the Public transport in Lagos constitutes an important share of journeys made by the popula-tion (60%) yet is still mainly provided by the informal sector.
•BusesThere had been no major fleet operating large con-ventional buses since the collapse of the Lagos State Transport Corporation in the 1980s. The failure of this state public transport company resulted in an exponential growth of the informal transport sector, mostly made up of danfos (minibuses) and molues (midibuses). Their current numbers can be estimated at about 100,000, the majority being danfos. The bus transport industry in Lagos is almost entirely owned and managed by the private sector - principally indi-viduals owning one or two second hand vehicles that they mostly hire out to drivers on a daily rental basis. Nevertheless, they tend to openly flout basic safety standards, with vehicles in severe disrepair and bad driver behaviour.
The danfo and molue industry comprises two major groups - the vehicle owners and the crews (drivers and conductors). Most drivers are affiliated to the National Road Transport Workers Union (NRTWU) and the own-ers are grouped under the Road Transport Employer’s Association of Nigeria (RTEAN) which represents their interests.
In 2008, the NRTWU signed with Lamata a franchise contract to operate on the BRT scheme and then shift-ing to formal operations with large buses on the BRT corridors with a current fleet of 220 vehicles meeting 18% of the public transport demand.
Nevertheless, it should be pointed out that as of 2005, the State Government purposing to reorganise and enhance the public transport service, decided to finish with informal low capacity units and set up a bus company (Lagbus Asset Management Ltd), as-sisting it in buses purchase using bilateral aid. The current fleet of Lagbus is of about 1,000 large con-ventional buses ensuring daily 22% of the public transport market share and also. Lagbus operates the BRT scheme.
•OkadaOkada refers to commercial motorcycles in Nigeria, where motorcycle riders carry passengers for hire. It is one of the chief modes of transport in Nigeria and by far the most common form of informal transport system in the country. The popularity and widespread acceptance of okada has rapidly risen in recent years. Unfortunately, the rise of okada has been accompa-nied by increased levels of high-risk behaviour and accidents on Nigerian roads; as a result they have come under heavy flak culminating in legislation restricting or prohibiting their operations in some Nigerian cities.

TRANS-AFRICA50
Public transport in Senegal
Senegal
Area 196,712 km2
Population 11,479,448 inhabitants
Capital Dakar
Density 58.36 inhab./km2
Growth rate of population 1.2%
Languages French
Religions Muslim: 94%, Christian: 4%, Indigenous beliefs: 2%
Political system Republic
Rate of urbanisation 42.52%
Main cities Dakar: 2.6M inhab., Thiès: 0.4M inhab., Kaolack: 0.3M inhab.
GDP per Capita (IMF 2007) 915 US$
Contribution of the economic sectors to GDP
Farming: 16.70%, Industry: 18.90%, Services: 64.40%
Rate of inflation 5.4%
Currency Franc CFA
I. BackgroundFrom colonial times until today, many companies have been created for transport management in Senegal and particularly in Dakar. Among them was the state owned bus company, CSTC, created in the late 1940s and restructured in 1971 and renamed SOTRAC (So-ciété des Transports en Commun du Cap Vert). At that time, some informal minibuses or “cars rapides” were already operating in the suburban areas alongside this formal company, which was unable to cope with the total city area demand.
However, the fares management by the State, in con-junction with its inability to provide regular financial support to SOTRAC resulted in the company finding it-self in a difficult financial situation. Unable to replace its fleet, it was declared bankrupt and was dissolved in November 1998, corresponding to a period of po-litical will to privatize bus network operations.
But the lack of well-organized transport combined with continued urbanization worsened the conditions of transport in urban areas, particularly in Dakar. It thus became urgent to define an appropriate policy to resolve transport issues in the capital. The Senega-lese State therefore started to restructure the sector, leading to the creation of a coordinating body for ur-ban transport in Dakar, the Executive Council of Urban Transport in Dakar (CETUD) in March 1997. In Decem-ber 2000, Dakar Dem Dikk, a private public transport
company, was also established taking over the assets of the former SOTRAC.
Nevertheless, after a decade, the transport modal split in Dakar is still largely dominated by walking, used by 71% of the population, ahead of public transport with a 22% share.
II. Public transport regulationPublic transport in Senegal is administered by the State through the Ministry of Infrastructures, Land and Air transports and its departments. Its main mission is to prepare and implement the policy decided by the Gov-ernment especially in the fields of infrastructures and transport. To this end, the Ministry oversees several departments and agencies including the CETUD and Dakar Dem Dikk.
CETUD is the organising and regulating transport au-thority of the Dakar urban region and in this regard responsible for the implementation of the programme for urban mobility improvement (PAMU). The pro-gramme includes five components among which are the capacity building of transport actors, the renewal of the public transport fleet, the rehabilitation and de-velopment of the city train (Petit train de banlieue) as well as road safety enhancement and air quality improvement. In the framework of the PAMU, a further EUR 100 million have been invested over the three past years.

TRANS-AFRICA
Weste
rn A
fric
a
51
Through the PAMU, CETUD launched a pioneer initia-tive to formalise the informal sector. Using its author-ity to allocate routes, CETUD developed a franchise system with 13 “GIE” (groups of economic interest) gathering the interests of the independent private operators. This innovative scheme supported by the World Bank encourages the operators to join the GIE so that through this formal identity they may benefit from the financing of their fleet renewal under pref-erential conditions. To date, about 500 vehicles have been involved in this operation, which is to be fol-lowed by a second operation involving 400 minibuses in 2009. CETUD has also provided training for own-ers, drivers and conductors.
III. Public transport operators
•DakarDemDikkDakar Dem Dikk (DDD) was created in 2001 as a lim-ited private company taking over the assets of SOTRAC. DDD started operations in 2002 with 60 large buses but with limited results as the fleet age entailed inefficient operations. Since 2004, however, through bilateral aid, new buses have been acquired resulting in total fleet today of 400 new buses serving 17 urban routes with 887 stop points in the city. DDD is considered the safest means of public transport in Dakar. DDD rates are subsi-dized by the government and overseen to maintain the level of the former SOTRAC. This subsidy covers the free transportation of specific social categories of people.
•“Carsrapides”“Cars rapides” are old small vans converted to accom-modate 22 passengers, attractively decorated but un-
comfortable. These rapid and overcrowded buses, in poor condition and challenging all safety rules, con-nect all cities in the country. In Dakar these white or blue and yellow minibuses, called “Ndiaga Ndiaye” and “cars rapides” respectively, can reach more than 25 years of age, but their replacement is now being actively encouraged.
The market is very fragmented with only two major operators, one with 400 vehicles and another with 200, out of a total fleet of about 3,000.
Their fares are fixed by government but often depend on negotiation which varies according to the time of the day or the month.
•Othertransportmodes
The only city in Senegal where taxis are metered is Dakar (and its suburbs). However, in spite of the effi-ciency of the system, taxi drivers progressively aban-doned the use of these meters for the benefit of bar-gaining. Some are “radio taxis” which can be called on request by telephone and are on the increase.
There are also small scale suburban railway services in Dakar, called “Petit Train de Banlieue”.
Sierra Leone
Area 71,740 km2
Population 6,294,774 inhabitants
Capital Freetown
Density 87.74 inhab./km2
Growth rate of population 2.28%
Languages English
Religions Muslim: 60%, Christian: 30%, traditional religions: 10%
Political system Republic
Rate of urbanisation 42.38%
Main cities Freetown: 1.4M inhab., Bo: 0.2M inhab.
GDP per Capita (IMF 2007) 290 US$
Contribution of the economic sectors to GDP
Farming: 46.38%, Industry: 24.99%, Services: 28.63%
Rate of inflation 1%
Currency Léone

TRANS-AFRICA52
Public transport in Sierra Leone
I. BackgroundSierra Leone has around 11,000km of public road net-work including around 8,000km classified as national roads and 3,000km of local networks, unclassified roads and tracks. Although the principal highways have a tarred surface, the secondary roads are poor-ly maintained and often impassable during the rainy season.
Most main roads in Freetown are paved but have potholes; unpaved side streets are generally naviga-ble. There is a major road resurfacing and repair pro-gramme ongoing in Freetown that is slowly improving the quality of roads in the city.
Local and long-distance bus services are operated by the Sierra Leone Road Transport Corporation. Buses are fast and cheap and connect all the major centres. Col-lective transport by bus or group taxi is generally er-ratic, sometimes unsafe.
II. Public transport regulationThe public transport sector is supervised by the Ministry of Transport and Aviation. The Ministry provides overall policy initiation, direction and regulation for the trans-port sector in the country. The ministry’s policy guide-lines and regulatory role covers the programmes and activities of the Sierra Leone Road Transport Authority (SLRTA). The major objective of this body is to design, develop and administer rules and regulations regarding the registration and licensing of motor vehicles.
It is also responsible for promoting road safety. As such it delivers licences and permits to operate as well as supervising inspection of vehicle roadworthiness.
III. Public transport operators
•TheSierraLeoneRoadTransportCorporationThe Sierra Leone Road Transport Corporation (SLRTC) was established as a limited liability company in 1964. The company runs inter and intra city bus passenger services in Freetown and the provincial towns. The poor state of roads coupled with mismanagement has adversely affected SLRTC’s performance. The company has benefited from donor funding particularly from the Islamic Development Bank (IDB). However, despite the assistance, its operations remain poor. The Govern-ment of Sierra Leone is exploring options for possible public private participation (PPP) in SLRTC.
Several private companies and individuals also oper-ate mini-bus/bus and coach services from Freetown to district headquarter towns.
•TaxisandminibusesThey are local taxis, 4-seater vehicles with yellow stripes which run fixed routes and which can also be hired for an hour up to several days. These local taxis tend to be old within Freetown.
Minibuses commonly called “Poda Poda” often crowded also provide transportation services within the city and surrounding towns at fixed fares.
Togo
Area 56,785 km2
Population 5,858,673 inhabitants
Capital Lomé
Density 103.17 inhab./km2
Growth rate of population 2.71%
Languages French
Religions Indigenous beliefs: 50%, Christian: 30%, Muslim: 20%
Political system Republic
Rate of urbanisation 28.53%
Main cities Lomé: 1M inhab., Sokodé: 0.2M inhab., Kara: 0.2M inhab.
GDP per Capita (IMF 2007) 387 US$
Contribution of the economic sectors to GDP
Farming: 60%, Industry: 10%, Services: 30%
Rate of inflation 3%
Currency Franc CFA

TRANS-AFRICA
Weste
rn A
fric
a
53
Public transport in Togo
I. BackgroundPublic transport in the city of Lomé, the capital of Togo, is characterized by an absence of public trans-port by conventional high-capacity buses (despite a recent initiative of Sotral which is still marginal) and almost an exclusive domination of the sector by infor-mal transport.
Yet as early as 1962, the city of Lomé had already conventional operations with high-capacity buses (50 to 80 passengers) with the State-owned RMTU (Régie Urbaine de Transport Public) which had an average fleet of about 20 vehicles; nevertheless its operation was unbalanced with fares set at a low level and in-sufficiently compensated by the State. Consequently, the company recorded successive deficits and was dissolved in 1982.
The uncontrolled urban sprawl combined with RMTU’s decline stimulated the development of the informal sector, consisting of minibus taxis until 1992. During the same period however, an increase was noted in the use of motorcycles but only privately to reach dif-ferent parts of the city.
The phenomenon of the motorcycle-taxi really ap-peared in Togo in 1992, after the great general strike that lasted 13 months and paralyzed the transport sector in Lomé at a time when the population was seeking to introduce multiparty politics to the country. Since then, these motorcycle-taxis have been widely adopted by the people of Lomé given the current pov-erty and despite all safety risks, to become today the principal means of public transport in the capital.
II. Public transport regulationResponsibility for public transport in Togo currently falls under the Presidency of the Republic.
The practice of the activity by any transporter is sub-ject to the prior deliverance of a permit from the com-petent authority.
However, the motorcycle-taxis were not authorized by the public powers at their inception stage. In 1994 a group of motorcycle-taxi drivers formed a union called USYNCTAT (Union Syndicale des Conducteurs de Taxis-motos du Togo), although the authorities banned its formation.
Nevertheless, after having fought the phenomenon for a long time because of its many negative exter-nalities, the Togolese authorities finally reconsidered their position due to the undeniable impact of these two-wheelers on society. Thus in 1996 a government decree sought recognition of this sector as a profes-sion regulated under the conditions for motorcycles. However, this decree has not been effectively imple-mented so far.
In 2002, motorcycle-taxi transport was the main topic of a regional workshop in Lomé, which gathered sev-eral transport experts from countries affected by this phenomenon: Benin, Togo and Niger.
As a result, political powers in Togo are now more fo-cused on finding the best way to formalize this sector, for example by establishing conditions for access and practice and professional standards while minimizing its adverse effects on the community.
III. Public transport operatorsPublic transport in Lomé remains the prerogative of the private sector: it consists of small cars registered as taxis as well as vans used as taxis. But at present this sector is dominated (80%) by motorcycle-taxis called “Zemidjan” or “Oléyia” numbering about 40,000 in 2002 and now close to 70,000, each carrying an average of 60 people per day. This vertiginous rise seems to be due to the arrival on the Togolese market of Chinese and Korean brands that are cheaper than the traditional Yamaha “Mate 50”.
Although this activity generates significant revenues for the State, it leads to pollution and many road ac-cidents. Drivers are undisciplined and do not respect the Highway Code. It is estimated that most of the drivers do not have a driving licence and that about 30% of road accidents occurring in Lomé involve mo-torcycle-taxis.
Despite these problems of poor safety conditions and pollution, motorcycle-taxis offer customers an un-deniable service in terms of frequency, door-to-door transportation, and all at a distance-based cost, which explains why they are so popular. Furthermore, this means of transport also became a source of employ-ment for many unemployed and young graduates without jobs, creating as it did over 70,000 jobs.

TRANS-AFRICA54
Angola
Area 1,246,700 km2
Population 12,531,357 inhabitants
Capital Luanda
Density 10.05 inhab./km2
Growth rate of population 2.136%
Languages Portuguese
Religions Christian: 90%, traditional beliefs: 10%
Political system Republic
Rate of urbanisation 53.30%
Main cities Luanda: 4.2M inhab., Cabinda: 0.4M inhab., Huambo: 0.4M inhab.
GDP per Capita (IMF 2007) 3,756 US$
Contribution of the economic sectors to GDP
Farming: 8.75%, Industry: 64.65%, Services: 26.60%
Rate of inflation 12.5%
Currency Kwanza
Public transport in Angola
I. BackgroundIn Angola, the majority of roads connecting Luanda with the provincial capitals are gradually being renewed. There used to be almost 8,000km of tarmacked roads but many infrastructures were destroyed when the con-flict broke out in 1975. Now, many roads still remain unpaved however and in poor condition. They are espe-cially impracticable during the rainy season or inacces-sible due to mines and broken bridges.
Even in the city of Luanda the roads are in poor condi-tion. As such, rebuilding infrastructure is a major objec-tive of the Angola State which invests each year several billions of euros in this task.
II. Public transport regulationThe Ministry of Transport is the government department responsible for the elaboration, execution, and oversight of transport policy in the Republic of Angola. In accord-ance with its mission, the tasks of the Ministry of Trans-port are notably to:
•Proposeandachieve theactionpolicyof thegovern-ment in the field of transport;
•Participateinactivelyindefiningtheinvestmentpolicyof the sector;
•Encourageroadsafety;
•Proposeandelaborate the legislationand the regula-tion necessary for the actual and effective operation of the transport sector;
III. Public transport operatorsThere are three types of urban public transport in Luanda:
•BusesThey link the city and the townships such as Golfo, Ben-fica, Cacuaco and Viana. The official fare per ticket is equivalent to EUR 0.30. Some buses are modern and air-conditioned; others on the contrary are very old.
•Collectivetaxisor“Gandongueiros”They are minibus vans painted in blue and white with-out any destination indicated, and which can carry up to about 12 passengers. They number several thousand in Luanda. Their routes cover the city of Luanda and its outskirts and they will stop anywhere to pick up cus-tomers or to let passengers alight.
•PrivatetaxisOnly one company, MACON, operating with 5-seater vehicles, is officially licensed. There are other unli-censed private taxis in some parts of the town such as near the international and domestic airport and ho-tels, etc., but they have no taximeter and the fare is negotiated with the customer.
The Gandongueiros and MACOM taxis have also oper-ated inter-city transport since 2002 when the freedom of movement was restored. In addition, another taxi company called Mason Company operates with white and blue 4WD taxis equipped with a meter.

TRANS-AFRICA
Sou
thern
Afr
ica
55
Botswana
Area 581,730 km2
Population 1,639,131 inhabitants
Capital Gaborone
Density 2.82 inhab./km2
Growth rate of population 0.6%
Languages Official language: English, Setswana, Kalanga, Sekgalagadi
Religions Christian: 71.6%, Badimo: 6%, other: 1.4%, not defined: 0.4%, none: 20.6%
Political system Republic with Parliament
Rate of urbanisation 51%
Main cities Gaborone: 0.3M inhab., Francistown: 0.2M inhab.
GDP per Capita (IMF 2007) 20,531 US$
Contribution of the economic sectors to GDP
Farming: 23.8%, Industry: 32%, Services: 44.2%
Rate of inflation 7.2%
Currency Pula
Public transport in Botswana
I. BackgroundBotswana is a southern African country bordering with South Africa, Namibia, Zambia and Zimbabwe. As a land-locked country, the transport sector is an important vector for the development of its economy. Botswana has rail, air and road as major modes of transport. Road transport constitutes the backbone of transport sector. Botswana has 24,455km of roads across the country that include paved, non-paved and sandy roads as well as secondary, tertiary and access roads. They connect the country’s main areas by high-ways and very good tarred roads. Other areas are be-ing developed and road-tarring projects are moving ahead at a record pace. Off main routes, the roads range from good, high-speed gravel to deep, rutted sand.
The national rate of vehicle ownership is of approxi-mately 1 vehicle for every 10 persons. In Gabarone, public transport in the form of large buses is largely non-existent. However, taxi-cars and taxi-minibus services are available but the latter are generally poor-ly maintained and not roadworthy. There are about 9000 public transport vehicles licensed as public car-riers in Gabarone.
II. Public transport regulationThe public transport sector is supervised by the Min-istry of Works and Transport responsible for all trans-
port operations in the country. Inside this ministry, the Department of road transport & safety (DRTS) is specifically involved in public transport management acting as a regulatory body in the public transport sector. The Department issues permits for public transport operation based on consultations with a Transport Advisory Board. As such, an Inspectorate is established by the Department to look into matters of roadworthiness of vehicles, adherence to scheduled routes of public transport and other issues relating to transportation in general. The Inspectorate works in cooperation with the police. The Department is man-dated to issue driver licences and is the enforcing au-thority for road transport in Botswana.
The Department, in association with transport opera-tors, decides on the new public transport routes. How-ever, operators have an option to decline the routes that they consider not profitable. This results in a situation where some routes are served by a larger number of public transport vehicles than necessary contrary to other routes that remain unused.
Operators are considered as the sole providers of their service after obtaining a permit from the Department of Road Transport and Safety. They must operate in such a way as to cover their operational costs. However, to help these operations and encourage more citizens to enter the market, the Botswana government decided to exempt the transporters from any tax on income. The

TRANS-AFRICA56
aim of this is to enable operators to ply more public transport vehicles in urban centres and empower citi-zens via small-scale entrepreneurship as a measure to contribute to the alleviation of unemployment.
III. Public transport operatorsPublic transport in urban areas in Botswana is mainly pro-vided by taxis and minibuses.
•MinibusesandmidibusesThe minibuses are popularly known as “combis” among the locals and operate in several towns according to a routing system regulated by the Government and charg-ing a uniform fare. At any point along the designated route, the minibus can be stopped to take customers or let people alight.
Long-distance passenger operations run mainly be-tween the main urban and mining centres and ma-
jor rural villages. Larger buses are used specially for these operations.
•TaxisTaxis are public transport cars carrying up to five pas-sengers at a time. They are divided into two categories: ordinary taxis and special taxis.
Ordinary taxis do not normally ply specific routes but wait until the vehicle is filled up to the requisite capacity before departure to a common destination of the passengers with a standard fixed fare. Special taxis essentially provide a single ride or door-to-door service.
Lesotho
Area 30,355 km2
Population 2,012,649 inhabitants
Capital Maseru
Density 66.30 inhab./km2
Growth rate of population -0.1%
Languages Sesotho, English, Zulu, Xhosa
Religions Christian: 80%, Indigenous beliefs: 20%
Political system Constitutional monarchy with Parliament
Rate of urbanisation 18%
Main cities Maseru: 0.5M inhab.
GDP per Capita (IMF 2007) 664 US$
Contribution of the economic sectors to GDP
Farming: 15.5%, Industry: 44%, Services: 40.5%
Rate of inflation 12%
Currency Loti
Public transport in Lesotho
I. BackgroundLesotho’s road network is constantly being expanded especially with the implementation of the Lesotho Highlands Water Project. Most Lesotho based com-panies use their trucks for internal transport. In ad-dition, road haulage firms provide related services. Lesotho’s road system is linked at many points to the South African road network thus providing excellent access to the cities and ports of RSA.
There are no railways in Lesotho. Maseru, the capital, is however linked to the South African railway system for freight.
II. Public transport regulationThe public transport sector is supervised by the Ministry of Public Works and Transport. The vision of the Ministry is to have efficient and well-developed transport and construction industries that promote investment and reduce poverty.
TRANS-AFRICA
Sou
thern
Afr
ica
57
The Department of Transport and Traffic (DTT) of the Ministry is responsible for the registration, licensing and inspection of vehicles and drivers. The vehicles and drivers are licensed and processed in Maseru as well as designated district centres. Passenger fares and other tariffs are set by the DTT and approved by the Road Transport Board (RTB). Fares are set based on the cost of operating vehicles taking into account the condition of the roads and other factors.
III. Public transport operatorsLesotho collective transport is mainly based on pri-vate operators aside conventional taxis, and a few buses.
•Buses
Buses are run by the publicly owned Lesotho Freight and Bus Services Corporation (LFBSC) which accounts for only about 0.5% of total public transport. As a so-cial responsibility to provide transport services to the people, LFBSC plies mostly on routes that are not com-mercially viable, through government subsidies.
•Taxi-minibus
The passenger transport services in the urban areas and inter-urban services are provided by privately owned mini, medium and large buses which account for over 75% of the business.
They are a quick means of transport, and convenient as they stop and pick up wherever customers want them to. There is a law against overloading, and both drivers and passengers are liable for the fine.
Minibus taxis are cheap rides because they are not necessarily comfortable or well maintained, though accidents are rare. Minibus taxis supplement bus services everywhere and ensure that customers can always find some form of collective transport on ma-jor routes, though different on minor routes off the tarred roads, where long waits can be expected.
•TaxiRegular taxis are recognisable by the yellow stripe down the side. They carry up to four passengers heading in the same direction. Their government-fixed prices are substantially more expensive than the minibuses. There is also a fleet of “special hire” taxis or ‘4+1’s’ that carry people wherever they want. Maseru however is so small that it is possible to walk to most places and at night taxis called by telephone are the only option available.
Madagascar
Area 587,041 km2
Population 20,042,551 inhabitants
Capital Antananarivo
Density 34.14 inhab./km2
Growth rate of population 3%
Languages French, Malgache
Religions Indigenous beliefs: 52%, Christian: 41%, Muslim: 7%
Political system Republic
Rate of urbanisation 27.55%
Main cities Antananarivo: 2M inhab., Toamasina: 0.3M inhab., Antsirabé: 0.2M inhab.
GDP per Capita (IMF 2007) 392 US$
Contribution of the economic sectors to GDP
Farming: 78%, Industry: 6.70%, Services: 15.30%
Rate of inflation 10%
Currency Franc of Madagascar

TRANS-AFRICA58
Public transport in Madagascar
I. BackgroundOne of the major problems hampering Madagascar’s development is the lack of a public transport system able to resolve in a sustainable and safe way the issue of the urban and interurban mobility of its citizens.
II. Public transport regulationPublic transport in Madagascar is regulated and over-seen by the Ministry of Transport and Tourism. As-pects related to land transport have been recently placed under the responsibility of the Agency of the Land Transport (ATT).
The ATT or “Agence des Transports Terrestres” was cre-ated in 2005 responsible for economic regulation of land transport by road, and the implementation of the Gov-ernment’s policy and strategy in the road safety area.
It is also in charge of the issuing of licences for drivers as well as for vehicles, the management of technical inspection of road vehicles and the implementation of preventive actions. The agency is also committed to improving relations between operators, users and government, and managing unsolved conflicts by is-suing related specification books where necessary.
The road enforcement is under the responsibility of National Security.
III. Public transport operatorsThere are several types of public transport services in Madagascar:
•Taxisor“taxi-be”Taxi-be are minibus-type public transportation vehi-cles, which connect one district of the city to another. Taxis are abundant in most of the major cities and are generally old models such as “Renault 4” or “2CV”. They are never metered and charge a fixed price which increases during the night.
•RickshawThey are non-motorized carts towed by men. Imported from Asia, they are particularly popular in Madagas-car. They abound in Antsirabe but also in Tamatave, Tuléar and Majunga. Each of them can carry up to two passengers. The prices are not controlled and vary ac-cording to the distance.
•Bush-taxisOf all the modes of transportation on the island, the bush-taxi is the most typical, the cheapest and thus, the most popular. It is the only real means of transport for the majority of the Malagasies. Always crowded, the bush-taxis connect cities. All sorts of vehicles are used such as 504 breaks of 9 seats, and minibuses (Mazda or Nissan of 18 places) or even Tata buses - bigger but slower to fill.
Malawi
Area 118,484 km2
Population 13,603,181 inhabitants
Capital Lilongwe
Density 114.81 inhab./km2
Growth rate of population 2.2%
Languages Official languages: English, Chichewa; Chinyanja, Chiyao, Chitumbuka
Religions Christian: 79.9%, Muslim: 12.8%, other: 3%, no religion: 4.3%
Political system Multi party democracy
Rate of urbanisation 15.10%
Main cities Blantyre: 0.7M inhab., Lilongwe: 0.7M inhab., Mzuzu: 0.1M inhab.
GDP per Capita (IMF 2007) 266 US$
Contribution of the economic sectors to GDP
Farming: 47.1%, Industry: 35.5%, Services: 17.5%
Rate of inflation 8%
Currency Kwacha

TRANS-AFRICA
Sou
thern
Afr
ica
59
Public transport in Malawi
I. BackgroundMalawi has a population of about 12 million people with about 25% living in urban areas. As a landlocked country, the efficiency and effectiveness of the trans-port links in Malawi are important for promoting eco-nomic activity and the welfare of the population, since a large number of urban area dwellers rely on collec-tive transport to go about their daily business.
Prior to the liberalization and deregulation that took place in the 1980s and 1990s, the public transport sec-tor was dominated by a public enterprise named Shire Bus Lines that was recently dissolved. The sector was complemented at the time by some minibus opera-tors. The challenge was the short supply of transport. Since the 1990s the transport business in general and public transport in particular was deregulated, and transport policies have been modified to permit mar-ket-determined decisions, enterprise autonomy, and private participation in the ownership and manage-ment of transport businesses. As a result, the number of private operators increased exponentially with the influx of many minibuses in the mid-1990s, which provided relief access to public transport.
II. Public transport regulationThe responsibility for public transport management lies with the Ministry of Transport and Public Works through the Road Traffic Directorate (RTD). The RTD is charged with administering regulatory provisions relating to motor vehicle administration, driver licens-ing administration, operator authorization and con-trol of permits.
Since 2000 the Malawian State has undertaken reforms to liberalize the public transport sector, but it was the National Transport Policy which fully deregulated the market in 2004 by removing any restrictions on entry and exit to the collective passenger transport sector while giving the sector the freedom to set its own tariffs. The situation therefore evolved from one of government-controlled prices before 2000 into a free market in which prices are determined by the indus-try itself, with the government only being informed about prices just prior to implementation.
Operators are just required to be registered with the Road Traffic Directorate (RTD) and obtain the necessary licences and permits to operate, such as road service per-mits and certificates of roadworthiness.
However, the RTD remains the enforcing body for mat-ters linked to safety and permit requirements and also the jointly regulated allocation of minibus routes with the Minibus Owner’s Association of Malawi (MOAM).
In this deregulated context, the government created the Competition and Fair Trading Commission to pre-vent collateral effects such as the formation of cartels and anti-competitive practices. Formally established in February 2005, the commission’s main objective is to encourage fair competition notably in the public transport sector and regulating monopolies in the in-terests of passenger welfare.
More recently, in order to boost the sector and en-hance its organisation and structure, the government removed the VAT and import duties for new buses of over 45 seats.
Companies operating large buses (over 45 seats) are free to operate on any route of their choice and fare set-ting is fully liberalised. There is free market entry and exit with the only potential barrier being the high cost of purchasing new buses. This reason may explain why there is no bus company with a significantly large fleet in the urban area.
III. Public transport operatorsThe sector is dominated by minibuses in spite of a sig-nificant fleet of large buses throughout the country.
•BusesIn the road passenger transport services, until re-cently the dominant player was the state-owned Shire Bus Lines which went into voluntary liquidation after the Malawian government announced in 2006 that its loans could not be redeemed. Its dissolution was of-ficially pronounced on April 2008. Some of the former managers of the Shire Bus Line however took over the assets of the company in a private initiative attempt-ing to maintain operation of these conventional large buses in Malawi.
In the domestic luxury coach bus service segment of the market, the main company is Axa Coach Services which is expanding its fleet and routes relatively rap-idly, taking advantage of the recent removal of duties for buses carrying more than 45 passengers and the dis-appearance of Shire Bus Lines. In this sub-sector there is no route allocation system and no trade association in place.
A number of bus companies also operate international services from Malawi to neighbouring countries.
•MinibusesMinibus operations are fully liberalised and the sector is very competitive and in some cases saturated. It is esti-mated that the total number of minibuses in the country stands at around 3,500. Minibuses and midibuses ac-count for 47% of the market share.
•TaxisThe number of registered taxis in Malawi is currently unknown but estimates put the figure at 1,500. An at-tempt to use meters failed some years ago notably due to the low income level of the population and the current fare system that works on a zonal basis. The registered taxi sub-sector is fairly competitive and is dominated by indigenous Malawian operators often with 2-3 vehicles.
•MatolasThey are pick-up trucks used as public transport means. Usually overloaded and unsafe, they connect up the main urban centres of the country. As they are quite affordable (two to three times cheaper than a minibus) they meet a significant demand of the population, en-suring 24% of national passenger transport.

TRANS-AFRICA60
Mauritius
Area 2,040 km2
Population 1,274,189 inhabitants
Capital Port-Louis
Density 624.60 inhab./km2
Growth rate of population 0.800%
Languages Official language: English; French Creole
Religions Hindu: 49%, Christian: 32%, Muslim: 17%, other
Political system Parliamentary Republic
Rate of urbanisation 42.40%
Main cities Port-Louis: 0.7M inhab., Triolet: 0.2M inhab., Mahébourg: 0.2M inhab.
GDP per Capita (IMF 2007) 5,496 US$
Contribution of the economic sectors to GDP
Farming: 6.09%, Industry: 28.19%, Services: 65.72%
Rate of inflation 9.1%
Currency Mauritian Roupie
Public transport in Mauritius
I. BackgroundRoad transport in Mauritius has gone through a re-markable phase of improvement resulting in the con-struction of new motorways and improvement of ex-isting roads. In Mauritius, road is the sole means for the transport of passengers and goods. The road net-work has reached approximately 1,900km with 90% paved.
In the wake of the country’s prosperity, some transport problems appeared such as the severe congestion af-flicting all traffic entering and leaving Port Louis, the capital, during peak hours. This problem has become more acute in the last five years as more people have acquired cars and started to use them to commute to work. Between 2000 and 2004, there was a 41% increase of private cars in circulation. If the current trend continues, Mauritius will face even greater traf-fic and pollution problems.
Mauritius has an extensive bus network service, which constitutes the main means of public transport. The bus network in Mauritius spreads throughout the coun-try. More than one third of the total bus service in the country is provided by the National Transport Corpo-ration. Road transport in Mauritius has improved tre-mendously and more improved modern types of buses have come up with better capacity, comfort, speed and reliability.
II. Public transport regulationThe public transport sector is supervised by the Min-istry of Public Infrastructure, Land Transport & Ship-ping. To ensure the provision of quality land transport services, the Ministry acts through the National Trans-port Authority (NTA).
NTA is the regulatory body set up in 1980 in order to implement government policies and decisions relating to road transport. It has to ensure that a satisfactory level of transport is provided for both passengers and goods in order to sustain the social and economic ac-tivities of the country. In addition, it makes proposals to the parent Ministry on legislation governing vehicle licensing and operation.
Accordingly, it is responsible for the definition and enforcement of regulations for public transport opera-tions, comprising the setting of fares and timetables and the registration and licensing of the vehicles. It also follows up the payment of the free transport sub-sidy to the operators. In 2005 free bus transportation was granted to all pensioners (i.e. all those over 60) and students. While pensioners can use all buses for free, to travel anywhere, students enjoy free trans-portation only between their places of residence and their schools. In the case of students, the subsidies are paid to bus owners, who receive a fixed amount per day, per bus, irrespective of the number of stu-dents they actually transport.

TRANS-AFRICA
Sou
thern
Afr
ica
61
III. Public transport operators
•BusesThe most common means of transport for the Mauri-tian people is the bus. Bus is a realtively easy means of transport in the island, not particularly comfortable but very cheap. The main public transport company is the National Transport Corporation (NTC).
•TheNationalTransportCorporation(NTC)The National Transport Corporation (NTC), a par-astatal company, was set up in the early 1980s to operate public transport services in the island. From modest beginnings, after taking over the assets of ex-Vacoas Transport Co. Ltd, NTC has grown into a major transport institution. It accounts for 40% of the public transport market share with a fleet of 520 buses with an average age of 15 years.
•OtherbuscompaniesNumerous other bus services ply the City of Port Louis. The main formal bus companies are United Bus Service (UBS), Mauritian Bus Transport (MTB), Triolet Bus Service (TBS) and Rose Hill Transport Ltd.
All of them began operation prior to 1975. The total fleet of these formal transport companies stands at 500 vehicles.
•TaxisThe second means of public transport in Mauritius is the taxi, which is more comfortable and which pro-vides a service to almost all locations throughout the island. Their numbers stand at around 800 vehicles.
Mauritian taxi drivers do not usually use the taxi meter even though most of their cars are fitted with one.
IV. Public transport projectsOver the years, the government has contemplated the introduction of a light rail transit system from the cen-tre of the island, through the main towns down to Port Louis. However, the light rail transit system has not materialized because of the high level of investment required and uncertainty about the financial viability of the project. Other alternatives are dedicated bus routes into Port Louis and a ring road around Port Lou-is so that north and southbound roads do not have to go through the capital. Numerous studies have been produced on the road traffic situation in and around Port Louis but not yet implemented.
Mozambique
Area 799,380 km2
Population 20,905,585 inhabitants
Capital Maputo
Density 26.15 inhab./km2
Growth rate of population 1.8%
Languages Official language: Portuguese; Emakhuwa, Xichangana, Elomwe
Religions Catholic: 23.8%, Muslim: 17.8%, Christian sionist: 17.5%, other: 17.8%, no religion: 23.1
Political system Republic
Rate of urbanisation 36%
Main cities Maputo: 1.7M inhab., Beira: 0.4M inhab., Nampula: 0.3M inhab.
GDP per Capita (IMF 2007) 397 US$
Contribution of the economic sectors to GDP
Farming: 21.2%, Industry: 30.6%, Services: 48.2%
Rate of inflation 8%
Currency Metical

TRANS-AFRICA62
Public transport in Mozambique
I. BackgroundThe city of Maputo in Mozambique has more than one million inhabitants. Most have a low income, live on the outskirts of the city and are largely dependent on bus transport for their daily activities.
The public passenger transport market in the region of Maputo is 80% dominated by the informal sector; mainly 15-seater minibuses operating in a seemingly ‘chaotic’ environment. The business is a wholly pri-vate one, supplied by owner-operators or by small firms that receive no government subsidy, credit, or other grants.
Other means of transport include one government company - TPM - which operates about 70 large bus-es, a number which is set to rise.
Discussions are taking place regarding the possible replacement of the small unit buses with large capac-ity buses better suited to a modern urban environ-ment. But considering the financial resources of the economy of Mozambique and the public budget, the current service has been maintained until now as it provides services at an affordable fare for the major-ity of the population.
II. Public transport regulationPublic transport is supervised by the Ministry of Trans-port and Communications.
The licensing of urban road transport services is de-volved to the municipalities.
Therefore, any public transport company which in-tends to operate in the capital needs a licence from the Directorate of Transport and Traffic of the City of Maputo. Fares are controlled by the Government but subject to approval by the city councils.
In 1989, the public transport system was liberalized leading to a significant growth in the supply of pri-vate vehicles, which entailed fierce competition on the streets. Thus, investments in vehicles became un-sustainable due to an excess of the available fleet.
Enforcement of rules and regulations is the responsi-bility of the National Traffic Police and the Municipal Polices. However, there is a partnership between the public and private stakeholders of the system in order to maintain control over the activity.
With the rise of fuel prices on the international mar-ket, the Government introduced subsidies for private operators in urban centres in February 2008. It also adopted a medium and long term strategy to relieve congestion in urban centers by allowing access to large buses only, with minibuses serving the outskirts. Besides, the Government is in the process of gradual-ly replacing the 15-seater vehicles widely used today with 25-seater minibuses; however the results are still imperceptible due to the lack of public funds.
III. Public transport operators
•BusesLarge buses are operated by the Maputo Public Trans-port Company (TPM), the state-owned public trans-port company for the Maputo area. The company has the monopoly on passenger transportation within the city of Maputo, except for a few routes. Initially, the TPM network covered a total length of 562km with more than 30 routes, but due to the lack of funds to purchase spare parts and the extremely bad road con-ditions that engendered high operational costs, the fleet progressively dwindled and area covered by TPM has been reduced by 328km, leaving 27 former bus lines to the informal sector.
Nevertheless, with the help of the State, some new buses were purchased in 2008, swelling the fleet to 89 buses with a forecast 80 additional new buses be-fore the end of the year. The market share of TPM is estimated to stand at 18-20%.
•Minibusesor“chapas”The development of the informal sector has been caused by the inability of TPM to satisfy the mobil-ity needs of citizens. The number of registered mini-buses increased from 100 in 1994 to 1,000 in 2000 and there are currently an estimated 3,000 or so ve-hicles in Maputo catering for around 80% of the trans-port need. ‘Chapas’ are 15-seater minibuses, largely consisting of used imports from Japan (Toyota Hiace). They operate on the same route as the TPM buses but are also able to penetrate the suburban areas with their smaller vehicles compared to the buses and coaches of TPM.
They operate from two major bus terminals in the city: one at Baixa (“downtown”), and another one at Museu (“the Museum”). Their stops are indicated by panels along the roadside and their destinations by coloured banners on vehicles. Chapas are generally used to cover short distances. They always wait to be full before departure even if it means driving at high speeds to make up for the delay.
•IntercityandurbanbusesSeveral private companies assure long distance con-nections. The most well-known, or ‘historical’ compa-ny is Oliveira. Its buses are old and hardly luxurious, but are the typr of choice of most Mozambicans.
•‘Laranjinhas’ortaxis-scootersThere are several ‘Laranjinhas’ in the city of Mapu-to. They are taxi-scooters or red and yellow bubble-shaped ‘tuk-tuks’.
•TaxisRelatively expensive in Maputo, taxis are mostly used for travel at night-time or to reach areas not closely served by “chapas”. Most taxis are unmetered.
TRANS-AFRICA
Sou
thern
Afr
ica
63
Namibia
Area 825,418 km2
Population 2,108,665 inhabitants
Capital Windhoek
Density 2.55 inhab./km2
Growth rate of population 0.950%
Languages Official language: English; Afrikaans, German, Oshivambo, Herero, Nama
Religions Christian: 80-90%, Indigenous beliefs: 10-20%
Political system Republic
Rate of urbanisation 36.00%
Main cities Windhoek: 0.4M inhab., Rundu: 0.1M inhab. Walvis Bay: 0.1M inhab.
GDP per Capita (IMF 2007) 3,671 US$
Contribution of the economic sectors to GDP
Farming: 26.10%, Industry: 12.20%, Services: 61.70%
Rate of inflation 6.7%
Currency Namibian Dollar
Public transport in Namibia
I. BackgroundNamibia has a good road infrastructure, both of tarred highways and graded dirt. There are 64,799km of road, of which 7,841km is tarred. Despite the long distances in Namibia, most people get around by land, and not air. Roads are generally well-maintained.
II. Public transport regulationThe public transport sector is supervised by the Min-istry of Works, Transport and Communication.
The Ministry of Works, Transport and Communication is dedicated to ensuring the availability and quality of transport infrastructure and specialized services to the satisfaction of the customer and the Government. The Ministry intends to commercialise some services on a self-sustaining basis and the core ministry will re-main responsible for the regulatory aspects only. The purpose of the current restructuring of the Ministry is to provide, maintain and administer government infra-structure in respect of transport.
The Department of Transport within the Ministry is re-sponsible notably for public transport regulation. As such, it issues the operating permits.
III. Public transport operatorsDifferent kinds of public transport services are pro-vided in Namibia:
•Buses
Public transport in Windhoek exists in the form of large conventional buses run by the City of Windhoek. The fleet currently stands at 60 buses.
•Taxis
There is also a system of shared taxis. These taxis primarily run between the townships and the main industrial/commercial areas of the city. Taxis are es-timated to stand at around 15,000 units which cater for around 75% of Windhoek daily collective transport trips. Routes are not fixed like in some other coun-tries and this gives some added flexibility but also means that fares between given destinations may not always be the same. Passengers may embark or alight at any point along the route.
•Combi
This is the easiest way to get to Windhoek by public transport as combis run from everywhere in Namibia, and through a combination of the different given routes, Windhoek is connected to most of the areas of the country.

TRANS-AFRICA64
South Africa
Area 1,219,090 km2
Population 48,687,055 inhabitants
Capital Pretoria, Cape Town, Bloemfontein
Density 39.94 inhab./km2
Growth rate of population 0.820%
Languages Afrikaans, English
Religions Not reported
Political system Republic
Rate of urbanisation 60.26%
Main cities Gauteng: 12.1M inhab., Cape Town: 4.8M inhab., Durban: 3.4M inhab., Port-Elizabeth: 1.4M inhab.
GDP per Capita (IMF 2007) 5,916 US$
Contribution of the economic sectors to GDP
Farming: 8.60%, Industry: 23.40%, Services: 68%
Rate of inflation 6%
Currency Rand
Public transport in South Africa
I. BackgroundThe Republic of South Africa has nine provinces and 284 municipalities including the six major cities in South Africa, namely, Johannesburg, Cape Town, eThekwini, Tshwane, Ekurhuleni and Nelson Mandela Bay. Before the 1990s, due to the apartheid regime, legislation was race based, including public transport legislation as well as planning and development. Across the country, buses were used by the Government as a preferred mode of road transport. In the urban areas, especially the cities, “premium service” bus services catered for the needs of the white population. Buses were also subsidised to provide transport services to the black population, for commuting purposes. About 60 bus companies pres-ently receive subsidies from the national department of transport.
Following their deregulation in the late 1980s the mini-bus taxis (around 14 seats) originally a survivalist busi-ness in the black communities, grew substantially to an extent that its market share surpassed that of buses and trains.
The minibus taxi fleet is estimated at over 120,000 ve-hicles country wide. Despite its growth, there have been numerous complaints about the safety of the mode from the general public. Overall, about 400-500 minibus tax-is are involved in fatal road accidents annually in South Africa.
Almost two decades after the fall of the apartheid re-gime, its legacy still remains a hurdle to overcome,
manifesting itself in the following illustrative exam-ples: the management of the issuing of public trans-port operating licences remains a thorny issue and a source of much of the conflict in the public transport industry, leading to violence in the minibus taxi indus-try, especially along lucrative routes and public trans-port is still seen as service for the poor, and mainly black people.
II. Public transport regulationThe national department of transport, through the minister of transport, is responsible for setting policy framework and monitoring of the transport policy. The provinces are similar in many respects to the national department of transport in that they set guidance on the planning and management of transport in the prov-inces. In addition to the planning functions, the prov-inces have budgets (received mainly from the national government) to spend on public transport subsidies and provincial roads.
Historically provinces have not been able to design and implement budgets for public transport infrastructure and operations, which has been the responsibility of local government. Local governments, through the statutory integrated transport plans, and in consulta-tion with communities, are supposed to identify short to long term transport interventions and budget for these accordingly. Legally, therefore, no interventions can be made in local government unless it has been identified and budgeted for in the integrated transport

TRANS-AFRICA
Sou
thern
Afr
ica
65
plans. The integrated transport plans are formulated for a five-year period and revised annually. After the five year period, the integrated transport plans receive major updates.
The responsibilities throughout South Africa are as follows:
•Nationalgovernment:setsbroadpublictransportpoli-cies. Provides budget for subsidised bus services and channels these through provinces. Also provides budg-et short-fall for commuter rail services.
•Provincial government: sets broad province specificpolicies and direction. Provides assistance to local gov-ernment unable to deliver on the transport legislative mandate, especially in the largely rural provinces. Re-sponsible for contracting and paying subsidised bus operators.
•Localgovernment(includingCities):throughtheinte-grated transport plans local government is responsible for the operations of public transport and held directly accountable by the communities.
III. Public transport operatorsIn general, the minibus taxi sector (or kombi taxi sector as it is locally known) dominating the “informal” public transport system in South Africa has grown enormously in the past twenty years ensuring 67.9% of the collective transport market share. Minibus taxis are the only form of public transport that penetrates every last sector in cities, including the poorest shack settlements. It is the cheapest form of transport and the daily lifeline of the bulk of the working population.
The bus sector, which is largely in private hands, has a 19% share of the passenger transport market. They are gathered under the South African Bus Operators Associa-tion (SABOA) which registers a total membership of more than 20,000 buses spread around the country. Some me-tered taxis exist but provide a marginal share of the pub-lic transport.
Each province in South Africa has quite extended collec-tive transport:
•GautengProvince:Homeofthreecitiesi.e.Johannes-burg, Tshwane and Ekurhuleni. There are many bus operators and the largest include PUTCO, Johannes-burg owned Metrobus, Tshwane owned Pretoria Bus Service.
- Putco bus services: The company was established in 1945. It has over 1,600 buses, 550 of which have rear engines and the rest front engines. The fleet has been recently recapitalised in line with the requirements of new legalisation. The company operates mainly in the Province of Gauteng and the provinces neighbouring Gauteng but with one trip end in Gauteng. The fleet contains standard and articulated buses.
- The City of Johannesburg Metrobus service (a city owned bus company) has over 530 buses covering 80 routes mainly in the historically white areas (de-mographics have changed). The services have recent-ly been extended to the traditionally black township of Soweto, but this created some disputes with Putco. The fleet comprises both standard and double decker buses.
- The City of Tshwane has a fleet of over 300 buses, largely old but refurbished, and operates in histori-
cally white areas (demographics have changed). The process of creating a separate company for the bus service (outside the core City government) has been prolonged. The fleet comprises both standard and double decker buses.
- Over 35,000 minibus taxis (the number could be higher due to non-registered minibus taxis).
•WesternCapeProvince:HomeoftheCityofCapeTown.Golden arrow bus service is the main operator in the City of Cape Town. Some of its operations have been subcontracted to smaller companies. It has a fleet of over 900 buses. Over 16,000 minibus taxis.
•Kwazulu-NataProvince:HomeofeThekwini (Durban).Bus operations in the City of eThekwini were privatized in 2003 and Remant Alton bus services took over the operation. The bus service has about 560 buses and also operates 70 midibuses (25-35 seaters). About 16,000 minibus taxis.
•LimpopoProvince:Alargelyruralprovince.GreatNorthTransport is the largest bus company operating in ur-ban and rural parts of the province. It is owned by a state owned company with a fleet of about 520 buses. Over 6,500 minibus taxis.
•NorthWestProvince:Alargelyruralprovince.Mainbusoperators include Northwest Star, Botlhaba and Batswa-na Gare and Bojanala whose operations are facilitated by the government owned North West Transport Invest-ment (Pty) Ltd. In the early 2000s the North West Prov-ince accelerated a drive to implement a Broad Based Economic Empowerment policy, leading to the estab-lishment of the Atamelang bus services. About 13,000 minibus taxis.
•Eastern Cape Province: Home of the Nelson MandelaBay City, but a largely rural province. Algoa bus serv-ice operates in the city with about 330 buses. The bus company has subcontracted some of its services to some smaller operators. There are about 10 minibus taxi associations in the Nelson Mandela Bay City. About 4,000 minibus taxis.
•FreeStateProvince:Alargelyruralprovince.Themainbus services provided by Interstate Bus Line and Maluti Bus service. Approximately 12,000 minibus taxi opera-tors and 92 registered minibus taxi associations. About 7,000 minibus taxis.
•Mpumalanga Province: A largely rural province. Theprovince reports 9 subsidised bus contracts with un-disclosed fleet sizes. Over 8,000 minibus taxis.
•Northern Cape Province: Spacious province but leastpopulated with desert like conditions. Not much infor-mation obtained from the province in terms of bus op-erations. About 1,000 minibus taxis.
IV. Public transport projectsThere are many public transport projects underway in South Africa mainly in the build up to the FIFA World Cup in 2010. Below only three are outlined:
•GautrainThe project of the Provincial Government of the Gauteng, the Gautrain, is designed to relieve the traffic on the N1 freeway between Johannesburg and Pretoria, which reg-isters daily traffic of 160,000 vehicles. The construction of this fast rail link began in October, 2006 and will be

TRANS-AFRICA66
finished before 2010, for the FIFA World Cup. It will con-nect Johannesburg in Pretoria and Sandton and the Inter-national Airport of Johannesburg. It will contain a certain number of underground subway stations, as well as air stations. It will be the first new railroad system built in South Africa since 1977.
•NationalTransportMasterPlanNATMAP2050The South African Government gave a directive to the Department of Transport to prepare an integrated trans-port infrastructure plan that will develop and establish a multimodal transportation system to meet South Af-rica’s transport needs as far into the future as 2050. The project started in January 2007 and is expected to be completed by March 2009.
The NATMAP 2050 undertakes to improve the efficiency and effectiveness of multi-modal transportation systems while addressing the issues such as uncoordinated op-erations and regulations between the various agencies.
•ITSIntelligent Transport System (ITS) - a five-year pilot project is being implemented since 2006 on the Ben Schoeman high-way - to improve road safety and reduce traffic congestion.
Besides, the implementation of bus rapid public trans-port networks and operation are ongoing in the City of Johannesburg, Tshwane, Cape Town, Nelson Mandela Bay and eThekwini and the following large towns: Buffalo city, Mangaung, Mbombela and Polokwane.
Swaziland
Area 17,365 km2
Population 1,128,814 inhabitants
Capital Mbabane
Density 65.00 inhab./km2
Growth rate of population -0.410%
Languages Official languages: English, swazi
Religions Sionist: 40%, Roman Catholic: 20%, Muslim: 10%, Anglican, Bahai, Methodist, Mormon, Judaism and other: 30%
Political system Parliamentary Monarchy
Rate of urbanisation 24.10%
Main cities Manzini: 0.1M inhab., Mbabane: 0.08M inhab.
GDP per Capita (IMF 2007) 2,838 US$
Contribution of the economic sectors to GDP
Farming: 11.53%, Industry: 47.60%, Services: 40.87%
Rate of inflation 6%
Currency Lilangeni
Public transport in Swaziland
I. BackgroundIn Swaziland, the transport system constitutes a vital link and service provider in the national economy. It is notably made up of about 3,108km of roads and 298km of railway.
The overall national transport policy and vision in Swa-ziland is to establish a transport system that provides a safe, efficient, cost-effective and fully integrated in-frastructure and operations to best meet the needs of customers, which promotes economic and social de-velopment and is environmentally and economically sustainable. The rate of car ownership in Swaziland
- rising at an average of 5% per annum - is still low at 32 per 1,000 of the population. The majority of the people in the country use public transport.
II. Public transport regulationThe public transport sector is regulated by the Road Transportation Board under the authority of the Ministry of Public Works and Transport which is responsible for the planning and Regulation of Road Transport Services. Road Transportation Board has the responsibility to reg-ister all public transport operators and to issue the per-mits to authorize their activities. The permits issued to serve specific routes must be renewed annually.

TRANS-AFRICA
Sou
thern
Afr
ica
67
Since 1997, minibuses have been officially recognised as a means of public transport. Nevertheless, there is no subsidy paid by the government or the municipali-ties to any operators. Buses are regularly checked by a government vehicle examiner and could be removed from service if defective parts are found, until these are repaired.
III. Public transport operatorsAs already mentioned, public transport constitutes the main form of transportation for the bulk of the population.
•Busesandminibuses
The bus is the principal means of transport. Bus size varies from the conventional large bus of 30-70 seats, used mainly for long-distance and inter-urban transport, to medium size (or midibuses) of 16-30 seats typically used in intra-urban transport, to 10-15 seater minibuses. About 7,000 buses, including
minibuses, entirely run by private operators, operate in the country and this is the main form of transport for the majority of Swazis. Like other similar modes in Africa, they are vehicles that accumulate as many travellers as possible while making their way in a general direction. Minibuses can usually be flagged down along main roads. Larger towns usually serve as minibus hubs or connections. In the absence of any subsidy, the operators are fully responsible for maintaining their vehicles in a roadworthy and safe condition.
Some buses also run intercity transport; they are usu-ally overcrowded due to the low fare level and farily infrequent.
•TaxisA taxi service operates in Mbabane and Manzini. Some minimal fares are set but they can vary according to a case by case basis. There are also non-shared (private hire) taxis in some of the larger towns.
Zambia
Area 752,612 km2
Population 11,669,534 inhabitants
Capital Lusaka
Density 15.51 inhab./km2
Growth rate of population 1.7%
Languages Official language: English; Bemba, Kaonda, Lozi, Lunda, Luvale, Nyanja, Tonga
Religions Christian: 50-75%, Muslim and Hindu: 24-49%, Indigenous beliefs: 1%
Political system Republic
Rate of urbanisation 39.80%
Main cities Lusaka: 2.7M inhab., Kitwe: 1.1M inhab., Ndola: 0.9M inhab.
GDP per Capita (IMF 2007) 939 US$
Contribution of the economic sectors to GDP
Farming: 49.1%, Industry: 28.3%, Services: 22.6%
Rate of inflation 10.5%
Currency Kwacha
Public transport in Zambia
I. BackgroundZambia has a total road length of 38,763km of tarred roads; 8,592km of gravel roads and 21,999km of dirt roads.
The road network has been significantly improved over the last ten years and most major routes are of reasonable qual-
ity. The Government of Zambia has prioritised the rehabili-tation of the road network and this process is ongoing.
Formal public transport is largely non-existent in small towns and areas outside of the large urban areas in Lu-saka, Livingstone and the Copperbelt where it exists in the form of taxi and mini-taxi services.

TRANS-AFRICA68
Zimbabwe
Area 390,757 km2
Population 12,382,920 inhabitants
Capital Harare
Density 31.69 inhab./km2
Growth rate of population 0.568%
Languages Official language: English; Shona, Sindebele
Religions Syncretic: 50%, Christian: 25%, Indigenous beliefs: 24%, Muslim and other: 1%
Political system Parliamentary democracy
Rate of urbanisation 35.90%
Main cities Harare: 3M inhab., Bulawayo: 0.8M inhab., Mutare: 0.2M inhab.
GDP per Capita (IMF 2007) 403 US$
Contribution of the economic sectors to GDP
Farming: 18,09%, Industry: 22.62%, Services: 59.29%
Rate of inflation 2,200,000%
Currency Zimbabwean dollar
A luxury inter-city coach service connects Lusaka with Harare in Zimbabwe and Johannesburg in South Africa.
II. Public transport regulationThe Department of Road Transport within the Ministry of Communications and Transport departments is re-sponsible for the regulation and management of road traffic as well as for the implementation of roads in line with the core functions of the Ministry related to public transport. It is in charge of registration, licensing and certification of Zambian registered vehicles and drivers and the enforcement of Road Traffic laws and regula-tions in particular.
Following the deregulation of the road transport industry, a number of service providers have entered the market. To ensure that the quality of the service being provided meets the expectations of users, there is need for an ef-fective regulatory regime to be provided by the Depart-ment of Road Transport.
III. Public transport operatorsPublic transport in the city of Lusaka consists of buses and taxis.
•BusandminibusoperationsThe bus service includes both city and intercity buses.
Large buses are operated by private companies from the bus terminal in Lusaka City and provide intercity bus service, and minibuses are operated as city buses. These minibuses do not follow a timetable, but instead are operated according to demand. Therefore, service does not start until the vehicle is full. As such, the larger buses wait longer before departure and then go slower
and stop at more places. For the faster minibuses, the fare is about 20% higher than the standard bus fare.
Another kind of bus is the ‘postbus’ which operate be-tween the post offices in the main towns trying to com-ply with a more fixed schedule on a specific round trip, taking both mailbags and passengers as they go.
Thirdly, the luxury coaches are private long-distance buses services that connect Lusaka to all district/provin-cial capitals and even Harare and Johannesburg. They are owned by private operators, well maintained and com-fortable, running a fairly punctual service. They operate mostly out of bus stations and they may be found on some main roads of Lusaka.
•TaxisTaxis are 5-seater cars, very common in Lusaka and some other main towns with no holographic meters and which can be hailed down in the street. Though they all have typed sheets stating the ‘minimum’ rates to and from various local places, the rate is very often agreed accord-ing to the mileage to be covered or the hire time. Official taxis are registered by the Government and are painted light blue with a registration number along the side.
•PostboatsRather like the postbuses, postboats operate on the Up-per Zambezi and the waters of Lake Bangweulu during the rainy season, transporting passengers as well as car-go, and even vehicles.

TRANS-AFRICA
Sou
thern
Afr
ica
69
Public transport in Zimbabwe
I. BackgroundOver the last few years the Zimbabwean economy has been characterized by high inflation and a significant drop in value of the Zimbabwean dollar. Clearly, this economic reality had an adverse effect on the provi-sion of public transport. The current transport modal split in urban areas of Zimbabwe is led by walking with public transport in second position, character-ized by excessive waiting times because of the inad-equacy of offer to the demand. This situation is even more acute in Harare the capital.
Before the independence of Zimbabwe in 1980, public transport services were operated by United Transport Group (UTG), a formal private company, in the urban areas of Zimbabwe under a franchise agreement with the local authority which gave UTG the monopoly on-operation within a specified franchise area.
After independence, the State removed the subsidy to UTG and legalized the informal sector. Since then though, UTG will now be nationalized becoming ZUP-CO and receive some government support in the form of new buses, the company will enter a period of de-cline, supplanted by the informal sector especially the commuter buses.
Nevertheless, the political and economical environ-ment will rapidly have a decisive impact on all public transport operators, whether formal or informal, in terms of difficulty to maintain and replace their fleet essentially due to the low level of fares in comparison to costs, in line with the acute inflation. This resulted in a shortage of service offer that compelled people to walk for long distances and travel in all sorts of ve-hicles including lorries and pick ups, a practice which compromises their safety.
II. Public transport regulationPublic transport management in Harare is under the responsibility of the Ministry of Transport and Com-munications which issues permits to operators ac-cording to their own choice of routes on the condition that they present a roadworthy vehicle.
The fares are fixed and controlled by the Ministry of transport and no longer the local community as before independence. The current fare levels are considered low given the real costs, although the people strive to afford them. Yet, the low current level of fares does not permit the operator to renew his fleet.
In Zimbabwe, the authorities as well as the operators are committed to the liberalization and self-regulation of the transport market, which should lead to greater dynamism of the sector.
With independence obtained, the State legalized ‘emer-gency taxis’ in 1982; 7-seater collective taxis, and then the ‘commuter buses’ (7 to 25 seats) in 1993. These measures were applied as ZUPCO was unable to meet the demand but they actually implied deregulation of the transport system.
The Zimbabwean State implicitly recognizes the need for a gradually shift to larger buses by its clear recent policy to refurbish the ZUPCO fleet and the passing of a new law exempting all large buses from the pay-ment of import duties.
III. Public transport operators
•The Zimbabwe United Passenger Company Lim-ited(ZUPCO)
The Zimbabwe United Passenger Company (ZUPCO) is a holding company nationalized in 1988 with 51% of the shares owned by the State. Despite the gov-ernment support in acquiring vehicles, ZUPCO never succeeds in effectively meeting the demand. In 2004 the Government decided to assume sole ownership of ZUPCO.
After having been the only legal public transport operator before the independence, it has been chal-lenged by the numerous informal smaller capacity units, leading it into a period of decline. The ZUPCO fleet decreased from 1,200 buses in 1980 to around 700 in 1997 while its routes shrank from 426 to 270.
In 2002 a recovery plan was adopted which planned the purchase of a new fleet of modern buses including luxury coaches to cater for the needs of passengers who require space and luxury. The company also en-tered into partnership with a Chinese company to sup-ply new, complete buses and essential components to repower and refurbish the old ZUPCO buses. The aim was to reach 1500 buses in operation by 2009.
•CommuterbusesThey are minibuses of around 11-15 seats and con-stitute the main motorized means of transport (over 80%) in Harare today at over 6,000 units. Though sev-eral companies with more than 200 minibuses can be counted, some even with modern facilities in terms of ticketing and strict operation, the market is glo-bally very fragmented, with most owners owning be-tween one and two vehicles. They operate along fixed routes with fares controlled by the State and depart only when they are full.
Their number significantly increased after their legal-ization by a presidential decree. Harare inhabitants noticed a substantial improvement in transportation for a period, because of the considerable reduction in waiting times and extension of the public transport network.
But the growth in the informal sector brought disorder, as some streets were turned into noisy and confused loading points. Informal operators currently face the challenge of renewing their fleet which has begun to be much less attractive and become unsafe.

TRANS-AFRICA70
Country Authorities OperatorsCameroon Ministry of Transport, Cities of Yaoundé and
Douala, Ministry of FinanceSocatur, leBus (10%), traditional taxis (40%), motorcycle-taxis (30%), taxi-buses (10%)
Central African Republic
Ministry of Transport and Civil Aviation, City of Bangui
Minibuses (70%), taxis (20%), motorcycles
Chad Ministry of Infrastructure (State Secretariat in charge of Transport)
Motorcycle taxis (85%), taxis and minibuses (15%)
Congo Brazzaville
Ministry of Transport and Civil Aviation, CNPR
Minibus (40%), shared taxis or “100-100” (13%), taxis (25%), buses (5%)
Democratic Republic of Congo
Ministry of Transport and Communications Routes, City of Kinshasa, Ministry of Economy
STUC SARL (20%), minibuses (70%), Office national de transport (ONATRA)
Equatorial Guinea
Ministry of Transport, Technologies, Posts and Telecommunication, CNTR,CNSR
Taxis
Gabon Ministry of Transport and Civil Aviation SOGATRA (1%), taxis (50%), minibuses (50%)
Cen
tral
Afr
ica
Country Authorities OperatorsBurundi Ministry of Transport, Posts and Telecommu-
nications, Bujumbura CityBuses OTRACO (10%), taxis (15%), minibus taxis (70%), bike and motorcycle-taxis (5%)
Comoros Vice-Presidency in charge of Transport and Tourism
buses, minibuses, taxis
Djibouti Ministry of Equipment and Transport, Conseil National des Transports (CNT)
Intercity buses (40%), taxis (30%), minibuses (30%)
Eritrea Ministry of Transport and Communications Buses (45%), minibuses (35%), and taxi cabs (15%)
Ethiopia Ministry of Transport and Communications Buses (15%), taxi minibuses and midibuses (75%), taxi cabs (5%)
Kenya Ministry of Transport, Transport Licensing Board (TLB),Nairobi city council
Buses (15%), matatus (75%), taxis (5%), Boda-boda
Rwanda Ministry of Infrastructure “Share taxis” minibus (80%), bus (5%), taxis cars (10%), motorcycle taxis (5%)
Seychelles Vice-Presidency in charge of Tourism and Transport
Taxis (20%), intercity buses and omnibus (80%)
Somalia Ministry of Transport, Civil Aviation and Ports Taxis, minibuses and shared taxi
Uganda State Secretariat in charge of Transport, Trans-port Licensing Board (TLB),UTODA
Matatus or taxis (30%), Boda-boda motorcycle (20%), bicycle (60%), bus (1%)
Tanzania Ministry of Infrastructures Development, Department of Communications and Trans-port, SUMATRA, DART
Buses (20%), minibuses (70%)
East
ern A
fric
aOverview of different actors of
the public transport system in Africa

TRANS-AFRICA 71
Country Authorities OperatorsBenin Ministry in charge of Land Transport, Air Trans-
port and Public Works, City of CotonouZémidjan (95%)
Burkina Faso Ministry of Transport SOTRACO buses (5-10%), taxis (35%), intercity buses (50%)
Cape Verde Ministry of Infrastructures, Transport and Sea Minibuses Hiace, taxi cabs
Côte d’Ivoire Ministry of Transport, AGETU SOTRA buses (20%), minibuses (27%), Shared taxis (32%), taxi cabs
Gambia State Secretariat of Public Works and Infra-structures of Development
GPTC (40%), taxis (60%)
Ghana Ministry of Transport, DVLA, NRSC, MMDAs MMT buses (15%), Tro-tro (minibuses), shared taxi (85%)
Guinea Conakry
Ministry of Transport, City of Conakry Taxis (45%), minibuses (45%), buses (10%)
Guinea Bissau Ministry of Transport and Communications Buses, minibuses
Liberia Ministry of Transport Buses (25%), taxi cabs (75%)
Mali Ministry of Equipment and Transport ,BRCTU Large buses (35%), minibuses (65%)
Niger Ministry of Transport and Civil Aviation, ECOGAR
SOTRUNI, SNTV
Nigeria Ministry of Transport, LAMATA, FCTA Buses (30%), Danfo and Molue (70%)
Senegal Ministry of Infrastructures, Land and Air Trans-ports, CETUD
Buses (20%), minibuses ‘Cars Rapides’ (45%), taxis (35%)
Sierra Leone Ministry of Transport and Aviation, SLRTA Taxis, minibus, SRLTC
Togo Responsibility of Transport Attached to the Presidency
Oléyia (80%)
Wes
tern
Afr
ica
Country Authorities OperatorsAngola Ministry of Transport Buses, Collective taxis, private taxis
Botswana Ministry of Works and Transport Minibuses and midibuses, taxis
Lesotho Ministry of Public Works and Transport, RTB LFBSC (0.5%), taxi-minibus (75%), taxi
Madagascar Ministry of Transport and Tourism, ATT Taxis or “taxi-be”, bush-taxis
Malawi Ministry of Transport and Public Works Buses (25%), minibuses (50%), taxis (1%), Matolas (24%)
Mauritius Ministry of Public Infrastructure, Land Transport & Shipping, National Transport Authority (NTA)
NTC (40%), Other companies with buses (45%), taxis (5%)
Mozambique Ministry of Transport and Communications TPM (18%), Chapas (80%), Others
Namibia Ministry of Works, Transport and Communication Buses, taxis, combi
South Africa National Department of Transport, Provincial, local departments
Buses (20%), minibuses (70%)
Swaziland Ministry of Public Works and Transport ,Road Transportation Board
Buses, minibuses, taxis
Zambia Ministry of Communications and Transport Buses, minibuses, taxis
Zimbabwe Ministry of Transport and Communications ZUPCO (10%), commuter buses (80%)
South
ern A
fric
a

TRANS-AFRICA72
Review of operational conditions of public transport vehicles in Africa
Country CompaniesTypes of vehicle
FleetAverage age of the fleet
Types of company
Ivory Coast
SOTRA Bus 814 5-10 years Public
UTBBus 96
5-10 years PublicMinibus 20
STB
Bus 120
5-10 years PublicMinibus 30
Car 18
UPETCA Metered taxis 6,000 10-15 yearsAssociation
of taxis
Burkina Faso SOTRACO
Bus 43
10-15 years PublicCar 2
2-wheelers 1
South AfricaGFLEET
Bus 250
0-5 years Public
Minibus 145
Car 6,642
2-wheelers 10
Truck 250
Golden Arrow Bus Bus 1,050 10-15 years Public
Kenya KBSBus 31
0-5 years PublicMinibus 254
Cameroon SOCATUR Bus 70 10-15 years Public
NamibiaCity of
WINDHOEKBus 60 + 15 years Public
Burundi
OTRACO Bus 50 5-10 years Public
Association of minibuses
Minibus90%
Bujumbura fleet10-15 years
Association of taxis
The data used for this report were collected within the framework of a survey carried out with nearly 70 transport operators but only a dozen forms were returned (approximately 17.1%). The data below summarises the replies of the respondents:
I. Regulatory and institutional frameworkThe data collected during this study show that with the exception of state-owned or parastatal companies which operate often under concession agreements or specific contracts, almost all transport companies do not have any contract with the transport regulatory authorities. Some formal administrative documents always exist, but operate in an artisanal framework.
With the exception of certain countries, public transport in Africa is almost always under the direct control of the
ministries in charge of transport. The administration is also often performed by the local communities. In gen-eral, this does not enable follow-up and results in some-what ‘rational’ management of the activity. Indeed, only certain countries such as Cote D’Ivoire, Senegal or South Africa have a legally constituted organising authority, re-sponsible for the daily regulation and working under the supervision of the Ministry for transport.
Legislation governing transport is often obsolete (dating from the early post-colonial decades: 1970s). This situ-
A. Operational conditions of public transport vehicles

TRANS-AFRICA 73
ation brings the problem of the inadequacy of the leg-islation in force vis-à-vis current development realities. Furthermore, there is sometimes overlapping in existing legislation or conflicts in competency in the attribution of the various state structures (transport management, territorial municipalities, etc).
It is thus vital today that we progress with the full-scale institutional reform of the transport systems in Africa for a sustainable development of this industry whose smooth functioning will lay the foundations for that of many other industries.
These overlapping of responsibilities create a disor-dered operational framework. In such a context, clan-destine and informal transport, more flexible than for-mal companies with large buses, gains an increasingly large market share. Formal companies complying with the regulations are very often subject to unfair competi-tion by the informal sector, which hinders their opera-tion. Hence, the need for structured transport growth in Africa is overdue.
II. Road transport infrastructuresOne main weakness of transport systems in Sub-Saharan Africa is the lack of transport infrastructures.
At the conclusion of the survey performed in the frame-work of this study, it appears that the transport infra-structures, in particular roads, account for over 43% of public transport vehicle malfunction. For various rea-sons, roads are poorly maintained, or not maintained at all throughout the continent. Moreover, very few are paved. The different maintenance policies developed for the maintenance of built roads have been rarely implemented.
The table below shows percentages of paved roads in Africa:
Surface (km2)
Population (million in-habitants)
Paved roads
(%)
Western Africa 5,112,060 223.24 22.6
Southern Africa 6,005,240 108.77 20.7
Eastern Africa 6,755,902 233.87 9.5
Central Africa 3,021,180 29.66 4.1
Total for Africa 20,894,382 596 15.1
It is obvious from this table that there are few tarred roads in Africa. Only around 15.1% of roads in Sub-Sa-haran Africa are paved; which means that there are not enough infrastructures for transport. Vehicles are thus operated in poor conditions and heavily exposed to the consequences of this bad quality road network.
In the majority of the African large cities, there are always some main arteries where traffic is difficult if not impossi-ble. The existing roads are often old and may be geometri-cally incompatible with average speeds today. Some arter-ies have very steep downward slopes, in particular in the case of interurban transport. To this must be added the problem of road capacity. Growth projections for urban traffic in Africa at the time of road construction did not anticipate the current levels of traffic. This huge increase in traffic is also partly due to the sharp rise in the importa-tion of second-hand vehicles from Europe in recent years.
However, some good examples can be pointed out in particular in the field of the implementation of dedi-cated roads in the framework of BRT projects: Lagos has launched operation of its BRT with at present, a 22km long corridor, Johannesburg is building 36km of its BRT which will finally be 122km long, and oth-ers are underway in Dar-Es-Salam and Accra. The con-struction of roads for exclusive use by public transport with the aim of structuring the city must be widely encouraged in Africa.
The importation of second-hand vehicles entails problems of congestion which reduces average speed and exacer-bates externalities such as pollution in terms of quantity of emissions but also in terms of the greater toxicity of these emissions, in particular for the diesel fleet.
III. Social, economic and environmental considerations
•Socio-politicalenvironmentThe customs of African populations generally have damaging consequences on the smooth running of transport. Areas adjacent to pavements and cross-roads are generally transformed into places of trade. The pavement area is also sometimes occupied, forc-ing motorists, pedestrians and cyclists to share the use of the roadways. These roadways, badly main-tained, are thus reduced and perpetual congestion is hence found in the districts where markets and coach stations are located.
Poor road discipline also hinders transport improve-ment. Drivers observe driving rules only when ab-solutely necessary, and this is also one of the main causes of urban congestion. This has negative conse-quences on vehicles as this behaviour increases the risk of accident and obliges drivers to permanently slow down their speed. This consequently impacts on the lifetime of brake discs and engines.
Besides, Africa is the continent most devastated by po-litical conflicts. According to the strategic Atlas 2008, out of 35 serious conflicts reported in the world, 13 are located in Africa, where 15 countries out of 53 are in the midst a “crisis of average to high intensity”.
Political instability in the majority of the African coun-tries does not allow the socio-economic development of the various sectors. The transport sector is strongly affected by this constraint. Indeed, during the several uprisings following the elections in African countries, or during the popular movement against the political decisions, in particular the increase in the price of ba-sic necessities (fuel, foodstuffs, etc), it is a recurrent scene to see populations committing numerous acts of vandalism on transport infrastructures (tyres burn-ing on roadways, destruction of signalling equipment, destruction of public transport vehicles). In parallel, during the various incidents of post-electoral unrest and putsches, buses are broken or burnt by citizens expressing their anger in the streets.
Another important fact hampering operations is the lack of skilled staff to run but also and especially to maintain and monitor the maintenance of public trans-port vehicles. Many companies have gone bankrupt due to inefficient technical maintenance or spare parts management.

TRANS-AFRICA74
There is an acute need of capacity building in the public transport sector, not only regarding operations but also in planning issues as one of the real challenges remains to devise an effective and sustainable transport scheme catering for African realities.
•ClimaticenvironmentSub-Saharan Africa has a great diversity of climates but the prevailing climate is a tropical one. From one end to the other of the sub-continent, heat differences are greatest between seasons, as well as between night and day. In the southern part, heat is attenuated by the mois-ture brought by the ocean and the altitude, particularly on the high plateaux of Eastern Africa. However, in spite of its low contribution to the worldwide production of greenhouse gases (less than 4%), the Intergovernmen-tal Panel on Climate Change, a UN-established research panel, asserted that Africa is already feeling the effects of the climate change and will suffer more from it in years to come. This situation and the fact that this part of the world is usually one of hottest, renders the cooling sys-tems with which current vehicles are fitted unsuitable. Besides, dust is the second climatic element which af-fects vehicles. Indeed due to the high amount of particles present in the air in some African regions, the air filters are usually rapidly blocked. The cooling systems in vehi-cles are thus not suitable for use in such a conditions.
•PublictransportfinancingThe public transport sector receives scarce financing be-cause of the lack of political will to help this sector; even though some states are firmly committed to the rehabili-tation of viable public transport for their citizens, gener-ally speaking, African governments seem to be unaware of the economic collateral effects of public transport dis-organisation. Thus the priority in allocation of budgets is still not given to this important sub-sector.
Private investment banks seldom invest because of the lack of confidence in this sector, which lacks effective advocacy to Africa decision-makers. For the paragov-ernmental companies that used to or still exist, one of the main issues is the difficulty for governments to pay subsidies to compensate for maintaining affordable fares and also for concessionary travel for some social groups (police force, schoolchildren, etc).
Moreover, there is insufficient facility offered to the in-formal sector for fleet renewal. Presented as such, the African transport sector is in difficulty and is struggling to find the means to continue.
The following average proportions emerged for mainte-nance costs from the various companies surveyed:
•Labour:4.85%;
•Fuelandoils:61.65%;
•Tyres:7.67%;
•Spareparts:23.94%;
•Other:1.89%.
More than 30% of companies’ budgets are allocated to the purchase of spare parts (various parts and tyres). Public transport also suffers from the recurring increases in the cost of fuel.
Financing issues also lead to aged fleets with an aver-age age that is on the increase. Generally, the trend in fleet renewal in Africa is to acquire second-hand vehicles usually from Europe. There are some struc-tured companies that acquire new vehicles, but given the key position held by private operators in Africa, most renewals involve acquiring second-hand vehi-cles. From interviews with persons responsible for taxis and minibus associations, it became clear that these second-hand vehicles are mainly used for infor-mal transport. This informal transport is usually pro-vided by operators for reasons of profit. They are not transport professionals and thus the acquisition costs are the main criterion for fleet renewal. This choice is further supported by the poor quality of the roadway systems, which destroys the vehicles very quickly. Thus, as the minimisation of the capital costs facili-tates speedier amortisation, second-hand vehicles ap-pear to be the ideal choice. This state of affairs was strongly apparent from the study. Indeed, across all operators who were assessed:
•20%ofvehiclesinusearebetween0and5yearsold;
•40%arebetween5and10yearsold;
•30%arebetween10and15yearsold;
•And10%areover15yearsold.
So 70% of the public transport vehicles used in Africa have between 5 and 15 years of use, clearly demon-strating that the vehicles used in Africa are aged in nature.
Apart from the structured companies, the main mode of maintenance performed by transport actors is corrective maintenance. This very costly system of maintenance renders maintaining the vehicle in a roadworthy state more and more difficult.
I. Impact on vehiclesThe operating conditions of public transport vehicles described above are not without consequence. The re-sult - affecting structured companies as well as unofficial transporters - is that the vehicles struggle to continue operating in these conditions. Many vehicles remain im-mobilised due to technical failures. The parts with the most recurring failures are:
•Thebrakingsystem
The survey revealed that the brakes of the vehicles used in Africa for urban public transport are not fit for use. This may be explained by the permanent braking by urban bus drivers due to the road conditions, but more frequently because of traffic congestion. Used permanently in this way, the braking equipment is worn earlier than it should be.
B. Impacts of the operating conditions on public transport vehicles

TRANS-AFRICA 75
For all operators surveyed, braking equipment ac-counts for nearly half of bus breakdowns in recur-rence terms and represents the same proportion of failures for minibuses and other taxis. For taxis, this can be explained by their system of operation: they are generally hailed in the streets.
•EngineConstituting the traction device for buses, engines are one of the most vulnerable parts. It was demon-strated during the study that overloading, poor road conditions and congestion occur frequently in African urban transport. This situation leads bus drivers to generally remain at low speeds for long periods. In such conditions, engines quickly lose power, a phe-nomenon also due to approximate maintenance and unfavourable conditions of use.
Furthermore, engine problems are also linked to the use of second-hand vehicles. Clearly, in a fleet com-prising vehicles with an average of between five and 15 years of age, there will be difficulties with engines that have already had a long former service life that then enter into worse operating conditions.
•ShockabsorbersShock absorbers are one of the main problems en-countered. Overloading by African public transport operators due to the small scale of their offer com-pared with the great demand and the state of roads damages the shock absorption system of the vehicles. In general, the quality of the urban roadways is bad and constantly driving on unpaved roads or roads with many potholes quickly destroys the suspension system.
•TyresTyres wear out frequently and contrary to other fail-ures, whose proportions in fleets are linked to the make of vehicle, tyres wear down at the same rate, regardless of vehicle type. This is a problem that generally affects every single fleet of the surveyed companies. Since tyres are the part directly in con-tact with the ground, they are exposed to the direct consequences of poor road quality (potholes, cracks on unpaved roads, etc).
The problem of the tyres and the suspension system is exacerbated for large buses due to frequent over-loading which increases the axle load.
•GearboxUnder the conditions of use described above, when the gearbox is manual, it unavoidably wears out more quickly. Proportionately, the breakdown of gearboxes represents approximately 10% of all breakdowns in the various companies surveyed.
•BodyworkThis aspect is not common to all the countries, in par-ticular inland countries, but it has been observed that this problem is in general specific to cities border-ing oceans, due to the ambient moisture and sea salt. Thus, vehicles exposed to marine breezes are more affected by corrosion than those operating inland.
The atmospheric corrosion of metals is similar to rust-ing in water. It results from the action of ambient oxy-gen, and possibly of water (condensation of moisture, rain, spattering, salt). The three main causes of deg-radation are:
- light, in particular ultra-violet;
- moisture;
- heat.
As well as these main generally worn out parts, there are other recurrent malfunctions but these vary from one company to another and from one type of vehicle to another.
II. Social consequencesThese various problems, caused mainly by the operat-ing conditions, involve operators having to frequently pay for maintenance to be able to continue their activ-ity. However, the financial problems described above limit the possibilities open to these operators. Thus, downtime increases and ends up by affecting compa-nies’ fleets. For private operators with a small fleet, discontinuing their business rapidly becomes inevi-table and for structured transport companies, the of-fer becomes increasingly small. Consequently, vehicle quality generally deteriorates; these vehicles being over-operated to fill the gap to cover permanently im-mobilised vehicles.
For passengers, waiting time at bus station grows in-creasingly long and mobility is greatly reduced.
All these problems plunge operators in a perpetual cycle of ‘back to square one’ and put a brake on the development of the activity.
Main causesAffected
partsState of roads Age of vehicles Climate Overloading Congestion
Braking system
Suspension
Tyres
Engine
Gearbox
Bodywork
The table hereinafter provides an overview:

TRANS-AFRICA76
To attenuate the effects of all these problems encoun-tered, public transport operators in Sub-Saharan Af-rica are obliged to find ways to adapt their vehicles to the conditions in order to reduce the impact on their activity. But the means, vehicle type and quality of maintenance labour being different, the structured companies resort to different adaptations than the in-formal private operators. The following list of modifi-cations made by transport operators is not exhaustive but covers only current practice on the continent.
Generally, used vehicles from Europe can be used in Africa but with certain precautions, in particular a ten-dency to oversize vehicles for Africa given the more difficult operating conditions.
I. Actions already undertaken by operatorsTechnically, changes already carried out to adapt vehi-cles to African conditions include:
•OnbusesA certain type of articulated bus having the engine and exhaust pipe at their rear causes a great quantity of dust and abrasive particles each time the bus starts up. The ventilator of the cooling system thus sucks in the particles stirred up by the bus start-up. Because buses have to stop and start up several times during their route, their cooling systems and engines often break down.
A solution devised by operators is to redirect the ex-haust pipe to exit at the side of the bus, thus solving the problem.
On 12m buses, for example, the engine power is around 240Hp. Because of the recurring overloads, these types of engine have already been replaced by 330Hp Caterpillar engines by some manufacturers to extend the lifetime of the engine. Indeed, since in Af-rica the buses are always crowded and use time is long, the 240Hp engines break down more quickly and their maximum lifetime is 5-6 years compared with ten years elsewhere.
In some cases the position of components is changed to adapt them. For example, the air intake is placed high up (on the roof) because it was observed that below 1.2 meters there is a risk from dust blockage, even when a filter protection is used. For the same reasons, the engine cooling system is placed on the roof because of the mud which can obstruct the radia-tor for example and lead to engine overheating even when the radiator is a standard size. But placing these elements high up requires an initial design minimising maintenance operations.
Public transport operators have also had problems with the front bumper, which is not very shock resistant. Operators usually strengthen the bumper using vari-ous methods, but very often this reinforcement is done by installing additional layers of fibreglass inside.
•OntaxisDue to the high costs of maintenance, rapid degra-dation of the second-hand vehicles generally used in Africa, and to render their business profitable, it is frequent for some taxis operators to buy and adapt vehicles designed to run on gasoline. Indeed, since vehicles running on gasoline are less expensive to pur-chase, some operators buy them and with the assist-ance of local mechanics, transform the energy source by adapting them to diesel use. According to these operators, this equates to around approximately 90% of the acquisition cost of a vehicle originally designed to run on diesel.
This is a practice generally carried out by vehicle im-porters who mislead their customers. However, it does have an impact on the lifespan of the vehicles.
•OnminibusesCertain adaptations are also made to minibuses. Tak-ing into account once again the initial capital costs, some buy utility vans with a maximum total weight of 3.5 tonnes (such as Mitsubishi Canter). The van is then reshaped by selling the rear shell and hav-ing local sheet metal workers build the body of mini-bus; then the engine is completely overhauled. The production cost varies across the continent, ranging from 70 to 80% of the purchase cost of a second-hand minibus.
II. General considerations to be applied for an African public transport busTaking into consideration all the problems encoun-tered by transport operators in Sub-Saharan Africa, due in particular to the infrastructures and other dif-ficult operating conditions, the following general pro-posals are made for the design of African buses:
•RobustnessTo safely address the harsh operating conditions, the structure and the components of the chassis must be protected from corrosion. They should be designed to resist the high temperatures and humid condition of most of African countries. An anti-corrosive pro-tection must be guaranteed for a long period, for in-stance at least ten years.
•SuspensionBecause of overloading and poor road conditions, a shock absorption system adapted to the various axle loads found in Africa must be designed. To be appro-priate for the continent, it needs to be oversized. This suspension must be automated so that the ground clearance remains constant whatever the vehicle load. A mechanism for assisting handicapped people must be envisaged.
•BrakingsystemTo resolve braking problems, consideration must be given to the use of the latest technologies, computer-
C. Reflections on solutions to be adopted by public transport operators

TRANS-AFRICA 77
assisted if required. An Anti Blockage System should be favoured for the braking system to increase the brake discs’ lifetime.
•GearboxThe gearbox must be automatic and tough. It must comprise speed limitation devices to adapt its use to urban or interurban transport. For urban buses, a nautomatic gear box is recommended whereas for in-terurban buses, a semi-automatic gear box is recom-mended.
•EngineEven though Africa faces low purchasing-power issues, vehicles for Africa must be equipped with engines meet-ing Kyoto Protocol pollution standards. Power must be revised upwards so as to guarantee an optimal lifespan in the load conditions encountered in Sub-Saharan Af-rica. Engine power should be above the current level to meet overloading practices prevalent in Africa. An engine of at least 250Hp is suitable for such overload conditions. Safety devices must be envisaged to pre-vent engine start-up under certain conditions (mainte-nance slot opened, etc.). Other devices must be envis-aged to ensure engine safety in the event of a decrease in oil pressure or overheating. Besides, the use of clean fuel or a low-emission engine is recommended.
The transmission of the movement must be designed to allow the vehicle to survive the difficult operating conditions and to be able to be used in optimal condi-tions of safety and comfort. The maximum speed of the vehicle must be:
•70km/hforurbanbuses;
•110km/hforinterurbanbuses.
•SteeringIntegrated power steering is recommended, being best suited to urban driving conditions. Power steer-ing is suited to urban transportas it improves drivers’ productivity and also allows the driver to easily ma-noeuvre out of small streets and congestion.
•ElectricwiringTo facilitate maintenance, all electric cables must be colour-coded and be properly insulated. This aims to decrease the maintenance times and lead to better availability of vehicles. It also avoids or minimises the risks from electric shocks.
•EnergyTo reduce the production of green house gases and improve the urban air quality, the African bus could have a less polluting energy source. For example, it could work with natural gas which is less polluting than ordinary fuels. Natural gas is often described as the cleanest fossil fuel, producing less carbon diox-ide per joule delivered than either coal or oil. It is a cleaner alternative to other automobile fuels such as gasoline (petrol) and diesel.
•CapacityComplementary operations between minibuses and large buses can be foreseen with the use of minibuses for feeder routes and large buses for trunk roads.
Various capacities should thus exist:
•Upto50placesforminibuses;
•From50to110placesforbuses.
The standards regarding space occupied by passen-gers must be complied with to ensure optimal com-fort on board. Integrating the various means of trans-port will allow to users to travel using several means of transport with a single ticket.
•ConfigurationoftheinteriorIt is preferable that the vehicle comprises at least two doors for better boarding and alighting. These doors must be wavering interior with two casements. The in-ternal space must be adequately ventilated, even when all the glazes are closed in period of rain by using ven-tilators or air extractors. The driver’s cab must be com-fortable, ergonomic, protected and adapted to opera-tion with only one agent. Seats must be comfortable and proofed against vandalism. The space between seats must be a comfortable base with the passengers. The minimum space between two successive seats should be approximately 75cm. The vehicle must be equipped with three modern wind vanes of line (front, side and back), visible remotely of day like night, even under unfavourable conditions of visibility.
•SimplicityofmaintenanceOnly electronic devices able to contribute to making maintenance easier are recommended. Their mainte-nance should be modular where possible and trouble-shooting easy.

TRANS-AFRICA78
Over half of states’ economic activity is concentrated within the cities mentioned in this report, most of which are country capitals. These cities are vital urban cen-tres for economies. However, looking at the studies and projects implemented so far, these are markedly more concerned with the provision of road, rural and interre-gional transport than urban public transport, even though public transport actively contributes to the dynamism of daily activities in these urban centres.
Historically, in almost all countries studied, the sovereign need to establish a public transportation system for the mobility of populations has always been manifested very early and often before independence. States sought to create state-owned and parastatal companies with large buses in line with a ‘modern’ and Western definition of public transport. A classic pattern of population growth coupled with unchecked urban sprawl has occured almost everywhere, with the official company unable to meet this demand. The already existing traditional informal sector, neglected by the authorities, gains momentum by supplementing the services of the formal structure and later by competing with it. We can estimate that over 60 formal companies providing public transport services have experienced a period of prosperity only to later disappear. But the informal sector should not be taken as solely responsible for these bankruptcies; financial or spare parts mismanagement is often also the reason for their downfall.
In all countries the informal or ‘small-scale’ sector is large-ly dominant today. It could be estimated as providing 80% of collective transport supply, in a context of widespread ‘running out of steam’ by formal enterprises with large buses, even in the light of recent initiatives. It must be said that when regulation is not strictly applied, the infor-mal sector engages in fierce and often unfair competition with structured companies operating large buses.
The intercity transport sector is significantly more active and more stable than the urban transport sector. The differ-ent operational realities seem to provide an explanation.
The operating rules of city buses are largely flouted; there is a strong will on the part of the African governments to implement public transport, the absence of which hits the local populations hard.
However, the minimum measures are not applied such as the operational optimisation of the vehicles, anticipation of maintenance problems or availability of spare parts.
The informal sector operates mostly with much smaller motorised vehicles than the ‘conventional’ large public transport bus. Informal transport units comprise 16 to 24-seat minibuses widespread in most cities in this re-port. The most common are Japanese brands (Toyota Hi-ace, Mazda, etc.), ubiquitous taxis (4-5 seats) and ‘combi’ type microbuses whose capacity ranges from 9-15 places are also fairly commonplace. In many countries, they of-ten compete against each other in this field, with mini-buses seeming to generally have the upper hand.
Minibuses are most often used for intercity services and can serve urban areas along their routes, while taxis are mostly confined to serving the inner cities and their suburbs.
Individual taxis formally differentiated from shared taxis and sometimes equipped with a meter, are also present in some countries.
Midibuses (25-45 seats) operate, but are much less commonplace than minibuses. It should be pointed out that one of the advantages of the informal sector is precisely the smaller size of the units, as most vehicles will not start until they are full and so large capacity vehicles may incur lengthy waiting time for users, par-ticularly during off-peak hours, and thus experience declining ridership.
Under current informal operations, the minibus appears to be the ideal and most profitable means for this sector. Its popularity can be explained by its capacity to transport more passengers than taxis and ability to achieve more turnarounds than the midibus. Although a barrier exists: the acquisition cost, which in some countries can be seen as a strength, in poor countries the cost is considered as high and cannot be borne by the population when trans-lated into travel costs. This explains the recent increase of motorcycle taxis that are spreading throughout cities but also into rural areas. The poor condition of roads in Africa is a factor underpinning their expansion as motorcycle taxis seem to be better suited to running on almost impassable roads. The poor road network is therefore a key element limiting the operations of large-bus companies.
A main asset of the informal sector that foils all attempts to ban it, is its ability to provide large number of jobs (in Benin, more than 200,000 persons are employed in the Zemidjan industry).
The 1990s also coincided with structural adjustment pro-grammes imposed by international donors, for which out-comes have been mixed. Except for a handful, all states opted for the liberalisation of the transport sector with its measures to wind up structured companies and facilitate market access for private informal transporters.
This raises questions of definition and terminology, as in many countries, although these carriers are called informal, they are implicitly recognised by the gov-ernment, pay taxes and comply with the institutional mechanisms in place depending on the level of enforce-ment by the state itself. Even if they are accepted by the public authorities, we consider that this sector can be generally grouped under the generic name of “collective transport” different from “public transport” in the way that public transport in its strict sense respects some basic rules such as the predefinition of routes and the provision of a scheduled service. In addition, the “in-formal” sector generally lacks order and is beyond su-pervision, even and especially in the form of organised unions with powerful lobbies.
In truth, liberalisation of transport has often been synony-mous with deregulation followed by disorder, since the number of informal transporters grew significantly and the system became chaotic. The informal sector is generally criticized due to its negative externalities of air pollution and lack of road safety. The vehicles are usually in poor condition, and this is coupled with bad driving behaviour. In this sense, motorcycle-taxis are even more vulnerable than other informal transport means. Moreover, the prolif-
Conclusions

TRANS-AFRICA 79
eration of these small units contributes to the congestion now commonplace in most of the African metropolises.
The presence of an urban transport organising authority does a great deal to help solve the problems of running a transport system distorted by the domination of the in-formal sector. Responsibilities and information are often scattered between several entities, hindering a consist-ent response. Public transport monitoring is facilitated by the presence of an organising authority.
Given the scale of the dysfunctioning that the infor-mal sector causes, some states have undertaken meas-ures, with a good results in some cases. A measure of a certain interest is the professionalization of infor-mal transport underway in Dakar and planned in some other cities. This involves consolidating the multitude of operators into a few formal bodies, assisted in the renewal of their fleets. Bodies can take various forms such as taking advantage of major project to make the transition from informal to formal. This is notably the case in Lagos with the introduction of its BRT network, under which one of the largest associations of opera-tors in Nigeria, formerly ‘owners’ of informal vehicles, was enabled to officially run high capacity buses on the BRT network.
Transferability in Africa of the successful Latin American BRT system is being studied in several countries.
Clearly, it is helpful to consider what is the best regulato-ry system for public transport in Africa. The coexistence of informal sector companies operating small units and large buses is hard on the large bus operators, especially in the context of total deregulation. Governments must still recognise the structuring and sustainable effect of high-capacity vehicles on the public transport landscape.
It should be noted that in Sub-Saharan Africa, purely pri-vate initiatives operating urban services with large buses are relatively rare.
In addition, the different forms of state intervention are diverse: some states commit infrastructure provision (Lagos), others subsidise operations while some buy ve-hicles to be used by the operator. In any case, the state must undertake its social responsibility in providing ef-fective transport for the welfare of populations.
Regarding operating conditions of vehicles, corrective actions are already often undertaken to reinforce vehi-cles, but this remains insufficient. It is thus necessary to design and manufacture a bus that complies technically with the few and non-exhaustive points listed in this doc-ument. A prerequisite is for the general specifications to be quantified in figures. The next stage of the Trans-Afri-ca project is devoted to this activity and is set to produce the necessary results.
Nevertheless, in the development of buses for Africa, the question of financing is crucial as technically, the design of a bus for Africa should not pose a problem. There seems to be a contradiction between adapting or designing a quality and durable bus for Africa with theoretically higher manufacturing costs and the low purchasing power of African companies. Besides, the ‘cheap’ bus favoured by African operators could be more expensive, in terms of post-purchase mainte-nance, than a bus effectively adapted and intended for Africa.
It is consequently important to adopt a global approach and also seek to develop mechanisms to finance public transport for Africa. The lack of such mechanisms means that projects never effectively come to fruition.
Bibliography
- Aaron Adiv, Urban transport in Maputo, Mozambique - a case study for developing countries, Transportation Research Board Annual Meeting, 2008
- Abotsi Kossi Emenefa Achille, un cas de transport ur-bain en Afrique, Les taxis motos au Togo, Dea trans-port, IUP d’Urbanisme, 2005
- Adam Smith, A Study of Urban Transport Institutional, Financial and Regulatory Frameworks in Large Sub-Sa-haran African Cities, SSATP, November 2005
- Ajay Kumar and Fanny Barrett, Africa infrastructure country diagnostic Stuck in traffic: Urban transport in Africa, World Bank, January 2008
- Amakoé P. Adoléhoumé, La problématique des trans-ports urbains et la réduction de la pollution de l’air due aux transports motorisés en Afrique subsaharienne, www.francophonie-durable.org/documents/colloque-ouaga-a3-adolehoume.pdf
- Anan Allos, Alison du Sautoy, Scott Wilson, Maputo Bus Study, Gold Projects, www.inro.ca/en/pres_pap/euro-pean/eeug98/maputo.pdf
- Rapport de l’Atelier régional sur l’impact du transport urbain à deux roues et ses perspectives de développe-
ment dans les pays de l’UEMOA (Benin, Niger et Togo), Lomé, novembre 2002
- Ayite Marcel Baglo, Le transport urbain en Afrique de l’Ouest : le cas de Cotonou, Liaison énergie francophonie, 2003
- Célestin Kaffo, Pierre Kamdem, Basile Tatsabong, Louis Marie Diebo, L’intégration des “motos-taxis” dans le trans-port public au Cameroun ou l’informel à la remorque de l’Etat : une solution d’avenir au problème de mobilité et de l’emploi urbain en Afrique subsaharienne, www.ville-en-mouvement.com/taxi/telechargements/pptkamdem.pdf
- Charles Lututa Ilongosi, Système des transports en commun à forte capacité dans les grandes villes afri-caines et mécanismes de financement (Cas de Kinsha-sa), www4.worldbank.org/afr/ssatp/Resources/HTML/Conferences/Maseru06/Proceedings/...ATS/02-High-CapacityPublicTransport_fr.pdf
- Décret n°2006-0184/PR/MET du 23 juillet 2006, Condi-tions d’exercice de la profession de transporteur urbain et interurbain, Djibouti, 2006
- Déplacements urbains cas de Brazzaville, Natondzi bino botondzi www.transponts.com/fichiers/travaux/travaux_2005/Deplacements-BZV.pdf

TRANS-AFRICA80
- Dieudonné Madebe, Quelle sortie de crise pour les transports urbains à Libreville ?, Echos du SITRASS, N° 14, Septembre 1997
- Étude régionale sur l’organisation, le financement et la rentabilité des micro-entreprises de transport urbain en Afrique subsaharienne Tome IV : Le cas de Harare, Document de travail, SSATP No 53, Janvier 2001
- Gacitua-Mario Estanislao, Nordang Hakon and Wodon Quentin, Livelihoods in Guinea-Bissau, World Bank, January 2007
- Guezere Assogba, Taxis collectifs et taxis-motos: un couple intermodal pour une meilleure intégration du transport urbain à Lomé, Colloque international de taxi, Lisbonne, Septembre 2007
- Hon._Jeremiah_Sulunteh, Challenge and investment op-portunities, private sector investment forum on Whash-ington DC USA, February 2005
- J Howe, A Davis, Boda boda: Uganda’s rural and ur-ban low-capacity transport services, Institute of Social Research, Makerere University, Uganda, 2001 - www.transport-links.org
- Jan van der Sluis, Risques réduits sur les routes du Tch-ad, R-2002-07F, www.swov.nl/rapport/R-2002-07F.pdf
- Karanga Augustin, Damiba Pierre Claver, Batabe Cora Mathias, Etude sur le renforcement des capacités au Burkina Faso : Secteur des transports - Ouagadougou, CAPES, 2003
- KM Gwilliam, Cities on the Move: A World Bank Urban Transport Strategy Review, World Bank, 2002
- L Djifarova-Vassileva, Minibus operations along Loma-gundi Road - Harare, Thredbo VI, Cape Town, South Africa, 1999
- LD Olvera, D Plat, P Pochet, Mesurer les dépenses de transport des ménages en Afrique Subsaharienne. Une Application au cas de Niamey, www.hal.archives-ouvertes.fr
- Loi N°95-029 portant organisation générale des trans-ports terrestres et fluviaux, 4 Août 1995, Madagascar
- M. Touré, T.O. Fadayomi, Migrations et urbanisation au sud du Sahara, - 1993 - Diffusion, Karthala
- M.Benmaamar, Urban transport services in Sub-Saharan Africa: Recommendations for reforms in Uganda, TRL Limited, 2002
- Maïdadi Sahabana, Les motos-taxis à Douala et leur perception par les pouvoirs publics: entre tolérance d’un secteur pourvoyeur d’emplois et de transport et volonté d’éradiquer une activité incontrôlable, Labora-toire d’Economie des Transports, ENTPE, www.cidegef.refer.org/douala/SAHABANA.doc
- Malachie Mbonde, Transport urbain à Bangui, Direction des Études techniques et de la programmation - Mairie de Bangui, www4.worldbank.org/afr/ssatp/Open.aspx?id=316
- Mariama Gamatié Bayard, Genre et transport au Niger: Environnement institutionnel - Accès - Prestation de services, Rapport provisoire, Septembre 1999
- Meleckidzedeck Khayesi, the struggle for regula-tory and economic sphere of influence in the matatu
means of transport in Kenya: a stakeholder analysis, Kenyatta University, Department of Geography, Kenya September 1999
- Milward Tobias, Minibus Operators and Passenger Wel-fare in Malawi, CUTS International, 2008
- Ministry of Public Infrastructure, Land Transport & Ship-ping, Multi-criteria analysis of the alternative mode of transport, Mauritius, May 2002
- Mintesnot Gebeyehu, Shin-ei Takano, Diagnostic Evalu-ation of Public Transportation Mode Choice in Addis Ababa, Japan Journal of Public Transportation, Vol. 10, N°. 4, 2007
- N.T. Rao, V. Vokolkova, Public private partnership in road transport sector in Botswana, www.codatu.org/francais/publications/actes/conferences/codatu12/papers/RAO.pdf
- Prosper Metougue, Le phénomène des « clandos » à Libre-ville ou l’informel à la remorque de l’Etat : enquete, Univer-sité du Littoral Côte d’Opale, Laboratoire Redéploiement In-dustriel et Innovation, ideas.repec.org/p/rii/riidoc/86.html
- Restructuration des ressources du FER du Tchad www4.worldbank.org/afr/ssatp/Resources/TrainingMateri-als/enpc_03_FER_Chad_restr.pdf
- Rijswijk, Relationship between urban land use planning, land markets, transport provisions and welfare of the poor, D20000807\23987, The Netherlands, August 2000
- S.I. Oni, Urban transportation at State and Local Gov-ernment levels, Department of Geography - University Of Lagos, Akoka-Lagos, September 1999
- Sectoral Development Strategies, Zambia, www.ecfa.or.jp/japanese/act-pf/H17/renkei/zambia/Zambia-Chapter%204-A.pdf
- Sering Falu Njie, The Gambia Sub-Saharan Africa Trans-port Policy Programme (SSATP) final report of the ssatp review, February 2008
- SSATP, Poverty and urban mobility in Conakry, World Bank, September 2004
- T Opiyo, The Metamorphosis of Kenya Bus Services Limited in the Provision of Urban Transport in Nairobi - Department of Civil Engineering, 2000
- TAG Consulting Economists, Competition issues in the transport sector in Malawi: passenger services and road haulage, October 2007
- TC Mbara, Activity patterns, transport and policies for the urban poor in Harare, Zimbabwe, final coun-try report, www.transport- links.org/transport_links/filearea/documentstore/305_Zimbabwe%20Final%20Report%20-%20Final.PDF
- TC Mbara - Coping with demand for urban passenger transport in Zimbabwe: challenges and options, 25th Annual Southern African Transport Conference, South Africa, 2006
- Wilson L Gashaza, JR Transport and vehicle characteris-tics in the City of Dar Es Salaam, transport sector strat-egy note, Tanzania, March 2007
- Xavier Godard, Quel modèle de transports collectifs pour les villes africaines ? (Cas de Brazzaville et Kinshasa), www.politique-africaine.com/numeros/pdf/017041.pdf

An informal transport terminal in Abidjan (Côte d’Ivoire)...
... A high-capacity bus in Accra (Ghana)
The new Bus Rapid Transit system (BRT) of Lagos (Nigeria)...
... A bus station with a futuristic design in South Africa
View of a Gautrain terminal (South Africa)...
A formerly neglected area, the transport sector is drawing growing attention from the African public authorities, economic analysts and international donors as an essential vector of growth, poverty
reduction and sustainable human development.
Given that the majority of Sub-Saharan African inhabitants are ex-pected to be living in urban areas by 2025, it is imperative that measures be conceived and applied to anticipate these major
urban mobility challenges.
It is now unanimously acknowledged that such access for populations to sustainable mobility could not take place without the implementa-
tion of bold policies in favour of public transport development.
It is within this dynamic that the Trans-Africa project is conceived, led by the International Association of Public Transport (UITP) and the African Association of Public Transport (UATP) with the financial
involvement of the European Commission.
This report is the first outcome of the project and provides an overview of the public transport sector in 44 countries in Sub-Saharan Africa.