Overview of Laminar Flow Control - NASA · NASA/TP-1998-208705 Overview of Laminar Flow Control...
142
NASA/TP-1998-208705 Overview of Laminar Flow Control Ronald D. Joslin Langley Research Center, Hampton, Virginia National Aeronautics and Space Administration Langley Research Center Hampton, Virginia 23681-2199 October 1998 https://ntrs.nasa.gov/search.jsp?R=19980232017 2018-06-02T17:26:40+00:00Z
Transcript of Overview of Laminar Flow Control - NASA · NASA/TP-1998-208705 Overview of Laminar Flow Control...
NASA/TP-1998-208705
Overview of Laminar Flow Control
Ronald D. Joslin
Langley Research Center, Hampton, Virginia
National Aeronautics and
Space Administration
Langley Research Center
Hampton, Virginia 23681-2199
October 1998
https://ntrs.nasa.gov/search.jsp?R=19980232017 2018-06-02T17:26:40+00:00Z
Acknowledgment.,;
The author's only intent in generating this overview was to summarize the available literature from a historical
prospective while making no judgement on the value of any contribution. This publication is dedicated to the many
scientists, engineers, and managers who have devoted a portion of their careers toward developing technologies whichwould someday lead to aircraft with laminar flow.
Special thanks to Anna Ruzecki and Dee Bullock for graphics services which led to the reproduced figures,
Eloise Johnson for technical editing services, and Patricia Gottschali for typesetting services. Gratitude is expressed
to the following companies and reviewers of this manuscript or a portion of this manuscript: Scott G. Anders,Dennis M. Bushnell, Michael C. Fischer, Jerry N. Hefner, Dal V. Maddalon, William L. Sellers III, Richard A.
Thompson, and Michael J. Walsh, Langley Research Center; Paul Johnson and Jeff Crouch, The Boeing Company;E. Kevin Hertzler, Lockheed Martin Corporation; and Feng Jiang, McDonnell Douglas Corporation.
The use of trademarks or names of manufacturers in this report is for accurate reporting and does not constitute anofficial endorsement, either expressed or implied, of such products or _nanufacturers by the National Aeronautics and
Space Administration.
Available from the following:
NASA Center for AeroSpace Information (CASI)7121 Standard Drive
Hanover, MD 21076-1320
(301) 621-0390
National Technical Information Service (NTIS)
5285 Port Royal Road
Springfield, VA 22161-2171(703) 487-465O
Contents
Tables ............................................................................ v
Figures ........................................................................... v
Abbreviations and Symbols ........................................................... ix
1. Introduction ..................................................................... 1
2. Background ...................................................................... 2
2.1. Definition of LFC .............................................................. 2
2.2. Benefits of LFC ............................................................... 3
3. Laminar Flow Control Design Methodology ............................................ 6
3.1. Boundary-Layer Instability Issues ................................................. 6
3.2. Surface Tolerances for Laminar Flow .............................................. 9
3.2.1. Waviness ................................................................ 12
3.2.2. Two-Dimensional Surface Discontinuities ...................................... 13
3.2.3. Three-Dimensional Surface Discontinuities ..................................... 13
3.3. Critical Suction Parameters for LFC .............................................. 14
3.4. Manufacturing Issues .......................................................... 16
3.4.1. Joints ................................................................... 16
3.4.2. Holes ................................................................... 16
3.5. Transition Prediction Design Tool Methodology .................................... 17
3.5.1. Granville Criterion ......................................................... 18
3.5.2. C1 and C2 Criteria ......................................................... 18
3.5.3. Linear Stability Theory ..................................................... 18
3.5.4. Parabolized Stability Equations Theory ......................................... 23
3.5.5. Transition Prediction Coupled to Turbulence Modeling ............................ 24
3.5.6. Receptivity--The Ingestion of Disturbances ..................................... 24
3.5.7. Optimize Linear Design for LFC .............................................. 253.5.8. Thermal LFC ............................................................. 26
3.5.9. Advanced Prediction of Manufacturing Tolerances ............................... 26
4. Laminar Flow Control Aircraft Operations ............................................ 26
4.1. Insect Contamination .......................................................... 27
4.1.1. Paper Cover ................................................................ 29
4.1.2. Scrapers ................................................................. 304.1.3. Deflectors ................................................................ 30
4.1.4. Fluidic Cover ............................................................. 30
4.1.5. Thermal Cover ............................................................ 30
4.1.6. Relaminarization .......................................................... 30
4.1.7. Liquid Discharge .......................................................... 314.1.8. Flexible Surface or Cover ................................................... 31
4.2. Ice Accumulation and Atmospheric Particulates .................................... 32
4.2.1. Ice Accumulation .......................................................... 32
4.2.2. Atmospheric Particulates .................................................... 33
4.3. Boundary-Layer Control for Takeoff and Landing ................................... 33
4.4. Operational Maintenance of Laminar Flow ......................................... 34
.oo
!!1
5. Laminar Flow Control Prior to OPEC Oil Embargo ..................................... 35
5.1. B- 18 Slot-Suction Glove Flight Test (1941 ) ........................................ 35
5.2. LFC Wind Tunnel Tests (1949-1963) ............................................. 36
5.2.1. Wind Tunnel Test With Porous Bronze Airfoil .................................. 36
5.2.2. University of Michigan Slot-Suction Wind Tunnel Tests ........................... 36
5.2.3. Douglas Slot-Suction Wind Tunnel Test ....................................... 37
5.3. Anson Mk. 1 Porous-Suction Flight Test (1948-1950) ............................... 37
5.4. Vampire Porous-Suction Flight Test (1953-1954) ................................... 37
5.5. F-94A Slot-Suction Glove Flight Test (1953-1956) ................................. 38
5.6. Later Subsonic Slot-Suction Wind Tunnel Tests (1958) .............................. 40
5.7. Supersonic Slot-Suction Wind Tunnel Tests (1957-1965) ............................. 41
5.8. X-21A (WB-66) Slot-Suction Flight Test (1960-1965) ............................... 43
6. Laminar Flow Control After OPEC Oil Embargo ....................................... 45
6.1. Boeing Research Wind Tunnel LFC Test (1977-1978) ................................ 46
6.2. Langley 8-Foot Transonic Pressure Tunnel LFC Wind Tunnel Test (1981-1988) ........... 46
6.3. Jetstar Leading-Edge Flight Test (1983-1986) ...................................... 48
6.4. Cessna Citation HI Nacelle LFC Flight Test (1986) .................................. 49
6.5. Dassault Falcon 50 HLFC Flight Tests (1987-1990) ................................. 50
6.6. Boeing 757 HLFC Flight Test (1990-1991) ........................................ 51
6.7. HLFC ONERA-CERT T2 Wind Tunnel Test (1991) ................................. 52
6.8. HLFC Nacelle Demonstration Flight Test (1992) .................................... 53
6.9. NLF and LFC Nacelle Wind Tunnel Tests (1991-1993) ............................... 53
6.10. VFW 614 HLFC Transonic Wind Tunnel Test (1992) ............................... 54
6.11. European NLF and HLFC Nacelle Demonstrator Flighl Tests (1992-1993) .............. 54
6.12. A320 Laminar Fin Wind Tunnel and Flight Test Progrzm (1993-1998) ................. 55
6.13. Langley 8-Foot Transonic Pressure Tunnel HLFC Wind Tunnel Test (1993-1995) ........ 55
6.14. High-Speed Civil Transport (1986) .............................................. 56
6.15. Supersonic LFC Quiet-Tunnel Tests (1987-1996) .................................. 57
6.16. F- 16XL Supersonic LFC Flight Tests (1989-1996) ................................. 58
7. Concluding Remarks ............................................................. 60
Appendix A---Subsonic Natural Laminar Flow Research ................................... 62
Appendix B--Supersonic Natural Laminar Flow Research ................................. 66
References ....................................................................... 67
Tables ........................................................................... 81
Figures .......................................................................... 84
iv

Tables
Table 1. Subsonic and Transonic LFC Wind Tunnel and Flight Experiments and Major
Accomplishments ................................................................ 81
Table 2. Subsonic LFC Wind Tunnel and Flight Experiments and Major Accomplishments
Prior to OPEC Oil Embargo (1970) .................................................. 82
Table 3. LFC Wind Tunnel and Flight Experiments and Major Accomplishments After
OPEC Oil Embargo ............................................................... 83
Figures
Figure 1
Figure 2.
Figure 3.
Figure 4.
Figure 5.
Figure 6.
Figure
Figure
Figure
Figure
Figure
Figure
Figure 13.
Figure 14.
Figure 15.
Figure 16.
Figure 17.
Figure 18.
Figure 19.
Figure 20.
Figure 21.
Figure 22.
Figure 23.
• Overview of Laminar Flow Control Projects ..................................... 84
Concepts and practical application ............................................. 85
Aircraft drag breakdown ..................................................... 86
Predicted drag benefits of laminar flow on subsonic business jet ..................... 86
Benefits of LFC with range for subsonic aircraft .................................. 87
Potential benefits of HLFC on advanced subsonic transport ......................... 87
7. Potential benefits of HLFC on advanced supersonic transport ........................ 88
8. Benefits of SLFC on supersonic aircraft ......................................... 88
9. Cost of jet fuel to airline industry .............................................. 89
10. Sketch of Tollmien-Schlichting traveling wave .................................. 90
11. Sketch of Taylor-Grrtler vortices over concave surface ............................ 90
12. Sketch of crossflow vortices over swept wing ................................... 91
Effect of wind speed and wing sweepback on transition ........................... 91
Maximum transition Reynolds number with wing sweep .......................... 92
Sketch of attachment-line flow ............................................... 92
Devices used to prevent attachment-line contamination ............................ 93
Effects of two-dimensional surface imperfection on laminar flow extend .............. 94
Typical permissible surface waviness .......................................... 94
Typical permissible three-dimensional type of surface protuberances ................. 95
Hole geometries and inlet region shapes• Not drawn to scale ....................... 95
Transition location as function of average pressure gradient ........................ 96
Transition location as function of turbulence level ................................ 97
Illustration of neutral curve for linear stability theory ............................. 98
Figure 24. Amplification of four waves of different frequency to illustrate determinationof N-factor curve ................................................................. 98
Figure 25. Cessna 206 anti-insect flight test results ........................................ 99
Figure 26. Estimated LFC performance with ice particles in air ............................. 102
Figure 27. Validation of Hall criteria for impact of cloud particulate on laminar flow usingJetstar aircraft .................................................................. 103
Figure 28. Pollution of atmosphere ................................................... 103
Figure 29. Induction system for slot-suction BLC on NACA 35-215 test panel on B 18 wing ...... 104
FigureLFC
FigureFigureFigureFigure
30.Sketchof methodusedtoconstructpermeablesurfacesforNACA64A010airfoil..................................................................... 105
31.DESA-2airfoil modelandslot-suctioninducedvelocitydiscontinuities.............. 106
32.Sketchof Vampireporous-suctionLFCflight testaircraft......................... 10733.F-94slot-suctionLFCflight testaircraft ...................................... 10834.Sketchof supersonicslot-suctionswept-wingmodelstestedatAEDC............... 109
Figure35.Minimumdragandoptimumsuctionfor supersonicslot-suctionLFCswept-wingmodels,one-thirdturbulentflat-platedrag,andslot-suction*]at-platemodeldrag............. 109
Figure36.X-21Aflight testaircraft.(FromFowellandAntonatos1995.)..................... 110Figure37.LaminarflowachievedduringX-21Aflight testforMachnumberof 0.7,altitude
of 40000ft, andchordReynoldsnumberof 20x 106,withextendedleadingedge............ 110Figure38.Swept-wingmodel,liner,andturbulentregionsfor TPTLFCexperiment............ 111Figure39.UppersurfacetransitionboundariesforMachnumbersof 0.261to0.826,chord
Reynoldsnumberof 10x 106,andfull suction......................................... 111
Figure40.Transitionlocationasfunctionof chordwiseextentof suctionforMachnumberof 0.82andchordReynoldsnumberof 15x 106....................................... 112
Figure41.CalculatedN-factorvaluescorrelatedwithtransitionlocationandamountofchordwisesuctionextentfor TPTLFCexperimentfor Machnumberof 0.82andchordReynoldsnumberof 10x 106...................................................... 112
Figure42.Jetstarleading-edgeflighttestaircraft........................................ 113Figure43.LockheedtestarticleonJetstaraircraft........................................ 113Figure44.DouglastestarticleonJetstaraircraft......................................... 114Figure45.LaminarflowextentonDouglasperforated-suctiontestarticle.Machnumber
andaltitudeareshownfor typicalflightwithJetstar.................................... 115
Figure46.DassultFalcon50HLFCflightdemonstrator,instrtmentationpackage,glove,andleading-edgedesign......................................................... 116
Figure47.ResultsfromFalcon50HLFCflight test.Bump301)mmfromwingroot............. 117Figure48.ELFINtestrange........................................................ 117Figure49.Boeing757flight testaircraftwithHLFCtestsection;staticpressure,hot-film,
andwake-surveyinstrumentation;andattachment-lineflow tensorinstrumentation........... 118
Figure50.Samplelaminarflowextentanddragreductionob_inedonBoeing 757HLFC flight tests .............................................................. 119
Figure 51. GEAE HLFC nacelle test article flown on Airbus A300/B2 and laminar flow
obtained on test article ........................................................... 120
Figure
Figure
Figure
Figure
Figure
Figure
Figure
Figure
52. ELFIN large-scale HLFC wind tunnel investigation results from ONERA S1MA ...... 121
53. NFL and HLFC flight test article on VFW 614 aircraft ........................... 121
54. Measured pressure on nacelle test article ..................................... 122
55. A320 HLFC vertical fin program ........................................... 123
56. A320 HLFC vertical fin analysis ........................................... 124
57. A320 HLFC vertical fin wind tunnel test in ONERA S1MA ....................... 125
58. Theoretical correlation of transition location with R _ynolds number ................ 125
59. F- 16XL Ship 1 .......................................................... 126
vi
Figure 60. Laminar flow region on perforated-suction glove of F-16XL Ship 1 with and withoutsuction ........................................................................ 127
Figure 61. F-16XL Ship 2 supersonic LFC test aircraft .................................... 128
vii


Abbreviations and Symbols
ACEE
AEDC
a
BF
BLC
BMFT
CD, t
ci
cL
G
Cq
Cq, t
CERT
CF
CFD
c
DLR
DOC
ELFIN
F
FB
g
g
H
Aircraft Energy Efficiency
Arnold Engineering and Development Center
double wave amplitude, ft
block fuel
boundary-layer control
German Ministry of Research and Technology
total drag coefficient, nondimensionalized by free-stream dynamic pressure and reference
area
skin-friction coefficient
lift coefficient
pressure coefficient
suction coefficient
total suction coefficient, nondimensionalized by free-stream velocity and density and
reference area
Centre d'l_tudes et de Recherches de Toulouse
crossflow
computational fluid dynamics
chord, ft
German Aerospace Research Establishment
direct operating cost
European Laminar Flow Investigation
fuselage
fuel burn
acceleration, 32.2 ft/sec 2
gap width, ft
horizontal tail
ix
HLFC
HSCT
HSR
h
IBL
k
L/D
L.E.
LF
LFC
LTPT
M
N
N
N,
NLF
OEW
ONERA
OPEC
PSE
R
RAE
Re
Re c
Re T
Hybrid Laminar Flow Control
High-Speed Civil Transport
High-Speed Research
altitude
interacting boundary layer
roughness height
lift-to-drag ratio at cruise
leading edge
laminar flow
Laminar Flow Control
Langley Low-Turbulence Pressure Tunnel
Mach number
= fsl-_ ds"_"_0
nacelle
number of Fourier series modes in time
number of Fourier series modes in spanwise direc :ion
Natural Laminar Flow
operating empty weight
Office National d'Etudes et de Recherches Aerospatiales
Organization of Petroleum Exporting Countries
parabolized stability equations
range
Royal Aircraft Establishment
Reynolds number
chord Reynolds number
transition Reynolds number
Re0
ReO,N
ReO,T
SLDT
SLFC
s
TOGW
TPT
TS
t
U
vk
U/
u, v, w, p
U, V, W, p
U, V, W, p
V
V
Vs
VSTFE
W
x, y, Z
x/l
O_
,y
momentum-thickness Reynolds number
momentum-thickness Reynolds number at neutral stability
momentum-thickness Reynolds number at transition
Langley Supersonic Low-Disturbance Tunnel
Supersonic Laminar Flow Control
marching coordinate for N-factor determination
takeoff gross weight
Langley 8-Foot Transonic Pressure Tunnel
Tollmien-Schlichting
time
velocity
local velocity at top of roughness particle
local potential velocity
disturbance velocities and pressure
mean velocities
instantaneous velocities and pressure
airspeed
vertical tail
suction flow velocity
Variable Sweep Transition Flight Experiment
wing
Cartesian coordinate system
nondimensional length
disturbance streamwise wave number
disturbance spanwise wave number
growth rate for N-factor determination
xi
;5
0
A
v
Vk
%
02
2D
3D
Subscripts:
k
max
0
OO
boundary-layer thickness
momentum thickness
wing sweep, deg
surface wavelength, ft
kinematic viscosity
local kinematic viscosity at roughness
disturbance profile
radial coordinate
group velocity angle
disturbance frequency
two-dimensional
three-dimensional
roughness element
maximum
momentum thickness
free stream
A tilde (-) over a symbol indicates instantaneous; a b_r (-), mean; a caret (^), complex eigenfunction.
xii
Abstract
The history of Laminar Flow Control (LFC) from the 1930s through the1990s is reviewed and the current status of the technology is assessed. Early stud-
ies related to the natural laminar boundary-layer flow physics, manufacturing
tolerances for laminar flow, and insect-contamination avoidance are discussed.
Although most of this publication is about slot-, porous-, and perforated-suctionLFC concept studies in wind tunnel and flight experiments, some mention is made
of thermal LFC. Theoretical and computational tools to describe the LFC aerody-
namics are included for completeness.
1. Introduction
This overview reviews Laminar Flow Control
(LFC) research that began in the 1930s and flourished
through the early 1960s until it was de-emphasized
because of a change in national priorities. During the
1970s when the oil embargo by OPEC led to a fuel
shortage and high-cost fuel, LFC research became
important again because of the aerodynamic perfor-mance benefits it could potentially produce for com-
mercial aircraft. The next 20 years of research resulted
in numerous significant achievements in LFC through
wind tunnel and flight experiments in the United
States and Europe.
The balance of this publication presents wind tun-
nel investigations, flight research activities, and LFC
design tool methodology development in the United
States and Europe that are devoted to advancing the
state of the art and reducing the risk associated with
the application of LFC technology to subsonic, tran-
sonic, and supersonic commercial and military trans-
ports. Because this publication is a review, it
encompasses much of the nearly 60-year history ofLFC research and LFC-related research to highlight
the many basic flow physics experiments and theory
development which have enabled successful hardwaredemonstrations.
Figure 1 and tables 1 through 3 summarize the
LFC projects that are discussed in this overview and
highlight the reference, LFC information, and accom-
plishment for each project. In section 2, definitions
appropriate to LFC are presented and the numerousbenefit studies are summarized. In section 3, the manyfundamental studies which have led to the current
understanding of the flow physics, the manufacturingtolerances necessary for laminar flow, and the design
tools used to predict the extent of laminar flow
(including transition prediction methods) are dis-cussed. In section 4, issues relating to operating LFC
aircraft are reviewed, including the potential impactsof insect and ice accumulation on laminar flow extent.
From figure 1, two clear eras can be (subjectively)
identified over the history of LFC. The first era is the
early wind tunnel and flight experiments and designtool advancements in slot-, porous- and perforated-
suction systems through the mid-1960s prior to the
OPEC oil embargo, which are covered in section 5.
Although many successful LFC demonstrationsoccurred in that era, the Vietnam Conflict caused a
shift in U.S. national priorities and the demise of the
major LFC projects.
Early in the 1970s, the OPEC oil embargo caused
the United States to generate national programs which
focused on improved aerodynamic efficiencies. This
focus reenergized LFC under the NASA Aircraft
Energy Efficiency (ACEE) Program. Many of the
major natural laminar flow (NLF) and LFC projectsunder ACEE demonstrated the achievement of laminar
flow in flight. Sparked by this U.S. success in the NLF
and LFC programs, Bulgubure and Arnal (1992) notedthat laminar flow projects began in France in 1984 to
gather data that were currently not available in France.
Arrospatiale, Dassault Aviation, and a number of
research organizations (including ONERA) were
involved in the French program. Then in 1989, the
European Laminar Flow Investigation (ELFIN)
Project was initiated, consisting of four primary ele-
ments concentrating on the development of laminar
flow technology for application to commercial trans-
port aircraft. These elements were
. A transonic wind tunnel evaluation of the
hybrid laminar flow control (HLFC) concept
on a large-scale model

. The development of a boundary-layer suction
device and the development of new wind tunnel
and flight test techniques for LFC
LFC ar_ discussed by summarizing numerous benefitstudies
. The development of improved computational
methods for laminar-to-turbulent flow predic-
tion capability
4. A partial-span flight demonstration of natural
laminar flow (Birch 1992)
According to Mecham (1992), the project team con-
sisted of 24 organizations, including Deutsche Airbus
(project leader), Arrospatiale, Alenia, British Aero-
space, CASA, Dassault Aviation, Domier, Fokker,
Saab, several smaller companies, six national aeronau-
tical research institutes, and nine universities. Among
these institutes and universities were ONERA, CIRA
INTA, DLR, and the Universities of Manchester,
Bristol, Galway, Lisbon, Lyngby, Darmstadt, Delft,
Madrid, and Zaragoza. Section 6 summarizes the
major U.S. and European LFC programs for the time
frame beginning with the OPEC oil embargo.
This overview publication attests to the enormous
amount of research pertaining to NLF and LFC in theliterature. Additional discussions of LFC can be found
in Harris and Hefner (1987), Wagner et al. (1988),Wagner et al. (1992), and Hefner (1992). A few bibli-
ographies of LFC are available by Bushnell and Tuttle
(1979), Tuttle and Maddalon (1982, 1993), and
Kopkin and Rife (1977). Holmes and Obara (1992)
and Holmes, Obara, and Yip (1984) review and focus
on NLF flight research; Somers (1992) and Pfenningerand Vemuru (1992) discuss laminar flow airfoils;
Wagner, Maddalon, and Fischer (1984); and Braslowand Fischer (1985) discuss the overall status of LFC.
Finally, refer to Research in Natural Laminar Flow
and Laminar-Flow Control (NASA CP-2387, 1987)and First European Forum on Laminar Flow Technol-
ogy (DGLR-Bericht 92-06, 1992) for a selection of
papers presented during those workshops. More
recently, the second European forum on LFCoccurred.
2. Background
In the following sections, the definition of NLF,
LFC, and HLFC are outlined and the benefits of using
2.1. Definition of LFC
LFC is an active boundary-layer flow control
(usually suction) technique employed to maintain the
laminar state at chord Reynolds numbers beyond that
which is normally characterized as being transitional
or turbulent in the absence of control. Understanding
this definition is an important first step toward under-
standing the goals of the technology. Often, a reader
mistakenly assumes that LFC implies the relaminar-ization of a turbulent flow state. These are two differ-
ent flow physics phenomena; although the same
control system may be employed for both problems,the energy requirements for relaminarization could
typically be an order of magnitude greater than that
required for LFC. Finally, LFC is a capability that is
designed to benefit an aircraft during cruise by reduc-ing the drag.
An alternate concept of drag reduction is referred
to as "natural laminar flow (NLF)." NLF employs a
favorable pressure gradient to delay the transition pro-
cess. Inherent in practical NLF wings is low sweep
and aircraft of small to moderate size. As the wing isswept, _erodynamic performance benefits are realized
for hig a-speed aircraft; however, the now three-dimensional (3D) flow field becomes vulnerable to a
boundary-layer instability termed "crossflow vortex
instability" (discussed in section 3). This instability
causes the NLF design to become ineffective and the
boundary-layer state to become turbulent very near the
wing le_ding edge. For nacelles, the application of the
NLF de dgn has been shown to produce unacceptablelow-spe._d performance; however, some modem NLF
nacelles have overcome earlier design deficiencies. An
active system is usually required to prevent these
boundary-layer instabilities from causing the laminarflow to become turbulent.
A significant advancement made in the develop-
ment ot LFC technology is the concept of Hybrid
Laminar Flow Control (HLFC). Shown in figure 2,HLFC integrates the concepts of NLF with LFC to
reduce suction requirements and reduce system com-
plexity. LFC is complex, involving suction (and ducts,
flutes, and pump source) over the whole-wing chord
2
(orenginenacelleor tail section).ThekeyfeaturesofHLFCare
1. Suctionis requiredonly in the leading-edgeregionaheadof thefrontspar
2. NLF is maintainedover the wing throughpropertailoringof thegeometry(pressure)
3. TheHLFCwingdesignhasgoodperformancein theturbulentmode
Theseconceptsintegratedin figure2with theKruegerflap (for high lift and ice andinsect-contaminationprevention)showonepotentialpracticalapplicationofHLFConawing.
2.2. Benefits of LFC
The benefits of LFC are configuration dependent;
change with time because of changes in fuel cost,
system cost, manufacturing technology efficiency
improvements; and are closely linked to the amount oflaminar flow and a host of other variables (including
the weight of a passenger for the overall payloadweight). Throughout the history of LFC, numerousbenefit studies have been carried out on a host of con-
figurations. The outcome of these studies is described
in this section along with a discussion of the impact offuel cost on LFC benefit.
Antonatos (1966) presented a review of the con-
cepts and applications of LFC, beginning with therealization that skin friction drag could amount to
approximately 75 percent of the total drag for an air-craft. Shown in figure 3, Thibert, Reneaux, and
Schmitt (1990) attributed friction drag to approxi-
mately 45 percent of the total drag. Because laminar
skin friction can be as much as 90 percent less than
turbulent skin friction at the same Reynolds number,
laminar flow would obviously be more desirable than
turbulent flow for reducing the drag of aerodynamic
vehicles (except in recovery regions where a severe
pressure drag penalty can occur because of boundary-
layer separation). A vehicle with laminar flow wouldhave much less skin friction drag than a vehicle with
turbulent flow. An example of the benefits of laminar
flow are shown in figure 4 for a subsonic business jet
(Holmes et al. 1985). Unfortunately, achieving lami-nar flow over the entire configuration is impractical
because of the sensitivity of the laminar flow to exter-nal and vehicle disturbances (e.g., panel-panel joints,
fasteners, access doors). However, drag reduction due
to laminar flow over select portions of a vehicle is
achievable. For an aircraft, the wings, engine nacelles,
fuselage nose, and horizontal and vertical tail are can-
didates for achieving laminar flow. Although the sum-mation of these individual drag reductions would
indicate a benefit due to laminar flow (fig. 4), the max-
imum or optimal benefits of LFC are achieved by
resizing the vehicle utilizing the benefits of laminarflow. Thus LFC could yield reductions in takeoff
gross weight (TOGW), operating empty weight(OEW), and block fuel (BF) for a given mission, and
significant improvements in cruise lift-to-drag ratio(L/D). Associated benefits may include reductions in
both emissions (pollution) and noise and smaller
engine requirements.
Lachmann (1961) discussed the design and opera-
tional economies of low-drag aircraft, including LFC.
This presentation was one of the few that listed the
equations and assumptions of the equations that led to
projected performance. Lachmann noted that the bene-fits of laminar flow obtained by LFC increased withthe size of the candidate aircraft, with benefits maxi-
mized for an all-wing aircraft. Also, if 39 percent of
the aircraft fuselage could be laminarized for a typicaltrans-Atlantic airline, Lachmann (1961) predicted a
10-percent increase in L/D.
Chuprun and Cahill (1966) discussed the perfor-
mance improvements of aircraft with LFC technologyfrom the systems perspective and noted that the impact
of any technology must involve the integrated result of
aerodynamics, structures, propulsion, cost, risk, reli-
ability, schedules (operations), and the sensitivity of
the proposed concept to the design goals. This inte-
grated result heavily determines the cost-effectiveness
of the design concept and whether the technology will
be implemented on the candidate aircraft. When com-
pared with the turbulent baseline aircraft, the impor-
tant improvement to the aircraft because of LFCwould be an increase in L/D. The amount of improve-
ment would depend on the amount of laminar flowachieved for a given surface geometry and flight con-
dition and the structural weight penalties incurred by
the addition of the pumping system. At a minimum,
the benefits of the LFC technology must overcome the
penalties incurred by such a system. The effect of the

LFC weightpenaltieson therangeof anaircraftis afunctionof theratioof fuelweightto grossweight.LFCweightpenaltieshavelesseffectonrangefor air-craftwithhighratiosof fuelto grossweight.Finally,theperformancebenefitsof LFCona modifiedC-5Atransportaircraftwerecomparedwith theC-5A base-
line; this comparison yielded range increases for con-
stant payload and payload increases with constant
range for the LFC version of the aircraft (quantified in
figs. 5 and 6). Clearly, the benefits of LFC became
pronounced compared with the turbulent baseline
for long-range medium payload aircraft, with 20 to
25 percent improvement in range on the LFC aircraft.Carefully noted by Chuprun and Cahill (1966), the
1966 development, production, and operation costs
were projected to be 10 to 20 percent higher for theLFC aircraft compared with the turbulent baselineaircraft.
Pfenninger (1987) explored an unconventional
long-range LFC transport concept. Using large-span,
large-a:¢pect-ratio, strut-braced wings, a cruise L/D of39.4 was estimated with laminar flow assumed on the
wings, nacelles, tail, and struts. Such an aircraft would
carry 50000 kg of payload (or 250 passengers +cargo) and cruise at a Mach number of 0.83. Weak
suction was positioned from 5 to 30 percent chord andit was predicted to achieve laminar flow on about
70 percent chord on the upper surface of the wing(HLFC I.
As illustrated in figure 5, Kirchner (1987) showed
that the benefits of LFC (HLFC and NLF) increased
with the increased size and range of the candidate air-
plane. This figure indicates that the benefits of LFC on
a long-range subsonic transport could lead to signifi-
cant fuel savings.
By noting that LFC benefits increase with
increased aircraft range, Goethert (1966) demonstrated
the performance benefit by example. A long-range air-
craft designed to carry a payload of 150000 lb some
5000 n.mi. could carry the same payload 6250 n.mi.
by employing LFC technology, or the LFC aircraft
would be able to carry a reduced payload of 100 000 lbsome 8000 n.mi.
Later, Sturgeon et al. (1976) performed a systems
study to determine the benefits of LFC on long-range
subsonic transports. Based on a range of 5500 n.mi.
and payloads of 200 (52400 lb) and 400 (104 800 lb)
passengers, the LFC transport would improve fuel
efficiency by 39.4 percent over advanced technology
turbulent aircraft; therefore fuel consumption would
be reduced by 28.2 percent and operating costs by8.4 percent.
Pearce (1982) presented the benefits of a LFC
subsonic transport compared with an advanced com-
parable turbulent configuration. The benefits of usingLFC were shown to be consistent with the results
already cited; however, unlike many of the studies,
Pearce showed the significance of both laminar flow
extent (i.e., transition location on the wing) and fuel
cost. For example, a rise in fuel cost from 45 cents to
1 dollar would cause direct operating cost (DOC) to be
increased from 3 to 8 percent with LFC compared with
the turbulent configuration.
Clark, Lange, and Wagner (1990) reported the
benefits of LFC for advanced military transport
aircraft. Based on a 132 500-1b payload transported6500 n.mi. at a Mach number of 0.77, the LFC trans-
port would lead to reductions in TOGW of 4 to 7 per-
cent, fuel weight of 13.4 to 17 percent, and thrust of
10.6 to 13 percent and an increase in cruise L/D of
18.4 to 19.2 percent compared with the turbulent base-
line cor_figuration. The lower and higher values corre-
sponded to low-wing and high-wing HLFC
configurations, respectively.
Arcara, Bartlett, and McCullers (1991) performeda LFC _enefit study for an advanced subsonic, twin-
engine commercial transport with projected 1995
engine, structure, and aerodynamic technologyimprovt;ments into a HLFC. With laminar flow
assumext on 50 percent chord on the upper wing sur-
faces and horizontal and vertical tails and 40 percent
on the engine nacelles, figure 6 shows reductions in
TOGW of 9.9 percent, OEW of 5.7 percent, and BF of
18.2 pe.:cent. Additionally, an increase in cruise L/D
of 14.7 percent was achieved compared with that of
the turbulent baseline. The figure shows the very
important location of the suction and resulting laminar
flow extent. The analysis included conservative esti-
mates of the HLFC system weight and engine bleed air
(to drive the suction device) requirements. Satisfaction
of all operational and Federal Aviation Regulations
(FAR) requirements, such as fuel reserves and
balancedfieldlength,wasachieved.A briefsectionontheimpactof fuelcostonthebenefitswasincludedintheanalysis.Fuelat65centspergallonhada reduc-tionin DOCof 5.8percentasaresultof HLFCcom-paredwith fuel at 2 dollarsper gallon havingareductioninDOCof 8.8percent.
Robert(1992a)discussedthepotentialbenefitsofHLFCappliedto theAirbusA320andA340classofsubsonictransports.Thestudysoughttodetermine
1.Differencesfor short-or long-haulaircraft
2.Whatsizeaircraftshouldbelaminarized
3.Wherelaminarizationisadvantageous
4.Whatfuelreductioncouldbeachieved
FortheA320witharangeof 500n.mi.,cruiserepre-sentedonly35percentof thetotalFB,whereasfortheA340with a rangeof 3000n.mi.,cruiserepresented80percentof thetotalFB. BecauseLFCis acruisetechnology,theA340 wouldbenefitmorefrom theapplicationof LFC thantheA320.If HLFCis usedover the first 15 to 20 percentchordfor the largerA340 classaircraft,a projecteddragreductionof14percentcouldbeobtainedby usinglaminarflowconceptsonthewing,horizontaltail,verticaltail,andnacelles.TheA320andA340studiesindicatedthat60percentof the performancegaincamefrom theuppersurfaceof thewingand30percentcamefromthelowersurfaceof thewing.Robertnotedthattherewasnopointin laminarizingthelowersurfacebecausethe costs of incorporatingaccessdoors and theKruegerflapwithinlaminarflow tolerancesoffsettheadvantagesofdragreductiononthelowersurface.Fortheissueof DOC,if a 2.8-percentincreasein thecostof maintenanceis assumed,the DOC would bereducedby0.8percentfor a3000-n.mi.cruiseandFBby5percent.Thebenefitsincreasedwithfuelcostandaircraftmission.Finally, Robertsummarizedthat along-rangetechnicalprogramcouldbeestablishedtoenableAirbusIndustrieto offera futureaircraftwithlaminarwings.This plan hasbeenpursuedin the1990swithwindtunnel tests, flight tests, fundamental
concept studies, and with advanced design tool devel-
opment. (See section 6.)
Supersonic laminar flow control (SLFC) impliesthat the test vehicle flies at supersonic Mach numbers
and that either LFC or HLFC is employed on the
vehicle. Feasibility studies by Boeing Commercial
Airplane Company (Parikh and Nagel 1990) and
McDonnell Douglas Corporation (Poweil, Agrawal,
and Lacey 1989) were conducted to determine thebenefits of SLFC applied to the HSCT configuration.
The Boeing configuration was designed to cruise ata Mach number of 2.4 and carry 247 passengers
(745 000 lb TOGW) 5000 and 6500 n.mi. The inboard
wing was a modified airfoil from the NACA65A-series and had a sweep of 75 ° (normal Mach
number of 0.62 at cruise), whereas the outboard por-
tion of the wing had a sharp supersonic leading edge
with 47 ° of sweep (normal Mach number of 1.64 atcruise). The SLFC feasibility study estimated benefits
to be reductions in TOGW of 8.5 percent, in OEW of
6.2 percent, and in FB of 12 percent. These numberstook into account the estimated 8500-1b suction-
system weight penalty. The benefits were greater foran aircraft resized for a range of 6500 n.mi. and are
shown in figure 7. With laminar flow covering 40 per-
cent of the wing wetted area, reductions in TOGW,OEW, and FB of 12.6, 9.8, and 16.0 percent, respec-
tively, were projected when compared with the turbu-lent version of the supersonic aircraft for a range of6500 n.mi. Based on a TOGW of 750 000 lb for the
turbulent baseline HSCT aircraft, the projected reduc-
tion in TOGW for the laminar aircraft is roughly
equivalent to the payload fraction of the aircraft OEW.
The McDonnell Douglas configuration was
designed to cruise at a Mach number of 2.2 and carry
308 passengers (750000 lb TOGW) 5750 n.mi. The
wing was a cranked arrow wing with most of the
sweep at 71 o and the outboard 30 percent span of the
wing swept 61.5 °. The SLFC feasibility study for
application to the HSCT found reductions in TOGW
of 8 percent and FB of 15 percent and an increase incruise L/D of 15 percent. Whereas the Boeing concept
employed a leading-edge suction strip and a second
spanwise suction strip at about 40 percent chord, theMcDonnell Douglas concept had large leading-edgesuction and a continuous low level of suction back to
the control surfaces.
Based on limited supersonic data, Kirchner (1987)
showed in our figure 8 that an increase of 10 to
30percentin L/D is expected by using SLFC on the
supersonic high-speed civil transport. Pfenninger and
Vemuru (1988) presented a strut-braced, highly sweptwing SLFC long-range transport design which was
capable of acquiring values of L/D of 19 to 27 at aMach number of 2 and 16 to 22 at a Mach numberof 2.5.
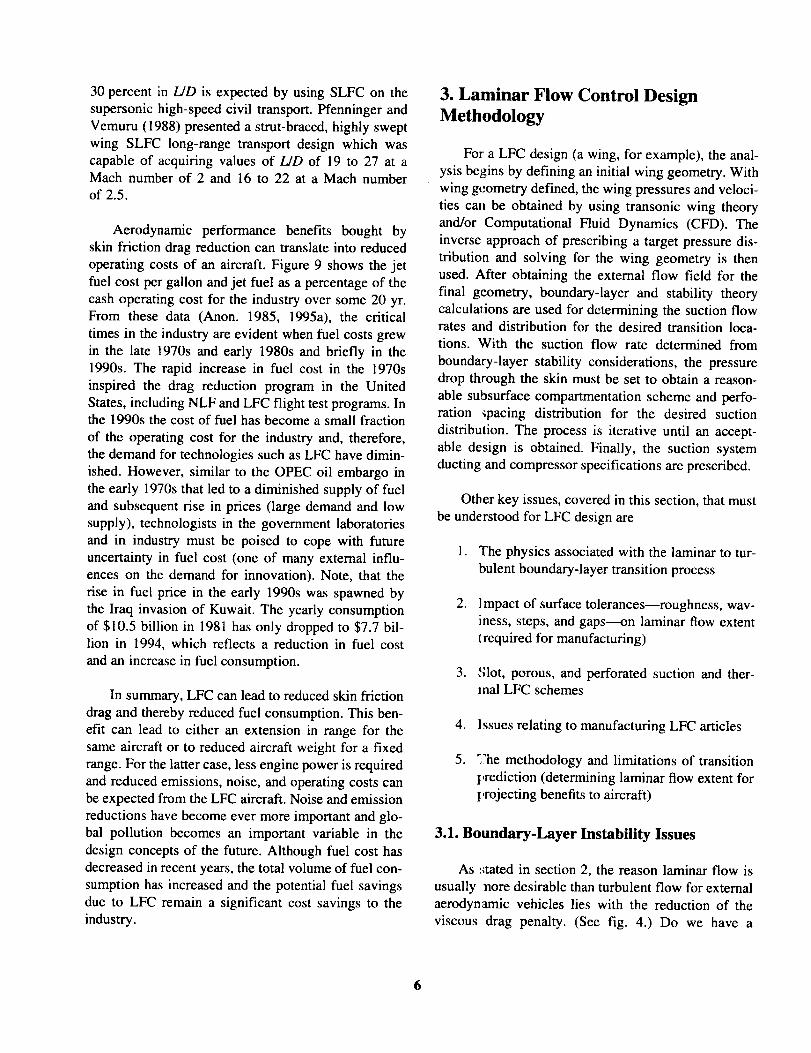
Aerodynamic performance benefits bought by
skin friction drag reduction can translate into reduced
operating costs of an aircraft. Figure 9 shows the jetfuel cost per gallon and jet fuel as a percentage of the
cash operating cost for the industry over some 20 yr.
From these data (Anon. 1985, 1995a), the critical
times in the industry are evident when fuel costs grewin the late 1970s and early 1980s and briefly in the
1990s. The rapid increase in fuel cost in the 1970s
inspired the drag reduction program in the United
States, including NLF and LFC flight test programs. Inthe 1990s the cost of fuel has become a small fraction
of the operating cost for the industry and, therefore,
the demand for technologies such as LFC have dimin-
ished. However, similar to the OPEC oil embargo in
the early 1970s that led to a diminished supply of fuel
and subsequent rise in prices (large demand and low
supply), technologists in the government laboratories
and in industry must be poised to cope with future
uncertainty in fuel cost (one of many external influ-ences on the demand for innovation). Note, that the
rise in fuel price in the early 1990s was spawned by
the Iraq invasion of Kuwait. The yearly consumptionof $10.5 billion in 1981 has only dropped to $7.7 bil-lion in 1994, which reflects a reduction in fuel cost
and an increase in fuel consumption.
In summary, LFC can lead to reduced skin friction
drag and thereby reduced fuel consumption. This ben-
efit can lead to either an extension in range for the
same aircraft or to reduced aircraft weight for a fixed
range. For the latter case, less engine power is required
and reduced emissions, noise, and operating costs canbe expected from the LFC aircraft. Noise and emission
reductions have become ever more important and glo-bal pollution becomes an important variable in the
design concepts of the future. Although fuel cost hasdecreased in recent years, the total volume of fuel con-
sumption has increased and the potential fuel savings
due to LFC remain a significant cost savings to theindustry.
3. Laminar Flow Control Design
Methodology
For a LFC design (a wing, for example), the anal-
ysis begins by defining an initial wing geometry. With
wing geometry defined, the wing pressures and veloci-
ties can be obtained by using transonic wing theory
and/or Computational Fluid Dynamics (CFD). The
inverse approach of prescribing a target pressure dis-
tribution and solving for the wing geometry is then
used. After obtaining the external flow field for the
final geometry, boundary-layer and stability theory
calculations are used for determining the suction flowrates and distribution for the desired transition loca-
tions. With the suction flow rate determined from
boundary-layer stability considerations, the pressuredrop through the skin must be set to obtain a reason-
able subsurface compartmentation scheme and perfo-
ration spacing distribution for the desired suction
distribution. The process is iterative until an accept-
able design is obtained. Finally, the suction system
ducting and compressor specifications are prescribed.
Other key issues, covered in this section, that must
be understood for LFC design are
1. The physics associated with the laminar to tur-
bulent boundary-layer transition process
. Impact of surface tolerances--roughness, wav-
iness, steps, and gaps----on laminar flow extent
Irequired for manufacturing)
3. ,';lot, porous, and perforated suction and ther-mal LFC schemes
4. Issues relating to manufacturing LFC articles
. _'he methodology and limitations of transition
t,rediction (determining laminar flow extent fort,rojecting benefits to aircraft)
3.1. Boundary-Layer Instability Issues
As :_tated in section 2, the reason laminar flow is
usually nore desirable than turbulent flow for external
aerodynamic vehicles lies with the reduction of the
viscous drag penalty. (See fig. 4.) Do we have a
sufficientunderstandingof the fundamentalflowphysicsfor theproblemto designanoptimal,reliable,cost-effectivesystemto controltheflow?Theanswerisencouraging!
The first major theoreticalcontributionsto thestudyof boundary-layer transition were made byHelmholtz (1868), Kelvin (1880), Reynolds (1883),
and Rayleigh (1879, 1880, 1887). Although these
early investigations neglected the effects of viscosity,the second derivative of the mean velocity proved to
be of key importance in explaining boundary-layerinstabilities. These fundamental studies proved to be
the basis for future breakthroughs in theoretical devel-
opment, including inviscid jet-flow instabilities and
shear-layer instabilities. Adding viscous effects, Orr
(1907) and Sommerfeld (1908) developed an ordinary
differential equation (Orr-Sommerfeld equation) that
governs the linear instability of two-dimensional dis-turbances in incompressible boundary-layer flow on
flat plates. Later, Squire (1933) accounted for three-dimensional waves by introducing a transformation
from three to two dimensions. This analysis showedthat two-dimensional waves were dominant in flat-
plate boundary layers. Tollmien (1929) and
Schlichting (1932) discovered convective traveling-wave instabilities (fig. 10) now termed Tollmien-
Schlichting (TS) instabilities, and Liepmann (1943)and Schubauer and Skramstad (1947) experimentally
confirmed the existence and amplification of these TS
instabilities in the boundary layer. One can visualize
this disturbance by remembering the image of water
waves created by dropping a pebble into a still lake or
puddle. In this image, the waves which are generateddecay as they travel from the source. Such is the case
in boundary-layer flow, except that the waves will
grow in strength when certain critical flow parameters
(say Reynolds number) are reached and lead to turbu-lent flow.
Taylor-Grrtler vortex disturbances arise when the
surface geometry becomes concave and are reminis-cent of counterrotating vortices. A sketch of thisvortex-disturbance structure is shown in figure 11.
The design engineer would have to be sensitive to this
disturbance only if there is concave curvature such as
on the lower surface of some wings; otherwise, this
disturbance is not too significant for LFC applications.
See Smith (1955), Wortmann (1969), and Hall (1983)for more detailed discussions of Taylor-Grrtler
disturbances.
In addition to transition dominated by TS distur-
bance, a dynamic instability, termed the crossflow
(CF) disturbance, is an important factor in the extentof laminar flow realized. The presence of TS and CF
disturbances in the boundary-layer flow is dependent
on the pressure gradient and on the wing sweep angle.
As shown by Gray (1952), Anscombe and Illingworth
(1956), and Boltz, Kenyon, and Allen (1960) for
swept wings and by Gregory, Stuart, and Walker
(1955) and Reilly and Pfenninger (1955) for rotating-disk flow, CF disturbances are characterized by coro-
tating vortices (sketched in fig. 12). For example,
Anscombe and Illingworth (1956) used a symmetricairfoil with a 4-ft chord in a wind tunnel experiment to
study the flow on the wing swept from 0 ° to 50 °. The
results showed that at angles above 25 ° to 30 °, a criti-
cal speed could be found which led to "striations" inthe surface flow visualization with transition between
50 and 60 percent chord. As the speed of the freestream increased, the transition moved forward. This
effect of sweep and Reynolds number on transition is
shown in figure 13 (Anscombe and Illingworth 1956).
The figure serves to provide a visual qualitative influ-
ence of wing sweep. They further noted that as thetransition front moved forward, the laminar boundary
layer became more sensitive to surface conditions andthe number of turbulent wedges increased. This sensi-
tivity was a unit Reynolds number influence; whereby
the critical height of a roughness element affectingtransition decreased with increase in unit Reynolds
number (discussed in section 3.2).
At the same time, Gray (1952) investigated the
effect of wing sweep in flight using the ArmstrongWhitworth AW.52 aircraft. Visualization was
achieved through sublimation, or liquid evaporation
from china clay techniques. Most of the results are for
sweep angles of 25 ° to 50 °, chord locations from 3 to
17 ft, and speeds from 50 to 500 knots at an altitude of
40 000 ft. Additionally, a Meteor Fin with 25 ° sweep,a Sabre F.86 with 39 ° wing sweep, an Avro 707A
Delta, and a Hawker P1052 were also tested. Gray
(1952) concluded that the leading-edge radius was adirect measure of the limit of laminar flow for all mod-
em flight speeds for sweep angles more than 20 ° or25 ° . The amount of laminar flow decreases with
increased leading-edge radius. Similar to the results
presented by Anscombe and Illingworth (1956), theresults of Gray (1952) showed that for a given sweep
angle, laminar flow was lost as the speed is increased
to a critical speed. Since those early experiments,
7
numerousflight experimentshaveshownthatnaturaltransitionmovesforwardonthewingwith increaseinwingsweep.Flightandwindtunnelmeasurementsoftransitionlocationwith wingsweepareshownin fig-ure14(Wagneretal. 1992).
Becausea favorablepressuregradient leadsto decreasedTS-disturbancegrowth and increased
CF-disturbance growth (Arnal 1992, for example), the
NLF wing design engineer would seek to optimize the
pressure distribution and sweep for prescribedReynolds number and Mach number such that the
pressure gradient causes the minimum growth of boththe TS and the CF disturbances over the chord of the
wing (or nacelle, etc.). For large sweep angles, LFC or
HLFC suction is used in the leading-edge region to
suppress the normally rapid growth of the CF
disturbances, and then the pressure on the wing
surface is tailored to minimize the growth of alldisturbances.
In addition to TS and CF disturbances which lead
to transition over the wing chord, attachment-line
instabilities are possible and can be correlated for nat-
ural transition in the linear limit with the Reynoldsnumber of the flow. If transition were to occur at some
location on the attachment line, the outboard portion
of the whole wing would have turbulent flow. Clearly,this can be understood by viewing the illustration in
figure 15 (from Wentz, Ahmed, and Nyenhuis 1985)
for the attachment-line region of a swept wing. Turbu-
lence (or attachment-line contamination) from the
fuselage boundary-layer flow can sweep out onto the
attachment line and cause the entire wing to beengulfed in turbulent flow. However, a turbulence
diverter such as Gaster's bump (Gaster 1965) can be
effectively used to establish a laminar attachment line;
this allows the potential for continued laminar flow onthe attachment line. Some methods which can be used
to prevent turbulent attachment-line contamination are
illustrated in figure 16 (from Maddalon and Braslow
1990). For LFC or HLFC, strong suction can also be
used at the fuselage-wing juncture to relaminarize theflow, and mild suction can be used thereafter on the
leading edge to maintain laminar flow.
Transition along the attachment line can be pre-
vented by designing the attachment-line Reynoldsnumber not to exceed some critical value. This was
drawn out in experiments by Gaster (1967), where
small-amplitude disturbances were acoustically
excited along the attachment line of a swept cylindermodel. Gaster generated sine waves with various fre-
quenck-s that were detected in the flow by a hot-filmgauge on the attachment line. He noted that the
recorded oscillations had preferred frequency bandsthat changed with tunnel speed and that this behavior
was reminiscent of traveling-wave instabilities. Fromhis measurements, he concluded that the small-
amplitude disturbances in an attachment-line bound-
ary layer were stable for momentum-thickness
Reynolds numbers Re 0 below 170. Later, Cumpstyand Head (1969) experimentally studied large-
amplitude disturbances and turbulent flow along theattachment line of a swept-wing model. Without artifi-
cially tripping the boundary-layer instabilities, theyobserved that laminar flow was stable to small-
amplitude disturbances up to Re 0 = 245 (which corre-sponds to the top speed of the tunnel). At the same
time, Plenninger and Bacon (1969) used a wing sweepof 45 ° to study the attachment-line instabilities in a
wind tunnel capable of reaching speeds sufficient to
obtain :rustable disturbances. With hot wires, they
observed regular sinusoidal oscillations with frequen-cies c_mparable with the most unstable two-
dimensional modes of theory; these modes caused
transition to occur at about Re 0 = 240. A continuedinterest in the transition initiated near the attachment
line of swept wings led Poll (1979, 1980) to perform
additional experiments with the swept circular model
of Cumpsty and Head (1969). Like Pfenninger and
Bacon (1969), Poll observed disturbances that ampli-fied along the attachment line. He noted that no unsta-
ble modes were observed below Re 0 = 230.
Accounting for all linear terms and using aneigenva_ue-problem approach, Hall, Malik, and Poll
(1984) .'tudied the linear stability of the attachment-
line boundary-layer flow called swept Hiemenz flow.
This tbaee-dimensional base flow was a similaritysolution of the Navier-Stokes equations; hence, its use
is advantageous in stability analyses. With a nonparal-
lel theory, Hall, Malik, and Poll (1984) determined
neutral :urves with and without steady suction andblowing and demonstrated that the attachment-line
boundar¢ layer can theoretically be stabilized withsmall amounts of suction. The linear results were
shown to be in good agreement with direct numerical
simulations of Spalart (1989), Theofilis (1993), andJoslin (1995, 1996).
8
Basedonthesetheoreticalandexperimentalstud-ies, the critical Reynoldsnumberfor the two-dimensionallinear instabilityof subsonicflows isRe0= 245.Additionalunderstandingoftheinstabilityof theattachment-lineflow to three-dimensionaldis-turbancesmustbe gainedto formulatetheoriesofdesignandimplementdevicesto preventinstabilitygrowth.
In studying leading-edge contamination,Pfenninger (1965) discovered through flight experi-ments that laminar flow could be obtained for
Re 0 < 100 but leading-edge contamination occurredfor Re 0 > 100. Gregory and Love (1965) found that
complete turbulence occurred for Re 0 > 95 in theirwind tunnel experiments on a swept airfoil. Flight
experiments by Gaster (1967) showed that turbulent
spots were first observed for Re 0 > 88. Cumpsty andHead (1969) and later Poll (1985) used a swept model
in a wind tunnel to show that turbulence was damped
for Re 0 < 99 and the leading edge was fully turbulent
for Re 0 > 114. Arnal, Juillen, and Casalis (1992) useda swept-wing model in a wind tunnel to show that
leading-edge contamination was observed at
Re 0-- 101 +4. Using the Jetstar LFC flight test air-craft, Maddalon et al. (1989) indicated that turbulentcontamination caused transition on the attachment line
of the test article for Re 0 > 94. Hence, for Re 0 < 100disturbances are damped, and for Re 0 > 100 the flow
becomes turbulent. Between Re 0 = 100 and the linear
critical Re 0 care must be taken so that the flow is nottripped. Wind tunnel experiments by Carlson (1964)indicated that the Reynolds number based on
boundary-layer momentum thickness at the front of
the attachment line should be Re 0 < 150 for very
small disturbances and Re 0 < 100 for large distur-bances. As many flight experiments have shown,
maintaining NLF on the attachment line is possible,
and the momentum-thickness Reynolds number can be
lowered by reducing the leading-edge radius or unit
Reynolds number. Decreasing the leading-edge radiushas the compounded benefit of decreasing the chord-
wise extent of the crossflow region and providing a
more rapid acceleration of the flow over the wing.
Additionally, a turbulent wedge, originating at the
fuselage-wing-leading-edge juncture, can sweep out
over a portion of the wing root region and is a concern
for NLF and LFC wing design. Clearly, one would
attempt to optimize the fuselage-wing juncture point
to cause this wedge to cling to the fuselage as much as
possible; thereby, laminar flow would occur in a
region close to the fuselage. The author knows of nostudy which has investigated the potential instability
of the interface between a turbulent wedge and lami-
nar flow over a wing; however, Hilton (1955) has used
the concept of tailoring the streamlines to the fuselage
to obtain a drag reduction.
In summary, for wing sweeps from 0 ° to 10°, TS
disturbances amplify and cause natural transition. If
the design pressure gradient is favorable (accelerating
flow), longer runs of laminar flow can be realized
because the TS-disturbance growth rate is suppressed,
whereas the opposite is true with an adverse pressure
gradient. Wing design should minimize the growth of
these disturbances to enable long runs of laminar flow.
Between wing sweep angles of 10° and 30 °, both TS
and CF disturbances are present, amplify, and cause
transition; much of the flow physics associated withthe nonlinear interaction of these modes is unknown.
For wings swept greater than 30 °, CF disturbances
dominate, amplify, and cause transition--often very
near the leading edge of the wing. Hence, LFC is
required to achieve laminar flow on highly swept
wings. Also, the leading-edge radius affects the stabil-
ity limits of flow along the attachment line, withincreased leading-edge radius being destabilizing tothe flow.
3.2. Surface Tolerances for Laminar Flow
Roughness, waviness, steps, and gaps are issues
related to manufacturing tolerances. Joints, rivets,
screw heads, and panel joints contribute to the
roughness-steps-gaps issue, and stiffness of the skin
with imposed loads and overall manufactured skinsmoothness are ingredients in the waviness issue.
Since the early days of filling, sanding, and smoothingof test articles, the present day standard production-
quality manufacturing techniques have enabled thewaviness issue to be surmountable. A thorough review
of the manufacturing tolerance issue is described by
Carmichael (1979) and Holmes et al. (1985).
In the First Wright Brothers' Lecture (in honor of
the famous aeronautical pioneers Wilbur and Orville
Wright) held at Columbia University, New York, onDecember 17, 1937, B. Melvill Jones presented
an overview of flight test experiments conducted
9
(mainly)at CambridgeUniversityin England. Jones(1938) stated that the main conclusions from those
flight experiments were
. Drag predictions for moderately thick wing
shapes can be made based on smooth flat-plate
skin friction data if the transition points were
known for the wing
. Laminar flow could be maintained up to
30 percent chord (with drag reductions of 30 to
35 percent) for chord Reynolds numbers of5 x 106 to 10 × 106
3. Small roughness and waviness moved transi-
tion points forward (increased drag)
The flight and wind tunnel tests have provided our
current understanding of the mechanisms which cause
transition to move forward because of surface imper-
fections. The impact of a surface imperfection (such asa rivet head) on the transition location can be viewed
either by looking at the transition location as a func-
tion of imperfection size for a fixed unit Reynolds
number or by keeping the size of the imperfection
fixed and looking at transition location as a function of
unit Reynolds number. The illustration in figure 17
(Holmes et al. 1985) depicts the latter case, where the
amount of laminar flow is decreased as Reynolds
number is increased. The problem is then to determinewhat roughness height and shape for a given Reynoldsnumber will cause a reduction in the amount of lami-
nar flow obtainable. In either case, the imperfection
stimulates eigenmodes in the boundary layer; the lin-
ear stability of the flow dictates whether these modes
will grow or decay as they evolve in the flow. How-
ever, as the height of the imperfection or unit
Reynolds number increases, a point is reached when
flow separation occurs because of the surface imper-
fection. At this point, inviscid instability arising from
the inflectional velocity profile can grow and induce
transition. Or if the imperfection is sufficiently large,
linear instability amplification is "bypassed" and tran-
sition follows by way of a nonlinear process. Our cur-
rent understanding of imperfections suggests that
larger critical step heights can be realized with
rounded steps because a reduced region of separation
and reduced inflectional instability growth are encoun-
tered in the experiments.
In experiments to examine transition in flight,
Stephens and Haslam (1938) used a Hart K1442 air-
craft which had a 2D wing test section and a Snark
L6103 aircraft which had a mildly swept-wing test
section. Among the reported results, spanwise ridges
of height 0.002 in. caused transition to move forwardat chord Reynolds numbers of 5 × 10⁶ and more; the
databas,_ did not provide sufficient information for
transition prediction (or correlation).
Surface roughness flight experiments described by
Bicknell (1939) were conducted on a Northrop A- 17A
single-engine attack airplane. The focus of the study
was to characterize the impact of conventional
manufacturer-induced roughness and gaps (rivets, lap
joints, access panels, and hinges) on drag. The results
for a standard wing were compared with a smoothwing at a chord Reynolds number up to 15 x 106. The
wing was made smooth by filling lap joints and
cementing pieces of rubber sheeting to build up theareas of rivet protuberance. The results show that a
50-percent increase in the profile-drag coefficient was
obtained with the rough wing compared with thesmoother wing.
At the Royal Aircraft Establishment (RAE) in
England, Young, Serby, and Morris (1939) reported
on the impact of camouflage paint, snap rivets, flush
rivets, lap joints, and leading-edge slats on wing drag
of the p,ototype Battle. The Battle had wings with low
sweep, with each wing containing three bomb doors
on the t nderside of the wings (reason for joint study).
The tesls were conducted by fitting specially prepared
skins over portions of the wings (approximately,
NACA 2417 airfoils). The range of chord Reynoldsnumber was 12 × 106 to 18 × 106 with approximate
unit Reynolds numbers per foot of 1.2 x 10⁶ to
1.8 × If -6. Both the drag due to the variation of transi-
tion location (due to protuberance) and drag due to theprotube'ance itself were measured in the course of the
flight test. For the Reynolds number per foot of
1.8 × 1C_6,transition was forced upstream of the protu-
berance of interest. In brief, the conclusions of this
flight te_t were
. Camouflage paint did not infuence the transi-
tion points; however, painting the wings of the
Battle-type aircraft reduced its top speed byabout 3 to 4 percent
10

. Span rivets both increased drag and affected
the transition point; for example, completely
fastening the wings of the Battle-type aircraft
with rivets 0.04 in. high and 0.25 in. wide
caused a decrease in the top speed of the air-
craft by about 2.5 percent
. Flush rivet drag was negligible but the transi-
tion point was affected with this type of rivet;
the implementation of flush rivets should be asfar back from the leading edge of the wing as
possible
. Ten unchamfered rearward facing lap joints
(1/16 in. high) decreased the top speed of the
Battle-type aircraft by 2.5 percent; however,
chamfered to a gradient of 1:5 led to only a
1.5-percent speed reduction
. The addition of a leading-edge slat to half the
wing of an aircraft with transition occurring
near the leading edge led to a top speed reduc-
tion of 1 to 2 percent for a very well-fit slat and
of about 2.5 percent for an average-fit slat; if
transition was not at the leading-edge region,
then the slat-incurred drag would be greaterthan if it were
. Formulas for estimating the drag effects due to
rivets and lap joints were shown to be in good
agreement with experimental results; although
the formulas for describing the drag due to riv-
ets and lap joints are very important for turbu-
lent configurations, the capability to predict the
impact of the protuberance on the transition
location is more significant for NLF and LFC
applications
Wetmore, Zalovcik, and Platt (1941) performed a
flight investigation to study the boundary-layer char-
acteristics and profile drag of a 2D laminar flow airfoil
at high Reynolds numbers. They used a Douglas B-18aircraft modified with an NACA 35-215, 17-ft chord
by 10-ft span test panel positioned on the wing 13 in.
outboard of the propeller-pulled engine of the aircraft.The test covered Reynolds numbers from 20 x 106 to
30 x 106 and included variations in power and surface
conditions. Engine power variations were made todetermine the impact of the engines on profile drag.
Although there was no fixed relationship between the
lift coefficient and Reynolds number (i.e., quantitative
evaluation was not possible), some qualitative com-
parisons can be made with reference to surface and
engine conditions. A two-tube rack was used to mea-sure the transition location. For the design lift coeffi-
cient (C L = 0.2) and Reynolds number of 26.7 x 10⁶,transition occurred at 42.4 percent chord (for engine-
off conditions). The pressure minimum for this airfoil
is at approximately 45 percent chord. For this bestlaminar flow case, the surface had a waviness ampli-
tude of 0.001 in., which was obtained through polish-
ing the surface. For the same flight conditions and a
surface waviness amplitude of 0.005 in., transition
occurred at 32.5 percent chord. This early work gavean indication of the influence of waviness on laminar
flow extent; however, because no surface wavelengths
were presented, the flight data cannot be used for wav-iness correlations. Finally, it was recognized that dif-
ferences in flight test results and wind tunnel results
were directly impacted by residual turbulence, even in
the "quiet tunnels" of that time.
Fage (1943) performed the first systematic wind
tunnel experiment to characterize the surface waviness
impact on laminar flow (point of transition) for a flat-
plate boundary-layer flow. The experiments were car-ried out using "corrugations"--smooth bulges and
hollows and flat ridges---on one side of a smooth flat
aluminum plate which had an elliptical leading edge.
Although the tunnel could produce sufficiently clean
flows up to a tunnel speed of 140 fps, the experiments
were carried out so that the corrugations impact transi-
tion well below 140 fps and are not affected by free-stream turbulence in the wind tunnel. Positioned 20 in.
downstream of the leading edge, a strip of spring steel
was used to form bulges and hollows and a piano wire
was used for ridges. Small surface tubes (mounted on
the plate) were used to indicate when a corrugationcaused transition to move forward as the tunnel speedwas varied.
For this zero pressure gradient case, Fage (1943)
found empirical expressions which gave an estimate
for the minimum height of spanwise bulges, hollows,
and ridges that affects the position of transition in the
experiments. The experiments showed that the mini-
mum height is not especially dependent on the form of
the corrugation, and it appeared that the flow condi-
tions that impact the transition location were related to
the local separation of the laminar boundary layer.
11

However,asFagenoted,it wasnot expected that thesesimple relations take into consideration all flow condi-
tions. In particular, only flow separation was consid-ered and the stability of the flow downstream of the
corrugation should be accounted for as well. Fage's
work did not include the effects of compressibility or
sweep.
At the same time, Braslow (1944) was studying
the impact of roughness on transition in a less system-
atic manner than Fage (1943). The effect of various
camouflage paints and the painting procedures on thedrag characteristics on an NACA 65-420 airfoil
section were examined. Using the Langley Low-
Turbulence Pressure Tunnel (LTPT), Braslow (1944)
showed that a carefully applied camouflage painted
surface could retain the low-drag characteristics of theairfoil up to chord Reynolds numbers of 22 x 106. This
maximum Reynolds number could not be overcome
unless some light sanding was applied to the painted
finish. This experiment demonstrated the impactroughness could have on drag (or transition) with unit
Reynolds number variation.
Smith and Higton (1945) reported the results of
King Cobra flight tests to determine the (surface) cri-
teria for laminar flow and the practicality of meeting
the necessary requirements. The impact of rain, dust,
insects, and surface-finish polish on the flow wasassessed. Dust and water accumulation did not
increase the measured drag, whereas as the tempera-
tures increased in April 1945, it became impossible to
fly without insect contamination affecting drag mea-
sured in flight. Also, the results showed that reducingthe waviness to _+0.001 in. led to runs of laminar flow
to 60 to 65 percent chord. Gray and Fullam (1950)
reported wind tunnel tests for the King Cobra wingmodel in the RAE No. 2 11.5- by 8-foot tunnel. Con-
sistent with the flight experiments, low drag was real-ized for Reynolds numbers of 15 x 106; however, the
existence of turbulence in the wind tunnel, which is
not present in free flight, caused some degradation of
the range of CL and a ragged transition front.
Plascott (1946) and Plascott et al. (1946) con-
ducted a flight test with a Hurricane II aircraft to mea-
sure improvements in laminar flow extent by reducing
surface waviness. The manufactured wing was found
to have waviness which prevented significant regionsof laminar flow. The manufacturer reduced the wavi-
ness b) the use of appropriate filler and careful rub-bing down the surface. Surface waviness wasmeasured to be less than 0.001 in. The results showed
a 26-percent decrease in the drag coefficient compared
with previous flight test results. Laminar flow was
realized to between 50 and 60 percent chord of the test
section (the pressure minimum was designed for about
50 percent chord). The conclusions from this flight
test were in agreement with the previous King Cobra
test; namely, reducing the surface waviness to
0.001 in. led to significant runs of laminar flow forflight Reynolds numbers in the range of 20 x l06.
The earlier wind tunnel and flight experiments
served to illustrate the impact of surface smoothness
(roughness and waviness) by demonstration. The fol-
lowing subsections present the current understanding
of surface smoothness, building upon these earliertests.
3.2.1. Waviness
Carmichael, Whites, and Pfenninger (1957),
Carmichael (1959), and Carmichael and Pfenninger(1959) developed the basis for "allowable waviness
criteria' for swept and unswept wing surfaces, influ-
enced by compressibility, suction, single bulges, mul-
tiple waves, and wing sweep. The criteria are still
valid today and were based on the available flight test
observations. Flight test experiments were carried out
by using the F-94A airplane with 69 suction slots as
described by Groth et al. (1957). Sinusoidal waves
were obtained over the width of the test section by
applying paint with the wavelength specified by mask-
ing tapt.. Wave height and length were varied in a
region of growth (28 percent chord) prior to thesuction influencing the disturbance evolution. Theresults :;howed that the extent of laminar flow was
more sensitive to the chordwise pressure distributionthan variations in Reynolds number for the critical
wave; an increase in a favorable chordwise pressuregradient was required to maintain laminar flow in the
presenct: of a surface wave. The relationship foundbetween the critical wave height and wavelength was
h2fiL = Constant. Sinusoidal waves at 15 percent chord
were al,,o studied. Only small increases in allowable
waviness were realized in this strong favorable pres-
sure gradient region, probably because the boundary
layer was thinner compared with the 28-percent chordcase.
12
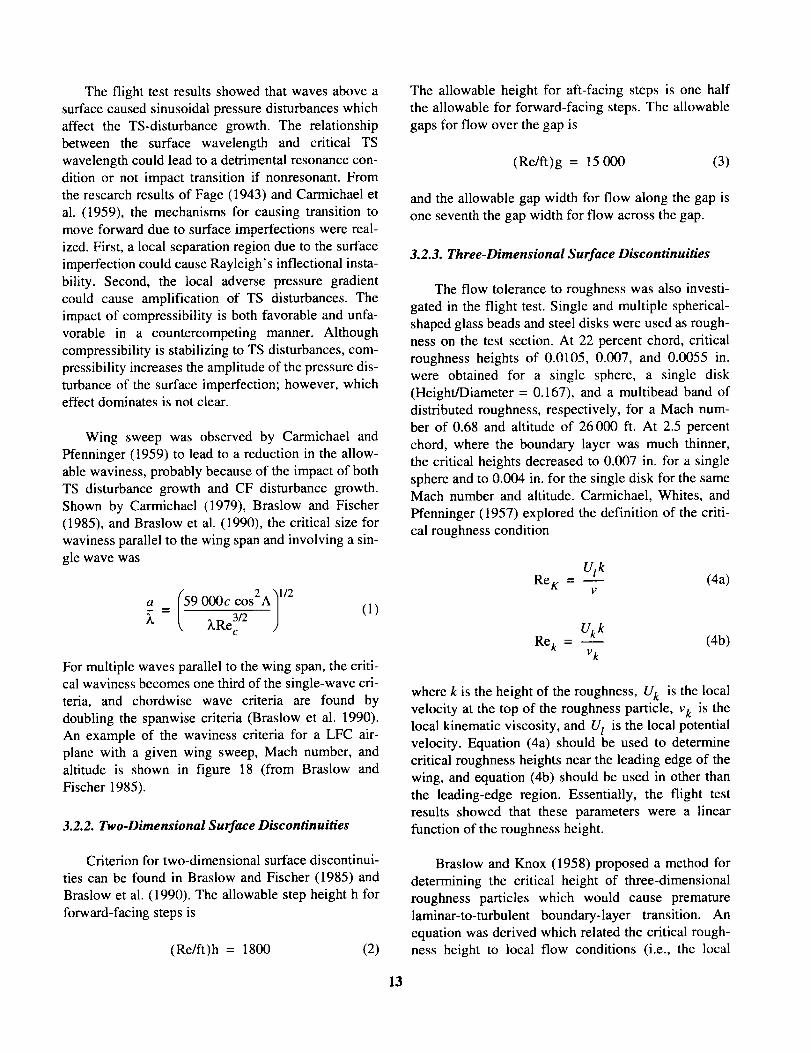
Theflight testresultsshowedthatwavesaboveasurfacecausedsinusoidalpressuredisturbanceswhichaffect the TS-disturbancegrowth.The relationshipbetweenthe surfacewavelengthand critical TSwavelengthcouldleadtoadetrimentalresonancecon-ditionor not impacttransitionif nonresonant.Fromtheresearchresultsof Fage(1943)andCarmichaeletal. (1959),themechanismsfor causingtransitiontomoveforwarddueto surfaceimperfectionswerereal-ized.First,a localseparationregiondueto thesurfaceimperfectioncouldcauseRayleigh'sinflectionalinsta-bility. Second,the local adversepressuregradientcouldcauseamplificationof TS disturbances.Theimpactof compressibilityis bothfavorableandunfa-vorablein a countercompetingmanner.AlthoughcompressibilityisstabilizingtoTSdisturbances,com-pressibilityincreasestheamplitudeofthepressuredis-turbanceof thesurfaceimperfection;however,whicheffectdominatesisnotclear.
Wing sweepwasobservedby CarmichaelandPfenninger(1959)to leadto areductionin theallow-ablewaviness,probablybecauseof theimpactof bothTSdisturbancegrowthandCF disturbancegrowth.Shownby Carmichael(1979),BraslowandFischer(1985),andBraslowetal. (1990),thecriticalsizeforwavinessparalleltothewingspanandinvolvingasin-glewavewas
a = (59 O00_____c_ccos2A11/2
)_ t _,Re_'2 J(1)
For multiple waves parallel to the wing span, the criti-
cal waviness becomes one third of the single-wave cri-teria, and chordwise wave criteria are found by
doubling the spanwise criteria (Braslow et al. 1990).
An example of the waviness criteria for a LFC air-
plane with a given wing sweep, Mach number, andaltitude is shown in figure 18 (from Braslow and
Fischer 1985).
3.2.2. Two-Dimensional Surface Discontinuities
The allowable height for aft-facing steps is one halfthe allowable for forward-facing steps. The allowable
gaps for flow over the gap is
(Re/ft)g = 15 000 (3)
and the allowable gap width for flow along the gap is
one seventh the gap width for flow across the gap.
3.2.3. Three-Dimensional Surface Discontinuities
The flow tolerance to roughness was also investi-
gated in the flight test. Single and multiple spherical-
shaped glass beads and steel disks were used as rough-
ness on the test section. At 22 percent chord, critical
roughness heights of 0.0105, 0.007, and 0.0055 in.
were obtained for a single sphere, a single disk
(Height/Diameter = 0.167), and a multibead band of
distributed roughness, respectively, for a Mach num-
ber of 0.68 and altitude of 26 000 ft. At 2.5 percent
chord, where the boundary layer was much thinner,
the critical heights decreased to 0.007 in. for a single
sphere and to 0.004 in. for the single disk for the sameMach number and altitude. Carmichael, Whites, and
Pfenninger (1957) explored the definition of the criti-
cal roughness condition
U/kRe K - (4a)
UkkRe k = -- (4b)
vk
where k is the height of the roughness, Uk is the localvelocity at the top of the roughness particle, vk is the
local kinematic viscosity, and U/ is the local potentialvelocity. Equation (4a) should be used to determine
critical roughness heights near the leading edge of thewing, and equation (4b) should be used in other than
the leading-edge region. Essentially, the flight test
results showed that these parameters were a linear
function of the roughness height.
Criterion for two-dimensional surface discontinui-
ties can be found in Braslow and Fischer (1985) and
Braslow et al. (1990). The allowable step height h for
forward-facing steps is
(Re/ft)h = 1800 (2)
Braslow and Knox (1958) proposed a method for
determining the critical height of three-dimensional
roughness particles which would cause premature
laminar-to-turbulent boundary-layer transition. An
equation was derived which related the critical rough-
ness height to local flow conditions (i.e., the local
13

temperatureandvelocityconditionsin the boundarylayer).Theresultswerepresentedfor zero-pressuregradientflow for Machnumbersfrom0to 5.A rough-nessReynoldsnumberRek of between250and600for Machnumbersup to 2 apparentlycausedprema-ture transition.Then, basedon the assumedRekwhich caused transition for known values of Mach
number, unit Reynolds number, and roughness
location, the critical roughness height could bedetermined.
Braslow and Maddalon (1993, 1994) discussed
roughness-related results of the Jetstar LFC flight test.
A ratio of roughness diameter to height between 0.5
and 5.0 is permissible in the high crossflow region of
swept-wing flow.
Th,'se wind tunnel and flight experiments demon-
strated the sensitivity of the flow to the surface defini-
tion. They also showed that with some careful surface
preparation, laminar flow could be obtainable. The
stringent surface smoothness and waviness criteria
(tolerances) for laminar flow posed a major challenge
for research in the 1950s and 1960s. A partial explana-
tion for the descope of subsonic LFC in the 1950s was
attributable to the severe surface manufacturing toler-
ances required to achieve laminar flow. However
the manufacturing technologies of the 1990s have
matured to the point that surface definition tolerancesare more readily achievable.
3.3. Critical Suction Parameters for LFC
An example of the critical roughness height with
altitude for a fixed Mach number is shown in figure 19(Braslow and Fischer 1985). As the altitude increases,
the unit Reynolds number decreases and the allowable
critical roughness heights can therefore increase.
The current understanding of the mechanismswhich cause transition to move forward due to surface
imperfections includes
As part of the Saric (1985) review of LFC controlwith stiction for AGARD, the issue of transition
caused by local streamwise vorticity generated in the
boundary-layer flow over a suction hole was briefly
covered. Essentially, the threshold parameters are not
known when these vortices appear nor what strengthand impact they have on the flow instabilities. These
parameters involve hole size, suction flow rate, hole
spacing and geometry, and hole inclination.
o
.
.
°
.
A local separation region due to the surface
imperfection could cause Rayleigh's inflec-
tional instability, which could cause transitionto move forward
The local adverse pressure gradient induced by
the surface imperfection could cause the ampli-fication of TS disturbances, which would cause
premature transition
Depending on the relationship between surface
wavelength and the disturbance (TS or CF),
transition can move forward or be postponed in
the CF-disturbance regions (due to wave super-position and relative wave phase)
The critical wave height decreases withincreased number of waves
Forward-facing rounded steps near the leading
edge had nearly a 50-percent increase in the
critical step height compared with forward-
facing square steps
The earliest fundamental understanding of the crit-
ical suction issue was reported by Goldsmith (1955,
1957), where experiments were conducted in the
Northrop 2-in-diameter laminar flow tube to deter-mine universal critical suction curves that would be
used to design suction through isolated holes or a row
of holes. Nondimensional parameters were determined
from rc suits over a large range of boundary-layer
Reynolds numbers, tube velocities, and hole configu-rations. Tube velocities were determined from
pressure-tap records, and the state of the boundarylayer was determined to be either laminar or turbulent
with a :;tethoscope. The critical suction was affected
by the hole diameter, the hole spacing, and the
boundaJy-layer thickness. The suction was adjustedfrom a flow condition which was turbulent until the
flow be_:ame laminar. This suction level which led to
laminar flow was called the critical maximum value.
When a sufficiently low suction level is reached that
any further decrease in the suction would lead to aturbulent flow, the minimum suction values were
obtained. The critical maximum suction arose because
with suction higher than this value, the three-
dimensionality of the flow into the hole would cause
14
prematuretransition.Goldsmith(1955)notedthatthecriticalsuctionquantitiesweredependentmoreonthegapbetweenadjacentholesthanon thediameterorcenterlinespacing.Also, the critical suctionwasreducedfor holesalignedat anangle(swept)to thestreamtubecomparedwithholesperpendicularto thestream-tubeaxis.SignificanttoGoldsmith(1957)wasthediscussionof theimpactof parametervariationsonmultiplerowsof holes.Namely,theactionof vorticesfromholesindifferentrowscanleadtohorseshoevor-tices,whichthenleadto turbulence.Thisundesirableflow phenomenoncan happenwith lower suctioncomparedwiththeisolatedholeorrowofholes.Gold-smithnotedthattheassociatedflowpatternwithmul-tiple rows of holeswascomplicatedand may besensitiveto the suctiondistributionand pressuregradients.
Rogers(1957)reportedresultsof experimentsintendedto extendthedatabaseof knowledgefromlow Reynoldsnumberpressuredropthroughholesandslots to the intermediateregime.As the Reynoldsnumberincreased,presumablyavortexformedattheinletedgeof theholeorslotcausingaflow-separationregion.Reattachmentcouldbe ratherabruptdown-streamof theholeor slot.Notheorywasavailabletopredictthebehaviorof theflow in this intermediateregion. Pressurerecoverycoefficientsversusslotwidthwerepresented.Becausethisreportwasessen-tially a contractorprogressreport,no conclusionsweredrawn;however,theauthordid maketheinter-estingpoint thattherewassomeunchartedregimebetween laminar suction attachedflow at lowReynoldsnumberandfree-jetflow athighReynoldsnumber.For sharp-edgeholesandslots,theexperi-mentalresultsagreedwiththeoryforthepressuredropcoefficientat low Reynoldsnumberflow. As theReynoldsnumberincreased,theexperimentalpressuredropcoefficientbrokeawayfrom thetheoryandathigh Reynoldsnumbersapproachedthe asymptoticnonviscousfree-jet flow theory.However,for theholesandslotswithroundededges,nodevelopmentofunstablevorticesor separationwasobservedin theexperiments.Theresultssuggestedthat(if practicalfrom manufacturingoperations)roundededgesforsuctionLFC are preferredto conventionalsharpedges.
Gregory(1961)reviewedthestatusof suctionsur-facesfor LFCapplication,includingthesurfacesused
amongpreviousinvestigators,and summarizedtheresults.Notingthedeclinein thefeasibilityof suctionslotsfor swept-wingconfigurations,Gregorypointedout thatasthewingwasswept,theeffectivedistancebetweenslots increased.Hence,a lossof the sloteffectivenessfor controloccurredespeciallyneartheleadingedge.Hence,theadvantagesof a whollyper-foratedsuctionsurfacebecomepronouncedwith no"obvious" flow-directionaldependencefor such aLFCsurface.Gregorylistedthe1961knownmaterialsfor LFC to besinteredmetals,fiberglasscompacts,perforatedsheets,wirecloth,electro-depositedmesh,slits,andorganicfibers.Thecriticalityof issuessuchas roughnessandporosityvarieddependingon thematerialused.
MeitzandFasel(1994)usedanunsteadyNavier-Stokessolver(directnumericalsimulation,DNS)tostudytheflow field adjacentanddownstreamof suc-tionholes.TheGoldsmith(1957)parameterspacewasstudiedwherelow suction-inducedvorticesdecayedwith downstreamdistanceandhighsuction-inducedvorticescoalescedwithvorticesfromadjacentholestocauseprematuretransitionto turbulence.In agreementwith the Goldsmithexperiments,the simulationsofMeitzandFaselshowedthatlow suctionthroughtheholesgeneratedapairof vorticeswhichdecayedwithdownstreamdistance.As the suctionincreasedtosomecritical value,the vorticesbecameunstable.Largersuctionled to vortexsheddingat the suctionholelocation.
Supportedby theEuropeanCommunitiesIndus-trial and MaterialsTechnologyProgramundertheLaminar Flow Investigation(ELFIN) II Project,MacManusand Eaton (1996) performedthree-dimensionalNavier-Stokessimulationsof thesuctionthroughholestostudythelocalflowphysicsinvolvingsingleandmultiplerowsof holes.Variationsin holediameter,boreshape,inlet shape,andinclinationoftheholeto thesurfaceontheresultingflowwereeval-uatedwith thesimulations.Seefigure20 for anillus-trationof theholesstudiedby MacManusandEaton(1996).Althougha detailedsurveyof the impactofthegeometricalvariationson theflow is veryimpor-tant for the designof LFC systems,only selectedresultswerepresentedby MacManusandEaton,mostlikely becauseof pagelimitations.Fromthoseselectcases,the conclusionswere(1) irregularitiesof the
15
holeshapehadminimaleffecton theinducedflow,(2) it wasundesirableto haveholesinclinedto thesurface,(3) theflow fieldat theholeinletwashighlythree-dimensional,(4) the suckedstreamtubewasapproximatelytheshapeof a circlesegment,(5) thepressuredropandmassflow ratewereinsensitivetothehole inletgeometry,and(6) interholeflow fieldeffectsexistedfor staggeredmultiplerowsof holes.(Incidentally,theadjacentrowsof holeswerestag-gered.)MacManuset al. (1996)performedcomple-mentingexperimentsto studytheflow in thevicinityof aLFC suctionhole.TheLDV measurementscon-firmedthattheflow field neartheholewashighlythree-dimensional.
Anselmet,Mrrlgaud,andFulachier(1992)usedan IMST watertunnelin FranceandlaserDopplervelocimeterandotherflow visualizationto determinetheflowstructureof suctionthroughandnearasingleorificeto determinetheoptimaldimensionof theholeandflow rate.Theexperimentsshowedthatif suctionwastoo large,prematuretransitionwouldoccur.Thestudyfocusedonly on single-holeflows and con-cludedby notingthe importanceof multiple-holealignmentstudiestowardtheLFCproblem.
Toevaluatethepotentialuseof perforatedsuctionstripsof LFC,Cornelius(1987)usedalow-turbulencewindtunnelatLockheed-GeorgiaCompanyandcom-paredthestripresultswith slot suction.A flat platewasusedwith a slot thicknessof 16percentof thelocal displacementthicknessanda perforatedstripwitha widthof 15percentof thedisplacementthick-nessasthetestarticle.Theslot thicknessof 0.25mmwascut with a saw,and the perforatedstrip had45 rows of 0.25-mm-diameterelectron-beam-drilledholes. The results showeda distinct differencebetweentheslotandperforatedstripwithvery largemagnitudeshearnearthedownstreamendof theslot.With a portionof theperforatedstrip(80percentofthewidthwascoveredwith tape),suppressionof thedisturbanceamplificationwasequivalentto usingthesuctionslot. Comparedwith the resultsusing thewiderperforatedstrip,it is demonstratedthatsuctionthroughthe slotsor narrowperforatedstripshaveagreaterbeneficialeffecton theboundary-layerstabil-ity. Theseresultssuggestedthatanalysiswhichusedcontinuoussuction(widestrips)wouldbeaconserva-tive approximationto suctionslotsor thinperforatedstrips.
3.4. Manufacturing Issues
In the early years of airplanes, thin metal skins,
multiple spanwise stringers, and countless fasteners
(e.g., rivets) on the surface prevented achieving lami-nar flow. On research aircraft, fillers were used even
into the 1980s to smooth problem areas of the surface.With the advent of bonded sandwich construction
methods, the production surface became as good as
the production mold definition. The surface structure
became sufficiently stiff so that adequate waviness cri-
teria could be maintained under loads (in subsonic and
transonic aircraft) and the new production capability
in the 1990s has solved (in principle) the task of manu-
facturing laminar flow quality surfaces.
3.4.1. Joints
Potential issues still remain associated with struc-
tural joints. The issue of critical waviness caused by
these intersections must be part of the design process.
The intersection of these major structures may have
fasteners which protrude above the surface and cause
flow interruption by way of steps and gaps. To avoid
this problem, a recessed intersection region could beemployed, which would remove the fastener issue and
could require a flush-fill technique to cover therecessed connection area. Similar to the structural
joints issue, access doors are a normal feature on air-
craft and require special attention for laminar flow to
be achit;vable. Flush mounting to within a few thou-
sands of an inch is required; sealing the access panel is
also reqaired to prevent air bleed from the panel.
3.4.2. Holes
Corlparable with early analysis on the Jetstar
(Powell 1987), Boeing 757, and F-16XL (Norris 1994)
LFC flight test articles, Parikh et al. (1990) studied the
suction system requirements (based on computational
analysis) for SLFC on a High-Speed Civil Transport
(HSCT). In the analysis, the perforated skin had holediameters on the order of 0.002 in. (0.05 mm), hole
spacing of 0.01 in. (0.025 mm), and a skin thickness of
0.04 in. (0.1 mm). With this information, it is clear
that millions to billions of holes are required for a
large-scale wing. For example, the hole spacing sug-
gests that 10 000 holes are contained in a square inch
or 1.4 million holes are found in a square foot. For
a large application such as the proposed HSCT,
16

420million holeswouldbe requiredon thewing ifHLFC were applied to the leading-edgeregion(assumingaregionof 100ft of spanby3ft of chord).If theentirewing wasusedfor LFC, thenapproxi-mately12billion holeswouldbe requiredandobvi-ouslywill becomea significantmanufacturingtask.Thislargenumberof holesis anoverlyconservativeestimatebecausetheholesizeandspacingareafunc-tionofthesuctionlevelandtheplacement(e.g.,ontheattachmentlineversusonthewingrooftopregion).
In Germany,Schwab(1992) discussedtheelectron-beamdrillingprocessfor creatingholesin asurfacefor suctionLFC.NotethattheJetstarflighttest(Powell1987)madeuseof thishole-drillingtech-nique.With this method,some3000holescouldbegeneratedpersecondwithholediametersassmallas0.04mm in 0.5-mm-thicksheetsof stainlesssteelto0.06 mm in 1.0-mm-thicksheets.As the materialthicknessincreased,the minimum hole diameterincreased.To controlthegeometricaldefinitionof thehole,a pulseprocedurewasrequired.Essentially,ahigh-powerelectronbeamimpingedon thesurfacetomeltandvaporizethematerialat impact.Crosssec-tionsof thedrilledholesindicatedthattheuppermostpartof thedrilledholeswas2 to 2.5timeslargerindiameterthantheexit diameter,with theexit of thehole being absolutelyburr-fee and round. (Seefig. 20(b)for an illustration.)This drillingtechniquesuggestedthatholesdrilledfor LFCshouldbedrilledfrom theinteriorto exteriorsothatthe interiorholediameteris biggerthanthe exterior.Therefore,forexample,if apieceof dust(orinsect)entersaholedueto suction,the articlewill be ableto freelyexit theholeintothesuctionchamberandnotgetlodgedinthehole.In additiontotheelectron-beamdrillingprocess,laserdrilling hasbeensuccessfullyusedfor LFCapplications.Both the Boeing757 HLFC (Collier1993)andtheF-16XLSLFC(Norris1994)flighttestshadskinswhichhadtheirholesdrilledwitha laser.The laserwouldproduceholeswith characteristicssimilartotheelectronbeam.
Supportedby theELFIN Program,Poll,Danks,andHumphreys(1992)lookedattheaerodynamicper-formanceof laser-drilledsuctionholesrelativeto thepressuredropacrossagivensurfacefor agivenmassflow rateandholediameter.Theyobservedthatlaserdrillingproducedarandomvarietyof holeshapeswith
noparticularcharacteristicdiameter(withoutastatisti-cal determinationof the hole diameter).The flowthroughtheholewascharacterizedbyincompressiblelaminarpipelikeflow.Theflow ratesof interestledtothepressuredropbeinga quadraticfunctionof themassflow rate.
BuxbaumandHrhne(1996)outlinedthetestingof two perforatedtitaniumsectionsto beusedin aLFCwindtunnelexperimentatArizonaStateUniver-sity.Thefirst panelwasauniformalignedpanel,andthesecondpanelhasasinepatternto theholealign-ment.Observationof the sectionsindicatesthatthelaser-drilledholesrangein spacing(0.35to 0.95mm)andshape.Theholeswerenotedto beseldomcircularasdesigned.LDVandhotwireswereusedto measurethe flow resultingfrom suctionthroughthe holes.Althoughmeasurementsof eachindividualholewereunobtainable,an innovativeapproachusinga smallfunnelplacedperpendicularto thesurfacewasusedtomakemeasurementsto about1.5mm.The drillingdirectionduringthemanufacturingprocesswaspre-sumedto havea largeimpacton thequalityof theresultingholes.Themeasurementsrevealedthatthedeviationfromthedesireduniformvelocitywas2per-cent(0.05m/sec)fortheuniformpaneland14percent(0.18m/sec)forthesinusoidalpanel.
3.5. Transition Prediction Design Tool
Methodology
The improvements in aerodynamic efficiency
directly scale with the amount of laminar flow
achieved. Hence, the designer must be able to accu-
rately predict the location of boundary-layer transition
on complex, three-dimensional geometries as a func-tion of suction distribution and suction level (or the
accurate prediction of the suction distribution for a
given target transition location). Pressure gradient,surface curvature and deformation, wall temperature,
wall mass transfer, and unit Reynolds number are
known to influence the stability of the boundary layer
and transition location. For practical HLFC designs, it
is imperative to be able to accurately predict therequired amount, location, and distribution of wall
suction (or thermal control or any other control tech-
nique) to attain a given ("designed for") transitionlocation.
17

This sectiondescribesthe conventionalandadvancedtransitionpredictiontools,someof whichinclude predictionof perturbationsto the laminarboundarylayer,thespectrumandamplitudesof theseperturbations,andthelinearandnonlinearpropagationof theseperturbations,which ultimately leadstotransition.For literaturefocusingon thetheoreticalandcomputationalaspectof transitionpredictionandLFC,refertoCousteix(1992)andArnal(1984,1994).
3.5.1. Granville Criterion
Granville (1953) reported on a procedure for cal-
culating viscous drag on bodies of revolution and
developed an empirical criterion for locating the tran-sition location associated with low-turbulence flows.
Low (or zero) turbulence characteristic of flight or
low-turbulence wind tunnels and high turbulence char-
acteristic of most wind tunnels are the two problemsconsidered relative to a transition criterion. The low-
turbulence case assumed that transition was TS distur-
bance dominated and began with infinitesimally
small-amplitude disturbances. Walz (in Oudart 1949)
suggested that rough empirical criteria for transitionwould indicate transition occurred at three times the
neutral stability Reynolds number. With data from
Dryden (1936), Hall and Hislop (1938), Schubauer(1939), and Schubauer and Skramstad (1948),
Granville (1953) showed that a variety of flight and
low-turbulence wind tunnel data collapsed into a crite-
rion (curve) based on Re0, T - Re0,N, which is the dif-
ference between the momentum thickness Reynolds
number at transition and at the neutral point, versus
02 d_which is the average pressure gradient param-v d._'
eter. This correlation was demonstrated for two-
dimensional flows and is shown in figure 21 with data
from Braslow and Visconti (1948). Granville used a
transformation to convert this information to a body-
of-rotation problem. The data were also correlatedwith turbulence level in the free stream as shown in
figure 22. Extrapolation of the criteria would work for
a two-dimensional airfoil dominated by TS transition
(Holmes et al. 1983), whereby the existing databaseincluded this form of transition. However, when the
design configuration begins to significantly differ
from the existing database, this transition prediction
criteria would likely fail.
3.5.2. C1 and C2 Criteria
At ONERA, Arnal, Juillen, and Casalis (1991)performed N-factor correlations with wind tunnel
experimental results of a LFC suction infinite swept
wing. The motivation for the study was to gain funda-
mental understanding of the transition process with
suction and to test the methodologies developed atONERA-CERT for three-dimensional flows. The
streamwise instability criteria were based on an exten-
sion of Granville (1953). Two crossflow transition cri-
teria have been developed by Areal, Habiballah, andCoustois (1984) at ONERA and are referred to as C1and C2. The C1 criterion involves a correlation of
transition onset integral values of the crossflow
Reynolds number and the streamwise shape factor.The C2 criterion is a correlation of transition onset
with a Reynolds number computed in the direction of
the most unstable wave, the streamwise shape factor,and the free-stream turbulence level. The results dem-
onstrate that the transition criteria cannot be applied in
regions where the pressure gradient is mild because
there is a large range of unstable directions. In that
region, one cannot look only at pure streamwise or
crossflow instabilities. The C1 criterion gives bad
results with wall suction present; however, the C2 cri-
teflon correctly accounts for wall suction.
3.5.3. £inear Stability Theory
The equations governing the linear stability of dis-
turbances in boundary layers were first described by
Orr (1907), Sommerfeld (1908), and Squire (1933).
These equations are ordinary differential equations
and are referred to as the "Orr-Sommerfeld and Squire
equations." Although the growth or decay of small-
amplitu:le disturbances in a viscous boundary layer
could b,_ predicted by the Orr-Sommerfeld and Squire
equations (within the quasi-parallel approximation),the ability to predict transition came in the 1950s with
the semi-empirical method by Smith (1953). This
transition-prediction method---called e N or N-factor
method---correlates the predicted disturbance growth
with m_:asured transition locations. Although limited
to empirical correlations of available experimentaldata, it:s the main tool in use through the 1990s.
Linear stability theory represents the current state
of the art for transition location prediction for three-
dimensional subsonic, transonic, and supersonic
18
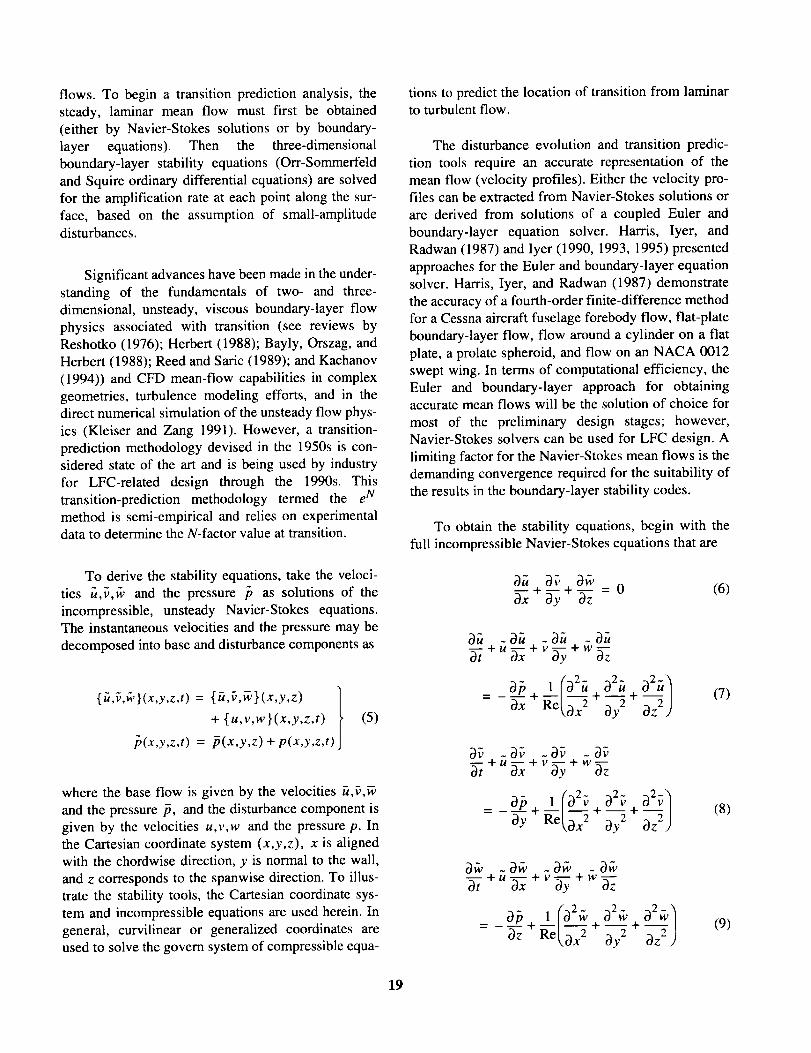
flows. To begin a transition prediction analysis, the
steady, laminar mean flow must first be obtained
(either by Navier-Stokes solutions or by boundary-
layer equations). Then the three-dimensional
boundary-layer stability equations (Orr-Sommerfeld
and Squire ordinary differential equations) are solved
for the amplification rate at each point along the sur-face, based on the assumption of small-amplitude
disturbances.
Significant advances have been made in the under-
standing of the fundamentals of two- and three-dimensional, unsteady, viscous boundary-layer flow
physics associated with transition (see reviews byReshotko (1976); Herbert (1988); Bayly, Orszag, and
Herbert (1988); Reed and Saric (1989); and Kachanov
(1994)) and CFD mean-flow capabilities in complex
geometries, turbulence modeling efforts, and in thedirect numerical simulation of the unsteady flow phys-
ics (Kleiser and Zang 1991). However, a transition-
prediction methodology devised in the 1950s is con-sidered state of the art and is being used by industry
for LFC-related design through the 1990s. This
transition-prediction methodology termed the e N
method is semi-empirical and relies on experimentaldata to determine the N-factor value at transition.
To derive the stability equations, take the veloci-
ties fi,_,& and the pressure _ as solutions of the
incompressible, unsteady Navier-Stokes equations.The instantaneous velocities and the pressure may be
decomposed into base and disturbance components as
{fi,_,_v}(x,y,z,t) = {fi,_,w}(x,y,z) [
+ {u,v,w}(x,y,z,t)
p(x,y,z,t) fi(x,y,z) + p(x,y,z,t)
(5)
where the base flow is given by the velocities u, v, w
and the pressure/_, and the disturbance component is
given by the velocities u,v,w and the pressure p. Inthe Cartesian coordinate system (x,y,z), x is aligned
with the chordwise direction, y is normal to the wall,
and z corresponds to the spanwise direction. To illus-
trate the stability tools, the Cartesian coordinate sys-
tem and incompressible equations are used herein. In
general, curvilinear or generalized coordinates are
used to solve the govern system of compressible equa-
tions to predict the location of transition from laminarto turbulent flow.
The disturbance evolution and transition predic-
tion tools require an accurate representation of the
mean flow (velocity profiles). Either the velocity pro-files can be extracted from Navier-Stokes solutions or
are derived from solutions of a coupled Euler and
boundary-layer equation solver. Harris, Iyer, and
Radwan (1987) and Iyer (1990, 1993, 1995) presented
approaches for the Euler and boundary-layer equation
solver. Harris, Iyer, and Radwan (1987) demonstrate
the accuracy of a fourth-order finite-difference method
for a Cessna aircraft fuselage forebody flow, flat-plate
boundary-layer flow, flow around a cylinder on a flat
plate, a prolate spheroid, and flow on an NACA 0012swept wing. In terms of computational efficiency, the
Euler and boundary-layer approach for obtainingaccurate mean flows will be the solution of choice for
most of the preliminary design stages; however,Navier-Stokes solvers can be used for LFC design. A
limiting factor for the Navier-Stokes mean flows is the
demanding convergence required for the suitability of
the results in the boundary-layer stability codes.
To obtain the stability equations, begin with the
full incompressible Navier-Stokes equations that are
3fi 3;vO'-x+ _yy+ _zz = 0 (6)
O-7+ U + V + W
1 (O2u O2___fi+O2fi1
+ + Oy2 Oz:)(7)
3y + Re_._x2 _y2 _z 2)(8)
5
1=-_z +Re_,bx2 by2 3z 2)
(9)
19

A Reynoldsnumbercanbedefinedas Re = US�v,
where U is the velocity, 8 is the characteristic length,and v is the kinematic viscosity.
For hydrodynamic linear stability theory, which
makes use of the quasi-parallel flow assumption, fi(y)
and _(y) are functions of distance from the wall onlyand v = 0. Substituting equations (5) into the Navier-
Stokes equations, the following linear system results:
/)u av 3w
oq'--x+ _y + _zz = 0 (10)
Ou - Ou dfi - 3u
at+u_+v_+Waz
ap lIa2u a2__u+_2./- - a-'--x+ Ree_x2 + ay2 _)Z 2 )
(11)
Ov -Or _Orat+U_x+Waz
ap+l (a2V a2V _2V)
- 3y _ee[,_x2 +-- + (12)Oy 2 t)Z2_
Ow -Ow dw -Ow
a--7+.Uxx+,,_ +w_
_ ap l(a2w a2.______W+ ¢)2W1az+_t, ajx2+ay2 az2)
(13)
According to the conventional normal mode
assumption used to derive the Orr-Sommerfeld and
Squire equation, the eigensolutions take the form
{u,v,w,p} = {fi,_,,_,,/3I(y) exp[i(otx+ _z-tot)]
(14)
where i = ,f2-i, ct and 13 are the nondimensional
wave numbers (proportional to wavelengths) in thestreamwise and spanwise directions, to is the fre-
quency, and {fi, _, _,,_ } describe the velocity profile.
Substituting equation (14) into the linear equations
(eqs. (10) to (13)), the following Orr-Sommerfeld and
Squire equations may be obtained:
2O
212[d 2 2 d2fi d2_,
-t_ -13 J-iRe tx--_-_ 2dy dy
1+(O_u+_w-t.0) -Or. __2 _, = 0 (15)
dZfi2
ay
dfi___ _ i2 + [_2 _ iRe(otfi + _ - to)] d-_-
( @)a= /Re 0_ +rdyj (16)
where _ is the wall normal vorticity and dn/dy n "isthe nth derivative in the wall normal direction. The
standard wall boundary conditions are
d_ _ = 0 (y = O) (17);,_y,
and the free-stream boundary conditions are
d_ _ _ 0 (y _,,_) (18);'Uyy'
Either spatial or temporal stability analysis may be
performed, whereby the temporal analysis is lessexpensive and the spatial analysis is more physical. In
addition to the Reynolds number, Mach number, and
other parameters that must be prescribed, a stabilityanalysis requires that the mean flow and its first and
second ¢¢all-normal derivatives be known very accu-rately. ,t, small deviation in the mean flow could cause
significant changes in the second derivative and con-taminate the stability calculation. Once the mean flow
is obtained, a stability problem has to determine six
unknowns: {_r,O_i,_r,_i,tor,_i}, which are thestream_ ise wave number, streamwise (spatial) growth
rate, spanwise wave number and growth rate, wave
frequency, and temporal growth rate. For the temporalformula :ion, t_ and 13are real numbers and to is a com-
plex nm nber that is determined through an eigenvalue
solver. For the spatial approach, t_ and 13are complex,and to is the wave frequency.
Because the spatial formulation is more represen-
tative of the real boundary-layer instability physics
and the temporal-to-spatial conversion is only valid on
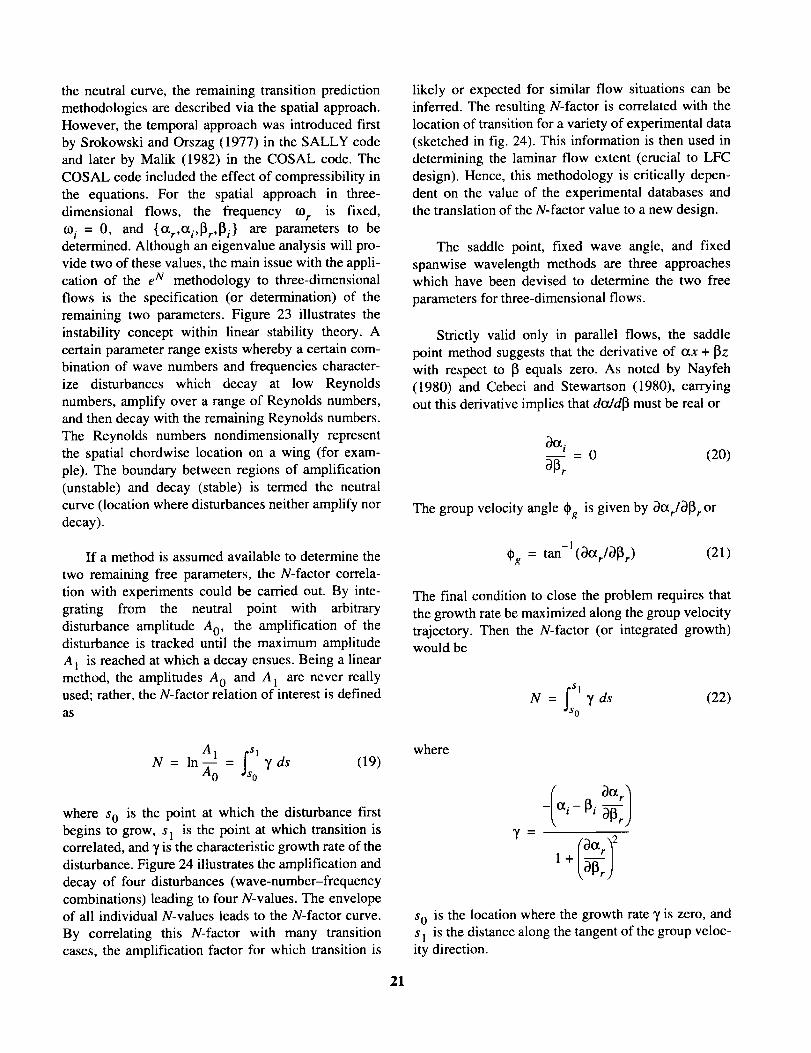
theneutralcurve,theremainingtransitionpredictionmethodologiesaredescribedvia thespatialapproach.However,thetemporalapproachwasintroducedfirstby SrokowskiandOrszag(1977)in theSALLYcodeandlaterby Malik (1982)in theCOSALcode.TheCOSALcodeincludedtheeffectof compressibilityinthe equations.For the spatialapproachin three-dimensionalflows, the frequency (O r is fixed,
(Oi = 0, and {_r,O_i,_r,13i} are parameters to bedetermined. Although an eigenvalue analysis will pro-vide two of these values, the main issue with the appli-
cation of the e N methodology to three-dimensional
flows is the specification (or determination) of the
remaining two parameters. Figure 23 illustrates the
instability concept within linear stability theory. A
certain parameter range exists whereby a certain com-bination of wave numbers and frequencies character-
ize disturbances which decay at low Reynolds
numbers, amplify over a range of Reynolds numbers,and then decay with the remaining Reynolds numbers.
The Reynolds numbers nondimensionally represent
the spatial chordwise location on a wing (for exam-
pie). The boundary between regions of amplification(unstable) and decay (stable) is termed the neutral
curve (location where disturbances neither amplify nor
decay).
If a method is assumed available to determine the
two remaining free parameters, the N-factor correla-
tion with experiments could be carried out. By inte-
grating from the neutral point with arbitrary
disturbance amplitude A 0, the amplification of thedisturbance is tracked until the maximum amplitude
A 1 is reached at which a decay ensues. Being a linearmethod, the amplitudes A 0 and A 1 are never reallyused; rather, the N-factor relation of interest is defined
as
likely or expected for similar flow situations can be
inferred. The resulting N-factor is correlated with the
location of transition for a variety of experimental data
(sketched in fig. 24). This information is then used in
determining the laminar flow extent (crucial to LFC
design). Hence, this methodology is critically depen-
dent on the value of the experimental databases andthe translation of the N-factor value to a new design.
The saddle point, fixed wave angle, and fixed
spanwise wavelength methods are three approacheswhich have been devised to determine the two free
parameters for three-dimensional flows.
Strictly valid only in parallel flows, the saddle
point method suggests that the derivative of otx + _z
with respect to 13equals zero. As noted by Nayfeh(1980) and Cebeci and Stewartson (1980), carrying
out this derivative implies that dogd_J must be real or
_}Ot i-- = 0
[3r(20)
The group velocity angle _g is given by _O_r/_13r or
_g = tan -l(bo_r/_r ) (21)
The final condition to close the problem requires that
the growth rate be maximized along the group velocity
trajectory. Then the N-factor (or integrated growth)would be
N = T ds (22)0
A, = T ds (19)N= ln_o o
where s o is the point at which the disturbance firstbegins to grow, s I is the point at which transition iscorrelated, and Y is the characteristic growth rate of the
disturbance. Figure 24 illustrates the amplification and
decay of four disturbances (wave-number-frequency
combinations) leading to four N-values. The envelopeof all individual N-values leads to the N-factor curve.
By correlating this N-factor with many transition
cases, the amplification factor for which transition is
where
--lOCi- [_i a13r)
y=
1+t713,)
sO is the location where the growth rate g is zero, and
s I is the distance along the tangent of the group veloc-ity direction.
21
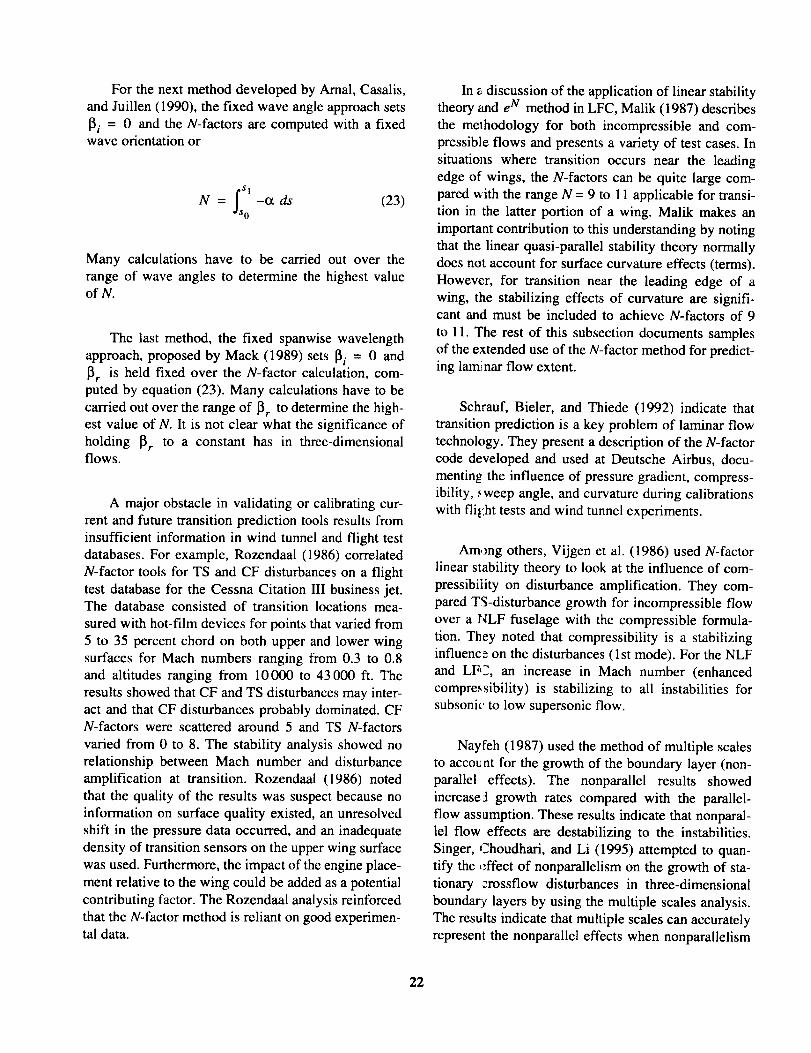
Forthenextmethoddeveloped by Arnal, Casalis,and Juillen (1990), the fixed wave angle approach sets
_i = 0 and the N-factors are computed with a fixedwave orientation or
ffflN = -o_ ds (23)0
Many calculations have to be carried out over the
range of wave angles to determine the highest valueof N.
The last method, the fixed spanwise wavelength
approach, proposed by Mack (1989) sets _i = 0 and_lr is held fixed over the N-factor calculation, com-puted by equation (23). Many calculations have to be
carried out over the range of 13r to determine the high-est value of N. It is not clear what the significance of
holding _r to a constant has in three-dimensionalflOWS.
A major obstacle in validating or calibrating cur-rent and future transition prediction tools results from
insufficient information in wind tunnel and flight test
databases. For example, Rozendaal (1986) correlated
N-factor tools for TS and CF disturbances on a flight
test database for the Cessna Citation III business jet.The database consisted of transition locations mea-
sured with hot-film devices for points that varied from
5 to 35 percent chord on both upper and lower wing
surfaces for Much numbers ranging from 0.3 to 0.8
and altitudes ranging from 10000 to 43 000 ft. The
results showed that CF and TS disturbances may inter-
act and that CF disturbances probably dominated. CFN-factors were scattered around 5 and TS N-factors
varied from 0 to 8. The stability analysis showed norelationship between Mach number and disturbance
amplification at transition. Rozendaal (1986) noted
that the quality of the results was suspect because no
information on surface quality existed, an unresolved
shift in the pressure data occurred, and an inadequate
density of transition sensors on the upper wing surfacewas used. Furthermore, the impact of the engine place-
ment relative to the wing could be added as a potential
contributing factor. The Rozendaal analysis reinforced
that the N-factor method is reliant on good experimen-tal data.
In a discussion of the application of linear stabilitytheory and eN method in LFC, Malik (1987) describes
the methodology for both incompressible and com-
pressible flows and presents a variety of test cases. In
situations where transition occurs near the leading
edge of wings, the N-factors can be quite large com-pared _ith the range N = 9 to 11 applicable for transi-
tion in the latter portion of a wing. Malik makes an
important contribution to this understanding by noting
that the linear quasi-parallel stability theory normallydoes not account for surface curvature effects (terms).
However, for transition near the leading edge of awing, the stabilizing effects of curvature are signifi-cant and must be included to achieve N-factors of 9
to 11. The rest of this subsection documents samplesof the extended use of the N-factor method for predict-ing laminar flow extent.
Schrauf, Bieler, and Thiede (1992) indicate that
transition prediction is a key problem of laminar flow
technology. They present a description of the N-factor
code developed and used at Deutsche Airbus, docu-
menting the influence of pressure gradient, compress-ibility, _,weep angle, and curvature during calibrations
with fli_:ht tests and wind tunnel experiments.
Am, rag others, Vijgen et al. (1986) used N-factor
linear stability theory to look at the influence of com-
pressibility on disturbance amplification. They com-
pared TS-disturbance growth for incompressible flow
over a NLF fuselage with the compressible formula-
tion. They noted that compressibility is a stabilizing
influenc_ on the disturbances (1 st mode). For the NLF
and LF,2, an increase in Mach number (enhanced
compressibility) is stabilizing to all instabilities forsubsoniv to low supersonic flow.
Nayfeh (1987) used the method of multiple scales
to acco_ nt for the growth of the boundary layer (non-
parallel effects). The nonparallel results showed
increased growth rates compared with the parallel-
flow assumption. These results indicate that nonparal-
lel flow effects are destabilizing to the instabilities.
Singer, Choudhari, and Li (1995) attempted to quan-
tify the _fffect of nonparallelism on the growth of sta-tionary :rossflow disturbances in three-dimensional
boundaE¢ layers by using the multiple scales analysis.
The results indicate that multiple scales can accurately
represent the nonparallel effects when nonparallelism
22
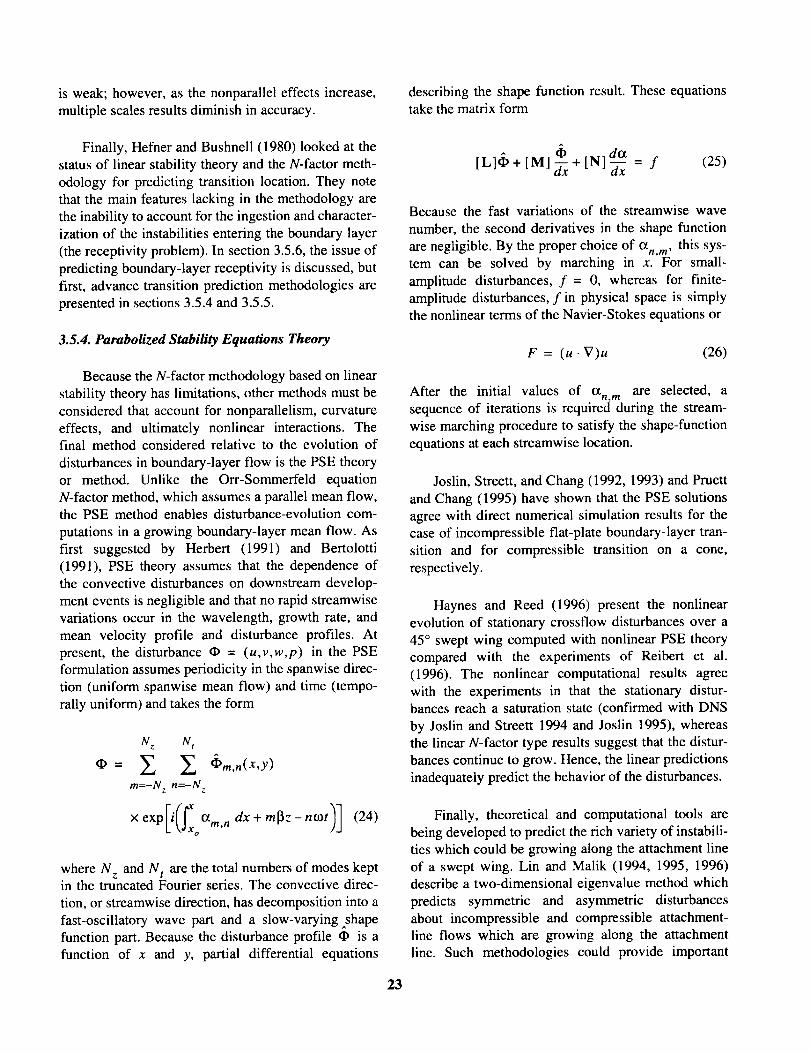
isweak;however,asthenonparalleleffectsincrease,multiplescalesresultsdiminishinaccuracy.
Finally,HefnerandBushnell(1980)lookedat thestatusof linearstabilitytheoryandtheN-factor meth-
odology for predicting transition location. They note
that the main features lacking in the methodology are
the inability to account for the ingestion and character-
ization of the instabilities entering the boundary layer
(the receptivity problem). In section 3.5.6, the issue of
predicting boundary-layer receptivity is discussed, but
first, advance transition prediction methodologies are
presented in sections 3.5.4 and 3.5.5.
3.5.4. Parabolized Stability Equations Theory
Because the N-factor methodology based on linear
stability theory has limitations, other methods must be
considered that account for nonparallelism, curvature
effects, and ultimately nonlinear interactions. Thefinal method considered relative to the evolution of
disturbances in boundary-layer flow is the PSE theoryor method. Unlike the Orr-Sommerfeld equation
N-factor method, which assumes a parallel mean flow,the PSE method enables disturbance-evolution com-
putations in a growing boundary-layer mean flow. As
first suggested by Herbert (1991) and Bertolotti(1991), PSE theory assumes that the dependence of
the convective disturbances on downstream develop-
ment events is negligible and that no rapid streamwise
variations occur in the wavelength, growth rate, and
mean velocity profile and disturbance profiles. At
present, the disturbance • = (u,v,w,p) in the PSEformulation assumes periodicity in the spanwise direc-
tion (uniform spanwise mean flow) and time (tempo-
rally uniform) and takes the form
N z Nt
2 Z *m'n(X'Y)
m=-N z n=-N z
X exp[i(J_x I_m, n dx+ m_z-noM)30
(24)
where N z and N t are the total numbers of modes keptin the truncated Fourier series. The convective direc-
tion, or streamwise direction, has decomposition into a
fast-oscillatory wave part and a slow-varying shapefunction part. Because the disturbance profile • is a
function of x and y, partial differential equations
describing the shape function result. These equationstake the matrix form
[L]_+ [n] dx + [N] = f (25)
Because the fast variations of the streamwise wave
number, the second derivatives in the shape function
are negligible. By the proper choice of O_n, m, this sys-tem can be solved by marching in x. For small-
amplitude disturbances, f = 0, whereas for finite-
amplitude disturbances, f in physical space is simplythe nonlinear terms of the Navier-Stokes equations or
F = (u. V)u (26)
After the initial values of O_n, m are selected, asequence of iterations is required during the stream-
wise marching procedure to satisfy the shape-function
equations at each streamwise location.
Joslin, Streett, and Chang (1992, 1993) and Pruett
and Chang (1995) have shown that the PSE solutions
agree with direct numerical simulation results for thecase of incompressible fiat-plate boundary-layer tran-
sition and for compressible transition on a cone,
respectively.
Haynes and Reed (1996) present the nonlinear
evolution of stationary crossflow disturbances over a
45 ° swept wing computed with nonlinear PSE theory
compared with the experiments of Reibert et al.(1996). The nonlinear computational results agree
with the experiments in that the stationary distur-bances reach a saturation state (confirmed with DNS
by Joslin and Streett 1994 and Joslin 1995), whereasthe linear N-factor type results suggest that the distur-
bances continue to grow. Hence, the linear predictions
inadequately predict the behavior of the disturbances.
Finally, theoretical and computational tools are
being developed to predict the rich variety of instabili-ties which could be growing along the attachment line
of a swept wing. Lin and Malik (1994, 1995, 1996)
describe a two-dimensional eigenvalue method which
predicts symmetric and asymmetric disturbancesabout incompressible and compressible attachment-
line flows which are growing along the attachment
line. Such methodologies could provide important
23
parametricinformationforthedesignof NLFandLFCsweptwings.
3.5.5. Transition Prediction Coupled to Turbulence
Modeling
In this subsection, a relatively new concept is out-
lined which involves coupling transition predictionmethodology with a two-equation turbulence model
approach. Warren and Hassan (1997a, 1997b) pose thetransition prediction problem within a nonlinear sys-
tem of equations involving the kinetic energy and
enstrophy. The exact governing equations provide alink between the laminar boundary-layer flow instabil-
ities, the nonlinear transitional flow state, and the fullyturbulent flow fluctuations. If the breakdown is initi-
ated by a disturbance with a frequency reminiscent of
the dominate growing instability, the simulations areinitiated. The influence of free-stream turbulence and
surface roughness on the transition location was
accounted for by a relationship between turbulence
level and roughness height with initial amplitude of
the disturbance. The initial comparisons with flat-
plate, swept fiat-plate, and infinite swept-wing wind
tunnel experiments suggest a good correlation
between the computations and experiments for a vari-
ety of free-stream turbulence levels and surface
conditions. Approaches relating flow instability and
transition and turbulence modeling show promise for
future computations of LFC-related aerodynamic
configurations.
3.5.6. ReceptivitymThe Ingestion of Disturbances
Morkovin (1969) is usually given the credit for
coining the process called receptivity. Receptivity is
the process by which free-stream turbulence perturbs
the boundary layer by free-stream disturbances origi-
nating at the edge of the boundary layer. Although
believed by many to be a significant piece of the tran-
sition process, only brief mention is given to receptiv-ity in this review. The rationale for this brief mention
lies with the fact that receptivity has not been an active
part in the history of LFC. However, receptivity will
inevitably play an important role in the future of NLF
and LFC technologies.
Let us quote Reshotko (1984) for a description oftransition and the role of receptivity. "In an environ-
ment where initial disturbance levels are small, the
transition Reynolds number of a boundary layer is
very much dependent upon the nature and spectrum of
the disturbance environment, the signatures in the
boundary layer of these disturbances and their excita-
tion of the normal modes ("receptivity"), and finally
the linear and nonlinear amplification of the growingmodes."
This description gives a view of what future LFC
design tools should involve to accurately capture the
unsteady transition process. The receptivity tools will
provide the disturbance spectrum and initial ampli-
tudes to be used by the linear and/or nonlinear evolu-
tion m_dule (e.g., linear stability theory, PSE theory)
to predtct the transition location or provide a means to
correlate the transition location. Such capability
already exists for the simplest of disturbance initiation
processes as described by Bertolotti and Crouch(1992).
Leehey and Shapiro (1980), Kachanov andTararykin (1990), Saric, Hoos, and Radeztsky (1991),
and V_iegel and Wlezien (1993) have conducted
receptivity experiments; Kerschen (1987), Tadjfar and
Bodonyi (1992), Fedorov and Khokhlov (1993),
Choudhari and Streett (1994), Choudhari (1994), and
Crouch (1994) have conducted theoretical studies of
receptivity to extend the knowledge base and capabil-
ity for predicting the receptivity process. Acoustic
noise, turbulence, and vorticity are free-stream influ-
ences end couple with single and distributed rough-
ness, s:eps and gaps, surface waviness, and other
things to produce disturbances in the viscous
boundary-layer flow which are relevant to NLF and
LFC applications. These ingestion mechanisms are
referred to as "natural receptivity"; however, there are
forced md natural categories of receptivity. Because
the dominant instabilities in a boundary-layer flow are
of a sh_rt scale, the receptivity initiation must inputenergy into the short-scale spectrum for the most effi-
cient excitation of disturbances. As Kerschen (1989)
pointed out, forced receptivity usually involves the
intentional generation of instability waves by supply-
ing energy to the flow at finite and selected wave-
lengths and frequencies that match the boundary-layer
disturbl,nce components. Examples of forced receptiv-
ity inchtde unsteady wall suction and blowing or heat-
ing and cooling (used for active flow control).
Forced theoretical and computational receptivity
is linked to the linear stability theory (section 3.5.3)
24
throughforcinga boundarycondition.Thefollowingequationis introducedastheboundaryconditionforthegenerationof adisturbancebysuctionandblowingthroughasingleorificein thewall(orboundary):
v = f(x) exp(-itot) (27)
where co is the frequency of the disturbance which one
desires to initiate, f(x) is the shape of the suction and
blowing distribution (generally a sine or cosine bubble
shape), and v is the resulting wall-normal velocity
component at the wall. Similar techniques can be used
for unsteady thermal forcing and to excite distur-
bances in a wind tunnel experiment.
Natural receptivity is more complicated in that
free-stream acoustic, turbulence, and vorticity are of
much longer wavelengths than the boundary-layer
disturbance. Complicating the matter, the free-stream
disturbance in nature has a well-defined propagation
speed and energy concentrated at specific wave-
lengths. Hence, the free-stream disturbance has no
energy in wavelengths that correspond to the
boundary-layer disturbance. So a mechanism musteffectively (and efficiently) be able to transfer energy
from the long-wavelength range to the short wave-
lengths. Mechanisms to accomplish this transfer
include the leading edge (of a plate and wing) and sur-
face discontinuities (e.g., bugs, surface roughness,
rivets).
Finally, the second class of natural receptivity
involves the interaction of long-wavelength free-stream disturbances with local mechanisms (i.e., wall
roughness, LFC suction, steps) to generate boundary-
layer disturbances. In this case, adjustments made tothe mean flow cannot be obtained with standard
boundary-layer equations. In this situation, the triple-
deck asymptotic approximation to the Navier-Stokes
equations is used. The triple deck produces an interac-
tive relationship between the pressure and the dis-
placement thickness due to matching of the
requirements between the three decks. The middle
deck or main deck responds inviscidly to the short-scale wall discontinuities. The viscous layer (lower
deck) between the main deck and the surface is
required to ensure that a no-slip boundary condition isenforced at the wall. Finally, the rapid change in dis-
placement thickness at the surface discontinuityinduces a correction to the outer potential flow. This
correction takes place in the upper deck. The mean
flow gradients due to the discontinuity serve as forcingterms for the disturbance equations. Therefore,
although much understanding about receptivity has
been gained over the past few years, significantresearch must be conducted, especially in the three-
dimensional effects and in supersonic flows, before
the tools become widely used as design tools. Again,
receptivity is included in this LFC review because it
will inherently play a role in future transition predic-
tion for NLF and LFC design tools.
To determine (or describe) this process of lengthscale conversion, Goldstein (1983, 1985) and
Goldstein, Leib, and Cowley (1987) showed that the
primary means of conversion was through nonparallelmean flow effects. Hence the two cases where nonpar-
allel effects are strongest are (1) regions of rapid
boundary-layer growth as at the leading edge where
the boundary layer is thin and rapidly growing and
(2) downstream at a surface discontinuity such as a
bump on the wall.
To determine the receptivity of the boundary layer
in the leading-edge region of a particular geometry tofree-stream disturbances, solutions of the linearized
unsteady boundary-layer equations are required. Thesesolutions match downstream with the Orr-Sommerfeld
equation, which governs the linear instability and
serves to provide a means for determining the ampli-
tude of the viscous boundary-layer disturbance.
3.5.7. Optimize Linear Design for LFC
Pertaining to the determination of what "optimal"suction distributions should be used on LFC systems,
Nelson and Rioual (1994) posed a determination bymeans of minimizing the power requirements to
achieve transition at a specified location, by applying
suction through a sequence of controllable panels.
Their paper had the problem formulated as a nonlinear
constrained optimization problem and focused more
on the stability of the algorithm than on the fluids
mechanics of the LFC system. In a comparable study,
Hackenberg, Tutty, and Nelson (1994) showed con-
vergence optimization of 2 or 4 panels is less than 10
iterations for the problem of transition on a flat plate.
More recently, Balakumar and Hall (1996)
employed optimal control theory and incompressiblelinear boundary-layer stability theory (N-factor of
25
9assumed) to predict the suction distribution under
the constraint of fixed mass flow (fixed energy
requirement). The beginning of the suction region was
imposed upstream of the neutral point and the end of
the suction was prescribed downstream of the transi-
tion point. For simplicity, the mean flow was
determined by solving incompressible boundary-layerequations. Although optimal suction is demonstrated
for TS wave control in a flat-plate boundary-layer
flow (Blasius), the resulting suction distributions for
traveling and stationary crossflow disturbances in
swept Hiemenz flow are quite relevant to HLFC
implemented on a swept wing at low speed. Interest-
ingly, the region of maximum suction occurred very
near the location of the onset of disturbance amplifica-
tion and progressively decreased through the region of
disturbance growth. In addition, Balakumar and Hall
concluded that over an order of magnitude more suc-
tion is required to control crossflow disturbances com-
pared with that required to control TS disturbances.
Stock (1990) posed an interesting way of viewing
boundary-layer instability with suction. The problem
was transformed from the problem of a boundary-
layer flow with a pressure gradient and suction to the
problem of an equivalent pressure gradient without
suction. The equivalence is imposed based on an iden-
tical form parameter, or shape factor H. Using integral
and finite-difference methods, the stability results forthe case with and without suction were shown to be in
agreement.
3.5.8. Thermal LFC
As early as the 1950s, the thermal concept was
recognized as a potential means for boundary-layerstabilization. Dunn and Lin (1953) realized and dem-
onstrated that mild surface cooling was able to stabi-
lize viscous boundary-layer instabilities which would
otherwise amplify and lead to transition. In fact, thecalculations showed that 2D disturbances could be
completely stabilized at Mach number of 1.6 for the
ratio of wall to free-stream temperature of 1.073,
which implies a small amount of cooling.
A more recent study by Boeing (Parihk and Nagel
1990), showed that with stability theory cooling can
be stabilizing to both TS and CF disturbances with
application to supersonic LFC transports.
Th, • application of thermal control for LFC air-
craft is in an infancy stage compared with suction
LFC. I;sues relating to the thermal surface are unre-
solved as of this publication. One of these potential
issues involves the possibility of surface waves being
generated through the use of strips of thermal control.
Whether such an application would generate waves
intolerable to laminar flow has not been studied yet.
3.5.9. Advanced Prediction of ManufacturingTolerances
Innovative tools have been developed to predict
the impact of manufacturing tolerances on the extent
of laminar flow; however, very little validation of
these tools has been documented. As Masad (1996a,
1996b) shows, interacting boundary-layer (IBL) the-ory, which accounts for the viscous-inviscid interac-
tion, can be coupled with either linear stability theory
or PSE theory to parameterize the allowable dimen-
sions of steps, gaps, rivets, and other things, which can
be used and not impact the laminar flow.
Nayfeh, Ragab, and AI-Maaitah (1987, 1988)
looked at the issue of manufacturing tolerances by per-
forming a study of boundary-layer instability around
humps and dips. Interacting boundary-layer theorywas ust:d to account for the viscous-inviscid interac-
tion associated with potential separation bubbles, and
the amplification of disturbances in the presence of
humps with various height-to-width ratios and at vari-
ous locations was studied. The results suggest thatN= 9 correlates well with the transition location. In
additior:, the size of the separation bubble is influ-
enced by the height-to-width ratio and Reynolds num-
ber, anti the disturbance instability is affected by the
height-to-width ratio and the location of the imperfec-tion from the leading edge of the plate and branch I ofthe neutral curve.
4. Laminar Flow Control Aircraft
Operations
The operational maintenance of laminar flow,
includirg controlling the accumulation of ice and
insects, is paramount to the incorporation of LFC on
aircraft. Both ice and insects generate roughness-
induced premature loss of laminar flow. Although
anti-icing systems have been operational for many
years on the leading edge of wings and on nacelles,
26

only limited research results for realistic insect-
prevention systems are available. This section focuses
primarily on the issue of insect accumulation and pre-vention; brief discussions on aircraft icing research,
the impact of atmospheric particulates on laminarflow, and boundary-layer control for high lift will
follow. Finally, a discussion of operational mainte-nance of laminar flow closes this section.
4.1. Insect Contamination
The population density of insects (or insects per
volume) depends on temperature, moisture, humidity,local terrain, vegetation, climate, wind speed, altitude,
and vehicle surface definition (e.g., wing shape).
Insect contamination along with ice adherence are two
of the most crucial operational issues which affect
NLF and LFC systems. A summary of the studies
addressing this issue follows.
On August 10, 1926, the first known attempt to
use an airplane in collecting insects was made underthe direction of E. P. Felt at Tallulah, Louisiana, in the
United States (lower Mississippi valley) and at
Tlahualilo, Durango, Mexico. Much of the test area is
swamp country, encompassing hundreds of small
lakes, bayous, rivers, and great forests. The project of
collecting insect data was conducted from August1926 to October 1931 and the results are reported by
Glick (1939) in a Department of Agriculture TechnicalBulletin. The investigation is of importance to LFC
(and aircraft in general) and documented the numbersand kinds of insects, spiders, and mites with atmo-
spheric conditions and altitude. DeHaviland H1 army
biplanes were used for the study and covered some150 000 miles. For the measure of insect density, traps
of 1 ft 2 embedded with fine-mesh copper screens were
placed between the biplane wings. A protective coverwas used to control the duration and altitude of expo-sure to the screens. All measurements were made with
10-min exposures at known speeds.
Although the altitudes ranged from 20 to 16 000 ft,the systematic studies were conducted at 200, 1000,
2000, 3000, and 5000 ft for daytime collections and
1000, 2000, 3000, and 5000 ft for nighttime collec-
tions. Over all altitudes, Glick (1939) reported that the
greatest number of insects was taken in May, withNovember and September following. The fewest
insects were taken in January and December. For
nighttime collections, the greatest numbers were takenin October followed by May. Results over the 5-yr
period indicated that the largest density of insects wasmeasured at low altitudes, with the number of insects
decreasing rapidly with increased altitude. Glick
(1939) also noted that temperature was one of the most
important meteorological factors in the control anddistribution of insects. He showed that the maximum
densities were measured at temperatures of 75 ° to
80°F. Finally, Glick (1939) noted that the insects and
mites captured at high altitude (and one spider at
15000 ft) were very small and completely at the
mercy of the air currents. The size, weight, and buoy-
ancy of the insects contributed directly to the height towhich the air currents carried it and hence to the pres-
ence of insects at high altitudes.
Hardy and Milne (1938) reported on the distribu-tion of insects with altitudes from 150 to 2000 ft. The
measurements were made with traps and nets carried
into the sky by kites in England. Their study con-ducted from 1932 to 1935 resulted in 839 insects cap-
tured in 124.5 hr of flight. Of interest here is that the
population density qualitatively agreed with Glick(1939) in that the largest density was at low altitude.
Although all insects were affected somewhat differ-
ently by the weather conditions, high temperature andlow humidity were determined to be more favorable toaerial drift than the reverse conditions. Freeman
(1945), under the direction of Hardy, expanded on the
early kite-flown study and found that the greatestnumbers and varieties of insects occurred in May,
June, and September. Although the information in
these studies were significant for the NLF technology,
the primary goals of the studies focused on character-
izing the insect families and the motion of agricultural
"pests" from one location to another.
Incidentally, in the flight testing of the
Hurricane II reported by Plascott et al. (1946), no flies
or insect debris was observed in this NLF flight test.
However, the drag measurements from previous flight
tests where flies and insects were picked up indicated
an increase in the drag due to insect debris. Hence, the
full advantages of laminar flow and the subsequent
low drag would require some method to prevent the
insects from adhering to the surface.
Atkins (1951) formally looked at the insect-
contamination problem by generating correlations
27

usingtheDakota,Wirraway,Mustang,andVampireaircraft.Theresultsgatheredfrom 24 flightsshowedthatcontaminationextendedto about14percentchordon theuppersurfaceandabout9 percentchordonthelowerwingsurface.A bughit wasonlyrecordedif ithad sufficient massto trip the boundarylayer.Furthermore,it wasreportedthatinsectcontaminationwasevidentin the winter,eventhoughMelbourne,Australia,hadacoolclimate.
As numerousarticlesin theliteraturehaveprevi-ouslystated,Coleman(1961)presentedoneof thefirstcomprehensivediscussions(reviews)of the issueofinsectcontamination.Colemannotedthatcorrelatingthenumerousenvironmentalconditionsto predicttheinsectdensitywashinderedbythefactthatavariationinoneparameter(e.g.,humidity)wasaccompaniedbysimultaneouschangesin otherparameters(e.g.,tem-perature,pressure).No consistentcorrelationshavebeenidentified for barometricpressure,humidity,light intensity,precipitation,or theelectricalstateoftheatmospherewith insectpopulationdensity.How-ever,air temperatureof 22° to 26°Candwindveloci-ties of between5 to 12 mph have beenshownindividuallytobeareasof maximumpopulationdensi-ties.Also,theinsectpopulationsweremaximizedneargroundlevelandrapidlydecreaseduptoanaltitudeof500ft. Thetemperatureandaltitudecorrelationswereconsistentwith thestudyby Glick (1939).Also, theregionof influencefor theaircraftwasduringtakeoffandinitial climb.Colemanproceededto discusstheentomologicalimpactoftheinsectoninfluencinglam-inarflow. Theinsecteitherremainsintactor disinte-grateswhenit impactsthesurface.Thisaccountwasdeterminedbythecriticalimpactvelocity(or rupturevelocity)of theinsect;therupturevelocitywasclearlydependenton theanatomicalstructureof the insect.Fieldandwindtunnelexperimentsrevealedthatrup-turevelocitiesbetween22.5and44.9mphwerefoundfor thevarietyof insectstested.Colemanalsonotedthatsmaller(1 to 3 mm)insectsweremorenumerousthanlarger(>3ram)insects.
CroomandHolmes(1985)reportedon a flightexperimentusingaCessna206to studytheinsectcon-taminationproblem.Theairspeed,altitude,andangleof attackwererecordedonmagnetictape.Thesurfacewinds,temperatures,andinsectcountsweremanuallyrecorded.Thetestswereconductedin a highinsectpopulationareato providethepotentialfor largeden-
sity(insect/1x 106ft3)accumulation.Flightdurationslastedfrom10to50minandtheairspeedrangedfrom80to 130mph.Thepresentflighttestresultsshowninfigure25 wereconsistentwith the earlierstudiesofGlick (1939),Hardy and Milne (1938),Freeman(1945),Coleman(1961) and Mareshand Bragg(1984).(Note,thepopulationdensitieswerenormal-izedbythelargestvalues.)Clearly,thelargestnumberof strikesoccurrednear77°Fin4to 8 mphwindsandrapidlydroppedoff in coolerandhottertemperatures.Furthermore,the insectdensityrapidlydroppedoffwith increasedaltitudeandtheinsectprotectionwasnotnecessaryatthehigheraltitudesabove500ft.
Estimatingthe insectimpacton the resulting"roughnesssize"wasadifficultcorrelationtomeasurebecausetheimpactwasa functionof bothincidenceandspeedof theinsect-surfaceconnection.Normally,theaccumulationofinsectswasmeasuredaftertheair-craft landed,without regardto the incidenceandspeed.However,somelimited observationsweremadein thewindtunnel.To modeltheinsectin refer-enceto thewing(ormostotherparts)of theaircraft,theinsectwasassumedto beaninanimateobjectforthepurposeof dynamicanalysis.This assumptionismadebecausethe dragwhichan insectexperiencesduetotheinducedvelocityin thevicinityof thewingsignificantlyexceedsthe propulsiveforcethat theinsectexerts.Basedon theinanimatemodelof theinsect,thetheoreticalstreamwiseextentof therough-nessha_shownsomeagreementwith availabledatafor 2D incompressibleflow. The theoreticalandexperirrentalresultsagreedquitewell for 2Dairfoilsandmildlysweptwings.Theconclusionof thiscom-parisonwasthatif thechordwisevelocitycomponentwasmuchlargerthanthespanwisevelocitycompo-nent,the insectaccumulation(and resultingrough-ness)wasessentiallya2Dprocess.
Low-speedwindtunnelresultsindicatedthattheresultingexcrescenceheightfor variousgeometryair-foilsat _mallangleof attackwasmaximizedneartheleadingedgeof thewingsanddecreasedin sizetoabout30 percentchord(upperand lowersurface),whereinsectaccumulationceasedexceptfor highangleot attack.
MareshandBragg(1984)developedamethodtopredictthecontaminationof anairfoil by insectsandthe resultant performancepenalty. The model
28

neglectedanylift thatmaybeproducedbythebodyoftheinsectandassumedthatthreeplanesof symmetryexistedabouttheinsectandthattheforcesactingontheinsectwereknown.Thevelocityflow field abouttheairfoilwasrequired(neglectingtheviscouseffectsin the boundarylayer)andthe insectdragandliftcoefficientswererequiredto computeinsecttrajecto-ries.Additionally,therupturevelocityof aninsectwasa functionof theshellhardnessandamountof bodyfluid containedwithin it. The resultsshowedthat(1)angleof attack,Reynoldsnumber,andaccretionconditionsinfluencedtheinsectcontaminationextent;(2)theeffectof contaminationfor agivenairfoilvar-iedfordifferentinsectsizesandtypes;and(3)theair-foil geometryplayedasignificantrolein determiningtheinsectaccretionpattem.
Coleman(1961)closedthe discussionof insectcontaminationbydiscussingtechniquestoeitherelim-inateor preventtheroughness-inducedeffectsof theinsectto laminarflow. Preventivetechniquesdis-cussedinclude(1)papercoverswhichcoverthesur-faceuntil sufficientaltitudeis reachedandthecoveris either releasedor extractedinto the aircraft,(2)mechanicalscraperswhich scrapethe surface,(3)deflectorswhicheithercatchtheinsectsor causetheirpathstobedeflectedawayfromthesurface,(4)ahighlyviscousfluid layerin whichtheinsectsweretrappedandcarriedawayin flight by thehighshear,(5) a coverwhich is dissolvableby fluid discharge,(6) a coverwhichis removedby a thermalprocess,(7) relaminarizationdownstreamof thecriticalinsectstrikearea,and(8)continuousliquiddischarge.
4.1.1. Paper Cover
Covering the test section with paper was the sim-
plest (or least mechanical) anti-insect device. Thisdevice was successfully used in the major laminar
flight tests, including Gray and Davies (1952) with the
King Cobra flight test; Head, Johnson, and Coxon
(1955) with the Vampire porous-suction flight test;Groth et al. (1957) with the F-94 slot-suction flight
test; and Runyan et al. (1987) with the Boeing 757
NLF flight test.
Gray and Davies (1952) reported on King Cobra
flight tests at the Royal Aircraft Establishment in
England. As the Spring days became warmer, theinsect contamination problem increased (even if the
flight tests were conducted early in the morning). Thisobservation is consistent with the insect density
increase with temperature discussed earlier. To avoid
the insect problem, a sheet of paper covered 0 to
30 percent chord on the upper and lower surface of thetest section. After the aircraft takeoff and climb to suf-
ficient altitude, the pilot could jettison the paper by
pulling a string attached to the paper and retrieving the
paper inside the cockpit through a piece of pitot
tubing.
To avoid insect contamination for the Vampire
porous-suction flight tests reported by Head, Johnson,and Coxon (1955), the test-section sleeve was pro-
tected during takeoff and climb by a strip of tracing
paper that covered from the leading edge to about
10 percent chord and was fixed to the surface withadhesive tape. Takeoff was delayed until 100 knots
had been reached. This speed was maintained during
takeoff and climb, and at "sufficient altitude," the
tracing paper was jettisoned by reducing the speed to90 knots.
To avoid insect contamination for the F-94A flight
tests of a slot-suction LFC experiment reported by
Groth et al. (1957), the first 30 percent of the upper
and lower surface of the test section on the wing was
protected with a cover of blotting paper taped to thewing. This paper remained attached through takeoff
and climb, then the plane was decelerated to remove
the covering. Without this covering, turbulent wedges
were generated from the insect remains. However, full
laminar flow could be regained by climbing to higher
altitudes (25 000 ft). This regaining of laminar flow is
understood to be a unit Reynolds number effect. Forconstant Mach number, a climb in altitude decreases
the unit Reynolds number and, as discussed insection 2, a lower unit Reynolds number flow is more
tolerant to a roughness (insect impact) of given size.
For the Boeing 757 NLF flight tests (Runyan et al.
1987), the glove was protected from insect strikes dur-
ing takeoff and climb by using a paper covering until
the airplane reached 5000 ft at which time the paper
was pulled into the cabin via a nylon cord. On flights
not using the protective covering, loss of laminar flow
was observed during the flight and evidence of insectaccumulation near the attachment line was measured
after landing.
29
4.1.2. Scrapers
Wires and felt pads have each been tested with
some success in wind tunnel experiments, the latter
working for painted surfaces. The problem of dragpenalty due to the device was not evaluated; however,the device must either be contained in the skin of the
aircraft during cruise flight or be jettisoned to avoid an
unreasonable drag penalty (Coleman 1961).
4.1.3. Deflectors
Deflectors consist of a surface (or plate) that
forms a nose flap which protects the leading edge of
the wing from insects and absorbs the insect impacts.
Tamigniaux, Stark, and Brune (1987) discussed a
wind tunnel experiment to test the effectiveness of the
Krueger high-lift device used as a shield against
insects (although the insects used were larger relative
to the model size than would be encountered in flight).
Note, figure 2 shows a leading-edge Krueger device,which would be retracted after takeoff and climb,
leaving a clean leading edge for cruise. The 2-ft model
consisted of a slotted-leading-edge Krueger flap on a
wing section. The insects were injected into the wind
tunnel at a free-stream velocity of 4 ft/sec upstream ofthe wing leading edge. Without insects, the Krueger
flap was varied for 37 different positions, optimizing
for maximum high-lift characteristics. The optimal
position was a 45 ° deflection and the optimal gap and
trailing-edge gap were both 2 percent of the airfoil ref-
erence chord. The results showed that lighter insects
impacted farther aft of the stagnation line than heavierinsects; this indicates that heavier insects have
straighter trajectories than lighter insects. A particle
trajectory code was developed for two-dimensionalmultielement airfoils; the calculated results were in
good agreement with the experiment. Insects impact-
ing at an angle less than 7 ° left negligible body rem-
nants on the wing upper surface to trip the laminar
boundary layer. The Krueger concept has been demon-
strated to be effective in flight on Jetstar LEVI" aircraft
(Powell 1987); however, incorporating an anti-icingsystem into the Krueger device remains an issue.
This concept has been developed into the modem
day Krueger flap and demonstrated on the Jetstar
flight test (Maddalon and Braslow 1990) described in
section 6.3. Also, this concept was successful for the
Boeing 757 HLFC flight experiment (Collier 1993) as
30
describ._d in section 6.6. The results indicated that it
was po,_sible to protect the upper surface but it was not
possible to protect the lower surface. However, the
plate device caused considerable drag and a pitching
moment. The retracted reflector could introduce sig-
nifican! ridges. The Krueger flap serves to both protectthe surface from insect strikes and improve lift.
4.1.4. Fluidic Cover
Coleman (1952) discussed wind tunnel tests that
employed the application of glycerine, glycerine andgelatine, and soap and methanol to wing sections.
These solutions would be wiped away as the aircraft
reaches sufficient speed to cause the shear to remove
the fluid (and insects). Although these solutions wereshown to decrease the accumulation of insects on the
test article, complete elimination of the insects was not
possible. Continuous spraying of the solution was
shown Io be effective and required a penalty of 0.2 to0.5 of the TOGW of the aircraft.
4.1.5. Thermal Cover
Under the concept of thermal covers, flammable
covers which could be electrically ignited can be ren-
dered out of possible solutions because of safety (and
pollutioa) concerns. Heating (rather cooking) the
insects antil they are consumed has been suggested,but the high temperatures required would be undesir-
able to the wing structure. Imposing a layer of ice on
the structure has been suggested and such a conceptwould be ideal in terms of preventing insect accumula-
tion. Tl-is layer of ice would then be removed after
takeoff and climb by the conventional de-icing sys-tems. Tie application of the ice layer to the aircraft,
potentially damaging effects of large ice pieces break-
ing away from the wing, the required thickness of ice
required to prevent insect contamination, the mini-
mum time to remove the ice layer, and the associated
performance penalty during takeoff are issues thatmust be addressed. Coleman (1952) discussed some
wind tulmel tests addressing some of these issues.
4.1.6. Relaminarization
Coleman (1961) noted that relaminarization
through the use of suction slots was investigated byCumming, Gregory, and Walker (1953). The results of
their wind tunnel experiment indicated that the pump

dragincreasedbecauseof the suction approximately
balancing the profile drag due to the insect-roughened
surface; hence, no apparent performance gain wasrealized with the suction slot.
4.1.7. Liquid Discharge
Peterson and Fisher (1978) reported on insect con-
tamination by using a Jetstar aircraft. The goals of the
experiment were investigating the extent of the insect
problem at large airports, determine whether insect
accumulation would erode in cruise flight, test the
ability of the then new surface coatings to alleviate the
insect accumulation problem, and test leading-edge
sprays for anti-insect protection. In November 1977,the Jetstar was flown on 15 takeoff and climb missions
to estimate the insect accumulation problem at Los
Angeles, Sacramento, and San Francisco airports
under normal airline-type operations. Insects wereaccumulated on 13 of the 15 flights and caused prema-
ture transition. The initial flights confirmed that insect
accumulation and resulting premature transition
required an anti-insect accumulation system. At the
trailing edge of the flaps, boundary-layer probesrecorded the state of the boundary layer. Next, five
spanwise segments of the leading-edge flap were
treated with (a) an aluminum alloy untreated surface,
(b) a spray-on DuPont Teflon coating, (c) DuPont
Teflon pressure-sensitive tape, (d) organosilicone
hydrophobic coating, and (e) random rain repellent
coating. Flights were then conducted from many air-
ports in the United States ranging from California toTexas to Florida. Insects were encountered on all
flights and the coatings were insufficient to removethe insect contamination interrupting laminar flow.
The insect accumulation on super-slick Teflon sur-
faces and hydrophobic coatings was compared with
standard reference aluminum. The flight test results
showed that none of the surfaces tested showed any
significant advantages in alleviating the insect con-
tamination. Five types of flight tests were conducted
with the spray insect-avoidance system: (1) no spray,
(2) water-detergent spray after all low passes,
(3) large-droplet water detergent spray after low
passes, (4) continuous water spray during low passes,
and (5) intermittent water-detergent spray during two
passes. The first test was used as the calibration or ref-
erence flight. The flight test with continuous spraywas most effective and no insect remains were
observed in the spray area (consistent with the results
of Coleman, 1952). Once insects have accumulated on
dry surfaces, they could not be removed in flight with
water and detergent spray.
In the Croom and Holmes (1985) flight experi-ment, three different fluids were considered for the
purpose of both insect prevention and ice protection.The solutions were (1) monoethylene glycol
(Aeroshell 07) and water solution, (2) propylene
glycolmethyl ether, and (3) monoethylene glycol(MEG) and water. The fluid was discharged through
either slots or perforated holes, where the holes had
a diameter of 0.0025 in. and were spaced about
0.0205 in. apart. The TKS anti-icing system served as
the method for the current test, partially because the
system has already been certified for several aircraft.
The left wing which had no insect protection was usedas the baseline. The tests showed that the insect-
protection system should be activated before insect
impact. The ratio of water to MEG in the fluid system
and the flow rate played significant roles in the effec-
tiveness of the insect protection system. The MEG/
water solution of 20/80 percent was very ineffective in
reducing the number of insect strikes. Approximately
10-percent fewer strikes were realized by using this
solution. However, with 80/20 percent solution, a
75-percent (or greater) reduction in the number ofrecorded insect strikes was realized. As the flow rate
was increased, the total insect accumulation
decreased. Croom and Holmes (1985) noted that only
a 3-in. perforated region on the panel and a flow rateof 0.16 to 0.33 gal/min were required to achieve a 68-
to 82-percent reduction in the insect accumulation.
Bulgubure and Arnal (1992) and Courty,
Bulgubure, and Arnal (1993) reported the use of a
TKS insect avoidance system for the HLFC flight tests
using a Falcon 50 test aircraft. Monopropylene glycol(MPG) was the fluid chosen for use in this system.
During low-altitude flight tests over insect-infested
areas, the port (untreated) side of the aircraft had600 insects/m 2 impact the leading edge in the region
of interest, whereas on the starboard (treated) side
with the MPG fluid, no insect contamination was
noted. Hence, the TKS system was very effective forinsect avoidance.
4.1.8. Flexible Surface or Cover
Compared with protective coverings or continuous
spray techniques, Wortmann (1963) proposed using a
31
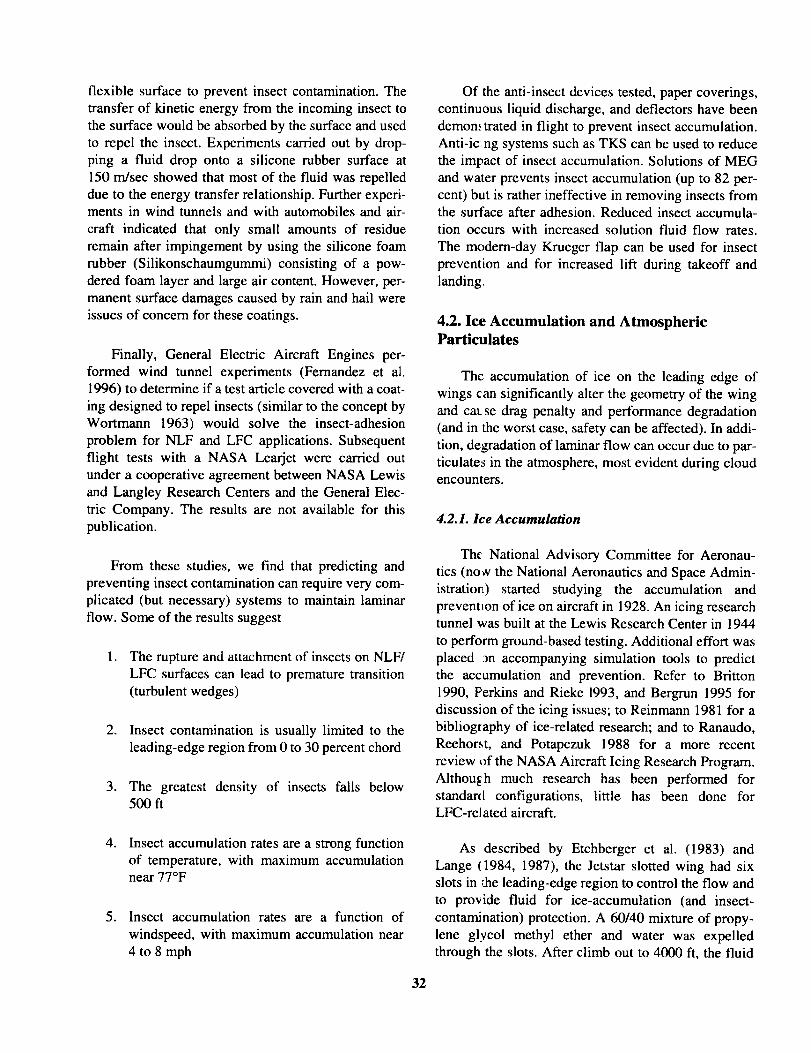
flexiblesurfaceto preventinsectcontamination.Thetransferof kineticenergyfromtheincominginsecttothesurfacewouldbeabsorbedbythesurfaceandusedto repelthe insect.Experimentscarriedoutby drop-ping a fluid drop ontoa siliconerubbersurfaceat150m/secshowedthatmostof thefluid wasrepelleddueto theenergytransferrelationship.Furtherexperi-mentsin windtunnelsandwith automobilesandair-craft indicatedthat only small amountsof residueremainafterimpingementby usingthesiliconefoamrubber(Silikonschaumgummi)consistingof a pow-deredfoamlayerandlargeair content.However,per-manentsurfacedamagescausedbyrainandhailwereissuesof concernforthesecoatings.
Finally, GeneralElectricAircraft Enginesper-formedwind tunnel experiments (Fernandez et al.1996) to determine if a test article covered with a coat-
ing designed to repel insects (similar to the concept byWortmann 1963) would solve the insect-adhesion
problem for NLF and LFC applications. Subsequent
flight tests with a NASA Learjet were carried out
under a cooperative agreement between NASA Lewis
and Langley Research Centers and the General Elec-
tric Company. The results are not available for this
publication.
Of the anti-insect devices tested, paper coverings,
continuous liquid discharge, and deflectors have been
demon, trated in flight to prevent insect accumulation.
Anti-ic ng systems such as TKS can be used to reduce
the impact of insect accumulation. Solutions of MEG
and water prevents insect accumulation (up to 82 per-
cent) but is rather ineffective in removing insects fromthe surface after adhesion. Reduced insect accumula-
tion occurs with increased solution fluid flow rates.
The modern-day Krueger flap can be used for insect
prevention and for increased lift during takeoff and
landing.
4.2. Ice Accumulation and AtmosphericParticulates
The accumulation of ice on the leading edge of
wings can significantly alter the geometry of the wing
and cause drag penalty and performance degradation
(and in the worst case, safety can be affected). In addi-
tion, degradation of laminar flow can occur due to par-
ticulates in the atmosphere, most evident during cloudencounters.
4.2.1. Ice Accumulation
From these studies, we find that predicting and
preventing insect contamination can require very com-plicated (but necessary) systems to maintain laminar
flow. Some of the results suggest
. The rupture and attachment of insects on NLF/
LFC surfaces can lead to premature transition
(turbulent wedges)
2. Insect contamination is usually limited to the
leading-edge region from 0 to 30 percent chord
3. The greatest density of insects falls below500 ft
The National Advisory Committee for Aeronau-
tics (no_v the National Aeronautics and Space Admin-
istration) started studying the accumulation and
preventLon of ice on aircraft in 1928. An icing researchtunnel was built at the Lewis Research Center in 1944
to perform ground-based testing. Additional effort was
placed 9n accompanying simulation tools to predict
the accumulation and prevention. Refer to Britton
1990, Perkins and Rieke 1993, and Bergrun 1995 for
discussion of the icing issues; to Reinmann 1981 for abibliography of ice-related research; and to Ranaudo,
Reehorst, and Potapczuk 1988 for a more recent
review of the NASA Aircraft Icing Research Program.
AlthouGh much research has been performed forstandard configurations, little has been done forLFC-related aircraft.
.
.
Insect accumulation rates are a strong function
of temperature, with maximum accumulationnear 77°F
Insect accumulation rates are a function of
windspeed, with maximum accumulation near
4 to 8 mph
As described by Etchberger et al. (1983) and
Lange (1984, 1987), the Jetstar slotted wing had six
slots in file leading-edge region to control the flow and
to provide fluid for ice-accumulation (and insect-
contamination) protection. A 60/40 mixture of propy-
lene glycol methyl ether and water was expelledthrough the slots. After climb out to 4000 ft, the fluid
32
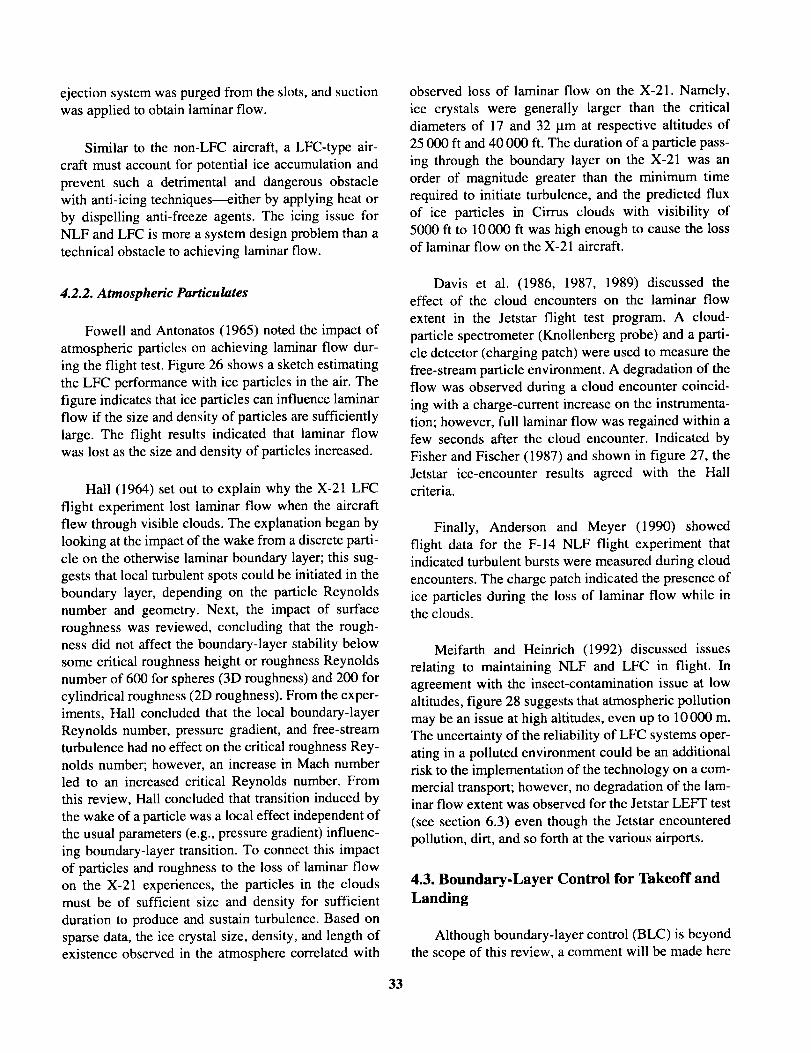
ejectionsystemwaspurgedfromtheslots,andsuctionwasappliedto obtainlaminarflow.
Similarto thenon-LFCaircraft,a LFC-typeair-craftmustaccountfor potentialiceaccumulationandpreventsucha detrimentaland dangerousobstaclewithanti-icingtechniques--eitherbyapplyingheatorby dispellinganti-freezeagents.Theicing issueforNLFandLFCismoreasystemdesignproblemthanatechnicalobstacletoachievinglaminarflow.
observedlossof laminarflow on theX-21.Namely,ice crystalsweregenerallylargerthan the criticaldiametersof 17and32_tmat respectivealtitudesof25000ft and40000ft. Thedurationof aparticlepass-ing throughtheboundarylayeron the X-21wasanorderof magnitudegreaterthanthe minimumtimerequiredto initiateturbulence,andthepredictedfluxof ice particlesin Cirrus cloudswith visibility of5000ft to 10000fl washighenoughto causethelossof laminarflowontheX-21aircraft.
4.2.2. Atmospheric Particulates
Fowell and Antonatos (1965) noted the impact of
atmospheric particles on achieving laminar flow dur-
ing the flight test. Figure 26 shows a sketch estimating
the LFC performance with ice particles in the air. The
figure indicates that ice particles can influence laminarflow if the size and density of particles are sufficiently
large. The flight results indicated that laminar flowwas lost as the size and density of particles increased.
Hall (1964) set out to explain why the X-21 LFC
flight experiment lost laminar flow when the aircraft
flew through visible clouds. The explanation began by
looking at the impact of the wake from a discrete parti-cle on the otherwise laminar boundary layer; this sug-
gests that local turbulent spots could be initiated in the
boundary layer, depending on the particle Reynoldsnumber and geometry. Next, the impact of surface
roughness was reviewed, concluding that the rough-ness did not affect the boundary-layer stability below
some critical roughness height or roughness Reynolds
number of 600 for spheres (3D roughness) and 200 for
cylindrical roughness (2D roughness). From the exper-iments, Hall concluded that the local boundary-layer
Reynolds number, pressure gradient, and free-streamturbulence had no effect on the critical roughness Rey-
nolds number; however, an increase in Mach number
led to an increased critical Reynolds number. Fromthis review, Hall concluded that transition induced by
the wake of a particle was a local effect independent of
the usual parameters (e.g., pressure gradient) influenc-
ing boundary-layer transition. To connect this impact
of particles and roughness to the loss of laminar flowon the X-21 experiences, the particles in the clouds
must be of sufficient size and density for sufficient
duration to produce and sustain turbulence. Based on
sparse data, the ice crystal size, density, and length of
existence observed in the atmosphere correlated with
Davis et al. (1986, 1987, 1989) discussed theeffect of the cloud encounters on the laminar flow
extent in the Jetstar flight test program. A cloud-
particle spectrometer (Knollenberg probe) and a parti-
cle detector (charging patch) were used to measure the
free-stream particle environment. A degradation of the
flow was observed during a cloud encounter coincid-
ing with a charge-current increase on the instrumenta-
tion; however, full laminar flow was regained within afew seconds after the cloud encounter. Indicated by
Fisher and Fischer (1987) and shown in figure 27, the
Jetstar ice-encounter results agreed with the Hallcriteria.
Finally, Anderson and Meyer (1990) showed
flight data for the F-14 NLF flight experiment thatindicated turbulent bursts were measured during cloud
encounters. The charge patch indicated the presence of
ice particles during the loss of laminar flow while inthe clouds.
Meifarth and Heinrich (1992) discussed issues
relating to maintaining NLF and LFC in flight. In
agreement with the insect-contamination issue at low
altitudes, figure 28 suggests that atmospheric pollution
may be an issue at high altitudes, even up to 10000 m.
The uncertainty of the reliability of LFC systems oper-
ating in a polluted environment could be an additional
risk to the implementation of the technology on a com-
mercial transport; however, no degradation of the lam-inar flow extent was observed for the Jetstar LEFT test
(see section 6.3) even though the Jetstar encountered
pollution, dirt, and so forth at the various airports.
4.3. Boundary-Layer Control for Takeoff and
Landing
Although boundary-layer control (BLC) is beyond
the scope of this review, a comment will be made here
33
becauseBLCisrelatedto LFCin thatthesuctionsys-temusedforLFCcouldpotentiallybeusedfor BLC.
An aircraftin high-liftmodedroopstheleading-edgeflapsto enhanceLID (increased camber). This
can lead to a region of flow separation over the flap
and reattachment near the hinge line. One proposedBLC concept involves drooping the leading-edge flapmore than conventional and use BLC suction to attach
the otherwise separated flow. BLC would be applied
just downstream of the hinge line.
Parikh et al. (1990) did a Euler computational
analysis of the BLC suction concept with application
to a supersonic transport. An assessment of the impact
on aerodynamic performance with BLC was comparedwith the simple flap device without BLC. Boeing's 3D
inviscid flow code--PANAIR--was used for a por-
tion of the study. The Euler analysis was deemed suf-
ficient for the study since previous studies have shown
that the inviscid analysis was capable of capturing the
vortex formation and nonlinear evolution on sharp
leading-edge wings. The Euler analysis provided the
pressure distributions, which were then used in a 3D
boundary-layer analysis to determine the state of the
viscous flow. The significance of Reynolds number
scaling was an important factor drawn out in the anal-
ysis. At flight Reynolds numbers, the inboard portion
of the wing indicated attached flow. However, at
lower Reynolds numbers (but same unit Reynoldsnumber), the flow separated on models which were
less than 1/4-scale. The calculations were repeated to
include unit Reynolds number variations. The conclu-
sion was that flow separation was only impacted bychord Reynolds number effects. However, the unit
Reynolds number calculations did not take into
account the additional sensitivity of the flow to rough-
ness (steps, gaps, joints). For the outboard portion of
the wing, separation was encountered (when transition
was assumed to occur at 5 percent chord). The effect
of BLC and suction-region extent were then studied
for the separated flow problem. The "optimized"
results showed that for the four spanwise regions stud-
ied, a chordwise extent beginning at the suction peak
location and covering 1 percent chord was sufficient
for separation control. The results showed that
Cq = 0.003 inboard and Cq = 0.004 outboard were suf-
ficient to prevent flow separation. Lower Cq wasrequired inboard because of the smaller suction peak.
These suction levels indicate that BLC required an
order qff magnitude more suction than LFC. The
resulting pressure drop was 10 psf for supersonic LFC
and 20 to 40 psf for BLC. The BLC led to a drag
improv,_ment of about 10 percent over the optimizedflap configuration. Parikh et al. (1990) noted that a
more definitive assessment of performance benefits
due to BLC should be made through wind tunnel tests.
4.4. Operational Maintenance of Laminar
Flow
The maintenance and manufacturing of smooth
surfaces is a significant issue in achieving laminarflow, potentially creating an additional burden on the
day-to-day operations of NLF and LFC aircraft.
Gray and Davies (1952) reported on the experi-
ences gained at the RAE in England dealing with sur-
face deterioration issues. In the King Cobra flight
tests, the test section of the wing was coated with two
coats of primer and one coat of filler, followed by
additional smoothing when deemed necessary. Over a
6-month period, the surface deteriorated only in the
skin joints regions. The aircraft was exposed to
weather for about 200 hr and 50 flights entailing about
40 hr. The rest of the time it was housed in a hangar.For different King Cobra aircraft, which was in the
open for about 2 years, the skin surface was chalky(dirty) _nd rivet and joints areas were the only areas of
the wing that had any surface damage (cracking). The
surface degradation results at the rivet-gap-joint areas
were consistent with those found by Plascott (1946)
and Plascott et al. (1946) for the Hurricane II flight
test program. Gray and Davies (1952) noted that once
the ground crews became habitually aware of the sen-
sitivity .'equired for handling the wing surface for the
Hurricaae and King Cobra programs, protective cover-
ings for the surface became unnecessary.
In the description of a porous-suction flight exper-iment on a Vampire aircraft, Head, Johnson, and
Coxon q1955) noted an operational issue that must be
addresse.d when using powered suction systems. If thesuction pump were to fail, then outflow could cause
premature separation at high lift coefficients. This
potential problem could be alleviated with simple non-return valves to prevent outflow conditions.
Related to the issue of maintaining laminar flow ina variety of flight environments and maneuvers, Groth
34

etal. (1957)notedthat 100percentlaminarflow wasmaintainedin horizontalflight, duringclimb,turns,and descentfor a rangeof Machnumbers.Both12-slotand69-slottestsrealizedalossof laminarflowflyingthroughclouds(consistentwiththeX-21 flighttestobservations);laminarflow wasregainedwithin30secafteremergingfromthecloud.Also, laminarflow wasmaintainedin moderatelygustyweather.However,strongatmosphericturbulencelevelscanleadto alossof laminarflow.Thiswasdemonstratedin 2-sec 0.5g and 30-sec0.3g accelerationsforchordReynoldsnumbersof 22× 106and27× 106,respectively.
Later,Carmichael,Whites,andPfenninger(1957)studiedthe impact of slot blockage on laminar flowextent for the 69 slot-suction test on the F-94A air-
plane. The tests were confined to the second slot of
chamber 5 (or the 22nd slot of 69 at 63.42 percent
chord). Paint plugs of slot chord length and with spansof 0.007, 0.0115, 0.015, 0.030, 0.20, 0.50, and 1.0 in.
were individually tested. All slots maintained the nor-mal suction distribution, whereas the suction in theslots in chamber 5 was varied. The results are summa-
rized as (1) for the 0.007-in. plug, no turbulence was
observed for the range of normal to maximum suction;
(2) for the 0.0115-in. plug, turbulence was realized
only after the suction was increased beyond 2.4 timesthe normal value; (3) for the 0.015- and 0.03-in. plugs,
normal suction produced turbulence and reducing the
level by 80 percent reestablished laminar flow; (4) for0.2-, 0.5-, and 1.0-in. plugs, greater than normal suc-
tion values were limiting; and (5) the upper suction
limit increased with increasing Reynolds number.
Essentially, the slot blockage can cause a pair of adja-cent vortices to combine and form a horseshoe vortex
and lead to turbulence.
Because the X-21A wings were built from many
panels spliced together on the wing, epoxy fills were
required over the panel splices to meet the high unit
Reynolds number step and waviness tolerances
(Fowell and Antonatos, 1965). However, the epoxyencountered cracking and chipping under the wing
loading and temperature changes of flight. The bond-
ing process proved to be the cause of the fill unreli-
ability and the process was successfully changed toachieve reliable tolerances. However, most of the
ground maintenance time was charged to the repair
and maintenance of these joint areas. Further laminar
flow tests must carefully address this issue.
Meifarth and Heinrich (1992) had an in-depth dis-
cussion of issues relating to achieving and maintaining
NLF and LFC from the operations perspective. A flow
chart of multidisciplinary issues which must be
addressed prior to the use and reliance of laminar flow
on aircraft performance was presented. Issues whichwould cause an increase in DOC for aircraft and those
which would cause a decrease in DOC are connected.
Some issues include the need for additional spare parts
and maintenance due to the suction system, uncertain-
ties in the potential contamination due to pollution res-
idue on the structural surface, and operational plan for
suction-system failure. The latter concern affects a
decrease in range and increase in fuel burn as a result
of the unexpected turbulent drag.
5. Laminar Flow Control Prior to
OPEC Oil Embargo
In this section, LFC projects are discussed for the
time frame prior to the OPEC oil embargo. Each sec-tion has the configuration or model information,
project goals, and summarized results.
5.1. B-18 Slot-Suction Glove Flight Test (1941)
Following the NLF flight test of Wetmore,Zalovcik, and Platt (1941), results of a 1941 LFC
flight test experiment were reported in an NACA
Wartime Report by Zalovcik, Wetmore, andVon Doenhoff (1944). A test panel with nine spanwise
suction slots was mounted on the left wing (NACA
35-215 airfoil) of a B-18 airplane (provided by the
Army Air Corps). The test panel shown in figure 29
had a chord of 204 in. and a spanwise extent of 120 in.
at the leading edge and tapered to 60 in. at the trailing
edge. The nine original suction slots were spaced
5 percent chord apart and were located from 20 to60 percent chord. The eight additional slots were later
added between each of the original slots. Suction was
supplied by an 85-hp Ford engine. Below each slot,the external flow was drawn through 0.25-in-diameter
holes drilled in the wood panel spaced 0.75 in. apart.
The airflow was manually regulated by butterflyvalves located in the cabin. Static-pressure orifices
35
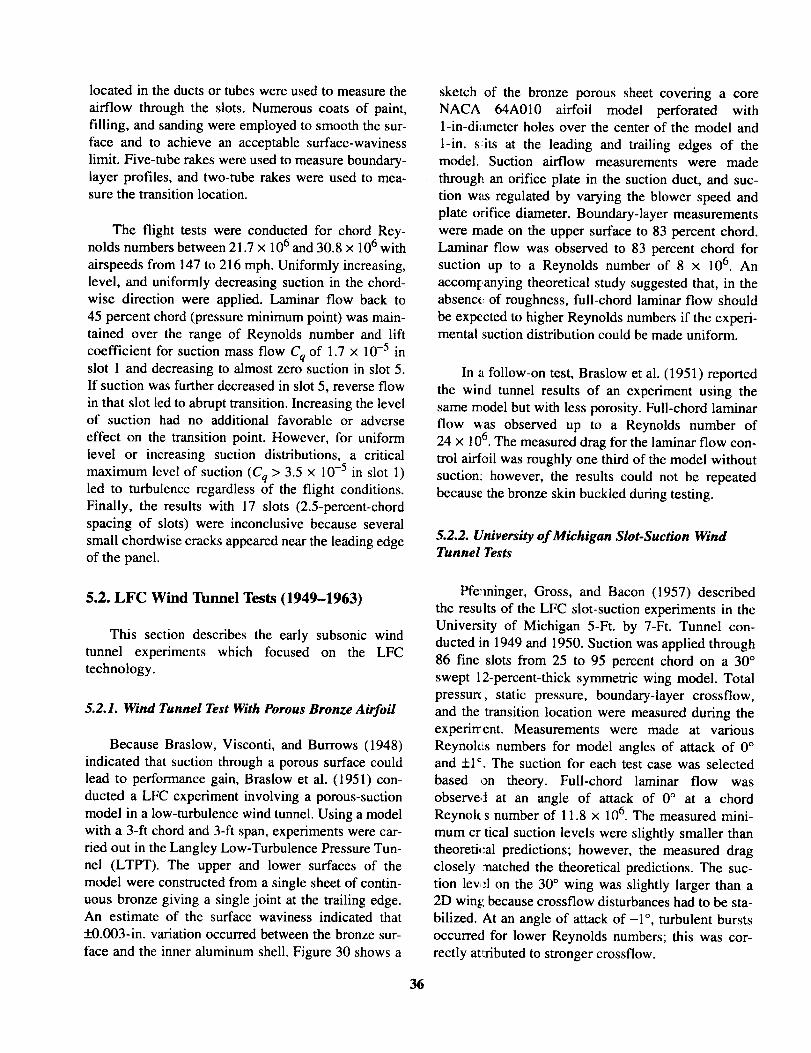
locatedin theducts or tubes were used to measure the
airflow through the slots. Numerous coats of paint,
filling, and sanding were employed to smooth the sur-
face and to achieve an acceptable surface-waviness
limit. Five-tube rakes were used to measure boundary-layer profiles, and two-tube rakes were used to mea-sure the transition location.
The flight tests were conducted for chord Rey-nolds numbers between 21.7 × 10⁶ and 30.8 x 10⁶ with
airspeeds from 147 to 216 mph. Uniformly increasing,level, and uniformly decreasing suction in the chord-
wise direction were applied. Laminar flow back to
45 percent chord (pressure minimum point) was main-
mined over the range of Reynolds number and lift
coefficient for suction mass flow Cq of 1.7 x 10⁻⁵ inslot 1 and decreasing to almost zero suction in slot 5.
If suction was further decreased in slot 5, reverse flow
in that slot led to abrupt transition. Increasing the levelof suction had no additional favorable or adverse
effect on the transition point. However, for uniform
level or increasing suction distributions, a critical
maximum level of suction (Cq > 3.5 x 10⁻⁵ in slot 1)led to turbulence regardless of the flight conditions.
Finally, the results with 17 slots (2.5-percent-chordspacing of slots) were inconclusive because several
small chordwise cracks appeared near the leading edgeof the panel.
5.2. LFC Wind Tunnel Tests (1949-1963)
This section describes the early subsonic wind
tunnel experiments which focused on the LFC
technology.
5.2.1. Wind Tunnel Test With Porous Bronze Airfoil
Because Braslow, Visconti, and Burrows (1948)
indicated that suction through a porous surface could
lead to performance gain, Braslow et al. (1951) con-
ducted a LFC experiment involving a porous-suction
model in a low-turbulence wind tunnel. Using a model
with a 3-ft chord and 3-ft span, experiments were car-
ried out in the Langley Low-Turbulence Pressure Tun-
nel (LTPT). The upper and lower surfaces of the
model were constructed from a single sheet of contin-
uous bronze giving a single joint at the trailing edge.An estimate of the surface waviness indicated that
_+0.003-in. variation occurred between the bronze sur-
face and the inner aluminum shell. Figure 30 shows a
36
sketch of the bronze porous sheet covering a core
NACA 64A010 airfoil model perforated with1-in-diameter holes over the center of the model and
l-in. s;its at the leading and trailing edges of themodel. Suction airflow measurements were made
through an orifice plate in the suction duct, and suc-
tion was regulated by varying the blower speed and
plate orifice diameter. Boundary-layer measurements
were made on the upper surface to 83 percent chord.
Laminar flow was observed to 83 percent chord forsuction up to a Reynolds number of 8 x 10 6. An
accompanying theoretical study suggested that, in theabsence: of roughness, full-chord laminar flow should
be expected to higher Reynolds numbers if the experi-mental suction distribution could be made uniform.
In a follow-on test, Braslow et al. (1951) reported
the wind tunnel results of an experiment using the
same model but with less porosity. Full-chord laminarflow v_as observed up to a Reynolds number of
24 x 106. The measured drag for the laminar flow con-
trol airfoil was roughly one third of the model without
suction: however, the results could not be repeatedbecause the bronze skin buckled during testing.
5.2.2. University of Michigan Slot-Suction WindTunnel Tests
Pfe:minger, Gross, and Bacon (1957) described
the results of the LFC slot-suction experiments in the
University of Michigan 5-Ft. by 7-Ft. Tunnel con-
ducted in 1949 and 1950. Suction was applied through
86 fine slots from 25 to 95 percent chord on a 30 °
swept 12-percent-thick symmetric wing model. Total
pressure, static pressure, boundary-layer crossflow,
and the transition location were measured during theexperin'ent. Measurements were made at various
Reynok_s numbers for model angles of attack of 0 °and __1c. The suction for each test case was selected
based on theory. Full-chord laminar flow was
observed at an angle of attack of 0 ° at a chordReynok s number of 11.8 x 10⁶. The measured mini-
mum cr tical suction levels were slightly smaller than
theoreti_:al predictions; however, the measured dragclosely _natched the theoretical predictions. The suc-
tion lew:l on the 30 ° wing was slightly larger than a
2D wing because crossfiow disturbances had to be sta-
bilized. At an angle of attack of -1 °, turbulent bursts
occurred for lower Reynolds numbers; this was cor-
rectly attributed to stronger crossflow.

5.2.3. Douglas Slot-Suction Wind Tunnel Test
Smith (1953) presented a review of LFC/BLC
research at the Douglas Aircraft Company and noted
that the program began early in 1948. The studies sug-
gested that as the Reynolds number increased the slotsmust become thinner and thinner; this caused doubt
about the structural feasibility of the concept. Smith
conceived the idea of having several velocity disconti-
nuities and regions of favorable velocity gradients for
boundary-layer stabilization. However, such an airfoil
must not separate if suction power was lost. The
nature of the concept may cause shock formation at
each jump; however, the suction would be sufficient to
prevent separation.
To test the concept, a 2D airfoil (G00107) model
was installed in a Douglas wind tunnel. The wind tun-
nel could reach a maximum Reynolds number of4.25 x 106 and had a maximum fluctuating velocity of
0.1 percent of the free-stream value. The model had a
42-in. chord and had the first pressure jump at 20 per-cent chord. The first suction slot was put at 5 percent
chord to control possible disturbances caused by simu-
lated debris. The last 19 percent of the model was aflap covered with a sheet of porous bronze mesh for
suction control. Laminar flow was easily achieved
back to the flap (81 percent chord). When a flap align-
ment problem was corrected, laminar flow was
observed back to 98 percent chord. These initial low
Reynolds number wind tunnel results provided a proof
of concept for the slot-suction concept with a pressure
jump and verified the idea that at a pressure jump all
fluid having a velocity pressure less than the pre-
scribed pressure rise must be removed from the flow
for boundary-layer stability.
The success of the wind tunnel experiment led to
the development of a high Reynolds number airfoil.
The new airfoil (DESA-2) had laminar flow designedto a chord Reynolds number of 50 x 106 using what is
presently known as the N-factor correlation method
(normally attributed to Smith 1956; Smith andGamberoni 1956; and Van Ingen 1956). Note that the
earlier document (Smith 1953) was classified until
recently. By using the N-factor correlation, N = 10 atthe trailing edge was selected as the design constraint.
For N = 6, the critical Reynolds number was reduced
to 35 x 106. Shown in figure 31, the DESA-2 model
had a 6-ft chord, 9 slots on the upper surface, and7 slots on the lower surface. Full-chord laminar flow
was easily obtained up to a chord Reynolds number of6.5 x 106 in the TDPT. Laminar flow was progres-
sively lost with an additional increase in wind tunnel
speed. Hot-wire surveys behind each slot revealed the
presence of wild disturbances behind slot 6 (55 per-cent chord), which were most likely attributable to a
0.003-in. step. Great care was then taken to remove alldiscontinuities in the model. Additional tests showed
that laminar flow was again lost, even though the flow
was theoretically stable to TS disturbances. The
results suggested that the flow was very sensitive to
surface roughness. Because of the surface-roughness
problems, the test data were insufficient to make anyconclusions about the sawtooth pressure-jump
distribution concept combined with slot suction forBLC/LFC.
5.3. Anson Mk.1 Porous-Suction Flight Test
(1948-1950)
Based on porous-suction LFC wind tunnel experi-
ments by Kay (1948), Head (1955) used an Anson
Mk. 1 aircraft to test the porous concept in flight tests.
The goals of the study were to study laminar
boundary-layer flow with uniform suction distribu-tions for zero and adverse pressure gradients, to deter-
mine the minimum suction required for laminar flow,and to determine the effectiveness of suction in con-
trolling transition induced by roughness and waviness.
The test section was a 2D symmetric airfoil cov-
ered with a porous nylon material (120-mesh phosphor
bronze gauze) covering the suction box. In testing theconcept, the results demonstrated that laminar flowwas achieved at all rates of suction; turbulent flow was
found on the same test section with no suction (gener-
ated by covering the suction area with an impermeable
paper). For high rates of suction, loss of laminar flow
occurred (in some cases), probably because of surface
imperfections. Finally, Head showed that smallamounts of distributed suction were ineffective in pre-
venting transition induced by roughness; however,
larger critical roughness existed with suction.
5.4. Vampire Porous-Suction Flight Test
(1953-1954)
In England, LFC flight test experiments were car-
ried out with the Vampire III single-seat fighter
aircraft powered with a single Coblin II jet engine.
37
Head,Johnson,andCoxon(1955)reporteddetailsoftheexperiment,includingrationalfor thesuctionsys-temdesignanddragreductionsobtainedwithsuctionaspart of the test section.The flight testsdemon-stratedthatfull-chordlaminarflowcouldbeobtainedin flight by using continuousdistributedporoussuction.
As sketchedin figure 32, a suctionsleeve(orglove)wasmountedto the Vampirewing nearthemidspanregionafter the taperof the wing. Theleading-edgesweepof thewingwas11.5°.Theporoussleevecoveredfrom6 percentto 98percentchordofthewing,withsuctionpowerdrawnfromaturbopumpunit drivenbyairbledfromthecompressorof theair-craft engine.ThesleevewasconstructedsuchthataporousMonelMetalclothsurfacewasbondedto theskinwhichhadpremilledrecessesto extracttheair.The sleevewascompartmentedto form 19 ducts,which led the air throughtwo venturitubesto thepump(mountedatthewingroot).
No attemptwasmadeto theoreticallydesignanoptimalglovegeometry;insteadthebasicwingshapewasusedto simplifythesleeveconstruction.Calcula-tionsforanoptimumsuctiondistributionweremadeatachordReynoldsnumberof 20x 106.Theresultingsuctiondistributionwhich led to a neutrallaminarboundarylayerwasusedasaguidefor designingthesuctionsystem.Surfacewavinesswas limited byapplying filling; the maximum wavinesswasmeasuredat _+0.005in., which was verygoodforproduction-typestandardsof thattime.
Approximately90 coppertubeswererun in thesleevetomeasuretheexternalsurfacepressures,pres-suresin theducts,andpressuresdownstreamof theorifice plates.Fromthedifferencebetweenthepres-surein andoutof theduct,achordwisesuctiondistri-butioncouldbeobtained.Theboundary-layervelocityprofileat thetrailingedgeof thewing,thechordwisepressuredistributionaroundthe sleeveandleadingedge,andthetotalsuctionflow fromeachcollectorwererecordedduringtheflight. Thepilot couldvarythesuctionflowandpumpoperatingconditionswhilein flight.
Seesection4.1 for a discussionof themethodusedduringthe Vampireflight testto avoid insectcontamination.
Theinitial flightswithandwithoutsuctionindi-catedthat transitionoccurredvery nearthe leadingedgeof thesleeveandthatthiswaslikelyroughness-inducedtransitiondueto the surfacequalityof theMonelMetalcloth.Insteadof tryingto improvetheMonelMetalclothsurfacequality,anylonparachutefabricwasaddedto coverthecloth.After carefullyapplyingthis fabric,full-chordlaminarflowcouldbeachievedfor chordReynoldsnumbersof 16.4x 10⁶.For higher Reynoldsnumbers,roughness-inducedtransitionoccurreddueto flawsin thenyloncovering.However,for thelowerReynoldsnumbers,theresultsshowedthata 70- to 80-percentoverallreductioninprofile drag(accountingfor suctionpenalties)wasrealizedwiththeporous-suctionLFCsystem.
In thefinal seriesof flight tests,significantandcarefuleffortwasconcentratedonreducingtherough-nessin theleading-edgeregionup toabout15percentchord.Bydoingthis,full-chordlaminarflowwasreal-izedfor aMachnumberof 0.70andchordReynoldsnumberof 26x 106.LaminarflowathigherReynoldsnumberswasnotachieved(likely)becauseof surfacewaviness.
A comparisonof the calculatedand measuredvelocityprofilesshowedsignificantdisagreement;thissuggeststhatthesuctionflow throughthesurfacewaslessthanwhattheventuresrecordedor thatthetheo-reticaltescriptionof theproblemwasnotadequate.Unlikemanyof theLFCflight testexperiments,thereportbyHead,Johnson,andCoxon(1955)pointedtodeficienciesin thetheoreticalpredictioncapabilityofthat era. Namely,the inability to determineslot-suctionspacingandminimumsuctionrequirementsfor laminarflowwerenotedalongwith theinabilitytodeterminesuitableholesizesandspacingsfor poroussuctionAsseenin section6.1.3,some40yearshavepassed:;incethisflightexperimentandtheseissuesareonly now beingaddressedby carefulwind tunnelexperiments.
5.5. F-94A Slot-Suction Glove Flight Test
(1953-1956)
Sul_poned by the U.S. Air Force and conducted at
Northrop Aircraft, Inc., Pfenninger et al. (1955) and
Carmichael, Whites, and Pfenninger (1957) describe
the LFC slot-suction experiment using a glove on the
F-94A airplane. The flight test was conducted to
38

extendthe useof suctionLFC in flight at highReynoldsnumbers.Becauseturbulencelevelsandroughnesseffectsdueto highunitReynoldsnumbersimpactthelaminarflow extentin thewindtunnels,itwasdeterminedthatflightexperimentswerenecessaryfor conceptvalidation.Tomakeacomparisonwiththewindtunnelresultsof Pfenninger(1951),thesuctionwing for theflight testwasdesignedwith a similarsuction arrangement.As shownin the sketchoffigure33,theglovewasmountedon theleft wingofthe F-94A, wheresuctionwas implementedon theuppersurfaceonly.Twelvesuctionslotswerelocatedbetween41.5and95percentchord.Remotecontrolwasusedto adjustneedlevalvesto changethechord-wisesuctiondistribution;thesuctioncompressorwasexternallymountedinapodonthefuselagebehindthewing.
Low surfacewavinesswasachievedby sandingandpolishingthetestarticle.No roughness-inducedtransitionwasrealizedupto chordReynoldsnumbersof 28 × 106 (unit Reynoldsnumberper foot of3.73x 106).Staticpressureandtemperaturemeasure-mentsof thesuctionchamber,staticpressureon theuppersurfaceof theglove,andboundary-layermea-surementsat the trailingedgeof the uppersurfaceweremadein thecourseof theflighttest.
Full-chordlaminarflow wasobservedon21 of23consecutiveflights.Twoflightswerenotsuccess-ful becauseof leading-edgecontaminationby bugsand sandparticulate.For chordReynoldsnumbersrangingfrom 12x 10 6 to 30 X 10 6 and Mach numbers
0.6 to 0.65, the glove had 100 percent laminar flow.
The drag decreased with increased Reynolds number
until a minimum was reached at the chord Reynoldsnumber of 22 x 106. As the Reynolds number was
increased, the drag unexplainably increased with
Reynolds number. (No mention was made of Cqlevels.)
In follow-on studies, Groth et al. (1957) and
Pfenninger and Groth (1961) reported the results foran LFC slot-suction experiment using the F-94A air-
plane and a glove with 69 suction slots. The justifica-tion for the additional slots was that such a multiple
slot configuration would be applicable to an actual air-
plane wing (i.e., the distance between slots should beminimized to avoid premature transition to turbulence
in a high chord Reynolds number flow).
The design of the 69-slot glove was based on the
pressure and suction distribution measured on the
12-slot glove. However, a variation in the hole sizesfor each slot accounted for the different pressure
losses of the sucked air resulting from a variation in
the chord pressure along a chamber. The slot widthswere selected to balance a local deceleration of the
flow due to wide slots (potentially causing premature
transition) and high flow velocities in narrow slots
(causing unnecessary pressure losses). Furthermore,the issue of surface waviness was controlled by polish-
ing the surface until the waviness was reduced to
1/3000 in/in (height-to-length ratio) or less.
The flight measurements with the 69-slot experi-ment were made in the same manner as the 12-slot
study. Laminar flow was achieved and maintained in
flight for chord Reynolds numbers ranging from12.25 x 10 6 to 36.34 x 10 6, resulting in drag reduc-
tions for all cases. No attempt was made to minimize
the drag by varying the suction distribution. Unlike the
drag rise with maximum chord Reynolds number forthe 12-slot configuration, no drag rise was realized in
the 69-slot test. Groth et al. (1957) postulated that the
increase in drag for the wider spaced slots could be
caused by the amplification of three-dimensional
disturbances (crossflow and/or Gtirtler) or two-
dimensional disturbances that may have locally been
amplified between the slots. If the drag increase wasdue to crossflow disturbances, then stronger suction
would be required at higher Reynolds numbers; this
would result in increased suction drag and wing pro-
file drag. In addition, the flight tests showed that lower
Mach numbers (reduced flight speeds) caused anincrease in lift coefficient, a forward shift of the pres-
sure minimum, and, therefore, a loss of 100 percent
laminar flow. For flights conducted at high subsonic
Mach numbers (=0.70), regions of local supersonic
flow on the glove limited the desired 100 percent lam-
inar flow. For local Mach numbers greater than 1.10, it
was not possible to maintain laminar flow back to the
trailing edge of the test section.
See section 4.1 for a discussion of insect contami-
nation avoidance during the slot-suction LFC F-94A
flight test.
Pfenninger and Groth (1961) additionallydiscussed an 81 slot-suction experiment which used
the 69-slot approach with 12 additional slots (and
39
4 chambers)in theregionof 8 to 41 percent chord. For
higher Reynolds numbers, the 81-slot configuration
had a drag increase compared with the 69-slot config-
uration; however, at lower Reynolds numbers and
higher lift coefficients the drag was less than the previ-ous 69-slot test.
5.6. Later Subsonic Slot-Suction Wind Tunnel
Tests (1958)
Carmichael and Pfenninger (1959) reported the
results of slot-suction LFC wind tunnel experiments
on a 30 ° swept-wing model. The tests were carried out
in the University of Michigan 5-Ft by 7-Ft and the
NORAIR 7-Ft by 10-Ft Low-Turbulence Tunnels with
the goal of determining whether surface waviness was
more critical on swept suction wings compared with
unswept suction wings. Previous results by
Pfenninger, Gross, and Bacon (1957) and by Bacon,
Tucker, and Pfenninger (1959) obtained full-chord
laminar flow to the trailing edge of a swept wing with93 suction slots for LFC. The model had a 7-ft chord
and the tunnels operated at unit Reynolds number perfoot of 1.7 x 10⁶ or a chord Reynolds number of
approximately 12 x 106. The surface waviness of the
model was 1/3000 in/in, and suction slots were located
from 0.5 to 97 percent chord. Fairings were applied atthe tunnel walls to remove three-dimensional effects,
and an angle of attack of 0 ° was imposed on the test
article. The F-94A flight test parameters were used to
guide the wind tunnel experiment. Sine-curve waves
were constructed of Reynolds Wrap aluminum foil
and layered using silicone adhesive. The experiments
were conducted with the slots covered by the waves(foil). The results showed that waves of different
length become critical when h2/_. is a constant (consis-
tent with the work of Fage (1943) and the F-94A flighttest results). From the database, the critical waviness
for swept laminar suction wings was defined as out-lined in section 3.2. However, from the limited results
it appears that multiple waves have smaller allowable
wave ratios than single-wave allowables. Finally, by
sealing some of the slots, the slot spacing was
increased from 0.55 percent (0.4 in.) to 2.2 percent
(1.6 in.) chord to determine a measure of sensitivity
for more practical applications. No significant differ-
ence in the results was observed in the experimentswith fewer slots.
Gross (1964) reported the results of experimentsthat were conducted in the NORAIR 7- by 10-Foot
Wind Tunnel using a 17-ft chord, two-dimensional,
4-percent-thick slot-suction laminar flow airfoil. One
hundred suction slots were located from 1 to 97.2 per-cent chord. The spanwise extent of the slots reducedfrom 77.4 in. at the first slot to 15.2 in. at the last slot.
Full-chord laminar flow was achieved up to a chord
Reynolds number of 26 x 106. It was suspected that
the wind tunnel flow quality contaminated the laminar
flow for larger Reynolds numbers.
Bacon, Pfenninger, and Moore (1964) reported the
experimental results of (1) a 4-percent-thick straight
laminar suction wing and (2) a 30 ° swept, 12-percent-thick, 7-ft chord laminar suction wing in the NORAIR
7- by 10-Foot Wind Tunnel to investigate the influ-ence of sound and vibration on the laminar flow extent
achieved with LFC suction through slots. Naphthalene
sublimation pictures showed that the introduction of
sound for the swept wing resulted in transition in the
flat pressure region of the wing and the appearance of
crossflow vortex signatures prior to transition. The
straight wing results indicated that the frequency
depend,.'nce of transition and sound correlated with the
theory _br Tollmien-Schlichting waves. For vibration,
additional suction was required to maintain laminarflow.
Gross and Bossei (1964) discussed the experi-
ments znd theoretical analysis of a LFC slot-suction
body of revolution. The experiments were conducted
in the NORAIR 7- by 10-Foot Wind Tunnel, and the
30 ° swc pt-wing model had 120 suction slots. The suc-tion slo:s were connected to 13 suction chambers. The
0.003-in. slots were spaced 2 in. apart from 4.84 to
75 percent of the model length and were spaced
0.5 in. :'rom 75 to 100.4 percent of the model. (Note,100.4 p,'rcent of the model indicates that the last slot
was par:ially positioned on the sting.) Laminar flow toa lengtt Reynolds number of 20.1 × 10⁶ was realized
with the. LFC. The theoretical analysis was compara-
ble wit)l the experiments; however, some disagree-
ment was found because the experiments could not
attain tl:e pure axisymmetric-symmetric flow assumed
in the tl"eory.
Gross, Bacon, and Tucker (1964) reported the
results of a LFC slot-suction experiment conducted in
40

theAmes12-FootPressureTunnel.Themodelhad93 slotsof 0.004 to 0.005in. wide extendingto97 percentchordof themodel.Theresultsshowedlaminarflow extentto a chordReynoldsnumberof29x 10 6.
5.7. Supersonic Slot-Suction Wind Tunnel
Tests (1957-1965)
Virtually all the wind tunnel and flight test experi-
ments relating to LFC were conducted in the subsonicflow environment. However, there are a few unclassi-
fied supersonic LFC-related wind tunnel experiments.
Groth (1961) reported the results of supersonic
LFC slot-suction wind tunnel experiments conducted
during 1957 and 1958. Groth, Pate, and Nenni (1965)
reported the results contracted to Northrop Aircraftfrom the U.S. Air Force through 1965. The first study
was conducted in a supersonic wind tunnel at the U.S.
Navy Ordinance Aeronautical Laboratory in Texas.
The model was a biconvex, 5-percent-thick, 20-in-chord two-dimensional airfoil. Tests were run for
Mach numbers of 2.23 and 2.77. Between 23.5 and
90 percent chord, 19 slots were cut in the model with
suction extracted into four chambers. The spanwiseextent of the slots decreased from 6.28 in. for the first
slot to 2.56 in. for the last slot, corresponding to the 8 °
taper consistent with observed turbulent wedge
spreading angle. Pressure orifices, thermocouples, and
boundary-layer rakes were used for the measurements.
Boundary-layer measurements were made for several
suction distributions. For the preliminary tests with nosuction, transition occurred at 40 and 30 percent chord
for Mach numbers of 2.23 and 2.77; this resulted
in transition Reynolds numbers of 5.1 x 10⁶ and
3.9 × 10⁶, respectively. With the suction model, shock
waves were observed originating from each slot. The
strength of the waves increased with increased suc-
tion. Laminar flow was observed at an angle of attackof 0 ° for the suction distributions used.
Groth (1961) noted that additional tests at Mach
numbers of 2.5, 3.0, and 3.5 were conducted in 1958
in tunnel E1 at Arnold Engineering Development Cen-
ter (AEDC) in Tennessee. A 20-caliber ogive cylinder,
3.25 in. in diameter (maximum) and 14.443 in. long,was used for the model; 16 suction slots were located
between 5 and 22 in. of the cylinder with 4 slots con-
nected to one chamber. (Note, the ogive cylinder
model was connected to a cylinder to form a total
model length of 40 in.) For a Mach number of 2.5, the
drag without suction was 1.35 times the friction drag
of a laminar flat plate and the flow was laminar to aReynolds number of 6 x 10⁶. To recover the same drag
by using suction to achieve laminar flow, theReynolds number was 9 x 10⁶. Drag increased as the
Reynolds number was increased. For a Mach numberof 3.0, the test article with no suction had laminar flow
for a Reynolds number of 4.5 x 10⁶. With suction, the
same drag could be achieved with a Reynolds numberof 6 x 10⁶.
A single-slot, 9.25-caliber ogive cylinder wastested at a Mach number of 2.9 in the 8-Inch by
13-Inch Supersonic Blow-Down Tunnel at the Univer-
sity of Michigan to study the flow physics near a slot.
Boundary-layer profiles were measured ahead and aft
of the slot with a total-pressure survey. A discussionwas given by Groth of the local Mach number and
pressure variations near the slot and its impact. Shock
waves emulating from the suction slot increased the
suction drag by approximately 10 to 15 percent. Groth
(1961) suggested that the installation of many fine
slots would reduce this shock-induced drag.
Groth (1964a), Jones and Pate (1961), and Groth,
Pate, and Nenni (1965) reported on experiments con-ducted in 1961 in the 1-m × 1-m (40-in. × 40-in.)
supersonic tunnel at Arnold Engineering and Develop-
ment Center. A fiat-plate model with a 41-in. chord,
40-in. span, and 76 spanwise suction slots was used ina Mach number 2 to 3.5 supersonic flow to study the
feasibility of LFC for supersonic flows. The slot width
ranged from 0.004 in. in the front to 0.005 in. in therear of the model. Below the slots, 0.2-in-deep holeswith diameters of 0.042 to 0.062 in. were drilled
0.25 in. apart. The instrumentation could measure sur-
face pressures on the model, suction chamber and
metering box pressures, and temperatures. A rake was
positioned at the rear of the model to determine the
state of the boundary layer. For Mach numbers of 2.5,3.0, and 3.5, full-chord laminar flow was observed to
Reynolds numbers of 21.8 x 10⁶, 25.7 x 10⁶, and
21.4 x 10 6, respectively (up to the tunnel limit). The
resulting reduction in skin friction drag of 28 and
43 percent of the turbulent plate values was achievedwith suction mass flow coefficients of 2 x 10⁻⁴ and
3 x 10⁻⁴. These laminar flows were obtained by
TS-disturbance stabilization where compressibility
41

helps considerably;crossflow disturbanceswereabsentfromthistwo-dimensionalflow. The measured
boundary-layer thickness and wake drag coefficients
were 40 to 80 percent larger than the theoretical data
for the same suction coefficients. This difference may
be attributable to spanwise contamination in the exper-
iments or the presence and influence of a detached
shock wave from the blunt leading-edge plate, which
is not accounted for in the theory.
Shock-wave boundary-layer interaction studies
were conducted by Greber (1959) at Massachusetts
Institute of Technology and in 1962 by Groth (1964a)at AEDC to determine if slot-suction could be used to
achieve laminar flow behind a shock wave. Using
strong suction in the shock-interaction zone, both
studies observed laminar boundary layers downstream
of the shock impingement area; this means that with
suction, a stronger shock was required to separate theflow. Again, crossflow disturbances were not present
in these LFC shock-boundary-layer interactionstudies.
Additional tests were reported by Groth (1964b) at
Mach numbers of 2.5, 3.0, and 3.5, which were con-
ducted in 1961 in tunnel E1 at Arnold Engineering
Development Center. A 20-caliber ogive cylinder,
3.25 in. in diameter (maximum) and 14.443 in. long,was used for the model, which had the same dimen-
sions as the 1958 model. An improved suction system
was used and 29 closely spaced suction slots were
located between 4.5 in. and 18 in. at spacings of0.5 in.; this led to a more continuous distribution of
suction compared with the 1958 LFC model. A total-pressure head rake was mounted aft of the last slot to
measure the state of the boundary layer. Full laminarflow was observed for chord Reynolds numbers of15.3 x 106 for Mach number 2.5, 11.5 x 10⁶ for Mach
number 3.0, and 6.3 x 10⁶ for Mach number 3.5. The
experimental boundary-layer thickness measurements
were shown to be 22 percent thicker than theoretical
estimates; however, the theory did not account for
potential shock waves emanating from the slots. Addi-
tionally, the effect of surface roughness on the laminarflow extent was measured at Mach number 3.0 and
unit Reynolds number per foot of 10 x 106. A
0.093-in-diameter disk with height of 0.0035 in. was
placed at 2.0 in. on the model. With no suction, transi-
tion moved upstream from 14 to 12 in. with the rough-
ness present for a Reynolds number of 6.3 x 10⁶;
however, with suction, laminar flow was maintained.
At higl-:er Reynolds numbers suction could not main-
tain larainar flow. The critical roughness heights of
0.001 t,_ 0.002 in. were determined for this high unitReynol, ts number.
Pate (1965) and Groth, Pate, and Nenni (1965)
reported on wind tunnel results of a LFC 9.2-in. cylin-
drical body of revolution. Suction was applied through150 slots on the model. Laminar flow was observed at
Mach number 2.5 to a length Reynolds number of42 x 106 and at Mach number 3.0 to a Reynolds num-
ber of 51.5 x 10⁶. The total drag at Mach number 3.0
was only 23 percent of the turbulent friction drag on aflat plate.
To verify the benefits of suction LFC for sweptsupersonic wings, Groth (1964c) and Pate and
Deitering (1963) reported the results of experimentswith a 3-percent-thick, 36 ° biconvex suction-slot wingtested i_a 1962 in the 1-m x 1-m tunnel at AEDC for
Mach numbers 2.5, 3.0, and 3.5. The purpose of the
test was to demonstrate supersonic slot-suction LFC in
the presence of crossflow disturbances. The wing had
a 39-in. flow-direction chord (31.5-in. perpendicular
chord) and 66 slots. Two models were tested. The firstmodel, which had insufficient suction distribution at
high Mach numbers, had the first slot at 1.6 in. aft of
the leading edge. No laminar flow was observed withthe first model for Mach number 3.5. The second
model (or modified model) had the first slot at 0.76 in.
down from the leading edge. Full laminar flow wasobserved for length Reynolds numbers of 17 x 106 forMach number 2.5, 25 x 106 for Mach number 3.0, and
20 x 106 for Mach number 3.5. However, the drag
coeffici _,nt was somewhat higher and was presumed to
be influenced by three-dimensionality in the tunnel.
Goldsmith (1964) reported results conducted in
1963 in the same AEDC tunnel but with a 72 ° swept-wing model and at flow conditions of Mach numbers
of 2.0 _nd 2.25, giving a subsonic leading edge to a
supercrJtical leading edge. Contoured wind tunnelwall lin:rs were installed to simulate an infinite (two-
dimensional flow) swept wing. The model had a 10-in.chord perpendicular to the leading edge and a 33-in.
chord it the streamwise direction. Sweeping the wingbeyond the Mach angle zeros the lift wave drag; how-
ever, this benefit may be offset by increases in induced
drag. To prevent this increase in induced drag, the
aspect ratio of the highly swept wing must lead to an
42
increasedwettedarea.Increasesin wettedareawouldsuggestthebenefitsof LFC(skin-frictionreductions)wouldbeprofitable.Slotsuctionwasusedwithslotsbeingas narrowas0.003to 0.0035in. andspaced0.08in. (0.27 in. in the streamlinedirection)apart.Threerowsof 13pressuretapswereusedinadditionto themeasurementsmadeby Groth(1964a)for theLFCsuctionsystem.Thetotaldragmeasurementsfortheflow at a Reynoldsnumberof 9 x 10⁶werelowandindicatedthattheflowwaslaminar;thedragrosequicklyfor anincreaseinReynoldsnumber.Turbulentcontaminationalong the attachmentline wassug-gestedastheculpritfor thesuddendragincrease.Theresults at Mach number2.25 were sparseandinconclusive.
FurtherstudyofhighlysweptwingsbyGoldsmith(1964)focusedontheinfluenceof thespanwiseveloc-ity componentonslotlosses.Previousincompressiblecalculationshaveassumedthatthe slotsweretwo-dimensionalchannelswithnodensitychangesin theslot; however,for supersonicflows, the calculatedlossesshouldaccountfor densityvariations.In addi-tion,anaccountof thespanwisevelocitycomponentshouldbeconsideredfor sweptslots.Theprocedurefor calculatingthelossesthrougha sweptslot wasratherlengthycomparedwith thatfor unsweptslots;however,the newprocedureindicateda 22-percentincreasein lossesfor anexampleproblemof a 72°sweptslot.Thisvalueindicatedthepotentialsignifi-canceof includingthespanwisecomponent.Thenewprocedureusedfor anunsweptcasegavethe sameresultsasthepriortwo-dimensionalapproach.
Finally,Pate(1964)andGroth,Pate,andNenni(1965)reportedtheresultsof slot-suctionLFCswept-wingmodelstestedin the1-mx 1-msupersonictunnelat AEDC. As sketchedin figure 34, 36° and 50°swept-wingmodelswith68and67slots,respectively,wereusedfor thetests.ForMachnumbersof 2.5,3.0,and3.5,laminarflow wasachievedonbothmodels,with full-chordlaminarflow beingobservedon the36° model.Theseresultsshownin figure35demon-stratethatdragreductionscanbeachievedby usingLFCin supersonicflow. Morespecifically,theslot-suctionLFC flat-plateand swept-wingresultsarecomparedwithone-thirdturbulentskinfrictionon aflatplate.ThenthetotaldragusingLFCwasafractionof theturbulentflow skinfriction.Groth,Pate,andNenni (1965) noted that suction requirements
increasedwith increasedMach numberand withincreasedcrossflow.Unlike theflat-platemodel,theswept-wingmodelsweresensitiveto thelocalsuctiondistribution.Two additionalslotswereaddedto the36° model in the leading-edgeregion to provideadequatesuctionwith increasedMachandReynoldsnumbers.
5.8. X-21A (WB-66) Slot-Suction Flight Test
(1960-1965)
The July 1966 issue of AIAA Astronautics and
Aeronautics was devoted to discussions on the pros-
pects of Laminar Flow Control and the X-21 LFC
flight test. This section summarizes the content of
those articles (which primarily focused on work by
Northrop and the Air Force Systems Command), the
June 1967 report of the Northrop Corporation (Kosin
1967), papers by Whites, Sudderth, and Wheldon
(1966) and Pfenninger and Reed (1966), and AGARD
reports by Pfenninger (1965) and Fowell and
Antonatos (1965), which summarized the X-21A slot-
suction flight experiment and the state of the art in
LFC aircraft of that era. Northrop modified two
WB-66 aircraft to incorporate LFC technology on the
wings to demonstrate the feasibility and practicality of
the design, manufacturing, operation, and maintenanceof LFC aircraft systems. Modifications of the WB-66
aircraft included the removal of the original wings and
their replacement with LFC slot-suction wings, theremoval of the engines and replacement with aft-
mounted engines, and the installation of LFC suction
compressors in pods mounted under the wings.
Figure 36 shows a modified X-21A aircraft.
Nenni and Gluyas (1966) discussed the aerody-
namic analysis involved with slot-suction LFC design.
In the 1960s, the analysis consisted of defining a wing
pressure and velocity distribution, followed by calcu-
lations of the viscous boundary-layer flow over the
wing, then the suction required to stabilize the bound-
ary layer was determined, and finally the slot spacingand size and the suction system were prescribed. The
process was iterative until the desired design was
obtained. By establishing the wing geometry, the wing
pressures and velocities can be obtained with transonic
wing theory. Notably, the pressure isobars should be
straight and constant along the wing span both toallow the suction slot to see a constant pressure and to
minimize the boundary-layer crossflow over a large
43

portionof thewing.Theinverseproblemof prescrib-ing the pressureandsolvingfor thewinggeometrycouldnot be tackledat that time.Local deviationsfromthedesiredpressuredidnothindertheattainmentof laminarflow (for full-chordLFC applications).Afterobtainingtheexternalflow field,boundary-layercalculationsprovidedvelocity profilesand integralthicknessesfor comparisonwith establishedcriteriafor theboundary-layerinstabilityto determinetransi-tion locations.If the idealstraightisobarwing wasapproached,the three-dimensionalboundary-layersystemcould be simplified with a conical flowassumption.ThisassumptionwasusedovermostoftheX-21Awing,with full three-dimensionalcalcula-tionsbeingmadeatthewingtipandwingroot.
TheX-21hada wingsweepof 30° anda flightenvelopewithMachnumbersfrom0.3to 0.8at alti-tudesfrom5000to44000ft. Approximately160hrofhigh-speedand1300hrof low-speedwindtunneltestswerecarriedoutwithamodelX-21Awingto validatethewing-designconcept.Goodcorrelationwaslaterfoundin comparingthewindtunnelandflight experi-mentresultsfor theeffectsof aeroelasticityandflightpressuredistributionson the wing. To preventattachment-linecontaminationresulting from thewing-fuselagejuncture,theX-21Ausedafence,verti-calslots,andagutter.
For the suctionsystemboundary-layercalcula-tions,acontinuous-areasuctionassumptionwasusedto approximatetheactuallydiscretedistributedsuctionwhichoccurredinsteps.Boundary-layerstabilityanal-ysisprovidedthenecessaryinformationfor determin-ingtheadequatesuctionflow rates.A typicalvalueoftheslotReynoldsnumberwas100,andtypicalsuctionquantitycoefficientsrangefrom v/Uoo = 5 x 10 -4 inrelatively flat pressure regions to v/U = 10 x 10 -4
near the leading edge of the wing. In the leading-edgeregion, the chordwise slots were 0.0035 in. wide and
spaced 0.75 in. apart and were used to control the flow
on the attachment line. Strong suction was requirednear or on the attachment line so that the momentum-
thickness Reynolds number did not exceed 100. In the
spanwise direction, the slots were varied in width so
that the velocity would gradually be reduced to zero asthe end of the slot was reached to minimize the
potential for vortex formation there. Typical valuesof the slot spacing/width include 1.1/0.003-0.004,
2.0/0.006-0.007, and 1.2/0.005 in/in for regions on the
wing of 1 to 5, 5 to 40, and 40 to 100 percent chord,respectively. The flow passed from the slot in the skin
through the holes in the structure below the skin, to the
duct via the plenum chambers beneath the slots, and
through the plenum ducts and flowmeter nozzles
through the inner skin. These slot plenum and holes
were designed to provide a uniform suction distribu-
tion along the suction slot to minimize the potential for
disturbances. For the X-21A suction system, 96 suc-
tion control valves were employed to independentlycontrol the suction in each slot. The airflow rates for
the system were operational from 85 to 130 percent of
the designed nominal flow rate to provide variations to
validate the unproven method for estimating the air-
flow. For example, the flight condition at an altitude of
43 000 ft and a Mach number of 0.75 had airflow rang-ing from 1.94 to 7.18 lb/sec. For the theoretical
description of the suction system involving a continu-
ous distribution, the flight-observed and theoretically
predicted suction over the wing chord agreed reason-
ably well except for the lower surface outboard region.Whites, Sudderth, and Wheldon (1966) showed that
for a Mach number of 0.74 and altitude of 41 400 ft,
the fliglat measured and predicted suction distribution
agreed in shape but differed in level by 50 percent,with theory underpredicting the requirements.
To measure the local state of the boundary layer,
total-pressure rakes were mounted at the trailing edge
of the wing. Single probes were positioned at a height
slightly above the laminar boundary-layer thickness.
When the state of the boundary layer was laminar, the
probe rt corded a full free-stream total pressure; other-
wise, a _maller pressure was recorded due to the probe
being immersed in a turbulent boundary layer. The
relationship between the pressure loss and the transi-
tion loc ltion was made both analytically and in flight.
Probes were used to measure velocity fluctuations
within tae boundary layer. Microphones mounted withdiaphra_;ms flush to the surface were used to measure
both velocity fluctuations and to determine sound lev-
els abox e the wing.
Corcerning the issue of allowable or tolerable
waviness and roughness, the report (Kosin 1967) doc-uments the flight condition of a Mach number of 0.8
and an altitude of 45000 ft, the permissible step
heights were 0.02 in. for forward-facing steps,0.009 in. for rearward-facing steps, and 0.25-in.
widths for spanwise running gaps. The permissible
44

amplitudeto wavelengthwasmuchlessthan0.004(wavinesscriteria).Theflight testsshowedthatthewing can toleratea 0.125-in.gap with a depthof0.18 in.onthelowerleftoutboardwingat60percentchord,0.04-in.gapsat 44 percent,and32 percentchordwithoutthelossof laminarflow.Theadditionofgapsof 0.05in. at 15percentchordand0.08in. at8 percentchordrequiredaloweringof thesuctioninthe forward ducts to maintainlaminarflow. Theresultsof wavinessstudiesshowedthatwavesasfarapartasthefrontandrearsparscanbetreatedby sin-glewavecriteriaratherthanmultiplewavecriteria.
Theimpactof acousticdisturbancesontransitionwasalsotestedin theX-21Aprogram.Thesoundwasintroducedaheadof the 15-percent-chordposition(frontspar).Therewasalackof evidencethatinternalnoisecausedanydeteriorationof the laminarflow.Thisimpactmaybecausedbyinsufficientintensityofthesoundatthecriticalfrequenciesevenwith sound10to 15percentabovenormallevelsin theductor itmaybecausedby thesoundnot beingintroducedatthe mostcritical chordwiseposition.SlotReynoldsnumbersfrom 120to 140wereshownto createa dis-turbanceat theslot-wingintersectionthatdominatedanypotentialdisturbancefromtheinternalductsoundpressures.Finally,testsshowedthat structuralvibra-tionswithinfrequencies400to 1800Hzatmagnitudesabovethenormalvibrationenvironmentdidnotaffectthelaminarflowextent.
Companion wind tunnel tests were performed to
verify that a sudden loss of laminar flow would not
cause control problems on a LFC aircraft. The resultsshowed that the lateral-directional and long-period
longitudinal dynamic motions may require more strin-
gent artificial damping than the minimum acceptable
requirements on the turbulent aircraft. However, bothmotions are of sufficient duration that the pilot correc-
tive action can be applied and the aircraft dynamics
does not present a danger to flight safety.
An interesting conclusion from Kosin (1967) sug-
gested that future studies should seek to reduce the
boundary-layer disturbances which are generated in
the wing-nose region of the aircraft.
For the flight tests beginning in 1963, the results
showed progressively increasing regions of laminar
flow, culminating at the end of the year with nearly
60-percent-chord laminar flow at a mean aerodynamic
chord Reynolds number of 20 x 106. During 1964, the
laminar flow region was extended to 70 percent chord
at that Reynolds number and from 30- to 55-percent-chord laminar flow at a Reynolds number of 30 x 106.
During 1965, laminar flow was realized up to 96, 81,
and 59 jpercent chord for Reynolds numbers of20 x 10u, 30 × 106, and 40 x 106, respectively. The
X-21A program completed more than 200 LFC
flights. Figure 37 shows sample results obtained dur-
ing the flight test for a Mach number of 0.7, altitude of40000 ft, and a chord Reynolds number of 20 x 106;
74 percent of the upper surface and 61 percent of thelower surface had laminar flow.
See section 4.2 for a discussion of the impact of
cloud particulate on laminar flow during the X-21A
flight test.
Using criteria from previous experiments, the
analysis required that the momentum-thickness
Reynolds number on the attachment line be lessthan 100. The second derivative of the velocity at the
wall led to momentum-thickness Reynolds number
correlations for both tangential and crossflow instabil-
ities. Although suction was applied in discrete steps(slots), the calculated suction requirements assumed
continuous suction on the surface. The suction system
should be designed to keep slot Reynolds numbers
below approximately 100 to prevent the generation of
disturbances by the slot flow. With the suction flow
rate determined from boundary-layer stability consid-
erations, the pressure drop through the skin must beset to obtain the desired flow rate.
6. Laminar Flow Control After OPEC
Oil Embargo
Because of the impact of the OPEC oil embargo
on fuel prices in the United States in the 1970s, the
Laminar Flow Control project (under the NASA
ACEE Program) was formed to help improve aircraft
cruise efficiency. The major NLF and LFC projects inthe United States included various general aviation
flight tests, F-111 TACT, F-14 VSTFE, Boeing 757
NLF glove flight experiments, a LFC wind tunnel
experiment, advanced airfoil development for NLF,
and the Jetstar LFC flight experiment. See appendix Afor a discussion of many of the subsonic NLF results.
This section contains LFC projects in the United
States and Europe after the OPEC oil embargo.
45
6.1. Boeing Research Wind Tunnel LFC Test
(1977-1978)
Kirchner (1987) discussed a slot-suction LFC
swept-wing experiment that was conducted in the
Boeing Research Wind Tunnel. The principal goals of
the test were to demonstrate the functionality of the
suction system, to establish the required suction distri-
bution, and to explore the sensitivity of the flow to
suction level. A 30 ° swept-wing model with a 20-ft
chord was designed with slot suction over the first
30 percent chord for the upper surface and the first
15 percent chord for the lower surface for the designcondition of Mach number 0.8. Confidence in the
design and analysis tools and the experimental diag-
nostic tools were the only results reported as products
of that LFC wind tunnel experiment.
6.2. Langley 8-Foot Transonic Pressure Tunnel
LFC Wind Tunnel Test (1981-1988)
In 1975, Werner Pfenninger devised a wind tunnel
experiment to determine the impact of a large super-
sonic zone on a supercritical wing (concept by
Whitcomb and Clark 1965) and application of suction
(slotted and perforated) LFC to control the boundary-
layer stability characteristics (Bobbitt et al. 1992).
The tunnel of choice during 1976 was the Ames
12 Foot Pressure Tunnel because of its good flow
quality, demonstrated by the previous achievement of
full-chord laminar flow on a swept wing. (See Gross,
Bacon, and Tucker, 1964.) However, funding commit-
ments to make flow-quality improvements to theLangley 8-Foot Transonic Pressure Tunnel (TPT)
changed the preferred tunnel to the 8-ft TPT in 1978.
In the 1980 time frame, the scope of the experiment
was modified from slot suction only to include a
perforated-suction panel, and in 1985, the plan was
modified to include the LFC capability with suction on
the first 20 percent chord of the model. The first test
with a slot-suction model began in 1981 and ended in
1985; perforated-suction testing began in 1985 and
ended in 1987; the HLFC test began in the winter of1987 and ended in 1988.
Harvey and Pride (1981) discussed the design of
the LFC suction system and required modification to
the tunnel. To minimize the impact of wind tunnel
free-stream turbulence vorticity, noise, and thermal
spottim;ss on transition, antiturbulence screens, honey-
combs, and a sonic choke were employed in the 8-ft
TPT. Tlae level of ulU,o dropped to between 0.03 and
0.06 percent. To simulate an infinite wing flow, upper
and lower tunnel wall effects were removed by install-
ing foam wall liners. Figure 38 shows a sketch of the
swept-wing model and wall liners installed in the 8-ft
TPT wind tunnel with the anticipated turbulent
regions.
Bobbitt et al. (1992) expanded on the discussion to
include the design of the tunnel liner, swept LFC wing
model, and the type and location of the instrumenta-
tion. For a 7.07-ft-chord model, the airfoil design had
a 12-percent-thick 23 ° swept-wing model, Mach num-
ber 0.82, CL -- 0.47, and a chord Reynolds number of20.2 × 106. In the design of the LFC model, CF distur-
bances were kept small to prevent CF-TS disturbance
interactions because the linear design theory could not
account for nonlinear interactions. To optimize the
design, many iteration cycles were required consistingof computing the mean-flow fluid dynamics and the
boundary-layer stability properties for specified suc-
tion levels. The SALLY (Srokowski and Orszag 1977)
and MARIA (Dagenhart 1981) boundary-layer stabil-ity cod,:s were used for the analysis. For all calcula-
tions, distributed suction over 1.5 to 25 percent chord
was enforced with Cq = -0.00015. For the design, an
adverse pressure gradient existed to about 25 percent
chord followed by a favorable gradient. The model
had suction capability to 96 percent chord on the upper
surface and to 85 percent chord on the lower surface,
with di_'ferent pressure gradients providing the poten-
tial for _tudying both TS and CF disturbances. Partial-
chord saction coupled with the favorable pressure gra-
dient prevented the CF disturbances from growing
beyond N = 4. The TS disturbances grew to N = 10.36
at 70 percent chord. A chief concern of the design pro-
cess wzs the supersonic bubble height limitation (dis-tance b_tween model and tunnel wall) and the desire
for stab le upper surface flow.
Brcoks and Harris (1987) noted that, for the slot-suction LFC test, full-chord laminar flow was
obtaine, t on the upper and lower surface for a Mach
number of 0.82 and a chord Reynolds number of
12 × 106 (unit Reynolds number per foot of approxi-mately 1.7 × 10⁶). The sonic bubble associated with
the flow on the upper surface of the model was slightly
larger than designed, partially because of the inability
46
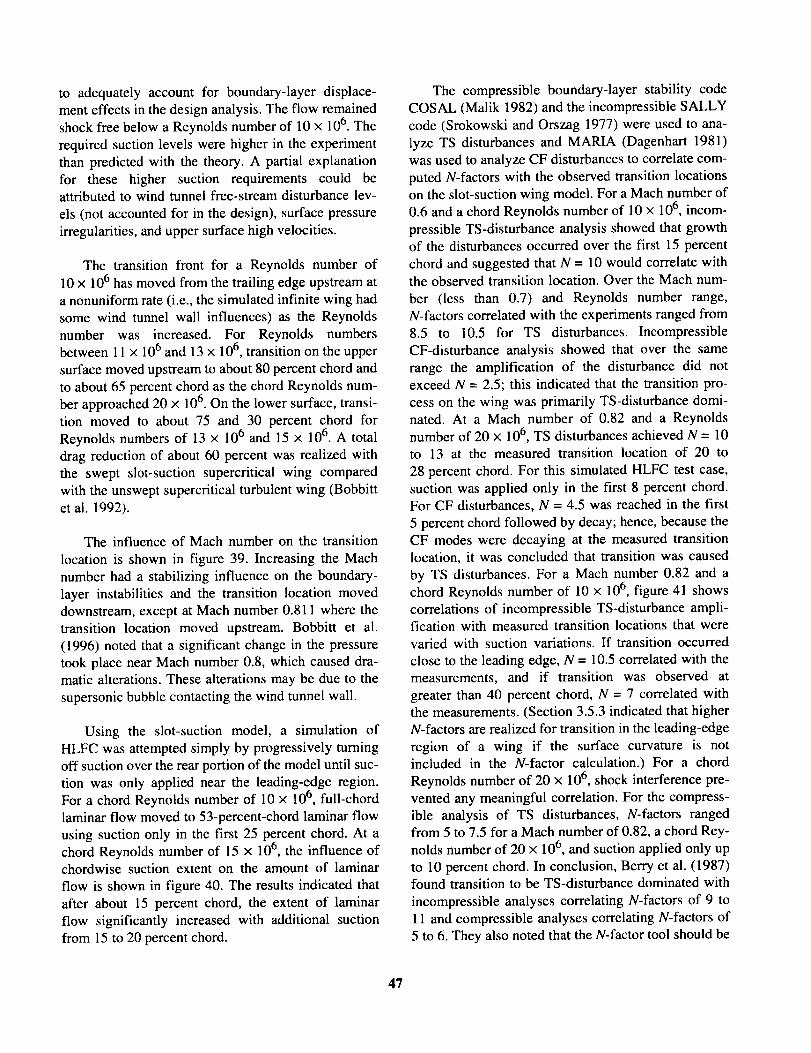
to adequatelyaccountfor boundary-layerdisplace-menteffectsin thedesignanalysis.The flow remainedshock free below a Reynolds number of 10 x 106. The
required suction levels were higher in the experiment
than predicted with the theory. A partial explanation
for these higher suction requirements could beattributed to wind tunnel free-stream disturbance lev-
els (not accounted for in the design), surface pressure
irregularities, and upper surface high velocities.
The transition front for a Reynolds number of10 × 106 has moved from the trailing edge upstream at
a nonuniform rate (i.e., the simulated infinite wing had
some wind tunnel wall influences) as the Reynolds
number was increased. For Reynolds numbersbetween 11 x 10 6 and 13 x 106, transition on the upper
surface moved upstream to about 80 percent chord and
to about 65 percent chord as the chord Reynolds num-ber approached 20 × l0 6. On the lower surface, transi-
tion moved to about 75 and 30 percent chord forReynolds numbers of 13 x 106 and 15 x 106. A total
drag reduction of about 60 percent was realized with
the swept slot-suction supercritical wing compared
with the unswept supercritical turbulent wing (Bobbittet al. 1992).
The influence of Mach number on the transition
location is shown in figure 39. Increasing the Machnumber had a stabilizing influence on the boundary-
layer instabilities and the transition location moved
downstream, except at Mach number 0.811 where the
transition location moved upstream. Bobbitt et al.
(1996) noted that a significant change in the pressure
took place near Mach number 0.8, which caused dra-
matic alterations. These alterations may be due to the
supersonic bubble contacting the wind tunnel wall.
Using the slot-suction model, a simulation of
HLFC was attempted simply by progressively turning
off suction over the rear portion of the model until suc-
tion was only applied near the leading-edge region.For a chord Reynolds number of 10 × 106, full-chord
laminar flow moved to 53-percent-chord laminar flow
using suction only in the first 25 percent chord. At achord Reynolds number of 15 x 106, the influence of
chordwise suction extent on the amount of laminar
flow is shown in figure 40. The results indicated that
after about 15 percent chord, the extent of laminar
flow significantly increased with additional suction
from 15 to 20 percent chord.
The compressible boundary-layer stability code
COSAL (Malik 1982) and the incompressible SALLY
code (Srokowski and Orszag 1977) were used to ana-
lyze TS disturbances and MARIA (Dagenhart 1981)
was used to analyze CF disturbances to correlate com-
puted N-factors with the observed transition locations
on the slot-suction wing model. For a Mach number of
0.6 and a chord Reynolds number of lO × 106, incom-
pressible TS-disturbance analysis showed that growthof the disturbances occurred over the first 15 percent
chord and suggested that N = 10 would correlate withthe observed transition location. Over the Mach num-
ber (less than 0.7) and Reynolds number range,
N-factors correlated with the experiments ranged from
8.5 to 10.5 for TS disturbances. IncompressibleCF-disturbance analysis showed that over the same
range the amplification of the disturbance did not
exceed N = 2.5; this indicated that the transition pro-
cess on the wing was primarily TS-disturbance domi-
nated. At a Mach number of 0.82 and a Reynoldsnumber of 20 x 106, TS disturbances achieved N -- 10
to 13 at the measured transition location of 20 to
28 percent chord. For this simulated HLFC test case,
suction was applied only in the first 8 percent chord.For CF disturbances, N = 4.5 was reached in the first
5 percent chord followed by decay; hence, because the
CF modes were decaying at the measured transition
location, it was concluded that transition was caused
by TS disturbances. For a Mach number 0.82 and achord Reynolds number of 10 x 106, figure 41 shows
correlations of incompressible TS-disturbance ampli-fication with measured transition locations that were
varied with suction variations. If transition occurred
close to the leading edge, N = 10.5 correlated with themeasurements, and if transition was observed at
greater than 40 percent chord, N = 7 correlated with
the measurements. (Section 3.5.3 indicated that higher
N-factors are realized for transition in the leading-edgeregion of a wing if the surface curvature is not
included in the N-factor calculation.) For a chord
Reynolds number of 20 x 106, shock interference pre-
vented any meaningful correlation. For the compress-
ible analysis of TS disturbances, N-factors ranged
from 5 to 7.5 for a Mach number of 0.82, a chord Rey-
nolds number of 20 x 106, and suction applied only up
to 10 percent chord. In conclusion, Berry et al. (1987)found transition to be TS-disturbance dominated with
incompressible analyses correlating N-factors of 9 to
11 and compressible analyses correlating N-factors of5 to 6. They also noted that the N-factor tool should be
47
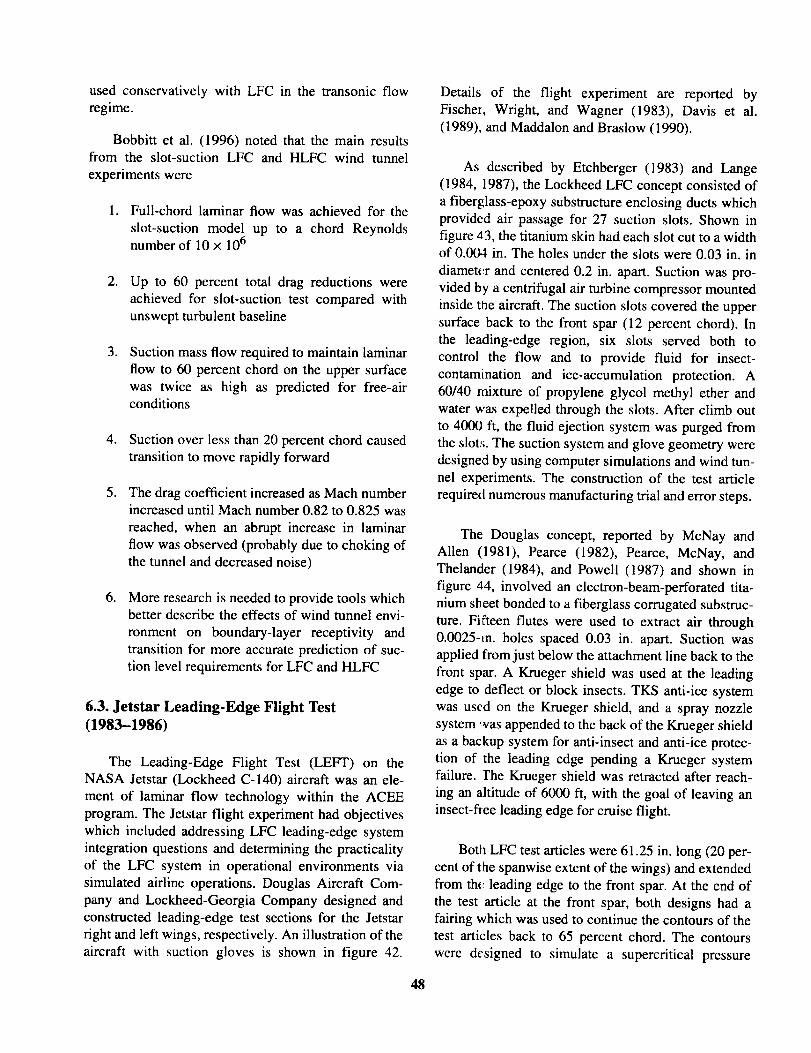
usedconservativelywith LFC in thetransonicflowregime.
Bobbittet al. (1996)notedthat the main resultsfrom the slot-suction LFC and HLFC wind tunnel
experiments were
. Full-chord laminar flow was achieved for the
slot-suction model up to a chord Reynoldsnumber of 10 x 106
. Up to 60 percent total drag reductions were
achieved for slot-suction test compared with
unswept turbulent baseline
. Suction mass flow required to maintain laminar
flow to 60 percent chord on the upper surface
was twice as high as predicted for free-airconditions
4. Suction over less than 20 percent chord caused
transition to move rapidly forward
. The drag coefficient increased as Mach numberincreased until Mach number 0.82 to 0.825 was
reached, when an abrupt increase in laminar
flow was observed (probably due to choking ofthe tunnel and decreased noise)
. More research is needed to provide tools whichbetter describe the effects of wind tunnel envi-
ronment on boundary-layer receptivity andtransition for more accurate prediction of suc-
tion level requirements for LFC and HLFC
6.3. Jetstar Leading-Edge Flight Test
(1983-1986)
The Leading-Edge Flight Test (LEFT) on the
NASA Jetstar (Lockheed C-140) aircraft was an ele-
ment of laminar flow technology within the ACEE
program. The Jetstar flight experiment had objectives
which included addressing LFC leading-edge system
integration questions and determining the practicality
of the LFC system in operational environments via
simulated airline operations. Douglas Aircraft Com-
pany and Lockheed-Georgia Company designed and
constructed leading-edge test sections for the Jetstar
right and left wings, respectively. An illustration of the
aircraft with suction gloves is shown in figure 42.
Details of the flight experiment are reported by
Fischer, Wright, and Wagner (1983), Davis et al.
(1989), and Maddalon and Braslow (1990).
As described by Etchberger (1983) and Lange(1984, 1987), the Lockheed LFC concept consisted of
a fiberglass-epoxy substructure enclosing ducts which
provided air passage for 27 suction slots. Shown infigure 43, the titanium skin had each slot cut to a width
of 0.004 in. The holes under the slots were 0.03 in. in
diamet_;r and centered 0.2 in. apart. Suction was pro-
vided by a centrifugal air turbine compressor mounted
inside the aircraft. The suction slots covered the upper
surface back to the front spar (12 percent chord). In
the leading-edge region, six slots served both to
control the flow and to provide fluid for insect-
contamination and ice-accumulation protection. A
60/40 mixture of propylene glycol methyl ether and
water was expelled through the slots. After climb out
to 4000 ft, the fluid ejection system was purged from
the slots. The suction system and glove geometry weredesigned by using computer simulations and wind tun-
nel experiments. The construction of the test article
required numerous manufacturing trial and error steps.
The Douglas concept, reported by McNay and
Allen (1981), Pearce (1982), Pearce, McNay, andThelander (1984), and Powell (1987) and shown in
figure 44, involved an electron-beam-perforated tita-
nium sheet bonded to a fiberglass corrugated substruc-
ture. Fifteen flutes were used to extract air through0.0025-m. holes spaced 0.03 in. apart. Suction was
applied from just below the attachment line back to the
front spar. A Krueger shield was used at the leading
edge to deflect or block insects. TKS anti-ice system
was used on the Krueger shield, and a spray nozzle
system was appended to the back of the Krueger shield
as a backup system for anti-insect and anti-ice protec-
tion of the leading edge pending a Krueger systemfailure, rhe Krueger shield was retracted after reach-
ing an altitude of 6000 ft, with the goal of leaving an
insect-free leading edge for cruise flight.
Both LFC test articles were 61.25 in. long (20 per-
cent of the spanwise extent of the wings) and extended
from th_ leading edge to the front spar. At the end of
the test article at the front spar, both designs had afairing which was used to continue the contours of the
test articles back to 65 percent chord. The contours
were designed to simulate a supercritical pressure
48

distributionfor thedesignconditionsof Machnumber0.75at analtitudeof 38000ft. Off-designconditionsrangedfromMachnumbersof 0.7to0.8andaltitudesof 29000to 40000ft. Thegloveshadaleading-edgesweepof 30° andthelocalpeakMachnumberof 1.1.
Surfacepitot tubesalignedalongthe front sparwereusedtodeterminethestateof theboundarylayer.Pitotprobeswerepositionedat 13percentchordatthelaminarboundary-layerheightto measurethestateoftheboundarylayer.Thedifferentialbetweenthepitotprobepressureandfree-streamreferenceprobepres-suregavethestateof theboundarylayer.Forlaminarflow, the differentialwouldbe zero,but for transi-tional andturbulentflow, a differentialwouldexistbecausethepitotprobewouldbesubmergedin atur-bulentboundarylayer.Atmosphericcloudconditionsweremeasuredbyalaserparticlespectrometerto pro-videaqualitativepictureof potentialice-particlecon-taminationandinterference.(Referto fig.45.)
At a Mach numberof 0.78 and altitudeof32000 ft, thetestarticleonlyhad7to 8percentlami-nar flow. Disturbancesalong the attachmentlinecausedtransitionto occurasthemomentum-thicknessReynoldsnumberincreasedabove110.IntroducingaGaster-typebump(fig. 16)on theinboardattachmentline eliminatedtheturbulentcontaminationproblem.Figure45showsatypicalflightprofileresult.Accord-
ing to Fisher and Fischer (1987), laminar flow was
realized back to the front spar by using the LFC
system.
For the Douglas article, laminar flow was
observed back to 83 percent of the article length for
design conditions and back to 97 percent for the off-
design condition of a Mach number of 0.705 and analtitude of 38 000 ft. Powell (1987) and Morris (1987)
discussed the LFC technological accomplishments
resulting from the Jetstar program for the Douglas
Aircraft Company. In brief, electron-beam-perforatedsuction surface fabrication, simplified LFC suction
panel construction, and a retractable Krueger shieldfor anti-insect contamination were devised and/or
demonstrated on the Jetstar. Also, because the Krueger
shield effectively prevented insect contamination on
the test section, liquid discharge from the spray nozzle
was not necessary.
A similar wood leading-edge bump was placed onthe Lockheed test article to prevent attachment-linecontamination. For a Mach number of 0.725 and an
altitude of 32000 ft, 97 percent laminar flow was
observed on the Lockheed glove. At the design Mach
number of 0.75, only 74 percent laminar flow wasrealized.
See section 4.2 for a discussion of the influence of
ice-particulate on laminar flow for the Jetstar flighttest. Note, that the aircraft encounter with clouds
shown in figure 45 lasted on the order of minutes and
that laminar flow was regained within a few seconds
after exiting the cloud.
In addition to demonstrating that the LFC systems
could be packaged in the leading-edge region, laminar
flow could be obtained through the suction LFC sys-tems, the simulated airline service demonstrated the
robustness of the LFC systems under normal operating
conditions of typical commercial aircraft (Maddalon
and Braslow 1990). As Warwick (1985) noted, the
X-21 program had difficulty keeping the LFC systemfree from insects and dirt or dust accumulation. The
Jetstar overcame this difficulty by using a Krueger
flap on the right wing and by applying a thin layer of
fluid on the left wing during takeoff. As a demonstra-
tion of the concept, the Jetstar aircraft operated out of
Atlanta, Georgia; Pittsburgh, Pennsylvania; and
Cleveland, Ohio, and into many other airports in theUnited States in 1985 and 1986 (Maddalon and
Braslow 1990). In this service, the aircraft was kept
outside and exposed to the weather (e.g., rain, pollu-tion). Results of the simulated airline service showed
that no operational problems were evident with the
LFC systems, no special maintenance was required,and LFC performance was proven through the realiza-tion of laminar flow on the test article.
6.4. Cessna Citation IlI Nacelle LFC Flight
Test (1986)
Peterman (1987) presented a Cessna Aircraft
Company perspective on NLF and LFC at a 1987
NASA symposium. Although the company focus had
primarily been on NLF, mention was made of a LFC
flight test that Cessna and Rohr Industries conductedin August and September 1986. The nacelle length
was extended by 10 in. and the first 40 percent of the
49

nacelleon a Citation III was reskinned with a woven-
wire porous surface called DYNAROHR. The surface
pressures and boundary-layer transition locations were
measured. Peterman did not discuss the LFC flight testresults in his presentation.
6.5. Dassault Falcon 50 HLFC Flight Tests
(1987-1990)
Bulgubure and Arnal (1992) and Courty,
Bulgubure, and Arnal (1993) noted that the purpose of
the flight tests on the Falcon 50 aircraft (fig. 46) was
to acquire data to validate and improve design tools
and to show the feasibility of the laminar flow concept
in flight conditions covering a range of Mach number,
Reynolds number, and sweep angle to a future laminar
business aircraft. The project took place in two flight
test phases plus a wind tunnel validation phase.
The first phase (1985-1987) aimed to demonstrate
that a wing could fly with NLF (optimized airfoil forextended regions of laminar flow) and to determine
the limits of this concept. The results of the programshowed that transition criteria had been correlated and
provided the knowledge required to proceed with the
second phase--a HLFC demonstration. The second
phase (1987-1990) of the flight test aimed to show the
feasibility of HLFC in a highly three-dimensional
region near the fuselage. The purpose of the follow-on
flight experiments was to show that laminar flow
could be realized for a 35 ° swept wing with flightReynolds numbers ranging from 12 × 10Uto 20 x 106.
The HLFC system was designed to provide
leading-edge boundary-layer suction aft to 10 percentchord on the upper surface, anti-icing and insect con-
tamination avoidance, and fuselage turbulence con-tamination avoidance along the attachment line. The
design objective was 30-percent-chord laminar flow.
Shown in figure 46, the perforated stainless steel suc-
tion article was placed over the existing inboard wing
structure in close proximity to the fuselage of the
Falcon 50 aircraft. The glove was faired into the exist-
ing wing with an epoxy resin fairing. Boundary-layer
suction was distributed chordwise through six span-
wise flutes. In addition, a TKS anti-icing system was
integrated into the design and performed the additionaltask of insect contamination
Calculations showed that at unit Reynolds num-
bers above 4 x 10⁶ (flight envelope), contamination
from the fuselage would spill onto the attachment line
and destroy the potential for laminar flow. Three-dimensional calculations were conducted to theoreti-
cally optimize a bump (Gaster 1965) to avoid the tur-
bulent contamination problem. This bump was
designed and constructed for the attachment-line
region near the fuselage-wing juncture and tested in a
wind tunnel. Results from the wind tunnel study of a
simplified model showed that the bump enabled larger
Reynolds numbers prior to turbulence onset. A bumpwas manufactured for the Falcon 50 aircraft.
As shown in figure 46, the installed instrumenta-
tion package included (1) 3 rows of static-pressuretaps embedded in the suction article between the flutes
to measure the pressure distribution Cp, (2) 3 rows of12 hot films each for transition detection flush
mounted in resin downstream of the suction article,
(3) a series of 14 hot-film sensor arrays on the uppersurface and 14 hot films oriented spanwise on the
attachrr_.ent line for attachment-line boundary-layer
state detection (used only during the leading-edgetransition-contamination measurements and removed
for flight tests with suction), (4) a pod installed foreither an infrared camera to record the transition loca-
tion or a video camera for recording leading-edge anti-
icing effectiveness, (5) 2 sensors for free-stream turbu-
lence measurements, and (6) 6 velocimeters coupled
with su:tic pressure taps to measure the suction flowrate in each channel.
The first HLFC flight test phase was conducted
initially without the Gaster bump; the primary objec-
tive of the flight investigation was the assessment of
the TKS anti-icing and insect-avoidance system. (Seesection _. 1 for a discussion of the effect of the use of a
TKS an :i-insect system for the flight test.) In addition,the location of the attachment line was measured for
proper placement to the Gaster bump. The second
phase of flight tests was with the bump on the aircraft
to deter.nine the effectiveness of the Gaster bump for
turbulel ce contamination avoidance along the attach-
ment line, the effect of sweep angle on the chordwiseextent ef laminar flow, and the effect of suction flow
rates an -1distribution on the chordwise extent of lami-
nar flo_. The flight tests were conducted such that the
chord Reynolds number variation in the region of thetest article was between 12 x 106 and 20 × 106. The
leading-edge sweep angle of the test article was nomi-
nally 35°; however, additional testing was conducted
50

at sideslip of 5° which yielded a leading-edge sweep
angle of 30 ° .
With boundary-layer suction and without the
bump, the whole test article was turbulent. For various
combinations of Reynolds number and sweep angle,
the best case revealed only a very small area of inter-
mittent boundary-layer flow outboard on the test arti-
cle. With the Gaster bump installed on the leading
edge at 150 mm from the fuselage and with the same
suction rates as in the case of no bump, the boundary
layer was observed to be mostly intermittent. With the
Gaster bump installed at 300 mm from the wing root,
figure 47 shows that most of the test article became
fully laminar. As expected, when the boundary-layersuction turned off, the flow over the test article
became completely turbulent.
The results of this two-phase flight test programdemonstrated that laminar flow was a viable concept
for at least the business-type aircraft. Hence, the
ELFIN program was established to advance NLF and
LFC technologies for subsonic flight. Figure 48 gives
a schematic of the range of interest for the projects
supported by the program.
6.6. Boeing 757 HLFC Flight Test (1990-1991)
In the 1980's, it was recognized that conventional
aircraft production wing surfaces could be built to
meet LFC design constraints. The NASA Jetstar flight
test addressed LFC suction leading-edge systems anddemonstrated extensive laminar flow in airline-type
operations. A large, commercial transport demonstra-
tion was the natural next logical stage of development.In 1987, NASA, the U.S. Air Force Wright Labora-
tory, and Boeing Commercial Airplane Group initi-
ated a cooperative flight test program on a Boeing 757
transport aircraft.
The Boeing 757 high Reynolds number HLFC
flight experiment was designed (1) to develop a data-base on the effectiveness of the HLFC concept applied
to a large, subsonic commercial transport, (2) to evalu-
ate real-world performance and reliability at flight
Reynolds numbers (including off-design conditions),
and (3) to develop and validate integrated and practi-
cal high-lift, anti-ice, and HLFC systems. (See Collier1993.)
A 22-ft span segment of the leading-edge box out-
board of the engine nacelle pylon and on the left wing
was replaced with a HLFC leading-edge box as shown
in figure 49. This new leading-edge section consisted
of a perforated titanium outer skin, suction flutesunder the skin, and collection ducts to allow suction
control of the boundary-layer CF- and TS-disturbance
growth from the leading edge to the front spar. The
leading edge included a Krueger shield integrated for
high lift and insect protection and hot air deicing sys-
tems. The wing-box portion of the test area consisted
of the original Boeing 757 surface and contour and
only required minor clean-up (e.g., shaved-off
exposed rivet heads) to meet surface waviness and
smoothness requirements. The design point for the
flight tests was Mach number 0.8 at CL = 0.50. Flight
tests of many off-design conditions were performed to
investigate extent of laminar flow as a function ofMach number, unit Reynolds number, and lift coeffi-
cient. Flight testing began in February 1990 and ended
in August 1991.
As shown in figure 49, flush-mounted pressure
taps were positioned in the perforated leading edge
and strip-a-tube belts were used to measure the exter-
nal pressure distribution over the wing box. Hot-filmsensors were used to determine the transition location
on the wing box and along the attachment line. Lim-
ited infrared camera imaging was obtained and indi-
cated that this technique was useful for boundary-layer
transition detection. Finally, wake-survey probes were
used to infer local drag-reduction estimates. The state
of the laminar boundary layer, the internal and exter-
nal pressure distributions, and the suction system weremonitored in real time onboard the aircraft during the
flight test.
The flight test demonstrated that the HLFC con-
cept was extremely effective in delaying boundary-
layer transition as far back as the rear spar around the
design point. A sample test condition (fig. 50) showsthat most of the hot films indicated laminar flow
beyond 65 percent chord (Maddalon 1991, 1992;
Shifrin 1991; Collier 1993). In fact, the suction rates
required to achieve laminar flow to 65 percent chord
were about one third of those predicted during the ini-
tial design (Maddalon, 1991). The wake-rake mea-
surements indicated a local drag reduction on the order
of 29 percent with the HLFC system operational,
51
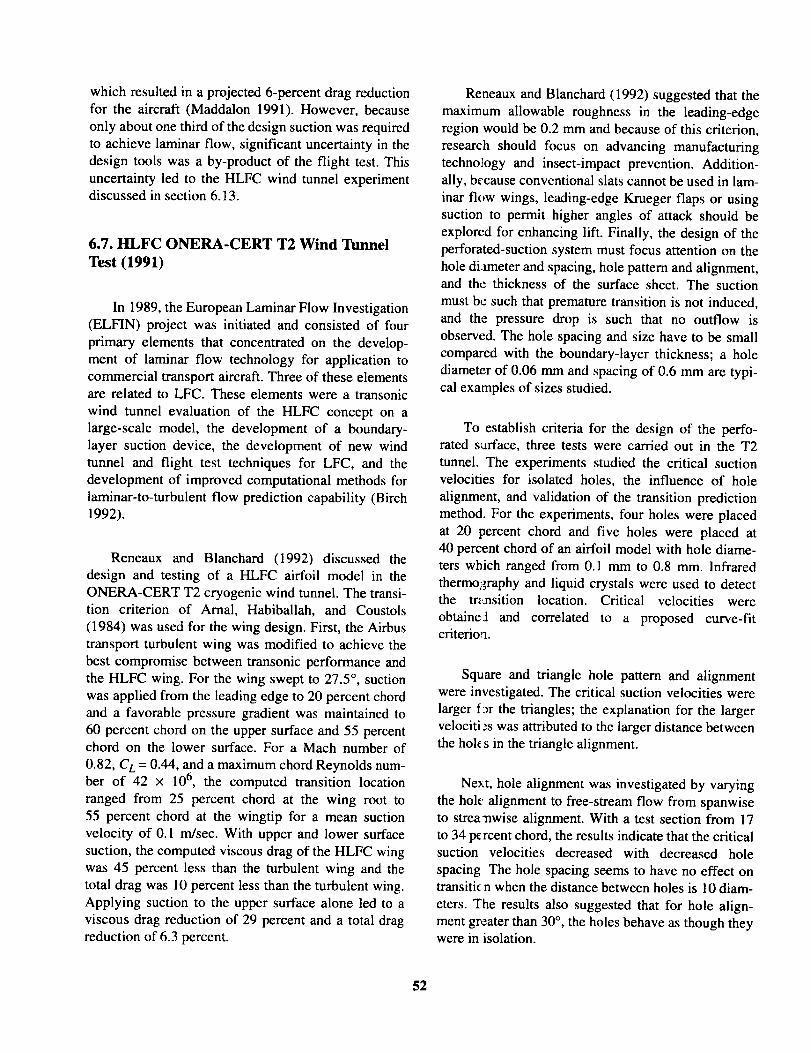
which resulted in a projected 6-percent drag reductionfor the aircraft (Maddalon 1991). However, because
only about one third of the design suction was required
to achieve laminar flow, significant uncertainty in the
design tools was a by-product of the flight test. This
uncertainty led to the HLFC wind tunnel experimentdiscussed in section 6.13.
6.7. HLFC ONERA-CERT T2 Wind Tunnel
Test (1991)
In 1989, the European Laminar Flow Investigation(ELFIN) project was initiated and consisted of four
primary elements that concentrated on the develop-
ment of laminar flow technology for application tocommercial transport aircraft. Three of these elementsare related to LFC. These elements were a transonic
wind tunnel evaluation of the HLFC concept on alarge-scale model, the development of a boundary-
layer suction device, the development of new wind
tunnel and flight test techniques for LFC, and the
development of improved computational methods for
laminar-to-turbulent flow prediction capability (Birch1992).
Reneaux and Blanchard (1992) discussed the
design and testing of a HLFC airfoil model in the
ONERA-CERT T2 cryogenic wind tunnel. The transi-tion criterion of Arnal, Habiballah, and Coustols
(1984) was used for the wing design. First, the Airbustransport turbulent wing was modified to achieve the
best compromise between transonic performance and
the HLFC wing. For the wing swept to 27.5 °, suction
was applied from the leading edge to 20 percent chordand a favorable pressure gradient was maintained to
60 percent chord on the upper surface and 55 percentchord on the lower surface. For a Mach number of
0.82, CL = 0.44, and a maximum chord Reynolds num-ber of 42 x 106, the computed transition location
ranged from 25 percent chord at the wing root to
55 percent chord at the wingtip for a mean suction
velocity of 0.1 m/sec. With upper and lower surface
suction, the computed viscous drag of the HLFC wing
was 45 percent less than the turbulent wing and the
total drag was 10 percent less than the turbulent wing.
Applying suction to the upper surface alone led to a
viscous drag reduction of 29 percent and a total dragreduction of 6.3 percent.
Reneaux and Blanchard (1992) suggested that the
maximum allowable roughness in the leading-edge
region would be 0.2 mm and because of this criterion,
research should focus on advancing manufacturing
technology and insect-impact prevention. Addition-ally, because convcntional slats cannot be used in lam-
inar flow wings, leading-edge Krueger flaps or using
suction to permit higher angles of attack should be
explored for enhancing lift. Finally, the design of the
perforated-suction system must focus attention on the
hole diameter and spacing, hole pattern and alignment,and the thickness of the surface sheet. The suction
must be such that premature transition is not induced,
and the pressure drop is such that no outflow is
observed. The hole spacing and size have to be small
compared with the boundary-layer thickness; a hole
diameter of 0.06 mm and spacing of 0.6 mm are typi-cal examples of sizes studied.
To establish criteria for the design of the perfo-rated surface, three tests were carried out in the T2
tunnel. The experiments studied the critical suctionvelocities for isolated holes, the influence of hole
alignment, and validation of the transition prediction
method. For the experiments, four holes were placed
at 20 percent chord and five holes were placed at40 percent chord of an airfoil model with hole diame-
ters which ranged from 0.1 mm to 0.8 mm. Infrared
thermography and liquid crystals were used to detect
the m_nsition location. Critical velocities were
obtaine:l and correlated to a proposed curve-fitcriterio,.a.
Square and triangle hole pattern and alignmentwere investigated. The critical suction velocities were
larger f_r the triangles; the explanation for the larger
velociti ._swas attributed to the larger distance betweenthe hole s in the triangle alignment.
Next, hole alignment was investigated by varying
the holt alignment to free-stream flow from spanwiseto strea-nwise alignment. With a test section from 17
to 34 percent chord, the results indicate that the criticalsuction velocities decreased with decreased hole
spacing The hole spacing seems to have no effect ontransiticn when the distance between holes is 10 diam-
eters. The results also suggested that for hole align-
ment greater than 30 °, the holes behave as though theywere in isolation.
52

6.8.HLFC NacelleDemonstrationFlight Test(1992)
The encouraging results achieved on the Boeing
757 HLFC flight experiment and the potential for dragreduction on nacelles led General Electric Aircraft
Engines (GEAE) to initiate a project with Rohr Indus-
tries, Inc., Allied Signal Aerospace, and NASA to
explore the use of LFC on nacelles. The project was
directed toward the flight demonstration of the HLFC
concept applied to the external surface of large, turbo-
fan engine nacelles. Bhutiani et al. (1993) stated that
the main objective of the project was to demonstrate
the feasibility of laminar flow nacelles for wide-body
aircraft powered by modern high-bypass engines and
to investigate the influence of aerodynamic character-istics and surface effects on the extent of laminar flow.
A production GEAE CF6-50C2 engine nacelleinstalled on the starboard wing of an Airbus A300/B2
commercial transport testbed aircraft was modified to
incorporate two HLFC panels-----one inboard and one
outboard--as shown in figure 51. The panels were
fabricated of a perforated composite material with suc-
tion from the highlight aft to the outer barrel-fan cowl
juncture. Suction was applied to the surface utilizingcircumferential flutes and was collected and ducted to
a turbocompressor unit driven by engine bleed. For
convenience, the turbocompressor unit was located in
the storage bay of the aircraft. The flow through each
flute was individually metered. The laminar flow con-tour extended aft over the fan cowl door and was
accomplished through the use of a nonperforated
composite structure blended back into the originalnacelle contour ahead of the thrust reverser. No provi-sions were made for ice-accumulation or insect-
contamination avoidance systems.
Static-pressure taps were mounted on the external
surface and in the flutes. A boundary-layer rake wasused to measure the state of the boundary layer. Hot-
film gauges were used for boundary-layer transitiondetection. Surface embedded microphones were used
to measure noise. A charge patch was used to measure
the atmospheric particle concentration. An infrared
camera was used for detecting the boundary-layer
transition location. Real-time monitoring and analysis
of the state of the boundary layer and suction system
were accomplished onboard the aircraft.
The flight-test phase of the project extended over
a period of 16 flights totaling 50 flight hr. As shown in
figure 51, the HLFC concept was effective over the
range of cruise altitude and Mach number and resulted
in laminar flow to as much as 43 percent of the nacelle
length (the design objective) independent of altitude
(Bhutiani et al. 1993, Collier 1993, Fernandez et al.
1996). At this transition location, the static-pressure
sensors indicated the onset of the pressure recovery
region, which caused the laminar boundary layer to
become turbulent. Without suction, significant laminar
flow was achieved on the LFC panel; the extent of
"natural" laminar flow increased with increasing alti-
tude (perhaps due to passive suction).
6.9. NLF and LFC Nacelle Wind Tunnel Tests
(1991-1993)
The earlier studies conducted in the United States
suggested that significant performance benefits could
be realized through the use of NLF and/or LFC on
engine nacelles. Before 1991, no flight tests were con-ducted by the Rolls-Royce Company to study LFC;
however, wind tunnel tests were conducted with atwo-dimensional model of a LFC nacelle. The wind
tunnel test demonstrated a region of substantial lami-
nar flow with sufficient suction. Due to unacceptablelevels of turbulence and noise in the tunnel, the exten-
sion of this effort was moved to a low-turbulence 9-ft
by 7-ft tunnel at the University of Manchester.
Mullender, Bergin, and Poll (1991) discussed the plan
to perform a series of wind tunnel experiments andtheoretical studies with NLF and LFC nacelles. The
theoretical studies were aimed at validating the LFC
design tools (including transition prediction) for use in
optimization of nacelle designs.
Optimal nacelle designs pointed toward minimiz-
ing the length of the cowl to maximize internal perfor-
mance and drag reduction benefits. For best high-
speed performance, conventional nacelles have a peak
pressure near the lip of the nacelle to distribute the
largest pressure at the most forward face of thenacelle; the flow was then decelerated over most of the
nacelle. This pressure distribution produced turbulentflow over most of the nacelle and a subsequent largeskin friction. Because the circumferential curvature
of the nacelle was smaller than the boundary-layerthickness on the nacelle, a two-dimensional model
was used to mimic the nacelle flow. Hot-film,
53

total-pressure,and static-pressure measurements of the
boundary layer were made during the wind tunnel
experiment. Using LFC suction, laminar flow was
observed on the nacelle model. By reducing the levelof suction, TS disturbances were measurable, and withno suction the flow was turbulent. Variations in tunnel
speed indicated that the suction was relatively constant
near the nose over the speed range; however, in the
mid nacelle region where the pressure gradient was
nearly flat, notable differences in suction were
observed for variation in tunnel speed. The linear cal-
culations suggested that an inviscid instability
(Rayleigh mode) developed and had greatest amplifi-
cation at 1700 Hz for a tunnel speed of 36 m/secand increased to 3500 Hz for 60 m/sec. In
two-dimensional viscous boundary-layer stability, the
frequency of the dominant mode would decrease withincreased distance downstream. Theoretical N-factor
correlations achieved 6.6 at a tunnel speed of 36 rn/secto 9.1 at 60 m/sec; this indicated that the TS distur-bances never evolved sufficient to cause transition.
Rather a separation bubble developed causingtransition.
ity (Schmitt, Reneaux, and Pries 1993). The model
had a span of 4.7 m and a mean chord of 1.58 m. The
perforated leading edge was built into the midspan
region of the wing and had a span of about 0.95 m.
Suction was implemented to about 15 percent chord
on both the upper and lower surfaces. The titaniumouter skin was 0.9 mm thick and had holes which were
40 [xm in diameter and spaced 0.5 mm apart. As
shown in figure 52, the leading edge consisted of38 suction flutes connected to 17 collection ducts. The
suction flow rate through each collection duct wasindividually controlled and measured. The chordwisetransition location was measured with infrared ther-
mography as a function of suction flow velocity for a
given transonic test condition. Figure 52 shows themeasured transition location as a function of suction
velocity. As suction was increased the transition front
moved aft. Laminar flow was achieved to 50 percentchord on the upper surface and to 30 percent chord
on the lower surface. Data gathered from the test
were used for suction system design criteriaand calibration of the laminar flow prediction
methodology.
6.10. VFW 614 HLFC Transonic Wind Tunnel
Test (1992)
6.11. European NLF and HLFC Nacelle
Demonstrator Flight Tests (1992-1993)
In 1986, the German laminar flow technology pro-
gram, supported by the German Ministry of Research
and Technology (BMFF), began wind tunnel and
flight experiments for NLF and LFC (Redeker et al.
1990). Ktimer (1990) noted that part of the program
involved determining (or discriminating) betweenwhen NLF is preferred and when HLFC or LFC is a
more appropriate choice for a particular aircraft. Two
of the major milestones of this program involved NLF
wind tunnel tests and flight research on a VFW 614
and Fokker 100 research aircraft to gain a database ofTS-disturbance- and CF-disturbance-dominated tran-sition for code calibration.
In 1992 and 1993, a cooperative program was con-
ducted by DLR, Rolls Royce, and MTU with the goal
of investigating in flight the prospects of achieving
extensi,'e laminar flow on aircraft engine nacelles(Barry et al. 1994). The test vehicle chosen for the
project was the VFW 614 ATTAS aircraft which has
twin Rolls-Snecma M45H turbofans. The placement
of the nacelle on the aircraft is shown in figure 53. The
program had the usual goals of demonstrating dragreductic_n with NLF and HLFC on a nacelle, verifying
the de,'ign methodology, verifying manufacturing
techniqlles, and validating the anti-insect transpiration
system.
The successful VFW 614 and Fokker 100 NLF
flight tests led to a transonic wind tunnel evaluation of
the HLFC concept, evaluation of wind tunnel test
techniques, and development of viable boundary-layer
suction devices. In March and April of 1992, a
1:2 scale model of one of a VFW 614 wing was built
with leading-edge suction and tested in the ONERAS 1MA transonic tunnel--the first LFC test in the facil-
For the NLF portion of the test program, two new
composite nacelles were constructed by Hurel-Dubois
for the program. One nacelle consisted of baselinelines an:l the second nacelle consisted of a new set of
aerodynamic lines, conducive to laminar flow. A third
nacelle was designed for validation of the HLFC con-
cept, which included a liquid transpiration insect con-
tamination avoidance system. (See Humphreys 1992.)
54

Instrumentation to measure the pressure, temperature,and transition location is illustrated on the test section
in figure 53. The flight test portion of the programconsisted of about 93 hr which clearly demonstrated
that laminar boundary-layer flow was achievable over
60 percent of the nacelle length in the installed envi-ronment over a large range of flight conditions for
both laminar flow concepts tested. For the NLF con-
cept, figure 54 shows the design and measured pres-
sures at two radial locations. Very good agreement
between the computed and observed pressures is real-
ized at t_ = 30°; however, significant disagreement was
found at _ = 140 ° near the pylon. This disagreement
can be attributed to the computations not including the
pylon in the design. Noise and vibration had little or
no effect on the ability to achieve laminar flow for
this design. The liquid transpiration-styled insect
contamination avoidance system was operated suc-
cessfully during the course of the flight testing.
The second phase of the program involved the
testing of the A320 vertical fin with leading-edge suc-
tion in the ONERA S1MA facility. The 1/2-scale
model in the tunnel is shown in figure 57. The objec-
tives of the wind tunnel experiment were to simulate
flight Reynolds numbers on the model, calibrate the
transition prediction tools, and establish LFC suction
design criteria. Finally, Anon. (1995b) reported thatthe A320 HLFC fin flight test program was scheduled
to be completed by 1996. (Prior to the publication of
the present report, no flight test data were available.)
The development of the A3XX program at Airbus hasallowed for the success of the A320 LFC fin program
by requiring the power plants of the A3XX to be posi-
tioned closer to the wing and for suction LFC nacelles
(Birch 1996).
6.13. Langley 8-Foot Transonic Pressure
Tunnel HLFC Wind Tunnel Test (1993-1995)
6.12. A320 Laminar Fin Wind Tunnel and
Flight Test Program (1993-1998)
Figure 55 shows an illustration of a 1987 plan byAirbus Industries in close collaboration with ONERA
and DLR to enable LFC capability for subsonic trans-
port aircraft. The program consisted of theoretical
analysis, a large wind tunnel evaluation, and a flight
test program of the vertical fin of the A320 aircraft
(ultimately geared toward the application of laminar
flow to wing and tail surfaces of a future advanced air-craft). The vertical fin of the A320 aircraft was chosen
as the candidate to test the feasibility of HLFC
because of the availability of an aircraft for flight test-
ing, simple installation, no de-icing system, attainment
of flight Reynolds number in an existing wind tunnel
(ONERA S1MA at Modane), and minimized cost
(Robert 1992a; Redeker, Quast, and Thibert 1992;Thibert, Reneaux, and Schmitt 1990).
Shown in figure 56, boundary-layer stability
results indicated that laminar flow is expected to
approximately 40 percent chord for the baseline A320
fin and to about 50 percent chord for the HLFC A320
fin (using a reasonable amount of suction). A benefit
study with the projected amount of laminar flow indi-
cates that an aircraft drag reduction of 1.0 to 1.5 per-
cent is possible by laminarizing the vertical fin.
Although the Boeing 757 HLFC flight test experi-
ment demonstrated significant runs of laminar flow
using leading-edge suction, sufficient uncertainty in
the design tools made the technology an unacceptable
risk for the commercial market. To provide a better
understanding of the complex physics of flow over a
swept-wing geometry, to provide a calibration data-
base for the LFC design tools, and to better understandthe issues of suction-system design, a joint NASA/
Boeing HLFC wind tunnel experiment was conducted
in the Langley 8-Foot Transonic Pressure Tunnel
(Phillips 1996).
A swept-wing model with a 7-ft span and 10-ft
chord was installed in the tunnel in January 1995 and
tests were conducted throughout the year. Tunnel lin-ers were installed to simulate an infinite swept wing.
Over 3000 infrared images and 6000 velocity profiles(hot-wire data) were obtained during the test, and thedata were made available to the team of researchers in
real time via encrypted World Wide Web communica-
tions (Phillips 1996).
As stated by Johnson (1996), an assessment of the
LFC design criteria was made to help guide future
designs. The influence of hole size and spacing andsuction level and distribution on the transition location
was recorded and correlated with the design tools.
Laminar flow was easily obtained back to the pressure
55

minimum with sufficient suction levels. Detailed sur-
face roughness and suction level measurements are
underway to characterize the leading-edge panels.
Detailed results are not available in the literature
for inclusion in this publication.
6.14. High-Speed Civil Transport (1986)
In 1986, NASA and the U.S. airframe and engine
manufacturers determined that the long-range travel
market was conducive to a supersonic airliner (high-
speed civil transport, HSCT); however, significant
technological advances were required. The advances
would require an aircraft to fly slightly faster than the
speed of the Concord but with nearly twice the range
and three times the number of passengers at an afford-
able ticket price while not damaging the environment.
As shown by Kirchner (1987), laminar flow could
lead to significant benefits for a supersonic transport.
When considering the application of NLF and LFC
technologies to the supersonic flow regime, the high
cost and limited availability of flight test aircraft
inhibits the advancement of these technologies. Mili-tary jet fighter aircraft, the Concord, and the Tupelov
Tu-144 currently fly at supersonic Mach numbers and
are potentially viable candidates to serve the LFC
research community; however, the design and manu-
facturing of most of these aircraft were devoid of the
future potential use for LFC missions and potentially
have unacceptable surface waviness, roughness, and
aircraft-specific obstacles. Wagner et al. (1990) pre-
sented the status of supersonic LFC through the 1980s.
In spite of these limitations, technology can be
advanced by making use of these aircraft when they
are made available. Toward the goal of advancing
NLF supersonic technology, flight experiments were
commenced in the United States toward gaining a
better understanding of the viscous flow physics. A
summary of the NLF results for supersonic aircraft arepresented in appendix B.
Two fundamental approaches were posed for the
supersonic laminar flow wing. The first approach wasa low-sweep wing which involved the design of a NLF
leading-edge region and low-suction (or thermal)
LFC on a section on the wing to extend the laminar
flow to higher chord Reynolds numbers. As discussed
by Gottschalk (1996), such a concept proposed by
Northrop Grumman Corporation would have a
sharp supersonic leading edge and result in a thin
attachment-line boundary layer and a very small
momentum-thickness Reynolds number. Such a flowshould be stable and have a laminar attachment line.
Crossflow disturbances could be avoided with the low
wing sweep and, with appropriate wing shaping, a par-tially NLF wing could be achieved. LFC would be
required on the rooftop of the wing to extend the
region of laminar flow to higher Reynolds numbers.
Concerning the use of thermal LFC, Dunn and Lin
(1953) have shown in the early 1950s that cooling can
be used to suppress disturbances. As shown by Boeing
(Parikh and Nagel 1990), cooling has a large impact
on TS disturbances and only a subtle influence on
CF disturbances; hence, cooling would not be useful
in the leading-edge region of swept wings for CFstabilization.
In contrast to the low-sweep supersonic laminarflow concept proposed by Northrop Grumman, the
highly swept wing would have a subsonic leading
edge, a blunt nose, and higher momentum-thickness
Reynolds number. As Wagner et al. (1990) noted, the
turbulent baseline HSCT configurations by The
Boeing Company and McDonnell Douglas Corpora-
tion were making use of the second approach. With
this h_gh-sweep wing, the issue of turbulentattachment-line contamination must be addressed and
suction LFC would be required to control the
CF-dominated transition process in the leading-edge
region of the wing. For long chords typical of the
HSCT configurations, an additional strip of suction (or
thermal) LFC would be required on the wing to delay
the TS- dominated transition process.
Williams (1995) noted that a proposed HSCT car-
rying 305 passengers and flying 5000 n.mi. with 1990
technology would weigh almost 1.25 million lb at
takeoff and would not meet the current noise require-
ments. A technology development program would
need tc reduce the weight by almost 50 percent to
make tae HSCT feasible. Toward overcoming thetechnic;d obstacles, NASA commenced Phase I of a
High-Speed Research (HSR) Program in partnership
with U.S. industry. Phase I focused on developing reli-able methods to predict engine-emission effects on the
ozone, noise reduction technologies, and the potential
56

advantages of supersonic laminar flow control(SLFC).
Feasibility studies by Boeing Aircraft Company
(Parikh and Nagel 1990) and McDonnell Douglas
Aircraft Company (Powell, Agrawal, and Lacey 1989)were funded to determine the benefits of supersonic
laminar flow control applied to the HSCT configura-
tion. Reductions in gross takeoff weight, mission fuel
burn, structural temperatures, emissions, and sonic
boom were predicted by incorporating SLFC technol-
ogy on a HSCT configuration (see section 2).
Because of the favorable results achieved with
Phase I of the program, HSR Phase II was initiated to
perform additional research toward advancing thestate of technology to make the HSCT economically
viable. As part of Phase II, the low-disturbance wind
tunnels at Langley and Ames Research Centers andthe F-16XL aircraft at Dryden Flight Research Center
were used to advance the state of the art in supersoniclaminar flow control. An overview of the understand-
ing of SLFC up to 1987 was provided by Bushnell andMalik (1987).
6.15. Supersonic LFC Quiet-Tunnel Tests
(1987-1996)
Conventional supersonic and hypersonic wind
tunnels are dominated by acoustic disturbances radi-
ated from the turbulent boundary layers on the tunnelwalls. The emanation of these disturbances follow
Mach lines. To study laminar flows (i.e., transition,
boundary-layer instability, and LFC), the test sectionin the tunnel must be clean (defined as free-stream
pressure fluctuations below 0.1 percent). This section
focuses on the research primarily supported by the
HSR project and conducted in the Langley SupersonicLow-Disturbance Tunnel (SLDT) and the Ames
Laminar-Flow Supersonic Wind Tunnel (LFSWT).
For more details about quiet tunnels, refer to the
review of quiet tunnel technology by Wilkinson et al.
(1992).
Beckwith, Chen, and Malik (1987, 1988) pre-sented a method to maintain a test section free from
acoustic disturbances which culminated in the Mach
number 3.5 Supersonic Low-Disturbance Tunnel
(SLDT) at Langley Research Center. The tunnel is a
blowdown facility supplied with dry high-pressure air
which exhausts into large vacuum spheres to providerun times on the order of 30 min. The nozzle throat is
highly polished to maximize the extent of laminar
flow on the nozzle walls. Upstream of the sonic throat,suction was used to remove the turbulent boundary
layer that exists on the wall. The fresh laminar bound-
ary layer evolved through the contoured nozzle until
the boundary layer undergoes transition to turbulence.
The location of this transition point governs the lengthof the low-disturbance test-section rhombus and is
directly influenced by the unit Reynolds number of the
flow. As the unit Reynolds number increases, the size
of the quiet test-section rhombus decreases; however,
the Reynolds number based on the length of the quiettest core increases. The tunnel was capable of operat-
ing in conventional noisy mode or in quiet (low-
disturbance) mode.
In the SLDT, measured transition Reynolds num-
bers were shown to be comparable with transition
observed in flight. Creel, Malik, and Beckwith (1987)and Creel, Beckwith, and Chen (1987) used the quiet
tunnel to study boundary-layer instabilities on a lead-
ing edge of a swept cylinder. The results suggestedthat transition was affected by wind tunnel noise only
when large roughness was present on the model, the
local roughness Reynolds number correlated with the
transition location for a wide range of Mach numbers,
and linear stability theory showed good agreement for
the experimental crossflow vortex wavelength of thedominant mode. Morrisette and Creel (1987) studied
the effect of surface roughness and waviness on transi-
tion in the SLDT. Controlled roughness and waviness
were imposed in the supersonic flow and comparedwith subsonic correlations. Eight 15-in. long and 5 °
half-angle wavy cones were tested, where the wave-length of the cones correspond to the most amplifiedTS disturbance for the smooth cone. A fixed surface
pitot tube was used to measure transition as a function
of total tunnel pressure. Results with wall waviness
indicated that the tunnel running with a noisy environ-
ment led to lower transition Reynolds numbers com-
pared with the results in the quiet environment. Also,
the results suggested that the transition location was a
function of aspect ratio (wave height over wave-
length). The quiet tunnel results for roughnessmatched with the correlation by Van Driest and
McCauley (1960) for three-dimensional roughness oncones. Morrisette and Creel (1987) concluded that
57
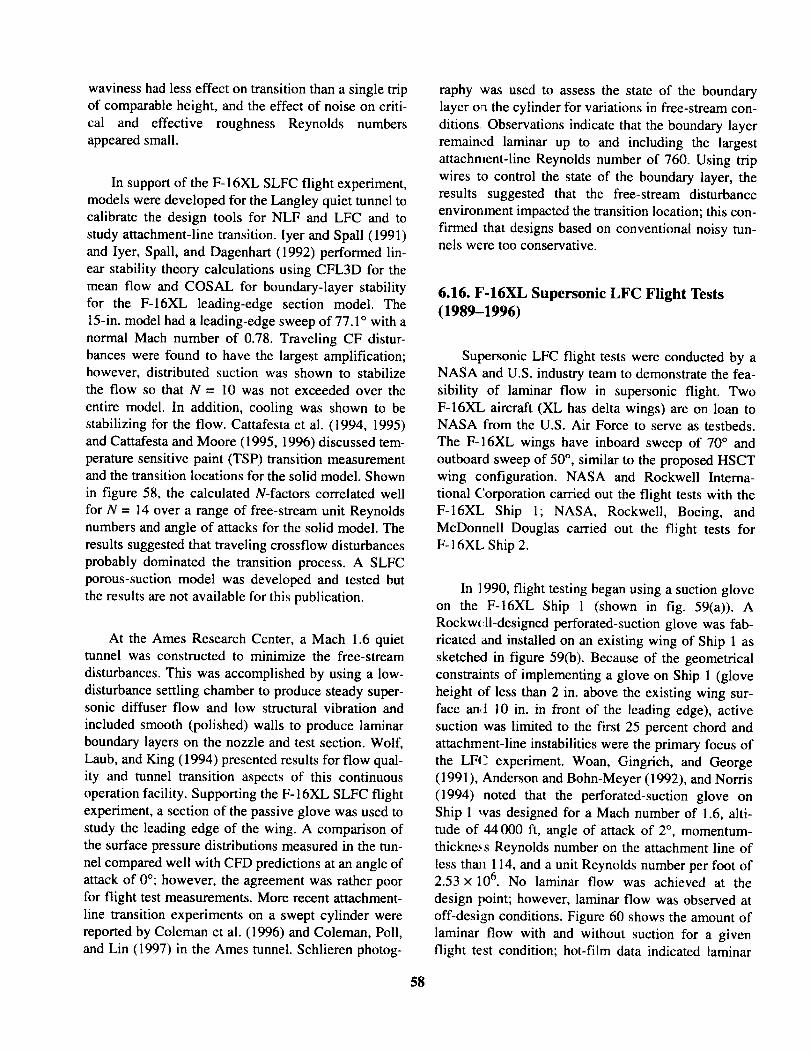
waviness had less effect on transition than a single trip
of comparable height, and the effect of noise on criti-
cal and effective roughness Reynolds numbersappeared small.
In support of the F-16XL SLFC flight experiment,
models were developed for the Langley quiet tunnel to
calibrate the design tools for NLF and LFC and to
study attachment-line transition. Iyer and Spall (1991)
and Iyer, Spall, and Dagenhart (1992) performed lin-
ear stability theory calculations using CFL3D for the
mean flow and COSAL for boundary-layer stabilityfor the F-16XL leading-edge section model. The
15-in. model had a leading-edge sweep of 77.1 ° with a
normal Mach number of 0.78. Traveling CF distur-
bances were found to have the largest amplification;however, distributed suction was shown to stabilize
the flow so that N = 10 was not exceeded over the
entire model. In addition, cooling was shown to be
stabilizing for the flow. Cattafesta et al. (1994, 1995)
and Cattafesta and Moore (1995, 1996) discussed tem-
perature sensitive paint (TSP) transition measurementand the transition locations for the solid model. Shown
in figure 58, the calculated N-factors correlated well
for N = 14 over a range of free-stream unit Reynolds
numbers and angle of attacks for the solid model. The
results suggested that traveling crossflow disturbances
probably dominated the transition process. A SLFC
porous-suction model was developed and tested but
the results are not available for this publication.
At the Ames Research Center, a Mach 1.6 quiettunnel was constructed to minimize the free-stream
disturbances. This was accomplished by using a low-
disturbance settling chamber to produce steady super-sonic diffuser flow and low structural vibration and
included smooth (polished) walls to produce laminar
boundary layers on the nozzle and test section. Wolf,
Laub, and King (1994) presented results for flow qual-ity and tunnel transition aspects of this continuous
operation facility. Supporting the F-16XL SLFC flight
experiment, a section of the passive glove was used to
study the leading edge of the wing. A comparison of
the surface pressure distributions measured in the tun-
nel compared well with CFD predictions at an angle of
attack of 0°; however, the agreement was rather poor
for flight test measurements. More recent attachment-
line transition experiments on a swept cylinder werereported by Coleman et al. (1996) and Coleman, Poll,
and Lin (1997) in the Ames tunnel. Schlieren photog-
raphy was used to assess the state of the boundary
layer oTathe cylinder for variations in free-stream con-
ditions. Observations indicate that the boundary layer
remained laminar up to and including the largest
attachment-line Reynolds number of 760. Using trip
wires to control the state of the boundary layer, the
results suggested that the free-stream disturbanceenvironment impacted the transition location; this con-
firmed that designs based on conventional noisy tun-nels were too conservative.
6.16. F-16XL Supersonic LFC Flight Tests
(1989-1996)
Supersonic LFC flight tests were conducted by a
NASA and U.S. industry team to demonstrate the fea-
sibility of laminar flow in supersonic flight. Two
F-16XL aircraft (XL has delta wings) are on loan toNASA from the U.S. Air Force to serve as testbeds.
The F-16XL wings have inboard sweep of 70 ° and
outboard sweep of 50 °, similar to the proposed HSCTwing configuration. NASA and Rockwell Interna-
tional Corporation carried out the flight tests with the
F-16XL Ship 1; NASA, Rockwell, Boeing, and
McDonnell Douglas carried out the flight tests forF- 16XL Ship 2.
In ]990, flight testing began using a suction glove
on the F-16XL Ship 1 (shown in fig. 59(a)). A
Rockwell-designed perforated-suction glove was fab-
ricated and installed on an existing wing of Ship 1 as
sketched in figure 59(b). Because of the geometrical
constraints of implementing a glove on Ship 1 (glove
height of less than 2 in. above the existing wing sur-
face and 10 in. in front of the leading edge), active
suction was limited to the first 25 percent chord and
attachment-line instabilities were the primary focus of
the LFC experiment. Woan, Gingrich, and George(1991), Anderson and Bohn-Meyer (1992), and Norris
(1994) noted that the perforated-suction glove onShip 1 was designed for a Mach number of 1.6, alti-
tude of 44 000 ft, angle of attack of 2°, momentum-
thickness Reynolds number on the attachment line of
less than 114, and a unit Reynolds number per foot of2.53 x 10 6. No laminar flow was achieved at the
design point; however, laminar flow was observed at
off-design conditions. Figure 60 shows the amount of
laminar flow with and without suction for a givenflight test condition; hot-film data indicated laminar
58

flow to the outboard portion of the glove (Anderson
and Bohn-Meyer 1992).
Woan, Gingrich, and George (1991) reported on
the design, analysis, and validation of a coupledNavier-Stokes and compressible linear stability theory
approach for supersonic LFC design. Validation wasobtained by using the methodology to design the suc-
tion LFC glove for the F-16XL Ship 1 and then by
making a comparison with flight-measured results. Atechnology goal of the methodology was to obtain a
design which minimizes suction requirements and
simultaneously defines a pressure which is conducive
to stabilizing the boundary layer. Overall, the CFDresults were in reasonably good agreement with the
Ship 1 database. Mean-flow results from the Navier-Stokes codes were used with the COSAL boundary-
layer stability code for correlations with the available
transition Ship 1 data. Stability calculations (for an
N-factor of 10) indicated that transition would occur at
1.5 in. from the leading edge without suction; shown
in figure 60, laminar flow was restricted to very near
the leading edge in the flight test with no suction. The
computations showed three distinct shocks which
must be tracked for laminar flow management. These
shocks emanated from the nose, the canopy, and the
engine inlet (underneath the aircraft).
Flores et al. (1991 ) used thin-layer Reynolds aver-
aged Navier-Stokes equations to study the sensitivity
of the attachment line and crossflow velocity profiles
to changes in angle of attack for Ship 1. The results
showed that as angle of attack increased (1) the
boundary-layer thickness and streamwise velocity pro-
files had no significant changes, (2) the attachment
line moved from the upper surface to the lower sur-
face, and (3) the crossflow velocity component at a
fixed location on the upper surface of the wingdecreased. This information is important for determin-
ing the optimal amount of suction required for a given
position on the wing to obtain laminar flow.
In the 1991-1992 time-frame, flight measure-ments were obtained for the flow on the F-16XL
Ship 2 leading-edge passive glove. The passive glove
had a 4.5-m span and 10-percent-chord section made
of foam and fiberglass and was designed byMcDonnell Douglas Corporation and built by NASA
Dryden Flight Research Center. The goal of the first
flight tests was to obtain surface pressure data to
calibrate the Euler design codes, particularly in the
leading-edge attachment-line region. Preventing the
fuselage turbulent boundary layer from contaminating
the attachment-line region of the wing was a second
major technical issue which was addressed in the first
phase of flight tests. The third technical area of inter-est involved characterizing the acoustic disturbancefield and disturbances which could come from the
fuselage turbulent boundary layer. The pressureand laminar flow extent data provided valuable
attachment-line region information for the design of
the Ship 2 suction glove.
The perforated-suction glove for Ship 2 was
designed in a collaborative effort between Boeing,
McDonnell Douglas, Rockwell, and NASA. A photo-
graph of Ship 2 and a sketch of the LFC test article are
shown in figure 61. Because of the asymmetry of
Ship 2 with the suction glove, stability and control of
the Ship 2 configuration was tested for safety assur-ance in a wind tunnel. For the flight article, the
perforated-suction SLFC glove was constructed of
inner and outer titanium skin and aluminum stringers.
Suction was obtained by using a modified Boeing 707
turbocompressor. Norris (1994) noted that suction was
applied through some 10 million holes and20 individual suction regions on the glove surface.
Wagner et al. (1990) and Fischer and Vemuru (1991)
noted that the F-16XL Ship 2 SLFC flight experiment
had objectives of achieving laminar flow over 50 to
60 percent chord on a highly swept wing, of delivering
validated CFD codes and design methodology, and of
establishing initial suction system design criteria for
LFC at supersonic speeds. The suction glove was
installed on Ship 2 and the first flight was conductedOctober 13, 1995. The first supersonic flight took
place on November 22, 1995. The first suction-on
supersonic flight test was accomplished January 24,1996.
Similar to Ship 1, Ship 2 had aircraft-specific
shock and expansion waves which influenced the flowon the wings. Although canopy and engine inlet
shocks spreading out over the wings and expansion
waves from beneath the wing caused a highlythree-dimensional flow field and difficulties in obtain-
ing laminar flow on the attachment-line region at the
same test conditions, significant progress toward
59
accomplishing the goals was achieved. In spite of
these test aircraft-dependent obstacles, Smith (1996)
noted that the supersonic laminar flow control flight
experiment achieved about 70 to 80 percent of the ini-
tial goals.
7. Concluding Remarks
This publication has reviewed some of the earlyfoundational studies and more recent U.S. and
European projects which had goals of solving techni-
cal obstacles associated with the application of lami-
nar flow control to advanced transport aircraft. The
technology has the potential to offer breakthrough
improvements in aircraft efficiency by leading to sig-
nificant reductions in aircraft fuel consumption,
extending range or increased payload, reductions in
emissions and noise, and increasing cruise lift and
drag, and reducing maximum gross takeoff weight.
Much progress has been accomplished toward the goal
of commercial incorporation of laminar flow control(LFC) (and natural laminar flow (NLF)) on wings,
tails, and engine nacelles. However, because the
application of the technology leads to additional sys-
tems and some uncertainty in the maintenance require-ments and long-term structural integrity due to the
system, questions still remain which must be resolved
relative to long-term operational and reliability char-
acteristics of current hybrid laminar flow control
(HLFC) concepts before the aircraft industry can guar-
antee the sustained performance of the LFC vehicle totheir airline customers.
The 1980s and 1990s brought the successful dem-onstration of a LFC aircraft (Jetstar and Falcon 50
LFC flight tests) in airline operations and with insect-prevention systems, the achievement of laminar flow
at high Reynolds numbers (Boeing 757 HLFC flighttest), the achievement of laminar flow on a HLFC
engine nacelle (A300/GE and VFW 614 nacelle flighttests), and various LFC wind tunnel tests (Langley8-Foot Transonic Pressure Tunnel and ONERA S 1MA
LFC tests). However, from the airframe company per-
spective, some technology issues exist which require
attention prior to the acceptance of LFC. These issues
include the resolution of potential performance penal-
ties versus projected HLFC benefits (leading-edge
Krueger versus conventional leading-edge slat sys-
tem); the development of HLFC compatible ice-
protection systems; the development of viable high
Reynohls number, wind tunnel test techniques for
HLFC ,-onfiguration development; the demonstration
of acceptable reliability, maintainability, and opera-
tional characteristics for a HLFC configuration; and
the ability to predict and guarantee benefits to the air-line customers. In 1991, a Senior Vice President of an
airframe systems manufacturer stated that before lami-
nar flow control could be used on commercial aircraft,
the long-term technical and economic viability of the
technology must be demonstrated. Although many ofthese issues have been addressed subsequent to thisstatemeat, the future of subsonic and transonic LFC
technology must reside in a large-scale demonstrator
to stud) the long-term reliability of the performanceand flight-safety operations, in refined design tool
development, and in the longer term understanding of
the effects of wind tunnel flow quality on the laminar
flow (LF) extent. An alternative future resides in the
demonstration of innovative LFC control systems.
Perhaps, advances in micro-machine, synthetic-jet,
smart-rraterial technologies will lead to orders of
magnitude improvements in efficiency, reliability, and
cost-effectiveness of these future LFC systems, and
LFC will be an integral part of this revolutionary newaircraft.
In the supersonic vehicle class, the 1990s brought
the first flight demonstration of LF achieved by super-
sonic la_ninar flow control (SLFC) through the success
of a NASA-industry team. In 1990, a General Man-
ager of a major airline company stated in a talk on thehigh-speed market in the next three decades that,
although the subsonic fleet will play the role of serv-ing the low-yield mass traffic markets, the supersonic
transport will be a big part of the intercontinental fleet
of the future. Looking at historical data, the long-range
aircraft _ntering the market and replacing an existing
aircraft aas never been smaller than the aircraft being
replaced. Based on these data, the smallest interconti-
nental supersonic transport (SST) will have a capacity
of no less than 300 seats (at moderately higher--
20 percc nt-----cost than the subsonic cost). The benefitsof LFC increase with the size of the aircraft. If this
subsonic: trend of larger aircraft entering the market
continue s, the LFC technology could be an even more
significant competitive advantage to a next generation
airplane. Environmental issues, materials, systems,
engines, and supersonic laminar flow control are some
of the research which ought to be pursued for the
development of a supersonic transport.
60

The reduced priority of LFC resides not with any
unfeasibility of the technology but rather with the
promise of benefits being intimately tied to the aircraft
fuel prices. As the cost of fuel decreases in real dollar
value, the benefits and hence future prospects of LFC
decrease to obscurity; conversely, as fuel price
increases, the benefits of LFC increase. Even if alter-
nate fuels are introduced into the equation, the benefits
of reduced
supersonicwith LFC.
noise and emissions (and heat stress on
aircraft) remain attractive achievements
NASA Langley Research Center
Hampton, VA 23681-2199June 18, 1998
61
Appendix A
Subsonic Natural Laminar Flow
Research
In this appendix, a bibliography of NLF research
results is briefly given. Additional reviews of laminar
flow flight testing are given by Wagner et al. (1988,
1989) and Hefner (1992). Holmes and Obara (1992)
and Holmes, Obara, and Yip (1984) review and focus
on NLF flight research, Somers (1992) and Pfenningerand Vemuru (1992) discuss laminar flow airfoils.
A.1. Cessna T210R (Late 1980s)
Research was performed to design NLF airfoilsand implement these airfoils in full-scale wind tunnel
and flight tests. For example, a Cessna T210Rresearch aircraft was used in the late 1980s to validate
the use of NLF for aerodynamic performance gains.This research airplane had a NLF wing and horizontalstabilizer and a smoothed vertical stabilizer. The air-
foil was designed to achieve 70 percent NLF on both
upper and lower surfaces; this resulted in low drag at acruise Reynolds number of 10 x 106. Murri and Jordon
(1987) and Befus et al. (1987) performed full-scale
wind tunnel and flight tests of this aircraft. Under a
joint research program, NASA, Cessna, and the Fed-
eral Aviation Administration (FAA) addressed the
flight testing of a NLF aircraft to simulate FAR Part 3certification. Related to certification, Manuel and
Doty (1990) describe the impact of the loss of laminar
flow on the Cessna T210R and make quantitative
comparisons of the ability of the aircraft to meet certi-fication under these conditions. Three test conditions
were explored:
1. Natural transition on all surfaces
. Fixed transition at 5 percent chord on the upper
and lower surfaces of the wing, horizontal sta-bilizer, and both sides of the vertical stabilizer
control behavior relative to FAR Part 23 and (2) climb
performance decreased l 0 percent, which was consis-
tent with the increased drag associated with a trippedboundary-layer flow.
A.2. Bellanca Skyrocket II
Holmes et al. (1983) reported on a flight investiga-
tion of NLF on a high-performance, single-propeller,
composite aircraft. The primary goals of the flight test
were (1 } to address the achievability of NLF on a mod-
em composite production-quality surface and (2) to
address some of the NLF-related maintainability
issues (e.g., insect contamination). The flight envelopeenables unit Reynolds numbers up to 1.9 x 10⁶ and
chord Reynolds numbers of 12 × 106. Without modifi-
cation of contours or waviness, the flight test results
indicated that laminar flow on the wings and empen-nage was responsible for the previously measured
lower-than-expected zero-lift drag coefficient. No pre-mature transition was observed due to waviness, con-
tour discrepancies, or surface dents. Significant
regions of laminar flow were realized in the slipstream
region. Insect-debris contamination in flight indicatedthat 25 percent of the insects caused transition. Thefact that transition was realized downstream of the
minimum pressure suggests that acoustic, surface, or
turbulence disturbances are not responsible for transi-
tion; rather, the amplification of TS disturbances or
laminar separation in an adverse pressure gradientdominales the transition process. NLF was achieved
on appraximately 40 percent of the wing and 50 to
70 percent of the propeller. In a comparison of the
waviness of the Bellanca Skyrocket II production
quality with the filled and sanded wing test section of
the King Cobra (see Smith and Higton 1945), it isclear that the production quality of more modern sur-faces has less variation, sufficient for NLF and LFC
technokgies. N-factor calculations showed that a3000-H= TS wave correlated with the transition loca-tion for V = 17.
A.3. Gulfstream GA-7 Cougar
. Fixed transition at 5 percent chord on the upper
and lower surfaces of the left wing and theremaining surfaces with natural transition
The conclusions were (1) the loss of NLF did not
cause the aircraft to exhibit unacceptable stability and
Howard, Miley, and Holmes (1985) studied the
effects c f the propeller slipstream on the laminar wing
boundary layer. Hot-film measurements in flight and a
wind tunnel show that the state of the boundary layerat any given point on the wing alternates between lam-
inar and turbulent flow because of the periodic
62

externalflow disturbancesgeneratedin the viscouswakeof thepropellerblade.Analyticstudiesrevealthatthecycliclaminarandturbulentdragof thewingis lowerthanafully turbulentwing.Hence,theNLFdesignyieldsdrag-penaltyreductionsin theslipstreamregionof thewingandin regionsnotaffectedby theslipstream.
A.4. Cessna Citation III
Wentz, Ahmed, and Nyenhuis (1984, 1985) dis-
cussed the results of a Langley Research Center,
Wichita State University, Cessna Aircraft Co., and
Boeing Commercial Airplane Company joint research
program on NLF. The study used a business jet air-
craft with the following objectives:
1. To determine the transition location at various
Mach numbers and Reynolds numbers
2. To determine the effects of wing sweep ontransition
3. To determine impact of engine acoustics ontransition
attached to both wings. The primary goal of the study
was to demonstrate laminar flow at higher Reynolds
numbers for swept wings. The glove geometry con-
sisted of a supercritical NLF airfoil designed by
Boeing and NASA to investigate NLF at transonic
speeds. For the design lift coefficient of 0.5 at a Machnumber of 0.77 and a Reynolds number of 25 x 106,
the airfoil had a favorable pressure gradient to about
70 percent chord on the upper surface (crossflow dis-
turbances were not considered in the design). The
glove was installed on the wing to achieve the desired
pressure distribution at l0 ° wing sweep. The flightresults showed that laminar flow was obtained to
56 percent chord on the upper surface at 9° sweep, to
21 percent chord at 25 ° sweep, with chord Reynoldsnumbers from 23 x l0 6 to 28 × l0 6, respectively. Themaximum run of laminar flow on the lower surface
was 51 percent wing chord at 16° wing sweep to 6 per-cent chord at 25 ° sweep (sideslip). The overall results
from the F- 111 TACT NLF flight experiment showed
laminar flow but not as much as expected. Besides not
accounting for potential crossflow-induced transition,the F- 111 had a limited spanwise extent of test section
and had a crude method for determining the transitionlocation.
4. To check the validity of boundary-layer stabil-
ity tools
Sublimating chemicals and hot-film anemometry areused to detect transition. The test section on the wing
was covered with fiberglass and filled and smoothedto minimize roughness-related effects caused by
joints, rivets, and screw heads. Plaster splashes of theupper and lower wing surfaces were made to measurewaviness. The measured waviness was welt below the
maximum allowable for a single wave. (See Kosin
1967.) Transition was realized to about 15 percent
chord for 20 ° wing sweep and to about 5 percent chord
for 30 ° wing sweep. The amplification of TS distur-
bances is proposed to be the cause for transitionbecause transition was realized in the region of
adverse pressure gradient. The impact of engine noiseon transition was inconclusive. The flight test results
were not compared with theory.
A.5. F-111
A F-111 Transonic Aircraft Technology (TACT)
airplane was tested with partial span NLF gloves
A.6. NASA NLF(1)-0414F Airfoil Experiment
In addition to flight tests, NLF wing design studies
were conducted in the 1980s. For example, McGee et
al. (1984) reported the results of testing a NLF wing
(NASA NLF(1)-0414F airfoil) in the Langley Low-Turbulence Pressure Tunnel (LTPT). The airfoil was
designed (Viken 1983) to achieve 70-percent-chord
laminar flow on both upper and lower surfaces at thedesign Reynolds number of 10 × 106 and Mach num-
ber of less than 0.40. In the wind tunnel experiment,
laminar flow was observed to 70 percent chord on
both surfaces at design conditions.
A.7. F-14
Following the achievement of laminar flow on the
F-Ill, the F-14 Variable Sweep Transition Flight
Experiment (VSTFE) was initiated by NASA and
Boeing Commercial Airplane Company (Anderson,
Meyer, and Chiles 1988). Unlike the F-Ill glove
(which was not designed to minimize CF disturbance
growth), the F-14 gloves were designed to optimizebetween TS- and CF-disturbance growth. The F-14
63
test used nearly all the span of the variable-sweep por-tion and hot films to detect transition onset in the
boundary layer. Testing of the smooth clean-up glove
ended in 1986 and testing with the Mach number 0.7NLF glove ended in 1987. Test variations included
wing sweep, Reynolds number, Mach number, and
pressure gradients. Discussed by Meyer, Trujillo, and
Bartlett (1987), the results from the F-14 VSTFE
showed maximum transition Reynolds numbers of
17.6 x 10⁶ for 15° wing sweep, 13.5 x 10⁶ for
20° sweep, 12 x 10 6 for 25 ° sweep, and 5 x 10⁶ for
3° sweep. Overall, the N-factor correlations gave a
much broader distribution of N(CF) versus N(TS) for
the F-14 flight test compared with the F-111. Hence,
either the N(CF)-N(TS) graph does not collapse the
transition points and correlations to a usable designtool or a more careful review and discrimination of the
usable flight test points must be made to reduce the
uncertainty and scatter in the results.
determine the potential influence of sound on the
potentially unstable flows. Essentially, a less stable
flow _'ould be expected simply by thickening the
nacelle lip. Obara and Dodbele (1987) reported the
aerodynamic performance results realized during the
flight experiment and Schoenster and Jones (1987)
reported the effect of the acoustic sources. For a flighttest at altitude of 1300 ft, Mach number of 0.25, and
unit Reynolds number per foot of 1.8 x 10⁶, subliming
chemicals indicated laminar flow to 50 percent of the
nacelle length, with transition occurring at the
forebody-aftbody joint. At the same flight conditions,
the noise sources had no noticeable impact on the tran-
sition locations. Away from the pylon, the measured
pressure distributions were shown to be in good agree-
ment with the design pressure back to the pressurepeak.
A.9. Boeing 757 NFL Flight Test
A.8. NLF Nacelle Flight Experiment
About the same time, a NLF nacelle flight experi-
ment was conducted through a teaming effort led byGeneral Electric Aircraft Engines. The experiment
was pursued because the friction drag associated with
modem turbofan nacelles may be as large as 4 to
5 percent of the total aircraft drag for a typical com-mercial transport and because potential specific fuel
consumption (SFC) reductions on the order of 1 to
1.5 percent may be achieved for laminar boundary-
layer flows on advanced nacelles. The first phase of
the flight experiment involved flying a NLF fairing on
the nacelle of a Citation aircraft to develop test tech-
niques and to establish the feasibility of the concept.
Hastings et al. (1986) reported the results of the first
phase which achieved laminar flow to 37 percent of
the fairing length. The analysis showed that the
Granville (1953) criterion predicted the observed tran-sition location for two of the four locations and that
the pressure on the fairing induced a neutrally stableflow; this indicated that the flow was sensitive to
external effects. The second phase of the flight test
experiment involved flying a full-scale flow-through
NLF nacelle (of various geometries) under the wing of
a Grumman OV-1 Mohawk aircraft (Hastings 1987;
Faust and Mungur 1987). Three nacelle shapes were
selected and designed to have pressure distributionswhich led to flow fields which were susceptible to
boundary-layer instabilities. The variation was to
The question of whether laminar flow could be
maintained on a commercial transport with high-bypass-ratio wing-mounted turbofan engines led to
another NASA-funded flight experiment. The Boeing
Company used its Boeing 757 flight research aircraft
with a part of one wing modified to reduce sweep andobtain more NLF and to obtain extensive noise field
measurements on a commercial transport (Runyan
et al. 1987). Primary goals of the experiment includedthe determination of the influence of noise on the lam-
inar boandary-layer flow. A 21 ° swept-wing glove
was moanted outboard of the engine on the right wing.
The noise level was measured with microphones, sur-
face pressures were measured with strip-a-tube belts,and transition locations with hot films as a function of
engine aower and flight condition. A large database
was obttined during the course of the flight test exper-iment. ?'he results suggest that the noise levels on the
lower sarface have engine power dependence; how-
ever, the upper surface did not show engine powerdependence but did show Mach number dependence.
At the design point, laminar flow was observed to
28 perc_:nt chord on the upper surface of the glove and
to 18 pt:rcent chord on the lower surface. At the out-
board portion of the glove, transition occurred at about
5 percent chord where the pressure peaked (not
predicted by the transonic design code). The lower
surface was more sensitive to engine power and 2 to
3 percent less laminar flow was observed at the higher
power settings compared with lower power settings.
64

Concerningthecalibrationdatafor transitionpredic-tionscodes,TS-andCF-disturbanceN-factors showed
fairly good agreement with the Boeing 757 and F-111
flight database.
A.10. VFW 614
In 1986, the German laminar flow technology pro-
gram, supported by the German Ministry of Research
and Technology (BMP-'I'), began wind tunnel and
flight experiments NLF and LFC (Redeker et al.
1990). Korner (1990) noted that part of the program
involved determining (or discriminating) between
when NLF is preferred and when HLFC or LFC is a
more appropriate choice for a particular aircraft. Addi-
tionally, two of the major milestones of this programinvolved NLF wind tunnel tests and flight research on
the 40-seat VFW 614 research aircraft (owned by
DLR) during 1987 through 1990. The goal of theVFW 614 ATTAS NLF flight experiment was to gain
a database of TS-disturbance- and CF-disturbance-
dominated transition for code calibration. During the
flight test, a database was obtained for variations inMach numbers from 0.35 to 0.7, Reynolds numbers
from 12 x 106 to 30 x 106, and sweep angles from 18°
to 24 ° (obtained with sideslip). For a Mach number of0.35, the transition front ranged from 8 to 50 percent
chord dependent on flap and yaw settings (Horstmannet al. 1990). For TS-disturbance-dominated transition,
the transition front was at nearly the same chordwise
location across the span, whereas for CF-disturbance-dominated transition, a distinct sawtooth pattern arose
(reminiscent of CF transition). As yaw was increased,the laminar attachment line became intermittently tur-bulent which was consistent with the threshold
momentum Reynolds number of 100 on the attach-
ment line. Following the VFW 614 NLF flight test, a
Fokker 100 transport aircraft was fitted with a partial-
span NLF glove to measure the drag reduction associ-ated with a NLF wing design, validate laminar flow
CFD methodology, and to establish the upper limits of
NLF (transition Reynolds number for a given leading-
edge sweep angle). The flight test consisted of three
flights for a total of 12 hr. The observed results
validated the design predictions of 15-percent dragreduction; this confirmed high-speed wind tunnel
investigations conducted at the Dutch National
Aerospace Laboratory (Mecham 1992).
65

Appendix B
Supersonic Natural Laminar FlowResearch
In this section, a brief summary of supersonic
NLF research is given.
B.1. F-104 Starfighter Flight Test
Some of the first transition-related supersonic
flight tests were carried out at the NASA High-Speed
Flight Station in California. In 1959, McTigue,
Overton, and Petty (1959) reported on transition
detection techniques tested in supersonic flight by
using an F-104 Starfighter. A wing glove made of
fiberglass cloth and epoxy resin was positioned on the
wing of the fighter-type aircraft. Resistance thermom-
eters and subliming chemicals were used to detect thetransition location. Cameras were used to record
the sublimation process in flight. Approximately 40
instrumented flights were flown up to a Mach number
of 2.0 and an altitude of 55 000 ft. Photographs were
presented in the report giving a measure of transition
location (laminar flow extent) with various flight con-ditions. No detailed analysis of the transition location
and mean-flow attributes was performed.
B.2. F-106 and F-15
An F-106 at Langley Research Center and an F-15
at Dryden Flight Research Center had a 6-month win-
dow of availability in 1985 which could be used to
study supersonic boundary-layer transition (Collier
and Johnson 1987). The F-15 twin-engine fighter was
selected as a flight test vehicle because earlier flight
tests have shown that pressures on the 45 ° swept wingwould support small amounts of NLF. A surface
clean-up glove was installed on the right wing of the
F-15 to eliminate surface imperfections in the original
wing. ".'he glove was 4 ft wide, extended past 30 per-
cent chord, and a notch-bump (fig. 15) was added to
the inboard side of the leading edge of the test sectionto eliminate the potential for attachment-line contami-
nation problems. The flight tests were flown at Mach
numbers ranging from 0.7 to 1.8, altitudes of 20000 to
55 000 ft, unit Reynolds numbers per foot of 1.2 x 10⁶to 4 x 10⁶, and angles of attack of -1 ° to 10°. Com-
pressible stability calculations (using COSAL) for sta-
tionary crossflow disturbances at zero frequency werecorrelated with the flight-observed transition location.
Ignoring surface curvature, N-factors of 10.5 and 11
matched the transition point for the Mach numbers of
0.98 and 1.16, where the transition points were mea-
sured at 20 and 15 percent chord, respectively. For
transition occurring closer to the leading edge,N-factors of 5.5 and 6 were found for Mach numbers
of 0.9 and 1.76. Surface clean-up gloves were
mounted on both the right wing (leading-edge sweepof 60 ° ) and the vertical tail (sweep of 55 ° ) of the
F-106. Gaster-type bumps were installed on the
inboard portion of the gloves to prevent attachment-
line contamination. Flight tests were conducted at
Mach numbers ranging from 0.8 to 1.8, altitudes rang-ing from 30 000 to 50 000 ft, unit Reynolds numbers
per foot of 1.6 x 10⁶ to 5.2 × 10⁶, and angles of attackof 3° to 14° . Turbulent flow was observed at the first
hot-filrr gauge (0.5 percent chord) for all but four of
the flig_at test points. All the transition points were
observed within 5 percent chord of the leading edge.
Either the attachment-line contamination prevention
was not working properly or strong crossflow distur-
bances were generated by the large leading-edgesweep. Collier and Johnson (1987) showed theoreti-
cally that N-factor values could be significantlydecreasc'd by adding small quantities of suction in the
first 12 percent chord of the vertical tail for a simu-
lated F- 106 test point. With this small amount of suc-
tion, disturbances were stable to 20 percent chord; this
suggests, that HLFC would lead to significant runswith lantinar flow.
66

References
Anon. 1985:85-86 Aerospace Facts & Figures. Aerospace
Industries Assoc. of America, Inc., pp. 94--95.
Anon. 1995a: Aerospace Facts & Figures 1995-96. Aero-
space Industries Assoc. of America, Inc., pp. 92-93.
Anon. 1995b: Laminar-Flow Testing Begins on Airbus
A320. Flightlnt., Apr. 12-18, p.10.
Anderson, Bianca Trujillo; Meyer, Robert R., Jr.; and
Chiles, Harry R. 1988: Techniques Used in the F-14
Variable-Sweep Transition Flight Experiment. NASATM- 100444.
Anderson, Bianca Trujillo; and Meyer, Robert R., Jr. 1990:
Effects of Wing Sweep on Boundary-Layer Transition
for a Smooth F-14A Wing at Mach Numbers From O.700to 0.825. NASA TM-101712.
Anderson, Bianca T.; and Bohn-Meyer, Marta 1992: Over-
view of Supersonic Laminar Flow Control Research on
the F-16XL Ships 1 and 2. SAE Paper 921994.
Anscombe, A.; and Illingworth, L. N. 1956: Wind-Tunnel
Observations of Boundary-Layer Transition on a Wing
at Various Angles of Sweepback. R&M 2968, BritishA.R.C.
Anselmet, F.; M6rigaud, E.; and Fulachier, L. 1992: Effect
of Hole Suction on Boundary Layer Transition. First
European Forum on Laminar Flow Technology,
DGLR-Bericht 92-06, pp. 67-72.
Antonatos, P. P. 1966: Laminar Flow Control-----Concepts
and Applications. Astronaut. & Aeronaut., vol. 4, no. 7,
pp. 32-36.
Arcara, P. C., Jr.; Bartlett, D. W.; and McCullers, L. A.
1991: Analysis for the Application of Hybrid Laminar
Flow Control to a Long-Range Subsonic Transport Air-
craft. SAE Paper 912113.
Areal, D. 1984: Description and Prediction of Transition
in Two-Dimensional, Incompressible Flow. Special
Course on Stability and Transition of Laminar Flow,
AGARD Rep. 709.
Arnal, D.; Habiballah, M.; and Coustols, E. 1984: Laminar
Instability Theory and Transition Criteria in Two- andThree-Dimensional Flow. La Recherche Aerospatiale,
no. 2, pp. 45-63.
Arnal, D.; Casalis, G.; and Juillen, J. C. 1990: Experimental
and Theoretical Analysis of Natural Transition on 'Infi-
nite' Swept Wing. Laminar-Turbulent Transition,
Springer-Verlag, pp. 311-325.
Areal, D.; Juillen, J. C.; and Casalis, G. 1991: The Effectsof Wall Suction on Laminar-Turbulent Transition in
Three-Dimensional Flow. Boundary Layer Stability and
Transition to Turbulence, FED-VOL. l l4, ASME,
pp. 155-162.
Arnal, D.; Juillen, J.-C.; and Casalis, G. 1992: FundamentalStudies Related to Laminar-Turbulent Transition Prob-
lems on Swept Wings. First European Forum on Lami-nar Flow Technology, DGLR-Bericht 92-06, pp. 35-44.
Areal, D. 1992: Boundary Layer Transition: Prediction,
Application to Drag Reduction. Special Course on Skin
Friction Drag Reduction, AGARD Rep. 786. (Available
from DTIC as AD A253 005.)
Arnal, Daniel 1994: Boundary Layer Transition: Predictions
Based on Linear Theory. Special Course on Progress in
Transition Modelling, AGARD Rep. 793.
Atkins, P. B. 1951: Wing Leading Edge Contamination
by Insects. Flight Note 17, Aeronaut. Res. Lab.
(Melbourne).
Bacon, J.; Tucker, V.; and Pfenninger, W. 1959: Michigan
5- by 7-Foot Tunnel Experiments on a 30 ° Swept 12%
Thick Symmetric Laminar Suction Wing With Suction
Extended Forward to 1% Chord. Rep. NOR-59-328
(BLC-119), Northrop Aircraft, Inc.
Bacon, J. W., Jr.; Pfenninger, W.; and Moore, C. R. 1964:
Investigations of a 30 ° Swept and a 17-Foot Chord
Straight Suction Wing in the Presence of InternalSound, External Sound, and Mechanical Vibrations.
Summary of Laminar Boundary Layer ControlResearch, Volume I, ASD-TDR-63-554, U.S. Air
Force, pp. 120-154. (Available from DTIC as
AD 605 185.)
Balakumar, P.; and Hall, P. 1996: Optimum Suction Distri-bution for Transition Control. AIAA-96-1950.
Barry, Brian; Parke, Simon J.; Bown, Nicholas W.; Riedel,
Hansgeorg; and Sitzmann, Martin 1994: The Flight
Testing of Natural and Hybrid Laminar Flow Nacelles.94-GT-408, ASME.
Bayly, Bruce J.; Orszag, Steven A.; and Herbert, Thorwald
1988: Instability Mechanisms in Shear-Flow Transition.
Annual Review of Fluid Mechanics, Volume 20, Ann.
Rev., Inc., pp. 359-391.
Beckwith, Ivan E.; Chen, Fang-Jeng; and Malik, Mujeeb R.
1987: Design and Fabrication Requirements for Low
Noise Supersonic/Hypersonic Wind Tunnels. Researchin Natural Laminar Flow and Laminar-Flow Control,
Jerry N. Hefner and Frances E. Sabo, compilers, NASA
CP-2487, Part 3, pp. 947-964.
Beckwith, I. E.; Chen, F.-J.; and Malik, M. R. 1988:
Design and Fabrication Requirements for Low-Noise
Supersonic/Hypersonic Wind Tunnels. AIAA-88-0143.
67

Befus, Jack; Nelson, E. Randel; Ellis, David R.; and Latas,
Joe 1987: Flight Test Investigations of a Wing Designed
for Natural Laminar Flow. SAE Paper 871044.
Bergrun, Norman 1995: A Warming Trend for Icing
Research. Aerosp. America, vol. 33, no. 8, pp. 22-27.
Berry, Scott; Dagenhart, J. R.; Brooks, C. W.; and Harris,
C. D. 1987: Boundary-Layer Stability Analysis of LaRC
8-Foot LFC Experimental Data. Research in Natural
Laminar Flow and Laminar-Flow Control. Jerry N.
Hefner and Frances E. Sabo, compilers, NASA
CP-2487, Part 2, pp. 471-489.
Bertolotti, Fabio Paolo 1991: Linear and Nonlinear Stability
of Boundary Layers With Streamwise Varying Proper-ties. Ph.D. Thesis, Ohio State Univ.
Bertolotti, Fabio P.; and Crouch, Jeffrey D. 1992: Simula-
tion of Boundary-Layer Transition: Receptivity to Spike
Stage. NASA CR-191413.
Bhutiani, P. K.; Keck, D. F.; Lahti, D. J.; Stringas, M. J.1993: Investigating the Merits of a Hybrid Laminar
Flow Nacelle. The Leading Edge, General Electric Co.,
Spring, pp. 32-35.
Bicknell, Joseph 1939: Determination of the Profile Drag of
an Airplane Wing in Flight at High Reynolds Numbers.
NACA Rep. 667.
Birch, S. 1992: Laminar Flow. Aerosp. Eng., vol. 12, no. 3,
pp. 45-47.
Birch, S. 1996: Aerospatiale Looks to the Future. Aerosp.
Eng., vol. 16, no. 6, pp. 28-30.
Bobbitt, Percy J.; Harvey, William D.; Harris, Charles D.;
and Brooks, Cuyler W., Jr. 1992: The Langley 8-FtTransonic Pressure Tunnel Laminar-Flow-Control
Experiment. Natural Laminar Flow and Laminar Flow
Control, R. W. Barnweli and M. Y. Hussaini, eds.,
Springer-Verlag, pp. 247--411.
Bobbitt, Percy J.; Ferris, James C.; Harvey, William D.; and
Goradia, Suresh H. 1996: Hybrid Laminar Flow Control
Experiment Conducted in NASA Langley 8-Foot Tran-sonic Pressure Tunnel. NASA TP-3549.
Boltz, F. W.; Kenyon, G. C.; and Allen, C. Q. 1960: Effects
of Sweep Angle on the Boundary-Layer Stability Char-
acteristics of an Untapered Wing at Low Speeds. NASATN D-338.
Braslow, Albert L. 1944: Investigation of Effects of Various
Camouflage Paints and Painting Procedures on the
Drag Characteristics of an NACA 65(421)-420, a = 1.0Airfoil Section. NACA WR L-141. (Formerly NACACB L4G17.)
Braslow, Albert L.; and Visconti, Fioravante 1948: Investi-
gation of Boundary-Layer Reynolds Number for Transi-
tion on an NACA 65(215)-114 Airfoil in the LangleyTwoDimensional Low-Turbulence Pressure Tunnel.
NACA TN 1704.
Braslow, Albert L.; Visconti, Fioravante; and Burrows,
Dale L. 1948: Preliminary Wind-Tunnel Investigation
of the Effect of Area Suction on the Laminar
Boulutary Layer Over an NACA 64A010 Airfoil. NACARM L7L15.
Braslow, Albert L.; Burrows, Dale L.; Tetervin, Neal; and
Viscanti, Fioravante 1951: Experimental and Theoreti-
cal _tudies of Area Suction for the Control of the Lami-
nar Boundary Layer on an NACA 64A010 Airfoil.
NACA Rep. 1025. (Supersedes NACA TN 1905 byBurrows, Braslow, and Tetervin and NACA TN 2112
by Braslow and Visconti.)
Braslow, Albert L.; and Knox, Eugene C. 1958: Simplified
Method for Determination of Critical Height of Distrib-uted Roughness Particles for Boundary-Layer Transi-tion at Mach Numbers From 0 to 5. NACA TN 4363.
Braslow Albert L.; and Fischer, Michael C. 1985: DesignCon.,iderations for Application of Laminar Flow Con-
trol Systems to Transport Aircraft. Aircraft Drag Pre-
diction and Reduction, AGARD Rep. 723, pp. 4-1 --4-27.
Brasiow, A.L.; Maddalon, D. V.; Bartlett, D. W.; Wagner,
R. D.; and Collier, F. S., Jr. 1990: Applied Aspects ofLaminar-Flow Technology. Viscous Drag Reduction in
Boundary Layers, Dennis M. Bushnell and Jerry Hefner,
eds., AIAA, pp. 47-78.
Braslow Albert L.; and Maddalon, Dal V. 1993: FlightTest._ of Three-Dimensional Surface Roughness in the
High-Crossflow Region of a Swept Wing With Laminar-Flo_ Control. NASA TM- 109035.
Braslow, Albert L.; and Maddalon, Dal V. 1994: FlightTests of Surface Roughness Representative of Construc-
tion tCivets on a Swept Wing With Laminar-Flow Con-trol. NASA TM-109103.
Britton, tandall K. 1990: Elevator Deflections on the Icing
Process. AIAA Student J., vol. 27, pp. 8-18.
Brooks, Cuyler W., Jr.; and Harris, Charles D. 1987:
Results of LFC Experiment on Slotted Swept Supercriti-
cal Airfoil in Langley's 8-Foot Transonic Pressure Tun-nel. Research in Natural Laminar Flow and Laminar-
Flow Control, Jerry N. Hefner and Frances E. Sabo,
comi,ilers, NASA CP-2487, Part 2, pp. 453-469.
Bulgubure, C.; and Arnal, D. 1992: DASSAULT Falcon 50
Laminar Flow Flight Demonstrator. First European
Forum on Laminar Flow Technology, DGLR-Bericht
92-06, pp.11-18.
68
Bushnell,D.M.;andTuttle,M.H. 1979:Survey and Bibli-
ography on Attainment of Laminar Flow Control in Air
Using Pressure Gradient and Suction--Volume 1.NASA RP-1035.
Bushnell, D. M.; and Malik, M. R. 1987: Supersonic Lami-nar Flow Control. Research in Natural Laminar Flow
and Laminar-Flow Control, Jerry N. Hefner and
Frances E. Sabo, compilers, NASA CP-2487, Part 3,
pp. 923-946.
Buxbaum, J6rg; and H6hne, Gordon 1996: Flow Measure-
ments of Porous Titanium Suction Panels Designed forLaminar Flow Control. MS Thesis, Arizona State Univ.
Carlson, J. C. 1964: Low Drag Boundary Layer Suction
Experiments Using a 33 ° Swept 15 Percent Thick Lami-
nar Suction Wing With Suction Slots Normal to the
Leading Edge Aerodynamic Model and Test Report.
NOR-64-281, Northrop Corp. (Available From DTIC as
AD 482 068.)
Carmichael, B. H.; Whites, Roy C.; and Pfenninger, W.
1957: Low Drag Boundary Layer Suction Experiments
in Flight on the Wing Glove of an F-94A Airplane. Rep.No. NAI-57-1163 (BLC- 101), Northrop Aircraft Inc.
Carmichael, B. H. 1959: Surface Waviness Criteria for
Swept and Unswept Laminar Suction Wings. Rep.
No. NOR-59-438 (BLC-123) (Contract AF33
(616)-3168), Northrop Aircraft, Inc.
Carmichael, B. H.; and Pfenninger, W. 1959: Surface
Imperfection Experiments on a Swept Laminar Suction
Wing. Rep. No. NOR-59-454 (BLC-124), NorthropAircraft Inc.
Camaichael, B. H. 1979: Summary of Past Experience in
Natural Laminar Flow and Experimental Program for
Resilient Leading Edge. NASA CR- 152276.
Cattafesta, L. N., Ill; Iyer, V.; Masad, J. A.; King, R. A.;
and Dagenhart, J. R. 1994: Three-Dimensional
Boundary-Layer Transition on a Swept Wing atMach 3.5. AIAA-94-2375.
Cattafesta, L. N., III; Iyer, V.; Masad, J. A.; King, R. A.;
and Dagenhart, J. R. 1995: Three-Dimensional
Boundary-Layer Transition on a Swept Wing at
Mach 3.5. AIAA J., vol. 33, no. 11, pp. 2032-2037.
Cattafesta, L. N., III; and Moore, J. G. 1995: Uncertainty
Estimates for Luminescent Temperature-Sensitive
Paint Intensity Measurements. AIAA-95-2193.
Cattafesta, Louis N., III; and Moore, Jay G. 1996: Review
and Application of Non-Topographic Photogrammetry
to Quantitative Flow Visualization. AIAA-96-2180.
Cebeci, Tuncer; and Stewartson, Keith 1980: On Stabilityand Transition in Three-Dimensional Flows. AIAA J.,
vol. 18, no. 4, pp. 398405.
Choudhari, Meelan 1994: Roughness-Induced Generation
of Crossflow Vortices in Three-Dimensional Boundary
Layers. Theoret. Comput. Fluid Dyn., vol. 6, pp. 1-30.
Choudhari, Meelan; and Streett, Craig 1994: Theoret-
ical Prediction of Boundary-Layer Receptivity.AIAA-94-2223.
Chuprun, John; and Cahiil, Jones F. 1966: LFC on Large
Logistics Aircraft. Astronaut. & Aeronaut., vol. 4, no. 7,
pp. 58-62.
Clark, Rodney L.; Lange, Roy H.; and Wagner, Richard D.
1990: Application of Advanced Technologies to FutureMilitary Transports. Progress in Military Airlift,AGARD-CP-495.
Coleman, W. S. 1952: Wind Tunnel Experiments on the
Prevention of Insect Contamination by Means of Solu-
ble Films and Liquids Over the Surface. BLCC Note 39.
Coleman, W. S. 1961: Roughness Due to Insects. BoundaryLayer and Flow Control, Volume 2, G. V. Lachmann,
ed., Pergamon Press, pp. 682-747.
Coleman, Colin P.; Poll, D. I. A.; Laub, James A.;
and Wolf, Stephen W. D. 1996: Leading Edge
Transition on a 76 Degree Swept Cylinder at Mach 1.6.AIAA-96-2082.
Coleman, Colin P.; Poll, D. I. A.; and Lin, Ray-Sing 1997:
Experimental and Computational Investigation of Lead-
ing Edge Transition at Mach 1.6. AIAA-97-1776.
Collier, F. S., Jr.; and Johnson, J. B. 1987: Supersonic
Boundary-Layer Transition on the LaRC F-106 andDFRF F-15 Aircraft--Part I: Transition Measurements
and Stability Analysis. Research in Natural Laminar
Flow and Laminar-Flow Control, Jerry N. Hefner and
Frances E. Sabo, compilers, NASA CP-2487, Part 3,
pp. 997-1014.
Collier, F. S., Jr. 1993: An Overview of Recent Sub-
sonic Laminar Flow Control Flight Experiments.AIAA-93-2987.
Cornelius, Kenneth C. 1987: An Experimental Evaluation
of Slots Versus Porous Strips for Laminar-Flow Appli-cations. Research in Natural Laminar Flow and
Laminar-Flow Control, Jerry N. Hefner and Frances E.
Sabo, compilers, NASA CP-2487, Part 2, pp. 435-451.
Courty, J. C.; Bulgubure, C.; and Arnal, D 1993: Estudesd'ecoulements Laminaires Chez Dassault Aviation:
Calculs et Essais en Vol (Studies on Laminar Flow Con-
ducted at Dassault Aviation; Calculations and Test
69
Flights).Recent Advances in Long Range and Long
Endurance Operation of Aircraft, AGARD CP-547.
Cousteix, Jean 1992: Basic Concepts on Boundary Layers.Special Course on Skin Friction Drag Reduction.
AGARD Rep. 786. (Available from DTIC as
AD A253 005.)
Creel, T. R., Jr.; Malik, M. R.; and Beckwith, I. E. 1987:
Experimental and Theoretical Investigation of
Boundary-Layer Instability Mechanisms on a Swept
Leading Edge at Mach 3.5. Research in Natural l_xoni-
nar Flow and Laminar-Flow Control, Jerry N. Hefner
and Frances E. Sabo, compilers, NASA CP-2487,
Part 3, pp. 981-995.
Creel, T. R., Jr.; Beckwith, I. E.; and Chen, F. J. 1987: Tran-
sition on Swept Leading Edges at Mach 3.5. J. Aircr.,vol. 25, no. 10, pp. 710-717.
Di Giorgio, L. 1990: The High Speed Market in the Next
Three Decades. Proceedings of the European Sympo-
siu_ on Future Supersonic Hypersonic TransportationSyst,,ms, pp. 117-130.
Dryden, Hugh L. 1936: Air Flow in the Boundary Layer
Near a Plate. NACA Rep. 562.
Dunn, D. W.; and Lin, C. C. 1953: On the Role of Three-
Dimensional Disturbances in the Stability of Supersonic
Boundary Layers. J. Aeronat. Sci., vol. 20, pp. 577-578.
Edwards, Brian 1977: Laminar Flow Control--Concepts,
Experiences, Speculations. Special Course on Conceptsfor Drag Reduction. AGARD Rep. 654, pp. 4-1-4-41.
Etchberger, F. R.; et al. 1983: LFC Leading Edge Glove
Flig/zt--Aircraft Modification Design, Test Article
Development, and Systems Integration. NASACR-172136.
Croom, C. C.; and Holmes, B. J. 1985: Flight Evaluation of
an Insect Contamination Protection System for Laminar
Flow Wings. SAE Paper 850860.
Fage, A. 1943: The Smallest Size of a Spanwise Surface
Corrugation Which Affects Boundary-Layer Transitionon an Aerofoil. R. & M. No. 2120, British A.R.C.
Crouch, J. D. 1994: Theoretical Studies on the Receptivity
of Boundary Layers. AIAA-94-2224.
Cumming, R. W.; Gregory, N.; and Walker, W. S. 1953: An
Investigation of the Use of an Auxiliary Slot To
Re-Establish Laminar Flow on Low-Drag Aerofoils.R. & M. No. 2742, British A.R.C.
Cumpsty, N. A.; and Head, M. R.1969: The Calculation of
the Three-Dimensional Turbulent Boundary Layer--
Part III. Comparison of Attachment-Line Calculations
With Experiment. Aeronaut. Q., vol. XX, pp. 99-113.
Dagenhart, J. Ray 1981 : Amplified Crossflow Disturbances
in the Laminar Boundary Layer on Swept Wings WithSuction. NASA TP- 1902.
Davis, Richard E.; Fischer, Michael C.; Fisher, David F.;
and Young, Ronald 1986: Cloud Particle Effects on
Laminar Flow in the NASA LEFT Program: Prelimi-
nary Results. AIAA-86-9811.
Davis, Richard E.; Maddalon, Dal V.; and Wagner,Richard D. 1987: Performance of Laminar-Flow
Leading-Edge Test Articles in Cloud Encounters.Research in Natural Laminar Flow and Laminar-Flow
Control, Jerry N. Hefner and Frances E. Sabo, compil-
ers, NASA CP-2487, Part 1, pp. 163-193.
Davis, Richard E.; Maddalon, Dal V.; Wagner, Richard D.;
Fisher, David F.; and Young, Ronald 1989: Evaluation
of Cloud Detection Instruments and Performance of
Laminar-Flow Leading-Edge Test Articles DuringNASA Leading-Edge Flight-Test Program. NASATP-2888.
Faust, G. K.; and Mungur, P. 1987: Status Report on a Nat-ural Laminar-Flow Nacelle Flight Experiment--Nacelle
Design. Research in Natural Laminar Flow and
Laminar-Flow Control, Jerry N. Hefner and Frances E.
Sabo, compilers, NASA CP-2487, Part 3, pp. 891-907.
Fedorov, A. V.; and Khokhlov, A. P. 1993: Excitation and
Evolution of Unstable Disturbances in Supersonic
Boundary Layer. Transitional and Turbulent Compress-
ible _lows, FED-Voi. 151, ASME.
Fernand,'.z, Rene; Rylicki, Daniel S.; Maddalon, Dal V.;
DietJich, Donald; and McVey, Leslie 1996: Flight Tests
of A lti-Insect Coatings on a Simulated Hybrid Laminar
Flow Nacelle Surface. Paper presented at World
Aviation Congress and Exposition 1996 (Los Angeles,
California).
Fischer, M. C.; Wright, A. S., Jr.; and Wagner, R. D. 1983:
A Fl!ght Test of Laminar Flow Control Leading-Edge
Systems. NASA TM-85712.
Fischer, Michael; and Vemuru, Chandra S. 1991: Applica-
tion _f Laminar Flow Control to the High Speed Civil
Transport--The NASA Supersonic Laminar Flow Con-
trol Program. SAE Paper 912115.
Fisher, David F.; and Fischer, Michael C. 1987: Develop-
ment Flight Tests of JetStar LFC Leading-Edge Flight
Test Experiment. Research in Natural Laminar Flow
and Laminar-Flow Control, Jerry N. Hefner and
Fran_:es E. Sabo, compilers, NASA CP-2487, Part 1,
pp. 117-140.
Flores, Jolen; Tu, Eugene L.; Anderson, Bianca; and
Landers, Stephen 1991: A Parametric Study of the
7O

LeadingEdgeAttachmentLine for the F-16XL.AIAA-91-1621.
Fowell,L. R.;andAntonatos,P.P.1965:SomeResultsFromtheX-21AProgram--Part2:LaminarFlowFlightTestResultson theX-21A.Recent Developments in
Boundary Layer Research---Part IV, AGARDograph97.
Freeman, J. A. 1945: Studies in the Distribution of Insects
by Aerial Currents---The Insect Population of the AirFrom Ground Level to 300 Feet. J. Anita. Ecol., vol. 14,
pp. 128-154.
Gaster, M. 1965: A Simple Device for Preventing Turbulent
Contamination on Swept Leading Edges. J. R.
Aeronaut. Soc., vol. 69, no. 659, pp. 788-789.
Gaster, M. 1967: On the Flow Along Swept Leading Edges.
Aeronaut. Q., vol. XVIII, pt. 2, pp. 165-184.
Glick, P. A. 1939: The Distribution of Insects, Spiders, and
Mites in the Air. Tech. Bull. No. 673, U.S. Dep.
Agriculture.
Goethert, Bernhard 1966: Toward Long-Range Aircraft
With Laminar Flow Control. Astronaut. & Aeronaut.,
vol. 4, no. 7, pp. 56-57.
Goldsmith, John 1955: Critical Suction Quantities and
Pumping Losses Associated With Laminar BoundaryLayer Suction Through Rows of Closely-Spaced Holes.
Rep. NAI-55-287 (BLC-72), Northrop Aircraft, Inc.(Available from DTIC as AD 74 865(b).)
Goldsmith, John 1957: Critical Laminar Suction Parame-
ters for Suction Into an Isolated Hole or a Single Row of
Holes. Rep. No. NAI-57-529 (BLC-95), NorthropAircraft, Inc.
Goldsmith, John 1964: Investigation of Laminar Flow Con-
trol Airfoils Swept Behind the Mach Angle. Summary of
Laminar Boundary Layer Control Research, Volume I,
ASD-TDR-63-554, U.S. Air Force, pp. 487-547.
(Available from DTIC as AD 605 185.)
Goldstein, M. E. 1983: The Evolution of Tollmien-
Schlichting Waves Near a Leading Edge. J. Fluid
Mech., vol. 127, pp. 59-81.
Goldstein, M. E. 1985: Scattering of Acoustic Waves Into
Tollmien-Schlichting Waves by Small Streamwise
Variations in Surface Geometry. J. Fluid Mech.,
vol. 154, pp. 509-529.
Goldstein, M. E.; Leib, S. J.; and Cowley, S. J. 1987: Gen-
eration of Tollmien-Schlichting Waves on Interactive
Marginally Separated Flows. J. Fluid Mech., vol. 181,
pp. 485-517.
Gottschalk, Mark A. 1996: Going With the Flow. Design
News, Sept. 9, pp. 23-24.
Granville, Paul S. 1953: The Calculation of the Viscous
Drag of Bodies of Revolution. Rep. 849, David W.
Taylor Model Basin.
Gray, W. E.; and Davies, H. 1952: Note on the Maintenance
of Laminar-Flow Wings. R. & M. No. 2485, BritishA.R.C.
Gray, W. E. 1952: The Effect of Wing Sweep on LaminarFlow. Tech. Memo. No. Aero 255, British R.A.E.
Gray, W. E.; and Fullam, P. W. J. 1950: Comparison
of Flight and Tunnel Measurements of Transition
on a Highly Finished Wing (King Cobra).
Rep. No. Aero 2383, British R.A.E.
Greber, Isaac 1959: Interaction of Oblique Shock Waves
With Laminar Boundary Layers. Tech. Rep. 59-2, MIT.
Gregory, N.; Stuart, J. T.; and Walker, W. S. 1955: On the
Stability of Three-Dimensional Boundary Layers With
Application to the Flow Due to a Rotating Disk. Philos.Trans. R. Soc. London, ser. A, voi. 248, no. 943,
pp. 155-199.
Gregory, N. 1961: Research on Suction Surfaces for
Laminar Flow. Boundary Layer and Flow Control,
Volume 2, G. V. Lachmann, ed., Pergamon Press,
pp. 924-960.
Gregory, N.; and Love, E. M. 1965: Laminar Flow on a
Swept Leading Edge: Final Progress Report. NPLAERO. Memo. No. 26, British A.R.C.
Gross, L. W.; Bacon, J. W., Jr.; and Tucker, V. L. 1964:
Experimental Investigation and Theoretical Analysis of
Laminar Boundary Layer Suction on a 30 ° Swept,
12-Percent-Thick Wing in the NASA Ames 12-Foot
Pressure Wind Tunnel. Summary of Laminar Boundary
Layer Control Research, Volume I, ASD-TDR-63-554,
U.S. Air Force, pp. 96-110. (Available from DTIC as
AD 605 185.)
Gross, L. W. 1964: Experimental Investigation of a
4-Percent-Thick Straight Laminar Suction Wing of
17-Foot Chord in the NORAIR 7- by 10-Foot Wind
Tunnel. Summary of Laminar Boundary Layer ControlResearch, Volume I, ASD-TDR-63-554, U.S. Air
Force, pp. 111-119. (Available from DTIC as
AD 605 185.)
Gross, L. W. 1964: Laminarization of a Sears-Haack Body
of Revolution by Means of Boundary Layer Suction.Summary of Laminar Boundary Layer Control
Research, Volume I, ASD-TDR-63-554, U.S. Air
Force, pp. 155-165. (Available from DTIC as
AD 605 185.)
71

Groth,E. E.; Carmichael,B. H.; Whites,RoyC.; andPfenninger,W. 1957:Low Drag Boundary Layer
Suction Experiments in Flight on the Wing Glove of a
F94-A Airplane--Phase II: Suction Through 69 Slots.NAI-57-318 (BLC-94) (Contract AF-33(616-3108)),
Northrop Aircraft, Inc.
Groth, E. E. 1961: Boundary Layer Suction Experiments at
Supersonic Speeds. Boundary Layer and Flow Control.
Volume 2, G. V. Lachmann, ed., Pergamon Press,
pp. 1049-1076.
Groth, E. E. 1964a: Investigation of a Laminar Flat Plate
With Suction Through Many Fine Slots With and With-
out Weak Incident Shock Waves. Summary of Laminar
Boundary Layer Control Research. Volume I,
ASD-TDR-63-554, U.S. Air Force, pp. 428--441.
(Available from DTIC as AD 605 185.)
Groth, E. E. 1964b: Low Drag Boundary Layer Suction
Experiments at Supersonic Speeds on an Ogive Cylin-
der With 29 Closely Spaced Slots. Summary of LaminarBoundary Layer Control Research. Volume I,
ASD-TDR-63-554, U.S. Air Force, pp. 449-463.(Available from DTIC as AD 605 185.)
Groth, E. E. 1964c: Investigations of Swept Wings With
Supersonic Leading Edges. Summary of LaminarBoundary Layer Control Research. Volume I,
ASD-TDR-63-554, U.S. Air Force, pp. 464-479.(Available from DTIC as AD 605 185.)
Groth, E. E.; Pate, S. R.; and Nenni, J. P. 1965: Laminar
Flow Control at Supersonic Speeds. Recent Develop-ments in Boundary Layer Research--Part IV,
AGARDograph 97.
Hackenberg P.; Tutty, O. R.: and Nelson, P. A. 1994:Numerical Studies of the Automatic Control of
Boundary-Layer Transition via Multiple Suction Panels.AIAA-94-2214.
Hall, A. A.; and Hislop, G. S. 1938: Experiments on the
Transition of the Laminar Boundary Layer on a FlatPlate. R. & M. No. 1843, British A.R.C.
Hall, G. R. 1964: On the Mechanics of Transition Produced
by Particles Passing Through an Initially Laminar
Boundary Layer and the Estimated Effect on the LFC
Performance of the X-21 Aircraft. Northrop Corp.
Hall, P. 1983: The Linear Development of GOrtler Vortices
in Growing Boundary Layers. J. Fluid Mech., vol. 130,pp. 41-58.
Hall, P.; Malik, M. R.; and Poll, D. I. A. 1984: On the
Stability of an Infinite Swept Attachment Line Bound-
ary Layer. Proc. R. Soc. London, ser. A, vol. 395,
pp. 220-245.
Hardy, A. C.; and Milne, P. S. 1938: Studies in the Distribu-
tion of Insects by Aerial Currents--Experiments in
Aerial Tow-Netting From Kites. J. Anita. Ecol., vol. 7,
no. 2, pp. 199-229.
Harris, lulius E.; Iyer, Venkit; and Radwan, Samit 1987:
Numerical Solutions of the Compressible 3-D
Boundary-Layer Equations for Aerospace Configura-
tions With Emphasis on LFC. Research in Natural Lam-
inar Flow and Laminar-Flow Control, Jerry N. Hefner
and Frances E. Sabo, compilers, NASA CP-2487,Part 2, pp. 517-545.
Harris, Roy V., Jr.; and Hefner, Jerry N. 1987: NASALaminar-How Program--Past, Present, Future.Research in Natural Laminar Flow and Laminar-Flow
Control, Jerry N. Hefner and Frances E. Sabo, compil-
ers, NASA CP-2487, Part 1, pp. 1-23.
Harvey, W. D.; and Pride, J. D. 1981: NASA Langley Lam-
inar Flow Control Airfoil Experiment. Laminar Flow
Control--1991 Research and Technology Studies,
Dal V. Maddalon, ed., NASA CP-2218, pp. 1-42.
Hastings, E. C.; Schoenster, J. A.; Obara, C. J.; and
Dodbele, S. S. 1986: Flight Research on Natural Lami-
nar Flow Nacelles: A Progress Report. AIAA-86-1629.
Hastings, Earl C., Jr. 1987: Status Report on a Natural Lam-
inar Flow Flight Experiment-- Summary. Research inNatural Laminar Flow and Laminar-Flow Control,
Jerry N. Hefner and Frances E. Sabo, compilers, NASACP-2487, Part 3, pp. 887-890.
Haynes, T. S.; and Reed, H. L. 1996: Computations in Non-
linear Saturation of Stationary Crossflow Vortices in a
Swept-Wing Boundary Layer. AIAA-96-0182.
Head, M. R. 1955: The Boundary Layer With Distributed
Suct!on. R. & M. No. 2783, British A.R.C. (Availablefrorr DTIC as AD B029 704.)
Head, M. R.; Johnson, D.; and Coxon, M. 1955: Flight
Experiments on Boundary-Layer Control for Low Drag.R. & M. No. 3025, British A.R.C.
Hefner, Ierry N.; and Bushnell, Dennis M. 1980: Status of
Linear Boundary-Layer Stability Theory and the en
Metl;od, With Emphasis on Swept-Wing Applications.NA5 A TP- 1645.
Hefner, lerry N. 1992: Laminar Flow Control: Introductionand Overview. Natural Laminar Flow and Laminar
Flow Control, R. W. Barnwell and M. Y. Hussaini, eds.,
Springer-Verlag, pp. 1-22.
Helmhoitz, H. 1868: Uber discontinuirliche Fltissigkeits-
Bewegungen. Akad. Wiss., Monatsber 215.
72
Herbert,Thorwald1988:SecondaryInstabilityofBoundaryLayers.Annual Review of Fluid Mechanics, Volume 20,
Ann. Rev., Inc., pp. 487-526.
Herbert, Th. 1991: Boundary-Layer Transition--Analysisand Prediction Revisited. AIAA-91-0737.
Hilton, W. F. 1955: Tests of a Fairing To Reduce the Drag
of a Supersonic Swept-Wing Root. J. Aeronaut. Sci.,
vol. 22, no. 3, pp. 173-178, 188.
Holmes, Bruce J.; Obara, Clifford J.; Gregorek, Gerald M.;
Hoffman, Michael J.; and Freuler, Rick J. 1983: Flight
Investigation of Natural Laminar Flow on the Bellanca
Skyrocket II. SAE Paper 830717.
Holmes, Bruce J., Obara, Clifford J.; and Yip, Long P.
1984: Natural Laminar Flow Experiments on Modern
Airplane Surfaces. NASA TP-2256.
Holmes, Bruce J.; Obara, Clifford J.; Martin, Glenn L.; and
Domack, Christopher S. 1985: Manufacturing Toler-ances for Natural Laminar Flow Airframe Surfaces.
SAE Paper 850863.
Holmes, Bruce J.; and Obara, Clifford J. 1992: Flight
Research on Natural Laminar Flow Applications. Natu-ral Laminar Flow and Laminar Flow Control, R. W.
Barnwell and M. Y. Hussaini, eds., Springer-Verlag,
pp. 73-142.
Horstmann, K. H.; Redeker, G.; Quast, A.; Dressier, U.; and
Bieler, H. 1990: Flight Tests With a Natural LaminarFlow Glove on a Transport Aircraft. AIAA-90-3044.
Howard, R. M.; Miley, S. J.; and Holmes, B. J. 1985:
An Investigation of the Effects of the Propeller Slip-
stream on the Laminar Wing Boundary Layer. SAE
Paper 850859.
Humphreys, B. E. 1992: Surface Contamination Avoidancefor Laminar Flow Surfaces. First European Forum on
Laminar Flow Technology, DGLR-Bericht 92-06,
pp. 262-269.
Iyer, Venkit 1990: Computation of Three-Dimensional
Compressible Boundary Layers to Fourth-Order Accu-
racy on Wings and Fuselages. NASA CR-4269.
Iyer, Venkit; and Spall, Robert 1991: Application of LinearStability Theory in Laminar Flow Design. SAE
Paper 912116.
Iyer, V.; Spall, R.; and Dagenhart, J. 1992: Computational
Study of Transition Front on a Swept Wing Leading-
Edge Model. AIAA-92-2630.
Iyer, Venkit 1993: Three-Dimensional Boundary-Layer
Program (BL3D) for Swept Subsonic or Supersonic
Wings With Application to Laminar Flow Control.NASA CR-4531.
Iyer, Venkit 1995: Computer Program BL2D for Solving
Two-Dimensional and Axisymmetric Boundary Layers.NASA CR-4668.
Johnson, Paul L. 1996: Effects of Suction on Crossfiow
Disturbance Growth--NASA/BCAG Crossflow Experi-
ment Results. Paper presented at World Aviation Con-
gress and Exposition 1996 (Los Angeles, California).
Jones, B. Melvill 1938: Flight Experiments on the Bound-
ary Layer. J. Aeronaut. Sci., vol. 5, no. 3, pp. 81-101.
Jones, J. H.; and Pate, S. R. 1961: Investigation of
Boundary-Layer Suction on a Flat Plate at MachNumber 3. AEDC-TN-61 - 128, U.S. Air Force.
Joslin, Ronald D.; Streett, Craig L.; and Chang, Chau-Lyan
1992: Validation of Three-Dimensional Incompressible
Spatial Direct Numerical Simulation Code--A Compar-ison With Linear Stability and Parabolic Stability Equa-
tion Theories for Boundary-Layer Transition on a FlatPlate. NASA TP-3205.
Joslin, R. D.; Street, C. L.; and Chang, C.-L. 1993: Spatial
Direct Numerical Simulation of Boundary-Layer Tran-
sition Mechanisms: Validation of PSE Theory. Theoret.
Comput. Fluid Dyn., vol. 4, pp. 271-288.
Joslin, R. D.; and Streett, C. L. 1994. The Role of Stationary
Crossflow Vortices in Boundary-Layer Transition
on Swept Wings. Phys. Fluids, vol. 6, no. 10,
pp. 3442-3453.
Joslin, Ronald D. 1995: Direct Simulation of Evolutionand Control of Three-Dimensional Instabilities in
Attachment-Line Boundary Layers. J. Fluid Mech.,
vol. 291, pp. 369-392.
Joslin, Ronald D. 1996: Simulation of Nonlinear Instabili-
ties in an Attachment-Line Boundary Layer. Fluid Dyn.
Res., vol. 18, pp. 81-97.
Kachanov, Y. S.; and Tararykin, O. I. 1990: The Experi-
mental Investigation of Stability and Receptivity of a
Swept-Wing Flow. Laminar-Turbulent Transition,D. Arnal and R. Michel, eds., Springer-Verlag,
pp. 499-509.
Kachanov, Yury S. 1994: Physical Mechanisms of
Laminar-Boundary-Layer Transition. Annual Review
of Fluid Mechanics, Volume 26, Ann. Rev., Inc.,
pp. 411-482.
Kay, J. M. 1953: Boundary-Layer Flow Along a Flat Plate
With Uniform Suction. R. & M. 2628, British A.R.C.
Kelvin, Lord 1880: On Disturbance in Lord Rayleigh'sSolution for Waves in a Plane Vortex Stratum. Mathe-
matical and Physical Papers, Volume 4, pp. 186-187.
73

Kerschen,E. J. 1987: Boundary-Layer Receptivity and
Laminar-Flow Airfoil Design. Research in Natural
Laminar Flow and Laminar-Flow Control, Jerry N.
Hefner and Frances E. Sabo, compilers, NASA
CP-2487, Part 1, pp. 273-287.
Kerschen, E. 1989: Boundary Layer Receptivity.AIAA-89-1109.
Kirchner, M. E. 1987: Laminar Flow: Challenge and Poten-tial. Research in Natural Laminar Flow and Laminar-
Flow Control, Jerry N. Hefner and Frances E. Sabo,
compilers, NASA CP-2487, Part 1, pp. 25-44.
Kleiser, Leonhard; and Zang, Thomas A. 1991: NumericalSimulation of Transition in Wall-Bounded Shear Flows.
Annual Review of Fluid Mechanics, Volume 23, Ann.
Rev., Inc., pp. 495-537.
Kopkin, T. J.; and Rife, C. D. 1977: laminar Flow Control
Bibliography. Rep. No. LG 77ER0018, Lockheed-Georgia Co. (Available from DTIC as AD B026 321L.)
Kosin, R. E. 1967: LFC Aircraft Design Data Laminar
Flow Control Demonstration Program. NOR-67-136,Northrop Aircraft, Inc.
KOrner, H. 1990: Natural Laminar Flow Research for
Subsonic Transport Aircraft in the FRG. Z. Flugwiss.
Weltraumforsch., vol. 14, pp. 223-232.
Lachmann, G. V. 1961: Aspects of Design, Engineering and
Operational Economy of Low Drag Aircraft. BoundaryLayer and Flow Control, Volume 2, G. V. Lachmann,
ed., Pergamon Press, pp. 1123-1166.
Lange, Roy H. 1984: Design Integration of Laminar FlowControl for Transport Aircraft. J. Aircr., vol. 21,
pp. 612-617.
Lange, Roy H. 1987: Lockheed Laminar-Flow Control
Systems Development and Applications. Research inNatural Laminar Flow and Laminar-Flow Control.
Jerry N. Hefner and Frances E. Sabo, compilers, NASA
CP-2487, Part 1, pp. 53-77.
Ledy, J. P.; Charpin, F.; and Garcon, F. 1993: ELFIN
(European Laminar Flow Investigation) Test in SIMA
Wind Tunnel. 1992 Scientific and Technical Activities,
ONERA, pp. 60-451.
Leehey, P.; and Shapiro, P. J. 1980: Leading Edge Effect
in Laminar Boundary Layer Excitation by Sound.
Laminar-Turbulent Transition, R. Eppler and H. Fasel,
eds., Springer-Verlag, pp. 321-331.
Liepmann, Hans W. 1943: Investigations on Laminar
Boundary-Layer Stability and Transition on Curved
Boundaries. NACA WR W-107. (Formerly NACAACR 3H30.)
Lin, R.-L; Edwards, J. R.; Wang, W.-P.; and Malik, M. R.
199b: Instabilities of a Mach 2.4 Slow-ExpansionSqm:ie Nozzle Flow. AIAA-96-0784.
Lin, R.-_;.; and Malik, M. R. 1994: The Stability of Incom-
pressible Attachment-Line Boundary Layers--A
2D-Eigenvalue Approach. AIAA-94-2372.
Lin, R.-S.; and Maiik, M. R. 1995: Stability and Transition
in Compressible Attachment-Line Boundary-LayerFlow. SAE Paper 952041.
Lin, Ra).-Sing; and Malik, Mujeeb R. 1996: On the Stability
of Attachment-Line Boundary Layers. Part 1--The
Incompressible Swept Hiemenz Flow. J. Fluid Mech.,vol. $11, pp. 239-255.
Lynch, Frank K.; and Klinge, Mark D. 1991: Some Practi-
cal Aspects of Viscous Drag Reduction Concepts. SAE
Paper 912129.
Mack, L. M. 1989: Stability of Three-Dimensional Bound-
ary I,ayers on Swept Wings at Transonic Speeds. Sym-
posium Transsonicum III, J. Zierep and H. Oertel, eds.,Springer-Verlag, pp. 209-224.
MacManus, D.; and Eaton, J. 1996: Micro-Scale Three-
Dimensional Navier-Stokes Investigation Laminar Flow
Control Suction Hole Configurations. AIAA-96-0544.
MacManus, David G.; Eaton, John A.; Barrett, Rod V.;
Rickards, Jeremy; and Swales, Chris 1996: Mapping the
Flow Field Induced by a HLFC Perforation Using aHigh Resolution LDV. AIAA-96-0097.
Maddalon, D. V., Collier, F. S., Jr.; Montoya, L. C.; and
Land, C. K. 1989: Transition Flight Experiments on aSwept Wing With Suction. AIAA-89-1893.
Maddalon, Dal V.; and Braslow, Albert L. 1990: Simulated-
Airline-Service Flight Tests of Laminar-Flow Control
With Perforated-Surface Suction System. NASATP-2 )66.
Maddaioa, Dal V. 1990: Boeing 757 Hybrid Laminar-Flow
ConU'ol Flight Tests. Langley Aerospace Test High-
light._, NASA TM-104090, p. 159.
Maddatoa, Dal V. 1991: Hybrid Laminar-Flow Control
Fligh_ Research. Research and Technology, NASATM-_.331, p. 47.
Malik,/V(ujeeb R. 1982: COSAL---A Black-Box Compress-
ible Stability Analysis Code for Transition Prediction
in T_ree-Dimensional Boundary Layers. NASACR- 165925.
Malik, Mujeeb R. 1987: Stability Theory Applications toLaminar-Flow Control. Research in Natural Laminar
Flow and Laminar-Flow Control, Jerry N. Hefner and
74
FrancesE.Sabo,compilers,NASACP-2487,Part1,pp.219-244.
Manuel,GregoryS.;andDoty,WayneA. 1990:A FlightTest Investigationof CertificationRequirementsfor Laminar-FlowGeneralAviation Airplanes.AIAA-90-1310.
Maresh,J.L.;andBragg,M.B. 1984:TheRoleofAirfoilGeometryinMinimizingtheEffectof InsectContami-nationofLaminarFlowSections.AIAA-84-2170.
Masad,J. 1996a:TheCriticalAllowableHeightof aBackward-FacingStep.AIAA-96-0780.
Masad,JamalA. 1996b:Effect of Surface Waviness on
Transition in Three-Dimensional Boundary-LayerFlow. NASA CR-201641.
McGhee, Robert J.; Viken, Jeffrey K.; Pfenninger, Werner;
Beasley, William D.; and Harvey, William D. 1984:
Experimental Results for a Flapped Natural-Laminar-
Flow Airfoil With High Lift/Drag Ratio. NASATM-85788.
McNay, Dave; and Allen, John 1981: Laminar Flow Con-
trol Leading Edge Glove Flight Test Article Develop-ment. ACEE-21-PM-1632 (Contract NAS1-16220),
McDonnell Douglas Corp.
McTigue, John G.; Overton, John D.; and Petty, Gilbert, Jr.
1959: Two Techniques for Detecting Boundary-Layer
Transition in Flight at Supersonic Speeds and at Alti-tudes Above 20,000 Feet. NASA TN D-18.
Mecham, Michael 1992: Europeans Test New Laminar
Flow Design, Target Lower Transport Operating Costs.
Aviat. Week & Space Tech., Feb. 3, p. 51.
Meifarth, K. U.; and Heinrich, S. 1992: The Environment
for Aircraft With Laminar Flow Technology WithinAirline Service. First European Forum on Laminar
Flow Technology, DGLR-Bericht 92-06, pp. 251-255.
Meitz, Hubert L.; and Fasel, Hermann F. 1994: Navier-Stokes Simulations of the Effects of Suction Holes on a
Fiat Plate Boundary Layer. Application of Direct and
Large Eddy Simulation to Transition and Turbulence,AGARD-CP-551.
Meyer, Robert R.; Trujillo, Bianca M.; and Bartlett,Dennis W. 1987:F-14 VSTFE and Results of the
Cleanup Flight Test Program. Research in Natural Lam-inar Flow and Laminar-Flow Control, Jerry N. Hefner
and Frances E. Sabo, compilers, NASA CP-2487,
Part 3, pp. 819-844.
Morkovin, Mark V. 1969: On the Many Faces of Transition.
Viscous Drag Reduction, C. Sinclair Wells, ed., Plenum
Press, pp. 1-31.
Morris, John 1987: LFC--A Maturing Concept. Researchin Natural Laminar Flow and Laminar-Flow Control,
Jerry N. Hefner and Frances E. Sabo, compilers, NASACP-2487, Part 1, pp. 45-51.
Morrisette, E. L.; and Creel, T. R., Jr. 1987: The Effects of
Wall Surface Defects on Boundary-Layer Transition in
Quiet and Noisy Supersonic Flow. Research in Natural
Laminar Flow and Laminar-Flow Control, Jerry N.
Hefner and Frances E. Sabo, compilers, NASA
CP-2487, Part 3, pp. 965-980.
Muilender, A. J.; Bergin, A. L.; and Poll, D. I. A. 1991:
Application of Laminar Flow to Aero Engine Nacelles.
Boundary Layer Transition & Control. Rep.No. PNR-90916, ETN-92-92205, British R.A.E.
Murri, Daniel G.; and Jordon, Frank L., Jr. 1987: Wind-
Tunnel Investigation of a Full-Scale General Aviation
Airplane Equipped With an Advanced Natural Laminar
Flow Wing. NASA TP-2772.
Nayfeh, A. 1980: Stability of Three-Dimensional Boundary
Layers. AIAA J., vol. 18, pp. 406-416.
Nayfeh, Ali H. 1987: Nonparallel Stability of Boundary
Layers. Research in Natural Laminar Flow and
Laminar-Flow Control, Jerry N. Hefner and Frances E.
Sabo, compilers, NASA CP-2487, Part l, pp. 245-259.
Nayfeh, Ali H.; Ragab, Saad A.; and A1-Maaitah, Ayman1987: Effect of Roughness on the Stability of Boundary
Layers. Research in Natural Laminar Flow and
Laminar-Flow Control, Jerry N. Hefner and Frances E.
Sabo, compilers, NASA CP-2487, Part l, pp. 301-315.
Nayfeh, Ali H.; Ragab, Saad A.; and AI-Maaitah, Ayman A.
1988: Effect of Bulges on the Stability of Boundary
Layers. Phys. Fluids, vol. 31, no. 4, pp. 796-806.
Nelson, P. A.; and Rioual, J.-L. 1994: An Algorithm for the
Automatic Control of Boundary Layer Flow. ISVR
Tech. Rep. No. 233, Univ. of Southhampton.
Nenni, Joseph P.; and Gluyas, George L. 1996: Aerody-
namic Design and Analysis of an LFC Surface.
Astronaut. & Aeronaut., vol. 4, no. 7, pp. 52-57.
Norris, Guy 1994: Smooth and Supersonic. Flight Int.,
vol. 145, no. 4421, pp. 32-33.
Obara, Clifford J.; and Dodbele, S. S. 1987: Status Report
on a Natural Laminar-Flow Nacelle Flight
Experiment--Nacelle Aerodynamic Performance.Research in Natural Laminar Flow and Laminar-Flow
Control, Jerry N. Hefner and Frances E. Sabo, compil-ers, NASA CP-2487, Part 3, pp. 908-913.
Orr, William M'Fadden 1907: The Stability or Instability of
the Steady Motions of a Liquid. Part II: A Viscous
75
Liquid. Proc. R. Irish Acad., vol. XXVII, section A,
no. 3, pp. 69-138.
Oudart, Adalbert 1949: Le Calcul de la Couche Limite
Laminaire ou Turbulente en Fiuide Compressible: Les
Methodes Semi-Empiriques Modernes et Les Travaux
du Dr. Ing. Alfred Walz (The Calculation of the Lami-
nar or Turbulent Boundary in a Compressible Fluid: The
Modern Semi-Empirical Methods and Work of
Dr. Alfred Walz). Publ. Sci. & Tech. No. 223, Minist6rede I'Air (Paris).
Parikh, P. G.; Chen, A. W.; Yu, N. J.; Wyatt, G. H.; and
Timar, T. 1990: Application of Boundary Layer Control
to HSCT Low Speed Configuration. AIAA- 90-3199.
Parikh, P. G.; and Nagel, A. L. 1990: Application of Lami-
nar Flow Control to Supersonic Transport Configura-tions. NASA CR-181917.
Pate, S. R. 1964: Investigation of Drag Reduction by
Boundary-Layer Suction on a 50-Deg Swept Tapered
Wing at M_ = 2.5 to 4. AEDC-TDR-64-221, U.S. Air
Force. (Available from DTIC as AD 450 195.)
Pate, S. R. 1965: Investigation of Drag Reduction by
Boundary-Layer Suction on a Body of Revolution atMach Numbers 2.5, 3, and 3.5. AEDC-TR-65-36, U.S.
Air Force. (Available from DTIC as AD 456 988.)
Pate, S. R.; and Deitering, J. S. 1963: Investigation of Drag
Reduction by Boundary-Layer Suction on a 36-Deg
Swept Wing at M_ = 2.5 to 4. AEDC-TDR-63-23, U.S.Air Force.
Pearce, W. E. 1981: Progress at Douglas on Laminar Flow
Control Applied to Commercial Transport Aircraft.
Laminar Flow Control. ACEE-23-PM-1630 (Contract
NAS 1-16234), McDonnell Douglas Corp.
Pearce, W. E. 1982: Progress at Douglas on Laminar Flow
Control Applied to Commercial Transport Aircraft.
ICAS Proceedings, 1982: 13th Congress of the Interna-
tional Council of the Aeronautical Sciences, AIAA Air-
craft Systems and Technology Conference, B. Laschkaand R. Staufenbiel, eds.
Pearce, W. E.; McNay, D. E.; and Thelander, J. A. 1984:
Laminar Flow Control Leading Edge Glove Flight Test
Article Development. NASA CR-172137.
Perkins, Porter J.; and Rieke, William J.: Aircraft Icing
Problems--After 50 years. AIAA-93-0392.
Peterrnan, B. E. 1987: Laminar Flow--The Cessna Perspec-tive. Research in Natural Laminar Flow and Laminar-
Flow Control, Jerry N. Hefner and Frances E. Sabo,
compilers, NASA CP-2487, Part 1, pp. 79-88.
Peterson, John B., Jr.; and Fisher, David F. 1978: Flight
Investigation of Insect Contamination and Its Allevia-
tion CTOL Transport Technology--1978, NASA
CP-2036, Part I, pp. 357-373.
Pfenninger, W.; Groth, E. E.; Carmichael, B. H.; and
Whites, R. C. 1955: Low Drag Boundary Layer Suction
Experiments in Flight on the Wing Glove of a F94-A
Airplane. Phase l--Suction Through Twelve Slots. Rep.
No. NAI-55-458 (BLC-77), Northrop Aircraft, Inc.(Available from DTIC as AD 79 342(b).)
Pfenninger, Werner 1952: Experiments With a 15% Thick
Slotted Laminar Suction Wing Model in the Low Turbu-
lence Tunnel (TDT) at the NACA, Langley Field,
Virginia. TR-5982, Northrop Aircraft, Inc.
Pfenninger, W.; Gross, Lloyd; and Bacon, John W., Jr.
(appendix I by G. S. Raetz) 1957: Experiments on a30 ° Swept 12%-Thick Symmetrical Laminar Suction
Wing in the 5-Ft by 7-Ft Michigan Tunnel. Rep.
No. NAI-57-317 (BLC-93), Northrop Aircraft, Inc.
Pfenninger, W.; and Groth, E. 1961: Low Drag Boundary
Layer Suction Experiments in Flight on a Wing Glove
of an F-94A Airplane With Suction Through a Large
Number of Fine Slots. Boundary Layer and Flow Con-
trol Volume 2, G. V. Lachmann, ed., Pergamon Press,
pp. 981-999.
Pfenninger, W. 1965: Some Results From the X-21A
Program--Part 1: Flow Phenomena at the Leading Edge
of Swept Wings. Recent Developments in Boundary
Layer Research--Part IV, AGARDograph 97.
Pfenninger, Werner; and Reed, Verlin D. 1966: Laminar-
Flow Research and Experiments. Astronaut. &
Aeronaut., vol. 4, no. 7, pp. 44-50.
Pfenninger, W.; and Bacon, J. W., Jr. 1969: Amplified Lam-
inar Boundary Layer Oscillations and Transition at the
Frollt Attachment Line of a 45 ° Swept Flat-Nosed Wing
With and Without Boundary Layer Suction. Viscous
Drag Reduction, C. Sinclair Wells, ed., Plenum Press,
pp. 85-105.
Pfenninger, W. 1987: Long-Range LFC Transport.Rest'arch in Natural Laminar Flow and Laminar-Flow
Con'rol, Jerry N. Hefner and Frances E. Sabo, compil-
ers, NASA CP-2487, Part 1, pp. 89-115.
Pfenninger, Werner; and Vemuru, Chandra S. 1988: Design
Asw, cts of Long Range Supersonic LFC Airplanes With
Highly Swept Wings. SAE Paper 881397.
Pfenninger, Werner; and Vemuru, Chandra S. 1992: Design
Philosophy of Long Range LFC Transports With
Advanced Supercritical LFC Airfoils. Natural Laminar
Flow and Laminar Flow Control, R. W. Bamwell and
M. Y. Hussaini, eds., Springer-Verlag, pp. 177-222.
76
Phillips,EdwardH.1996:NASASendsTestDataViaWeb.Aviat. Week & Space Technol., Apr. 15, p. 37.
Plascott, R. H.; Higton, D. J.; Smith, F.; and Bramwell,
A. R. 1946: Flight Tests on Hurricane 11, Z.3687 Fitted
With Special Wings of "Low-Drag" Design. R. & M.No. 2546, British A.R.C.
Poll, D. I. A. 1979: Transition in the Infinite Swept Attach-
ment Line Boundary Layer. Aeron. Quart., vol. XXX,
pp. 607-628.
Poll, D. I. A. 1980: Three-Dimensional Boundary LayerTransition via the Mechanisms of Attachment Line
Contamination and Cross Flow Instability. Laminar
Turbulent Transition, R. Eppler and H. Fasel, eds.,
Springer-Verlag, pp. 253-262.
Poll, D. I. A. 1985: Some Observations of the Transition
Process on the Windward Face of a Long Yawed Cylin-
der. J. Fluid Mech., vol. 150, pp. 329-356.
Poll, D. I. A.; Danks, M.; and Humphreys, B. E. t992: The
Aerodynamic Performance of Laser Drilled Sheets.
First European Forum on Laminar Flow Technology,
DGLR-Bericht 92-06, pp. 274-277.
Powell, Arthur G. 1987: The Right Wing of the L.E.F.T.
Airplane. Research in Natural Laminar Flow and
Laminar-Flow Control, Jerry N. Hefner and Frances E.
Sabo, compilers, NASA CP-2487, Part I, pp. 141-161.
Powell, A. G.; Agrawal, S.; and Lacey, T. R. 1989: Feasi-
bility and Benefits of Laminar Flow Control on Super-sonic Cruise Airplanes. NASA CR- 181817.
Pruett, C. David; and Chang, Chau-Lyan 1995: Spatial
Direct Numerical Simulation of High-Speed Boundary-
Layer Flows--Part II: Transition on a Cone in Mach 8
Flow. Theoret. Comput. Fluid Dyn., vol. 7, pp. 397--424.
Ranaudo, Richard J.; Reehorst, Andrew L.; and Potapezuk,Mark G. 1988: An Overview of the Current NASA Pro-
gram on Aircraft Icing Research. SAE Paper 881386.
Rayleigh, Lord 1879: On the Instability of Jets.Scientific Papers, Volume I, Cambridge Univ. Press,
pp. 361-371.
Rayleigh, Lord 1880: On the Stability or Instability of Cer-tain Fluid Motions. Proc. London Math. Soc., vol. 11,
pp. 57-70.
Rayleigh, Lord 1887: On the Stability or Instability of Cer-tain Fluid Motions II. Proc. London Math. Soc., vol. 19,
pp. 67-74.
Redeker, G.; Horstmann, K. H.; Ktister, H; Thiede, P.; and
Szodruch, J. 1990: Design of a Natural Laminar Flow
Glove for a Transport Aircraft. AIAA-90-3043.
Redeker, G.; Quast, A.; and Thibert, J. J. 1992: Das A320
Laminar-Seitenleit Werks-Program. Proceedings of
JAHRBUSH 1992, Volume III, DGLR, pp. 1259-1270.
Reed, Helen L.; and Saric, William S. 1989: Stability of
Three-Dimensional Boundary Layers. Annual Review
of Fluid Mechanics, Volume 21, Ann. Rev., Inc.,
pp. 235-284.
Reibert, M. S.; Saric, W. S.; Carrilio, R. B., Jr.; and
Chapman, K. L. 1996: Experiments in Nonlinear Satura-
tion of Stationary Crossflow Vortices in a Swept-Wing
Boundary Layer. AIAA-96-0184.
Reilly, Richard J.; and Pfenninger, W. 1955: Laminar Flow
Observations on a Rotating Disc. Rep. No. NAI-55-288
(BLC-73), Northrop Aircraft, Inc.
Reinmann, J. J. 1981: Selected Bibliography of NACA-
NASA A ircrafi Icing Publications. NASA TM-81651.
Reneaux, J.; and Blanchard, A. 1992: The Design and Test-
ing of an Airfoil With Hybrid Laminar Flow Control.
First European Forum on Laminar Flow Technology,
DGLR-Bericht 92-06, pp. 164-174.
Reshotko, Eli 1976: Boundary-Layer Stability and Transi-
tion. Annual Review of Fluid Mechanics, Volume 8,
Ann. Rev., Inc., pp. 31 !-349.
Reshotko, E. 1984: Environment and Receptivity. Special
Course on Stability and Transition of Laminar Flow,
AGARD Rep. 709, pp. 4-1-4-11.
Reynolds, Osborne 1883: An Experimental Investigation ofthe Circumstances Which Determine Whether the
Motion of Water Shall Be Direct or Sinuous, and of the
Law of Resistance in Parallel Channels. Philosoph.
Trans. R. Soc. London, ser. A, vol. 174, pp. 935-982.
Robert, J.-P. 1992a: Hybrid Laminar Flow ControI--A
Challenge for a Manufacturer. First European Forum
on Laminar Flow Technology, DGLR-Bericht 92-06,
pp. 294-308.
Robert, J.-P. 1992b: Drag Reduction: An Industrial Chal-
lenge. Special Course on Skin Friction Drag Reduction.
AGARD Rep. 786. (Available from DTIC as
AD A253 005.)
Rogers, Kenneth H. 1955: Investigation of the Pressure
Distribution Along a Constant Area Suction Duct With
90 Degree Drilled-Hole Inlet. Rep. No. NAI-55-286
(BLC-71), Northrop Aircraft, Inc.
Rogers, K. H. 1957: Experimental and Theoretical Investi-
gations of the Pressure-Drop Through Holes and Slots
in Incompressible Viscous Flow. Rep. No. NAI-58-19
(BLC-104), Northrop Aircraft, Inc. (Available fromDTIC as AD 152 319.)
77
Rozendaal,R. A. 1986:Natural Laminar Flow FlightExperiments on a Swept Wing Business Jet--Boundary
Layer Stability Analyses. NASA CR-3975.
Shifrin, Carole A. 1991: Hybrid Laminar Flow Tests Cut
Drag, Fuel Burn on 757. Aviat. Week & Space TechnoL,
Dec 2, pp. 36-37.
Runyan, L. James; and George-Falvy, Dezso 1979: Ampli-
fication Factors at Transition on an Unswept Wing inFree Flight and on a Swept Wing in Wind Tunnel.AIAA-79-0267.
Runyan, L. J.; Bielak, G. W.; Behbehani, R.; Chen, A. W.;
and Rozendaal, R. A. 1987:757 NLF Glove Flight TestResults. Research in Natural Laminar Flow and
Laminar-Flow Control, Jerry N. Hefner and Frances E.
Sabo, compilers, NASA CP-2487, Part 3, pp. 795-818.
Singer, Bart A.; Choudhari, Meelan; and Li, Fei 1995:
Weakly Nonparallel and Curvature Effects on Station-
ary Crossflow Instability: Comparison of Results From
Multiple-Scales Analysis and Parabolized Stability
Equations. NASA CR-198200.
Smith, A. M. O. 1953: Review of Research on Laminar
Boundary Layer Control at the Douglas Aircraft Co.,
EI Segundo Division. Rep. No. ES-19475, DouglasAircraft Co.
Saric, William S. 1985: Laminar Flow Control With Suc-
tion: Theory and Experiment. Aircraft Drag Prediction
and Reduction, AGARD Rep. 723.
Smith, A. M. O. 1955: On the Growth of Taylor-G0rtler
Vortices Along Highly Concave Walls. Q. Appl. Math.,
vol. XIII, no. 3, pp. 233-262.
Saric, William S.; Hoos, Jon A.; and Radeztsky, Ronald H.
1991: Boundary-Layer Receptivity of Sound With
Roughness. Boundary Layer Stability and Transition to
Turbulence, FED-Vol. 114, ASME, pp. 17-22.
Schlichting, H. 1932: Concerning the Origin of Turbulence
in a Rotating Cylinder. Math. Phys. Klasse, no. 2,
pp. 160-198.
Schmitt, V.; Reneaux, J.; and Priest, J. 1993: Maintaining
Laminarity by Boundary Layer Control. 1992 Scientific
and Technical Activities, ONERA, pp. 13-14.
Schoenster, James A.; and Jones, Michael G. 1987: Status
Report on a Natural Laminar-Flow Nacelle Flight
Experiment: Effects of Acoustic Sources. Research inNatural Laminar Flow and Laminar-Flow Control,
Jerry N. Hefner and Frances E. Sabo, compilers, NASACP-2487, Part 3, pp. 914-923.
Schrauf, G.; Bieler, H.; and Thiede, P. 1992: TransitionPrediction---The Deutsche Airbus View. First
European Forum on Laminar Flow Technology,
DGLR-Bericht 92-06, pp. 73-82.
Schubauer, G. B. 1939: Air Flow in the Boundary Layer of
an Elliptic Cylinder. NACA Rep. 652.
Schubauer, G. B.; and Skramstad, H. K. 1947: Laminar
Boundary-Layer Oscillations and Stability of Laminar
Flow. J. Aeronaut. Sci., vol. 14, no. 2, pp. 69-78.
Schubauer, G. B.; and Skramstad, H. K. 1948: Laminar-
Boundary-Layer Oscillations and Transition on a Flat
Plate. NACA Rep. 909.
Schwab, U. 1992: Electron Beam Drilled Holes for Laminar
Flow Control. First European Forum on Laminar Flow
Technology, DGLR-Bericht 92-06, pp. 270-273.
Smith, A. M. O. 1956: Transition, Pressure Gradient, and
Stability Theory. Proceedings of the International Con-
gress of Applied Mechanics, Volume 9, pp. 234-244.
Smith, A. M. O.; and Gamberoni, Nathalie 1956: Transi-
tion, Pressure Gradient, and Stability Theory. Rep.
No. ES 26388, Douglas Aircraft Co., Inc.
Smith, Bruce A. 1995: F-16XL Flights Could Aid in HSCT
Design. Aviat. Week & Space Technol., Oct. 23,pp. 42--44.
Smith, Bruce A. 1996: Laminar Flow Data Evaluated.
Aviat. Week & Space TechnoL, Oct. 7, p. 30.
Smith, F.; and Higton, D. J. 1945: Flight Tests on "King
Cob'a" FZ.440 To Investigate the Practical Require-
men, s for the Achievement of Low Profile Drag Coeffi-cients on a "Low Drag" Aerofoil. R. & M. No. 2375,British A.R.C.
Somers, Dan M. 1992: Subsonic Natural-Laminar-FlowAirfoils. Natural Laminar Flow and Laminar Flow
Comrol, R. W. Barnwell and M. Y. Hussaini, eds.,
SpriJlger-Verlag, pp. 143-176.
Sommeffeld, A. 1908: Ein Beitrag zur Hydrodynamischen
Erklaerung der Turbulenten Fluessigkeitsbewegungen.Atti ;nt. Congress of Math., vol. 3, pp. 116-124.
Spalart, P. R. 1989: Direct Numerical Study of Leading-Edge Contamination. Fluid Dynamics of 3-D Turbulent
Shear Flows and Transition, AGARD-CP-438,
pp..'.1-5.13.
Squire, 1t. B. 1933: On the Stability for Three-DimensionalDisturbances of Viscous Fluid Flow Between Parallel
Walls. Proc. R. Soc. London, ser. A, vol. CXLII,
pp. 621-628.
78
Srokowski,AndrewJ.; andOrszag,StevenA. 1977:MassFlow Requirementsfor LFC Wing Design.AIAA-77-1222.
Stephens,A.V.;andHaslam,J.A.G.1938:Flight Experi-
ments on Boundary Layer Transition in Relation to
Profile Drag. R. & M. No. 1800, British A.R.C.
Stock, H. W. 1990: The Stability and Amplification Rates
of Two-Dimensional, Incompressible Laminar Bound-
ary Layers With Suction. Z. Flugwiss. Weltraumforsch,
vol. 14, pp. 263-272.
Sturgeon, R. F.; Bennett, J. A.; Etchberger, F. R.; Ferrill,R. S.; and Meade, L. E. 1976: Study of the Application
of Advanced Technologies to Laminar-Flow Control
Systems for Subsonic Transports. Volume 1I: Analyses.NASA CR- 144949.
Tadjfar, M.; and Bodonyi, R. J. 1992: Receptivity of a Lam-
inar Boundary Layer to the Interaction of a Three-
Dimensional Roughness Element With Time-Harmonic
Free-Stream Disturbances. J. Fluid Mech., vol. 242,
pp. 701-720.
Tamigniaux, T. L. B.; Stark, S. E.; and Brune, G. W. 1987:
An Experimental Investigation of the Insect ShieldingEffectiveness of a Krueger Flap/Wing Airfoil Configu-ration. AIAA-87-2615.
Theofilis, Vassilios 1993a: Numerical Experiments on the
Stability of Leading Edge Boundary Layer Flow: ATwo-Dimensional Linear Study. Int. J. Numer. Methods
Fluids, vol. 16, pp. 153-170.
Thibert, J. J.; Reneaux, J.; and Schmitt, Reneaus V. 1990:
ONERA Activities on Drag Reduction. Proceedings of
the 17th Congress of the International Council of the
Aeronautical Sciences, pp. 1053-1059. (Available asICAS-90-3.6.1.)
Tollmien, W. 1929: l_lber die Entstehung der Turbulenz.
Math.-Phys. Kl., pp. 21-44. (Translation available as
NACA TM 609.)
Tuttle, Made H.; and Maddalon, Dal V. 1982: Laminar
Flow Control (1976-1982)--A Selected, Annotated
Bibliography. NASA TM-84496.
Tuttle, Made H.; and Maddalon, Dal V. 1993: Laminar
Flow Control--1976-1991: A Comprehensive, Anno-
tated Bibliography. NASA TM- 107749.
Van Driest, E. R.; and McCauley, W. D. 1960: The Effect
of Controlled Three-Dimensional Roughness on
Boundary-Layer Transition at Supersonic Speeds. J.
Aerosp. Sci., vol. 27, no. 4, pp. 261-271,303.
Van Ingen, J. L. 1956: A Suggested Semi-Empirical Method
for the Calculation of the Boundary Layer Transition
Region. Rep. V.T.H.-74, Tech. Hogeschool Vliegtuig-bouwkunde.
Viken, Jeffrey K. 1983: Aerodynamic Design Consider-
ations and Theoretical Results for a High ReynoldsNumber Natural Laminar Flow Airfoil. M.S. Thesis,
George Washington Univ.
Vijgen, P. M. H. W.; Dodbele, S. S.; Holmes, B. J.; and
Van Dam, C. P. 1986: Effects of Compressibility on
Design of Subsonic Natural Laminar Flow Fuselages.AIAA-86-1825.
Von Doenhoff, Albert E. 1940: Investigation of the Bound-
ary Layer About a Symmetrical Airfoil in a Wind Tunnel
of Low Turbulence. NACA WR L-507.
Wagner, Richard D.; Maddalon, Dal V.; and Fischer,Michael C. 1984: Technology Developments for Lami-
nar Boundary Layer Control on Subsonic Transport Air-
craft. NASA paper presented at the 54th Meeting of theFluid Dynamics Panel Symposium on Improvement of
Aerodynamic Performance Through Boundary LayerControl and High Lift Systems (Brussels, Belgium).
Wagner, R. D.; Maddalon, D. V.; Bartlett, D. W.; andCollier, F. S., Jr. 1988: Fifty. Years of Laminar Flow
Flight Testing. SAE Paper 881393.
Wagner, Richard D.; Maddalon, Dal V.; Bartlett, D. W.;
Collier, F. S., Jr.; and Braslow, A. L. 1989: Laminar-
Flow Flight Experiments. Transonic Symposium: The-
or),, Application and Experiment--Volume 2, Jerome T.
Foughner, compiler, NASA CP-3020, pp. 59-104.
Wagner, R. D.; Fischer, M. C.; Collier, F. S., Jr.; and
Pfenninger, W. 1990: Supersonic Laminar Flow Control
on Commercial Transports. 17th Congress of the Inter-national Council of the Aeronautical Sciences, ICAS
Proceedings.
Wagner, R. D.; Maddalon, D. V.; Bartlett, D. W.; Collier,F. S., Jr.; and Braslow, A. L. 1992: Laminar Flow Flight
Experiments--A Review. Natural Laminar Flow andLaminar Flow Control, R. W. Barnwell and M. Y.
Hussaini, eds., Springer-Verlag, pp. 23-72.
Warren, E. S.; and Hassan, H. A. 1997a: An Alternative to
the en Method for Determining Onset of Transition.AIAA-97-0825.
Warren, E. S.; and Hassan, H. A. 1997b: A Transition Clo-
sure Model for Predicting Transition Onset. SessionCode: 10AI, Presented at 1997 AIAA/SAE World Avi-
ation Congress.
Warwick, Graham 1985: JetStar Smoothes the Way. Flight
Int., vol. 128, pp. 32-34.
79

Wentz,W. H.,Jr.;Ahmed,A.; andNyenhuis,R. 1984:
Natural Laminar Flow Flight Experiments on a Swept-
Wing Business Jet. AIAA-84-2189.
Wentz, W. H., Jr.; Ahmed, A.; and Nyenhuis, R. 1985: Fur-
ther Results of Natural Laminar Flow Flight Test Exper-
iments. General Aviation Aircraft Aerodynamics, SAE
SP-621, pp. 37-50.
Wetmore, J. W.; Zalovcik, J. A.; and Platt, Robert C. 1941:
A Flight Investigation of the Boundary-Layer Charac-
teristics and Profile Drag of the NACA 35-215
Laminar-Flow Airfoil at High Reynolds Numbers.
NACA WR L-532. (Formerly NACA MR May 5,
1941.)
Whitcomb, Richard T.; and Clark, Larry R. 1965: An Airfoil
Shape for Efficient Flight at Supercritical Mach Num-bers. NASA TM X-1109.
Whites, R. C.; Sudderth, R. W.; and Wheldon, W. G. 1966:Laminar Flow Control on the X-21. Astronaut. &
Aeronaut., vol. 4, no. 7, pp. 38-43.
Wiegel, M.; and Wlezien, R. W. 1993: Acoustic Receptivity
of Laminar Boundary Layers Over Wavy Walls.AIAA-93-3280.
Wilkinson, S. P.; Anders, S. G.; Chen, F.-J.; and Beckwith,
I. E. 1992: Supersonic and Hypersonic Quiet TunnelTechnology at NASA Langley. AIAA-92-3908.
Williams, Louis J. 1995: HSCT Research Gathers Speed.
Aerosp. America, pp. 32-37.
Woan, C. J.; Gingrich, P. B.; and George, M. W. 1991: CFD
Validation of a Supersonic Laminar Flow Control
Concept. AIAA-91-0188.
Wolf, Stephen W. D.; Laub, James A.; and King, Lyndell S.1994: Flow Characteristics of the NASA-Ames Laminar
Flow Supersonic Wind Tunnel for Mach 1.6 Operation.AIAA-94-2502.
Wortmann, F. X. 1963: A Method for Avoiding Insect
Roughness on Aircraft. Luftahrettechnik Raumfahr-
itechnik, vol. 9, no. 9, pp. 272-274. (Translation avail-
able as NASA T'l" F-15454.)
Wortmann, F. X. 1969: Visualization of Transition. J. Fluid
Mech., vol. 38, pt. 3, pp. 473-480.
Young, A. D.; Serby, J. E.; and Morris, D. E. 1939: Flight
Test,_" on the Effect of Surface Finish on Wing Drag.
R. & M. No. 2258, British A.R.C.
Zalovcik, John A.; Wetmore, J. W., and Von Doenhoff,
Albert E. 1944: Flight Investigation of Boundary-Layer
Control by Suction Slots on an NACA 35-215 Low-Drag
Airfoil at High Reynolds Numbers. NACA WR L-521.
(Formerly NACA ACR 4B29.)
Zalovcit, John A.; and Skoog, Richard B. 1945: Flight
lnve :tigation of Boundary-Layer Transition and ProfileDrag of an Experimental Low-Drag Wing Installed on a
Fighter-Type Airplane. NACA WR L-94. (FormerlyNACA ACR L5C08a.)
8O
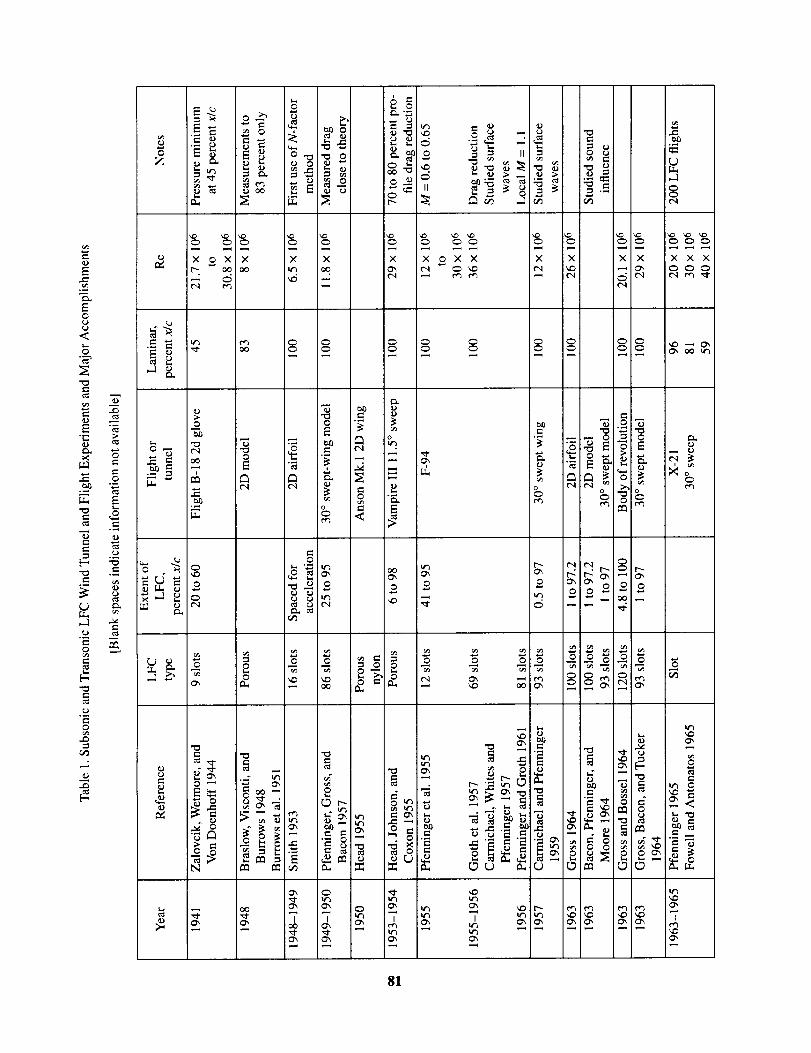
0z
E
0 o
e- X X X
0
_ ",___.
_ ._
a _
e-
-r.a
gNN
"-d0
t",l
£0
X X X X£XX
0 "_E
-._ - =•_ _, .._
0
__
r_
___ _-
._-_ _
X X XX XXX
-,-_ _
_ _o _
£££££
O0 000
- _ _ ____
i -_ _ _ _i__. o
81

t,_
0
,,D
E
0
0o
E
°
.o
E
o,,D
0
Z
¢,)
Im0
0
r-. o.
X X X X X X X X X X X X X X X X
0 0 0 0 0
• _ ._ °_ °,_
-_ _ o_ o_ _._
k,e3 t'_
0 _ t",l
- - -_-._ __ _ _.. -
00
,5
o -_
H N
000
000
..
0
_ z
82
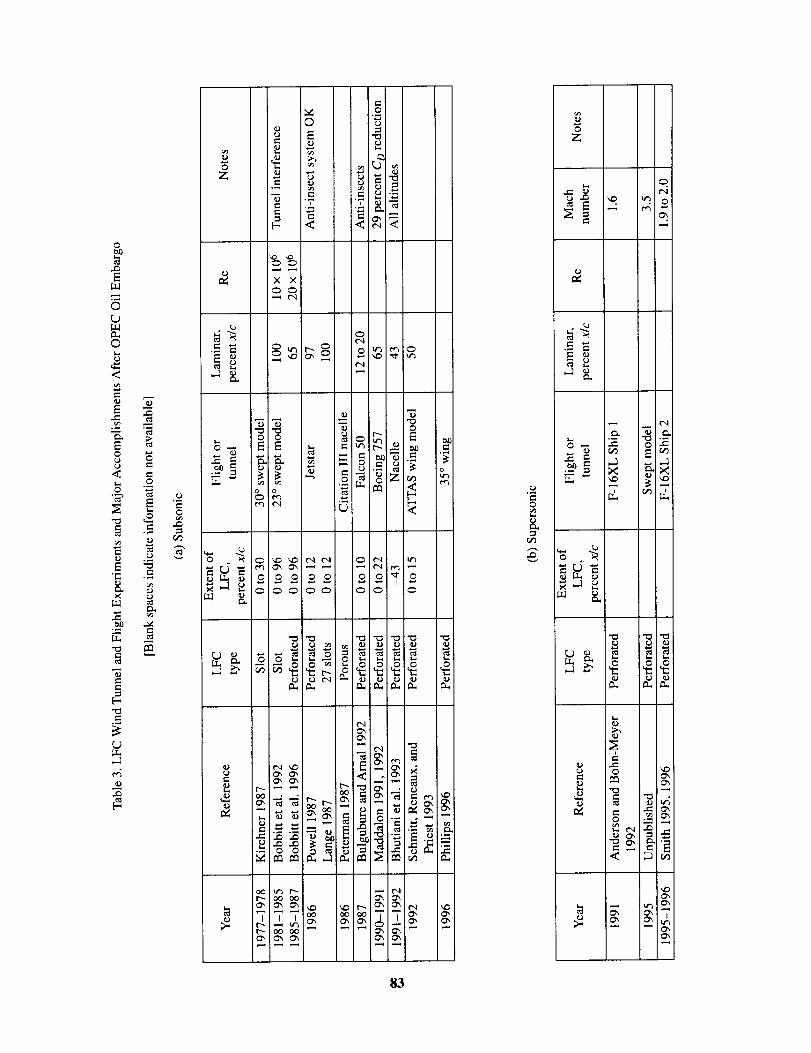
0
E
©
©
<
E -
0
._ .m
¢-,¢-,
t-
0z
t_
t-
e-,
©E
t-.
× ×
tx.I
0
t-"T'
¢xl
¢xl
c-O
p
t'_ _'x 0'_ ,--_ ,--_ ,'_ '¢xl t',"_ ''_
¢-q s,_
¢.q
0",
_ _ t'_ _ ¢"1
--- __
0z
e.
o
8.r_
e.,
t-o
e.-
t',3
J,
83

B-18 slot O
2D slot and porous []
30 ° wing slot []
Anson Mk.1 2D porous O
Vampire 30 ° wing porous O
F-94 swept slot O
30 ° wing slot []
Flat plate, 2D airfoil, and ogive cylinder slot •
O Subsonic flight
• Supersonic flight
[] Subsonic wind tunnel
• Supersonic wind tunnel
30 °, 50 °, and 72.5 ° wing slot •
2D, 30 ° wing, and body of revolution slot []
X-21 30 ° swept slot O
I I I I I
1930 1940 1950 1960 1970
Year
Figure 1. Overview of Laminar Flow Control Projects.
O A320 fin perforated
[] 35 ° wing perforated
• F-16XL Ship 2 perforated
• Swept wing perforated
[] Swept wing perforated
O A300 nacelle perforated
• F-16XL Ship 1 perforated
O Boeing 757 perforated
O Falcon 50 perforated
O Jetstar perforated and slot
O Citation nacelle porous
[] 23 ° wing perforated
-] 23 ° wing slot
[] 30 ° wing slot
I I I
1980 1990 2000
84

Natural laminar flow (NLF)
c_\
Laminar flow control (LFC)
,%lcrrrrrr
cp
\
Hybrid laminar flow control (HLFC)
cp
\x/c
(a) NLF, LFC, and HLFC concepts for wing.
_- Smooth joint and
Anti-icing ,_;'__' " _- Krueger flap and insect shield
(b) Practical application of HLFC wing.
Figure 2. Concepts and practical application. (From Collier 1993.)
85
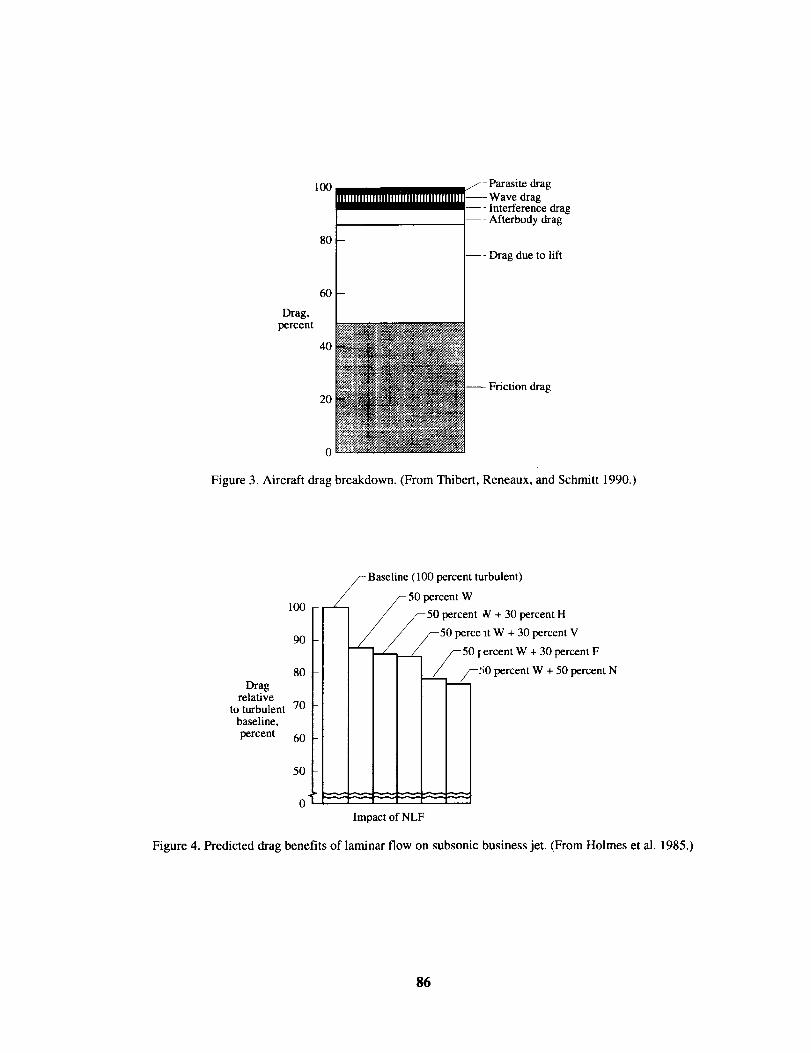
100
80
60
Drag,percent
40
LgI---- Afterbody drag
.... Drag due to lift
20
0
Figure 3. Aircraft drag breakdown. (From Thibert, Reneaux, and Schmitt 1990.)
/_- Baseline (100 percent turbulent)
_- 50 percent W
100 - _ / _--50 percent _V+ 30 percent H
90 - _ / /--50 perce it W + 30 percent V. _ /--50 iercent W + 30 percent F
_ ....__50 percent W + 50 percent N80 -
Dragrelative
to turbulent 70 -baseline,
percent 60 -i
50 - _:_0
Impact of NLF
Figure 4. Predicted drag benefits of laminar flow on subsonic business jet. (From Holmes et al. 1985.)
86
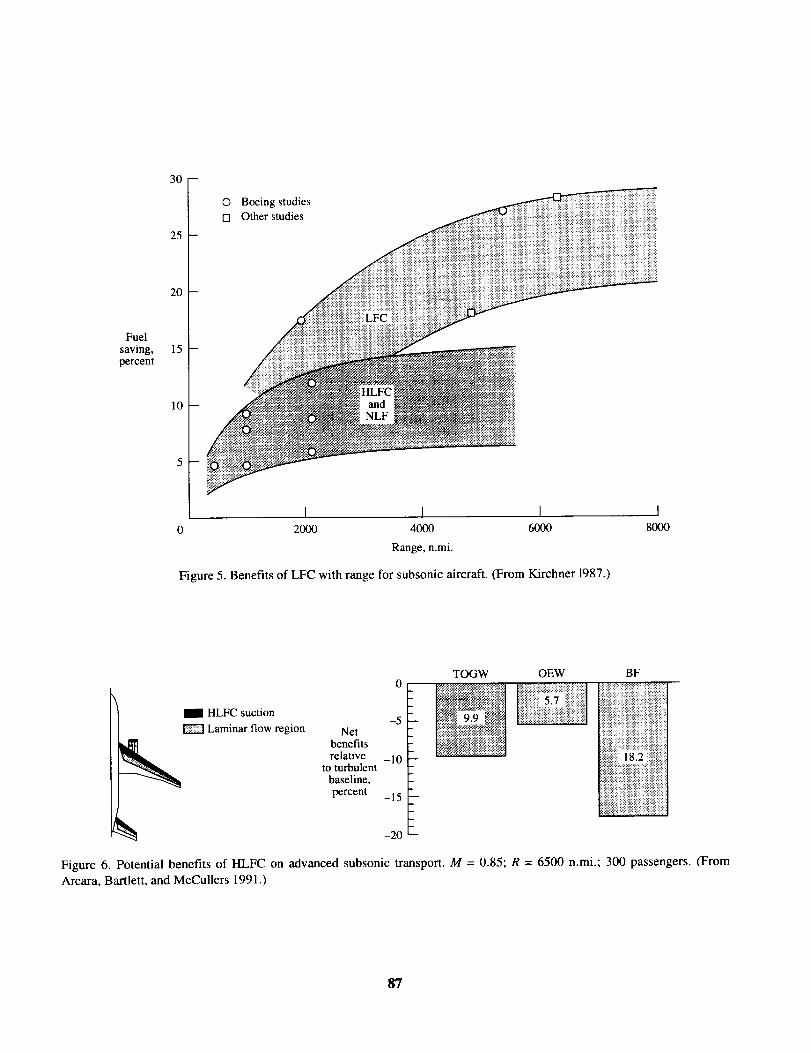
Fuel
saving,percent
30--
25--
20 -
15 -
10
5
O Boeing studies
[] Other studies
I I I0 2000 4000 6000
Range, n.mi.
Figure 5. Benefits of LFC with range for subsonic aircraft. (From Kirchner 1987.)
I8000
HLFC suction
Laminar flow region Netbenefitsrelative
to turbulent
baseline,
percent
-5
-10
-15
-20
TOGW OEW BF
Figure 6. Potential benefits of HLFC on advanced subsonic transport. M = 0.85; R = 6500 n.mi.; 300 passengers. (From
Arcara, Bartlett, and McCullers 1991 .)
87
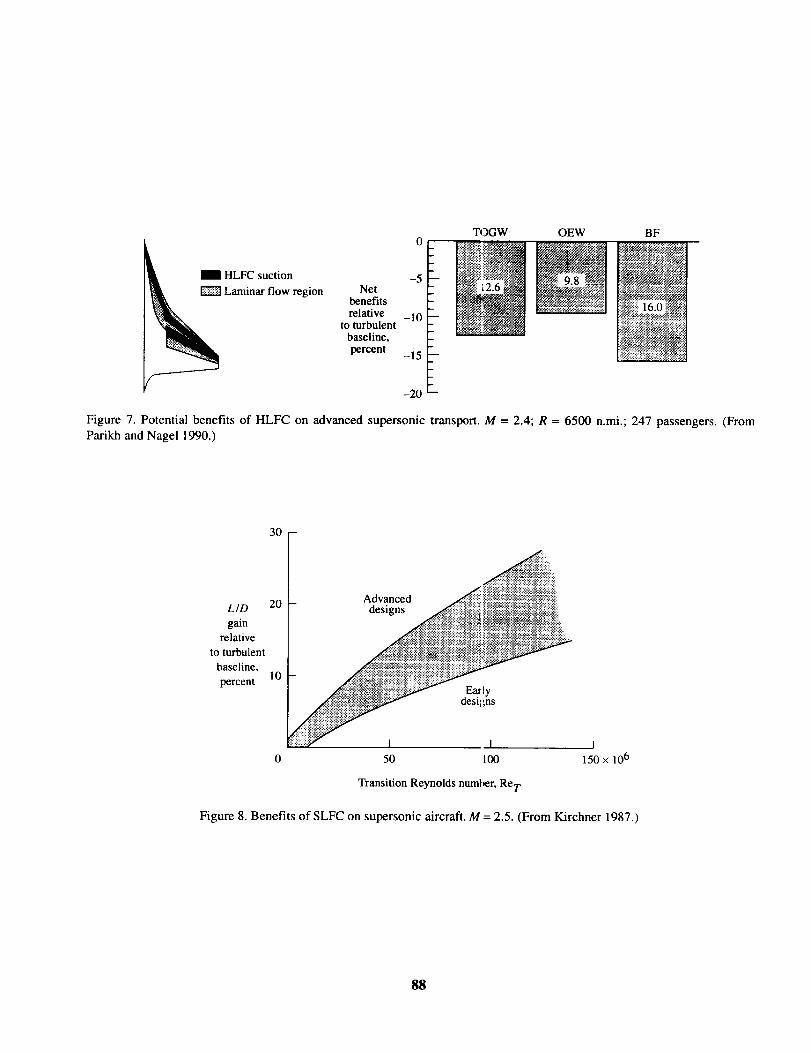
HLFC suction
Laminar flow region Netbenefitsrelative
to turbulentbaseline,
percent
-5
-10
-15
-20
TOGW OEW BF
•__ • _ ,_ ._
Figure 7. Potential benefits of HLFC on advanced supersonic transport. M = 2.4; R = 6500 n.mi.; 247 passengers. (From
Parikh and Nagel 1990.)
30 -
L/D
gain
relative
to turbulent
baseline,
percent
20
10
Advanced
designs
Ea/lydesi_ :ns
I
0 50 100 150 x 106
Transition Reynolds number, Re T
Figure 8. Benefits of SLFC on supersonic aircraft. M = 2.5. (From Kirchner 1987.)
88
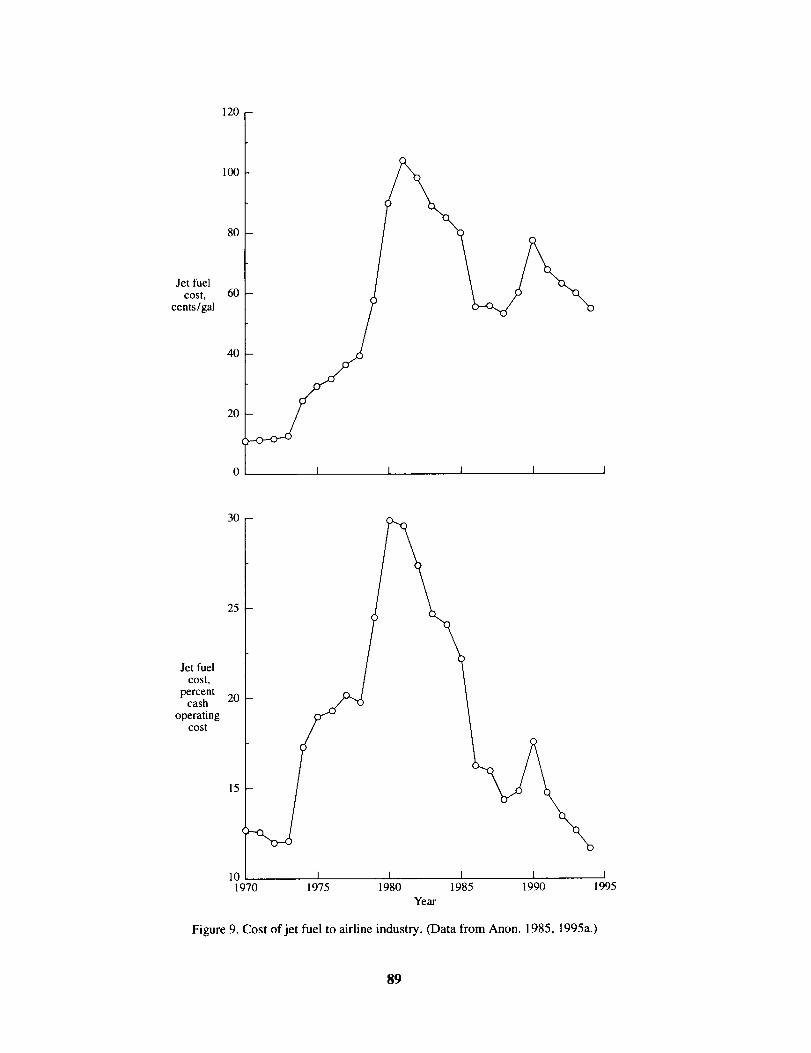
120 -
Jet fuel
COSt,
cents/gal
100
80
60
40
20
I I I I
Jet fuel
cost,
percentcash
operatingCOSt
30
25
20
15
10 I 11970 1975 1980
I I I1985 1990 1995
Year
Figure 9. Cost of jet fuel to airline industry. (Data from Anon. 1985, 1995a.)
89
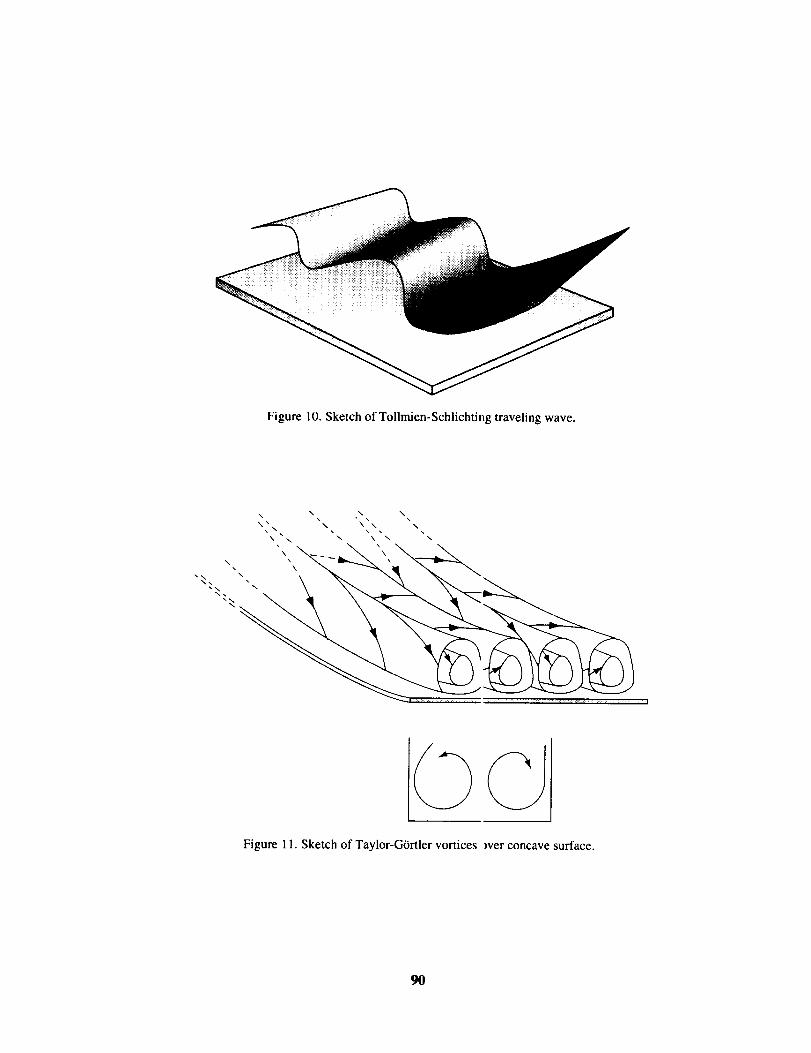
Figure 10. Sketch of Tollmien-Schlichting traveling wave.
\ \ \ \
\\\x \ \ \ \
\ \ \ \ \ \
i
Figure 11. Sketch of Taylor-GiJrtler vortices _ver concave surface.
90

Boundary-layer edge_ flf_
Potential-.flow f_ /
Free-stream velocity
vortex
Wall OOOOnormal
Spanwise
Figure 12. Sketch of crossflow vortices over swept wing.
80
Distance oftransition line
from L.E.,percent chord
60
40
20
E]----z
Sweep, A, deg
_7 o
A 25
+ 30
35
(3 40
-- × 45
12] 50 ]
0 50 100 150 200 250 300 350
Wind speed, ft/sec
Figure 13. Effect of wind speed and wing sweepback on transition. (From Anscombe and Illingworth 1956.)
400
91

(ReT)ma x
25
20
]5!
10
x 106
F• B-18 glove
• Langley LTPT tests
(6-series airfoils)
• King Cobra
• Ames 12-ft tests
I I I I I I I I
5 l 0 15 20 25 30 35 40
A, deg
Figure 14. Maximum transition Reynolds number with wing sweep. (From Wagner et al. 1992.)
Figure 15. Sketch of attachment-line flow. (From Wenz, Ahmed, and Nyenhuis 1985.)
92
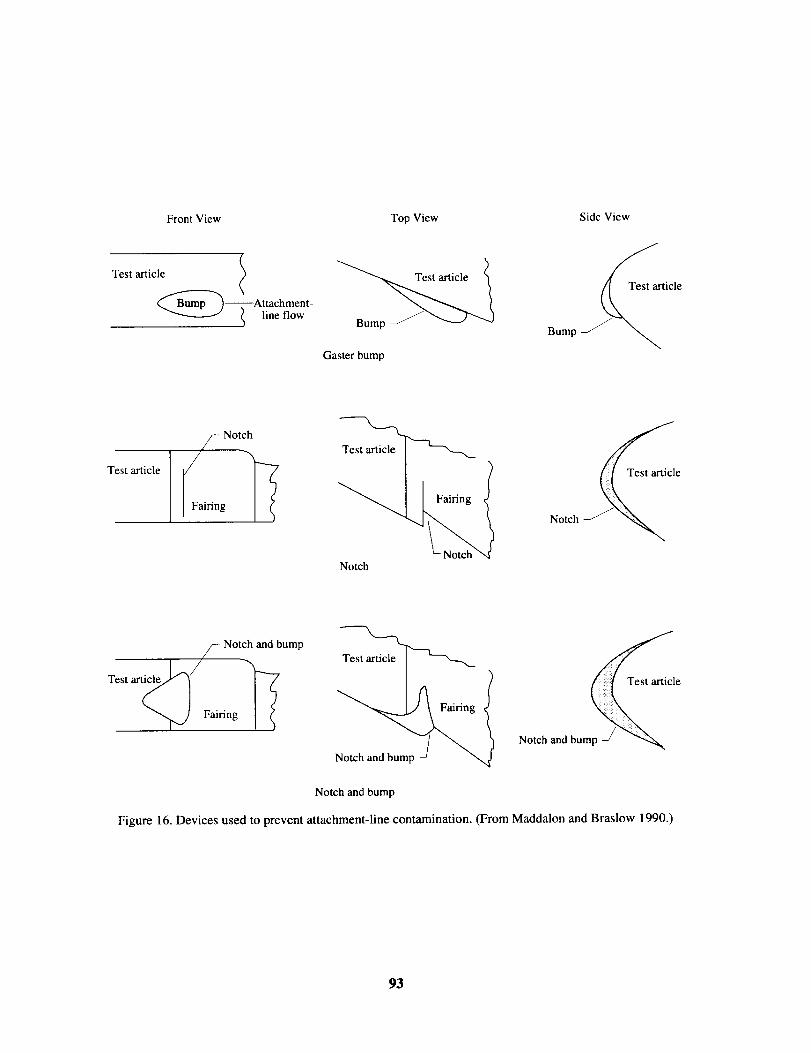
Front View
Test article /
__Attachment-
l line flow
Top View
Bump -/
Gaster bump
Side View
Bump __icle
Test article
Notch
Notch __le
////-_ Notch and bump
Test art__ Fairing _
Notch and bump -/
Test article
Notch and bump
Figure 16. Devices used to prevent attachment-line contamination. (From Maddaion and Braslow 1990.)
93
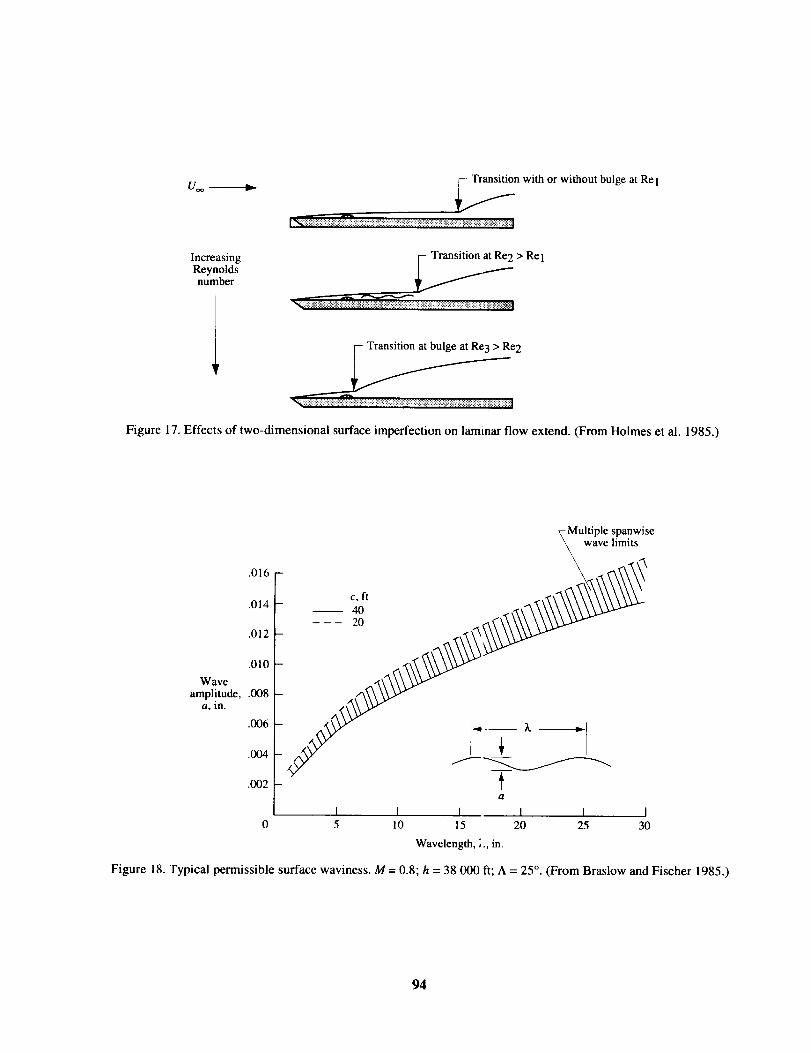
Uoo ---------I_
IncreasingReynoldsnumber
_-- Tr_tion with or without bulge at Re 1
I'_,,_ _ _ _':__ _ _7_? _ :_ _-_S__!_.._.]
> Re 1
2
Figure 17. Effects of two-dimensional surface imperfection on laminar flow extend. (From Holmes et al. 1985.)
.016
.014
.012
.010
Wave
amplitude, .008a, in.
.006
.004
.002
TMultiple spanwise
wave limits
- ioo'
-a
I I I I I I
5 10 15 20 25 30
Wavelength, ;., in.
Figure 18. Typical permissible surface waviness. M = 0.8; h = 38 000 ft; A = 25 °. (From Braslow and Fischer 1985.)
94

.04-
.03
Critical
roughnessheight, .02
in.
.01
I I I I I I I I I I
0 1 2 3 4 5 6 7 8 9 l0
Distance from leading edge, ft
h, ft
..----- 50000
40000
30000
._-------- 20000
Figure 19. Typical permissible three-dimensional type of surface protuberances. M = 0.8. (From Braslow and Fischer 1985.)
50 and 80 lam
20d
(a) Idealized cylindrical hole. (b) Conical hole.
/(c) Inclined conical hole.
Rad = 0.Sd//_ IRad = 0.25d ]
(d) Radiused inlet.
Rad = 0.5d
0.5d
(e) Asymmetrically radiused inlet. (f) Raised rounded inlets.
Figure 20. Hole geometries and inlet region shapes. Not drawn to scale. (From MacManus and Eaton 1996.)
95
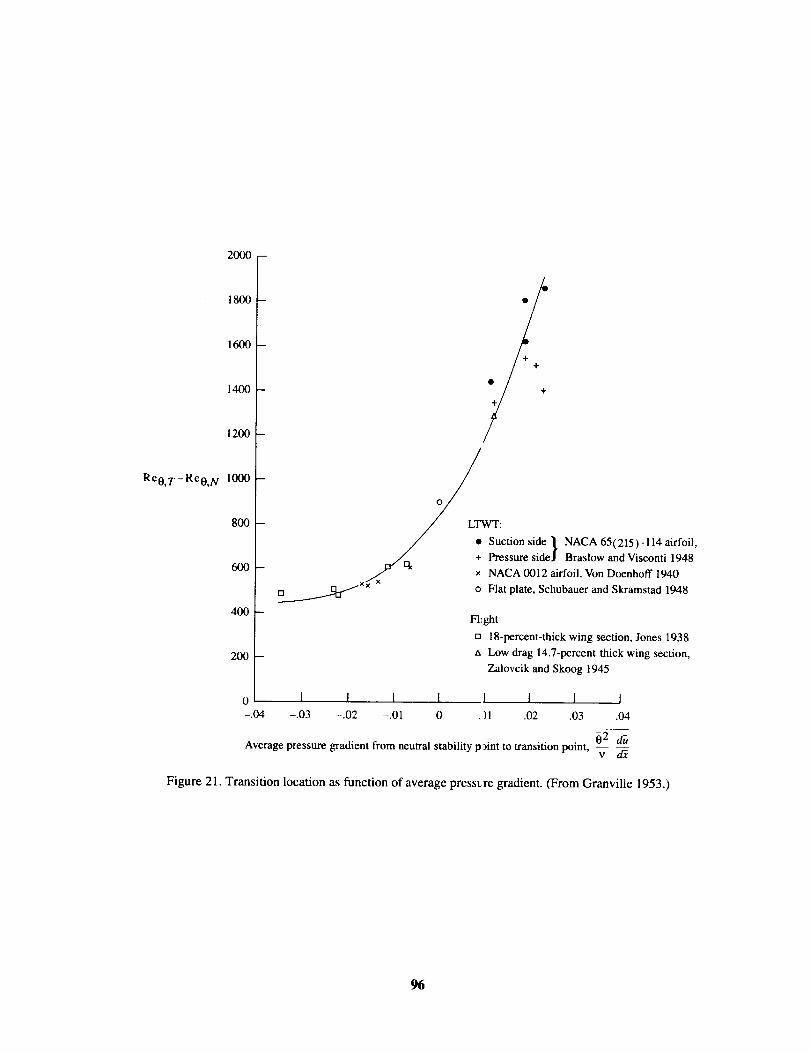
2000 -
Re0,T- Re0,N
180O
1600
1400
1200
1000
800 -
600 -
400 -
200 -
0
--.04
Average pressure gradient from neutral stability p >int to transition point, -- --
/
LTWT:
Suction side "It NACA 65(215)-! 14 airfoil,/ + Pressure side.I Braslow and Visconti 1948
x_ gr't_ × NACA 0012 airfoil, Von Doenhoff 1940
[] ×× o Flat plate, Schubauer and Skramstad 1948
Flght
[] 18-percent-thick wing section, Jones 1938
,x Low drag 14.7-percent-thick wing section,
Zalovcik and Skoog 1945
I I I I I I I I-.03 -.02 -.01 0 . )1 .02 .03 .04
62 du
v d_
Figure 21. Transition location as function of average presst:re gradient. (From Granville 1953.)
96
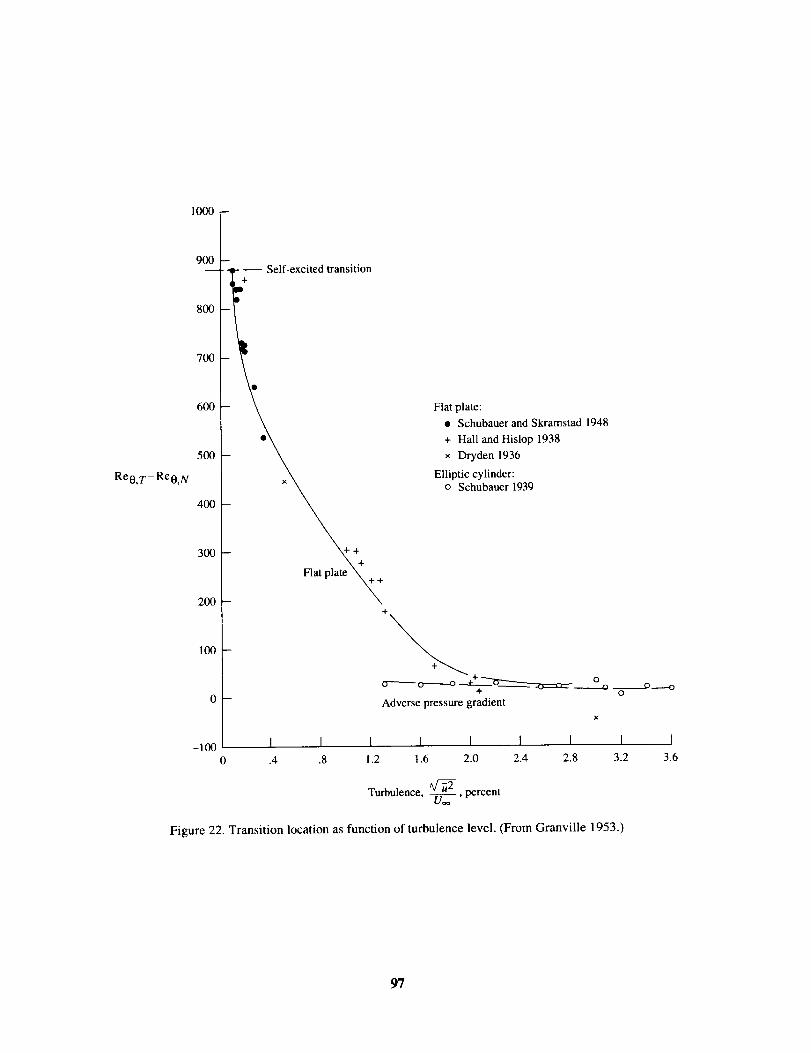
1000
900F
Self-excited transition
800
700
Re0, T- Re0, N
600
500--
400--
300--
200 -
100 -
0 -
Flat plate:
• Schubauer and Skramstad 1948
÷ Hall and Hislop 1938
x Dryden 1936
Elliptic cylinder:o Schubauer 1939
÷
+
Flat pla_++
oAdverse pressure gradient
x
.O -------O
-1oo I I I I I I I I I0 .4 .8 1.2 1.6 2.0 2.4 2.8 3.2 3.6
Turbulence, _-, percent
Figure 22. Transition location as function of turbulence level. (From Granville 1953.)
97

t_
S:able
Stable
Re
Figure 23. Illustration of neutral curve for linear stability theory.
N
x/c t_ Transition
Figure 24. Amplification of four waves of different frequency to llustrate determination of N-factor curve.
98

300 -
250
200
Population density, 150insects/l × 106 ft 3
100
50
-- Maresh and Bragg 1984
o Croom and Holmes 1985
25O 500 75O 1000
Altitude, ft
(a) Vertical distribution of population density.
Time
to accumulate
= 300 insects,rain
15
25
35
45
OA
[]
oO o
o AA[] AD D o
o A o
oD A O
dd
55 I55 60 65 70
o 4 to 8 mph wind
[] >4 mph wind
A <8 mph wind
• • <12 hr after rain
Tick indicates less than300 insect strikes
d_d
I I I I I
75 80 85
Groundtemperature,°F
(b) Effect of meteorological conditions on rate of insect accumulation; V = 130 mph; h = 50 ft.
Figure 25. Cessna 206 anti-insect flight test results. (From Croom and Holmes 1985.)
99
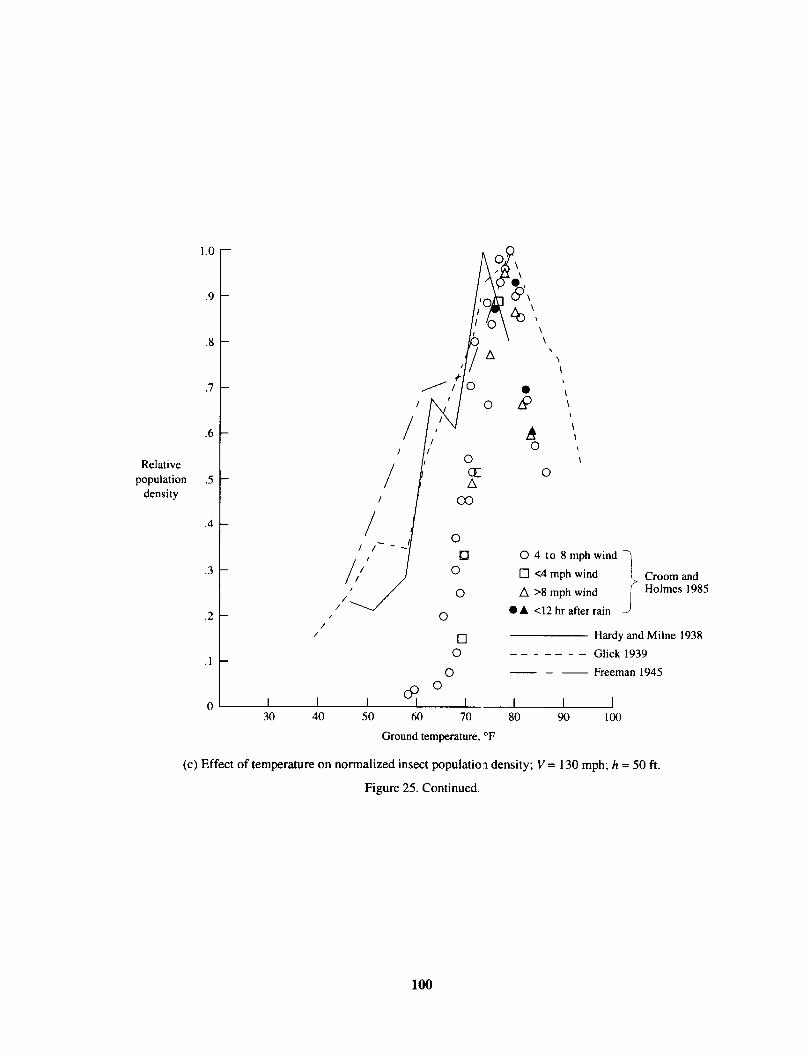
Relative
population
density
1.0
.9
.8
.7
.6
.5
.4
.3
.2/
/
//
/
//
// /
/
/
/
cP
30 40 50 60
A
O
©
\
\
O
O
[] O 4 to 8 mph wind -_
O [] <4 mph wind _ Croom and© A >8 mph wind Holmes 1985
• & <12 hr after rainO
[] Hardy and Miine 1938
© ....... Glick 1939
© Freeman 1945
O
I I I I70 80 90 100
Ground temperature, °F
(c) Effect of temperature on normalized insect populatio a density; V = 130 mph; h = 50 ft.
Figure 25. Continued.
100

Relative
population
density
1.0
.8
.6
.4
.2
--"kO \
\
i I J I i0 10 20
• O Croom and Holmes 1985
Hardy and Milne 1938
....... Glick 1939
Freeman 1945
\\
\
30 40
Surface wind velocity, mph
(d) Effect of wind velocity on normalized insect population density; V = 130 mph; h = 50 ft.
Time
to accumulate
-- 300 insects,min.
5
15
25
35
45
5570
o
oo
o
I
oO
ooo
oaoo
o
o Croom and Holmes 1985
Tick indicates less than 300 insect strikes
I I I I I I I100 130
Airspeed, V, mph
(e) Effect of airspeed in rate of insect accumulation; h = 50 ft; surface windspeed, 4 to 8 mph; surface temperature, 70°F.
Figure 25. Concluded.
101
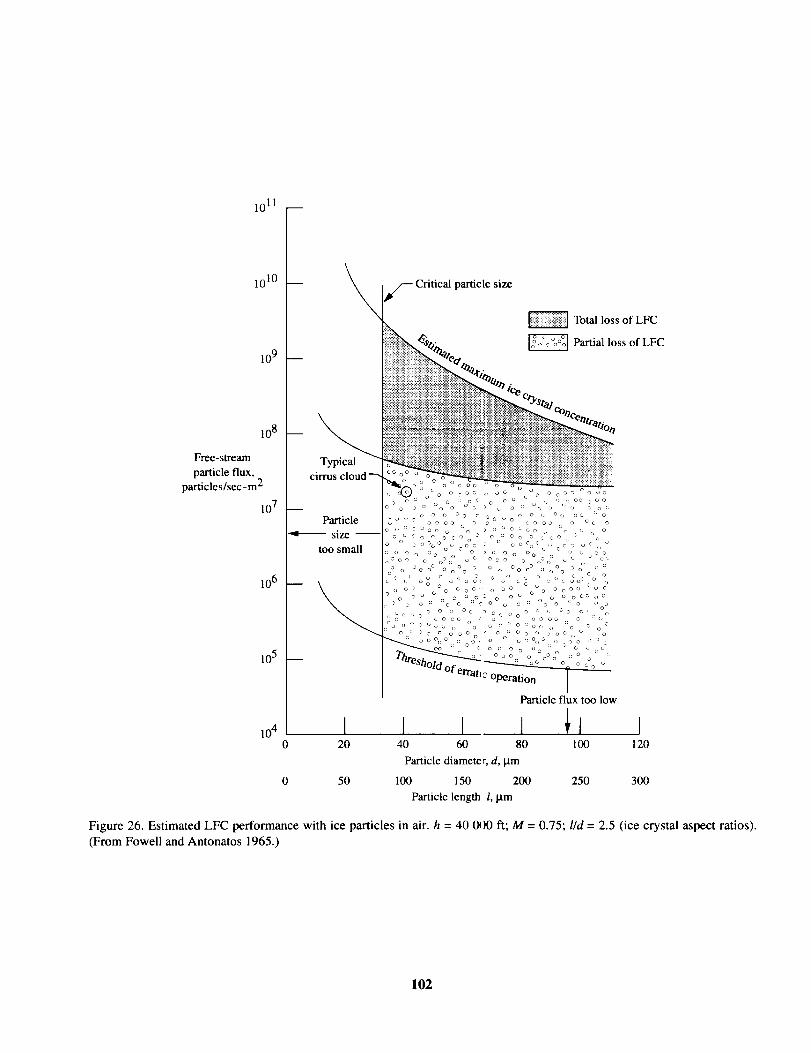
1011 i
1010
10 9
10 8
Free-stream
particle flux,
particles/sec-m 2
10 7
10 6
105
10 4
Typicalcirrus
i
Particle
size --
too small
Critical particle size
Total loss of LFC
_ Partial loss of LFC
o o o c,_o ° oc, oa o _ o oc. oo o c
_o o° o °oo o o o o ° o °oc_ o o o o oo o o c, o o o o > o o o c, ': _ o o o
o cO ° o o o o _o o ¸_ _ r: •' o o o o" ' o r. o ,3 o c o o o o
oo o o o o o o _. o . c,
oooooZoO:oo o
Particle flux too low
I I I I I0 20 40 60 80 100 120
Particle diamete r, d, p.m
0 50 100 150 200 250 300
Particle length l, I.tm
Figure 26. Estimated LFC performance with ice particles in air. h = 40 OI0 ft; M = 0.75; lid = 2.5 (ice crystal aspect ratios).
(From Fowell and Antonatos 1965.)
102
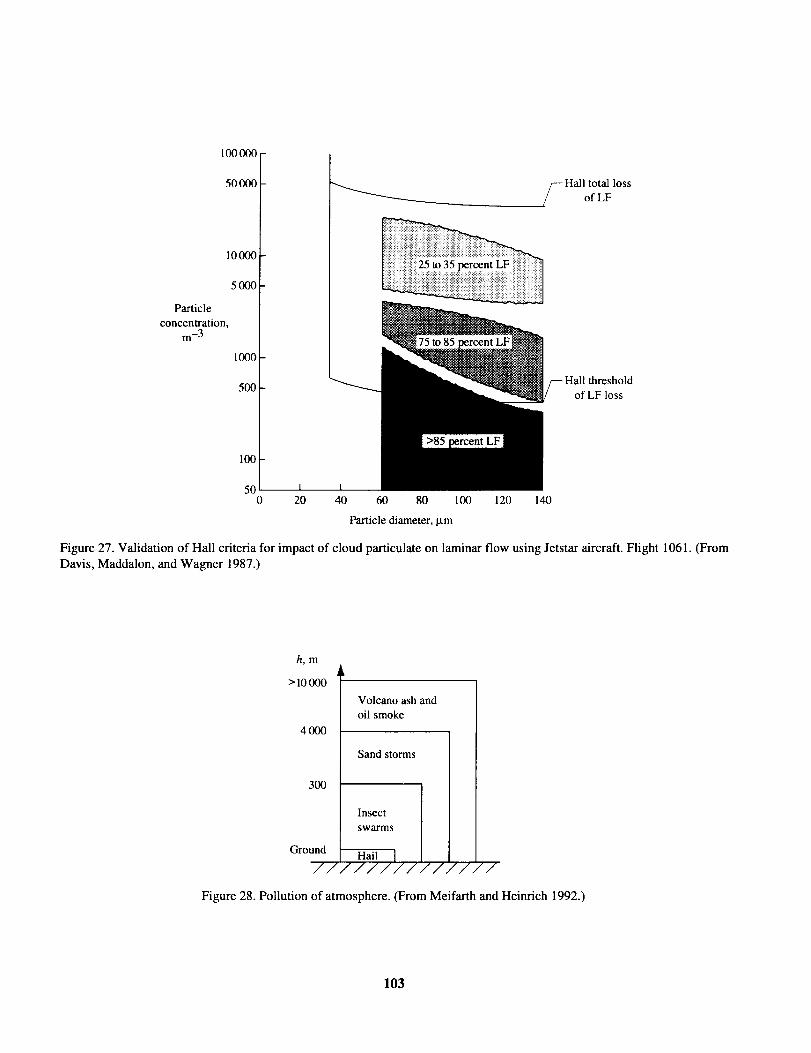
100000
Particle
concentration,m-3
500OO
10000
5OOO
1000
500
100
500 20 40 60 80 I00 120 140
Particle diameter, I.tm
Hall total loss
of LF
;shold
of LF loss
Figure 27. Validation of Hall criteria for impact of cloud particulate on laminar flow using Jetstar aircraft. Flight 1061. (From
Davis, Maddalon, and Wagner 1987.)
h, m
>10000
4000
300
Volcano ash and
oil smoke
Sand storms
Insect Iswarms
z7 -
Figure 28. Pollution of atmosphere. (From Meifarth and Heinrich 1992.)
103
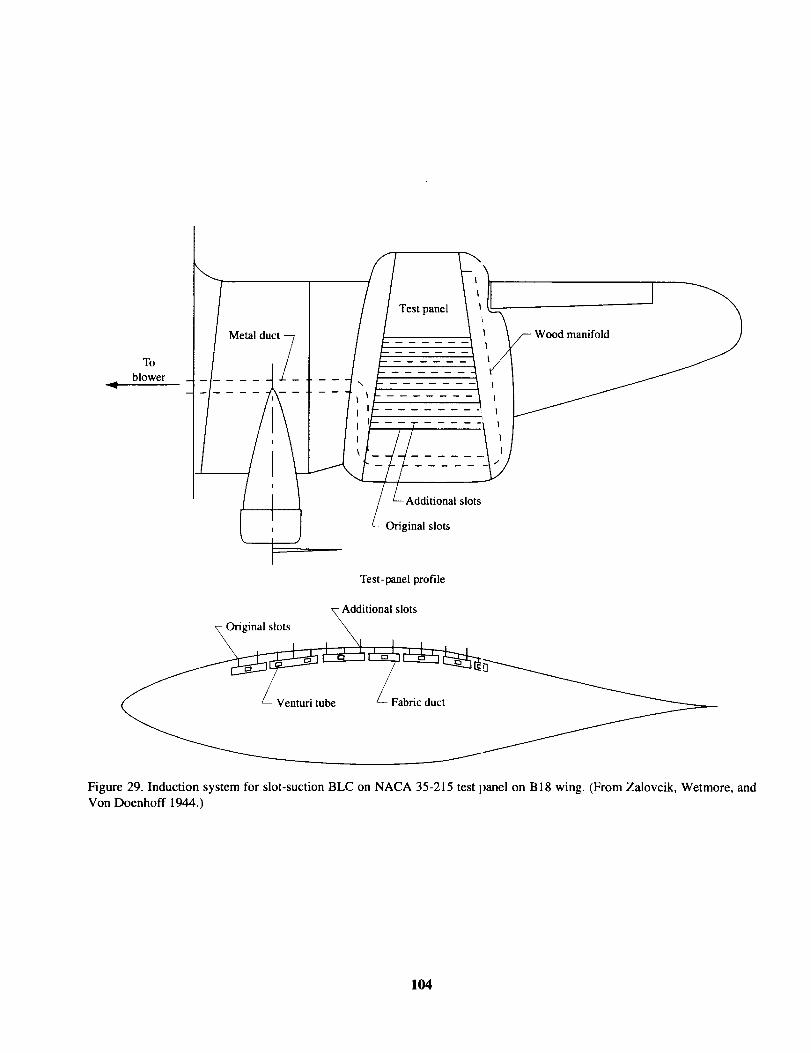
Toblower
\
Test panel
Metal duct manifold
- Additional slots
Original slots
Test-panel profile
_Additional slots
_ Original slots _.
L_ Venturi tube Fabric duct
Figure 29. Induction system for slot-suction BLC on NACA 35-215 test lmnel on B 18 wing. (From Zalovcik, Wetmore, and
Von Doenhoff 1944.)
104

Coarse wire screen
Fine wire screen
Blotting paper
To blower
Figure 30. Sketch of method used to construct permeable surfaces for NACA 64A010 LFC airfoil. (From Braslow, Visconti,
and Burrows 1948.)
105
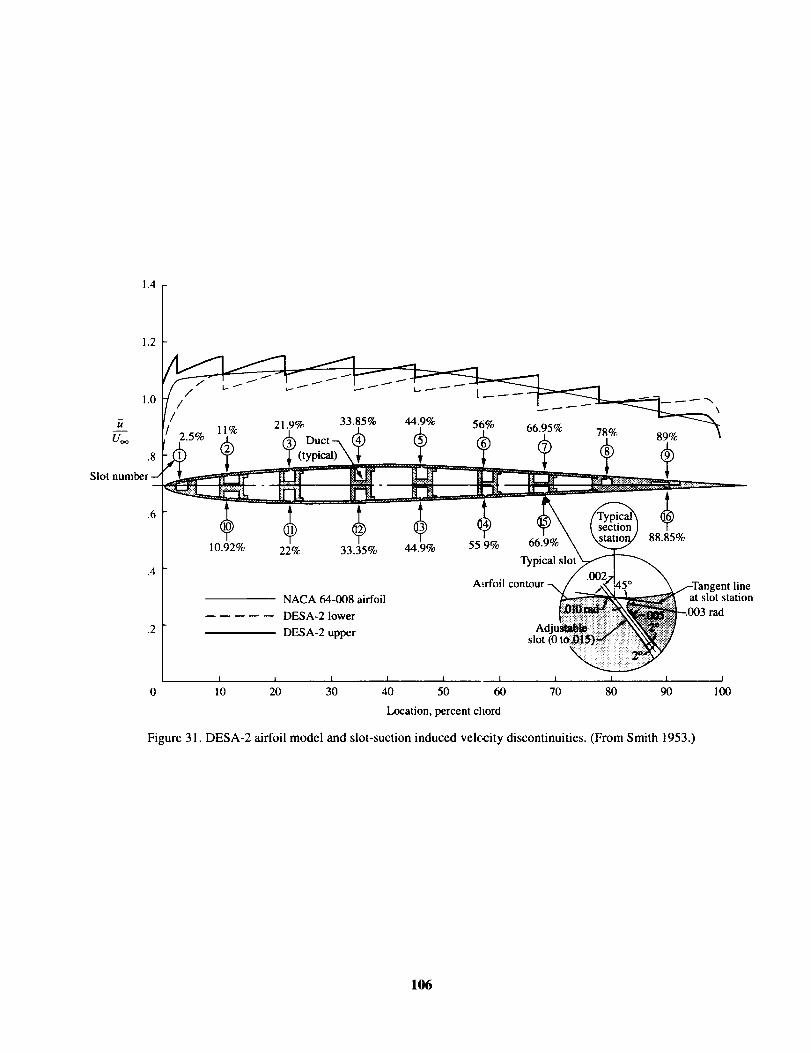
1.4
Slot
1.2
11% 21.9% 33.85% 44.9% 56% 66.95%--_ 78% _c_:,.,,,,....--_ \_,_ -_"_V/
10.92% 22% 33.35% 44.9% 55 9% 66.9% 88.85%
Typical
ALrfoil
NACA 64-008 airfoil
DESA-2 lower
DESA-2 upper Adslot
at slot station
rad
I I I I I 1 I I
0 10 20 30 40 50 60 70 80 90
Location, percent chord
I
I00
Figure 31. DESA-2 airfoil model and slot-suction induced velc_city discontinuities. (From Smith 1953.)
106
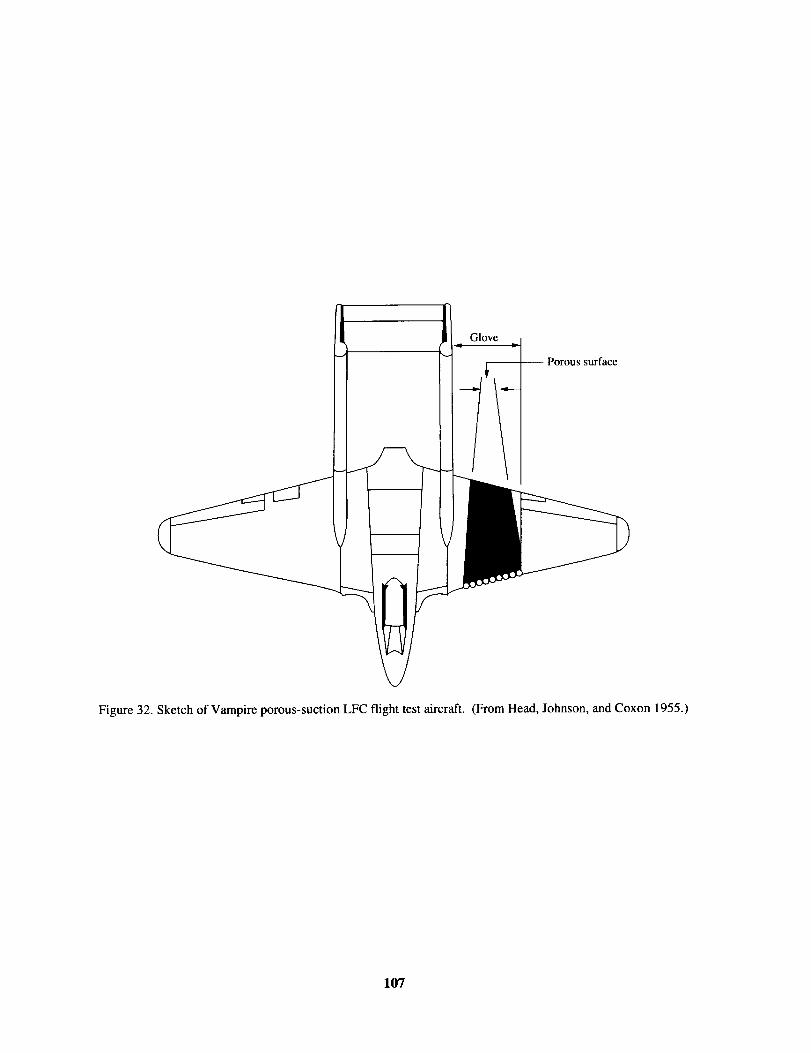
Glove
-- Porous surface
Figure 32. Sketch of Vampire porous-suction LFC flight test aircraft. (From Head, Johnson, and Coxon 1955.)
107
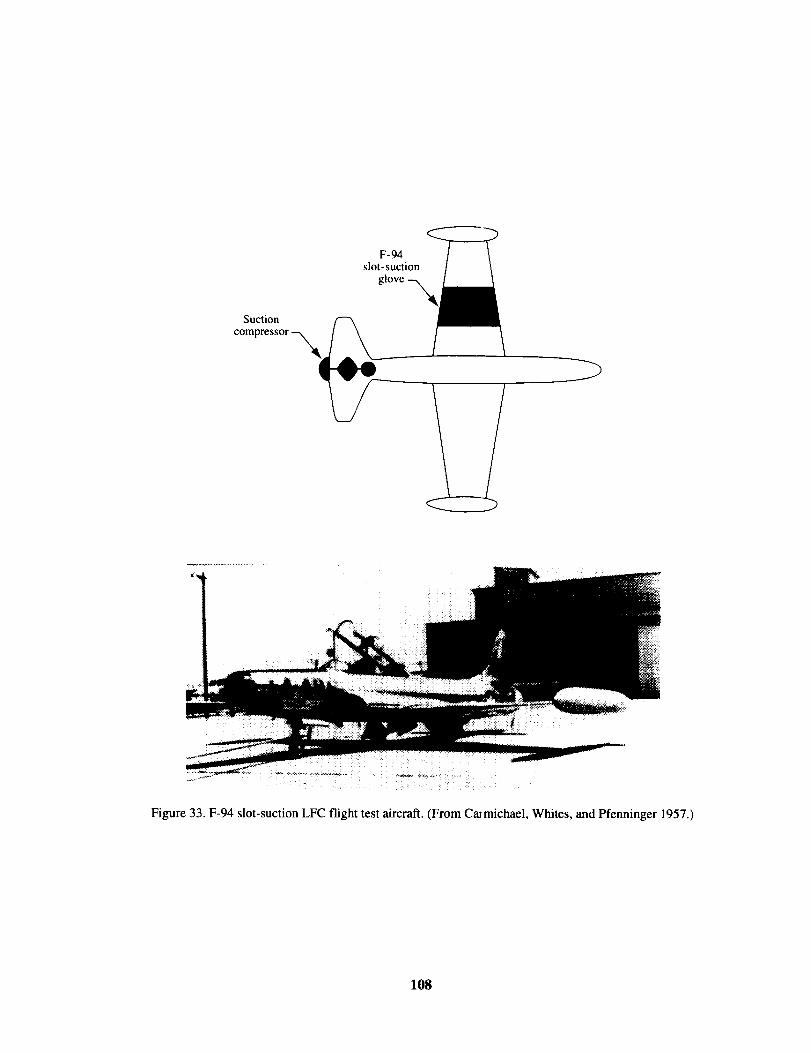
F-94slot- suction
Suction
Figure 33. F-94 slot-suction LFC flight test aircraft. (From CaJmichael, Whites, and Pfenninger 1957.)
108
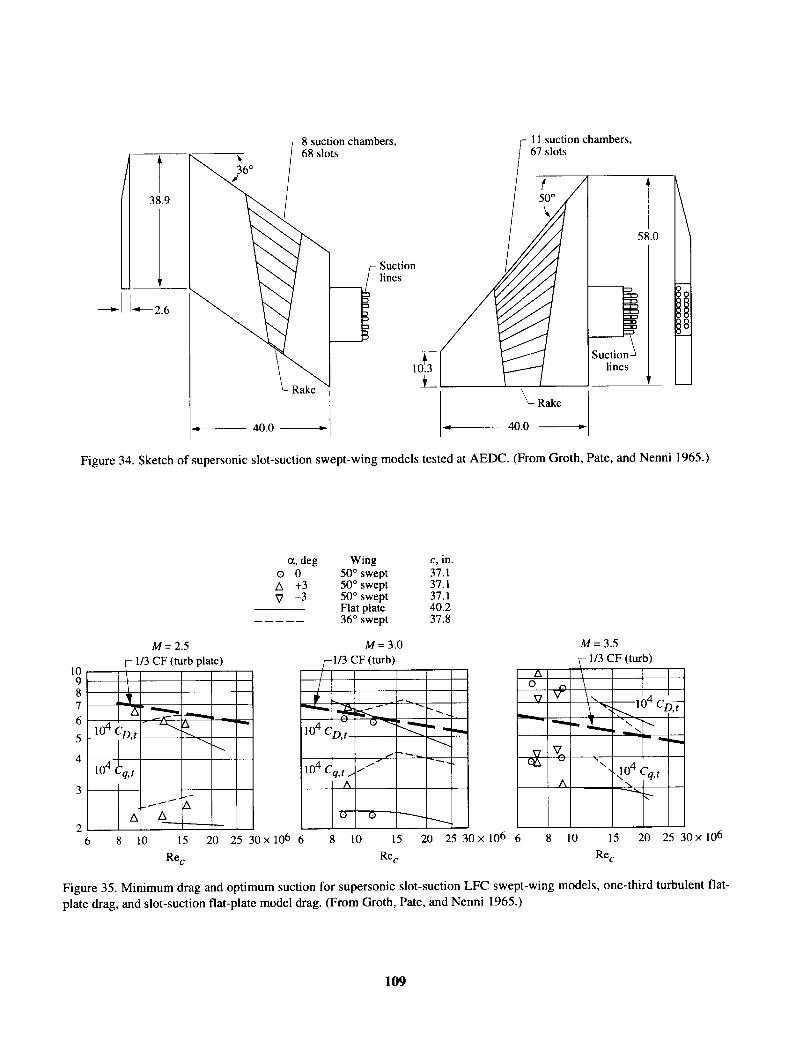
38.9
-_--- 2.6
8 suction chambers, 11 suction chambers,68 slots 67 slots
_I 58.0
,,/ I F- Suction /JTJ I
L Rake"q _t_ L_- Rake
= 40.0 _ 4 40.0
Figure 34. Sketch of supersonic slot-suction swept-wing models tested at AEDC. (From Groth, Pate, and Nenni 1965.)
M= 2.5
1/3 CF (turb plate)!0
87
6 _
5 l°4CD, ti _"_
4 -"104 q,t
o:, deg Wing c, in.O 0 50 ° swept 37.1A +3 50 ° swept 37.1_7 -3 50 ° swept 37.1
Flat plate 40.236 ° swept 37.8
M=3.0 M=3.5
r-l/3 CF (turb) 1/3 CF (turb)
_ V V- x, 14 c
-._--_- 104 _a-"_L._ ,. -- _.. _ \
CD, t - ,, _ ,__x
ogvo .104 Cq, t// " 104 Cq, t
3 _ ] A A "_
26 8 10 15 20 25 30 x 106 6 8 10 15 20 25 30 x 106 6 8 10 15 20 25 _0 x 106
Re c Rec Re c
Figure 35. Minimum drag and optimum suction for supersonic slot-suction LFC swept-wing models, one-third turbulent fiat-
plate drag, and slot-suction flat-plate model drag. (From Groth, Pate, and Nenni 1965.)
109
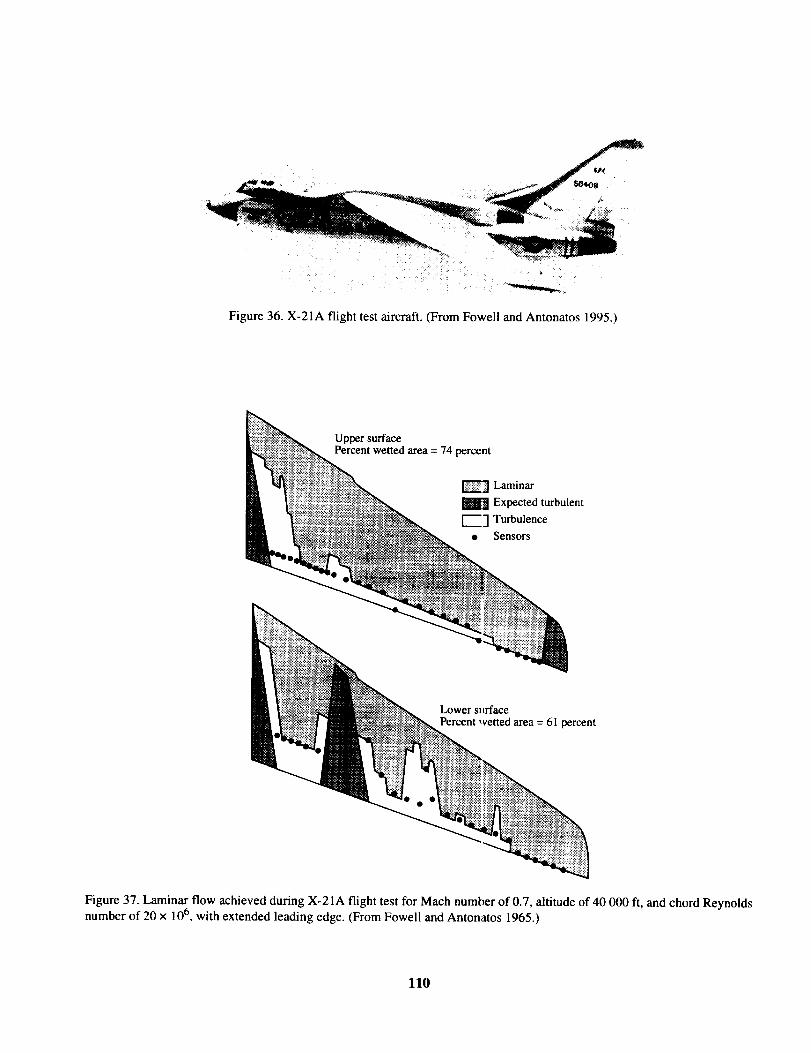
~
Figure 36. X-21A flight test aircraft. (From Fowell and Antonatos 1995.)
Upper surfacePercent wetted area = 74 percent
Laminar
Expected turbulent
Turbulence
• Sensors
Lower sltrface
Percent wetted area = 61 percent
Figure 37. Laminar flow achieved during X-21A flight test for Mach number of 0.7, altitude of 40 000 ft, and chord Reynolds
number of 20 x 106, with extended leading edge. (From Fowell and Antonatos 1965.)
110

///_Tunnel
iling liner
turbulent region
lment flap
Flow -- Tunnel centerline
Leading
Floor
turbulent region /Tunnel floor liner
Figure 38. Swept-wing model, liner, and turbulent regions for TPT LFC experiment. (From Bobbitt et al. 1996.)
Flow
2 3
\
\ _ Wake rake
0 O_1 Boundary-layer rake
.29 .36 .43 .50 .57.61 .68 .74 .81 .87
x/c
Figure 39. Upper surface transition boundaries for Mach numbers of 0.261 to 0.826, chord Reynolds number of 10 x 106, and
full suction. (From Bobbitt et al. 1996.)
111
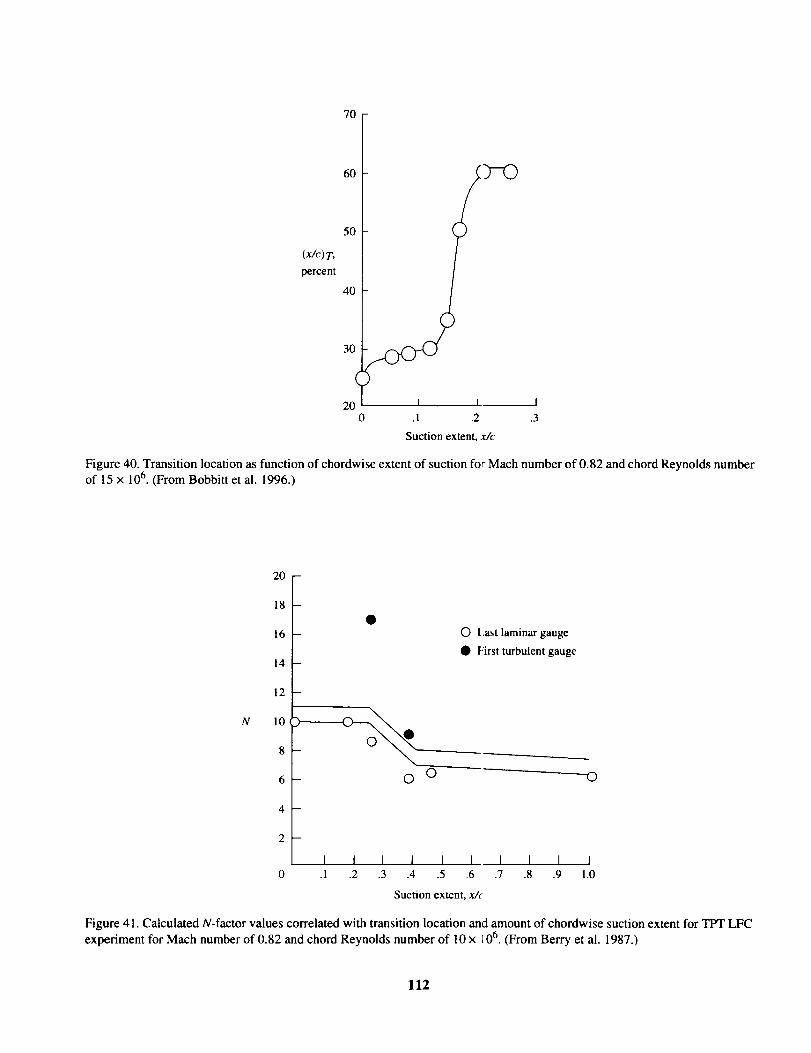
70
(x/c) T,
percent
6O
5O
40
3O
2O
0
I i I
.1 .2 .3
Suction extent, x/c
Figure 40. Transition location as function of chordwise extent of suction for Mach number of 0.82 and chord Reynolds number
of 15 x 106. (From Bobbitt et al. 1996.)
20 -
N
18
16
14
12
10
8
6
4
2
0
O Last laminar gauge
• First turbulent gauge
- O © O
D
I I I I I I I [ I J.1 .2 .3 .4 .5 .6 .7 .8 .9 1.0
Suction extent, x/t
Figure 41. Calculated N-factor values correlated with transition location and amount of chordwise suction extent for TPT LFC
experiment for Mach number of 0.82 and chord Reynolds number of 10 x _06. (From Berry et al. 1987.)
112
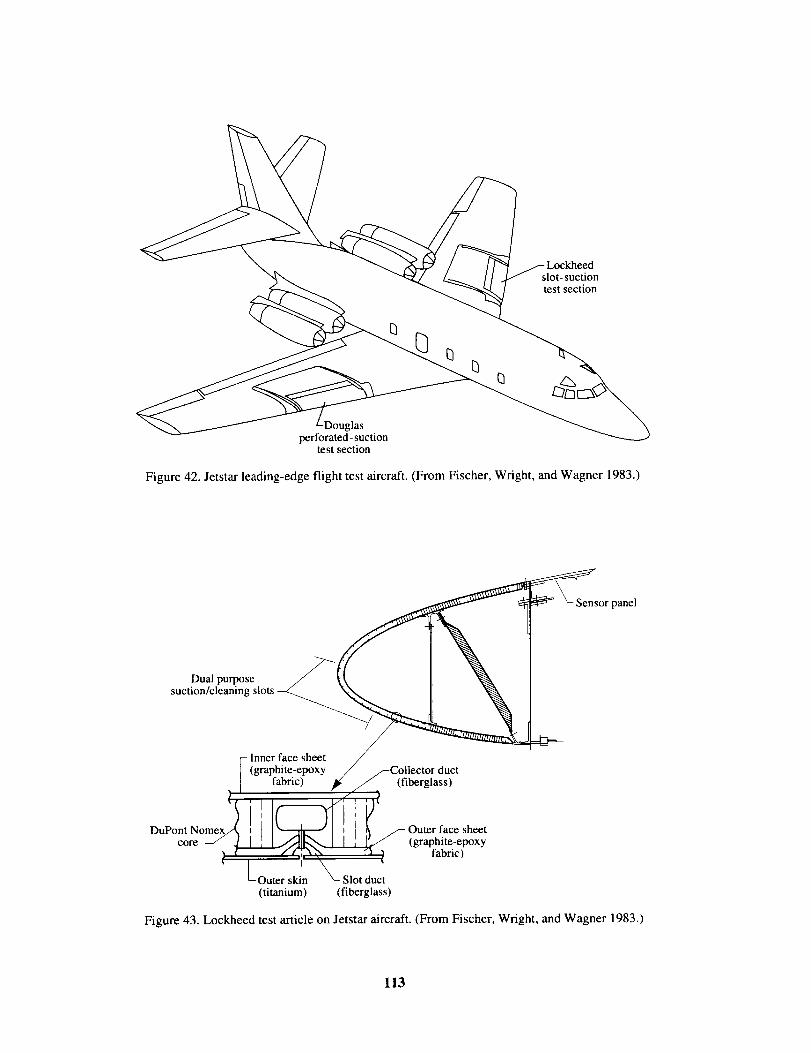
slot- suction
test section
Douglas
perforated- suctiontest section
Figure 42. Jetstar leading-edge flight test aircraft. (From Fischer, Wright, and Wagner 1983.)
panel
Dual purposesuction/cleaning
Inner face sheet
(graphite-epoxyfabric) (fiberglass)
DuPont Nomex Outer face sheet
core (graphite-epoxyfabric)
Outer skin duct
(titanium) (fiberglass)
Figure 43. Lockheed test article on Jetstar aircraft. (From Fischer, Wright, and Wagner 1983.)
113
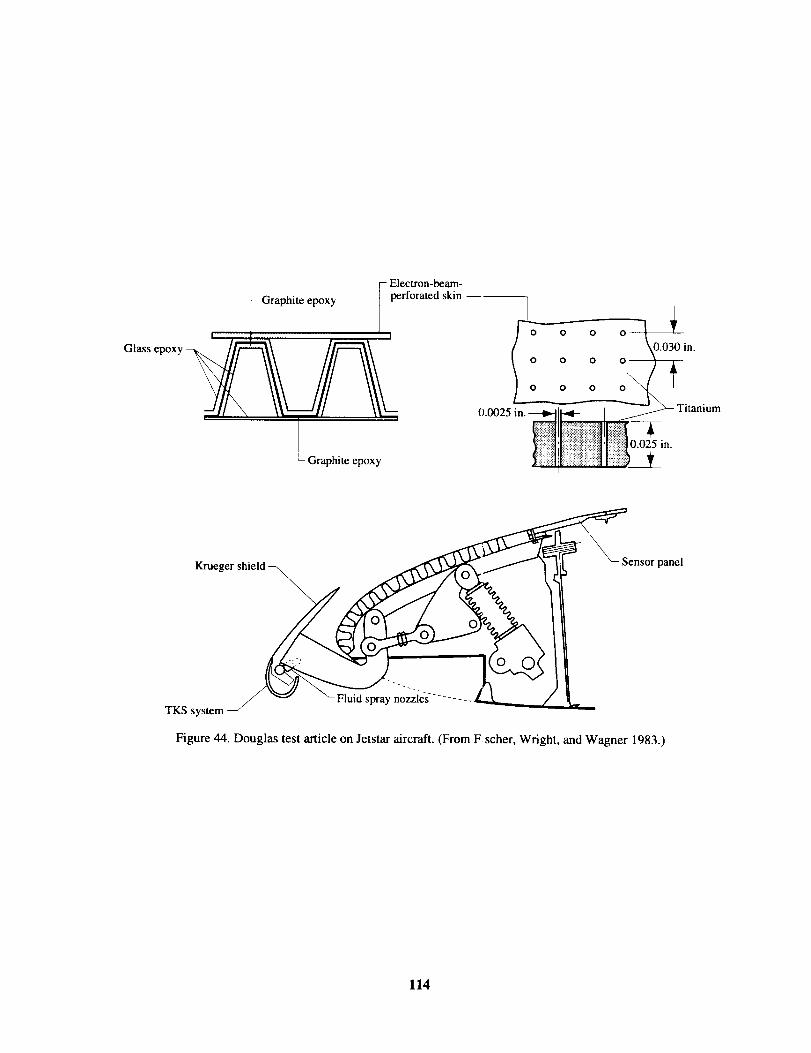
!
Glass epoxy
I-- Electron-beam-
- Graphite epoxy ] perforated skin
!
Graphite epoxy '
in-
Krueger shield _ _ Sensor panel
O
y nozzlesTKS system
Figure 44. Douglas test article on Jetstar aircraft. (From F scher, Wright, and Wagner 1983.)
114
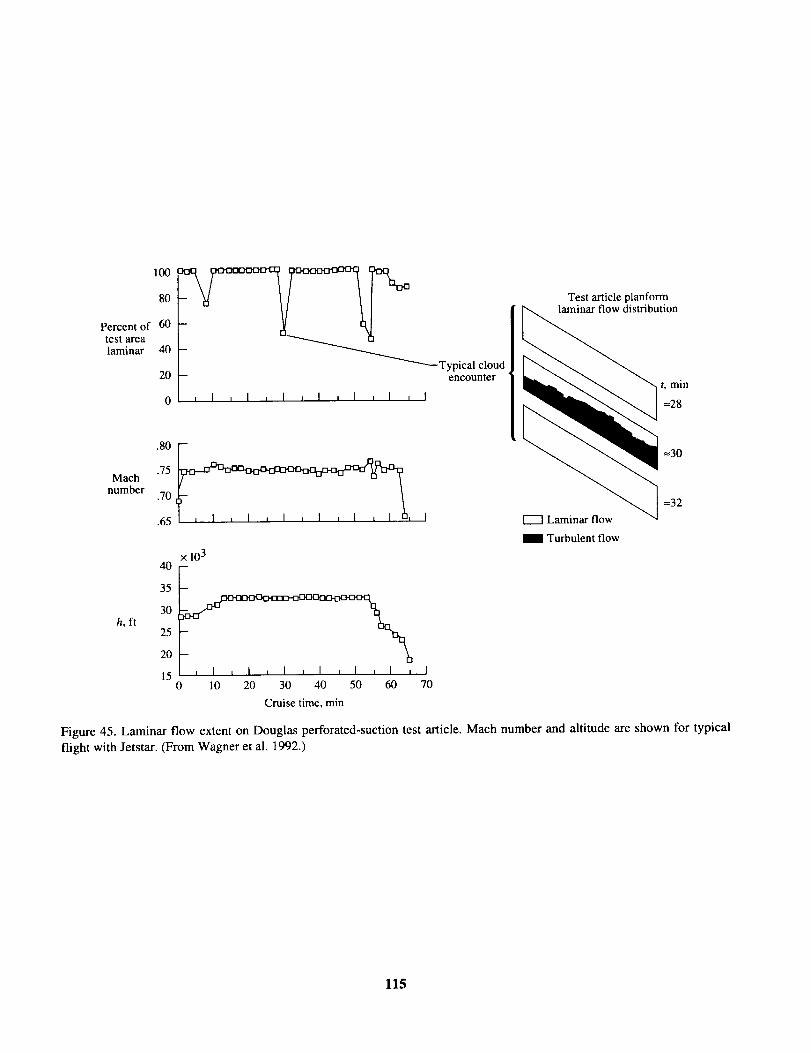
100
8O
Percent of 60
test arealaminar 40
20
0
_Typical cloud
- encounter
, I , I i I , I , I , I , I
Test article planformlaminar flow distribution
t, min
=28
Mach
number
h, ft
.75
.70
.65 i
x 10340 -
35 -
25
20
15 , I t I , I i I , I , I ,0 10 20 30 40 50 60
Cruise time, min
=30
r-----1Laminar flow
I Turbulent flow
--32
I
70
Figure 45. Laminar flow extent on Douglas perforated-suction test article. Mach number and altitude are shown for typical
flight with Jetstar. (From Wagner et al. 1992.)
115

JPressure
taps
Hot films
)
Perforatedtitanium sheet
Resin
Flutes
-icingand cleaning panel
Original wing
Figure 46. Dassult Falcon 50 HLFC flight demonstrator, instrumentatiol_ package, glove, and leading-edge design. (From
Bulgubure and Areal 1992; Courty, Bulgubure, and Areal 1993.)
116
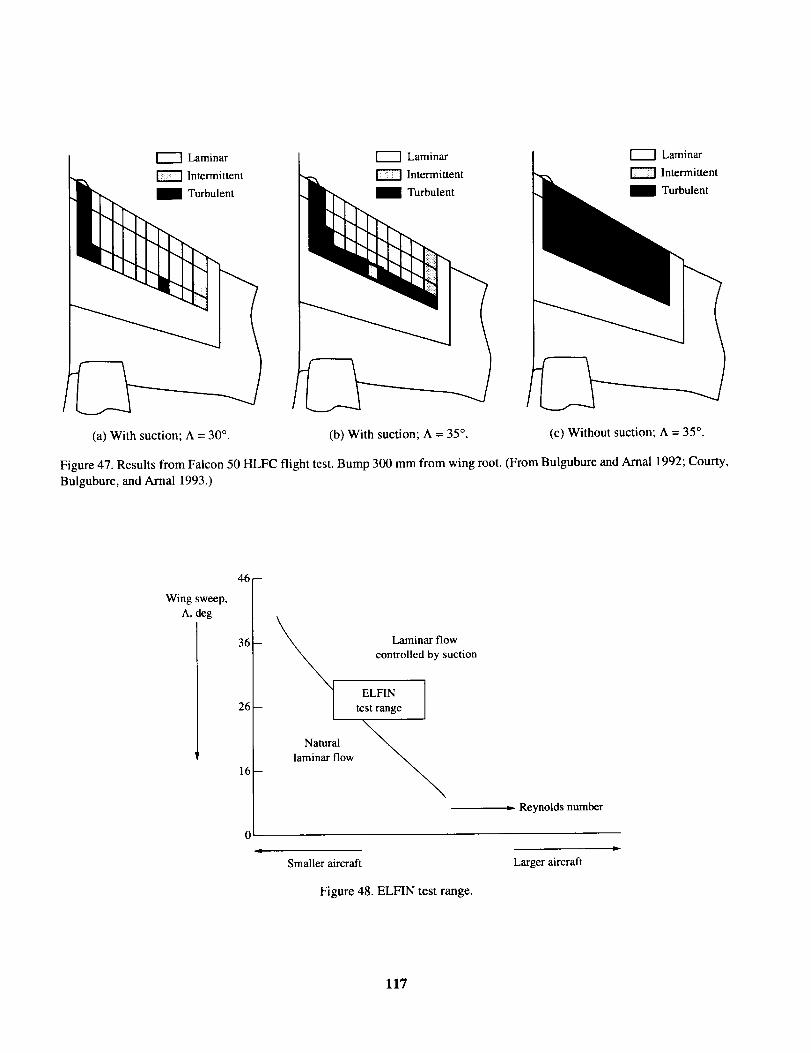
Laminar
_ Intermittent
I"----] Laminar
Intermittent
Turbulent
1"---"] Laminar
Intermittent
I Turbulent
(a) With suction; A = 30 °. (b) With suction; A = 35 °. (c) Without suction; A = 35 °.
Figure 47. Results from Falcon 50 HLFC flight test. Bump 300 mm from wing root. (From Buigubure and Amal 1992; Courty,
Bulgubure, and Arnal 1993.)
Wing sweep,
A, deg
46-
36-
26-
16-
0
_U
Natural
laminar flow
Laminar flow
controlled by suction
ELFIN
test range
t. Reynolds number
Smaller aircraft
Figure 48. ELFIN test range.
Larger aircraft
117

I
OOI|O0 |g_O
H
- nsors
e survey probe
c_Attachment-lineflow sensors
f- Strip-a-tube belts
_Flush pressure taps
Figure 49. Boeing 757 flight test aircraft with HLFC test section; static pr:ssure, hot-film, and wake-survey instrumentation;
and attachment-line flow sensor instrumentation. (From Maddaion 1990, 1 )91 ; Collier 1993.)
118

HLFC
suction panel -Hot-film indication
O Laminar
(D Intermittent
• Turbulent
0102030
5060
65 70
/I
(a) Laminar flow extent; M = 0.82; h = 38 600 ft; C L = 0.48.
Heightabove
wing
ake
rated to 29-percent localdrag reduction extrapolatesto = 6-percent airplane drag
(b) Drag reduction; M = 0.82; C L = 0.475.
Figure 50. Sample laminar flow extent and drag reduction obtained on Boeing 757 HLFC flight tests. (From Maddalon 1990,
1991; Collier 1993.)
119
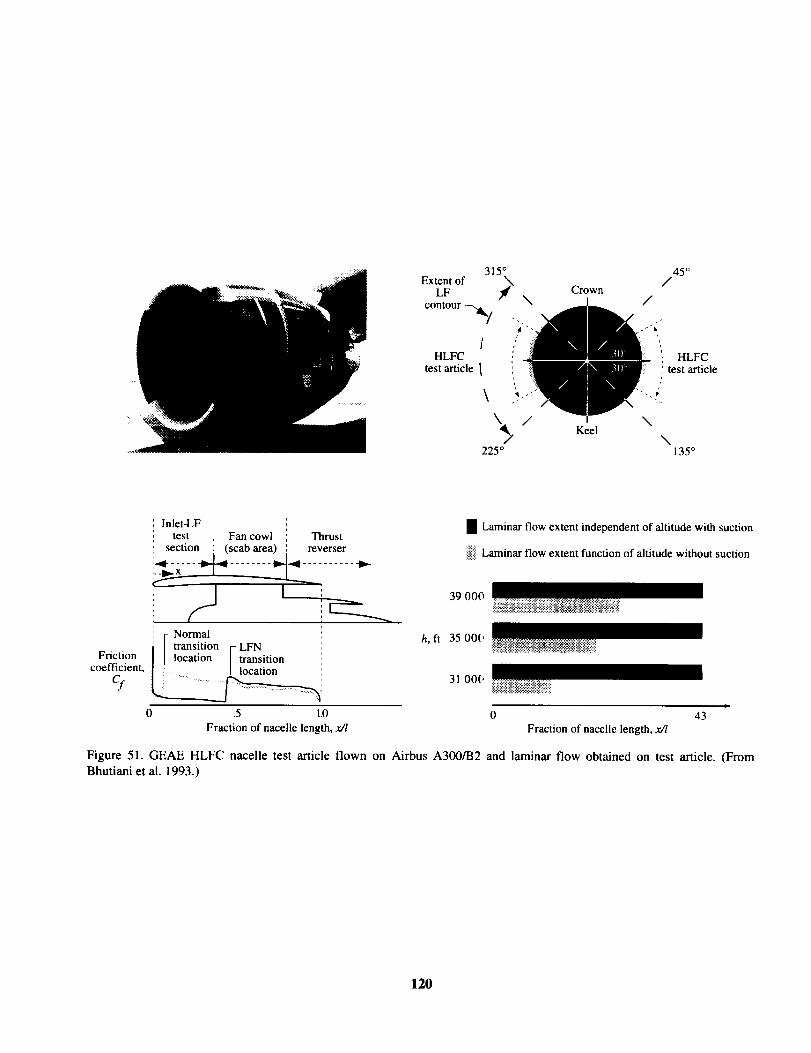
315°Extentof \¢
LF \contour --_ "-.
lHLFC
test article 1
225 °
45 °/
Crown/
_L
'I HLFCi test article
f
"-.r
i \Keel
\135 °
Frictioncoefficient,
c/
Inlet-LF i ',
test ! Fan cowl ! Thrustsection : (scab area) : reverser
: ! I
: [- Norn?ali / transmon VLFNI / location ! trans!tion
1 Laminar flow extent independent of altitude with suction
i_iiiLaminar flow extent function of altitude without suction
39 000
h, ft 35 00('
31 00(,
0 .5 1.0 0 43
Fraction of nacelle length, x// Fraction of nacelle length, x//
Figure 51. GEAE HLFC nacelle test article flown on Airbus A300/B2 and laminar flow obtained on test article. (From
Bhutiani et al. 1993.)
120
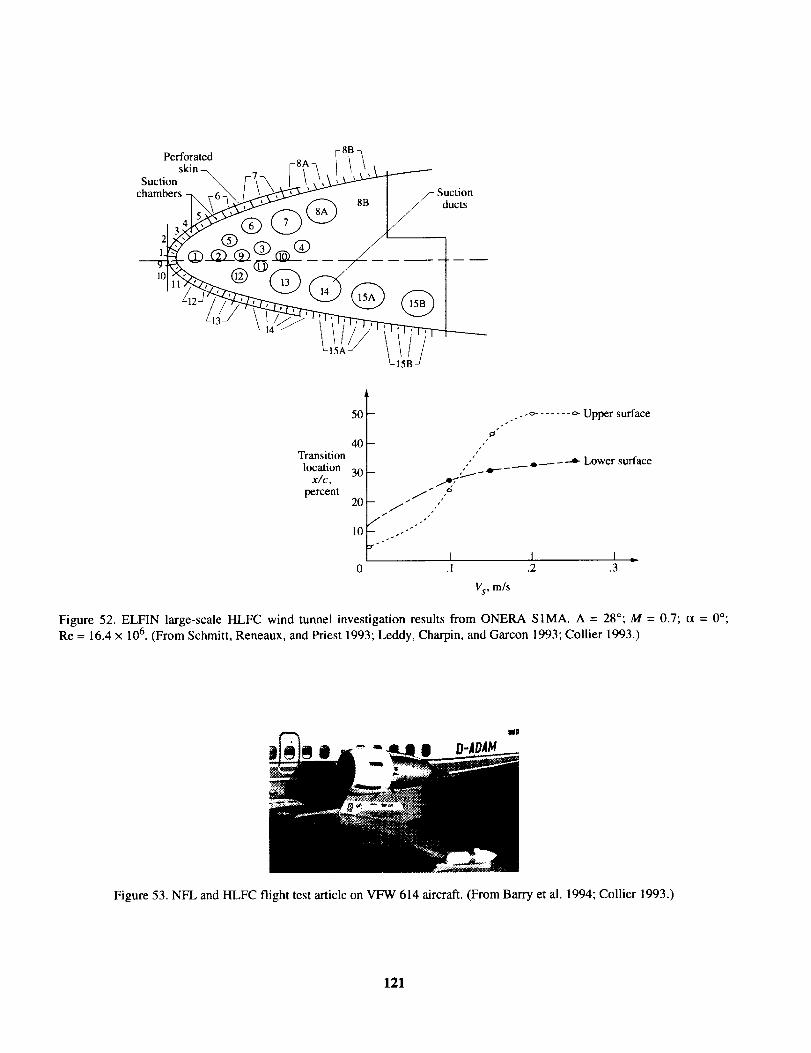
Perforated (-8B
skin-_. 7 [8A-_ _ t,.\ _ ,_Suction _ F_ |l,x,_
chambers q,, ,-6_x',,_ ] _ ^_ ] /- Suction
10 ......
Transitionlocation
x/c,
percent
5O
40
30
20
10
,-", o....... o- Upper surface
¢
• _ Lower surface
J
I I I ,,0 .1 .2 .3
Vs, m/s
Figure 52. ELFIN large-scale HLFC wind tunnel investigation results from ONERA S1MA. A = 28°; M = 0.7; ct = 0%
Re = 16.4 x 10⁶. (From Schmitt, Reneaux, and Priest 1993; Leddy, Charpin, and Garcon 1993; Collier 1993.)
2
Figure 53. NFL and HLFC flight test article on VFW 614 aircraft. (From Barry et al. 1994; Collier 1993.)
121

-Cp 0
t_ = 30 °
[] 0 Flight test data
-- Euler calculation
, = 30°
4°°i i
0 .5 1.0
x/l
0
0 = 30 °
) 4ooi i
0 .5 1.0
x/l
Figure 54. Measured pressure on nacelle test article. (From Barry et al. 1994.)
122
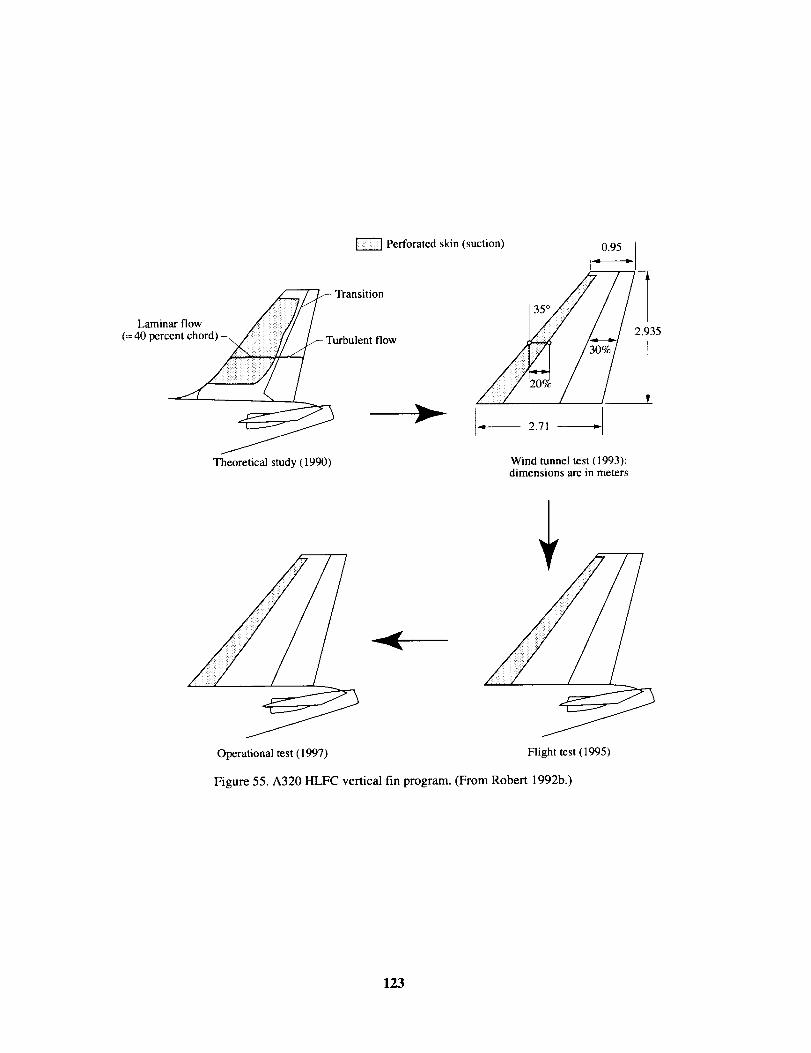
Laminar flow
(=40 percent chord) -_,
Theoretical study (1990)
Perforated skin (suction)
flow _/_ 2935
_ 2.71
Wind tunnel test (1993);dimensions are in meters
Operational test (1997) Flight test (1995)
Figure 55. A320 HLFC vertical fin program. (From Robert 1992b.)
123

t' _- Baseline A320
-_ J _HLFC A320
_/c, p:rcent 1
Transitionlocation,
x/c
.5
.4
.3
.2
.1
0
_ HLFC A320 fin\
A320 fin
1 1 I
.1 .2
Suction, Vs, m/sec
.3
Suction distribution
,Lx/c
.2
o I -v,
Figure 56. A320 HLFC vertical fin analysis. M = 0.78; Re = 24 x 106. (F "om Thibert, Reneaux, and Schmitt 1990; Redeker,
Quast, and Thibert 1992.)
124
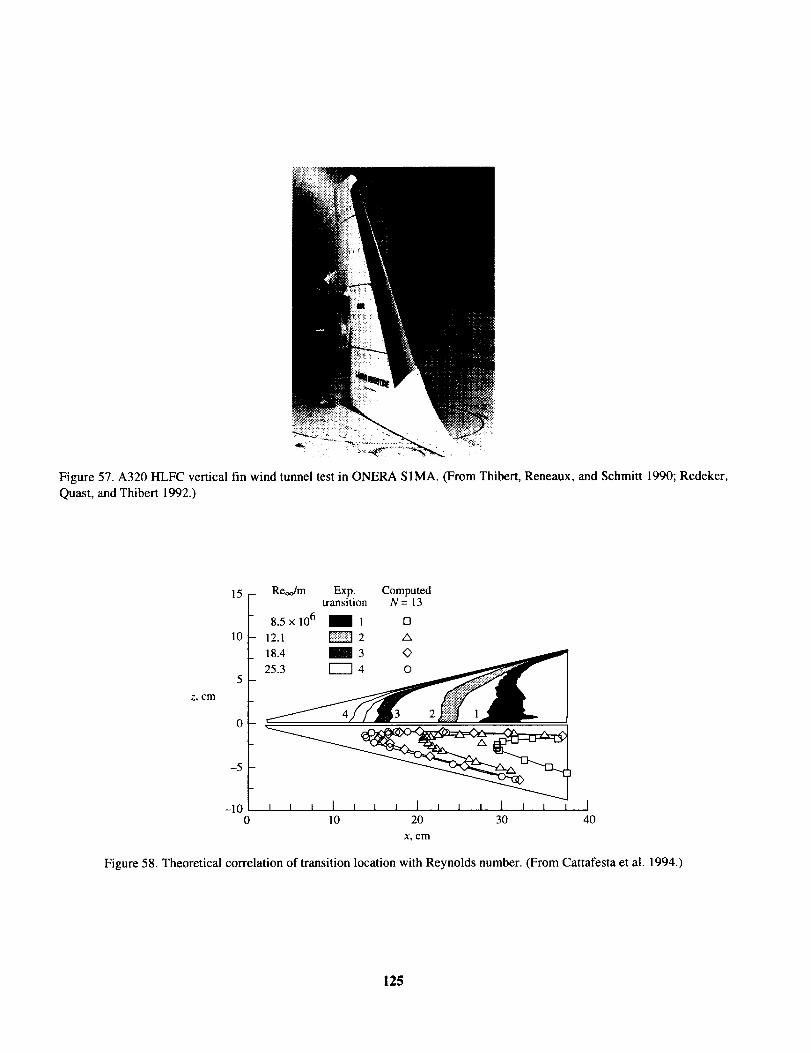
Figure 57. A320 HLFC vertical fin wind tunnel test in ONERA S1MA. (From Thibert, Reneaux, and Schmitt 1990; Redeker,
Quast, and Thibert 1992.)
Z, cm
15
10
0
-5
RecJm Exp. Computedtransition N = 13
8.5 x 10⁶ 1 1 []
12.1 _ 2 A
18.4 1 3 _
-]o i i I I I I i I J J i I t i i I0 10 20 30 40
X, cm
Figure 58. Theoretical correlation of transition location with Reynolds number. (From Cattafesta et al. 1994.)
125

EC92-09032-2
(a) Single-seat aircraft used for laminaJ airflow studies.
Active glove
Liquid crystaltest section ---
Video camera
(b) Aircraft with perforated-suction glove. (From Anderson and Bohn-Meyer 1992.)
Figure 59. F-16XL Ship 1.
126
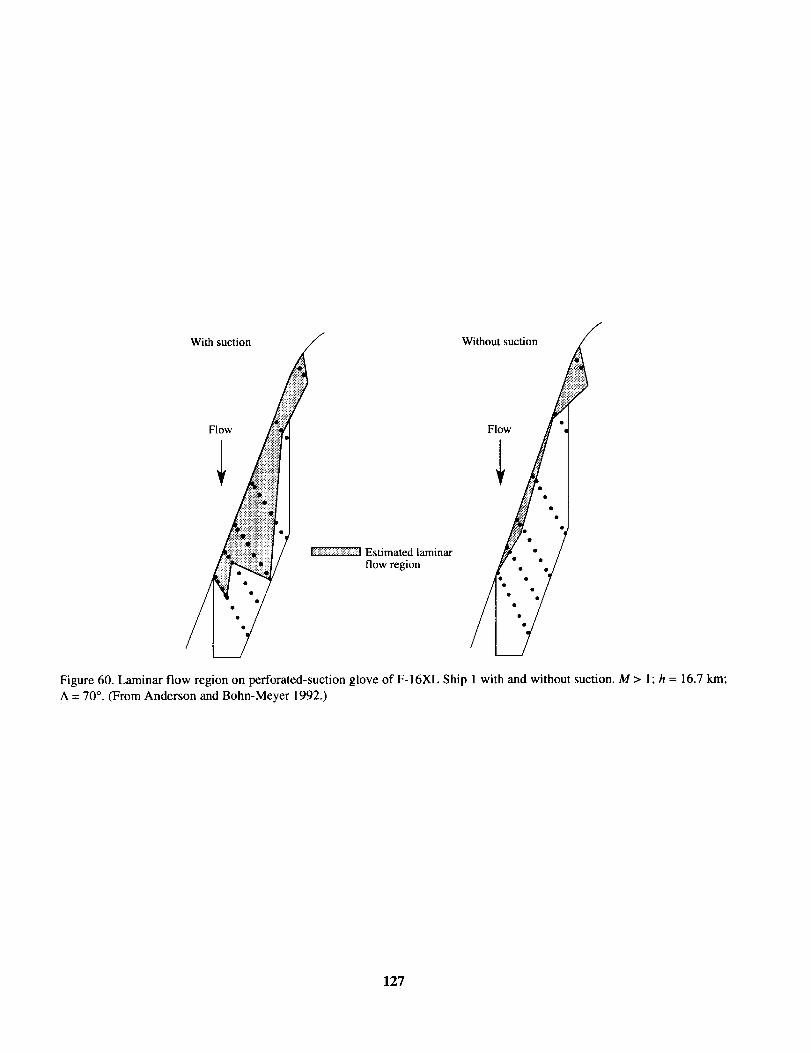
Withsuction Withoutsuction
Flow Flowle
Estimated laminarflow region
Figure 60. Laminar flow region on perforated-suction glove of F-16XL Ship 1 with and without suction. M > 1 ; h = 16.7 km;
A = 70 °. (From Anderson and Bohn-Meyer 1992.)
127
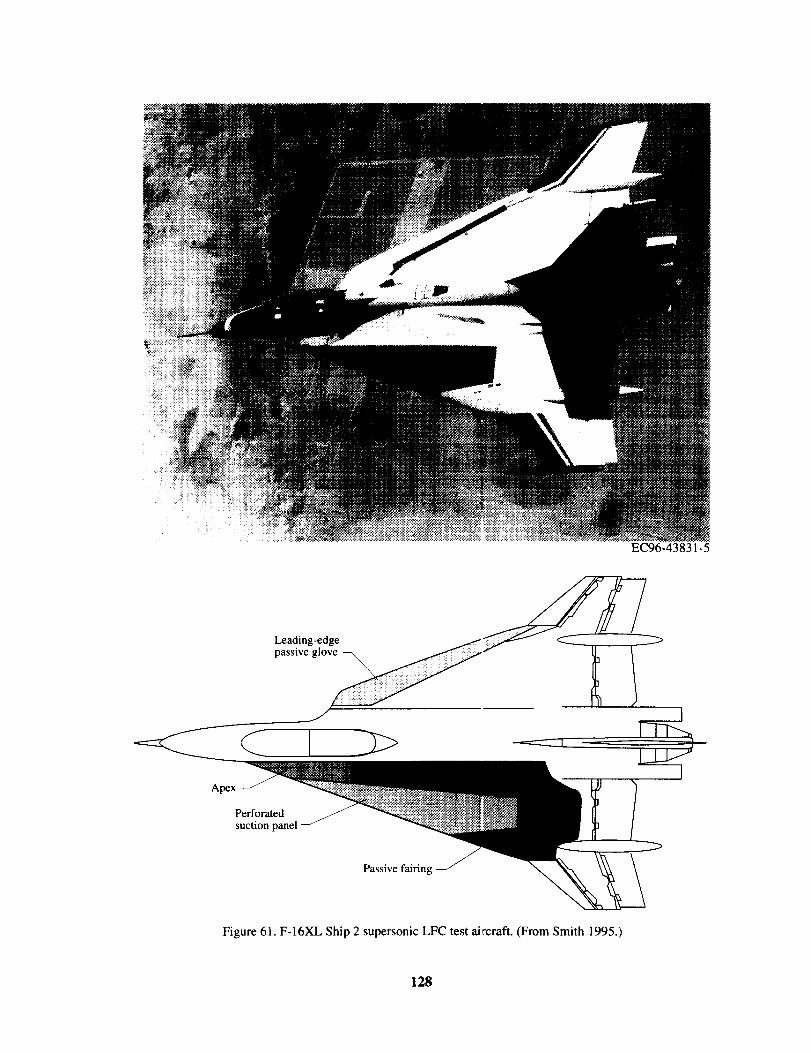
EC96-43831-5
s 5Z> -_=
Apex
Perforated
suction panel
Passive fairing
Figure 61. F-16XL Ship 2 supersonic LFC test aircraft. (From Smith 1995.)
128
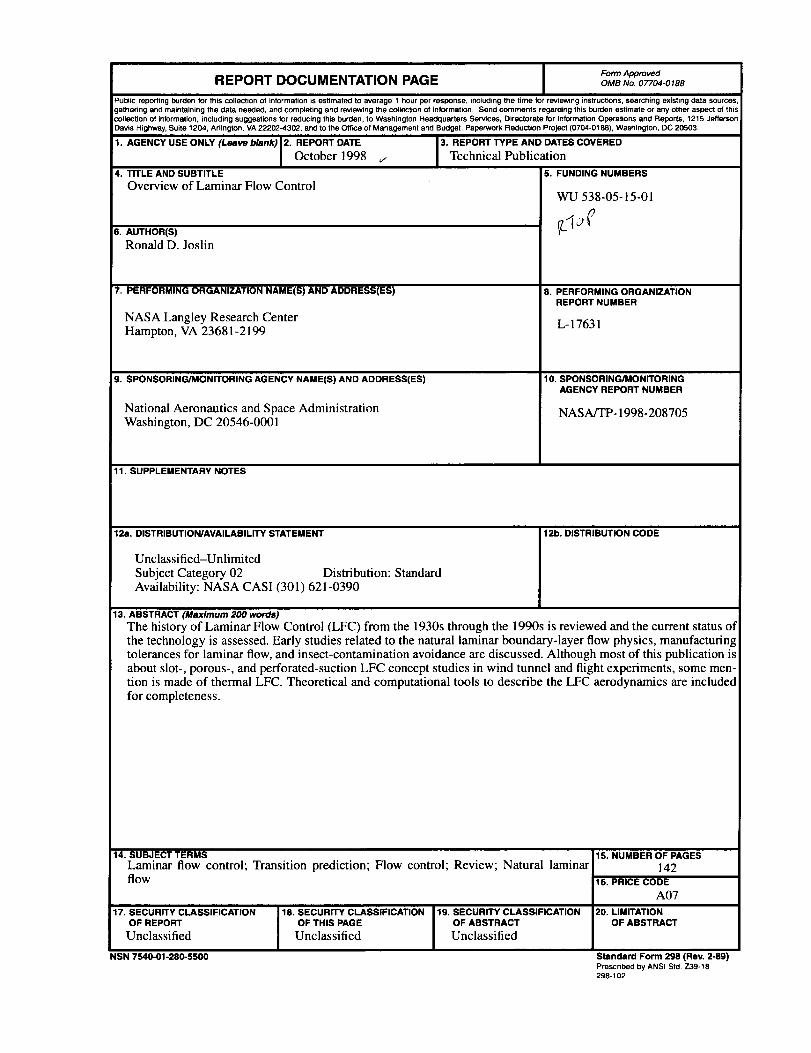
Form ApprovedREPORT DOCUMENTATION PAGE OMaNo.o_o4-om8
Public reporting burden for this collection of information is estimated to average 1 hour per response, including the time for reviewing instructions, searching existing data sources,gathering and maintaining the data needed, and completing and reviewing the collection of info_'mation. Send comments regarding this burden estimate or any other aspect of thiscollection of information, including suggestions for reducing this b_rden, to Washington Headquarters Services, Directorate for Information Operations and Reports, 1215 JeffersonDavis Highway, Suite 1204, Arlington, VA 22202-4302, and to the Office of Management and Budget, Paperwork ReduCtion Project (0704-O188), Washington, DC 20503.
1. AGENCY USE ONLY (Leave blank) 2. REPORT DATE
October 1998
4. TITLE AND SUBTITLE
Overview of Laminar Flow Control
3. REPORT TYPE AND DATES COVERED
Technical Publication
S. AUTHOR(S)
Ronald D. Joslin
7. PERFORMING ORGANIZATION NAME(S) AND ADDRESS(ES)
NASA Langley Research Center
Hampton, VA 23681-2199
9. SPONSORING/MONITORING AGENCY NAME(S) AND ADDRESS(ES)
National Aeronautics and Space Administration
Washington, DC 20546-0001
S. FUNDING NUMBERS
WU 538-05-15-01
8. PERFORMING ORGANIZATIONREPORT NUMBER
L-17631
10. SPONSORING/MONITORING
AGENCY REPORT NUMBER
NASA/TP-1998-208705
11. SUPPLEMENTARY NOTES
12a. DISTRIBUTION/AVAILABILITY STATEMENT
Unclassified-Unlimited
Subject Category 02 Distribution: StandardAvailability: NASA CASI (301) 621-0390
12b. DISTRIBUTION CODE
13. ABSTRACT (Maximum 200 words)
The history of Laminar Flow Control (LFC) from the 1930s through the 1990s is reviewed and the current status ofthe technology is assessed. Early studies related to the natural laminar boundary-layer flow physics, manufacturingtolerances for laminar flow, and insect-contamination avoidance are discussed. Although most of this publication isabout slot-, porous-, and perforated-suction LFC concept studies in wind tunnel and flight experiments, some men-tion is made of thermal LFC. Theoretical and computational tools to describe the LFC aerodynamics are includedfor completeness.
14. SUBJECT TERMS
Laminar flow control; Transition prediction; Flow control; Review; Natural laminarflow
17. SECURITY CLASSIFICATION
OF REPORT
Unclassified
NSN 7540-01-280-5500
18. SECURITY CLASSIFICATION
OF THIS PAGE
Unclassified
15. NUMBER OF PAGES
14216. PRICE CODE
A07
19. SECURITY CLASSIFICATION 20. LIMITATION
OF ABSTRACT OF ABSTRACT
Unclassified
Standard Form 298 (Rev. 2-89)Proscribed by ANSI Std. Z39-18298-102