Overview of Key Findings 2007 - Monitoring the...
76
NATIONAL INSTITUTE ON DRUG ABUSE Monitoring the Future National Results on Adolescent Drug Use Overview of Key Findings 2007 National Institutes of Health U.S. Department of Health and Human Services
Transcript of Overview of Key Findings 2007 - Monitoring the...

NATIONAL INSTITUTE ON DRUG ABUSE
Monitoring the FutureNational Results on Adolescent Drug Use
Overview of Key Findings
2007
National Institutes of HealthU.S. Department of Health and Human Services

MONITORING THE FUTURE
NATIONAL RESULTS ON ADOLESCENT DRUG USE
Overview of Key Findings, 2007
by
Lloyd D. Johnston, Ph.D. Patrick M. O'Malley, Ph.D. Jerald G. Bachman, Ph.D.
John E. Schulenberg, Ph.D.
The University of Michigan Institute for Social Research
National Institute on Drug Abuse 6001 Executive Boulevard
Bethesda, Maryland 20892
U.S. DEPARTMENT OF HEALTH AND HUMAN SERVICES National Institutes of Health

This publication was written by the principal investigators and staff of The Monitoring the Future project, at the Institute for Social Research, the University of Michigan, under Research Grant No. 3 R01 DA 01411 from the National Institute on Drug Abuse. The findings and conclusions in this report are those of the authors and do not necessarily represent the views of the NIH.
Public Domain Notice All material appearing in this volume is in the public domain and may be reproduced or copied without permission from the National Institute on Drug Abuse or the authors. Citation of the source is appreciated.
Recommended Citation Johnston, L. D., O’Malley, P. M., Bachman, J. G., & Schulenberg, J. E. (2008). Monitoring the Future national results on adolescent drug use: Overview of key findings, 2007 (NIH Publication No. 08-6418). Bethesda, MD: National Institute on Drug Abuse.
National Institute on Drug Abuse NIH Publication No. 08-6418
April 2008

Contents
Introduction.............................................................................................................................1
Study Design and Methods.....................................................................................................3
Overview of Key Findings......................................................................................................5
Specific Results by Drug
Any Illicit Drug.........................................................................................................10 Marijuana..................................................................................................................12 Inhalants....................................................................................................................14 LSD...........................................................................................................................16 Cocaine .....................................................................................................................18 Crack.........................................................................................................................20 Amphetamines ..........................................................................................................22 Methamphetamine and Crystal Methamphetamine (Ice) .........................................24 Heroin .......................................................................................................................26 Narcotics other than Heroin......................................................................................28 Tranquilizers .............................................................................................................30 Sedatives (Barbiturates)............................................................................................32 Ecstasy (MDMA) and Other “Club Drugs”..............................................................34 Alcohol .....................................................................................................................36 Cigarettes ..................................................................................................................38 Smokeless Tobacco ..................................................................................................40 Steroids .....................................................................................................................42
Subgroup Differences ...........................................................................................................44
Tables Covering All Drugs
1. Trends in Lifetime Prevalence of Use of Various Drugs ...................................46 2. Trends in Annual Prevalence of Use of Various Drugs .....................................51 3. Trends in 30-Day Prevalence of Use of Various Drugs .....................................55 4. Trends in 30-Day Prevalence of Daily Use of Various Drugs ...........................58 5. Trends in Harmfulness of Drugs as Perceived by 8th Graders................................................................................................................59 6. Trends in Harmfulness of Drugs as Perceived by 10th Graders................................................................................................................60
Contents (continued) 7. Trends in Harmfulness of Drugs as Perceived by 12th Graders................................................................................................................61 8. Trends in Disapproval of Drug Use by 8th Graders ...........................................63 9. Trends in Disapproval of Drug Use by 10th Graders .........................................64 10. Trends in Disapproval of Drug Use by 12th Graders .........................................65 11. Trends in Availability of Drugs as Perceived by 8th Graders................................................................................................................67 12. Trends in Availability of Drugs as Perceived by 10th Graders................................................................................................................68 13. Trends in Availability of Drugs as Perceived by 12th Graders................................................................................................................69
Introduction Monitoring the Future (MTF) is a long-term study of American adolescents, college students, and adults through age 45. The study, ongoing on an annual basis since its inception in 1975, is conducted by the University of Michigan’s Institute for Social Research and is supported under a series of investigator-initiated, competing research grants from the National Institute on Drug Abuse. The need for a study such as MTF is evident. Substance use by American young people has proven to be a rapidly changing phenomenon, requiring frequent assessments and reassessments. Since the mid-1960s, when illicit drug use burgeoned in the normal youth population, it has remained a major concern for the nation. Smoking, drinking, and illicit drug use are leading causes of morbidity and mortality, both during adolescence as well as later in life. How vigorously the nation responds to teenage substance use, how accurately it identifies the sub-stance abuse problems that are emerging, and how well it comes to understand the effectiveness of the many policy and intervention efforts largely depend on the ongoing collection of valid and reliable data. Monitoring the Future is designed to generate such data in order to provide an accurate picture of what is happening in this domain and why. It has served that function well for the past 32 years. The 2007 MTF survey encompassed nearly 50,000 eighth-, 10th-, and 12th-grade students in over 400 secondary schools nationwide. The first published results are presented in this report. Recent trends in the use of licit and illicit drugs are emphasized, as well as trends in the levels of perceived risk and personal disapproval associated with each drug. This study has shown these beliefs and attitudes to be particularly important in explaining trends in use. In addition, trends in the perceived availability of each drug are presented. A synopsis of the design and methods used in the study and an overview of the key results from the 2007 survey follow this introductory section. Next is a section for each individual drug class, providing figures that show trends in the overall proportions of students at each grade level (a) using the drug, (b) seeing a “great risk” associated with its use, (c) disapproving of its use, and (d) saying that they think
they could get it “fairly easily” or “very easily” if they wanted to. The years for which data on each grade are available are 1975–2007 for 12th graders and 1991–2007 for 8th and 10th graders, who were first included in the study in 1991. The tables at the end of this report provide the statistics underlying the figures; in addition, they present data on lifetime, annual, 30-day, and (for selected drugs) daily prevalence.1 For the sake of brevity, we present these prevalence statistics here only for the 1991–2007 interval, but statistics on 12th graders are available for earlier years in other publications from the study. For each prevalence period, the tables indicate which of the most recent one-year changes (between 2006 and 2007) are statistically significant. The graphic depictions of multiyear trends often indicate gradual, continuing change that may not reach significance in a given year. A much more extensive analysis of the study’s findings on secondary school students may be found in Volume I, the second monograph in this series, which will be published later in 2008.2 Volume I also contains a more complete description of the study’s methodology, as well as an appendix explaining how to test the significance of differences between groups or of trends over time. The most recent such volume is always available on the study’s Web site under Publications. The study’s findings on American college students and adults through age 45 are not covered in this early Overview report because the 2007 data from those populations are available later than the data from secondary school students. They will be
1Prevalence refers to the proportion or percentage of the sample reporting use of the given substance on one or more occasions in a given time interval—e.g., lifetime, past 12 months, or past 30 days. For most drugs, the prevalence of daily use refers to reported use on 20 or more occasions in the past 30 days. 2The most recent publication in this series is: Johnston, L. D., O’Malley, P. M., Bachman, J. G., & Schulenberg, J. E. (2007). Monitoring the Future national survey results on drug use, 1975–2006: Volume I, Secondary school students (NIH Publication No. 07-6205). Bethesda, MD: National Institute on Drug Abuse, 699 pp.
1

covered in Volume II, the third monograph in this annual series, which will be published later in 2008.3 Volume II also contains a chapter dealing with national trends in HIV/AIDS-related risk and protective behaviors among young adults 21 to 30 years old. Volumes in these annual series are available from the National Clearinghouse for Alcohol and Drug information at (800) 729-
3The most recent in this series is: Johnston, L. D., O’Malley, P. M., Bachman, J. G., & Schulenberg, J. E. (2007). Monitoring the Future national survey results on drug use, 1975–2006: Volume II, College students and adults ages 19–45 (NIH Publication No. 07-6206). Bethesda, MD: National Institute on Drug Abuse, 307 pp.
6686 or by e-mail at [email protected]. They also may be viewed and downloaded from the study’s Web site. Further information on the study, including its latest press releases, a listing of all publications, and the text of many of them may be found on the Web site at www.monitoringthe future.org.
2

Study Design and Methods
At the core of Monitoring the Future is a series of large, annual surveys of nationally representative samples of public and private secondary school students throughout the coterminous United States. Every year since 1975, a national sample of 12th graders has been surveyed. Beginning in 1991, the study was expanded to include comparable, inde-pendent national samples of 8th graders and 10th graders each year. The year 2007 marked the 33rd survey of 12th graders and the 17th survey of 8th and 10th graders.
Sample Sizes The 2007 sample sizes were about 16,500, 16,400, and 15,100 in 8th, 10th, and 12th grades, respectively. In all, about 48,000 students in 403 secondary schools participated. Because multiple questionnaire forms are administered at each grade level, and because not all questions are contained in all forms, the number of cases upon which a particular statistic is based may be less than the total sample size. The tables here contain notes on the number of forms used for each statistic if less than the total sample is used.
Field Procedures University of Michigan staff members administer the questionnaires to students, usually in their classrooms during a regular class period. Participation is voluntary. Parents are notified well in advance of the survey administration and are provided the opportunity to decline their son’s or daughter’s participation. Questionnaires are self-completed and formatted for optical scanning. In 8th and 10th grades the questionnaires are completely anonymous, and in 12th grade they are confidential (to permit the longitudinal follow-up surveys of random subsamples of participants for some years after high school). Extensive, carefully designed procedures are followed to protect the confidentiality of subjects and their data. All procedures are reviewed and approved on an annual basis by the University of Michigan’s Institutional Review Board (IRB) for compliance with federal guidelines for the treatment of human subjects.
Measures A standard set of three questions is used to determine usage levels for the various drugs (except for cigarettes and smokeless tobacco). For example, we ask, “On how many occasions (if any) have you used marijuana . . . (a) . . . in your lifetime? (b) . . . during the past 12 months? (c) . . . during the last 30 days?” Each of the three questions is answered on the same answer scale: 0, 1–2, 3–5, 6–9, 10–19, 20–39, and 40 or more occasions. For the psychotherapeutic drugs (amphetamines, sedatives [barbiturates], tranquilizers, and narcotics other than heroin), respondents are instructed to include only use “. . . on your own—that is, without a doctor telling you to take them.” A similar qualification is used in the question on use of anabolic steroids. For cigarettes, respondents are asked two questions about use. First they are asked, “Have you ever smoked cigarettes?” (the answer categories are “never,” “once or twice,” and so on). The second question asks, “How frequently have you smoked cigarettes during the past 30 days?” (the answer categories are “not at all,” “less than one cigarette per day,” “one to five cigarettes per day,” “about one-half pack per day,” etc.). Smokeless tobacco questions parallel those for cigarettes. Alcohol use is measured using the three questions illustrated above for marijuana. A parallel set of three questions asks about the frequency of being drunk. A different question asks, for the prior two-week period, “How many times have you had five or more drinks in a row?” Perceived risk is measured by a question asking, “How much do you think people risk harming themselves (physically or in other ways), if they . . .” “try marijuana once or twice,” for example. The answer categories are “no risk,” “slight risk,” “moderate risk,” “great risk,” and “can’t say, drug unfamiliar.”
3

Disapproval is measured by the question “Do YOU disapprove of people doing each of the following?” followed by “trying marijuana once or twice,” for example. Answer categories are “don’t disapprove,” “disapprove,” and “strongly disapprove.” In the 8th- and 10th-grade questionnaires only, a fourth category, “can’t say, drug unfamiliar,” is provided, and is included in the calculations.
Perceived availability is measured by the question “How difficult do you think it would be for you to get each of the following types of drugs, if you wanted some?” Answer categories are “probably impossible,” “very difficult,” “fairly difficult,” “fairly easy,” and “very easy.” For 8th and 10th graders only, the additional answer category, “can’t say, drug unfamiliar,” is offered and included in the calculations.
4

Overview of Key Findings
In recent years, the trends in drug use have become more complex, and thus more difficult to describe. A major reason for this increased complexity is that cohort effects have emerged, beginning with the increases in drug use that occurred during the early 1990s. “Cohort effects” refer to lasting differences between class cohorts that stay with them as they advance through school and beyond. These effects result in the various grades reaching peaks or valleys in different years, and thus the various age groups are sometimes moving in different directions at a given point in history. We have seen such cohort effects for cigarette smoking throughout most of the life of the study, but such effects were much less apparent for the illicit drugs until the past decade and a half. The 8th graders have been the first to show turnarounds in illicit drug use: they were the first to show the upturn in use in the early 1990s and the first to show the decline in use after 1996. They have generally shown the greatest proportional declines from recent peak levels of use, attained for the most part during the 1990s, while the proportional declines have generally been the least at 12th grade. A number of drugs showed modest continuing declines in use in 2007, although few of the one-year changes reached statistical significance. These included marijuana, and all of the stimulant drugs other than cocaine. Most of the other drugs held steady in their use in 2007, generally following decreases in their use in prior years. Only one of the many classes of drugs under study showed any sign of increase in use this year—ecstasy (MDMA).
Drugs Decreasing in Use The use of any illicit drug in the 12 months preceding the survey (annual prevalence) is down by more than four tenths among 8th graders since the recent peak for that grade in 1996. Tenth and 12th graders reached their recent peaks a year later than the 8th graders; from their 1997 peaks, use is down by about a quarter among 10th graders, but by only about 15% so far among 12th graders. In the one-year interval from 2006 to 2007, only the 8th-grade level had a statistically significant decline in any prevalence period in this index (specifically, in lifetime and annual prevalence); nevertheless, gradual declines did continue in all grades, with 8th-grade lifetime use showing the largest decline of 1.9 percentage points to 19%. In 2007, the lifetime
prevalence rates for this index were 19%, 36%, and 47% in grades 8, 10, and 12, respectively. In other words, just under half of American secondary school students today have tried an illicit drug by the time they near high school graduation. A number of specific drug classes showed continuing declines this year in at least one grade. These include marijuana, amphetamines, Ritalin specifically, methamphetamine, and crystal methamphetamine. (Alcohol and cigarettes, discussed in a separate section below, also showed some significant declines.) Marijuana use tends to drive the overall illicit drug index because it is by far the most prevalent of the illicit drugs. Therefore, marijuana shows a very similar pattern of change to that for any illicit drug. In 2007, the annual prevalence of marijuana use fell by a significant 1.4 percentage points among 8th graders to 10.3%, and by a nonsignificant 0.6 percentage points among 10th graders to 24.6%. Annual marijuana use among 12th graders leveled at 31.7%. Amphetamine use is well below recent peak levels in all three grades under study. Eighth and 10th graders reached their peak levels in annual prevalence in 1996 and since then have shown declines of more than one half and one third, respectively. Twelfth graders, on the other hand, did not reach their recent peak level until 2002, and have declined by one third since then. The decline in use has decelerated at 8th grade since 2004, though there was a nonsignificant 0.5-percentage-point drop this year; at 10th grade, use stabilized after 2005. Twelfth graders have continued to show a gradual decline in recent years (down 0.6 percentage points in 2007, nonsignificant), once again suggesting that a cohort effect is at work. Ritalin is a specific prescription amphetamine. Its use outside of medical supervision was first measured in the study in 2001; use has been falling since then, with total declines of between one quarter and one half at each grade level. In 2007, 2.1% (8th grade), 2.8% (10th grade), and 3.8% (12th grade) report having used Ritalin without medical instruction at least once in the prior 12 months. Methamphetamine use was not included in the study until 1999. Since then it has shown a rather steady decline in all three grades—a decline that has now reached about two thirds in all three grades. That decline
5

continued in 2007, significantly so in both 8th and 12th grades. Crystal methamphetamine (ice) reached its lowest point this year since 1992. Its use is measured only among 12th graders; their annual prevalence this year is 1.6%, down by about half from the peak year of 2002.
Drugs Holding Steady Among the many drugs showing very little change in 2007 at any grade level were LSD, hallucinogens other than LSD, cocaine, crack cocaine, heroin, narcotics other than heroin, OxyContin and Vicodin specifically, sedatives, tranquilizers, three so-called “club drugs” (Ketamine, Rohypnol, and GHB), and steroids. In each case, annual prevalence rates are below where they were at their recent peaks, but no appreciable further decline occurred at any grade level for these drugs in 2007. LSD use—which had shown very sharp declines in annual prevalence between 1999 and 2004, accom-panied by a sharp decline in the perceived availability of the drug—has shown little further decline at any grade level. Annual prevalence rates are now very low—at 1.1% in grade 8, 1.9% in grade 10, and 2.1% in grade 12. During the period of decline, perceived risk and disapproval of LSD use did not change in ways that would have been expected if they were driving the change in use (that is, they did not increase); on the other hand, perceived availability did change in the expected direction, showing a sharp decline. Hallucinogens other than LSD, taken as a class, show much less decline in recent years than LSD; but they are still somewhat below their recent peak levels. (Psilocybin, also known as “shrooms” or “magic mushrooms,” is the most widely used of these drugs today.) Annual use changed very little in 2007. Annual prevalence ranges from 1.6% in 8th grade to 4.8% in 12th grade. The one stimulant drug that did not show a decline this year was cocaine. Cocaine use reached a recent peak among teens in the late 1990s, declined for a year or two, and has held relatively level in recent years. Today, annual prevalence ranges between 2% and 5% in grades 8, 10, and 12. Crack cocaine use previously declined some in all three grades but showed no further decline this year. Annual prevalence now ranges between 1.3% and 1.9% across the three grades; these rates are down by between a
quarter and one half from what they were at their recent peaks. Heroin use finally fell below its recent peak levels in all three grades by 2001. Since then use has held quite steady. Annual prevalence of heroin use is now slightly below 1.0% in all three grades. Narcotics other than heroin, taken as a class, are reported only for 12th graders. After increasing substantially since the early 1990s, use of this class of drugs has appeared to level over the past few years. Still, the annual prevalence rate stands at 9.2%. Vicodin and OxyContin, two important analgesics in the narcotic drugs class, are discussed below. OxyContin use was first measured in 2002. The 2007 figures for all three grades are slightly higher than they were in 2002, but the trend lines have been somewhat erratic. For the three grades combined, there was no change in annual prevalence in the past year. Annual prevalence rates in 2007 for OxyContin use are 1.8%, 3.9%, and 5.3%. In other words, one in every twenty high school seniors has at least tried this powerful narcotic drug in the past year. Similarly, Vicodin use shows no systematic change in use this year, and the observed rates remain close to recent peak levels. Annual prevalence rates in 2007 are higher than they are for OxyContin: 2.7%, 7.2%, and 9.6% in 8th, 10th, and 12th grades, respectively. Sedative (barbiturate) use, which is reported only for 12th grade, did not reach its recent peak until 2005, when annual prevalence reached 7.2%. It is down slightly to 6.2% in 2007. Tranquilizer use increased steadily for nearly a decade, from 1992 to about 2000 among 10th and 12th graders (and from 1991 through 1996 among 8th graders). Thereafter it declined, but this year there was no further decline. Thus, the decade-long upward march in tranquilizer use in the upper grades ended, some modest downward trending occurred, and now that decline seems to be over. Use among 8th graders, which has been much lower, started declining after 1996 and has changed very little since 1998. Annual prevalence rates now lie between 2.4% in grade 8 and 6.2% in grade 12—only modestly below their recent peak levels. Three “club drugs”—Ketamine, Rohypnol, and GHB—have all had quite low prevalence rates in recent years and showed some declines. In 2007, however, there was
6

little systematic change in annual prevalence for any of these three drugs. Anabolic steroid use reached peak levels by 2000 in 8th and 10th grades, and by 2002 in 12th grade. Since those peak levels, annual prevalence has declined by one half in the lower grades and over four tenths in 12th grade; those declines began in 2001 among 8th graders, in 2003 among 10th graders, and not until 2005 among 12th graders. In 2006 and 2007, steroid use remained relatively unchanged. The annual prevalence figures in 2007 were 0.8%, 1.1%, and 1.4% in grades 8, 10, and 12, respectively.
Drugs Showing Signs of Increased Use Only one drug showed signs of increased use this year—ecstasy (MDMA)—and the increase was modest and not significant. Another drug, inhalants, provided mixed signals, so we discuss it in this section. Ecstasy (MDMA) use declined substantially at all three grade levels after 2001, apparently as a result of a considerable rise in perceived risk of using this drug. However, while some further decrease occurred in 2006 in 8th grade, there was a nearly significant increase of 1.1 percentage points at 12th grade (to 4.1%), and annual prevalence at 10th grade had been increasing a bit over the prior two years. In 2007 there was some further increase in use at 10th and 12th grades, and the prior gradual decline at 8th grade ended. Of perhaps more concern, perceived risk and disapproval of ecstasy use have been declining in the two lower grades over the past three years, and perceived risk at 12th grade leveled in 2006 and declined in 2007. In 2007 all three grades showed some decline in perceived risk and disapproval. Given that changes in these important attitudes and beliefs are often leading indicators of changes to come in actual use, there is the concern that newer arrivals to adolescence do not have an appreciation of the dangers of using this drug and will be more likely to initiate use as a result. Inhalants constitute another class of drug which has shown a worrisome decline in perceived risk, and it exhibited a mixed pattern of change this year. After 1995, inhalant use had been declining at all three grades. Then in 2003 we reported a significant increase in inhalant use among the 8th graders, and in 2004 all grades showed some increase in annual prevalence, though none was statistically significant. In 2005, there occurred some further increase in grade 12. This pattern of increase may have reflected a cohort effect working its way up the age spectrum, as we have seen for several
other drugs. In 2006 and 2007 the pattern of changes has been mixed, with the increase in use continuing at 10th grade, but with some decline occurring at 8th and 12th grades. Of particular concern for the future, however, is the fact that among the 8th and 10th graders, perceived risk had been falling steadily for five years, after peaking in 2001. In 2007, that decline halted in 8th grade but continued at 10th. (Twelfth graders are not asked about the risks of inhalant use.) We believe that this recent trend may reflect generational forgetting (discussed below) of the dangers of this drug, as newer cohorts replace the older ones who had been exposed to the anti-inhalant ads in the middle 1990s, leaving the newer cohorts vulnerable to a resurgence of use.
Over-the-Counter Cough and Cold Medicines In response to a possible emergent trend, a new question was included in the study for the first time in 2006 about the use of over-the-counter cough and cold medicines for the purpose of “getting high.” The drugs in these classes that are abused usually contain dextromethorphan, a cough suppressant that can cause alterations of consciousness and mood when taken in high doses. Street names for these drugs include “DXM,” “Dex,” and “skittles.” The proportions of students reporting having used these drugs during the prior year for the purpose of getting high were 4%, 5%, and 7% in grades 8, 10, and 12, respectively, in 2006. These rates remained the same in 2007, with the exception that use at 12th grade declined by one percentage point; so at this point this problem behavior does not seem to be increasing further. Because these drugs are available over the counter, students may not fully recognize the dangers of using them, even in high doses. Perceived risk is not assessed, but we believe it is possible that the increasing attention to these drugs and their dangers, particularly by the media over the past few years, may have succeeded in stemming the growth in their use.
Implications for Prevention The wide divergence in historical trajectories of the various drugs over time helps to illustrate the point that, to a considerable degree, the determinants of use are often specific to the drugs. These determinants include both the perceived benefits and the perceived risks that young people come to associate with each drug. Unfortunately, word of the supposed benefits of using a drug usually spreads much faster than information about the adverse consequences. The former—supposed benefits—takes only rumor and a few testimonials, the spread of which has been hastened greatly by the media
7
and the Internet. It usually takes much longer for the evidence of adverse consequences (e.g., death, disease, overdose reactions, addictive potential) to cumulate and then be disseminated. Thus, when a new drug comes onto the scene, it has a considerable “grace period” during which its benefits are alleged and its consequences are not yet known. We believe that ecstasy was the most recent beneficiary of such a grace period, which lasted until 2001, when perceived risk for this drug finally began to rise sharply. To a considerable degree, prevention must occur drug by drug, because people will not necessarily generalize the adverse consequences of one drug to the use of other drugs. Many beliefs and attitudes held by young people are specific to the drug. The figures in this Overview on perceived risk and disapproval for the various drugs—attitudes and beliefs that we have shown to be important in explaining many drug trends over the years—amply illustrate this assertion. These attitudes and beliefs are at quite different levels for the various drugs and, more importantly, often trend differently over time.
“Generational Forgetting” Helps Keep the Epidemic Going Another point worth keeping in mind is that there tends to be a continuous flow of new drugs onto the scene and of older ones being “rediscovered” by young people. Many drugs have made a comeback years after they first fell from popularity, often because young people’s knowledge of their adverse consequences faded as generational replacement took place. We call this process “generational forgetting.” Examples include LSD and methamphetamine, two drugs used widely in the beginning of the broad epidemic of illicit drug use, which originated in the 1960s. Heroin, cocaine, PCP, and crack are some others that made a comeback in the 1990s after their initial popularity faded. At present we see a danger that LSD and ecstasy may be about to exhibit the effects of generational forgetting of their potential for adverse consequences. As for newer drugs emerging, examples include the nitrite inhalants and PCP in the 1970s; crack and crystal methamphetamine in the 1980s; and Rohypnol, GHB, and ecstasy in the 1990s. The perpetual introduction of new drugs (or of new forms or new modes of administration of older ones, as illustrated by crack, crystal methamphetamine, and noninjected heroin) helps to keep the country’s “drug problem” alive. Because of the lag times described previously, during which evidence of adverse consequences must cumulate and be disseminated before they begin to deter use, the forces of
containment are always playing “catch up” with the forces of encouragement and exploitation. Organized efforts to reduce the “grace period” experienced by new drugs would seem among the most promising responses for minimizing the damage they will cause. Such efforts regarding ecstasy by the National Institute on Drug Abuse and others appeared to pay off. The psychotherapeutic drugs now make up a larger part of the overall drug picture than was true 10 years ago, in part because use has increased for many of them over that period, and in part because use of a number of street drugs has declined substantially since the mid-1990s. It seems likely that young people are less concerned about the dangers of using these drugs outside of medical regimen than they are about the dangers of using the illegal drugs, quite likely because the former are widely used for legitimate medical purposes. Increasingly, prescription psychotherapeutic drugs are being advertised directly to the consumer, which also may imply that they can be used with low risk.
Cigarettes and Alcohol The statistics for use of the licit drugs—cigarettes and alcohol—are also a basis for considerable concern. Nearly half (46%) of American young people have tried cigarettes by 12th grade, and nearly a quarter (22%) of 12th graders are current smokers. Even as early as 8th grade, nearly a quarter (22%) have tried cigarettes, and 1 in 14 (7.1%) has already become a current smoker. Fortunately, there has been some real improvement in these smoking statistics over the last 10 or 11 years, following a dramatic increase earlier in the 1990s. Much of the recent improvement was simply regaining the ground lost in the early 1990s, but by 2007 that has been more than accomplished. Thirty-day prevalence of cigarette use reached its recent peak in 1996 at grades 8 and 10, capping a rapid climb from the 1991 levels (when data were first gathered on these grades). In the decade between 1996 and 2007, current smoking has fallen considerably in these grades (by 66% and 54%, respectively). For 12th graders, peak use occurred a year later, in 1997, and has had a more modest decline so far of 41% by 2007. However, because of the strong cohort effect that we have consistently observed for cigarette smoking, we expect the 12th graders to continue to show declines, as the lighter-using cohorts of 8th and 10th graders become 12th graders. Overall increases in perceived risk and disapproval of smoking appear to have contributed to this downturn. Perceived risk increased substantially and fairly steadily in all grades from 1995 through 2004,
8

after which it leveled in 8th and 10th grades, but continued rising in 12th until 2006, after which it leveled. Disapproval of smoking had been rising steadily in all grades since 1996. After 2004, the rise decelerated in the lower grades through 2006—again, reflecting a cohort effect in this attitude. It seems likely that some of the attitudinal change that has occurred for cigarettes is attributable to the adverse publicity suffered by the tobacco industry in the 1990s, as well as a reduction in cigarette advertising and an increase in antismoking advertising reaching children. But price is also likely to have been an important factor; cigarette prices rose appreciably in the late 1990s and early 2000s as cigarette companies tried to cover the costs of the tobacco settlement, and as states increased excise taxes on cigarettes. Unfortunately, the declines in smoking in all grades have decelerated considerably, and current daily use showed no further decline in 2007 in the two upper grades. Very likely a slowdown in price increases, as well as declines in the funding of antismoking campaigns at both the national and state levels, have contributed to these developments. In 2007 use among 8th graders decreased significantly, use among 10th graders dropped very slightly, and use by 12th graders leveled. We believe it likely that the larger proportional declines in the lower grades will make their way into the upper grades as the cohort effect makes its way up the age spectrum. Smokeless tobacco use had also been in decline in recent years, continuing into the early 2000s, but the decline appears to have ended for the upper grades. The 30-day prevalence rates for smokeless tobacco are now down by about half from their peak levels. Alcohol use remains extremely widespread among today’s teenagers. Nearly three quarters of students (72%) have consumed alcohol (more than just a few sips) by the end of high school; and about two fifths (39%) have done so by 8th grade. In fact, more than half (55%) of the 12th graders and nearly a fifth (18%) of the 8th graders in 2007 report having been drunk at least once in their life. To a considerable degree, alcohol trends have tended to parallel the trends in illicit drug use. These include a modest increase in binge drinking (defined as having
five or more drinks in a row at least once in the past two weeks) in the early and mid-1990s, though it was a proportionally smaller increase than was seen for most of the illicit drugs. Fortunately, binge drinking rates for the nation’s teenagers leveled off seven to ten years ago, just about when the illicit drug rates began to turn around, and in 2002 a drop in drinking and drunkenness began to appear in all grades. The decline continued into 2005 for drinking at all grades (as well as for prior-month drunkenness among 10th and 12th graders). In 2007, current use of alcohol continued to decline for 12th grade, declined some in 8th grade, and leveled among 10th graders. The longer-term trend data available for 12th graders show that alcohol usage rates, and binge drinking in particular, are substantially below where they were at the beginning of the 1980s. Most of the improvement occurred during the 1980s, before being partly offset by increases in the first half of the 1990s; fortunately, the recurrence of a downturn in recent years pretty much offset the ground lost in the 1990s.
Where Are We Now? Clearly, the problem of substance abuse among American young people continues to remain sufficiently widespread to merit concern. Today, nearly half of them (47%) have tried an illicit drug by the time they finish high school. Indeed, if inhalant use is included in the definition of illicit drug use, nearly a third (28%) have done so as early as 8th grade—when most students are only 13 or 14 years old. More than 1 in 4 (26%) have used some illicit drug other than marijuana by the end of 12th grade, and nearly 1 in 5 (19%) of all 12th graders reported doing so during the 12 months prior to the survey. Of course, if we look at the situation from the perspective of helping to deter future use, we may want to emphasize the considerable proportions of youth who do not use each of these drugs and who disapprove of their use. For example, 74% of seniors today made it through the end of high school without ever using an illicit drug other than marijuana, and more than half (58%) did so without ever trying marijuana. Further, the great majority personally disapprove of using most of the illicit drugs, as has been true for many years.
9

Any Illicit Drug
Monitoring the Future routinely reports three different indexes of illicit drug use—an index of “any illicit drug” use, an index of the use of “any illicit drug other than marijuana,” and an index of the use of “any illicit drug including inhalants.”4 In this section we discuss only the first two; the statistics for all three may be found in Tables 1–3. In order to make comparisons over time, we have kept the definitions of these indexes constant, even though some new substances appear as time passes. The index levels are little affected by the inclusion of these newer substances, however, primarily because most individuals who use these newer substances are also using the more prevalent drugs included in the indexes. The major exception has been inhalants, the use of which is quite prevalent in the lower grades. Thus, after the lower grades were added to the study in 1991, a special index was added that includes inhalants.
Trends in Use In the late 20th century, young Americans reached extraordinarily high levels of illicit drug use by U.S. as well as international standards. The trends in lifetime use of any illicit drug are given in the first panel on the facing page.5 By 1975, when the study began, the majority of young people (55%) had used an illicit drug by the time they left high school. This figure rose to two thirds (66%) by 1981 before a long and gradual decline to 41% by 1992—the low point. After 1992 the proportion rose considerably, reaching a recent high point of 55% in 1999; it stands at 47% in 2007. Trends for annual, as opposed to lifetime, prevalence appear in the second (upper right) panel. Among 8th graders, a gradual and continuing falloff occurred after 1996. Peak rates since 1991 were reached in
4Footnote “a” to Tables 1 through 4 provides the exact definition of “any illicit drug.” 5This is the only set of figures in this Overview presenting lifetime use statistics. For other drugs, lifetime statistics may be found in Table 1.
1997 in the two upper grades and declined little for several years. However, since 2001 both upper grades have shown declines, which continued in 2007. Because marijuana is much more prevalent than any other illicit drug, trends in its use tend to drive the index of any illicit drug use. Thus we have an index that excludes marijuana, and shows the proportions of high school students who use the other, so-called “harder” illicit drugs. The proportions who have used any illicit drug other than marijuana in their lifetime are shown in the third panel (lower left). In 1975 over one third (36%) of 12th graders had tried some illicit drug other than marijuana. This figure rose to 43% by 1981, then declined for a long period to a low of 25% in 1992. Some increase followed in the 1990s as the use of a number of drugs rose steadily, and it reached 30% by 1997. (In 2001 it was 31%, but this reflected a slight artifactual upward shift in the estimate due to a change in the question wording for “other hallucinogens” and tranquilizers.6) Since 1997, the rate has fallen some to 26% in 2007. The fourth panel presents the annual prevalence data for the same index, which shows a pattern of change over the past few years similar to the index of any illicit drug use, but with much less pronounced change since 1991. Overall, these data reveal that, while use of individual drugs (other than marijuana) may fluctuate widely, the proportion using any of them is much less labile. In other words, the proportion of students prone to using such drugs and willing to cross the normative barriers to such use changes more gradually. The usage rate for each individual drug, on the other hand, reflects many more rapidly changing determinants specific to that drug: how widely its psychoactive potential is recognized, how favorable the reports of its supposed benefits are, how risky the use of it is seen to be, how acceptable it is in the peer group, how accessible it is, and so on.
6The term “psychedelics” was replaced with “hallucinogens,” and “shrooms” was added to the list of examples, resulting in somewhat more respondents indicating use of this class of drugs. For tranquilizers, Xanax was added to the list of examples given, slightly raising the reported prevalence of use.
10

Trends in Illicit Drug UseGrades 8, 10, and 12
0
20
40
60
80
100
'75 '77 '79 '81 '83 '85 '87 '89 '91 '93 '95 '97 '99 '01 '03 '05 '07
12th Grade10th Grade8th Grade
0
20
40
60
80
100
'75 '77 '79 '81 '83 '85 '87 '89 '91 '93 '95 '97 '99 '01 '03 '05 '070
20
40
60
80
100
'75 '77 '79 '81 '83 '85 '87 '89 '91 '93 '95 '97 '99 '01 '03 '05 '07
0
20
40
60
80
100
'75 '77 '79 '81 '83 '85 '87 '89 '91 '93 '95 '97 '99 '01 '03 '05 '07
% who used any illicit drug in lifetime % who used any illicit drug in last 12 months
% who used any illicit drug other than marijuana in last 12 months*
% who used any illicit drug other thanmarijuana in lifetime*
YEAR YEAR
YEAR YEAR
*Beginning in 2001, revised sets of questions on other hallucinogen and tranquilizer use were introduced. Data for “any illicit drug other than marijuana” were affected by these changes.
PE
RC
EN
TP
ER
CE
NT
PE
RC
EN
TP
ER
CE
NT
Source. The Monitoring the Future study, the University of Michigan.
11
Marijuana
Marijuana has been the most widely used illicit drug throughout the study’s 33 years. Marijuana can be taken orally, mixed with food, and smoked in a concentrated form as hashish—the use of which is much more common in Europe. However, nearly all the consumption in this country involves smoking it in rolled cigarettes (“joints”), in pipes, or occasionally in hollowed-out cigars (“blunts”).
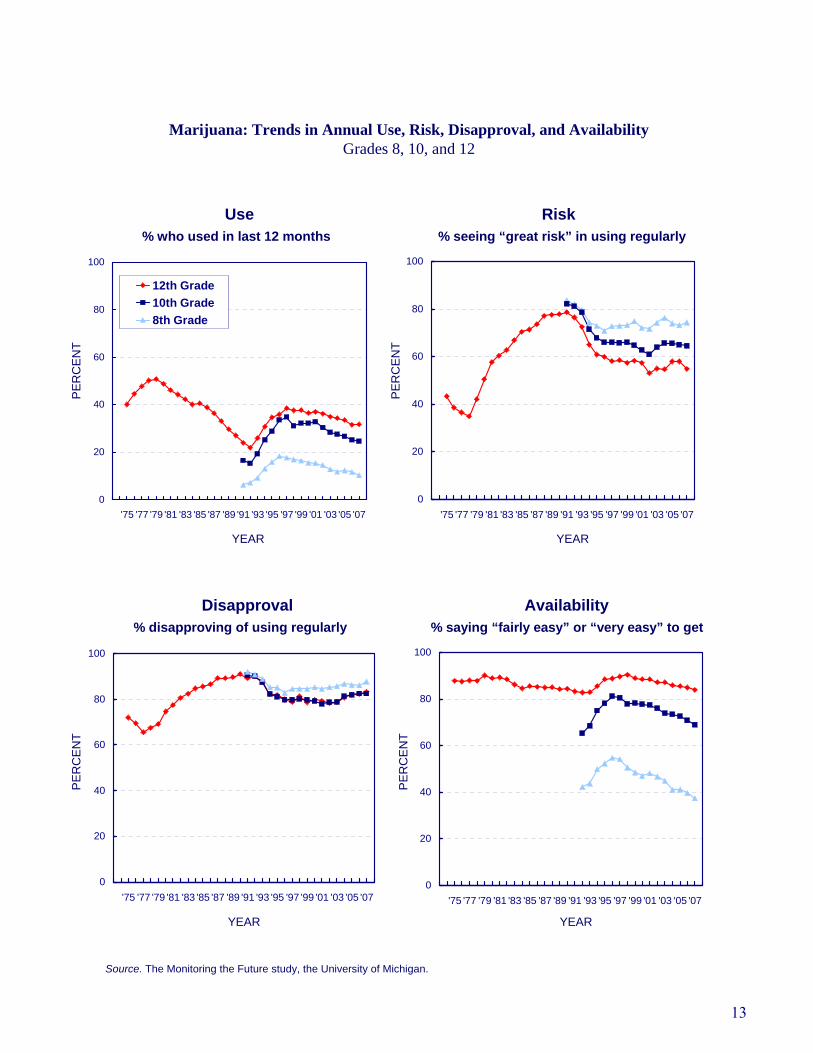
Trends in Use Annual marijuana prevalence peaked among 12th graders in 1979 at 51%, following a rise that began during the 1960s. Then use declined fairly steadily for 13 years, bottoming at 22% in 1992—a decline of more than half. The 1990s, however, saw a resur-gence of use. After a considerable increase (one that actually began among 8th graders a year earlier than among 10th and 12th graders), annual prevalence rates peaked in 1996 at 8th grade and in 1997 at 10th and 12th grades. After 1996 there was a continuing gradual decline among 8th graders that appeared to halt in 2005 (after a drop of about one third over the 10-year period), but then resumed, with a significant drop in annual prevalence occurring in 2007. In the upper grades, only a very modest decline occurred between 1997 and 2002, followed by a continuing gradual decline since then. The decline continued through 2007 for 10th graders but halted in 2007 among 12th graders.
Perceived Risk The amount of risk perceived to be associated with using marijuana fell during the rise in use in the 1970s, and again during the subsequent rise in use in the 1990s. Indeed, at 10th and 12th grades, perceived risk began to decline a year before use began to rise in the upturn of the 1990s, making perceived risk a leading indicator of change in use. (The same may have happened at 8th grade as well, but we do not have data starting early enough to check that possibility.) The decline in perceived risk halted in 1996 in 8th and 10th grades, and use began to decline a year or two later, again making perceived risk a
leading indicator. From 1996 to 2000, perceived risk held fairly steady, and the decline in use in the upper grades stalled. However, from 2000 to 2002, perceived risk declined some in all grades. After 2002, perceived risk increased in all grades through 2004 as use declined. Since then, perceived risk has been generally level in all grades.
Disapproval Personal disapproval of marijuana use slipped considerably among 8th graders between 1991 and 1996 and among 10th and 12th graders between 1992 and 1997. For example, the proportions of 8th, 10th, and 12th graders who said that they disapproved of trying marijuana once or twice fell by 17, 21, and 19 percentage points, respectively, over those intervals of increasing use. After that there was some modest increase in disapproval among 8th graders, but not much among 10th and 12th graders until 2004, when all grades showed increases. Since 2003 disapproval has increased some in all three grades.
Availability Ever since the study began in 1975, between 83% and 90% of seniors each year have said that they could get marijuana fairly easily or very easily if they wanted some. It has been considerably less accessible to younger adolescents. Still, in 2007 nearly two fifths of 8th graders (37%) and more than two thirds of all 10th graders (69%) reported it as being accessible. This compares to 84% for seniors. Therefore, it seems clear that marijuana has remained a highly accessible drug. As marijuana use rose sharply in the early and mid-1990s, reported availability increased as well, perhaps reflecting the fact that more young people had friends who were users. Availability peaked for 8th and 10th graders in 1996 and has fallen off since then, particularly in 8th grade. Availability peaked in 1998 for 12th graders and has declined more gradually than among the younger students.
12
Marijuana: Trends in Annual Use, Risk, Disapproval, and AvailabilityGrades 8, 10, and 12
0
20
40
60
80
100
'75 '77 '79 '81 '83 '85 '87 '89 '91 '93 '95 '97 '99 '01 '03 '05 '07
12th Grade10th Grade8th Grade
0
20
40
60
80
100
'75 '77 '79 '81 '83 '85 '87 '89 '91 '93 '95 '97 '99 '01 '03 '05 '07
0
20
40
60
80
100
'75 '77 '79 '81 '83 '85 '87 '89 '91 '93 '95 '97 '99 '01 '03 '05 '07
0
20
40
60
80
100
'75 '77 '79 '81 '83 '85 '87 '89 '91 '93 '95 '97 '99 '01 '03 '05 '07
% who used in last 12 months % seeing “great risk” in using regularly
% saying “fairly easy” or “very easy” to get% disapproving of using regularly
YEAR YEAR
YEAR YEAR
Use Risk
Disapproval Availability
Source. The Monitoring the Future study, the University of Michigan.
PE
RC
EN
TP
ER
CE
NT
PE
RC
EN
TP
ER
CE
NT
13

Inhalants
Inhalants are any gases or fumes that can be inhaled for the purpose of getting high. These include many household products—the sale and possession of which is perfectly legal—including glue, nail polish remover, gasoline, solvents, butane, and propellants used in certain commercial products such as whipped cream dispensers. Unlike nearly all other classes of drugs, their use is most common among younger ado-lescents and tends to decline as youth grow older. The early use of inhalants may reflect the fact that many inhalants are cheap, readily available (often in the home), and legal to buy and possess. The decline in use with age likely reflects their coming to be seen as “kids’ drugs,” in addition to the fact that a number of other drugs become available to older adolescents, who are also more able to afford them.
Trends in Use According to the long-term data from 12th graders, inhalant use (excluding the use of nitrite inhalants) rose gradually for some years, from 1976 to 1987. This rise in use was somewhat unusual in that most other forms of illicit drug use were in decline during the 1980s. Use rose among 8th and 10th graders from 1991, when data were first gathered on them, through 1995; it rose among 12th graders from 1992 to 1995. All grades then exhibited a fairly steady and substantial decline in use through 2001 or 2002. Since 2001 the grades have diverged somewhat in their trends; 8th graders showed a significant increase in use for two years, followed by a decline after 2004; 10th graders have shown an increase since 2002; and 12th graders showed some increase from 2003 to 2005, but a decline since then. Only the 10th graders have yet to show a decline, and the fact that perceived risk of harm has been decreasing among them since about 2001 suggests that a decline is unlikely.
Perceived Risk Only 8th and 10th graders have been asked questions about the degree of risk they associate with inhalant use. Relatively low proportions think that there is a “great risk” in using an inhalant once or twice. However, there was an upward shift in this belief between 1995 and 1996, with significant increases observed in both 8th and 10th grades. The Partnership for a Drug-Free America launched an anti-inhalant advertising initiative in 1995, which may help to explain the increase in perceived risk in 1996 and the turnaround in use after that point. That increase in per-ceived risk marked the beginning of a long and important decline in inhalant use. However, the degree of risk associated with inhalant use began to decline steadily six years ago among both the 8th and 10th graders, perhaps explaining the turnaround in use in 2003 among 8th graders and in 2004 in the upper grades. The hazards of inhalant use were communicated during the mid-1990s; but there may currently be a “generational forgetting” of these hazards, as replacement cohorts who were too young to get that earlier message have entered adolescence.
Disapproval Over 80% of students say that they would disapprove of even trying an inhalant. There was a very gradual upward drift in this attitude among 8th and 10th graders from 1995 through about 2001, with a gradual falloff since then among 8th graders.
Availability Respondents have not been asked about the availability of inhalants. We have assumed that these substances are universally available to young people in these age ranges.
14

Inhalants: Trends in Annual Use, Risk, and DisapprovalGrades 8, 10, and 12
0
6
12
18
24
30
'75 '77 '79 '81 '83 '85 '87 '89 '91 '93 '95 '97 '99 '01 '03 '05 '07
12th Grade10th Grade8th Grade
0
20
40
60
80
100
'75 '77 '79 '81 '83 '85 '87 '89 '91 '93 '95 '97 '99 '01 '03 '05 '07
0
20
40
60
80
100
'75 '77 '79 '81 '83 '85 '87 '89 '91 '93 '95 '97 '99 '01 '03 '05 '07
% who used in last 12 months % seeing “great risk” in using once or twice
% disapproving of using once or twice
YEAR YEAR
YEAR
0
20
40
60
80
100
'75 '77 '79 '81 '83 '85 '87 '89 '91 '93 '95 '97 '99 '01 '03 '05 '07
(no data)
% saying “fairly easy” or “very easy” to get
YEAR
Use Risk
Disapproval Availability
Source. The Monitoring the Future study, the University of Michigan.
PE
RC
EN
TP
ER
CE
NT
PE
RC
EN
TP
ER
CE
NT
15

LSD
For some years, LSD was the most widely used drug within the larger class of drugs known as hallucinogens. This is no longer true, due to sharp decreases in its use combined with an increasing use of psilocybin. (Statistics on overall hallucinogen use and on use of hallucinogens other than LSD are shown in the tables at the end of this report.)
Trends in Use Annual prevalence of LSD use among 12th graders has been below 10% since the study began in 1975. Use declined some in the first 10 years of the study, likely continuing a decline that had begun before 1975. Use had been fairly level in the latter half of the 1980s but, as was true for a number of other drugs, rose in all three grades between 1991 and 1996. Since 1996, use has declined in all three grades, with particularly sharp declines between 2001 and 2003; since then use has remained at historically low levels, though all three grades showed a slight increase in use in 2007. Annual prevelance is down from peak levels by about three fourths.
Perceived Risk We think it likely that perceived risk for LSD use increased during the early 1970s, before this study began, as concerns grew about possible neurological and genetic effects (most of which were never scientifically confirmed) as well as “bad trips” and “flashbacks.” However, there was some decline in perceived risk in the late 1970s. The degree of risk associated with LSD experimentation remained fairly level among 12th graders through most of the 1980s, but a substantial decline occurred in all grades in the first half of the 1990s, when use rose. Since about 2000, perceived risk has declined steadily and substantially among 8th graders, declined modestly among 10th graders, but held fairly steady among 12th graders. The decline in 8th grade suggests that younger teens are becoming less knowledgeable about this drug’s effects than their predecessors—through what we have called “generational forgetting”—which suggests a growing vulnerability to a resurgence of use. The decline of LSD use in recent years, despite a fall in perceived risk, suggests that some factors other
than a change in underlying attitudes and beliefs are contributing to the downturn—perhaps some displacement by ecstasy prior to 2001, or declining availability (discussed below).
Disapproval Disapproval of LSD use was quite high among 12th graders through most of the 1980s, but began to decline after 1991 along with perceived risk. All three grades exhibited a decline in disapproval through 1996, with disapproval of experimentation dropping 11 percentage points between 1991 and 1996 among 12th graders. After 1996 a slight increase in disapproval emerged among 12th graders, accompanied by a leveling among 10th graders and some further decline among 8th graders. Since 2001, disapproval of LSD use has diverged among the three grades, declining considerably among 8th graders, declining less among 10th graders, and increasing significantly among 12th graders. Note, however, that the percentages of 8th and 10th graders who respond with “can’t say, drug unfamiliar” increased over the years; thus the base for disapproval has shrunk, suggesting that the real decline of disapproval among the younger students is less than it appears here. (This fact is also consistent with the notion that generational forgetting has been occurring.) Regardless of these di-verging trends, use fell sharply in all grades before leveling in 2004, with little change since then.
Availability Reported availability of LSD by 12th graders fell considerably from 1975 to 1979, declined a bit further until 1986, and then began a substantial rise, reaching a peak in 1995. LSD availability also rose somewhat among 8th and 10th graders in the early 1990s, reaching a peak in 1995 or 1996. Since those peak years, there has been considerable falloff in all three grades—quite possibly in part because fewer students have LSD-using friends through whom they could gain access. But there may well have been a decrease in the supply of LSD due to the closing of major LSD-producing labs by the Drug Enforcement Administration, with one particularly important seizure in 2000. It is clear that attitudinal changes cannot explain the recent declines in use.
16

LSD: Trends in Annual Use, Risk, Disapproval, and AvailabilityGrades 8, 10, and 12
0
6
12
18
24
30
'75 '77 '79 '81 '83 '85 '87 '89 '91 '93 '95 '97 '99 '01 '03 '05 '07
12th Grade10th Grade8th Grade
0
20
40
60
80
100
'75 '77 '79 '81 '83 '85 '87 '89 '91 '93 '95 '97 '99 '01 '03 '05 '07
0
20
40
60
80
100
'75 '77 '79 '81 '83 '85 '87 '89 '91 '93 '95 '97 '99 '01 '03 '05 '07
0
20
40
60
80
100
'75 '77 '79 '81 '83 '85 '87 '89 '91 '93 '95 '97 '99 '01 '03 '05 '07
% who used in last 12 months % seeing “great risk” in using once or twice
% saying “fairly easy” or “very easy” to get% disapproving of using once or twice
YEAR YEAR
YEAR YEAR
Use Risk
Disapproval Availability
Source. The Monitoring the Future study, the University of Michigan.
PE
RC
EN
TP
ER
CE
NT
PE
RC
EN
TP
ER
CE
NT
17

Cocaine
Cocaine was used almost exclusively in powder form for some years, though “freebasing” emerged for a while. Then in the early 1980s came the advent of crack cocaine. Our original questions did not distinguish among different forms of cocaine or different modes of administration, but simply asked about using cocaine. In 1987 we began to ask separate questions about the use of crack cocaine and “cocaine other than crack,” which was comprised almost entirely of powder cocaine use. The findings contained in this section report on the results of the more inclusive questions asked of 12th graders over the years. Data on overall cocaine use are presented in the figures in this section, and results for crack alone are presented graphically in the next section.
Trends in Use There have been some important changes in the levels of overall cocaine use (which includes crack) over the life of the study. Use among 12th graders originally burgeoned in the late 1970s and remained fairly stable through the first half of the 1980s before starting a precipitous decline after 1986. Annual prevalence among 12th graders dropped by about three quarters between 1986, when it was 12.7%, and 1992, when it reached 3.1%. Between 1992 and 1999, use reversed course again and doubled to 6.2% before declining to 5.0% by 2000, which is about where it has remained since (5.2% in 2007). Use also rose in 8th and 10th grades after 1992 before reaching recent peak levels in 1998 and 1999, respectively. In the early 2000s, use dropped some in both grades, but levels in 2007 are about where they were in 2003.
Perceived Risk General questions about the dangers of cocaine and disapproval of cocaine have been asked only of 12th graders. The results tell a fascinating story. They show that perceived risk for experimental use fell in the late 1970s (when use was rising), stayed level in the first half of the 1980s (when use was level), and then jumped very sharply in a single year (by 14 per-centage points between 1986 and 1987), just when the
substantial decline in use began. The year 1986 was marked by a national media frenzy over crack cocaine and also by the widely publicized cocaine-related death of Len Bias, a National Basketball Association first-round draft pick. Bias’ death was originally re-ported as resulting from his first experience with co-caine. Though that was later proven to be incorrect, the message had already “taken.” We believe that this event helped to persuade many young people that use of cocaine at any level is dangerous, no matter how healthy the individual. Perceived risk continued to rise through 1991 as the fall in use continued. After 1991, perceived risk began what became a longer-term de-cline, and a year later use began a long rise. Perceived risk has leveled in recent years, as has use.
Disapproval Disapproval of cocaine use by 12th graders followed a cross-time pattern similar to that for perceived risk, although its seven-percentage-point jump in 1987 was not quite so pronounced. There was some decline from 1991 to 1997, but fair stability since then despite the earlier modest decline in perceived risk.
Availability The proportion of 12th graders saying that it would be “fairly easy” or “very easy” for them to get cocaine if they wanted some was 33% in 1977, rose to 48% by 1980 as use rose, held fairly level through 1982, and then after a one-year drop, increased steadily to 59% by 1989 (in a period of rapidly declining use). It then fell back to about 47% by 1994, which is roughly where it has remained since. Note that the pattern of change does not map well onto the pattern of change in actual use, suggesting that changes in overall availability have not been a major determinant of use—particularly during the sharp decline in use in the late 1980s. The advent of crack cocaine in the early 1980s, however, provided a lower cost form of cocaine, thus reducing the prior social class differences in use (as is documented in our other publications).
18

Cocaine (including Crack): Trends in Annual Use, Risk, Disapproval, and AvailabilityGrades 8, 10, and 12
0
4
8
12
16
20
'75 '77 '79 '81 '83 '85 '87 '89 '91 '93 '95 '97 '99 '01 '03 '05 '07
12th Grade10th Grade8th Grade
0
20
40
60
80
100
'75 '77 '79 '81 '83 '85 '87 '89 '91 '93 '95 '97 '99 '01 '03 '05 '070
20
40
60
80
100
'75 '77 '79 '81 '83 '85 '87 '89 '91 '93 '95 '97 '99 '01 '03 '05 '07
0
20
40
60
80
100
'75 '77 '79 '81 '83 '85 '87 '89 '91 '93 '95 '97 '99 '01 '03 '05 '07
% who used in last 12 months % seeing “great risk” in using once or twice
% saying “fairly easy” or “very easy” to get% disapproving of using once or twice
YEAR YEAR
YEAR YEAR
Use Risk
Disapproval Availability
Source. The Monitoring the Future study, the University of Michigan.
PE
RC
EN
TP
ER
CE
NT
PE
RC
EN
TP
ER
CE
NT
19

Crack
Several indirect indicators in the study suggested that crack use grew rapidly in the period 1983–1986, beginning before we had direct measures of crack use. In 1986 a single usage question was included in one of the five questionnaire forms given to 12th graders; the question asked those who indicated any cocaine use in the prior 12 months if they had used crack. The results from that question represent the first data point in the first panel on the facing page. After that, we introduced three questions about crack use into several questionnaire forms.
Trends in Use After 1986 there was a precipitous drop in crack use among 12th graders—a drop that continued through 1991. After 1991 for 8th and 10th graders (when data were first available) and after 1993 for 12th graders, all three grades showed a slow, steady increase in use through 1998. Crack use finally started to drop after 1998 in 8th and 10th grades and after 1999 in 12th grade. Since those recent peak years, annual preva-lence has dropped by nearly half in the lower grades, including a significant drop for 10th graders in 2006, and by more than a quarter in 12th grade. As with many drugs, the decline at 12th grade has lagged be-hind those in the lower grades. There was no change in 2007.
Perceived Risk By the time we added questions about the perceived risk of using crack in 1987, crack was already seen by 12th graders as one of the most dangerous of all the illicit drugs: 57% saw a great risk in even trying it. This compared to 54% for heroin, for example. (See the previous section on cocaine for a discussion of changes in perceived risk in 1986.) Perceived risk for crack rose still higher through 1990, reaching 64% of 12th graders who said they thought there was a great risk in taking crack once or twice. (Use was dropping during that interval.) After 1990 some falloff in perceived risk began, well before crack use began to increase in 1994. Thus, here again, perceived risk was a leading indicator. Between 1991 and 1998 there was a considerable falloff in this belief in grades 8 and 10, as use rose quite steadily. Perceived risk leveled in 2000 in grades 8 and 12 and a year later in grade 10. We think that the declines in perceived risk for crack and cocaine during the 1990s may well reflect an
example of “generational forgetting,” wherein the class cohorts that were in adolescence when the adverse consequences were most obvious (i.e., in the mid-1980s) were replaced by newer cohorts who had heard much less about the dangers of this drug as they were growing up.
Disapproval Disapproval of crack use was not included in the study until 1990, by which time it was also at a very high level, with 92% of 12th graders saying that they disapproved of even trying it. Disapproval of crack use declined slightly but steadily in all three grades from 1991 through about 1997. After a brief period of stability, disapproval has increased very slightly in the last few years.
Availability Crack availability has not changed dramatically across the interval for which data are available, as the fourth panel on the facing page illustrates. Eighth and 10th graders reported some modest increase in availability in the early 1990s. This was followed by a slow, steady decrease from 1995 through 2004 in 8th grade (followed by a leveling) and sharper drops among 10th and 12th graders beginning in 1999 and 2000, respectively. Since 2004, availability has declined slightly in all three grades.
NOTE: The distinction between crack cocaine and other forms of cocaine (mostly powder) was not made until the middle of the life of the study. The figures on the facing page begin their trend lines when these distinctions were introduced for the different types of measures. Figures are not presented here for the “other forms of cocaine” measures, simply because the trend curves look extremely similar to those for crack. (All the statistics are contained in the tables presented later.) Although the trends are very similar, the absolute levels of use, risk, etc., are somewhat different. Usage levels tend to be higher for cocaine powder compared to crack, and the levels of perceived risk a bit lower, while disapproval has been close for the two different forms of cocaine and availability has been somewhat lower for crack.
20

Crack: Trends in Annual Use, Risk, Disapproval, and AvailabilityGrades 8, 10, and 12
0
2
4
6
8
10
'75 '77 '79 '81 '83 '85 '87 '89 '91 '93 '95 '97 '99 '01 '03 '05 '07
12th Grade10th Grade8th Grade
0
20
40
60
80
100
'75 '77 '79 '81 '83 '85 '87 '89 '91 '93 '95 '97 '99 '01 '03 '05 '070
20
40
60
80
100
'75 '77 '79 '81 '83 '85 '87 '89 '91 '93 '95 '97 '99 '01 '03 '05 '07
0
20
40
60
80
100
'75 '77 '79 '81 '83 '85 '87 '89 '91 '93 '95 '97 '99 '01 '03 '05 '07
% who used in last 12 months % seeing “great risk” in using once or twice
% saying “fairly easy” or “very easy” to get% disapproving of using once or twice
YEAR YEAR
YEAR YEAR
Use Risk
Disapproval Availability
Source. The Monitoring the Future study, the University of Michigan.
PE
RC
EN
TP
ER
CE
NT
PE
RC
EN
TP
ER
CE
NT
21

Amphetamines
Amphetamines, a class of psychotherapeutic stim-ulants, had a relatively high prevalence of use in the youth population for many years. The behavior reported here excludes any use under medical supervision. Amphetamines are controlled substances—they cannot be bought or sold without a doctor’s prescription—but some are diverted from legitimate channels, and some are manufactured and/or imported illegally.
Trends in Use The use of amphetamines rose in the last half of the 1970s, reaching a peak in 1981—two years after marijuana use peaked. We believe that the usage rate reached in 1981 (annual prevalence of 26%) may have been an exaggeration of true amphetamine use because “look-alikes” were in common use at that time. After 1981 a long and steady decline in use of amphetamines by 12th graders began, which did not end until 1992. As with many other illicit drugs, amphetamines made a comeback in the 1990s. Use peaked in the lower two grades by 1996. Since those peak years, use declined steadily in 8th grade, and sporadically in 10th grade. Only after 2002 did it begin to decline in 12th grade. Since 2004 the decline in 8th grade slowed considerably, the decline in 10th grade stalled, but some further decline has occurred in grade 12—a pattern that we are now seeing for a number of drugs. Since the recent peaks in use, annual prevalence has declined by more than half in 8th grade, and by about a third in 10th and 12th grades.
Perceived Risk Only 12th graders are asked questions about the amount of risk they associate with amphetamine use. Overall, changes in perceived risk have been less strongly correlated with changes in usage levels (at the aggregate level) for this drug than for a number of others, although the expected inverse association
pertained during much of the period 1975–2001. There was a decrease in risk during the period 1975–1981 (when use was rising), some increase in perceived risk in 1986–1991 (when use was falling), and some decline in perceived risk from 1991 to 1995 (in advance of use rising again). But in the interval 1981–1986, risk was quite stable even though use fell considerably. Because those are the years of peak cocaine use, it seems likely that some of the decline in amphetamine use in the 1980s was not due to a change in attitudes specific to that drug but rather due to some displacement by another stimulant—cocaine. Perceived risk has been rising in the past several years, possibly contributing to the decline in use that has been occurring among 12th graders since 2002. In 2007, seniors’ perceived risk continued to increase and their use continued to decline.
Disapproval Disapproval of amphetamine use is asked only of 12th graders. Relatively high proportions of 12th graders have disapproved of even trying amphetamines throughout the life of the study. Disapproval did not change in the late 1970s despite the increase in use, although there seemed to be a one-year drop in 1981. From 1981 to 1992, disapproval rose gradually from 71% to 87% as use steadily declined. Disapproval has increased fairly steadily since 1996 along with perceived risk. Use has been declining since 2002.
Availability When the study started in 1975, amphetamines had a high level of reported availability. The level fell by about 10 percentage points by 1977, drifted up a bit through 1980, jumped sharply in 1981, and then began a long, gradual decline through 1991. There was a modest increase in availability at all three grade levels in the early 1990s, as use rose, followed by some decline in the mid-1990s and stability after 1997. In the early to mid-2000s, some further decline has been observed in all three grades.
22

Amphetamines: Trends in Annual Use, Risk, Disapproval, and AvailabilityGrades 8, 10, and 12
0
10
20
30
40
50
'75 '77 '79 '81 '83 '85 '87 '89 '91 '93 '95 '97 '99 '01 '03 '05 '07
12th Grade10th Grade8th Grade
0
20
40
60
80
100
'75 '77 '79 '81 '83 '85 '87 '89 '91 '93 '95 '97 '99 '01 '03 '05 '07
0
20
40
60
80
100
'75 '77 '79 '81 '83 '85 '87 '89 '91 '93 '95 '97 '99 '01 '03 '05 '07
0
20
40
60
80
100
'75 '77 '79 '81 '83 '85 '87 '89 '91 '93 '95 '97 '99 '01 '03 '05 '07
% who used in last 12 months % seeing “great risk” in using once or twice
% saying “fairly easy” or “very easy” to get% disapproving of using once or twice
YEAR YEAR
YEAR YEAR
Use Risk
Disapproval Availability
Source. The Monitoring the Future study, the University of Michigan.
PE
RC
EN
TP
ER
CE
NT
PE
RC
EN
TP
ER
CE
NT
23

Methamphetamine and Crystal Methamphetamine (Ice)
One subclass of amphetamines is called meth-amphetamine. This subclass (at one time called “speed”) has been around for a long time and gave rise to the phrase “speed kills” in the 1960s. Probably because of the reputation it got at that time as a particularly dangerous drug, it was not very popular for some years. As a result, we did not include a full set of questions about its use in the study’s early questionnaires. One form of methamphetamine, crystal methamphetamine or “ice,” grew in popularity in the 1980s. It comes in crystallized form, as the name implies, and the chunks can be heated and the fumes inhaled, much like crack cocaine.
Trends in Use For most of the life of the study, the only question about methamphetamine use has been contained in a single 12th-grade questionnaire form. Respondents who indicated using any type of amphetamines in the prior 12 months were asked in a sequel question to indicate on a prespecified list the types they had used during that period. “Methamphetamine” was one type on the list, and data exist on its use since 1976. In 1976, annual prevalence was 1.9%; it then roughly doubled to 3.7% by 1981 (the peak year), before declining for over a decade all the way down to 0.4% by 1992. Use then rose again in the 1990s, as did use of a number of drugs, reaching 1.3% by 1998. In other words, it has followed a cross-time trajectory fairly similar to that for amphetamines as a whole. In 1990, in the 12th-grade questionnaires only, we introduced our usual set of three questions for crystal methamphetamine, measuring lifetime, annual, and 30-day use. Among 12th graders in 1990, 1.3% indicated any use in the prior year; the figure then climbed to 3.0% by 1998, after which it showed an irregular pattern of decline through about 2003, and then some further decline since 2005. This variable is charted on the first facing panel.
Responding to the growing concern about meth-amphetamine use in general—not just crystal methamphetamine use—we added a full set of three questions about the use of any methamphetamine to the 1999 questionnaires for all three grade levels. These questions yield a somewhat higher annual prevalence for 12th graders: 4.3% in 2000, compared to the sum of the methamphetamine and ice answers in the other question format, which totaled 2.8%. It would appear, then, that the long-term method we had been using for tracking methamphetamine use probably yielded an understatement of the absolute prevalence level, perhaps because some proportion of methamphetamine users did not correctly categorize themselves initially as amphetamine users (even though methamphetamine was given as one of the examples of the amphetamines). We think it unlikely that the shape of the trend curve was distorted, however. The newer questions (not graphed here) show annual prevalence rates in 2007 of 1.1%, 1.6%, and 1.7% for 8th, 10th, and 12th graders, respectively. All of these levels are down considerably from the first measurment taken in 1999, when they were 3.2%, 4.6%, and 4.7%, respectively (see Table 2). So, despite growing public attention to the metham-phetamine problem in the country, its use has shown a fairly steady decline over the past seven years, at least among secondary school students. (We have not seen a similar decline in methamphetamine use among young adults up through 2006.)
Other Measures No questions have yet been added to the study on perceived risk, disapproval, or availability with regard to overall methamphetamine use. Data on perceived risk and availability for crystal methamphetamine, specifically, may be found on the facing page.
24

Crystal Methamphetamine (Ice): Trends in Annual Use, Risk, and AvailabilityGrades 8, 10, and 12
0
2
4
6
8
10
'75 '77 '79 '81 '83 '85 '87 '89 '91 '93 '95 '97 '99 '01 '03 '05 '07
12th Grade10th Grade8th Grade
0
20
40
60
80
100
'75 '77 '79 '81 '83 '85 '87 '89 '91 '93 '95 '97 '99 '01 '03 '05 '07
0
20
40
60
80
100
'75 '77 '79 '81 '83 '85 '87 '89 '91 '93 '95 '97 '99 '01 '03 '05 '07
0
20
40
60
80
100
'75 '77 '79 '81 '83 '85 '87 '89 '91 '93 '95 '97 '99 '01 '03 '05 '07
% who used in last 12 months % seeing “great risk” in using once or twice
% saying “fairly easy” or “very easy” to get% disapproving of using once or twice
YEAR YEAR
YEAR YEAR
Use Risk
Disapproval Availability
(no data)
Source. The Monitoring the Future study, the University of Michigan.
PE
RC
EN
TP
ER
CE
NT
PE
RC
EN
TP
ER
CE
NT
25

Heroin
For many decades, heroin, a derivative of opium, was administered primarily by means of injection into a vein. However, in the 1990s the purity of available heroin reached very high levels, making other modes of administration (such as snorting and smoking) practical alternatives to injection. Thus, in 1995 we introduced questions that asked separately about using heroin with and without a needle so that we might see to what extent noninjection use helped to explain the upsurge in heroin use we were observing. The usage statistics presented on the facing page are based on heroin use by any method, but data on the two specific types of administration are contained in the tables at the end of this report.
Trends in Use The annual prevalence of heroin use among 12th graders fell by half between 1975 and 1979, from 1.0% to 0.5%. The rate then held amazingly steady for about 14 years, until 1993. Use then rose in the mid- and late 1990s, reaching peak levels in 1996 among 8th graders (1.6%), in 1997 among 10th grad-ers (1.4%), and in 2000 among 12th graders (1.5%). Since those peak levels, use has declined, with annual prevalence in all three grades at 0.8% or 0.9% in 2005 to 2007. The questions about use with and without a needle were not introduced until the 1995 survey, so they did not encompass much of the period of increasing heroin use. Responses to these questions showed that by then about equal proportions of all users at 8th grade were using heroin by each of the two methods of ingestion, and some—nearly a third of the users—were using by both means. At 10th grade a somewhat higher proportion of all users took heroin without a needle, and at 12th grade a higher proportion still. Much of the remaining increase in overall heroin use beyond 1995 occurred in the proportions using it without injecting, which we strongly suspect was true in the immediately preceding period of increase as well. Likewise, most of the decrease in use since the recent peak levels has been due to decreasing use of heroin without a needle.
Perceived Risk Students have long seen heroin to be one of the most dangerous drugs, which no doubt helps to account both for the consistently high level of personal disap-proval of use (see next section) and the quite low prevalence of use. Nevertheless, there have been some changes in perceived risk levels over the years. Be-tween 1975 and 1986, perceived risk gradually de-clined, even though use dropped and then stabilized in that interval. Then there was an upward shift in 1987 (the same year that perceived risk for cocaine jumped dramatically) to a new level, where it held for four years. In 1992, perceived risk dropped to a lower pla-teau again, a year or two before use started to rise. Perceived risk then rose again in the latter half of the 1990s, and use leveled off and subsequently declined. Based on the short interval for which we have such data from 8th and 10th graders, the tables at the end of this report illustrate that perceived risk of use without a needle rose in the lower grades between 1995 and 1997, foretelling an end to the increase in use. Note that perceived risk has served as a leading indicator of use for this drug, as well as for a number of others.
Disapproval There has been little fluctuation in the very high disapproval levels for heroin use over the years, although what change there was in the last half of the 1990s was consistent with the concurrent changes in perceived risk and use.
Availability The proportion of 12th-grade students saying they could get heroin fairly easily if they wanted some remained around 20% through the mid-1980s; it then increased considerably from 1986 to 1992 before stabilizing at about 35% from 1992 through 1998. At the lower grade levels, reported availability has been lower. Availability has declined some since 1995, 1997, and 1998 among 8th, 10th, and 12th graders, respectively.
26

Heroin: Trends in Annual Use, Risk, Disapproval, and AvailabilityGrades 8, 10, and 12
0
1
2
3
4
5
'75 '77 '79 '81 '83 '85 '87 '89 '91 '93 '95 '97 '99 '01 '03 '05 '07
12th Grade10th Grade8th Grade
0
20
40
60
80
100
'75 '77 '79 '81 '83 '85 '87 '89 '91 '93 '95 '97 '99 '01 '03 '05 '07
0
20
40
60
80
100
'75 '77 '79 '81 '83 '85 '87 '89 '91 '93 '95 '97 '99 '01 '03 '05 '07
0
20
40
60
80
100
'75 '77 '79 '81 '83 '85 '87 '89 '91 '93 '95 '97 '99 '01 '03 '05 '07
% who used in last 12 months % seeing “great risk” in using once or twice*
% saying “fairly easy” or “very easy” to get% disapproving of using once or twice*
YEAR YEAR
YEAR YEAR
*Prior to 1995, the questions asked about heroin use in general. Since 1995, the question has asked specifically about heroin use without a needle.
Use Risk
Disapproval Availability
Source. The Monitoring the Future study, the University of Michigan.
PE
RC
EN
TP
ER
CE
NT
PE
RC
EN
TP
ER
CE
NT
27

Narcotics other than Heroin
There are a number of narcotic drugs other than heroin—all controlled substances. Many are analgesics that can be prescribed by physicians and dentists for the control of pain. Like heroin, many are derived from opium, but there are also a number of synthetic analogues in use today, including OxyContin and Vicodin. Throughout the life of the study, we have asked about the use of any narcotic drug other than heroin without specifying which one. Examples of drugs in the class are provided in the question. In one of the six 12th-grade questionnaire forms, however, respondents indicating that they had used any narcotic in the past 12 months were then asked to check which of a fairly complete list of such drugs they used. Table E-4 in appendix E of Volume I in this annual monograph series provides trends in their annual prevalence data. In the late 1970s, opium and codeine were among the narcotics most widely used. In recent years Vicodin, codeine, Percocet, and OxyContin are the most popular.
Trends in Use Use is reported only for 12th graders, because we considered the data from 8th and 10th graders to be of questionable validity. As shown in the first panel of the facing page, the use of narcotics other than heroin by 12th graders generally trended down from about 1977 through 1992. After 1992 use rose rather steeply, with annual prevalence increasing from 3.3% in 1992 to 9.5% in 2004, before leveling. (In 2002 the question was revised to add Vicodin, OxyContin, and Percocet to the examples given, which apparently had
the effect of increasing reported prevalence. So the extent of the increase may be exaggerated, but probably not by much, because these drugs came onto the scene later, during the rise.) Two drugs of recent interest—OxyContin and Vicodin—are charted in the second and third panels on the facing page, in a deviation from the usual arrangement. (There are no data to display for perceived risk or disapproval of use of narcotics other than heroin.) OxyContin use increased for all grades over the interval 2002 (when it was first measured) through 2007, though the trend lines have been irregular. Annual prevalence in 2007 was 1.8%, 3.9%, and 5.2% in grades 8, 10, and 12, respectively. Use of Vicodin, on the other hand, has remained fairly constant since 2002, though at considerably higher levels than OxyContin. In 2007 annual prevalence rates were 2.7%, 7.2%, and 9.6% in grades 8, 10, and 12.
Availability Questions were asked about the availability of other narcotics, taken as a class. Perceived availability increased among 12th graders from 1978 through 1989, even as reported use was dropping. Availability rose again after 1992, this time accompanying an increase in reported use. Since 2003, availability has remained level at about 40% until 2007, when availability declined to 37%. This compares with 26% in 1978. By way of contrast, in the lower grades reported availability has been declining since about 1997.
28

Narcotics other than Heroin (including OxyContin and Vicodin): Trends in Annual Use and AvailabilityGrades 8, 10, and 12
0
4
8
12
16
20
'75 '77 '79 '81 '83 '85 '87 '89 '91 '93 '95 '97 '99 '01 '03 '05 '07
12th Grade10th Grade8th GradeLine 4
0
20
40
60
80
100
'75 '77 '79 '81 '83 '85 '87 '89 '91 '93 '95 '97 '99 '01 '03 '05 '07
0
4
8
12
16
20
'75 '77 '79 '81 '83 '85 '87 '89 '91 '93 '95 '97 '99 '01 '03 '05 '07
0
4
8
12
16
20
'75 '77 '79 '81 '83 '85 '87 '89 '91 '93 '95 '97 '99 '01 '03 '05 '07
% who used any narcotics other than heroin % who used OxyContin in last 12 months
% saying other narcotics are “fairly easy”% who used Vicodin in last 12 months
YEAR
YEAR
YEAR
YEAR
Use of Narcotics other than Heroin
Vicodin Use Availability
*Beginning in 2002, a revised set of questions on other narcotics use was introduced, in which Talwin, laudanum, and paregoric were replaced with Vicodin, OxyContin, and Percocet.
or “very easy” to get
in last 12 months*
OxyContin Use
PE
RC
EN
TP
ER
CE
NT
PE
RC
EN
TP
ER
CE
NT
Source. The Monitoring the Future study, the University of Michigan.
29

Tranquilizers
Tranquilizers constitute another class of psycho-therapeutic drugs that are legally sold only by prescription, like amphetamines. They are central nervous depressants and, for the most part, are comprised of benzodiazepines (minor tranquilizers), although some nonbenzodiazepines have been introduced. Respondents are instructed to exclude any medically prescribed use from their answers. At present, Valium and Xanax are the two tranquilizers most commonly used by students. In 2001 the examples given in the question on tranquilizers were modified to reflect changes in the drugs in common use—Miltown was dropped and Xanax was added. As the first panel on the facing page shows, this caused a modest increase in the reported level of tranquilizer use in the upper grades, so we have broken the trend line to reflect the point of redefinition.
Trends in Use During the late 1970s and all of the 1980s, tranquilizers fell steadily from popularity, with use declining by three quarters among 12th graders over the 15-year interval between 1977 and 1992. Their use then increased during the 1990s, as happened with many other drugs. Annual prevalence more than doubled among 12th graders, rising steadily through 2002, before leveling. Use also rose steadily among 10th graders, but began to decline some in 2002. Use peaked much earlier among 8th graders, in 1996, and then declined slightly for two years. Tranquilizer use has remained relatively stable since then among the 8th graders, at considerably lower levels than the
upper two grades. From 2002 to 2005 there was some decline among 10th graders, followed by a leveling, while among 12th graders there has been a gradual continuing decline since 2002. The staggered nature of the declines and leveling across grades suggests that a cohort effect is at work. It also suggests that the modest decline among 12th graders will likely end in a year or two.
Perceived Risk Data have not been collected on perceived risk, primarily due to questionnaire space limitations.
Disapproval Data have not been collected on disapproval, for the same reason.
Availability As the number of 12th graders reporting non-medically prescribed tranquilizer use fell dramatically during the 1970s and 1980s, so did the proportion saying that tranquilizers would be fairly or very easy to get. Whether declining use caused the decline in availability, or vice versa, is unclear. Perceived availability fell by two thirds—from 72% in 1975 to 24% by 2007. Most of that decline occurred before the 1990s. There was a further drop in availability during the 1990s at all three grade levels, despite the fact that use rose a bit. Availability is down some in the 2000s in all three grades.
30

Tranquilizers: Trends in Annual Use and AvailabilityGrades 8, 10, and 12
0
6
12
18
24
30
'75 '77 '79 '81 '83 '85 '87 '89 '91 '93 '95 '97 '99 '01 '03 '05 '07
12th Grade10th Grade8th Grade
0
20
40
60
80
100
'75 '77 '79 '81 '83 '85 '87 '89 '91 '93 '95 '97 '99 '01 '03 '05 '07
0
20
40
60
80
100
'75 '77 '79 '81 '83 '85 '87 '89 '91 '93 '95 '97 '99 '01 '03 '05 '07
0
20
40
60
80
100
'75 '77 '79 '81 '83 '85 '87 '89 '91 '93 '95 '97 '99 '01 '03 '05 '07
% who used in last 12 months* % seeing “great risk” in using once or twice
% saying “fairly easy” or “very easy” to get% disapproving of using once or twice
YEAR YEAR
YEAR YEAR
Use Risk
Disapproval Availability
(no data)
(no data)
*Beginning in 2001, a revised set of questions on tranquilizer use was introduced, in which Xanax replaced Miltown in the list of examples.
Source. The Monitoring the Future study, the University of Michigan.
PE
RC
EN
TP
ER
CE
NT
PE
RC
EN
TP
ER
CE
NT
31

Sedatives (Barbiturates)
Like tranquilizers, sedatives are prescription-controlled psychotherapeutic drugs that are central nervous system depressants. They are used to assist sleep and relieve anxiety. Though for many years respondents have been asked specifically about their use of barbiturate sedatives, they likely have been including other classes of sedatives in their answers. In 2004 the question on use was revised to say “sedatives (barbiturates)”—a change that appeared to have practically no impact on the reported levels of use. Respondents are routinely instructed to exclude from their answers any use that occurred under medical supervision. Usage data are reported only for 12th graders because we believe that students in the lower grades tend to overreport use, perhaps including their use of nonprescription sleep aids or other over-the-counter drugs.
Trends in Use Like tranquilizers, the use of sedatives (barbiturates) fell rather steadily among 12th graders from the mid-1970s through the early 1990s. From 1975 to 1992, use fell by three fourths, from 10.7% annual prevalence to 2.8%. As with many other drugs, a gradual, long-term resurgence in sedative use occurred after 1992, and use continued to rise steadily through 2005. Since 2005, use has declined, but in 2007 the prevalence rate is still near its recent peak, though not as high as it had been in the late 1970s. A specific sedative, methaqualone, has been included in the study from the beginning. In 1975, methaqualone use was about half the level of barbiturate use. Its use declined steadily from 1981, when annual prevalence was 7.6%, through 1993, when annual prevalence reached the negligible level of 0.2%. Use increased some for a couple of years, reaching 1.1% in 1996, where it remained through 1999 before declining to 0.8% in 2001, about where it has remained since.
Perceived Risk Trying sedatives (barbiturates) was never seen by most students as very dangerous, and it is clear from the second panel on the facing page that perceived risk cannot do much to explain the trends in use that occurred from 1975 through 1986, at least. Perceived risk actually declined a bit between 1975 and 1986—an interval in which use was also declining. But then perceived risk shifted up some through 1991, consis-tent with the fact that use was still falling. It dropped back some through 1995, as use was increasing, and then remained relatively stable for a few years. Per-ceived risk has not changed much since 1999.
Disapproval Like many of the illicit drugs other than marijuana, sedative (barbiturate) use has received the disapproval of the great majority of high school graduating classes since 1975, although there have been some changes in level. Those changes have generally been consistent with the changes in actual use observed. Disapproval of using these drugs once or twice rose from 78% in 1975 to a high of 91% in 1990, where it held for two years. Then disapproval eroded a bit to 86% by 2000 during a period of increasing use. As discussed above, the question text was changed slightly in 2004, which appeared to have the effect of lessening disapproval slightly. There has been little increase since 2004.
Availability As the fourth panel on the facing page shows, the availability of sedatives (barbiturates) has generally been declining during most of the life of the study, except for one shift up that occurred in 1981—a year in which we believe that so-called “look-alike” drugs (probably including sedative look-alikes) became more widespread. (The change in question text in 2004 appears to have had the effect of raising reported availability among the 12th graders.)
32

Sedatives (Barbiturates): Trends in Annual Use, Risk, Disapproval, and Availability
Grades 8, 10, and 12
0
6
12
18
24
30
'75 '77 '79 '81 '83 '85 '87 '89 '91 '93 '95 '97 '99 '01 '03 '05 '07
12th Grade10th Grade8th GradeLine 4
0
20
40
60
80
100
'75 '77 '79 '81 '83 '85 '87 '89 '91 '93 '95 '97 '99 '01 '03 '05 '07
0
20
40
60
80
100
'75 '77 '79 '81 '83 '85 '87 '89 '91 '93 '95 '97 '99 '01 '03 '05 '07
0
20
40
60
80
100
'75 '77 '79 '81 '83 '85 '87 '89 '91 '93 '95 '97 '99 '01 '03 '05 '07
% who used in last 12 months* % seeing “great risk” in using once or twice*
% saying “fairly easy” or “very easy” to get*% disapproving of using once or twice*
YEAR YEAR
YEAR YEAR
Use Risk
Disapproval Availability
*In 2004, the question text was changed from “barbiturates” to “sedative/barbiturates” and the list of examples was changed.
Source. The Monitoring the Future study, the University of Michigan.
PE
RC
EN
TP
ER
CE
NT
PE
RC
EN
TP
ER
CE
NT
33

Ecstasy (MDMA) and Other “Club Drugs”
There are a number of “club drugs,” so labeled because they have been popular at night clubs and “raves.” They include LSD, MDMA (“ecstasy”), methamphetamine, GHB (gammahydroxybutyrate), ketamine (“special K”), and Rohypnol. We deal here primarily with ecstasy, Rohypnol, ketamine, and GHB, because LSD and methamphetamine have been discussed already. Rohypnol and GHB, both of which can induce amne-sia while under the influence, also have been labeled “date rape drugs.” The annual prevalence of GHB use in 2007 was 0.7%, 0.6%, and 0.9% in grades 8, 10, and 12, and the annual prevalence of ketamine use was 1.0%, 0.8%, and 1.3%. Both have shown considerable drops since their recent peak levels of use—on the order of four tenths to six tenths (see Table 2). Rohypnol was added to the survey in 1996, and low levels of use were reported—annual prevalence around 1% in all three grade levels. Use at 8th grade declined to 0.5% by 1999 before leveling. In the upper two grades, use first rose for a year or two before beginning to fall back. Use at 10th grade has fallen by nearly one half since the peak rate in 1997, but by just over one fourth from the recent peak in 12th grade. There are no questions on risk, dis-approval, or availability for GHB, ketamine, or Rohypnol.
Trends in Ecstasy Use Ecstasy is used more for its mildly hallucinogenic properties than for its stimulant properties. Questions about its use were added to the secondary school stu-dent surveys in 1996. (They were asked of college students and adults since 1989; and ecstasy use began to rise above trace levels in 1995, continuing through 2001 for young adults.) Annual prevalence of ecstasy use in 10th and 12th grades in 1996 was 4.6%—actually considerably higher than among college students and young adults at that time—but it fell in both grades over the next two years. Use then rose sharply in both grades in 1999 through 2001, bringing annual prevalence up to 6.2% among 10th graders and 9.2% among 12th graders. In 2000 and 2001, use also began to rise among 8th graders, to 3.5%. In 2002, use decreased sharply—by about one fifth—in all three grades, fol-lowed by an even sharper decline in 2003. The drops
continued in 2004, but decelerated considerably. By 2005 the decline had halted among 8th and 10th grad-ers, but it continued for another year among 12th graders. For the past two or three years, use has in-creased among 10th and 12th graders, raising the con-cern that a new epidemic of ecstasy use may be de-veloping. In 2007, annual prevalence rates are still below the recent peak levels reached in 2001 by be-tween two fifths and two thirds in all three grades.
Perceived Risk There was little change in 12th graders’ perceived risk of ecstasy use until 2001, when it jumped by eight percentage points, and then by another seven per-centage points in 2002. Significant increases occurred again in 2003 for all grades. This very sharp rise likely explains the turnaround in use, as we had pre-dicted it would. Perceived risk continued to increase among 12th graders through 2005. Since 2004 we have seen a troubling drop in perceived risk, first among the 8th and 10th graders, then among the 12th graders. This shift corresponds to the increase in use in the upper two grades, and suggests to us that there may well be a “generational forgetting” of the dangers of ecstasy use as a result of generational replacement.
Disapproval Disapproval of ecstasy use had been declining slightly after 1998, but increased significantly in all three grades in 2002, along with the rise in perceived risk. The significant increases in disapproval continued through 2003 for 8th graders, 2004 for 10th graders, and 2006 for 12th graders. Since those peaks, disapproval has been dropping, particularly among 8th graders. We believe that the erosion in perceived risk and disapproval amongthe younger students makes them vulnerable to a rebound in ecstasy use.
Availability The figure shows a dramatic rise in 12th graders’ perceived availability of ecstasy after 1991, particularly between 1999 and 2001. Perceived availability declined among 8th graders into 2007, however, the decline in the upper grades halted in either 2006 or 2007. Availability clearly does not account for the rebound in use so far.
34

Ecstasy (MDMA): Trends in Annual Use, Risk, Disapproval, and AvailabilityGrades 8, 10, and 12
0
2
4
6
8
10
'75 '77 '79 '81 '83 '85 '87 '89 '91 '93 '95 '97 '99 '01 '03 '05 '07
12th Grade10th Grade8th Grade
0
20
40
60
80
100
'75 '77 '79 '81 '83 '85 '87 '89 '91 '93 '95 '97 '99 '01 '03 '05 '07
0
20
40
60
80
100
'75 '77 '79 '81 '83 '85 '87 '89 '91 '93 '95 '97 '99 '01 '03 '05 '07
0
20
40
60
80
100
'75 '77 '79 '81 '83 '85 '87 '89 '91 '93 '95 '97 '99 '01 '03 '05 '07
% who used in last 12 months % seeing “great risk” in using once or twice
% saying “fairly easy” or “very easy” to get% disapproving of using once or twice
YEAR YEAR
YEAR YEAR
Use Risk
Disapproval Availability
Source. The Monitoring the Future study, the University of Michigan.
PE
RC
EN
TP
ER
CE
NT
PE
RC
EN
TP
ER
CE
NT
35

Alcohol
Alcoholic beverages have been among the most widely used substances by American young people for a very long time. In 2007 the proportions of 8th, 10th, and 12th graders who admitted drinking an alcoholic beverage in the 30-day period prior to the survey were 16%, 33%, and 44%, respectively. A number of measures of alcohol use are presented in the tables at the end of this report. Here we focus on the pattern of alcohol consumption that is probably of the greatest concern from a public health perspective—episodic heavy drinking, or what we have called “binge drinking.” The measure is the reported number of occasions on which the respondent had five or more drinks in a row during the prior two-week interval. The first panel shows the percentage of respondents doing so at least once in the prior two weeks.
Trends in Use Among 12th graders, binge drinking reached its peak at about the same time as overall illicit drug use, in 1979. It held steady for a few years before declining substantially from 41% in 1983 to a low of 28% in 1992 (also the low point of any illicit drug use). This was a drop of almost one third in binge drinking. Although illicit drug use rose by considerable proportions in the 1990s, binge drinking rose by only a small fraction—about four percentage points among the 12th graders—between 1992 and 1998. There was some upward drift between 1991 (13%) and 1996 (16%) among 8th graders, between 1992 (21%) and 1999 (26%) among 10th graders, and between 1993 (28%) and 1998 (32%) among 12th graders. In the years since those recent peaks, there has been some decline in binge drinking at all three grades—one third at 8th grade, one sixth in 10th grade, and one seventh in 12th grade. In 2007, binge drinking decreased among 8th graders, remained level among 10th graders, and rose slightly among 12th graders. One point to note in these findings is that there is no evidence of any “displacement effect” in the aggregate between alcohol and marijuana—a hypothesis frequently heard. The two drugs have moved much more in parallel over the years than in opposite directions.
Perceived Risk For most of the study, the majority of 12th graders have not viewed binge drinking on weekends as carrying a great risk (second panel). However, an increase from 36% to 49% occurred between 1982 and 1992. There then followed a modest decline to 43% by 1997, before it stabilized. In recent years, perceived risk had been rising some, but it declined in 2007 to 46%. These changes track fairly well the changes in actual binge drinking. We believe that the public service advertising campaigns in the 1980s against drunk driving, as well as those that urged use of designated drivers when drinking, may have contributed to the increase in perceived risk of binge drinking in general. As we have published elsewhere, drunk driving by 12th graders declined during that period by an even larger proportion than binge drinking. Also, we have demonstrated that increases in the minimum drinking age that occurred during the 1980s were followed by reductions in drinking, and increases in perceived risk associated with drinking.
Disapproval Disapproval of weekend binge drinking moved fairly parallel with perceived risk, suggesting that such drinking (and very likely the drunk-driving behavior often associated with it) became increasingly unacceptable in the peer group. Note that the rates of disapproval and perceived risk for binge drinking are higher in the lower grades than in 12th grade. There has been some increase in disapproval in the lower grades since 2001, including a significant increase for 8th grade in 2007. As with perceived risk, disapproval has increased appreciably in all grades in recent years, especially in the upper grades.
Availability Perceived availability of alcohol, which until 1999 was asked only of 8th and 10th graders, was very high and mostly steady in the 1990s. Since 1996, however, there has been a significant decline in 8th grade (particularly) and 10th grade. For 12th grade, availability has declined very slightly but is still at a very high level, with 92% saying that it is, or would be, fairly easy or very easy for them to get alcohol.
36

Alcohol: Trends in Binge Drinking, Risk, Disapproval, and AvailabilityGrades 8, 10, and 12
0
20
40
60
80
100
'75 '77 '79 '81 '83 '85 '87 '89 '91 '93 '95 '97 '99 '01 '03 '05 '07
12th Grade10th Grade8th Grade
0
20
40
60
80
100
'75 '77 '79 '81 '83 '85 '87 '89 '91 '93 '95 '97 '99 '01 '03 '05 '07
0
20
40
60
80
100
'75 '77 '79 '81 '83 '85 '87 '89 '91 '93 '95 '97 '99 '01 '03 '05 '07
0
20
40
60
80
100
'75 '77 '79 '81 '83 '85 '87 '89 '91 '93 '95 '97 '99 '01 '03 '05 '07
% seeing “great risk” in having 5+ drinks in a row
% saying “fairly easy” or “very easy”% disapproving of having 5+ drinks in a row
YEAR YEAR
YEAR YEAR
once or twice each weekend
once or twice each weekend to get alcohol
Use Risk
Disapproval Availability
% who had 5+ drinks in a rowin previous 2 weeks
PE
RC
EN
TP
ER
CE
NT
PE
RC
EN
TP
ER
CE
NT
Source. The Monitoring the Future study, the University of Michigan.
37

Cigarettes
Cigarette smoking is the leading cause of preventable disease and mortality in the United States. It is usually initiated in adolescence.
Trends in Use Differences in smoking rates between various birth cohorts (or, in this case, school class cohorts) tend to stay with those cohorts throughout the life cycle. This means that it is critical to prevent smoking very early. It also means that the trends in a given historical period may differ across various grade levels as changes occurring earlier in adolescence work their way up the age spectrum. Among 12th graders, 30-day prevalence of smoking reached a peak in 1976, at 39%. (The peak likely occurred considerably earlier for lower grade levels as these same class cohorts passed through them in previous years.) There was about a one quarter drop in the 12th-grade 30-day prevalence between 1976 and 1981, when the rate reached 29%, and remained there until 1992 (28%). In the 1990s, smoking began to rise sharply, starting in 1992 among 8th and 10th graders and in 1993 among 12th graders. Over the next four to five years, smoking rates increased by about one half in the lower two grades and by almost one third in grade 12—very substantial increases. Smoking peaked in 1996 for 8th and 10th graders and in 1997 for 12th graders before beginning a fairly steady and substantial decline—a decline that continued through 2004 for 8th and 10th graders (12th graders increased a bit in 2004). Between those peak levels in the mid-1990s and 2004, 30-day prevalence of smoking de-clined by 56% in 8th grade, 47% in 10th, and 32% in 12th. It is noteworthy, however, that this important decline in adolescent smoking decelerated sharply after about 2002. There has been some further decline since 2004 in all grades. In 2007 there was a significant drop in 30-day and daily prevalence among 8th graders, a slight drop in both measures for 10th graders and no further change for 12th graders.
Perceived Risk Among 12th graders, the proportion seeing great risk in pack-a-day smoking rose before and during the first decline in use. It leveled in 1980 (before use leveled), declined a bit in 1982, but then started to rise again
gradually for five years. (It is possible that cigarette advertising effectively offset the influence of rising perceptions of risk during that five-year period.) Per-ceived risk fell some in the early 1990s at all three grade levels as use increased sharply. After 1995, risk began to climb in all three grades (a year before smoking started to decline in grade 12). Between 2000 and 2003, perceived risk leveled in all grades. In 2004, it increased in all grades, but since 2004 only the 12th grade has shown further rise, very likely due to a cohort effect playing itself out. Note the disparity of the degrees of perceived risk among grade levels. There is a clear age effect, but by the time most youngsters fully appreciate the hazards of smoking, many have already initiated the behavior.
Disapproval Disapproval rates for smoking have been fairly high throughout the study and, unlike perceived risk, are higher in the lower grade levels. Among 12th graders, there was a gradual increase in disapproval of smok-ing from 1976 to 1986, some erosion over the follow-ing five years, then a steeper erosion from the early 1990s through 1997. Since 1997, disapproval has been increasing among 12th graders. In the lower grades, disapproval declined between 1991 and 1996, the period of sharply increasing use. Since those low points, there was a fairly steady increase in disap-proval in all grades, continuing into 2007 in the two lower grades. We measure a number of other smok-ing-related attitudes, and these also became increas-ingly negative in recent years (see Table 3 in the 2007 MTF press release on teen smoking, available at www.monitoringthefuture.org).
Availability When the question was first introduced in 1992, availability of cigarettes was reported to be very high by 8th (78% saying fairly or very easy to get) and 10th graders (89%). (We do not ask the question of 12th graders, for whom we assume accessibility to be nearly universal.) Since 1996, availability has been steadily declining, especially among 8th graders. In 2007, there were significant drops at both 8th and 10th grades; 56% of 8th graders and 78% of 10th graders now say that cigarettes would be easy to get.
38

Cigarettes: Trends in 30-Day Use, Risk, Disapproval, and AvailabilityGrades 8, 10, and 12
0
20
40
60
80
100
'75 '77 '79 '81 '83 '85 '87 '89 '91 '93 '95 '97 '99 '01 '03 '05 '07
12th Grade10th Grade8th Grade
0
20
40
60
80
100
'75 '77 '79 '81 '83 '85 '87 '89 '91 '93 '95 '97 '99 '01 '03 '05 '07
0
20
40
60
80
100
'75 '77 '79 '81 '83 '85 '87 '89 '91 '93 '95 '97 '99 '01 '03 '05 '07
0
20
40
60
80
100
'75 '77 '79 '81 '83 '85 '87 '89 '91 '93 '95 '97 '99 '01 '03 '05 '07
% who used in past 30 days% seeing “great risk” in smoking a pack
% saying “fairly easy” or “very easy” to get% disapproving of smoking a pack
YEAR YEAR
YEAR YEAR
or more per day
or more per day
UseRisk
Disapproval Availability
Source. The Monitoring the Future study, the University of Michigan.
PE
RC
EN
TP
ER
CE
NT
PE
RC
EN
TP
ER
CE
NT
39
Smokeless Tobacco
Smokeless tobacco comes in two forms: “snuff” and “chew.” Snuff is finely ground tobacco usually sold in tins, either loose or in packets. It is held in the mouth between the lip or cheek and the gums. Chew is a leafy form of tobacco, usually sold in pouches. It too is held in the mouth and may, as the name implies, be chewed. In both cases, nicotine is absorbed by the mucous membranes of the mouth. Smokeless tobacco is sometimes called “spit” tobacco because users spit out the tobacco juices and saliva (which is stimulated by the tobacco) that accumulate in the mouth.
Trends in Use The use of smokeless tobacco by teens had been decreasing gradually, and 30-day prevalence is now only about half of peak levels in the mid-1990s. Among 8th graders, 30-day prevalence dropped from a 1994 peak of 7.7% to a low of 3.3% in 2002, about where it remains in 2007 (3.3%); 10th graders’ use was down from a 1994 peak of 10.5% to 4.9% in 2004, but has since risen to 6.1% by 2007; and 12th graders’ use decreased from a 1995 peak of 12.2% to 6.5% in 2002, before leveling (it is 6.6% in 2007). Thirty-day prevalence of daily use of smokeless tobacco also fell gradually, but appreciably, in recent years. The daily usage rates in 2007 are 0.8%, 1.6%, and 2.8% in grades 8, 10, and 12—down substantially from the peak levels recorded in the 1990s but, again, the declines have halted. It should be noted that smokeless tobacco use among American young people is almost exclusively a male behavior. For example, among males the 30-day prevalence rates in 2007 are 4.7%, 10.2%, and 11.9% in grades 8, 10, and 12, respectively, versus 1.7%, 2.0%, and 1.2% among females. The respective
current daily use rates for males are 1.6%, 2.9%, and 5.6% compared to 0.1%, 0.3%, and 0.2% for females.
Perceived Risk The most recent low point in the level of perceived risk for smokeless tobacco was 1995 in all three grades. Since 1995 there has been a gradual but sub-stantial increase in proportions saying that there is a great risk in using it regularly—among 8th graders, from 34% to 42% in 2007; and among 10th graders, from 38% to 47%. Among 12th graders, perceived risk increased from 33% in 1995 to 46% in 2006 be-fore falling back to 44% in 2007. It thus appears that one important reason for the appreciable declines in smokeless tobacco use during the latter half of the 1990s was the fact that an increasing proportion of young people were persuaded of the dangers of using it. But the increase in perceived risk appears to be over.
Disapproval Only 8th and 10th graders are asked about their personal disapproval of using smokeless tobacco regularly. The most recent low points for disapproval in both grades were 1995 and 1996. Since 1996, disapproval rose among 8th graders from 74% to 82% in 2005, where it remains in 2007, and from 71% to 81% among 10th graders, with little further change through 2007.
Availability There are no questions in the study concerning the perceived availability of smokeless tobacco.
40

Smokeless Tobacco: Trends in 30-Day Use, Risk, and Disapproval Grades 8, 10, and 12
0
6
12
18
24
30
'75 '77 '79 '81 '83 '85 '87 '89 '91 '93 '95 '97 '99 '01 '03 '05 '07
12th Grade10th Grade8th Grade
0
20
40
60
80
100
'75 '77 '79 '81 '83 '85 '87 '89 '91 '93 '95 '97 '99 '01 '03 '05 '07
0
20
40
60
80
100
'75 '77 '79 '81 '83 '85 '87 '89 '91 '93 '95 '97 '99 '01 '03 '05 '07
% who used in past 30 days % seeing “great risk” in using regularly
% disapproving of using regularly
YEAR YEAR
YEAR
0
20
40
60
80
100
'75 '77 '79 '81 '83 '85 '87 '89 '91 '93 '95 '97 '99 '01 '03 '05 '07
% saying “fairly easy” or “very easy” to get
(no data)
YEAR
Use Risk
Disapproval Availability
Source. The Monitoring the Future study, the University of Michigan.
PE
RC
EN
TP
ER
CE
NT
PE
RC
EN
TP
ER
CE
NT
41

Steroids
Unlike all other drugs discussed in this volume, anabolic steroids are not usually taken for their psychoactive effects but rather for their physical effects on the body, in particular for their effects on muscle and strength development. They are similar to most other drugs studied here in two respects: they can have adverse consequences for the user, and they are controlled substances for which there is an illicit market. Questions about their use were added to the study beginning in 1989. Respondents are asked: “Steroids, or anabolic steroids, are sometimes prescribed by doctors to promote healing from certain types of injuries. Some athletes, and others, have used them to try to increase muscle development. On how many occasions (if any) have you taken steroids on your own—that is, without a doctor telling you to take them . . . ?” In 2006 the question text was changed slightly in some questionnaire forms—with the phrase “to promote healing from certain types of injuries” being replaced with “to treat certain conditions.” The resulting data did not show any effect from this rewording. In 2007 the remaining forms were changed in the same manner.
Trends in Use Anabolic steroids are used predominately by males; therefore, data based on all respondents can mask the higher rates and larger fluctuations that occur among males. (For example, in 2007, annual prevalence rates were 1.1%, 1.7%, and 2.3% for boys in grades 8, 10, and 12, compared with 0.4%, 0.4%, and 0.6% for girls.) Between 1991 and 1998, the overall annual prevalence rate was fairly stable among 8th and 10th graders, ranging between 0.9% and 1.2%. In 1999, however, use jumped from 1.2% to 1.7% in both 8th and 10th grades. Almost all of that increase occurred among boys (increasing from 1.6% in 1998 to 2.5% in 1999 in 8th grade and from 1.9% to 2.8% in 10th grade). Thus, the rates among boys increased by about 50% in a single year. Among 8th graders, steroid use has declined since then and is down overall to 0.8% in 2007. Among 10th graders, use continued to increase, reaching 2.2% in 2002, but then declined to 1.1% by 2007. In 12th grade there was a different trend story. With data going back to 1989, we can see that steroid use first fell from 1.9% overall in 1989 to 1.1% in 1992—the low point. From 1992 to 1999 there was a more gradual increase in use, reaching 1.7% in 2000.
In 2001, use rose significantly among 12th graders to 2.4% (possibly reflecting the effect of the younger, heavier-using cohorts getting older). Use was at 2.5% in 2004 and decreased significantly to 1.5% in 2005 and 1.4% in 2007. Use at the lower grades is now down by about half from their peak levels, and at 12th grade by about four tenths. The use of androstenedione—a steroid precursor—has also declined sharply since 2001.
Perceived Risk Perceived risk and disapproval were asked of 8th and 10th graders for only a few years, before the ques-tionnaire space was allocated to other items. All grades seemed to have a peak in perceived risk around 1993. The longer-term data from 12th graders, how-ever, show a six-percentage-point drop between 1998 and 1999, another four-percentage-point drop in 2000, and an additional three-percentage-point drop by 2003 (to 55%, the lowest point ever). A change this sharp is quite unusual and highly significant, suggesting that some particular event (or events) in 1998 made ster-oids seem less risky. (Although we lack a direct meas-ure, it seems likely that there was at least as large a drop in the lower grades, as well, where the sharp up-turn in use occurred that year.) By 2007, perceived risk for 12th graders was at 57%.
Disapproval Disapproval of steroid use has been quite high for some years. By 2000 there was only slight falloff in disapproval, despite the decline in perceived risk, but between 1998 and 2003 there was a modest decrease in disapproval as well. Since then, disapproval has risen some as perceived risk has risen and use has declined.
Availability Perceived availability of steroids is relatively high and increases with grade level. Some substances were sold over-the-counter. Androstenedione was legally avail-able until January 2005, when it was classified as a Schedule III controlled substance. Reported steroid availability has declined some in all grades since 2002.
42

Steroids: Trends in Annual Use, Risk, Disapproval, and AvailabilityGrades 8, 10, and 12
0
1
2
3
4
5
'75 '77 '79 '81 '83 '85 '87 '89 '91 '93 '95 '97 '99 '01 '03 '05 '07
12th Grade10th Grade8th Grade
0
20
40
60
80
100
'75 '77 '79 '81 '83 '85 '87 '89 '91 '93 '95 '97 '99 '01 '03 '05 '07
0
20
40
60
80
100
'75 '77 '79 '81 '83 '85 '87 '89 '91 '93 '95 '97 '99 '01 '03 '05 '07
0
20
40
60
80
100
'75 '77 '79 '81 '83 '85 '87 '89 '91 '93 '95 '97 '99 '01 '03 '05 '07
% who used in last 12 months % seeing “great risk” in using once or twice
% saying “fairly easy” or “very easy” to get% disapproving of using once or twice
YEAR YEAR
YEAR YEAR
Use Risk
Disapproval Availability
Source. The Monitoring the Future study, the University of Michigan.
PE
RC
EN
TP
ER
CE
NT
PE
RC
EN
TP
ER
CE
NT
43

Subgroup Differences
Understanding the important subgroup variations in substance use among the nation’s youth allows for more informed considerations of substance use etiology and prevention. In this section, we present a brief overview of some of the major demographic subgroup differences. Space does not permit a full discussion or documentation of the many subgroup differences on the host of drugs covered in this report. However, the much longer Volume I in this series—including the one published in 2007 and the one forthcoming in 2008—contains an extensive appendix with tables giving the subgroup prevalence levels and trends for all of the classes of drugs discussed here. Chapters 4 and 5 in Volume I also present a more in-depth discussion and interpretation of those subgroup differences. Comparisons are made by gender, college plans, region of the country, community size, socio-eonomic level (as measured by the educational level of the parents), and race/ethnicity. Monitoring the Future Occasional Paper 67—to be succeeded by Occasional Paper 69 (forthcoming)—is available on the study’s Web site (www.monitoringthefuture.org), and provides in graphic form the many subgroup trends for all drugs. The reader may wish to access the graphic version of this material available in this online occasional paper, because it is so much easier to comprehend the findings with a pictoral display of the subgroup trend data over time than with the tabular material provided in Volume I.
Gender Generally, we have found males to have somewhat higher rates of illicit drug use than females (particularly, higher rates of frequent use), and much higher rates of smokeless tobacco and steroid use. Males generally have had higher rates of heavy drinking; however, in their 30-day prevalence of alcohol use at 8th grade, the girls overtook the boys in 2002 and have had higher rates since. At 10th grade, girls overtook boys in 2005 and have remained equivalent since. The genders have had roughly equivalent rates of cigarette smoking (although among 12th graders the two genders have reversed order twice during the life of the study). In 2007, 30-day smoking fell among 8th- and 10th-grade females, resulting in lower rates than among males. The gender
differences, in which males end up with higher rates of use, appear to emerge as students grow older. In 8th grade, females actually have higher rates of use for some drugs. Usage rates for the various substances generally tend to move much in parallel across time for both genders, although the absolute differences tend to be largest in the historical periods in which overall prevalence rates are highest.
College Plans While in high school, those students who are not college-bound (a decreasing proportion of the total youth population) are considerably more likely to be at risk for using illicit drugs, drinking heavily, and particularly smoking cigarettes. Again, these dif-ferences are largest in periods of highest prevalence. In the lower grades, the college-bound showed a greater increase in cigarette smoking in the early to mid-1990s than did their non-college-bound peers.
Region of the Country The differences associated with region of the country are sufficiently varied and complex that we cannot do justice to them here. In the past, though, the Northeast and the West tended to have the highest proportions of students using any illicit drug, and the South the lowest (although these rankings do not apply to many of the specific drugs and do not apply to all grades today). In particular, the cocaine epidemic of the early 1980s was much more pronounced in the West and Northeast than in the other two regions, although the differences decreased as the overall epidemic subsided. While the South and West have generally had lower rates of drinking among students than the Northeast and the North Central (Midwest), those differences have narrowed somewhat in recent years. Cigarette smoking rates have consistently been lowest in the West (except in 2004 among 8th graders, when the Northeast was just as low, and in 2007, when the Northeast was the lowest). The upsurge of ecstasy use in 1999 occurred primarily in the Northeast, but that drug’s newfound popularity then spread to the three other regions of the country in 2000.
Population Density There have not been very large or consistent differences in overall illicit drug use associated with
44

population density over the life of the study, helping to demonstrate just how ubiquitous the illicit drug phenomenon has been in this country. Crack and heroin use generally have not been concentrated in urban areas, as is commonly believed, meaning that no parents should assume that their children are immune to these threats simply because they do not live in a city.
Socioeconomic Level The average level of education of the student’s parents, as reported by the student, is used as a proxy for socioeconomic status of the family. For many drugs the differences in use by socioeconomic class are very small, and the trends have been highly parallel. One very interesting difference occurred for cocaine, the use of which was positively associated with socioeconomic level in the early 1980s. That association had nearly disappeared by 1986, however, with the advent of crack, which offered cocaine at a lower price. Cigarette smoking showed a similar narrowing of class differences, but this time it was a large negative association with socioeconomic level that diminished considerably between roughly 1985 and 1993. In more recent years, that negative association has reemerged in the lower grades as use declined faster among students from more educated families. Rates of binge drinking are roughly equivalent across the classes in the upper grades (but not in 8th grade), and this rough equivalence has existed for some time among 12th graders.
Race/Ethnicity Among the most dramatic and interesting subgroup differences are those found among the three largest
racial/ethnic groups—Whites, African Americans, and Hispanics. Contrary to popular assumption, at all three grade levels African-American students have substantially lower rates of use of most licit and illicit drugs than do Whites. These include any illicit drug use, most of the specific illicit drugs, alcohol, and cigarettes. In fact, African Americans’ use of cigarettes is dramatically lower than Whites’ use; and this is a difference that emerged largely during the life of the study (i.e., since 1975). Hispanic students have rates of use that tend to fall between the other two groups in 12th grade—usually closer to the rates for Whites than for African Americans. Hispanics do have the highest reported rates of use for some drugs in 12th grade—crack, heroin with and without a needle, methamphetamine, and crystal methamphetamine. In 8th grade, they tend to come out highest of the three racial/ethnic groups on nearly all classes of drugs (amphetamines being the major exception). One possible explanation for this change in ranking between 8th and 12th grade may lie in the considerably higher school dropout rates of Hispanic youth. Thus, more of the “drug-prone” segment of that ethnic group may leave school before 12th grade compared to the other two racial/ ethnic groups. Another explanation could be that Hispanics are more precocious in their initiation of these types of behaviors. Again, we refer the reader to Occasional Paper 69 (forthcoming) at www.monitoringthefuture.org for a much more complete picture of these complex subgroup differences and how they have changed over the years.
45

1991 1992 1993 1994 1995 1996 1997 1998 1999 2000 2001 2002 2003 2004 2005 2006 2007
8th Grade 18.7 20.6 22.5 25.7 28.5 31.2 29.4 29.0 28.3 26.8 26.8 24.5 22.8 21.5 21.4 20.9 19.0 -1.9 s 10th Grade 30.6 29.8 32.8 37.4 40.9 45.4 47.3 44.9 46.2 45.6 45.6 44.6 41.4 39.8 38.2 36.1 35.6 -0.5 12th Grade 44.1 40.7 42.9 45.6 48.4 50.8 54.3 54.1 54.7 54.0 53.9 53.0 51.1 51.1 50.4 48.2 46.8 -1.4
Any Illicit Drug other
8th Grade 14.3 15.6 16.8 17.5 18.8 19.2 17.7 16.9 16.3 15.8‡ 17.0 13.7 13.6 12.2 12.1 12.2 11.1 -1.1 10th Grade 19.1 19.2 20.9 21.7 24.3 25.5 25.0 23.6 24.0 23.1‡ 23.6 22.1 19.7 18.8 18.0 17.5 18.2 +0.7 12th Grade 26.9 25.1 26.7 27.6 28.1 28.5 30.0 29.4 29.4 29.0‡ 30.7 29.5 27.7 28.7 27.4 26.9 25.5 -1.4
including Inhalantsa,c
8th Grade 28.5 29.6 32.3 35.1 38.1 39.4 38.1 37.8 37.2 35.1 34.5 31.6 30.3 30.2 30.0 29.2 27.7 -1.5 10th Grade 36.1 36.2 38.7 42.7 45.9 49.8 50.9 49.3 49.9 49.3 48.8 47.7 44.9 43.1 42.1 40.1 39.8 -0.3 12th Grade 47.6 44.4 46.6 49.1 51.5 53.5 56.3 56.1 56.3 57.0 56.0 54.6 52.8 53.0 53.5 51.2 49.1 -2.1
8th Grade 10.2 11.2 12.6 16.7 19.9 23.1 22.6 22.2 22.0 20.3 20.4 19.2 17.5 16.3 16.5 15.7 14.2 -1.5 10th Grade 23.4 21.4 24.4 30.4 34.1 39.8 42.3 39.6 40.9 40.3 40.1 38.7 36.4 35.1 34.1 31.8 31.0 -0.8 12th Grade 36.7 32.6 35.3 38.2 41.7 44.9 49.6 49.1 49.7 48.8 49.0 47.8 46.1 45.7 44.8 42.3 41.8 -0.5
8th Grade 17.6 17.4 19.4 19.9 21.6 21.2 21.0 20.5 19.7 17.9 17.1 15.2 15.8 17.3 17.1 16.1 15.6 -0.5 10th Grade 15.7 16.6 17.5 18.0 19.0 19.3 18.3 18.3 17.0 16.6 15.2 13.5 12.7 12.4 13.1 13.3 13.6 +0.3 12th Grade 17.6 16.6 17.4 17.7 17.4 16.6 16.1 15.2 15.4 14.2 13.0 11.7 11.2 10.9 11.4 11.1 10.5 -0.6
8th Grade — — — — — — — — — — — — — — — — — — 10th Grade — — — — — — — — — — — — — — — — — — 12th Grade 1.6 1.5 1.4 1.7 1.5 1.8 2.0 2.7 1.7 0.8 1.9 1.5 1.6 1.3 1.1 1.2 1.2 +0.1
8th Grade 3.2 3.8 3.9 4.3 5.2 5.9 5.4 4.9 4.8 4.6‡ 5.2 4.1 4.0 3.5 3.8 3.4 3.1 -0.3 10th Grade 6.1 6.4 6.8 8.1 9.3 10.5 10.5 9.8 9.7 8.9‡ 8.9 7.8 6.9 6.4 5.8 6.1 6.4 +0.4 12th Grade 9.6 9.2 10.9 11.4 12.7 14.0 15.1 14.1 13.7 13.0‡ 14.7 12.0 10.6 9.7 8.8 8.3 8.4 0.0
8th Grade 2.7 3.2 3.5 3.7 4.4 5.1 4.7 4.1 4.1 3.9 3.4 2.5 2.1 1.8 1.9 1.6 1.6 0.0 10th Grade 5.6 5.8 6.2 7.2 8.4 9.4 9.5 8.5 8.5 7.6 6.3 5.0 3.5 2.8 2.5 2.7 3.0 +0.3 12th Grade 8.8 8.6 10.3 10.5 11.7 12.6 13.6 12.6 12.2 11.1 10.9 8.4 5.9 4.6 3.5 3.3 3.4 +0.1
8th Grade 1.4 1.7 1.7 2.2 2.5 3.0 2.6 2.5 2.4 2.3‡ 3.9 3.3 3.2 3.0 3.3 2.8 2.6 -0.3 10th Grade 2.2 2.5 2.8 3.8 3.9 4.7 4.8 5.0 4.7 4.8‡ 6.6 6.3 5.9 5.8 5.2 5.5 5.7 +0.2 12th Grade 3.7 3.3 3.9 4.9 5.4 6.8 7.5 7.1 6.7 6.9‡ 10.4 9.2 9.0 8.7 8.1 7.8 7.7 -0.1
8th Grade — — — — — — — — — — — — — — — — — — 10th Grade — — — — — — — — — — — — — — — — — — 12th Grade 2.9 2.4 2.9 2.8 2.7 4.0 3.9 3.9 3.4 3.4 3.5 3.1 2.5 1.6 2.4 2.2 2.1 -0.1
Lifetime 2006–
TABLE 1
LSD
2007change
Any Illicit Druga
than Marijuanaa,b
Hallucinogensb,f
Trends in Lifetime Prevalence of Use of Various Drugs in Grades 8, 10, and 12
Any Illicit Drug
Marijuana/Hashish
Inhalantsc,d
Nitritese
(Table continued on next page.)
Hallucinogens other than LSDb
PCPe
46

1991 1992 1993 1994 1995 1996 1997 1998 1999 2000 2001 2002 2003 2004 2005 2006 2007
8th Grade — — — — — 3.4 3.2 2.7 2.7 4.3 5.2 4.3 3.2 2.8 2.8 2.5 2.3 -0.1 10th Grade — — — — — 5.6 5.7 5.1 6.0 7.3 8.0 6.6 5.4 4.3 4.0 4.5 5.2 +0.8 12th Grade — — — — — 6.1 6.9 5.8 8.0 11.0 11.7 10.5 8.3 7.5 5.4 6.5 6.5 0.0
8th Grade 2.3 2.9 2.9 3.6 4.2 4.5 4.4 4.6 4.7 4.5 4.3 3.6 3.6 3.4 3.7 3.4 3.1 -0.3 10th Grade 4.1 3.3 3.6 4.3 5.0 6.5 7.1 7.2 7.7 6.9 5.7 6.1 5.1 5.4 5.2 4.8 5.3 +0.5 12th Grade 7.8 6.1 6.1 5.9 6.0 7.1 8.7 9.3 9.8 8.6 8.2 7.8 7.7 8.1 8.0 8.5 7.8 -0.7
8th Grade 1.3 1.6 1.7 2.4 2.7 2.9 2.7 3.2 3.1 3.1 3.0 2.5 2.5 2.4 2.4 2.3 2.1 -0.2 10th Grade 1.7 1.5 1.8 2.1 2.8 3.3 3.6 3.9 4.0 3.7 3.1 3.6 2.7 2.6 2.5 2.2 2.3 0.0 12th Grade 3.1 2.6 2.6 3.0 3.0 3.3 3.9 4.4 4.6 3.9 3.7 3.8 3.6 3.9 3.5 3.5 3.2 -0.3
8th Grade 2.0 2.4 2.4 3.0 3.4 3.8 3.5 3.7 3.8 3.5 3.3 2.8 2.7 2.6 2.9 2.7 2.6 -0.1 10th Grade 3.8 3.0 3.3 3.8 4.4 5.5 6.1 6.4 6.8 6.0 5.0 5.2 4.5 4.8 4.6 4.3 4.8 +0.5 12th Grade 7.0 5.3 5.4 5.2 5.1 6.4 8.2 8.4 8.8 7.7 7.4 7.0 6.7 7.3 7.1 7.9 6.8 -1.1
8th Grade 1.2 1.4 1.4 2.0 2.3 2.4 2.1 2.3 2.3 1.9 1.7 1.6 1.6 1.6 1.5 1.4 1.3 -0.1 10th Grade 1.2 1.2 1.3 1.5 1.7 2.1 2.1 2.3 2.3 2.2 1.7 1.8 1.5 1.5 1.5 1.4 1.5 +0.1 12th Grade 0.9 1.2 1.1 1.2 1.6 1.8 2.1 2.0 2.0 2.4 1.8 1.7 1.5 1.5 1.5 1.4 1.5 +0.1
8th Grade — — — — 1.5 1.6 1.3 1.4 1.6 1.1 1.2 1.0 1.0 1.1 1.0 1.0 0.9 -0.1 10th Grade — — — — 1.0 1.1 1.1 1.2 1.3 1.0 0.8 1.0 0.9 0.8 0.8 0.9 0.9 0.0 12th Grade — — — — 0.7 0.8 0.9 0.8 0.9 0.8 0.7 0.8 0.7 0.7 0.9 0.8 0.7 -0.1
8th Grade — — — — 1.5 1.6 1.4 1.5 1.4 1.3 1.1 1.0 1.1 1.0 0.9 0.9 0.7 -0.2 10th Grade — — — — 1.1 1.7 1.7 1.7 1.6 1.7 1.3 1.3 1.0 1.1 1.1 1.0 1.1 0.0 12th Grade — — — — 1.4 1.7 2.1 1.6 1.8 2.4 1.5 1.6 1.8 1.4 1.3 1.1 1.4 +0.3
8th Grade — — — — — — — — — — — — — — — — — — 10th Grade — — — — — — — — — — — — — — — — — — 12th Grade 6.6 6.1 6.4 6.6 7.2 8.2 9.7 9.8 10.2 10.6 9.9‡ 13.5 13.2 13.5 12.8 13.4 13.1 -0.2
8th Grade 10.5 10.8 11.8 12.3 13.1 13.5 12.3 11.3 10.7 9.9 10.2 8.7 8.4 7.5 7.4 7.3 6.5 -0.8 10th Grade 13.2 13.1 14.9 15.1 17.4 17.7 17.0 16.0 15.7 15.7 16.0 14.9 13.1 11.9 11.1 11.2 11.1 -0.1 12th Grade 15.4 13.9 15.1 15.7 15.3 15.3 16.5 16.4 16.3 15.6 16.2 16.8 14.4 15.0 13.1 12.4 11.4 -1.0
Methamphetaminem,n
8th Grade — — — — — — — — 4.5 4.2 4.4 3.5 3.9 2.5 3.1 2.7 1.8 -0.9 s 10th Grade — — — — — — — — 7.3 6.9 6.4 6.1 5.2 5.3 4.1 3.2 2.8 -0.4 12th Grade — — — — — — — — 8.2 7.9 6.9 6.7 6.2 6.2 4.5 4.4 3.0 -1.4 ss
8th Grade — — — — — — — — — — — — — — — — — — 10th Grade — — — — — — — — — — — — — — — — — — 12th Grade 3.3 2.9 3.1 3.4 3.9 4.4 4.4 5.3 4.8 4.0 4.1 4.7 3.9 4.0 4.0 3.4 3.4 -0.1
2006–
With a Needlej
change2007
Other Cocaineh
Ecstasy (MDMA)g
Cocaine
Crack
Amphetaminesk
Heroini
Without a Needlej
Other Narcoticsk,l
TABLE 1 (cont.)Trends in Lifetime Prevalence of Use of Various Drugs
Lifetime
in Grades 8, 10, and 12
Crystal Meth. (Ice)n
(Table continued on next page.)
47

1991 1992 1993 1994 1995 1996 1997 1998 1999 2000 2001 2002 2003 2004 2005 2006 2007Sedatives (Barbiturates)k
8th Grade — — — — — — — — — — — — — — — — — — 10th Grade — — — — — — — — — — — — — — — — — — 12th Grade 6.2 5.5 6.3 7.0 7.4 7.6 8.1 8.7 8.9 9.2 8.7 9.5 8.8 9.9 10.5 10.2 9.3 -0.9
8th Grade — — — — — — — — — — — — — — — — — — 10th Grade — — — — — — — — — — — — — — — — — — 12th Grade 1.3 1.6 0.8 1.4 1.2 2.0 1.7 1.6 1.8 0.8 1.1 1.5 1.0 1.3 1.3 1.2 1.0 -0.3
8th Grade 3.8 4.1 4.4 4.6 4.5 5.3 4.8 4.6 4.4 4.4‡ 5.0 4.3 4.4 4.0 4.1 4.3 3.9 -0.5 10th Grade 5.8 5.9 5.7 5.4 6.0 7.1 7.3 7.8 7.9 8.0‡ 9.2 8.8 7.8 7.3 7.1 7.2 7.4 +0.2 12th Grade 7.2 6.0 6.4 6.6 7.1 7.2 7.8 8.5 9.3 8.9‡ 10.3 11.4 10.2 10.6 9.9 10.3 9.5 -0.8
8th Grade — — — — — 1.5 1.1 1.4 1.3 1.0 1.1 0.8 1.0 1.0 1.1 1.0 1.0 -0.1 10th Grade — — — — — 1.5 1.7 2.0 1.8 1.3 1.5 1.3 1.0 1.2 1.0 0.8 1.3 +0.5 12th Grade — — — — — 1.2 1.8 3.0 2.0 1.5 1.7 — — — — — — —
8th Grade 70.1 69.3‡ 55.7 55.8 54.5 55.3 53.8 52.5 52.1 51.7 50.5 47.0 45.6 43.9 41.0 40.5 38.9 -1.6 10th Grade 83.8 82.3‡ 71.6 71.1 70.5 71.8 72.0 69.8 70.6 71.4 70.1 66.9 66.0 64.2 63.2 61.5 61.7 +0.2 12th Grade 88.0 87.5‡ 80.0 80.4 80.7 79.2 81.7 81.4 80.0 80.3 79.7 78.4 76.6 76.8 75.1 72.7 72.2 -0.5
8th Grade 26.7 26.8 26.4 25.9 25.3 26.8 25.2 24.8 24.8 25.1 23.4 21.3 20.3 19.9 19.5 19.5 17.9 -1.6 10th Grade 50.0 47.7 47.9 47.2 46.9 48.5 49.4 46.7 48.9 49.3 48.2 44.0 42.4 42.3 42.1 41.4 41.2 -0.2 12th Grade 65.4 63.4 62.5 62.9 63.2 61.8 64.2 62.4 62.3 62.3 63.9 61.6 58.1 60.3 57.5 56.4 55.1 -1.3
Flavored Alcoholic Beveragese,m
8th Grade — — — — — — — — — — — — — 37.9 35.5 35.5 34.0 -1.4 10th Grade — — — — — — — — — — — — — 58.6 58.8 58.1 55.7 -2.3 12th Grade — — — — — — — — — — — — — 71.0 73.6 69.9 68.4 -1.4
8th Grade 44.0 45.2 45.3 46.1 46.4 49.2 47.3 45.7 44.1 40.5 36.6 31.4 28.4 27.9 25.9 24.6 22.1 -2.4 ss 10th Grade 55.1 53.5 56.3 56.9 57.6 61.2 60.2 57.7 57.6 55.1 52.8 47.4 43.0 40.7 38.9 36.1 34.6 -1.5 12th Grade 63.1 61.8 61.9 62.0 64.2 63.5 65.4 65.3 64.6 62.5 61.0 57.2 53.7 52.8 50.0 47.1 46.2 -0.9
Smokeless Tobaccoq
8th Grade 22.2 20.7 18.7 19.9 20.0 20.4 16.8 15.0 14.4 12.8 11.7 11.2 11.3 11.0 10.1 10.2 9.1 -1.1 10th Grade 28.2 26.6 28.1 29.2 27.6 27.4 26.3 22.7 20.4 19.1 19.5 16.9 14.6 13.8 14.5 15.0 15.1 +0.1 12th Grade — 32.4 31.0 30.7 30.9 29.8 25.3 26.2 23.4 23.1 19.7 18.3 17.0 16.7 17.5 15.2 15.1 -0.1
8th Grade 1.9 1.7 1.6 2.0 2.0 1.8 1.8 2.3 2.7 3.0 2.8 2.5 2.5 1.9 1.7 1.6 1.5 -0.1 10th Grade 1.8 1.7 1.7 1.8 2.0 1.8 2.0 2.0 2.7 3.5 3.5 3.5 3.0 2.4 2.0 1.8 1.8 0.0 12th Grade 2.1 2.1 2.0 2.4 2.3 1.9 2.4 2.7 2.9 2.5 3.7 4.0 3.5 3.4 2.6 2.7 2.2 -0.5
Rohypnolo
change
Source. The Monitoring the Future study, the University of Michigan.
Steroidsr
Alcohol, Any Usep
Cigarettes, Any Use
Been Drunkn
Tranquilizersb,k
Methaqualonee,k
in Grades 8, 10, and 12
20072006–Lifetime
TABLE 1 (cont.)Trends in Lifetime Prevalence of Use of Various Drugs
48

1992 1993 1994 1995 1996 1997 1998 1999 2000 2001 2002 2003 2004 2005 2006 20078th Graders 17,500 18,600 18,300 17,300 17,500 17,800 18,600 18,100 16,700 16,700 16,200 15,100 16,500 17,000 16,800 16,500 16,10010th Graders 14,800 14,800 15,300 15,800 17,000 15,600 15,500 15,000 13,600 14,300 14,000 14,300 15,800 16,400 16,200 16,200 16,10012th Graders 15,000 15,800 16,300 15,400 15,400 14,300 15,400 15,200 13,600 12,800 12,800 12,900 14,600 14,600 14,700 14,200 14,500
OxyContin, and Percocet. The 2002 data presented here are based on the changed forms only; N is one half of N indicated. In
indicated. Data based on one of four forms beginning in 2002; N is one sixth of N indicated. For 12th graders only: Data based on one of six forms in 1996–2001; N is one sixth of N indicated. Data based on two of six forms beginning in 2002; N is two sixths
oFor 8th and 10th graders only: Data based on one of two forms in 1996; N is one half of N indicated. Data based on three of four forms in 1997–1998; N is two thirds of N indicated. Data based on two of four forms in 1999–2001; N is one third of N
2003, the remaining forms were changed to the new wording. The data are based on all forms beginning in 2003. mFor 8th and 10th graders only: Data based on one of four forms; N is one third of N indicated.nFor 12th graders only: Data based on two of six forms; N is two sixths of N indicated.
8th and 10th graders only: The use of other narcotics and sedatives (barbiturates) has been excluded because these younger
replaced with Xanax. For 8th, 10th, and 12th graders: The 2001 data presented here are based on the changed forms only; N is
one half of N indicated. For 12th graders only: Data based on one of six forms in 1996–2001; N is one sixth of N indicated.
remaining 8th- and 10th-grade forms. Data presented here represent the combined data from all forms. Separate questions were asked for use with injection and without injection. In 1996, the heroin question was changed in all
eFor 12th graders only: Data based on one of six forms; N is one sixth of N indicated.fHallucinogens are unadjusted for underreporting of PCP.gFor 8th and 10th graders only: Data based on one of two forms in 1996; N is one half of N indicated. Data based on one third of N indicated in 1997–2001 due to changes in the questionnaire forms. Data based on two of four forms beginning in 2002; N is
in 2002. Data for any illicit drug other than marijuana and hallucinogens are also affected by these changes and have been
beginning in 1996. For 12th graders only: Data based on three of six forms; N is three sixths of N indicated. kOnly drug use not under a doctor’s orders is included here.lIn 2002 the question text was changed in half of the questionnaire forms. The list of examples of narcotics other than heroin was updated. Talwin, laudanum, and paregoric—all of which had negligible rates of use by 2001—were replaced with Vicodin,
estimates for the two most recent classes is due to rounding error.
Notes. Level of significance of difference between the two most recent classes: s = .05, ss = .01, sss = .001.
Data based on two of six forms beginning in 2002; N is two sixths of N indicated.
See relevant footnote for that drug. Any apparent inconsistency between the change estimate and the prevalence-of-use
aFor 12th graders only: Use of "any illicit drug" includes any use of marijuana, LSD, other hallucinogens, crack, other cocaine, or heroin; or any use of other narcotics, amphetamines, sedatives (barbiturates), or tranquilizers not under a doctor’s orders. For
one half of N indicated. In 2002 the remaining forms were changed to the new wording. The data are based on all forms beginning
cFor 12th graders only: Data based on five of six forms in 1991–1998; N is five sixths of N indicated. Data based on three of six
Weighted N s 1991
"—" indicates data not available. "‡" indicates some change in the question.
jFor 8th and 10th graders only: Data based on one of two forms in 1995; N is one half of N indicated. Data based on all forms
forms beginning in 1999; N is three sixths of N indicated.dInhalants are unadjusted for underreporting of amyl and butyl nitrites.
respondents appear to overreport use (perhaps because they include the use of nonprescription drugs in their answers). bIn 2001 the question text was changed on half of the questionnaire forms for each age group. "Other psychedelics" was changed to "other hallucinogens" and "shrooms" was added to the list of examples. For the tranquilizer list of examples, Miltown was
handled in a parallel manner.
hFor 12th graders only: Data based on four of six forms; N is four sixths of N indicated.iIn 1995 the heroin question was changed in one of two forms for 8th and 10th graders and in three of six forms for 12th graders.
qFor 8th and 10th graders only: Data based on one of two forms for 1991–1996 and on two of four forms beginning in 1997; N is one half of N indicated. For 12th graders only: Data based on one of six forms; N is one sixth of N indicated.
change. The remaining forms were changed in 2005.
of N indicated. Data for 2001 and 2002 are not comparable due to changes in the questionnaire forms. pFor 8th, 10th, and 12th graders: In 1993, the question text was changed slightly in half of the forms to indicate that a "drink" meant "more than just a few sips." The 1993 data are based on the changed forms only; N is one half of N indicated for these groups.
question text was changed slightly in half of the forms. An examination of the data did not show any effect from the wording In 1994 the remaining forms were changed to the new wording. The data are based on all forms beginning in 1994. In 2004, the
Footnotes for Tables 1 through 4
49
actual daily use is measured, and for 5+ drinks, for which the prevalence of having five or more drinks in a row in the last two weeks
tFor 12th graders only: Data based on two of six forms in 2000; N is two sixths of N indicated. Data based on three of six forms in 2001; N is three sixths of N indicated. Data based on one of six forms beginning in 2002; N is one sixth of N indicated.
forms beginning in 2006; N is three sixths of N indicated.
"alcopops" data.
did not show any effect from the wording change. For 12th graders only: Data based on two of six forms in 1991–2005; N is two
wDaily use is defined as use on 20 or more occasions in the past 30 days except for cigarettes and smokeless tobacco, for which
is measured. xFor 12th graders only: Due to a coding error, previously released versions of this table contained values that were slightly off for the measure of five or more drinks in a row for 2005 and 2006. These have been corrected here.
sixths of N indicated. Data based on three of six forms beginning in 2006; N is three sixths of N indicated.
vThe 2003 flavored alcoholic beverage data were created by adjusting the 2004 data to reflect the change in the 2003 and 2004
rFor 8th, 10th, and 12th graders: In 2006, the question text was changed slightly in some of the forms. An examination of the data
sFor 12th graders only: Data based on two of six forms in 2002–2005; N is two sixths of N indicated. Data based on three of six
uData based on two of six forms in 2000; N is two sixths of N indicated. Data based on three of six forms beginning in 2001; N is three sixths of N indicated.
50

1991 1992 1993 1994 1995 1996 1997 1998 1999 2000 2001 2002 2003 2004 2005 2006 2007
8th Grade 11.3 12.9 15.1 18.5 21.4 23.6 22.1 21.0 20.5 19.5 19.5 17.7 16.1 15.2 15.5 14.8 13.2 -1.6 s 10th Grade 21.4 20.4 24.7 30.0 33.3 37.5 38.5 35.0 35.9 36.4 37.2 34.8 32.0 31.1 29.8 28.7 28.1 -0.7 12th Grade 29.4 27.1 31.0 35.8 39.0 40.2 42.4 41.4 42.1 40.9 41.4 41.0 39.3 38.8 38.4 36.5 35.9 -0.5
Any Illicit Drug other
8th Grade 8.4 9.3 10.4 11.3 12.6 13.1 11.8 11.0 10.5 10.2‡ 10.8 8.8 8.8 7.9 8.1 7.7 7.0 -0.7 10th Grade 12.2 12.3 13.9 15.2 17.5 18.4 18.2 16.6 16.7 16.7‡ 17.9 15.7 13.8 13.5 12.9 12.7 13.1 +0.4 12th Grade 16.2 14.9 17.1 18.0 19.4 19.8 20.7 20.2 20.7 20.4‡ 21.6 20.9 19.8 20.5 19.7 19.2 18.5 -0.7
including Inhalantsa,c
8th Grade 16.7 18.2 21.1 24.2 27.1 28.7 27.2 26.2 25.3 24.0 23.9 21.4 20.4 20.2 20.4 19.7 18.0 -1.7 s 10th Grade 23.9 23.5 27.4 32.5 35.6 39.6 40.3 37.1 37.7 38.0 38.7 36.1 33.5 32.9 31.7 30.7 30.2 -0.5 12th Grade 31.2 28.8 32.5 37.6 40.2 41.9 43.3 42.4 42.8 42.5 42.6 42.1 40.5 39.1 40.3 38.0 37.0 -0.9
8th Grade 6.2 7.2 9.2 13.0 15.8 18.3 17.7 16.9 16.5 15.6 15.4 14.6 12.8 11.8 12.2 11.7 10.3 -1.4 s 10th Grade 16.5 15.2 19.2 25.2 28.7 33.6 34.8 31.1 32.1 32.2 32.7 30.3 28.2 27.5 26.6 25.2 24.6 -0.6 12th Grade 23.9 21.9 26.0 30.7 34.7 35.8 38.5 37.5 37.8 36.5 37.0 36.2 34.9 34.3 33.6 31.5 31.7 +0.2
8th Grade 9.0 9.5 11.0 11.7 12.8 12.2 11.8 11.1 10.3 9.4 9.1 7.7 8.7 9.6 9.5 9.1 8.3 -0.8 10th Grade 7.1 7.5 8.4 9.1 9.6 9.5 8.7 8.0 7.2 7.3 6.6 5.8 5.4 5.9 6.0 6.5 6.6 +0.2 12th Grade 6.6 6.2 7.0 7.7 8.0 7.6 6.7 6.2 5.6 5.9 4.5 4.5 3.9 4.2 5.0 4.5 3.7 -0.9
8th Grade — — — — — — — — — — — — — — — — — — 10th Grade — — — — — — — — — — — — — — — — — — 12th Grade 0.9 0.5 0.9 1.1 1.1 1.6 1.2 1.4 0.9 0.6 0.6 1.1 0.9 0.8 0.6 0.5 0.8 +0.3
8th Grade 1.9 2.5 2.6 2.7 3.6 4.1 3.7 3.4 2.9 2.8‡ 3.4 2.6 2.6 2.2 2.4 2.1 1.9 -0.1 10th Grade 4.0 4.3 4.7 5.8 7.2 7.8 7.6 6.9 6.9 6.1‡ 6.2 4.7 4.1 4.1 4.0 4.1 4.4 +0.3 12th Grade 5.8 5.9 7.4 7.6 9.3 10.1 9.8 9.0 9.4 8.1‡ 9.1 6.6 5.9 6.2 5.5 4.9 5.4 +0.5
8th Grade 1.7 2.1 2.3 2.4 3.2 3.5 3.2 2.8 2.4 2.4 2.2 1.5 1.3 1.1 1.2 0.9 1.1 +0.1 10th Grade 3.7 4.0 4.2 5.2 6.5 6.9 6.7 5.9 6.0 5.1 4.1 2.6 1.7 1.6 1.5 1.7 1.9 +0.2 12th Grade 5.2 5.6 6.8 6.9 8.4 8.8 8.4 7.6 8.1 6.6 6.6 3.5 1.9 2.2 1.8 1.7 2.1 +0.4
8th Grade 0.7 1.1 1.0 1.3 1.7 2.0 1.8 1.6 1.5 1.4‡ 2.4 2.1 2.1 1.9 2.0 1.8 1.6 -0.2 10th Grade 1.3 1.4 1.9 2.4 2.8 3.3 3.3 3.4 3.2 3.1‡ 4.3 4.0 3.6 3.7 3.5 3.7 3.8 +0.2 12th Grade 2.0 1.7 2.2 3.1 3.8 4.4 4.6 4.6 4.3 4.4‡ 5.9 5.4 5.4 5.6 5.0 4.6 4.8 +0.2
8th Grade — — — — — — — — — — — — — — — — — — 10th Grade — — — — — — — — — — — — — — — — — — 12th Grade 1.4 1.4 1.4 1.6 1.8 2.6 2.3 2.1 1.8 2.3 1.8 1.1 1.3 0.7 1.3 0.7 0.9 +0.2
TABLE 2
(Table continued on next page.)
2007change
Any Illicit Drug
Marijuana/Hashish
Inhalantsc,d
Hallucinogens other than LSDb
Annual
Trends in Annual Prevalence of Use of Various Drugs in Grades 8, 10, and 12
Hallucinogensb,f
LSD
Nitritese
Any Illicit Druga
than Marijuanaa,b
PCPe
2006–
51

1991 1992 1993 1994 1995 1996 1997 1998 1999 2000 2001 2002 2003 2004 2005 2006 2007
8th Grade — — — — — 2.3 2.3 1.8 1.7 3.1 3.5 2.9 2.1 1.7 1.7 1.4 1.5 +0.1 10th Grade — — — — — 4.6 3.9 3.3 4.4 5.4 6.2 4.9 3.0 2.4 2.6 2.8 3.5 +0.7 12th Grade — — — — — 4.6 4.0 3.6 5.6 8.2 9.2 7.4 4.5 4.0 3.0 4.1 4.5 +0.4
8th Grade 1.1 1.5 1.7 2.1 2.6 3.0 2.8 3.1 2.7 2.6 2.5 2.3 2.2 2.0 2.2 2.0 2.0 -0.1 10th Grade 2.2 1.9 2.1 2.8 3.5 4.2 4.7 4.7 4.9 4.4 3.6 4.0 3.3 3.7 3.5 3.2 3.4 +0.3 12th Grade 3.5 3.1 3.3 3.6 4.0 4.9 5.5 5.7 6.2 5.0 4.8 5.0 4.8 5.3 5.1 5.7 5.2 -0.5
8th Grade 0.7 0.9 1.0 1.3 1.6 1.8 1.7 2.1 1.8 1.8 1.7 1.6 1.6 1.3 1.4 1.3 1.3 +0.1 10th Grade 0.9 0.9 1.1 1.4 1.8 2.1 2.2 2.5 2.4 2.2 1.8 2.3 1.6 1.7 1.7 1.3 1.3 0.0 12th Grade 1.5 1.5 1.5 1.9 2.1 2.1 2.4 2.5 2.7 2.2 2.1 2.3 2.2 2.3 1.9 2.1 1.9 -0.1
8th Grade 1.0 1.2 1.3 1.7 2.1 2.5 2.2 2.4 2.3 1.9 1.9 1.8 1.6 1.6 1.7 1.6 1.5 -0.1 10th Grade 2.1 1.7 1.8 2.4 3.0 3.5 4.1 4.0 4.4 3.8 3.0 3.4 2.8 3.3 3.0 2.9 3.1 +0.1 12th Grade 3.2 2.6 2.9 3.0 3.4 4.2 5.0 4.9 5.8 4.5 4.4 4.4 4.2 4.7 4.5 5.2 4.5 -0.7
8th Grade 0.7 0.7 0.7 1.2 1.4 1.6 1.3 1.3 1.4 1.1 1.0 0.9 0.9 1.0 0.8 0.8 0.8 0.0 10th Grade 0.5 0.6 0.7 0.9 1.1 1.2 1.4 1.4 1.4 1.4 0.9 1.1 0.7 0.9 0.9 0.9 0.8 0.0 12th Grade 0.4 0.6 0.5 0.6 1.1 1.0 1.2 1.0 1.1 1.5 0.9 1.0 0.8 0.9 0.8 0.8 0.9 +0.2
8th Grade — — — — 0.9 1.0 0.8 0.8 0.9 0.6 0.7 0.6 0.6 0.7 0.6 0.5 0.6 0.0 10th Grade — — — — 0.6 0.7 0.7 0.8 0.6 0.5 0.4 0.6 0.5 0.5 0.5 0.5 0.5 0.0 12th Grade — — — — 0.5 0.5 0.5 0.4 0.4 0.4 0.3 0.4 0.4 0.4 0.5 0.5 0.4 -0.1
8th Grade — — — — 0.8 1.0 0.8 0.8 0.9 0.7 0.6 0.6 0.6 0.6 0.5 0.5 0.5 -0.1 10th Grade — — — — 0.8 0.9 1.1 1.0 1.1 1.1 0.7 0.8 0.5 0.7 0.7 0.6 0.6 0.0 12th Grade — — — — 1.0 1.0 1.2 0.8 1.0 1.6 0.8 0.8 0.8 0.7 0.8 0.6 1.0 +0.4 s
8th Grade — — — — — — — — — — — — — — — — — — 10th Grade — — — — — — — — — — — — — — — — — — 12th Grade 3.5 3.3 3.6 3.8 4.7 5.4 6.2 6.3 6.7 7.0 6.7‡ 9.4 9.3 9.5 9.0 9.0 9.2 +0.2
8th Grade — — — — — — — — — — — 1.3 1.7 1.7 1.8 2.6 1.8 -0.7 10th Grade — — — — — — — — — — — 3.0 3.6 3.5 3.2 3.8 3.9 +0.1 12th Grade — — — — — — — — — — — 4.0 4.5 5.0 5.5 4.3 5.2 +0.9
8th Grade — — — — — — — — — — — 2.5 2.8 2.5 2.6 3.0 2.7 -0.3 10th Grade — — — — — — — — — — — 6.9 7.2 6.2 5.9 7.0 7.2 +0.2 12th Grade — — — — — — — — — — — 9.6 10.5 9.3 9.5 9.7 9.6 -0.2
8th Grade 6.2 6.5 7.2 7.9 8.7 9.1 8.1 7.2 6.9 6.5 6.7 5.5 5.5 4.9 4.9 4.7 4.2 -0.5 10th Grade 8.2 8.2 9.6 10.2 11.9 12.4 12.1 10.7 10.4 11.1 11.7 10.7 9.0 8.5 7.8 7.9 8.0 +0.1 12th Grade 8.2 7.1 8.4 9.4 9.3 9.5 10.2 10.1 10.2 10.5 10.9 11.1 9.9 10.0 8.6 8.1 7.5 -0.6
Annual
Cocaine
Other Cocaineh
Crack
With a Needlej
Without a Needlej
2007change
Ecstasy (MDMA)g
TABLE 2 (cont.)Trends in Annual Prevalence of Use of Various Drugs
in Grades 8, 10, and 12
Heroini
Amphetaminesk
Vicodinm,s
OxyContinm,s
Other Narcoticsk,l
2006–
(Table continued on next page.)
52

1991 1992 1993 1994 1995 1996 1997 1998 1999 2000 2001 2002 2003 2004 2005 2006 2007Ritalinm,n
8th Grade — — — — — — — — — — 2.9 2.8 2.6 2.5 2.4 2.6 2.1 -0.5 10th Grade — — — — — — — — — — 4.8 4.8 4.1 3.4 3.4 3.6 2.8 -0.9 12th Grade — — — — — — — — — — 5.1 4.0 4.0 5.1 4.4 4.4 3.8 -0.6
Methamphetaminem,n
8th Grade — — — — — — — — 3.2 2.5 2.8 2.2 2.5 1.5 1.8 1.8 1.1 -0.7 ss 10th Grade — — — — — — — — 4.6 4.0 3.7 3.9 3.3 3.0 2.9 1.8 1.6 -0.2 12th Grade — — — — — — — — 4.7 4.3 3.9 3.6 3.2 3.4 2.5 2.5 1.7 -0.8 s
8th Grade — — — — — — — — — — — — — — — — — — 10th Grade — — — — — — — — — — — — — — — — — — 12th Grade 1.4 1.3 1.7 1.8 2.4 2.8 2.3 3.0 1.9 2.2 2.5 3.0 2.0 2.1 2.3 1.9 1.6 -0.2
8th Grade — — — — — — — — — — — — — — — — — — 10th Grade — — — — — — — — — — — — — — — — — — 12th Grade 3.4 2.8 3.4 4.1 4.7 4.9 5.1 5.5 5.8 6.2 5.7 6.7 6.0 6.5 7.2 6.6 6.2 -0.4
8th Grade — — — — — — — — — — — — — — — — — — 10th Grade — — — — — — — — — — — — — — — — — — 12th Grade 0.5 0.6 0.2 0.8 0.7 1.1 1.0 1.1 1.1 0.3 0.8 0.9 0.6 0.8 0.9 0.8 0.5 -0.3
8th Grade 1.8 2.0 2.1 2.4 2.7 3.3 2.9 2.6 2.5 2.6‡ 2.8 2.6 2.7 2.5 2.8 2.6 2.4 -0.1 10th Grade 3.2 3.5 3.3 3.3 4.0 4.6 4.9 5.1 5.4 5.6‡ 7.3 6.3 5.3 5.1 4.8 5.2 5.3 0.0 12th Grade 3.6 2.8 3.5 3.7 4.4 4.6 4.7 5.5 5.8 5.7‡ 6.9 7.7 6.7 7.3 6.8 6.6 6.2 -0.5
8th Grade — — — — — — — — — — — — — — — 4.2 4.0 -0.1 10th Grade — — — — — — — — — — — — — — — 5.3 5.4 +0.1 12th Grade — — — — — — — — — — — — — — — 6.9 5.8 -1.0
8th Grade — — — — — 1.0 0.8 0.8 0.5 0.5 0.7 0.3 0.5 0.6 0.7 0.5 0.7 +0.1 10th Grade — — — — — 1.1 1.3 1.2 1.0 0.8 1.0 0.7 0.6 0.7 0.5 0.5 0.7 +0.1 12th Grade — — — — — 1.1 1.2 1.4 1.0 0.8 0.9‡ 1.6 1.3 1.6 1.2 1.1 1.0 -0.1
GHBm,t
8th Grade — — — — — — — — — 1.2 1.1 0.8 0.9 0.7 0.5 0.8 0.7 -0.1 10th Grade — — — — — — — — — 1.1 1.0 1.4 1.4 0.8 0.8 0.7 0.6 -0.1 12th Grade — — — — — — — — — 1.9 1.6 1.5 1.4 2.0 1.1 1.1 0.9 -0.2
8th Grade — — — — — — — — — 1.6 1.3 1.3 1.1 0.9 0.6 0.9 1.0 +0.1 10th Grade — — — — — — — — — 2.1 2.1 2.2 1.9 1.3 1.0 1.0 0.8 -0.2 12th Grade — — — — — — — — — 2.5 2.5 2.6 2.1 1.9 1.6 1.4 1.3 0.0
change
(Table continued on next page.)
TABLE 2 (cont.)Trends in Annual Prevalence of Use of Various Drugs
Annual
Crystal Meth. (Ice)n
2007
Tranquilizersb,k
Sedatives (Barbiturates)k
2006–
Methaqualonee,k
in Grades 8, 10, and 12
OTC Cough/Cold Medicinesm,n
Ketaminem,u
Rohypnolo
53

1991 1992 1993 1994 1995 1996 1997 1998 1999 2000 2001 2002 2003 2004 2005 2006 2007
8th Grade 54.0 53.7‡ 45.4 46.8 45.3 46.5 45.5 43.7 43.5 43.1 41.9 38.7 37.2 36.7 33.9 33.6 31.8 -1.8 10th Grade 72.3 70.2‡ 63.4 63.9 63.5 65.0 65.2 62.7 63.7 65.3 63.5 60.0 59.3 58.2 56.7 55.8 56.3 +0.4 12th Grade 77.7 76.8‡ 72.7 73.0 73.7 72.5 74.8 74.3 73.8 73.2 73.3 71.5 70.1 70.6 68.6 66.5 66.4 -0.1
8th Grade 17.5 18.3 18.2 18.2 18.4 19.8 18.4 17.9 18.5 18.5 16.6 15.0 14.5 14.5 14.1 13.9 12.6 -1.3 10th Grade 40.1 37.0 37.8 38.0 38.5 40.1 40.7 38.3 40.9 41.6 39.9 35.4 34.7 35.1 34.2 34.5 34.4 -0.1 12th Grade 52.7 50.3 49.6 51.7 52.5 51.9 53.2 52.0 53.2 51.8 53.2 50.4 48.0 51.8 47.7 47.9 46.1 -1.8
Flavored Alcoholic
8th Grade — — — — — — — — — — — — — 30.4 27.9 26.8 26.0 -0.8 10th Grade — — — — — — — — — — — — — 49.7 48.5 48.8 45.9 -2.9 s 12th Grade — — — — — — — — — — — — 55.2 55.8 58.4 54.7 53.6 -1.0
Bidism,n
8th Grade — — — — — — — — — 3.9 2.7 2.7 2.0 1.7 1.6 — — — 10th Grade — — — — — — — — — 6.4 4.9 3.1 2.8 2.1 1.6 — — — 12th Grade — — — — — — — — — 9.2 7.0 5.9 4.0 3.6 3.3 2.3 1.7 -0.6
Kreteksm,n
8th Grade — — — — — — — — — — 2.6 2.6 2.0 1.9 1.4 — — — 10th Grade — — — — — — — — — — 6.0 4.9 3.8 3.7 2.8 — — — 12th Grade — — — — — — — — — — 10.1 8.4 6.7 6.5 7.1 6.2 6.8 +0.6
8th Grade 1.0 1.1 0.9 1.2 1.0 0.9 1.0 1.2 1.7 1.7 1.6 1.5 1.4 1.1 1.1 0.9 0.8 -0.1 10th Grade 1.1 1.1 1.0 1.1 1.2 1.2 1.2 1.2 1.7 2.2 2.1 2.2 1.7 1.5 1.3 1.2 1.1 -0.1 12th Grade 1.4 1.1 1.2 1.3 1.5 1.4 1.4 1.7 1.8 1.7 2.4 2.5 2.1 2.5 1.5 1.8 1.4 -0.3
Note. See Table 1 for relevant footnotes.Source. The Monitoring the Future study, the University of Michigan.
Been Drunkn
in Grades 8, 10, and 12
Steroidsr
Beveragese,m,v
2007change
Annual
Alcohol, Any Usep
2006–
TABLE 2 (cont.)Trends in Annual Prevalence of Use of Various Drugs
54

1991 1992 1993 1994 1995 1996 1997 1998 1999 2000 2001 2002 2003 2004 2005 2006 2007
8th Grade 5.7 6.8 8.4 10.9 12.4 14.6 12.9 12.1 12.2 11.9 11.7 10.4 9.7 8.4 8.5 8.1 7.4 -0.7 10th Grade 11.6 11.0 14.0 18.5 20.2 23.2 23.0 21.5 22.1 22.5 22.7 20.8 19.5 18.3 17.3 16.8 16.9 +0.2 12th Grade 16.4 14.4 18.3 21.9 23.8 24.6 26.2 25.6 25.9 24.9 25.7 25.4 24.1 23.4 23.1 21.5 21.9 +0.4
Any Illicit Drug other
8th Grade 3.8 4.7 5.3 5.6 6.5 6.9 6.0 5.5 5.5 5.6‡ 5.5 4.7 4.7 4.1 4.1 3.8 3.6 -0.2 10th Grade 5.5 5.7 6.5 7.1 8.9 8.9 8.8 8.6 8.6 8.5‡ 8.7 8.1 6.9 6.9 6.4 6.3 6.9 +0.6 12th Grade 7.1 6.3 7.9 8.8 10.0 9.5 10.7 10.7 10.4 10.4‡ 11.0 11.3 10.4 10.8 10.3 9.8 9.5 -0.3
including Inhalantsa,c
8th Grade 8.8 10.0 12.0 14.3 16.1 17.5 16.0 14.9 15.1 14.4 14.0 12.6 12.1 11.2 11.2 10.9 10.1 -0.8 10th Grade 13.1 12.6 15.5 20.0 21.6 24.5 24.1 22.5 23.1 23.6 23.6 21.7 20.5 19.3 18.4 17.7 18.1 +0.4 12th Grade 17.8 15.5 19.3 23.0 24.8 25.5 26.9 26.6 26.4 26.4 26.5 25.9 24.6 23.3 24.2 22.1 22.8 +0.7
8th Grade 3.2 3.7 5.1 7.8 9.1 11.3 10.2 9.7 9.7 9.1 9.2 8.3 7.5 6.4 6.6 6.5 5.7 -0.8 10th Grade 8.7 8.1 10.9 15.8 17.2 20.4 20.5 18.7 19.4 19.7 19.8 17.8 17.0 15.9 15.2 14.2 14.2 -0.1 12th Grade 13.8 11.9 15.5 19.0 21.2 21.9 23.7 22.8 23.1 21.6 22.4 21.5 21.2 19.9 19.8 18.3 18.8 +0.4
8th Grade 4.4 4.7 5.4 5.6 6.1 5.8 5.6 4.8 5.0 4.5 4.0 3.8 4.1 4.5 4.2 4.1 3.9 -0.2 10th Grade 2.7 2.7 3.3 3.6 3.5 3.3 3.0 2.9 2.6 2.6 2.4 2.4 2.2 2.4 2.2 2.3 2.5 +0.3 12th Grade 2.4 2.3 2.5 2.7 3.2 2.5 2.5 2.3 2.0 2.2 1.7 1.5 1.5 1.5 2.0 1.5 1.2 -0.3
8th Grade — — — — — — — — — — — — — — — — — — 10th Grade — — — — — — — — — — — — — — — — — — 12th Grade 0.4 0.3 0.6 0.4 0.4 0.7 0.7 1.0 0.4 0.3 0.5 0.6 0.7 0.7 0.5 0.3 0.5 +0.2
8th Grade 0.8 1.1 1.2 1.3 1.7 1.9 1.8 1.4 1.3 1.2‡ 1.6 1.2 1.2 1.0 1.1 0.9 1.0 +0.1 10th Grade 1.6 1.8 1.9 2.4 3.3 2.8 3.3 3.2 2.9 2.3‡ 2.1 1.6 1.5 1.6 1.5 1.5 1.7 +0.2 12th Grade 2.2 2.1 2.7 3.1 4.4 3.5 3.9 3.8 3.5 2.6‡ 3.3 2.3 1.8 1.9 1.9 1.5 1.7 +0.1
LSD 8th Grade 0.6 0.9 1.0 1.1 1.4 1.5 1.5 1.1 1.1 1.0 1.0 0.7 0.6 0.5 0.5 0.4 0.5 +0.1 10th Grade 1.5 1.6 1.6 2.0 3.0 2.4 2.8 2.7 2.3 1.6 1.5 0.7 0.6 0.6 0.6 0.7 0.7 0.0 12th Grade 1.9 2.0 2.4 2.6 4.0 2.5 3.1 3.2 2.7 1.6 2.3 0.7 0.6 0.7 0.7 0.6 0.6 0.0
Hallucinogens other than LSDb
8th Grade 0.3 0.4 0.5 0.7 0.8 0.9 0.7 0.7 0.6 0.6‡ 1.1 1.0 1.0 0.8 0.9 0.7 0.7 0.0 10th Grade 0.4 0.5 0.7 1.0 1.0 1.0 1.2 1.4 1.2 1.2‡ 1.4 1.4 1.2 1.4 1.3 1.3 1.4 +0.2 12th Grade 0.7 0.5 0.8 1.2 1.3 1.6 1.7 1.6 1.6 1.7‡ 1.9 2.0 1.5 1.7 1.6 1.3 1.4 +0.1
PCPe
8th Grade — — — — — — — — — — — — — — — — — — 10th Grade — — — — — — — — — — — — — — — — — — 12th Grade 0.5 0.6 1.0 0.7 0.6 1.3 0.7 1.0 0.8 0.9 0.5 0.4 0.6 0.4 0.7 0.4 0.5 +0.1
Hallucinogensb,f
(Table continued on next page.)
Any Illicit Druga
Marijuana/Hashish
Inhalantsc,d
Nitritese
than Marijuanaa,b
TABLE 3Trends in 30-Day Prevalence of Use of Various Drugs
in Grades 8, 10, and 12
200730-Day 2006–
change
Any Illicit Drug
55

1991 1992 1993 1994 1995 1996 1997 1998 1999 2000 2001 2002 2003 2004 2005 2006 2007
8th Grade — — — — — 1.0 1.0 0.9 0.8 1.4 1.8 1.4 0.7 0.8 0.6 0.7 0.6 0.0 10th Grade — — — — — 1.8 1.3 1.3 1.8 2.6 2.6 1.8 1.1 0.8 1.0 1.2 1.2 0.0 12th Grade — — — — — 2.0 1.6 1.5 2.5 3.6 2.8 2.4 1.3 1.2 1.0 1.3 1.6 +0.3
8th Grade 0.5 0.7 0.7 1.0 1.2 1.3 1.1 1.4 1.3 1.2 1.2 1.1 0.9 0.9 1.0 1.0 0.9 -0.1 10th Grade 0.7 0.7 0.9 1.2 1.7 1.7 2.0 2.1 1.8 1.8 1.3 1.6 1.3 1.7 1.5 1.5 1.3 -0.2 12th Grade 1.4 1.3 1.3 1.5 1.8 2.0 2.3 2.4 2.6 2.1 2.1 2.3 2.1 2.3 2.3 2.5 2.0 -0.6 s
8th Grade 0.3 0.5 0.4 0.7 0.7 0.8 0.7 0.9 0.8 0.8 0.8 0.8 0.7 0.6 0.6 0.6 0.6 0.0 10th Grade 0.3 0.4 0.5 0.6 0.9 0.8 0.9 1.1 0.8 0.9 0.7 1.0 0.7 0.8 0.7 0.7 0.5 -0.2 s 12th Grade 0.7 0.6 0.7 0.8 1.0 1.0 0.9 1.0 1.1 1.0 1.1 1.2 0.9 1.0 1.0 0.9 0.9 0.0
8th Grade 0.5 0.5 0.6 0.9 1.0 1.0 0.8 1.0 1.1 0.9 0.9 0.8 0.7 0.7 0.7 0.7 0.6 -0.1 10th Grade 0.6 0.6 0.7 1.0 1.4 1.3 1.6 1.8 1.6 1.6 1.2 1.3 1.1 1.5 1.3 1.3 1.1 -0.1 12th Grade 1.2 1.0 1.2 1.3 1.3 1.6 2.0 2.0 2.5 1.7 1.8 1.9 1.8 2.2 2.0 2.4 1.7 -0.7 s
8th Grade 0.3 0.4 0.4 0.6 0.6 0.7 0.6 0.6 0.6 0.5 0.6 0.5 0.4 0.5 0.5 0.3 0.4 +0.2 10th Grade 0.2 0.2 0.3 0.4 0.6 0.5 0.6 0.7 0.7 0.5 0.3 0.5 0.3 0.5 0.5 0.5 0.4 0.0 12th Grade 0.2 0.3 0.2 0.3 0.6 0.5 0.5 0.5 0.5 0.7 0.4 0.5 0.4 0.5 0.5 0.4 0.4 0.0
8th Grade — — — — 0.4 0.5 0.4 0.5 0.4 0.3 0.4 0.3 0.3 0.3 0.3 0.2 0.3 +0.1 s 10th Grade — — — — 0.3 0.3 0.3 0.4 0.3 0.3 0.2 0.3 0.2 0.3 0.3 0.3 0.3 0.0 12th Grade — — — — 0.3 0.4 0.3 0.2 0.2 0.2 0.2 0.3 0.3 0.2 0.3 0.3 0.2 -0.1
8th Grade — — — — 0.3 0.4 0.4 0.3 0.4 0.3 0.4 0.3 0.3 0.3 0.2 0.2 0.2 0.0 10th Grade — — — — 0.3 0.3 0.4 0.5 0.5 0.4 0.2 0.4 0.2 0.3 0.3 0.3 0.2 -0.1 12th Grade — — — — 0.6 0.4 0.6 0.4 0.4 0.7 0.3 0.5 0.4 0.3 0.5 0.3 0.4 +0.1
8th Grade — — — — — — — — — — — — — — — — — — 10th Grade — — — — — — — — — — — — — — — — — — 12th Grade 1.1 1.2 1.3 1.5 1.8 2.0 2.3 2.4 2.6 2.9 3.0‡ 4.0 4.1 4.3 3.9 3.8 3.8 +0.1
8th Grade 2.6 3.3 3.6 3.6 4.2 4.6 3.8 3.3 3.4 3.4 3.2 2.8 2.7 2.3 2.3 2.1 2.0 -0.1 10th Grade 3.3 3.6 4.3 4.5 5.3 5.5 5.1 5.1 5.0 5.4 5.6 5.2 4.3 4.0 3.7 3.5 4.0 +0.5 12th Grade 3.2 2.8 3.7 4.0 4.0 4.1 4.8 4.6 4.5 5.0 5.6 5.5 5.0 4.6 3.9 3.7 3.7 0.0
8th Grade — — — — — — — — 1.1 0.8 1.3 1.1 1.2 0.6 0.7 0.6 0.6 0.0 10th Grade — — — — — — — — 1.8 2.0 1.5 1.8 1.4 1.3 1.1 0.7 0.4 -0.3 12th Grade — — — — — — — — 1.7 1.9 1.5 1.7 1.7 1.4 0.9 0.9 0.6 -0.3
8th Grade — — — — — — — — — — — — — — — — — — 10th Grade — — — — — — — — — — — — — — — — — — 12th Grade 0.6 0.5 0.6 0.7 1.1 1.1 0.8 1.2 0.8 1.0 1.1 1.2 0.8 0.8 0.9 0.7 0.6 -0.1
Crystal Meth. (Ice)n
30-Day 2006–
Without a Needlej
Other Narcoticsk,l
Crack
Other Cocaineh
(Table continued on next page.)
Methamphetaminem,n
Heroini
With a Needlej
Ecstasy (MDMA)g
Cocaine
TABLE 3 (cont.)Trends in 30-Day Prevalence of Use of Various Drugs
in Grades 8, 10, and 12
2007change
Amphetaminesk
56

1991 1992 1993 1994 1995 1996 1997 1998 1999 2000 2001 2002 2003 2004 2005 2006 2007Sedatives (Barbiturates)k
8th Grade — — — — — — — — — — — — — — — — — — 10th Grade — — — — — — — — — — — — — — — — — — 12th Grade 1.4 1.1 1.3 1.7 2.2 2.1 2.1 2.6 2.6 3.0 2.8 3.2 2.9 2.9 3.3 3.0 2.7 -0.3
8th Grade — — — — — — — — — — — — — — — — — — 10th Grade — — — — — — — — — — — — — — — — — — 12th Grade 0.2 0.4 0.1 0.4 0.4 0.6 0.3 0.6 0.4 0.2 0.5 0.3 0.4 0.5 0.5 0.4 0.4 0.0
8th Grade 0.8 0.8 0.9 1.1 1.2 1.5 1.2 1.2 1.1 1.4‡ 1.2 1.2 1.4 1.2 1.3 1.3 1.1 -0.2 10th Grade 1.2 1.5 1.1 1.5 1.7 1.7 2.2 2.2 2.2 2.5‡ 2.9 2.9 2.4 2.3 2.3 2.4 2.6 +0.2 12th Grade 1.4 1.0 1.2 1.4 1.8 2.0 1.8 2.4 2.5 2.6‡ 2.9 3.3 2.8 3.1 2.9 2.7 2.6 -0.1
8th Grade — — — — — 0.5 0.3 0.4 0.3 0.3 0.4 0.2 0.1 0.2 0.2 0.4 0.3 -0.1 10th Grade — — — — — 0.5 0.5 0.4 0.5 0.4 0.2 0.4 0.2 0.3 0.2 0.2 0.2 0.0 12th Grade — — — — — 0.5 0.3 0.3 0.3 0.4 0.3 — — — — — — —
8th Grade 25.1 26.1‡ 24.3 25.5 24.6 26.2 24.5 23.0 24.0 22.4 21.5 19.6 19.7 18.6 17.1 17.2 15.9 -1.3 10th Grade 42.8 39.9‡ 38.2 39.2 38.8 40.4 40.1 38.8 40.0 41.0 39.0 35.4 35.4 35.2 33.2 33.8 33.4 -0.4 12th Grade 54.0 51.3‡ 48.6 50.1 51.3 50.8 52.7 52.0 51.0 50.0 49.8 48.6 47.5 48.0 47.0 45.3 44.4 -0.9
8th Grade 7.6 7.5 7.8 8.7 8.3 9.6 8.2 8.4 9.4 8.3 7.7 6.7 6.7 6.2 6.0 6.2 5.5 -0.7 10th Grade 20.5 18.1 19.8 20.3 20.8 21.3 22.4 21.1 22.5 23.5 21.9 18.3 18.2 18.5 17.6 18.8 18.1 -0.7 12th Grade 31.6 29.9 28.9 30.8 33.2 31.3 34.2 32.9 32.9 32.3 32.7 30.3 30.9 32.5 30.2 30.0 28.7 -1.3
Flavored Alcoholic Beveragese,m
8th Grade — — — — — — — — — — — — — 14.6 12.9 13.1 12.2 -0.9 10th Grade — — — — — — — — — — — — — 25.1 23.1 24.7 21.8 -2.9 ss 12th Grade — — — — — — — — — — — — — 31.1 30.5 29.3 29.1 -0.2
8th Grade 14.3 15.5 16.7 18.6 19.1 21.0 19.4 19.1 17.5 14.6 12.2 10.7 10.2 9.2 9.3 8.7 7.1 -1.6 ss 10th Grade 20.8 21.5 24.7 25.4 27.9 30.4 29.8 27.6 25.7 23.9 21.3 17.7 16.7 16.0 14.9 14.5 14.0 -0.5 12th Grade 28.3 27.8 29.9 31.2 33.5 34.0 36.5 35.1 34.6 31.4 29.5 26.7 24.4 25.0 23.2 21.6 21.6 0.0
Smokeless Tobaccoq
8th Grade 6.9 7.0 6.6 7.7 7.1 7.1 5.5 4.8 4.5 4.2 4.0 3.3 4.1 4.1 3.3 3.7 3.2 -0.5 10th Grade 10.0 9.6 10.4 10.5 9.7 8.6 8.9 7.5 6.5 6.1 6.9 6.1 5.3 4.9 5.6 5.7 6.1 +0.4 12th Grade — 11.4 10.7 11.1 12.2 9.8 9.7 8.8 8.4 7.6 7.8 6.5 6.7 6.7 7.6 6.1 6.6 +0.5
8th Grade 0.4 0.5 0.5 0.5 0.6 0.4 0.5 0.5 0.7 0.8 0.7 0.8 0.7 0.5 0.5 0.5 0.4 -0.1 10th Grade 0.6 0.6 0.5 0.6 0.6 0.5 0.7 0.6 0.9 1.0 0.9 1.0 0.8 0.8 0.6 0.6 0.5 -0.1 12th Grade 0.8 0.6 0.7 0.9 0.7 0.7 1.0 1.1 0.9 0.8 1.3 1.4 1.3 1.6 0.9 1.1 1.0 0.0
Trends in 30-Day Prevalence of Use of Various Drugsin Grades 8, 10, and 12
2007change
30-Day 2006–
TABLE 3 (cont.)
Methaqualonee,k
Source. The Monitoring the Future study, the University of Michigan.Note. See Table 1 for relevant footnotes.
Tranquilizersb,k
Rohypnolo
Steroidsr
Alcohol, Any Usep
Cigarettes, Any Use
Been Drunkn
57
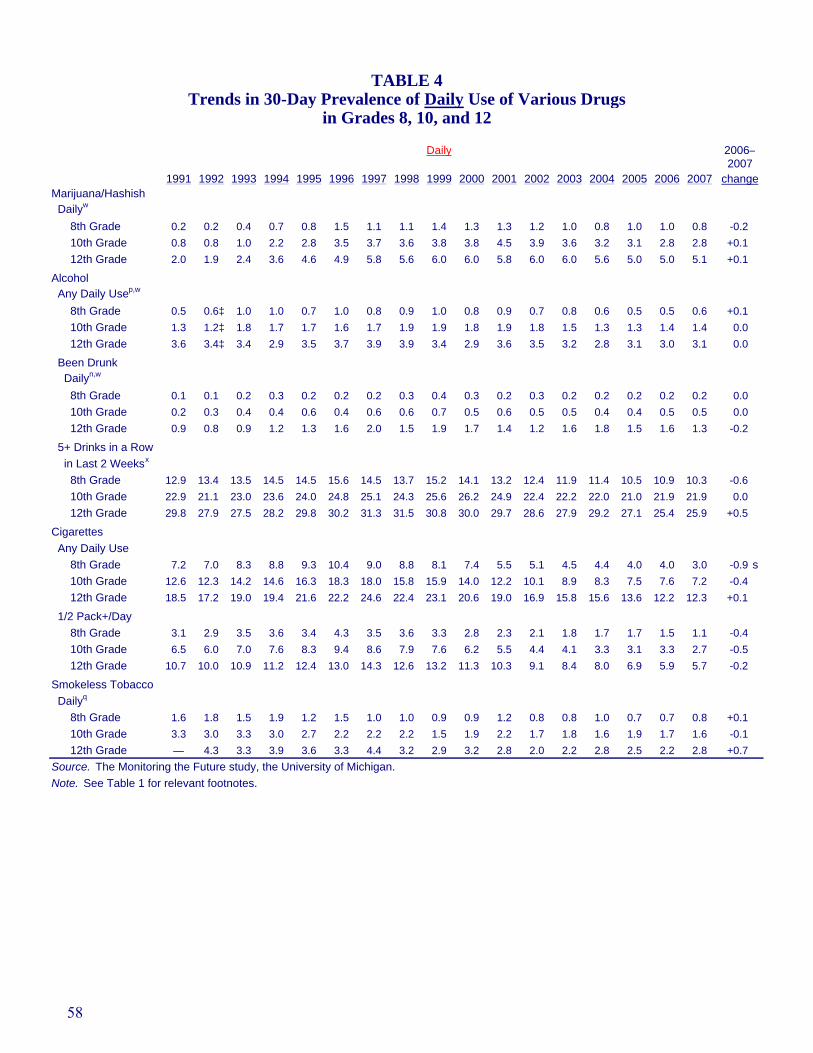
1991 1992 1993 1994 1995 1996 1997 1998 1999 2000 2001 2002 2003 2004 2005 2006 2007
Dailyw
8th Grade 0.2 0.2 0.4 0.7 0.8 1.5 1.1 1.1 1.4 1.3 1.3 1.2 1.0 0.8 1.0 1.0 0.8 -0.2 10th Grade 0.8 0.8 1.0 2.2 2.8 3.5 3.7 3.6 3.8 3.8 4.5 3.9 3.6 3.2 3.1 2.8 2.8 +0.1 12th Grade 2.0 1.9 2.4 3.6 4.6 4.9 5.8 5.6 6.0 6.0 5.8 6.0 6.0 5.6 5.0 5.0 5.1 +0.1
Alcohol Any Daily Usep,w
8th Grade 0.5 0.6‡ 1.0 1.0 0.7 1.0 0.8 0.9 1.0 0.8 0.9 0.7 0.8 0.6 0.5 0.5 0.6 +0.1 10th Grade 1.3 1.2‡ 1.8 1.7 1.7 1.6 1.7 1.9 1.9 1.8 1.9 1.8 1.5 1.3 1.3 1.4 1.4 0.0 12th Grade 3.6 3.4‡ 3.4 2.9 3.5 3.7 3.9 3.9 3.4 2.9 3.6 3.5 3.2 2.8 3.1 3.0 3.1 0.0
Dailyn,w
8th Grade 0.1 0.1 0.2 0.3 0.2 0.2 0.2 0.3 0.4 0.3 0.2 0.3 0.2 0.2 0.2 0.2 0.2 0.0 10th Grade 0.2 0.3 0.4 0.4 0.6 0.4 0.6 0.6 0.7 0.5 0.6 0.5 0.5 0.4 0.4 0.5 0.5 0.0 12th Grade 0.9 0.8 0.9 1.2 1.3 1.6 2.0 1.5 1.9 1.7 1.4 1.2 1.6 1.8 1.5 1.6 1.3 -0.2
5+ Drinks in a Row
8th Grade 12.9 13.4 13.5 14.5 14.5 15.6 14.5 13.7 15.2 14.1 13.2 12.4 11.9 11.4 10.5 10.9 10.3 -0.6 10th Grade 22.9 21.1 23.0 23.6 24.0 24.8 25.1 24.3 25.6 26.2 24.9 22.4 22.2 22.0 21.0 21.9 21.9 0.0 12th Grade 29.8 27.9 27.5 28.2 29.8 30.2 31.3 31.5 30.8 30.0 29.7 28.6 27.9 29.2 27.1 25.4 25.9 +0.5
Cigarettes Any Daily Use 8th Grade 7.2 7.0 8.3 8.8 9.3 10.4 9.0 8.8 8.1 7.4 5.5 5.1 4.5 4.4 4.0 4.0 3.0 -0.9 s 10th Grade 12.6 12.3 14.2 14.6 16.3 18.3 18.0 15.8 15.9 14.0 12.2 10.1 8.9 8.3 7.5 7.6 7.2 -0.4 12th Grade 18.5 17.2 19.0 19.4 21.6 22.2 24.6 22.4 23.1 20.6 19.0 16.9 15.8 15.6 13.6 12.2 12.3 +0.1
1/2 Pack+/Day 8th Grade 3.1 2.9 3.5 3.6 3.4 4.3 3.5 3.6 3.3 2.8 2.3 2.1 1.8 1.7 1.7 1.5 1.1 -0.4 10th Grade 6.5 6.0 7.0 7.6 8.3 9.4 8.6 7.9 7.6 6.2 5.5 4.4 4.1 3.3 3.1 3.3 2.7 -0.5 12th Grade 10.7 10.0 10.9 11.2 12.4 13.0 14.3 12.6 13.2 11.3 10.3 9.1 8.4 8.0 6.9 5.9 5.7 -0.2
8th Grade 1.6 1.8 1.5 1.9 1.2 1.5 1.0 1.0 0.9 0.9 1.2 0.8 0.8 1.0 0.7 0.7 0.8 +0.1 10th Grade 3.3 3.0 3.3 3.0 2.7 2.2 2.2 2.2 1.5 1.9 2.2 1.7 1.8 1.6 1.9 1.7 1.6 -0.1 12th Grade — 4.3 3.3 3.9 3.6 3.3 4.4 3.2 2.9 3.2 2.8 2.0 2.2 2.8 2.5 2.2 2.8 +0.7Source. The Monitoring the Future study, the University of Michigan.Note. See Table 1 for relevant footnotes.
Dailyq
Marijuana/Hashish
Been Drunk
Smokeless Tobacco
in Last 2 Weeksx
change
TABLE 4Trends in 30-Day Prevalence of Daily Use of Various Drugs
in Grades 8, 10, and 12
2007Daily 2006–
58

How
muc
h do
you
thin
k pe
ople
risk
har
min
g
them
selv
es (p
hysi
cally
or i
n ot
her w
ays)
,if
they
. . .
1991
1992
1993
1994
1995
1996
1997
1998
1999
2000
2001
2002
2003
2004
2005
2006
2007
Try
mar
ijuan
a on
ce o
r tw
ice
40.4
39.1
36.2
31.6
28.9
27.9
25.3
28.1
28.0
29.0
27.7
28.2
30.2
31.9
31.4
32.2
32.8
+0.6
Sm
oke
mar
ijuan
a oc
casi
onal
ly57
.956
.353
.848
.645
.944
.343
.145
.045
.747
.446
.346
.048
.650
.548
.948
.950
.2+1
.3S
mok
e m
ariju
ana
regu
larly
83.8
82.0
79.6
74.3
73.0
70.9
72.7
73.0
73.3
74.8
72.2
71.7
74.2
76.2
73.9
73.2
74.3
+1.1
Try
inha
lant
s on
ce o
r tw
iceb
35.9
37.0
36.5
37.9
36.4
40.8
40.1
38.9
40.8
41.2
45.6
42.8
40.3
38.7
37.5
35.8
35.9
+0.1
Take
inha
lant
s re
gula
rlyb
65.6
64.4
64.6
65.5
64.8
68.2
68.7
67.2
68.8
69.9
71.6
69.9
67.4
66.4
64.1
62.1
61.9
-0.2
Take
LS
D o
nce
or tw
icec
——
42.1
38.3
36.7
36.5
37.0
34.9
34.1
34.0
31.6
29.6
27.9
26.8
25.8
23.8
22.8
-1.0
Take
LS
D re
gula
rlyc
——
68.3
65.8
64.4
63.6
64.1
59.6
58.8
57.5
52.9
49.3
48.2
45.2
44.0
40.0
38.5
-1.5
Try
ecst
asy
(MD
MA
) onc
e or
twic
ed—
——
——
——
——
—35
.838
.941
.942
.540
.032
.830
.4-2
.3Ta
ke e
csta
sy (M
DM
A) o
ccas
iona
llyd
——
——
——
——
——
55.5
61.8
65.8
65.1
60.8
52.0
48.6
-3.4
sTr
y cr
ack
once
or t
wic
eb62
.861
.257
.254
.450
.851
.049
.949
.348
.748
.548
.647
.448
.749
.049
.647
.647
.3-0
.3Ta
ke c
rack
occ
asio
nally
b82
.279
.676
.874
.472
.171
.671
.270
.670
.670
.170
.069
.770
.370
.469
.468
.768
.3-0
.5Tr
y co
cain
e po
wde
r onc
e or
twic
eb55
.554
.150
.748
.444
.945
.245
.044
.043
.343
.343
.943
.243
.744
.444
.243
.543
.5+0
.1Ta
ke c
ocai
ne p
owde
r occ
asio
nally
b77
.074
.371
.869
.166
.465
.765
.865
.265
.465
.565
.864
.965
.866
.065
.364
.064
.2+0
.2Tr
y he
roin
onc
e or
twic
e w
ithou
t usi
ng a
nee
dlec
——
——
60.1
61.3
63.0
62.8
63.0
62.0
61.1
62.6
62.7
61.6
61.4
60.4
60.3
-0.2
Take
her
oin
occa
sion
ally
with
out u
sing
a n
eedl
ec—
——
—76
.876
.679
.279
.078
.978
.678
.578
.577
.877
.576
.875
.376
.4+1
.1Tr
y on
e or
two
drin
ks o
f an
alco
holic
bev
erag
e (
beer
, win
e, li
quor
)11
.012
.112
.411
.611
.611
.810
.412
.111
.611
.912
.212
.512
.613
.713
.914
.214
.9+0
.7Ta
ke o
ne o
r tw
o dr
inks
nea
rly e
very
day
31.8
32.4
32.6
29.9
30.5
28.6
29.1
30.3
29.7
30.4
30.0
29.6
29.9
31.0
31.4
31.3
32.6
+1.4
Hav
e fiv
e or
mor
e dr
inks
onc
e or
twic
e e
ach
wee
kend
59.1
58.0
57.7
54.7
54.1
51.8
55.6
56.0
55.3
55.9
56.1
56.4
56.5
56.9
57.2
56.4
57.9
+1.4
Sm
oke
one
or m
ore
pack
s of
cig
aret
tes
per d
aye
51.6
50.8
52.7
50.8
49.8
50.4
52.6
54.3
54.8
58.8
57.1
57.5
57.7
62.4
61.5
59.4
61.1
+1.7
Use
sm
okel
ess
toba
cco
regu
larly
35.1
35.1
36.9
35.5
33.5
34.0
35.2
36.5
37.1
39.0
38.2
39.4
39.7
41.3
40.8
39.5
41.8
+2.2
Take
ste
roid
sf64
.269
.570
.267
.6—
——
——
——
——
——
——
—A
ppro
xim
ate
N =
17,4
0018
,700
18,4
0017
,400
17,5
0017
,900
18,8
0018
,100
16,7
0016
,700
16,2
0015
,100
16,5
0017
,000
16,8
0016
,500
16,1
00
TA
BL
E 5
T
rend
s in
Har
mfu
lnes
s of D
rugs
as P
erce
ived
by
8th
Gra
ders
Any
app
aren
t inc
onsi
sten
cy b
etw
een
the
chan
ge e
stim
ate
and
the
prev
alen
ce-o
f-use
est
imat
es fo
r the
two
mos
t rec
ent c
lass
es is
due
to ro
undi
ng e
rror
.
Per
cent
age
sayi
ng "g
reat
risk
"a
8th
Gra
ders
2006
– 20
07
chan
ge
d Dat
a ba
sed
on o
ne th
ird o
f N in
dica
ted.
e Beg
inni
ng in
199
9, d
ata
base
d on
two
third
s of
N in
dica
ted
due
to c
hang
es in
que
stio
nnai
re fo
rms.
f Dat
a ba
sed
on tw
o fo
rms
in 1
991
and
1992
. D
ata
base
d on
one
of t
wo
form
s in
199
3 an
d 19
94; N
is o
ne h
alf o
f N in
dica
ted.
Sou
rce.
The
Mon
itorin
g th
e Fu
ture
stu
dy, t
he U
nive
rsity
of M
ichi
gan.
a Ans
wer
alte
rnat
ives
wer
e: (
1) N
o ris
k, (2
) Slig
ht ri
sk, (
3) M
oder
ate
risk,
(4) G
reat
risk
, and
(5) C
an’t
say,
dru
g un
fam
iliar
.b B
egin
ning
in 1
997,
dat
a ba
sed
on tw
o th
irds
of N
indi
cate
d du
e to
cha
nges
in q
uest
ionn
aire
form
s.c D
ata
base
d on
one
of t
wo
form
s in
199
3–19
96; N
is o
ne h
alf o
f N in
dica
ted.
Beg
inni
ng in
199
7, d
ata
base
d on
one
third
of N
indi
cate
d du
e to
cha
nges
in q
uest
ionn
aire
form
s.
Not
es.
Leve
l of s
igni
fican
ce o
f diff
eren
ce b
etw
een
the
two
mos
t rec
ent c
lass
es:
s =
.05,
ss
= .0
1, s
ss =
.001
. "—
" ind
icat
es d
ata
not a
vaila
ble.
59

How
muc
h do
you
thin
k pe
ople
risk
har
min
gth
emse
lves
(phy
sica
lly o
r in
othe
r way
s),
if th
ey .
. .19
9119
9219
9319
9419
9519
9619
9719
9819
9920
0020
0120
0220
0320
0420
0520
0620
07Tr
y m
ariju
ana
once
or t
wic
e30
.031
.929
.724
.421
.520
.018
.819
.619
.218
.517
.919
.921
.122
.022
.322
.222
.20.
0S
mok
e m
ariju
ana
occa
sion
ally
48.6
48.9
46.1
38.9
35.4
32.8
31.9
32.5
33.5
32.4
31.2
32.0
34.9
36.2
36.6
35.6
36.0
+0.4
Sm
oke
mar
ijuan
a re
gula
rly82
.181
.178
.571
.367
.965
.965
.965
.865
.964
.762
.860
.863
.965
.665
.564
.964
.5-0
.4Tr
y in
hala
nts
once
or t
wic
eb37
.838
.740
.942
.741
.647
.247
.545
.848
.246
.649
.948
.747
.746
.745
.743
.943
.0-0
.9Ta
ke in
hala
nts
regu
larly
b69
.867
.969
.671
.571
.875
.874
.573
.376
.375
.076
.473
.472
.273
.071
.270
.268
.6-1
.6Ta
ke L
SD
onc
e or
twic
ec—
—48
.746
.544
.745
.144
.543
.545
.043
.041
.340
.140
.840
.640
.338
.835
.4-3
.4s
Take
LS
D re
gula
rlyc
——
78.9
75.9
75.5
75.3
73.8
72.3
73.9
72.0
68.8
64.9
63.0
63.1
60.8
60.7
56.8
-4.0
ssTr
y M
DM
A (e
csta
sy) o
nce
or tw
iced
——
——
——
——
——
39.4
43.5
49.7
52.0
51.4
48.4
45.3
-3.1
Take
MD
MA
(ecs
tasy
) occ
asio
nally
d—
——
——
——
——
—64
.867
.371
.774
.672
.871
.368
.2-3
.1s
Try
crac
k on
ce o
r tw
iceb
70.4
69.6
66.6
64.7
60.9
60.9
59.2
58.0
57.8
56.1
57.1
57.4
57.6
56.7
57.0
56.6
56.4
-0.2
Take
cra
ck o
ccas
iona
llyb
87.4
86.4
84.4
83.1
81.2
80.3
78.7
77.5
79.1
76.9
77.3
75.7
76.4
76.7
76.9
76.2
76.0
-0.2
Try
coca
ine
pow
der o
nce
or tw
iceb
59.1
59.2
57.5
56.4
53.5
53.6
52.2
50.9
51.6
48.8
50.6
51.3
51.8
50.7
51.3
50.2
49.5
-0.7
Take
coc
aine
pow
der o
ccas
iona
llyb
82.2
80.1
79.1
77.8
75.6
75.0
73.9
71.8
73.6
70.9
72.3
71.0
71.4
72.2
72.4
71.3
70.9
-0.4
Try
hero
in o
nce
or tw
ice
with
out u
sing
a n
eedl
ec—
——
—70
.772
.173
.171
.773
.771
.772
.072
.270
.672
.072
.470
.070
.5+0
.5Ta
ke h
eroi
n oc
casi
onal
ly w
ithou
t usi
ng a
nee
dlec
——
——
85.1
85.8
86.5
84.9
86.5
85.2
85.4
83.4
83.5
85.4
85.2
83.6
84.2
+0.6
Try
one
or tw
o dr
inks
of a
n al
coho
lic b
ever
age
(be
er, w
ine,
liqu
or)
9.0
10.1
10.9
9.4
9.3
8.9
9.0
10.1
10.5
9.6
9.8
11.5
11.5
10.8
11.5
11.1
11.6
+0.5
Take
one
or t
wo
drin
ks n
early
eve
ry d
ay36
.136
.835
.932
.531
.731
.231
.831
.932
.932
.331
.531
.030
.931
.332
.631
.733
.3+1
.6H
ave
five
or m
ore
drin
ks o
nce
or tw
ice
eac
h w
eeke
nd54
.755
.954
.952
.952
.050
.951
.852
.551
.951
.050
.751
.751
.651
.753
.352
.454
.1+1
.7S
mok
e on
e or
mor
e pa
cks
of c
igar
ette
s pe
r day
e60
.359
.360
.759
.057
.057
.959
.961
.962
.765
.964
.764
.365
.768
.468
.167
.768
.2+0
.4U
se s
mok
eles
s to
bacc
o re
gula
rly40
.339
.644
.242
.238
.241
.042
.242
.844
.246
.746
.246
.948
.047
.846
.145
.946
.7+0
.8Ta
ke s
tero
idsf
67.1
72.7
73.4
72.5
——
——
——
——
——
——
——
App
roxi
mat
e N
=14
,700
14,8
0015
,300
15,9
0017
,000
15,7
0015
,600
15,0
0013
,600
14,3
0014
,000
14,3
0015
,800
16,4
0016
,200
16,2
0016
,100
2006
– 20
07
chan
ge
TA
BL
E 6
T
rend
s in
Har
mfu
lnes
s of D
rugs
as P
erce
ived
by
10th
Gra
ders
Per
cent
age
sayi
ng "g
reat
risk
"a
10th
Gra
ders
f Dat
a ba
sed
on tw
o fo
rms
in 1
991
and
1992
. D
ata
base
d on
one
of t
wo
form
s in
199
3 an
d 19
94; N
is o
ne h
alf o
f N in
dica
ted.
Sou
rce.
The
Mon
itorin
g th
e Fu
ture
stu
dy, t
he U
nive
rsity
of M
ichi
gan.
a Ans
wer
alte
rnat
ives
wer
e: (
1) N
o ris
k, (2
) Slig
ht ri
sk, (
3) M
oder
ate
risk,
(4) G
reat
risk
, and
(5) C
an’t
say,
dru
g un
fam
iliar
.b B
egin
ning
in 1
997,
dat
a ba
sed
on tw
o th
irds
of N
indi
cate
d du
e to
cha
nges
in q
uest
ionn
aire
form
s.c D
ata
base
d on
one
of t
wo
form
s in
199
3–19
96; N
is o
ne h
alf o
f N in
dica
ted.
Beg
inni
ng in
199
7, d
ata
base
d on
one
third
of N
ind
icat
ed d
ue to
cha
nges
in q
uest
ionn
aire
form
s.
Not
es.
Leve
l of s
igni
fican
ce o
f diff
eren
ce b
etw
een
the
two
mos
t rec
ent c
lass
es:
s =
.05,
ss
= .0
1, s
ss =
.001
. "—
" ind
icat
es d
ata
not a
vaila
ble.
A
ny a
ppar
ent i
ncon
sist
ency
bet
wee
n th
e ch
ange
est
imat
e an
d th
e pr
eval
ence
-of-u
se e
stim
ates
for t
he tw
o m
ost r
ecen
t cla
sses
is d
ue to
roun
ding
err
or.
d Dat
a ba
sed
on o
ne th
ird o
f N in
dica
ted.
e Beg
inni
ng in
199
9, d
ata
base
d on
two
third
s of
N in
dica
ted
due
to c
hang
es in
que
stio
nnai
re fo
rms.
60

How
muc
h do
you
thin
k pe
ople
risk
har
min
gth
emse
lves
(phy
sica
lly o
r in
othe
r way
s),
if th
ey .
. .19
7519
7619
7719
7819
7919
8019
8119
8219
8319
8419
8519
8619
8719
8819
8919
9019
91Tr
y m
ariju
ana
once
or t
wic
e15
.111
.49.
58.
19.
410
.013
.011
.512
.714
.714
.815
.118
.419
.023
.623
.127
.1S
mok
e m
ariju
ana
occa
sion
ally
18.1
15.0
13.4
12.4
13.5
14.7
19.1
18.3
20.6
22.6
24.5
25.0
30.4
31.7
36.5
36.9
40.6
Sm
oke
mar
ijuan
a re
gula
rly43
.338
.636
.434
.942
.050
.457
.660
.462
.866
.970
.471
.373
.577
.077
.577
.878
.6Tr
y LS
D o
nce
or tw
ice
49.4
45.7
43.2
42.7
41.6
43.9
45.5
44.9
44.7
45.4
43.5
42.0
44.9
45.7
46.0
44.7
46.6
Take
LS
D re
gula
rly
81.4
80.8
79.1
81.1
82.4
83.0
83.5
83.5
83.2
83.8
82.9
82.6
83.8
84.2
84.3
84.5
84.3
Try
PC
P o
nce
or tw
ice
——
——
——
——
——
——
55.6
58.8
56.6
55.2
51.7
Try
MD
MA
(ecs
tasy
) onc
e or
twic
e—
——
——
——
——
——
——
——
——
Try
coca
ine
once
or t
wic
e42
.639
.135
.633
.231
.531
.332
.132
.833
.035
.734
.033
.547
.951
.254
.959
.459
.4Ta
ke c
ocai
ne o
ccas
iona
lly—
——
——
——
——
——
54.2
66.8
69.2
71.8
73.9
75.5
Take
coc
aine
regu
larly
73.1
72.3
68.2
68.2
69.5
69.2
71.2
73.0
74.3
78.8
79.0
82.2
88.5
89.2
90.2
91.1
90.4
Try
crac
k on
ce o
r tw
ice
——
——
——
——
——
——
57.0
62.1
62.9
64.3
60.6
Take
cra
ck o
ccas
iona
lly—
——
——
——
——
——
—70
.473
.275
.380
.476
.5Ta
ke c
rack
regu
larly
——
——
——
——
——
——
84.6
84.8
85.6
91.6
90.1
Try
coca
ine
pow
der o
nce
or tw
ice
——
——
——
——
——
——
45.3
51.7
53.8
53.9
53.6
Take
coc
aine
pow
der o
ccas
iona
lly—
——
——
——
——
——
—56
.861
.965
.871
.169
.8Ta
ke c
ocai
ne p
owde
r reg
ular
ly—
——
——
——
——
——
—81
.482
.983
.990
.288
.9Tr
y he
roin
onc
e or
twic
e60
.158
.955
.852
.950
.452
.152
.951
.150
.849
.847
.345
.853
.654
.053
.855
.455
.2Ta
ke h
eroi
n oc
casi
onal
ly75
.675
.671
.971
.470
.970
.972
.269
.871
.870
.769
.868
.274
.673
.875
.576
.674
.9Ta
ke h
eroi
n re
gula
rly87
.288
.686
.186
.687
.586
.287
.586
.086
.187
.286
.087
.188
.788
.889
.590
.289
.6Tr
y he
roin
onc
e or
twic
e w
ithou
t usi
ng a
nee
dle
——
——
——
——
——
——
——
——
—Ta
ke h
eroi
n oc
casi
onal
ly w
ithou
t usi
ng a
nee
dle
——
——
——
——
——
——
——
——
—Tr
y am
phet
amin
es o
nce
or tw
ice
35.4
33.4
30.8
29.9
29.7
29.7
26.4
25.3
24.7
25.4
25.2
25.1
29.1
29.6
32.8
32.2
36.3
Take
am
phet
amin
es re
gula
rly69
.067
.366
.667
.169
.969
.166
.164
.764
.867
.167
.267
.369
.469
.871
.271
.274
.1Tr
y cr
ysta
l met
h. (i
ce) o
nce
or tw
ice
——
——
——
——
——
——
——
——
61.6
Try
seda
tives
(bar
bitu
rate
s) o
nce
or tw
iceb
34.8
32.5
31.2
31.3
30.7
30.9
28.4
27.5
27.0
27.4
26.1
25.4
30.9
29.7
32.2
32.4
35.1
Take
sed
ativ
es (b
arbi
tura
tes)
regu
larly
b69
.167
.768
.668
.471
.672
.269
.967
.667
.768
.568
.367
.269
.469
.670
.570
.270
.5Tr
y on
e or
two
drin
ks o
f an
alco
holic
bev
erag
e (
beer
, win
e, li
quor
)5.
34.
84.
13.
44.
13.
84.
63.
54.
24.
65.
04.
66.
26.
06.
08.
39.
1Ta
ke o
ne o
r tw
o dr
inks
nea
rly e
very
day
21.5
21.2
18.5
19.6
22.6
20.3
21.6
21.6
21.6
23.0
24.4
25.1
26.2
27.3
28.5
31.3
32.7
Take
four
or f
ive
drin
ks n
early
eve
ry d
ay63
.561
.062
.963
.166
.265
.764
.565
.566
.868
.469
.866
.569
.768
.569
.870
.969
.5H
ave
five
or m
ore
drin
ks o
nce
or tw
ice
eac
h w
eeke
nd37
.837
.034
.734
.534
.935
.936
.336
.038
.641
.743
.039
.141
.942
.644
.047
.148
.6S
mok
e on
e or
mor
e pa
cks
of c
igar
ette
s pe
r day
51.3
56.4
58.4
59.0
63.0
63.7
63.3
60.5
61.2
63.8
66.5
66.0
68.6
68.0
67.2
68.2
69.4
Use
sm
okel
ess
toba
cco
regu
larly
——
——
——
——
——
—25
.830
.033
.232
.934
.237
.4Ta
ke s
tero
ids
——
——
——
——
——
——
——
63.8
69.9
65.6
App
roxi
mat
e N
=2,
804
2,91
83,
052
3,77
03,
250
3,23
43,
604
3,55
73,
305
3,26
23,
250
3,02
03,
315
3,27
62,
796
2,55
32,
549
See
rele
vant
foot
note
. A
ny a
ppar
ent i
ncon
sist
ency
bet
wee
n th
e ch
ange
est
imat
e an
d th
e pr
eval
ence
-of-u
se e
stim
ates
for t
he tw
o m
ost r
ecen
t cla
sses
is d
ue to
roun
ding
err
or.
Not
es.
Leve
l of s
igni
fican
ce o
f diff
eren
ce b
etw
een
the
two
mos
t rec
ent c
lass
es:
s =
.05,
ss
= .0
1, s
ss =
.001
. "—
" ind
icat
es d
ata
not a
vaila
ble.
"‡"
indi
cate
s so
me
chan
ge in
que
stio
n.
S
ourc
e. T
he M
onito
ring
the
Futu
re s
tudy
, the
Uni
vers
ity o
f Mic
higa
n.
TA
BL
E 7
T
rend
s in
Har
mfu
lnes
s of D
rugs
as P
erce
ived
by
12th
Gra
ders
Per
cent
age
sayi
ng "g
reat
risk
"a
12th
Gra
ders
Con
t.
61

How
muc
h do
you
thin
k pe
ople
risk
har
min
gth
emse
lves
(phy
sica
lly o
r in
othe
r way
s),
if th
ey .
. .19
9219
9319
9419
9519
9619
9719
9819
9920
0020
0120
0220
0320
0420
0520
0620
07Tr
y m
ariju
ana
once
or t
wic
e24
.521
.919
.516
.315
.614
.916
.715
.713
.715
.316
.116
.115
.916
.117
.818
.6+0
.8S
mok
e m
ariju
ana
occa
sion
ally
39.6
35.6
30.1
25.6
25.9
24.7
24.4
23.9
23.4
23.5
23.2
26.6
25.4
25.8
25.9
27.1
+1.2
Sm
oke
mar
ijuan
a re
gula
rly76
.572
.565
.060
.859
.958
.158
.557
.458
.357
.453
.054
.954
.658
.057
.954
.8-3
.1Tr
y LS
D o
nce
or tw
ice
42.3
39.5
38.8
36.4
36.2
34.7
37.4
34.9
34.3
33.2
36.7
36.2
36.2
36.5
36.1
37.0
+1.0
Take
LS
D re
gula
rly
81.8
79.4
79.1
78.1
77.8
76.6
76.5
76.1
75.9
74.1
73.9
72.3
70.2
69.9
69.3
67.3
-2.0
Try
PC
P o
nce
or tw
ice
54.8
50.8
51.5
49.1
51.0
48.8
46.8
44.8
45.0
46.2
48.3
45.2
47.1
46.6
47.0
48.0
+1.1
Try
MD
MA
(ecs
tasy
) onc
e or
twic
e—
——
——
33.8
34.5
35.0
37.9
45.7
52.2
56.3
57.7
60.1
59.3
58.1
-1.2
Try
coca
ine
once
or t
wic
e56
.857
.657
.253
.754
.253
.654
.652
.151
.150
.751
.251
.050
.750
.552
.551
.3-1
.2Ta
ke c
ocai
ne o
ccas
iona
lly75
.173
.373
.770
.872
.172
.470
.170
.169
.569
.968
.369
.167
.266
.769
.868
.8-1
.0Ta
ke c
ocai
ne re
gula
rly90
.290
.189
.387
.988
.387
.186
.385
.886
.284
.184
.583
.082
.282
.884
.683
.3-1
.3Tr
y cr
ack
once
or t
wic
e62
.457
.658
.454
.656
.054
.052
.248
.248
.449
.450
.847
.347
.848
.447
.847
.3-0
.5Ta
ke c
rack
occ
asio
nally
76.3
73.9
73.8
72.8
71.4
70.3
68.7
67.3
65.8
65.4
65.6
64.0
64.5
63.8
64.8
63.6
-1.2
Take
cra
ck re
gula
rly89
.387
.589
.688
.688
.086
.285
.385
.485
.385
.884
.183
.283
.583
.382
.882
.6-0
.2Tr
y co
cain
e po
wde
r onc
e or
twic
e57
.153
.255
.452
.053
.251
.448
.546
.147
.049
.049
.546
.245
.446
.245
.845
.1-0
.7Ta
ke c
ocai
ne p
owde
r occ
asio
nally
70.8
68.6
70.6
69.1
68.8
67.7
65.4
64.2
64.7
63.2
64.4
61.4
61.6
60.8
61.9
59.9
-2.1
Take
coc
aine
pow
der r
egul
arly
88.4
87.0
88.6
87.8
86.8
86.0
84.1
84.6
85.5
84.4
84.2
82.3
81.7
82.7
82.1
81.5
-0.6
Try
hero
in o
nce
or tw
ice
50.9
50.7
52.8
50.9
52.5
56.7
57.8
56.0
54.2
55.6
56.0
58.0
56.6
55.2
59.1
58.4
-0.7
Take
her
oin
occa
sion
ally
74.2
72.0
72.1
71.0
74.8
76.3
76.9
77.3
74.6
75.9
76.6
78.5
75.7
76.0
79.1
76.2
-2.9
Take
her
oin
regu
larly
89.2
88.3
88.0
87.2
89.5
88.9
89.1
89.9
89.2
88.3
88.5
89.3
86.8
87.5
89.7
87.8
-1.9
Try
hero
in o
nce
or tw
ice
with
out u
sing
a n
eedl
e—
——
55.6
58.6
60.5
59.6
58.5
61.6
60.7
60.6
58.9
61.2
60.5
62.6
60.2
-2.4
Take
her
oin
occa
sion
ally
with
out u
sing
a n
eedl
e—
——
71.2
71.0
74.3
73.4
73.6
74.7
74.4
74.7
73.0
76.1
73.3
76.2
73.9
-2.4
Try
amph
etam
ines
onc
e or
twic
e32
.631
.331
.428
.830
.831
.035
.332
.232
.634
.734
.436
.835
.737
.739
.541
.3+1
.9Ta
ke a
mph
etam
ines
regu
larly
72.4
69.9
67.0
65.9
66.8
66.0
67.7
66.4
66.3
67.1
64.8
65.6
63.9
67.1
68.1
68.1
-0.1
Try
crys
tal m
eth.
(ice
) onc
e or
twic
e61
.957
.558
.354
.455
.354
.452
.751
.251
.352
.753
.851
.252
.454
.659
.160
.2+1
.1Tr
y se
dativ
es (b
arbi
tura
tes)
onc
e or
twic
eb32
.229
.229
.926
.329
.126
.929
.026
.125
.025
.726
.227
.9‡
24.9
24.7
28.0
27.9
-0.1
Take
sed
ativ
es (b
arbi
tura
tes)
regu
larly
b70
.266
.163
.361
.660
.456
.856
.354
.152
.350
.349
.349
.6‡
54.0
54.1
56.8
55.1
-1.6
Try
one
or tw
o dr
inks
of a
n al
coho
lic b
ever
age
(be
er, w
ine,
liqu
or)
8.6
8.2
7.6
5.9
7.3
6.7
8.0
8.3
6.4
8.7
7.6
8.4
8.6
8.5
9.3
10.5
+1.1
Take
one
or t
wo
drin
ks n
early
eve
ry d
ay30
.628
.227
.024
.825
.124
.824
.321
.821
.723
.421
.020
.123
.023
.725
.325
.1-0
.2Ta
ke fo
ur o
r fiv
e dr
inks
nea
rly e
very
day
70.5
67.8
66.2
62.8
65.6
63.0
62.1
61.1
59.9
60.7
58.8
57.8
59.2
61.8
63.4
61.8
-1.6
Hav
e fiv
e or
mor
e dr
inks
onc
e or
twic
e e
ach
wee
kend
49.0
48.3
46.5
45.2
49.5
43.0
42.8
43.1
42.7
43.6
42.2
43.5
43.6
45.0
47.6
45.8
-1.8
Sm
oke
one
or m
ore
pack
s of
cig
aret
tes
per d
ay69
.269
.567
.665
.668
.268
.770
.870
.873
.173
.374
.272
.174
.076
.577
.677
.3-0
.3U
se s
mok
eles
s to
bacc
o re
gula
rly35
.538
.936
.633
.237
.438
.640
.941
.142
.245
.442
.643
.345
.043
.645
.944
.0-1
.9Ta
ke s
tero
ids
70.7
69.1
66.1
66.4
67.6
67.2
68.1
62.1
57.9
58.9
57.1
55.0
55.7
56.8
60.2
57.4
-2.8
App
roxi
mat
e N
=2,
684
2,75
92,
591
2,60
32,
449
2,57
92,
564
2,30
62,
130
2,17
32,
198
2,46
62,
491
2,51
22,
407
2,45
0
b In 2
004
the
ques
tion
text
was
cha
nged
from
"bar
bitu
rate
s" to
"sed
ativ
es/b
arbi
tura
tes"
and
the
list o
f exa
mpl
es w
as c
hang
ed fr
om "d
owne
rs, g
oofb
alls
, red
s, y
ello
ws,
etc
." to
just
"dow
ners
." T
hese
cha
nges
like
ly e
xpla
in th
e di
scon
tinui
ty in
the
2004
resu
lts.
TA
BL
E 7
(con
t.)
Tre
nds i
n H
arm
fuln
ess o
f Dru
gs a
s Per
ceiv
ed b
y 12
th G
rade
rs
a Ans
wer
alte
rnat
ives
wer
e: (
1) N
o ris
k, (2
) Slig
ht ri
sk, (
3) M
oder
ate
risk,
(4) G
reat
risk
, and
(5) C
an’t
say,
dru
g un
fam
iliar
.
Per
cent
age
sayi
ng "g
reat
risk
"a20
06–
2007
ch
ange
12th
Gra
ders
62

Do
you
disa
ppro
ve o
f peo
ple
doin
g ea
ch o
f the
follo
win
g?19
9119
9219
9319
9419
9519
9619
9719
9819
9920
0020
0120
0220
0320
0420
0520
0620
07Tr
ying
mar
ijuan
a on
ce o
r tw
ice
84.6
82.1
79.2
72.9
70.7
67.5
67.6
69.0
70.7
72.5
72.4
73.3
73.8
75.9
75.3
76.0
78.7
+2.8
sss
Sm
okin
g m
ariju
ana
occa
sion
ally
89.5
88.1
85.7
80.9
79.7
76.5
78.1
78.4
79.3
80.6
80.6
80.9
81.5
83.1
82.4
82.2
84.5
+2.3
ssS
mok
ing
mar
ijuan
a re
gula
rly92
.190
.888
.985
.385
.182
.884
.684
.584
.585
.384
.585
.385
.786
.886
.386
.187
.7+1
.7s
Tryi
ng in
hala
nts
once
or t
wic
eb84
.984
.082
.581
.681
.882
.984
.183
.085
.285
.486
.686
.185
.185
.184
.683
.484
.1+0
.7Ta
king
inha
lant
s re
gula
rlyb
90.6
90.0
88.9
88.1
88.8
89.3
90.3
89.5
90.3
90.2
90.5
90.4
89.8
90.1
89.8
89.0
89.5
+0.5
Taki
ng L
SD
onc
e or
twic
ec—
—77
.175
.271
.670
.972
.169
.169
.466
.764
.662
.661
.058
.158
.553
.953
.5-0
.4Ta
king
LS
D re
gula
rlyc
——
79.8
78.4
75.8
75.3
76.3
72.5
72.5
69.3
67.0
65.5
63.5
60.5
60.7
55.8
55.6
-0.2
Tryi
ng M
DM
A (e
csta
sy) o
nce
or tw
iced
——
——
——
——
——
69.0
74.3
77.7
76.3
75.0
66.7
65.7
-1.0
Taki
ng M
DM
A (e
csta
sy) o
ccas
iona
llyd
——
——
——
——
——
73.6
78.6
81.3
79.4
77.9
69.8
68.3
-1.5
Tryi
ng c
rack
onc
e or
twic
eb91
.790
.789
.186
.985
.985
.085
.785
.486
.085
.486
.086
.286
.487
.487
.687
.288
.6+1
.4s
Taki
ng c
rack
occ
asio
nally
b93
.392
.591
.789
.989
.889
.390
.389
.589
.988
.889
.889
.689
.890
.390
.590
.091
.2+1
.1Tr
ying
coc
aine
pow
der o
nce
or tw
iceb
91.2
89.6
88.5
86.1
85.3
83.9
85.1
84.5
85.2
84.8
85.6
85.8
85.6
86.8
87.0
86.5
88.2
+1.7
sTa
king
coc
aine
pow
der o
ccas
iona
llyb
93.1
92.4
91.6
89.7
89.7
88.7
90.1
89.3
89.9
88.8
89.6
89.9
89.8
90.3
90.7
90.2
91.0
+0.9
Tryi
ng h
eroi
n on
ce o
r tw
ice
with
out u
sing
a n
eedl
ec—
——
—85
.885
.087
.787
.388
.087
.287
.287
.886
.986
.686
.987
.288
.4+1
.2Ta
king
her
oin
occa
sion
ally
with
out u
sing
a n
eedl
ec—
——
—88
.587
.790
.189
.790
.288
.988
.989
.689
.088
.688
.588
.589
.7+1
.2Tr
ying
one
or t
wo
drin
ks o
f an
alco
holic
bev
erag
e (
beer
, win
e, li
quor
)51
.752
.250
.947
.848
.045
.545
.747
.548
.348
.749
.851
.149
.751
.151
.251
.354
.0+2
.8s
Taki
ng o
ne o
r tw
o dr
inks
nea
rly e
very
day
82.2
81.0
79.6
76.7
75.9
74.1
76.6
76.9
77.0
77.8
77.4
78.3
77.1
78.6
78.7
78.7
80.4
+1.7
Hav
ing
five
or m
ore
drin
ks o
nce
or tw
ice
eac
h w
eeke
nd85
.283
.983
.380
.780
.779
.181
.381
.080
.381
.281
.681
.981
.982
.382
.982
.083
.8+1
.8s
Sm
okin
g on
e or
mor
e pa
cks
of c
igar
ette
s pe
r day
e82
.882
.380
.678
.478
.677
.380
.380
.081
.481
.983
.584
.684
.685
.785
.385
.687
.0+1
.4U
sing
sm
okel
ess
toba
cco
regu
larly
79.1
77.2
77.1
75.1
74.0
74.1
76.5
76.3
78.0
79.2
79.4
80.6
80.7
81.0
82.0
81.0
82.3
+1.3
Taki
ng s
tero
idsf
89.8
90.3
89.9
87.9
——
——
——
——
——
——
——
App
roxi
mat
e N
=17
,400
18,5
0018
,400
17,4
0017
,600
18,0
0018
,800
18,1
0016
,700
16,7
0016
,200
15,1
0016
,500
17,0
0016
,800
16,5
0016
,100
e Beg
inni
ng in
199
9, d
ata
base
d on
two
third
s of
N in
dica
ted
due
to c
hang
es in
que
stio
nnai
re fo
rms.
f Dat
a ba
sed
on tw
o fo
rms
in 1
991
and
1992
. D
ata
base
d on
one
of t
wo
form
s in
199
3 an
d 19
94; N
is o
ne h
alf o
f N in
dica
ted.
Sou
rce.
The
Mon
itorin
g th
e Fu
ture
stu
dy, t
he U
nive
rsity
of M
ichi
gan.
a Ans
wer
alte
rnat
ives
wer
e: (
1) D
on't
disa
ppro
ve, (
2) D
isap
prov
e, (3
) Stro
ngly
dis
appr
ove,
and
(4) C
an’t
say,
dru
g un
fam
iliar
.
c Dat
a ba
sed
on o
ne o
f tw
o fo
rms
in 1
993–
1996
; N is
one
hal
f of N
indi
cate
d. B
egin
ning
in 1
997,
dat
a ba
sed
on o
ne th
ird o
f N in
dica
ted
due
to c
hang
es in
que
stio
nnai
re fo
rms.
d Dat
a ba
sed
on o
ne th
ird o
f N in
dica
ted.
Not
es.
Leve
l of s
igni
fican
ce o
f diff
eren
ce b
etw
een
the
two
mos
t rec
ent c
lass
es:
s =
.05,
ss
= .0
1, s
ss =
.001
. "—
" ind
icat
es d
ata
not a
vaila
ble.
A
ny a
ppar
ent i
ncon
sist
ency
bet
wee
n th
e ch
ange
est
imat
e an
d th
e pr
eval
ence
-of-u
se e
stim
ates
for t
he tw
o m
ost r
ecen
t cla
sses
is d
ue to
roun
ding
err
or.
TA
BL
E 8
T
rend
s in
Dis
appr
oval
of D
rug
Use
by
8th
Gra
ders
b Beg
inni
ng in
199
7, d
ata
base
d on
two
third
s of
N in
dica
ted
due
to c
hang
es in
que
stio
nnai
re fo
rms.
Per
cent
age
who
"dis
appr
ove"
or "
stro
ngly
dis
appr
ove"
a
8th
Gra
ders
2006
–
2007
ch
ange
63
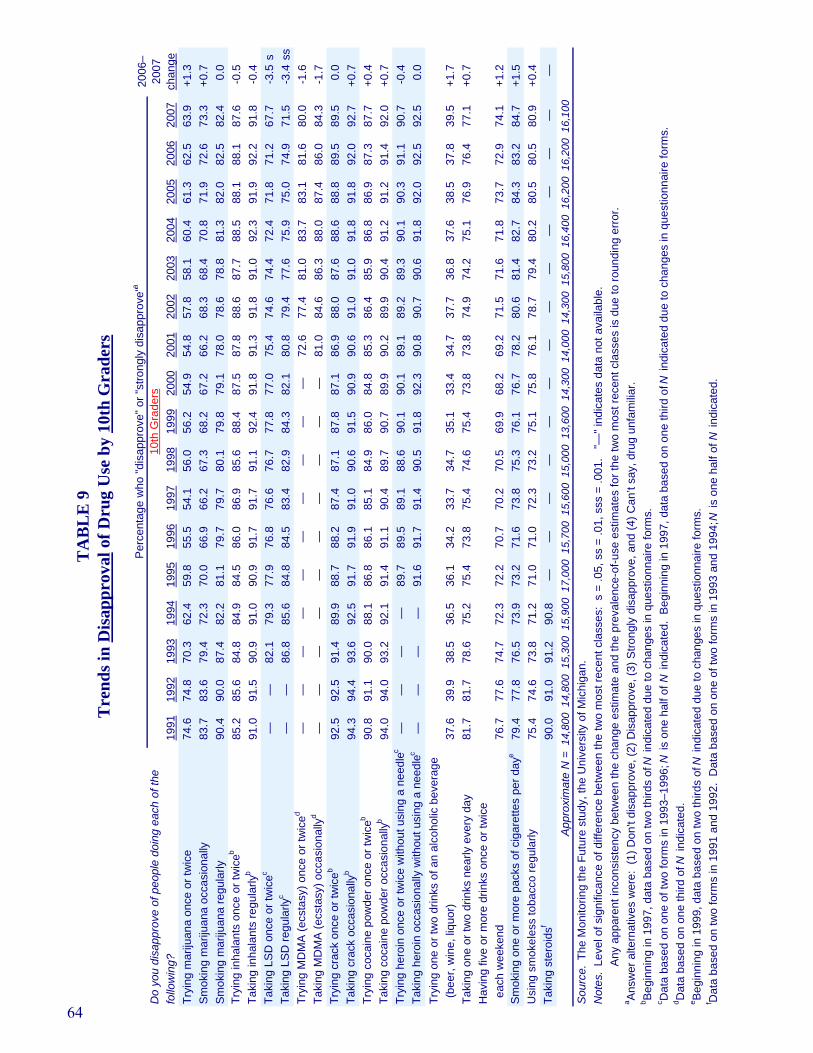
Do
you
disa
ppro
ve o
f peo
ple
doin
g ea
ch o
f the
follo
win
g?19
9119
9219
9319
9419
9519
9619
9719
9819
9920
0020
0120
0220
0320
0420
0520
0620
07Tr
ying
mar
ijuan
a on
ce o
r tw
ice
74.6
74.8
70.3
62.4
59.8
55.5
54.1
56.0
56.2
54.9
54.8
57.8
58.1
60.4
61.3
62.5
63.9
+1.3
Sm
okin
g m
ariju
ana
occa
sion
ally
83.7
83.6
79.4
72.3
70.0
66.9
66.2
67.3
68.2
67.2
66.2
68.3
68.4
70.8
71.9
72.6
73.3
+0.7
Sm
okin
g m
ariju
ana
regu
larly
90.4
90.0
87.4
82.2
81.1
79.7
79.7
80.1
79.8
79.1
78.0
78.6
78.8
81.3
82.0
82.5
82.4
0.0
Tryi
ng in
hala
nts
once
or t
wic
eb85
.285
.684
.884
.984
.586
.086
.985
.688
.487
.587
.888
.687
.788
.588
.188
.187
.6-0
.5Ta
king
inha
lant
s re
gula
rlyb
91.0
91.5
90.9
91.0
90.9
91.7
91.7
91.1
92.4
91.8
91.3
91.8
91.0
92.3
91.9
92.2
91.8
-0.4
Taki
ng L
SD
onc
e or
twic
ec—
—82
.179
.377
.976
.876
.676
.777
.877
.075
.474
.674
.472
.471
.871
.267
.7-3
.5s
Taki
ng L
SD
regu
larly
c —
—86
.885
.684
.884
.583
.482
.984
.382
.180
.879
.477
.675
.975
.074
.971
.5-3
.4ss
Tryi
ng M
DM
A (e
csta
sy) o
nce
or tw
iced
——
——
——
——
——
72.6
77.4
81.0
83.7
83.1
81.6
80.0
-1.6
Taki
ng M
DM
A (e
csta
sy) o
ccas
iona
llyd
——
——
——
——
——
81.0
84.6
86.3
88.0
87.4
86.0
84.3
-1.7
Tryi
ng c
rack
onc
e or
twic
eb92
.592
.591
.489
.988
.788
.287
.487
.187
.887
.186
.988
.087
.688
.688
.889
.589
.50.
0Ta
king
cra
ck o
ccas
iona
llyb
94.3
94.4
93.6
92.5
91.7
91.9
91.0
90.6
91.5
90.9
90.6
91.0
91.0
91.8
91.8
92.0
92.7
+0.7
Tryi
ng c
ocai
ne p
owde
r onc
e or
twic
eb90
.891
.190
.088
.186
.886
.185
.184
.986
.084
.885
.386
.485
.986
.886
.987
.387
.7+0
.4Ta
king
coc
aine
pow
der o
ccas
iona
llyb
94.0
94.0
93.2
92.1
91.4
91.1
90.4
89.7
90.7
89.9
90.2
89.9
90.4
91.2
91.2
91.4
92.0
+0.7
Tryi
ng h
eroi
n on
ce o
r tw
ice
with
out u
sing
a n
eedl
ec—
——
—89
.789
.589
.188
.690
.190
.189
.189
.289
.390
.190
.391
.190
.7-0
.4Ta
king
her
oin
occa
sion
ally
with
out u
sing
a n
eedl
ec—
——
—91
.691
.791
.490
.591
.892
.390
.890
.790
.691
.892
.092
.592
.50.
0Tr
ying
one
or t
wo
drin
ks o
f an
alco
holic
bev
erag
e (
beer
, win
e, li
quor
)37
.639
.938
.536
.536
.134
.233
.734
.735
.133
.434
.737
.736
.837
.638
.537
.839
.5+1
.7Ta
king
one
or t
wo
drin
ks n
early
eve
ry d
ay81
.781
.778
.675
.275
.473
.875
.474
.675
.473
.873
.874
.974
.275
.176
.976
.477
.1+0
.7H
avin
g fiv
e or
mor
e dr
inks
onc
e or
twic
e e
ach
wee
kend
76.7
77.6
74.7
72.3
72.2
70.7
70.2
70.5
69.9
68.2
69.2
71.5
71.6
71.8
73.7
72.9
74.1
+1.2
Sm
okin
g on
e or
mor
e pa
cks
of c
igar
ette
s pe
r day
e79
.477
.876
.573
.973
.271
.673
.875
.376
.176
.778
.280
.681
.482
.784
.383
.284
.7+1
.5U
sing
sm
okel
ess
toba
cco
regu
larly
75.4
74.6
73.8
71.2
71.0
71.0
72.3
73.2
75.1
75.8
76.1
78.7
79.4
80.2
80.5
80.5
80.9
+0.4
Taki
ng s
tero
idsf
90.0
91.0
91.2
90.8
——
——
——
——
——
——
——
App
roxi
mat
e N
=14
,800
14,8
0015
,300
15,9
0017
,000
15,7
0015
,600
15,0
0013
,600
14,3
0014
,000
14,3
0015
,800
16,4
0016
,200
16,2
0016
,100
e Beg
inni
ng in
199
9, d
ata
base
d on
two
third
s of
N in
dica
ted
due
to c
hang
es in
que
stio
nnai
re fo
rms.
f Dat
a ba
sed
on tw
o fo
rms
in 1
991
and
1992
. D
ata
base
d on
one
of t
wo
form
s in
199
3 an
d 19
94; N
is o
ne h
alf o
f N in
dica
ted.
Sou
rce.
The
Mon
itorin
g th
e Fu
ture
stu
dy, t
he U
nive
rsity
of M
ichi
gan.
a Ans
wer
alte
rnat
ives
wer
e: (
1) D
on't
disa
ppro
ve, (
2) D
isap
prov
e, (3
) Stro
ngly
dis
appr
ove,
and
(4) C
an’t
say,
dru
g un
fam
iliar
.
c Dat
a ba
sed
on o
ne o
f tw
o fo
rms
in 1
993–
1996
; N is
one
hal
f of N
indi
cate
d. B
egin
ning
in 1
997,
dat
a ba
sed
on o
ne th
ird o
f N in
dica
ted
due
to c
hang
es in
que
stio
nnai
re fo
rms.
d D
ata
base
d on
one
third
of N
indi
cate
d.
Not
es.
Leve
l of s
igni
fican
ce o
f diff
eren
ce b
etw
een
the
two
mos
t rec
ent c
lass
es:
s =
.05,
ss
= .0
1, s
ss =
.001
. "—
" ind
icat
es d
ata
not a
vaila
ble.
A
ny a
ppar
ent i
ncon
sist
ency
bet
wee
n th
e ch
ange
est
imat
e an
d th
e pr
eval
ence
-of-u
se e
stim
ates
for t
he tw
o m
ost r
ecen
t cla
sses
is d
ue to
roun
ding
err
or.
TA
BL
E 9
Tre
nds i
n D
isap
prov
al o
f Dru
g U
se b
y 10
th G
rade
rs
b Beg
inni
ng in
199
7, d
ata
base
d on
two
third
s of
N in
dica
ted
due
to c
hang
es in
que
stio
nnai
re fo
rms.
Per
cent
age
who
"dis
appr
ove"
or "
stro
ngly
dis
appr
ove"
a
10th
Gra
ders
2006
–
2007
ch
ange
64
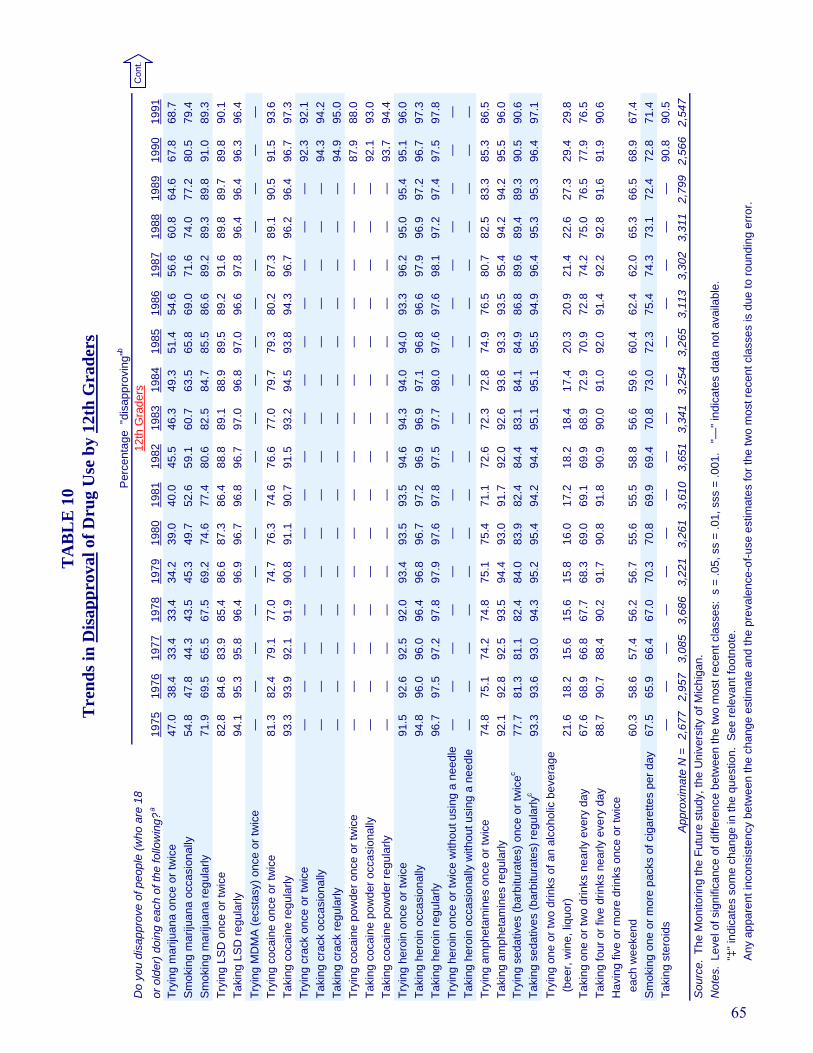
Do
you
disa
ppro
ve o
f peo
ple
(who
are
18
or
old
er) d
oing
eac
h of
the
follo
win
g?a
1975
1976
1977
1978
1979
1980
1981
1982
1983
1984
1985
1986
1987
1988
1989
1990
1991
Tryi
ng m
ariju
ana
once
or t
wic
e47
.038
.433
.433
.434
.239
.040
.045
.546
.349
.351
.454
.656
.660
.864
.667
.868
.7S
mok
ing
mar
ijuan
a oc
casi
onal
ly54
.847
.844
.343
.545
.349
.752
.659
.160
.763
.565
.869
.071
.674
.077
.280
.579
.4S
mok
ing
mar
ijuan
a re
gula
rly71
.969
.565
.567
.569
.274
.677
.480
.682
.584
.785
.586
.689
.289
.389
.891
.089
.3Tr
ying
LS
D o
nce
or tw
ice
82.8
84.6
83.9
85.4
86.6
87.3
86.4
88.8
89.1
88.9
89.5
89.2
91.6
89.8
89.7
89.8
90.1
Taki
ng L
SD
regu
larly
94
.195
.395
.896
.496
.996
.796
.896
.797
.096
.897
.096
.697
.896
.496
.496
.396
.4Tr
ying
MD
MA
(ecs
tasy
) onc
e or
twic
e—
——
——
——
——
——
——
——
——
Tryi
ng c
ocai
ne o
nce
or tw
ice
81.3
82.4
79.1
77.0
74.7
76.3
74.6
76.6
77.0
79.7
79.3
80.2
87.3
89.1
90.5
91.5
93.6
Taki
ng c
ocai
ne re
gula
rly93
.393
.992
.191
.990
.891
.190
.791
.593
.294
.593
.894
.396
.796
.296
.496
.797
.3Tr
ying
cra
ck o
nce
or tw
ice
——
——
——
——
——
——
——
—92
.392
.1Ta
king
cra
ck o
ccas
iona
lly—
——
——
——
——
——
——
——
94.3
94.2
Taki
ng c
rack
regu
larly
——
——
——
——
——
——
——
—94
.995
.0Tr
ying
coc
aine
pow
der o
nce
or tw
ice
——
——
——
——
——
——
——
—87
.988
.0Ta
king
coc
aine
pow
der o
ccas
iona
lly—
——
——
——
——
——
——
——
92.1
93.0
Taki
ng c
ocai
ne p
owde
r reg
ular
ly—
——
——
——
——
——
——
——
93.7
94.4
Tryi
ng h
eroi
n on
ce o
r tw
ice
91.5
92.6
92.5
92.0
93.4
93.5
93.5
94.6
94.3
94.0
94.0
93.3
96.2
95.0
95.4
95.1
96.0
Taki
ng h
eroi
n oc
casi
onal
ly94
.896
.096
.096
.496
.896
.797
.296
.996
.997
.196
.896
.697
.996
.997
.296
.797
.3Ta
king
her
oin
regu
larly
96.7
97.5
97.2
97.8
97.9
97.6
97.8
97.5
97.7
98.0
97.6
97.6
98.1
97.2
97.4
97.5
97.8
Tryi
ng h
eroi
n on
ce o
r tw
ice
with
out u
sing
a n
eedl
e—
——
——
——
——
——
——
——
——
Taki
ng h
eroi
n oc
casi
onal
ly w
ithou
t usi
ng a
nee
dle
——
——
——
——
——
——
——
——
—Tr
ying
am
phet
amin
es o
nce
or tw
ice
74.8
75.1
74.2
74.8
75.1
75.4
71.1
72.6
72.3
72.8
74.9
76.5
80.7
82.5
83.3
85.3
86.5
Taki
ng a
mph
etam
ines
regu
larly
92.1
92.8
92.5
93.5
94.4
93.0
91.7
92.0
92.6
93.6
93.3
93.5
95.4
94.2
94.2
95.5
96.0
Tryi
ng s
edat
ives
(bar
bitu
rate
s) o
nce
or tw
icec
77.7
81.3
81.1
82.4
84.0
83.9
82.4
84.4
83.1
84.1
84.9
86.8
89.6
89.4
89.3
90.5
90.6
Taki
ng s
edat
ives
(bar
bitu
rate
s) re
gula
rlyc
93.3
93.6
93.0
94.3
95.2
95.4
94.2
94.4
95.1
95.1
95.5
94.9
96.4
95.3
95.3
96.4
97.1
Tryi
ng o
ne o
r tw
o dr
inks
of a
n al
coho
lic b
ever
age
(be
er, w
ine,
liqu
or)
21.6
18.2
15.6
15.6
15.8
16.0
17.2
18.2
18.4
17.4
20.3
20.9
21.4
22.6
27.3
29.4
29.8
Taki
ng o
ne o
r tw
o dr
inks
nea
rly e
very
day
67.6
68.9
66.8
67.7
68.3
69.0
69.1
69.9
68.9
72.9
70.9
72.8
74.2
75.0
76.5
77.9
76.5
Taki
ng fo
ur o
r fiv
e dr
inks
nea
rly e
very
day
88.7
90.7
88.4
90.2
91.7
90.8
91.8
90.9
90.0
91.0
92.0
91.4
92.2
92.8
91.6
91.9
90.6
Hav
ing
five
or m
ore
drin
ks o
nce
or tw
ice
eac
h w
eeke
nd60
.358
.657
.456
.256
.755
.655
.558
.856
.659
.660
.462
.462
.065
.366
.568
.967
.4S
mok
ing
one
or m
ore
pack
s of
cig
aret
tes
per d
ay
67.5
65.9
66.4
67.0
70.3
70.8
69.9
69.4
70.8
73.0
72.3
75.4
74.3
73.1
72.4
72.8
71.4
Taki
ng s
tero
ids
——
——
——
——
——
——
——
—90
.890
.5A
ppro
xim
ate
N =
2,67
72,
957
3,08
53,
686
3,22
13,
261
3,61
03,
651
3,34
13,
254
3,26
53,
113
3,30
23,
311
2,79
92,
566
2,54
7
TA
BL
E 1
0 T
rend
s in
Dis
appr
oval
of D
rug
Use
by
12th
Gra
ders
Per
cent
age
"dis
appr
ovin
g"b
12th
Gra
ders
Any
app
aren
t inc
onsi
sten
cy b
etw
een
the
chan
ge e
stim
ate
and
the
prev
alen
ce-o
f-use
est
imat
es fo
r the
two
mos
t rec
ent c
lass
es is
due
to ro
undi
ng e
rror
.
Not
es.
Leve
l of s
igni
fican
ce o
f diff
eren
ce b
etw
een
the
two
mos
t rec
ent c
lass
es:
s =
.05,
ss
= .0
1, s
ss =
.001
. "—
" ind
icat
es d
ata
not a
vaila
ble.
"‡
" ind
icat
es s
ome
chan
ge in
the
ques
tion.
See
rele
vant
foot
note
.
Sou
rce.
The
Mon
itorin
g th
e Fu
ture
stu
dy, t
he U
nive
rsity
of M
ichi
gan.
Con
t.
65

Do
you
disa
ppro
ve o
f peo
ple
(who
are
18
or
old
er) d
oing
eac
h of
the
follo
win
g ?a
1992
1993
1994
1995
1996
1997
1998
1999
2000
2001
2002
2003
2004
2005
2006
2007
Tryi
ng m
ariju
ana
once
or t
wic
e69
.963
.357
.656
.752
.551
.051
.648
.852
.549
.151
.653
.452
.755
.055
.658
.6+2
.9S
mok
ing
mar
ijuan
a oc
casi
onal
ly79
.775
.568
.966
.762
.963
.264
.462
.565
.863
.263
.464
.265
.467
.869
.370
.2+0
.8S
mok
ing
mar
ijuan
a re
gula
rly90
.187
.682
.381
.980
.078
.881
.278
.679
.779
.378
.378
.780
.782
.082
.283
.3+1
.1Tr
ying
LS
D o
nce
or tw
ice
88.1
85.9
82.5
81.1
79.6
80.5
82.1
83.0
82.4
81.8
84.6
85.5
87.9
87.9
88.0
87.8
-0.2
Taki
ng L
SD
regu
larly
95
.595
.894
.392
.593
.292
.993
.594
.394
.294
.094
.094
.494
.695
.695
.994
.9-1
.0Tr
ying
MD
MA
(ecs
tasy
) onc
e or
twic
e—
——
——
82.2
82.5
82.1
81.0
79.5
83.6
84.7
87.7
88.4
89.0
87.8
-1.1
Tryi
ng c
ocai
ne o
nce
or tw
ice
93.0
92.7
91.6
90.3
90.0
88.0
89.5
89.1
88.2
88.1
89.0
89.3
88.6
88.9
89.1
89.6
+0.6
Taki
ng c
ocai
ne re
gula
rly96
.997
.596
.696
.195
.696
.095
.694
.995
.594
.995
.095
.895
.496
.096
.196
.2+0
.1Tr
ying
cra
ck o
nce
or tw
ice
93.1
89.9
89.5
91.4
87.4
87.0
86.7
87.6
87.5
87.0
87.8
86.6
86.9
86.7
88.8
88.8
+0.1
Taki
ng c
rack
occ
asio
nally
95.0
92.8
92.8
94.0
91.2
91.3
90.9
92.3
91.9
91.6
91.5
90.8
92.1
91.9
92.9
92.4
-0.5
Taki
ng c
rack
regu
larly
95.5
93.4
93.1
94.1
93.0
92.3
91.9
93.2
92.8
92.2
92.4
91.2
93.1
92.1
93.8
93.6
-0.2
Tryi
ng c
ocai
ne p
owde
r onc
e or
twic
e89
.486
.687
.188
.383
.183
.083
.184
.384
.183
.383
.883
.682
.283
.284
.183
.5-0
.6Ta
king
coc
aine
pow
der o
ccas
iona
lly93
.491
.291
.092
.789
.789
.388
.790
.090
.389
.890
.288
.990
.089
.490
.490
.6+0
.2Ta
king
coc
aine
pow
der r
egul
arly
94.3
93.0
92.5
93.8
92.9
91.5
91.1
92.3
92.6
92.5
92.2
90.7
92.6
92.0
93.2
92.6
-0.6
Tryi
ng h
eroi
n on
ce o
r tw
ice
94.9
94.4
93.2
92.8
92.1
92.3
93.7
93.5
93.0
93.1
94.1
94.1
94.2
94.3
93.8
94.8
+1.0
Taki
ng h
eroi
n oc
casi
onal
ly96
.897
.096
.295
.795
.095
.496
.195
.796
.095
.495
.695
.996
.496
.396
.296
.8+0
.6Ta
king
her
oin
regu
larly
97.2
97.5
97.1
96.4
96.3
96.4
96.6
96.4
96.6
96.2
96.2
97.1
97.1
96.7
96.9
97.1
+0.2
Tryi
ng h
eroi
n on
ce o
r tw
ice
with
out u
sing
a n
eedl
e —
——
92.9
90.8
92.3
93.0
92.6
94.0
91.7
93.1
92.2
93.1
93.2
93.7
93.6
-0.1
Taki
ng h
eroi
n oc
casi
onal
ly w
ithou
t usi
ng a
nee
dle
—
——
94.7
93.2
94.4
94.3
93.8
95.2
93.5
94.4
93.5
94.4
95.0
94.5
94.9
+0.5
Tryi
ng a
mph
etam
ines
onc
e or
twic
e86
.984
.281
.382
.279
.981
.382
.581
.982
.182
.383
.885
.884
.186
.186
.387
.3+1
.0Ta
king
am
phet
amin
es re
gula
rly95
.696
.094
.194
.393
.594
.394
.093
.794
.193
.493
.594
.093
.994
.895
.395
.4+0
.1Tr
ying
sed
ativ
es (b
arbi
tura
tes)
onc
e or
twic
ec90
.389
.787
.587
.384
.986
.486
.086
.685
.985
.986
.687
.8‡
83.7
85.4
85.3
86.5
+1.3
Taki
ng s
edat
ives
(bar
bitu
rate
s) re
gula
rlyc
96.5
97.0
96.1
95.2
94.8
95.3
94.6
94.7
95.2
94.5
94.7
94.4
‡94
.295
.295
.194
.6-0
.5Tr
ying
one
or t
wo
drin
ks o
f an
alco
holic
bev
erag
e (
beer
, win
e, li
quor
)33
.030
.128
.427
.326
.526
.124
.524
.625
.226
.626
.327
.226
.026
.429
.031
.0+2
.0Ta
king
one
or t
wo
drin
ks n
early
eve
ry d
ay75
.977
.873
.173
.370
.870
.069
.467
.270
.069
.269
.168
.969
.570
.872
.873
.3+0
.5Ta
king
four
or f
ive
drin
ks n
early
eve
ry d
ay90
.890
.689
.888
.889
.488
.686
.786
.988
.486
.487
.586
.387
.889
.490
.690
.5-0
.1H
avin
g fiv
e or
mor
e dr
inks
onc
e or
twic
e e
ach
wee
kend
70.7
70.1
65.1
66.7
64.7
65.0
63.8
62.7
65.2
62.9
64.7
64.2
65.7
66.5
68.5
68.8
+0.3
Sm
okin
g on
e or
mor
e pa
cks
of c
igar
ette
s pe
r day
73.5
70.6
69.8
68.2
67.2
67.1
68.8
69.5
70.1
71.6
73.6
74.8
76.2
79.8
81.5
80.7
-0.8
Taki
ng s
tero
ids
92.1
92.1
91.9
91.0
91.7
91.4
90.8
88.9
88.8
86.4
86.8
86.0
87.9
88.8
89.4
89.2
-0.2
App
roxi
mat
e N
=2,
645
2,72
32,
588
2,60
32,
399
2,60
12,
545
2,31
02,
150
2,14
42,
160
2,44
22,
455
2,46
02,
377
2,45
0
c In 2
004
the
ques
tion
text
was
cha
nged
from
"bar
bitu
rate
s" to
"sed
ativ
es/b
arbi
tura
tes"
and
the
list o
f exa
mpl
es w
as c
hang
ed fr
om "d
owne
rs, g
oofb
alls
, red
s, y
ello
ws,
etc
." to
just
"dow
ners
." T
hese
cha
nges
like
ly e
xpla
in th
e di
scon
tinui
ty in
the
2004
resu
lts.
2006
–
2007
ch
ange
TA
BL
E 1
0 (c
ont.)
T
rend
s in
Dis
appr
oval
of D
rug
Use
by
12th
Gra
ders
a The
1975
que
stio
n as
ked
abou
t peo
ple
who
are
"20
or o
lder
."b A
nsw
er a
ltern
ativ
es w
ere:
(1)
Don
't di
sapp
rove
, (2)
Dis
appr
ove,
and
(3) S
trong
ly d
isap
prov
e. P
erce
ntag
es a
re s
how
n fo
r cat
egor
ies
(2) a
nd (3
) com
bine
d.
Per
cent
age
"dis
appr
ovin
g"b
12th
Gra
ders
66

How
diff
icul
t do
you
thin
k it
wou
ld b
e
for y
ou to
get
eac
h of
the
follo
win
g
type
s of
dru
gs, i
f you
wan
ted
som
e?19
9219
9319
9419
9519
9619
9719
9819
9920
0020
0120
0220
0320
0420
0520
0620
07M
ariju
ana
42.3
43.8
49.9
52.4
54.8
54.2
50.6
48.4
47.0
48.1
46.6
44.8
41.0
41.1
39.6
37.4
-2.2
sLS
D21
.521
.821
.823
.523
.622
.719
.318
.317
.017
.615
.214
.012
.311
.510
.810
.5-0
.2P
CPb
18.0
18.5
17.7
19.0
19.6
19.2
17.5
17.1
16.0
15.4
14.1
13.7
11.4
11.0
10.5
9.5
-1.1
MD
MA
(ecs
tasy
)b—
——
——
——
——
23.8
22.8
21.6
16.6
15.6
14.5
13.4
-1.1
Cra
ck25
.625
.926
.928
.727
.927
.526
.525
.924
.924
.423
.722
.520
.620
.820
.919
.7-1
.2C
ocai
ne p
owde
r25
.725
.926
.427
.827
.226
.925
.725
.023
.923
.922
.521
.619
.419
.920
.219
.0-1
.2H
eroi
n19
.719
.819
.421
.120
.619
.818
.017
.516
.516
.916
.015
.614
.113
.213
.012
.6-0
.3O
ther
nar
cotic
sb19
.819
.018
.320
.320
.020
.617
.116
.215
.615
.014
.715
.012
.412
.913
.011
.7-1
.3A
mph
etam
ines
32.2
31.4
31.0
33.4
32.6
30.6
27.3
25.9
25.5
26.2
24.4
24.4
21.9
21.0
20.7
19.9
-0.8
Cry
stal
met
h. (i
ce)b
16.0
15.1
14.1
16.0
16.3
15.7
16.0
14.7
14.9
13.9
13.3
14.1
11.9
13.5
14.5
12.1
-2.5
ssS
edat
ives
(bar
bitu
rate
s)27
.426
.125
.326
.525
.624
.421
.120
.819
.720
.719
.419
.318
.017
.617
.316
.8-0
.5Tr
anqu
ilize
rs22
.921
.420
.421
.320
.419
.618
.117
.316
.217
.816
.917
.315
.814
.814
.414
.40.
0A
lcoh
ol76
.273
.974
.574
.975
.374
.973
.172
.370
.670
.667
.967
.064
.964
.263
.062
.0-1
.0C
igar
ette
s77
.875
.576
.176
.476
.976
.073
.671
.568
.767
.764
.363
.160
.359
.158
.055
.6-2
.4ss
Ste
roid
s24
.022
.723
.123
.824
.123
.622
.322
.622
.323
.122
.021
.719
.718
.117
.117
.0-0
.1A
ppro
xim
ate
N =
8,35
516
,775
16,1
1915
,496
16,3
1816
,482
16,2
0815
,397
15,1
8014
,804
13,9
7215
,583
15,9
4415
,730
15,5
0215
,043
TA
BL
E 1
1 T
rend
s in
Ava
ilabi
lity
of D
rugs
as P
erce
ived
by
8th
Gra
ders
Not
es.
Leve
l of s
igni
fican
ce o
f diff
eren
ce b
etw
een
the
two
mos
t rec
ent c
lass
es:
s =
.05,
ss
= .0
1, s
ss =
.001
.
"—" i
ndic
ates
dat
a no
t ava
ilabl
e.
a Ans
wer
alte
rnat
ives
wer
e: (
1) P
roba
bly
impo
ssib
le, (
2) V
ery
diffi
cult,
(3) F
airly
diff
icul
t, (4
) Fai
rly e
asy,
(5) V
ery
easy
, and
(6) C
an't
say,
dru
g un
fam
iliar
. b B
egin
ning
in 1
993,
dat
a ba
sed
on h
alf o
f for
ms;
N is
one
hal
f of N
indi
cate
d.
Per
cent
age
sayi
ng "f
airly
eas
y" o
r "ve
ry e
asy"
to g
eta
8th
Gra
ders
Any
app
aren
t inc
onsi
sten
cy b
etw
een
the
chan
ge e
stim
ate
and
the
prev
alen
ce-o
f-use
est
imat
es fo
r the
two
mos
t rec
ent c
lass
es is
due
to ro
undi
ng e
rror
.
Sou
rce.
The
Mon
itorin
g th
e Fu
ture
stu
dy, t
he U
nive
rsity
of M
ichi
gan.
2006
–
2007
ch
ange
67
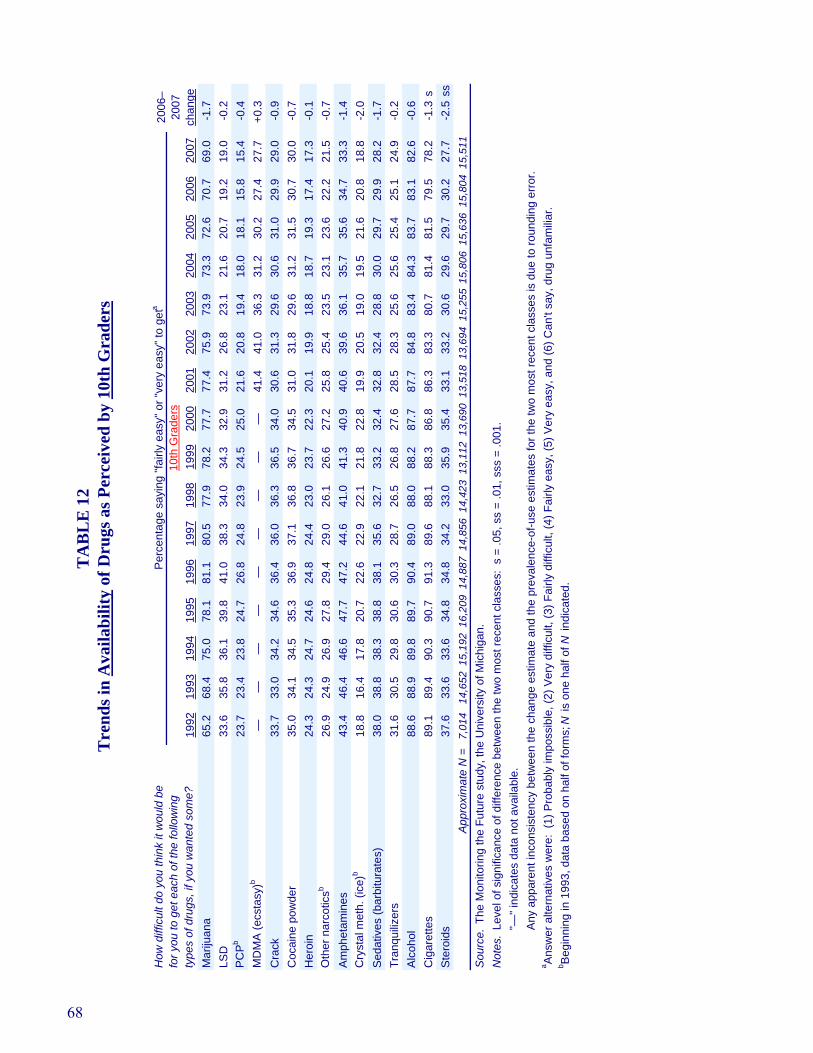
How
diff
icul
t do
you
thin
k it
wou
ld b
e fo
r you
to g
et e
ach
of th
e fo
llow
ing
type
s of
dru
gs, i
f you
wan
ted
som
e?19
9219
9319
9419
9519
9619
9719
9819
9920
0020
0120
0220
0320
0420
0520
0620
07M
ariju
ana
65.2
68.4
75.0
78.1
81.1
80.5
77.9
78.2
77.7
77.4
75.9
73.9
73.3
72.6
70.7
69.0
-1.7
LSD
33.6
35.8
36.1
39.8
41.0
38.3
34.0
34.3
32.9
31.2
26.8
23.1
21.6
20.7
19.2
19.0
-0.2
PC
Pb23
.723
.423
.824
.726
.824
.823
.924
.525
.021
.620
.819
.418
.018
.115
.815
.4-0
.4M
DM
A (e
csta
sy)b
——
——
——
——
—41
.441
.036
.331
.230
.227
.427
.7+0
.3C
rack
33.7
33.0
34.2
34.6
36.4
36.0
36.3
36.5
34.0
30.6
31.3
29.6
30.6
31.0
29.9
29.0
-0.9
Coc
aine
pow
der
35.0
34.1
34.5
35.3
36.9
37.1
36.8
36.7
34.5
31.0
31.8
29.6
31.2
31.5
30.7
30.0
-0.7
Her
oin
24.3
24.3
24.7
24.6
24.8
24.4
23.0
23.7
22.3
20.1
19.9
18.8
18.7
19.3
17.4
17.3
-0.1
Oth
er n
arco
ticsb
26.9
24.9
26.9
27.8
29.4
29.0
26.1
26.6
27.2
25.8
25.4
23.5
23.1
23.6
22.2
21.5
-0.7
Am
phet
amin
es43
.446
.446
.647
.747
.244
.641
.041
.340
.940
.639
.636
.135
.735
.634
.733
.3-1
.4C
ryst
al m
eth.
(ice
)b18
.816
.417
.820
.722
.622
.922
.121
.822
.819
.920
.519
.019
.521
.620
.818
.8-2
.0S
edat
ives
(bar
bitu
rate
s)38
.038
.838
.338
.838
.135
.632
.733
.232
.432
.832
.428
.830
.029
.729
.928
.2-1
.7Tr
anqu
ilize
rs31
.630
.529
.830
.630
.328
.726
.526
.827
.628
.528
.325
.625
.625
.425
.124
.9-0
.2A
lcoh
ol88
.688
.989
.889
.790
.489
.088
.088
.287
.787
.784
.883
.484
.383
.783
.182
.6-0
.6C
igar
ette
s89
.189
.490
.390
.791
.389
.688
.188
.386
.886
.383
.380
.781
.481
.579
.578
.2-1
.3s
Ste
roid
s37
.633
.633
.634
.834
.834
.233
.035
.935
.433
.133
.230
.629
.629
.730
.227
.7-2
.5ss
App
roxi
mat
e N
=7,
014
14,6
5215
,192
16,2
0914
,887
14,8
5614
,423
13,1
1213
,690
13,5
1813
,694
15,2
5515
,806
15,6
3615
,804
15,5
11
a Ans
wer
alte
rnat
ives
wer
e: (
1) P
roba
bly
impo
ssib
le, (
2) V
ery
diffi
cult,
(3) F
airly
diff
icul
t, (4
) Fai
rly e
asy,
(5) V
ery
easy
, and
(6) C
an't
say,
dru
g un
fam
iliar
. b B
egin
ning
in 1
993,
dat
a ba
sed
on h
alf o
f for
ms;
N is
one
hal
f of N
indi
cate
d.
Any
app
aren
t inc
onsi
sten
cy b
etw
een
the
chan
ge e
stim
ate
and
the
prev
alen
ce-o
f-use
est
imat
es fo
r the
two
mos
t rec
ent c
lass
es is
due
to ro
undi
ng e
rror
.
TA
BL
E 1
2 T
rend
s in
Ava
ilabi
lity
of D
rugs
as P
erce
ived
by
10th
Gra
ders
Not
es.
Leve
l of s
igni
fican
ce o
f diff
eren
ce b
etw
een
the
two
mos
t rec
ent c
lass
es:
s =
.05,
ss
= .0
1, s
ss =
.001
.
"—" i
ndic
ates
dat
a no
t ava
ilabl
e.
Per
cent
age
sayi
ng "f
airly
eas
y" o
r "ve
ry e
asy"
to g
eta
10th
Gra
ders
Sou
rce.
The
Mon
itorin
g th
e Fu
ture
stu
dy, t
he U
nive
rsity
of M
ichi
gan.
2006
–
2007
ch
ange
68
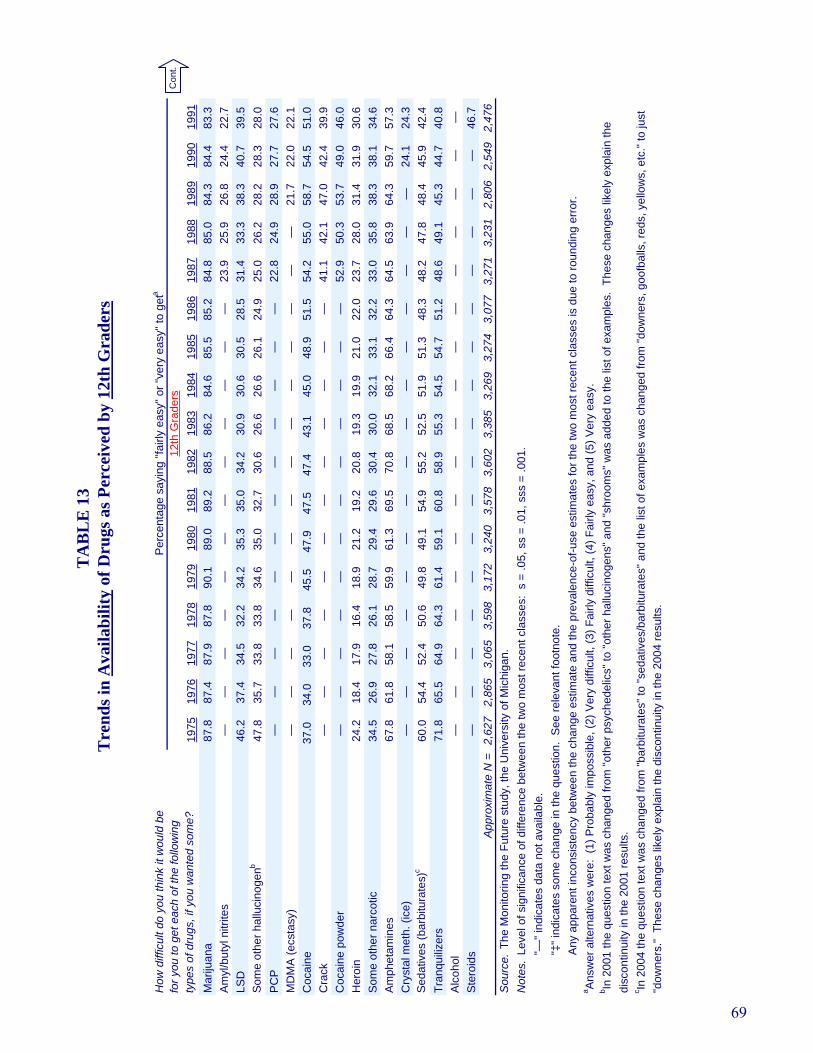
How
diff
icul
t do
you
thin
k it
wou
ld b
e
for y
ou to
get
eac
h of
the
follo
win
g
type
s of
dru
gs, i
f you
wan
ted
som
e?19
7519
7619
7719
7819
7919
8019
8119
8219
8319
8419
8519
8619
8719
8819
8919
9019
91M
ariju
ana
87.8
87.4
87.9
87.8
90.1
89.0
89.2
88.5
86.2
84.6
85.5
85.2
84.8
85.0
84.3
84.4
83.3
Am
yl/b
utyl
nitr
ites
——
——
——
——
——
——
23.9
25.9
26.8
24.4
22.7
LSD
46.2
37.4
34.5
32.2
34.2
35.3
35.0
34.2
30.9
30.6
30.5
28.5
31.4
33.3
38.3
40.7
39.5
Som
e ot
her h
allu
cino
genb
47.8
35.7
33.8
33.8
34.6
35.0
32.7
30.6
26.6
26.6
26.1
24.9
25.0
26.2
28.2
28.3
28.0
PC
P—
——
——
——
——
——
—22
.824
.928
.927
.727
.6M
DM
A (e
csta
sy)
——
——
——
——
——
——
——
21.7
22.0
22.1
Coc
aine
37.0
34.0
33.0
37.8
45.5
47.9
47.5
47.4
43.1
45.0
48.9
51.5
54.2
55.0
58.7
54.5
51.0
Cra
ck—
——
——
——
——
——
—41
.142
.147
.042
.439
.9C
ocai
ne p
owde
r—
——
——
——
——
——
—52
.950
.353
.749
.046
.0H
eroi
n24
.218
.417
.916
.418
.921
.219
.220
.819
.319
.921
.022
.023
.728
.031
.431
.930
.6S
ome
othe
r nar
cotic
34.5
26.9
27.8
26.1
28.7
29.4
29.6
30.4
30.0
32.1
33.1
32.2
33.0
35.8
38.3
38.1
34.6
Am
phet
amin
es67
.861
.858
.158
.559
.961
.369
.570
.868
.568
.266
.464
.364
.563
.964
.359
.757
.3C
ryst
al m
eth.
(ice
)—
——
——
——
——
——
——
——
24.1
24.3
Sed
ativ
es (b
arbi
tura
tes)
c60
.054
.452
.450
.649
.849
.154
.955
.252
.551
.951
.348
.348
.247
.848
.445
.942
.4Tr
anqu
ilize
rs71
.865
.564
.964
.361
.459
.160
.858
.955
.354
.554
.751
.248
.649
.145
.344
.740
.8A
lcoh
ol—
——
——
——
——
——
——
——
——
Ste
roid
s—
——
——
——
——
——
——
——
—46
.7A
ppro
xim
ate
N =
2,62
72,
865
3,06
53,
598
3,17
23,
240
3,57
83,
602
3,38
53,
269
3,27
43,
077
3,27
13,
231
2,80
62,
549
2,47
6
"dow
ners
." T
hese
cha
nges
like
ly e
xpla
in th
e di
scon
tinui
ty in
the
2004
resu
lts.
Not
es.
Leve
l of s
igni
fican
ce o
f diff
eren
ce b
etw
een
the
two
mos
t rec
ent c
lass
es:
s =
.05,
ss
= .0
1, s
ss =
.001
.
a Ans
wer
alte
rnat
ives
wer
e: (
1) P
roba
bly
impo
ssib
le, (
2) V
ery
diffi
cult,
(3) F
airly
diff
icul
t, (4
) Fai
rly e
asy,
and
(5) V
ery
easy
.b In
200
1 th
e qu
estio
n te
xt w
as c
hang
ed fr
om "o
ther
psy
ched
elic
s" to
"oth
er h
allu
cino
gens
" and
"shr
oom
s" w
as a
dded
to th
e lis
t of e
xam
ples
. Th
ese
chan
ges
likel
y ex
plai
n th
e di
scon
tinui
ty in
the
2001
resu
lts.
c In 2
004
the
ques
tion
text
was
cha
nged
from
"bar
bitu
rate
s" to
"sed
ativ
es/b
arbi
tura
tes"
and
the
list o
f exa
mpl
es w
as c
hang
ed fr
om "d
owne
rs, g
oofb
alls
, red
s, y
ello
ws,
etc
." to
just
"—" i
ndic
ates
dat
a no
t ava
ilabl
e.
Any
app
aren
t inc
onsi
sten
cy b
etw
een
the
chan
ge e
stim
ate
and
the
prev
alen
ce-o
f-use
est
imat
es fo
r the
two
mos
t rec
ent c
lass
es is
due
to ro
undi
ng e
rror
.
"‡
" ind
icat
es s
ome
chan
ge in
the
ques
tion.
See
rele
vant
foot
note
.
Sou
rce.
The
Mon
itorin
g th
e Fu
ture
stu
dy, t
he U
nive
rsity
of M
ichi
gan.
TA
BL
E 1
3 T
rend
s in
Ava
ilabi
lity
of D
rugs
as P
erce
ived
by
12th
Gra
ders
12th
Gra
ders
Per
cent
age
sayi
ng "f
airly
eas
y" o
r "ve
ry e
asy"
to g
eta
Con
t.
69

How
diff
icul
t do
you
thin
k it
wou
ld b
e
for y
ou to
get
eac
h of
the
follo
win
g ty
pes
of d
rugs
, if y
ou w
ante
d so
me?
1992
1993
1994
1995
1996
1997
1998
1999
2000
2001
2002
2003
2004
2005
2006
2007
Mar
ijuan
a82
.783
.085
.588
.588
.789
.690
.488
.988
.588
.587
.287
.185
.885
.684
.983
.9-1
.0A
myl
/but
yl n
itrite
s25
.925
.926
.726
.023
.923
.825
.121
.423
.322
.522
.319
.720
.019
.718
.418
.1-0
.4LS
D44
.549
.250
.853
.851
.350
.748
.844
.746
.944
.739
.633
.633
.128
.629
.028
.7-0
.3S
ome
othe
r hal
luci
noge
nb29
.933
.533
.835
.833
.933
.935
.129
.534
.5‡
48.5
47.7
47.2
49.4
45.0
43.9
43.7
-0.3
PC
P31
.731
.731
.431
.030
.530
.030
.726
.728
.827
.225
.821
.924
.223
.223
.121
.0-2
.1M
DM
A (e
csta
sy)
24.2
28.1
31.2
34.2
36.9
38.8
38.2
40.1
51.4
61.5
59.1
57.5
47.9
40.3
40.3
40.9
+0.7
Coc
aine
52.7
48.5
46.6
47.7
48.1
48.5
51.3
47.6
47.8
46.2
44.6
43.3
47.8
44.7
46.5
47.1
+0.6
Cra
ck43
.543
.640
.541
.940
.740
.643
.841
.142
.640
.238
.535
.339
.239
.338
.837
.5-1
.2C
ocai
ne p
owde
r48
.045
.443
.743
.844
.443
.345
.743
.744
.640
.740
.237
.441
.741
.642
.541
.2-1
.3H
eroi
n34
.933
.734
.135
.132
.233
.835
.632
.133
.532
.329
.027
.929
.627
.327
.429
.7+2
.2S
ome
othe
r nar
cotic
37
.137
.538
.039
.840
.038
.942
.840
.843
.940
.544
.044
.040
.239
.239
.637
.3-2
.3A
mph
etam
ines
58.8
61.5
62.0
62.8
59.4
59.8
60.8
58.1
57.1
57.1
57.4
57.4
55.4
51.2
52.9
49.6
-3.3
Cry
stal
met
h. (i
ce)
26.0
26.6
25.6
27.0
26.9
27.6
29.8
27.6
27.8
28.3
28.3
26.1
26.7
27.2
26.7
25.1
-1.6
Sed
ativ
es (b
arbi
tura
tes)
c44
.044
.543
.342
.341
.440
.040
.737
.937
.435
.736
.635
.3‡
46.3
44.4
43.8
41.7
-2.1
Tran
quili
zers
40.9
41.1
39.2
37.8
36.0
35.4
36.2
32.7
33.8
33.1
32.9
29.8
30.1
25.7
24.4
23.6
-0.8
Alc
ohol
——
——
——
—95
.094
.894
.394
.794
.294
.293
.092
.592
.2-0
.3S
tero
ids
46.8
44.8
42.9
45.5
40.3
41.7
44.5
44.6
44.8
44.4
45.5
40.7
42.6
39.7
41.1
40.1
-1.0
App
roxi
mat
e N
=2,
586
2,67
02,
526
2,55
22,
340
2,51
72,
520
2,21
52,
095
2,12
02,
138
2,39
12,
169
2,16
12,
131
2,42
0
TA
BL
E 1
3 (c
ont.)
T
rend
s in
Ava
ilabi
lity
of D
rugs
as P
erce
ived
by
12th
Gra
ders
Per
cent
age
sayi
ng "f
airly
eas
y" o
r "ve
ry e
asy"
to g
eta
12th
Gra
ders
2006
–
2007
ch
ange
Sou
rce.
The
Mon
itorin
g th
e Fu
ture
stu
dy, t
he U
nive
rsity
of M
ichi
gan.
Not
es.
Leve
l of s
igni
fican
ce o
f diff
eren
ce b
etw
een
the
two
mos
t rec
ent c
lass
es:
s =
.05,
ss
= .0
1, s
ss =
.001
.
c In 2
004
the
ques
tion
text
was
cha
nged
from
"bar
bitu
rate
s" to
"sed
ativ
es/b
arbi
tura
tes"
and
the
list o
f exa
mpl
es w
as c
hang
ed fr
om "d
owne
rs, g
oofb
alls
, red
s, y
ello
ws,
etc
." to
just
"d
owne
rs."
The
se c
hang
es li
kely
exp
lain
the
disc
ontin
uity
in th
e 20
04 re
sults
.
a Ans
wer
alte
rnat
ives
wer
e: (
1) P
roba
bly
impo
ssib
le, (
2) V
ery
diffi
cult,
(3) F
airly
diff
icul
t, (4
) Fai
rly e
asy,
and
(5) V
ery
easy
.b In
200
1 th
e qu
estio
n te
xt w
as c
hang
ed fr
om "o
ther
psy
ched
elic
s" to
"oth
er h
allu
cino
gens
" and
"shr
oom
s" w
as a
dded
to th
e lis
t of e
xam
ples
. Th
ese
chan
ges
likel
y ex
plai
n th
e
disc
ontin
uity
in th
e 20
01 re
sults
.
"—" i
ndic
ates
dat
a no
t ava
ilabl
e.
"‡" i
ndic
ates
som
e ch
ange
in th
e qu
estio
n. S
ee re
leva
nt fo
otno
te.
Any
app
aren
t inc
onsi
sten
cy b
etw
een
the
chan
ge e
stim
ate
and
the
prev
alen
ce-o
f-use
est
imat
es fo
r the
two
mos
t rec
ent c
lass
es is
due
to ro
undi
ng e
rror
.
70
NIH Publication No. 08-6418April 2008