Overview of Japanese Industrial Technology...
80
INDUSTRY ANDENERGY DEPAATMENT WORKING PAPER INDUSTRY SERIES PAPER No. 6 Overviewof JapaneseIndustrial Technology Development FILE copy March 1989 The World Bank Industry and Energy Department,PPR Public Disclosure Authorized Public Disclosure Authorized Public Disclosure Authorized Public Disclosure Authorized
Transcript of Overview of Japanese Industrial Technology...
INDUSTRY AND ENERGY DEPAATMENT WORKING PAPERINDUSTRY SERIES PAPER No. 6
Overview of Japanese IndustrialTechnology Development
FILE copy
March 1989
The World Bank Industry and Energy Department, PPR
Pub
lic D
iscl
osur
e A
utho
rized
Pub
lic D
iscl
osur
e A
utho
rized
Pub
lic D
iscl
osur
e A
utho
rized
Pub
lic D
iscl
osur
e A
utho
rized

OVERVIEW OF JAPANESE INDUSTRIALTECHNOLOGY DEVELOPMENT
Sadao Nagaoka
March 1989
odusuy Development Disionodustry and Energ Department'olcy, Plaing and ResearchVorld Bank

-rg or THE - 2EyXAuLZK-TL 3Q2M1QL2M0ZW
Tshla of Contgnta
REI'flRE NJ0RLDWAR .. . ... .......... 1 ......
A. Governmnt Investment and Divestiture ........ 1S. Foreign Experts and the Educational System ....... 1C. Infrastructure for Technology Development .. .... 2D. Trade and the Incentive Regime ..... 3S. Dlrect Foreign Investment 4 . .. .. .
it. ECONOMIC AND KV=PM1=IN THR POST-UAR DECADES... ......... 5
A. Economic Performance.. .... .... 5B. Contribution of Technological Progress to
Economic Growth ..... ..... 6C. Industrial Technology Development and
InternatLonal Trade . .........
111. GENERAL EMVIRONMENT UHICH SUPPORmTD THE RAPID. 11
A. Hm= Resources ........................ .......... 11
1. The Educational System .... .112. Training Supported by Enterprisos . .113. Effect on Technology Development . .12
B. Domstic CompetLtion . . .131. Market Structure . .132. Sources of Domestic Competition . .14
C. Activist Industrial Policy . .. 161. Temporary Protection and Export Promotion * 162. Effects on Technology Developmnt .193. DistinguishLng Factors of the Industrial
Policy of Japan .20
nV. IMPORT OF FOREI ITS MASTERY.23
A. General Trends of Technology Import .23B. Government Measures ... . ...... . .26
1. Regulation of the Import of ForelgnTechnology. ...... 26
2. Flscal Incentive for the Introduction ofNov Technology .30

ABLE or on'=x (Conelnust)
3. Utects of the Iestrictlve Policy onDirect Foreign Investment .................. 32
4. Intorsdlation by Public ResearchInstitutions and UnLvrsities .............. 33
V. DESIJ On .r oKL2a* .............. .. * * * * .................. 35
A. Strong Viability of Small and Medium Enterprises 35B. Subcontracting System . .... ..... 35C. National Developmnt of QualLty Control
System .. 37D. Policies and Institutions Supporting Technology
Diffusion to Small and Medium Enterprise .. 40F. Analysis and Potential Lssons . .43
Vt. DIYe LOPKT OF RU SEROI AND D= .EN caPASiTY.... 45
A. Domestic R&D Efforts ........... . . ...................... 45B. R3 PolLelos . .................................... 47
1. Fiscal and Financial Incentives ...... ....... 472. Government-sponsored R&D Schem .......... .. 513. Research Associatlon ...... ................. S24. National Research Laboratories ............. 535. Patent system .............................. 54
C. Analysis and Lessons ...... 55
viz. goNC2lZo Q ................ 57
UA:LADZZ
L. This paper provides an overview of the experience of industrialtechnology develOpment in Japan since World War I. It doos not attempt toconduct new empirical work, partly due to the sizable existing litorature.The main contribution of the paper is a broader and more systematic approachto undorstanding the process of industrial technology development In Japan.
1i. Chapter I presencs a brief hiatorv of intrial teehnolggyga.Jnno s in Japan before World War II ln order to place the subsequentdevelopment in perspective. It focuses primarily on the role of government.
11i. Chapter 1I briefly reviows the interaion beMwee egongmic growtha ad techbnol develLone In the post-War era. It draws attention to thefollowing facts: First, Japan's high economic growth was heavily dependent ontechnology development i.e., successive introduction of new technologies andnew Industries. Second, it took substantial time and technological effort fornewly introduced technology to generate sizable exports.
iv. Chapter III discusses the gneral enironment, which has supportedrapid lndustrial technology development: human resources development,aomestic competition, and an active industrial policy. it points out that aromrkable expansion of science and engineering manpower took place ln Japan.It also discusses three major factors that may have made a difference in theeffectiveness of industrial pollcy-cum-protection compared with many develop-ing countries today: fierce domestic competition, non-accomodative protec-tion, and baic dependence on market initiatives and discipline.
v. Chpter IV reviews the experience of the regulatory and incentivepo lcy for of fgrei teabnago, includLng governmentscreening of technology imports and the role of a restrictive DFV polLcy. Italso draws &ttention to public research institutions' effective role intechnology transfer.
vt. Chapter V turns to the experience of tachnglogv difuon. Itpoints out that the decentralized industrial organLzation in Japan--theoxtensive subcontracting systems and subsidiary networks- -was highly effectivefor technology diffusion, primarily due to increased incentives for technologyusers to inmovate. It also discusses the government's information andpromotional measures for t chnology diffusion: masures for the developmentof quality control system and measures for supporting technology diffusion tos_1ll and medium enterpises.
vii. Chapter Vt diacusses adeveloment golieies It pointsout that rapid grofth in R&D capabillty was achievd in Japan with only modestR&D support from the government. It discusses both general and targetedsupport for R6D: fiscal and financial incentives. government-sponsored R&Dsch_eme, research assocLations, natLonal research laboratories, and the patentsyst".
viLL. The Conclusion presents major potential lessons for developingcountries and outlines an agenda for future research.

A. And OUSISUt.
1.01 The initil forward stop toward lndustTialization was taken by theJapans. government, although extensive manual productLon activities alreadyexisted in traditional industries such as textiles, metal working and woodprocessing before the Meiji restoration (1869). In 1870, the Kinlstry ofEn8glnering wvs created. It *stablished government-owned factories in severalsectors (textiles, shipbuLldLng. engineering. steel. papor, etc.). Thesefactories were Lntended to deoonstrate modern technology from abroad. Mostfactories were sold to the private sector in 1880 because of the fiscal crisLsthat resulted from clvil var in Japan.
1.02 This divestiture provided the business foundation for the MaLh&Mgroups by offering the opportunlty for the transformation of com reialcapital into industrial capital. The divestiture was associated with thetransfer of technological resources from the public sector to the privatesector, since the government already had made a massive effort in developinghuman technical resources.
1.03 Thre vws a substantial doonstration effect in the textilesector. Although technologies usod in the government spianing factories weretoo capital intensive for private enterprises to adopt directly, they stimu-lated private enterprises to adapt modern technology and eventually to developsplnning technology fitting the Japanese environment of that time. Thetextile Lndustry became a major export Industry and led the Lndustrializationof Japan.
B. the Edacional Svstr
1.04 During the 10 years from 1872 to 1881. the governmeat invitedthousands of foreLgn educators, engLnoers and other experts to provideassistance in running the government-owned factories and educational institu-tions.!/ The Ministry of Enginsering allocated about 42% of its total budget
3/ Baused on Tamemaw I. DJaan nLC aiDv1siog o f LJAbe (in Japanese), ToyokeLzai, 1984, Chapter 7; KobayashiT. Zo. J.a n lr z (ln Jpanese), Bunshindo, 1981, pp. 159l 230; LevineS.S. aid Kawada H. _ esour n a Industr__ De1o_ n_,1980, Princeton, Chapter 10; YoshLkaL K. -Is i Technolo Policy of"Mn (in Japanese), Toyokeizal, 1985, Chapter 2; and Small and MedlumAgency, MITI, Histor( of Jechnoo. Polic- Outline (in japanese).
2/ The goverrnnt invited 3,762 foreign exports durLng these years. Duringthe 20 years from 1872 to 1891. the government hired 5,526 foreign experts,and the private sector hired 8.313. A Statistics an Imneial Jo=(in Japanese).


-3-
(1914-1918). Som of these Japanese lnstLtutLons achieved major technologlcalaccomplishments and had a substantlal iopact on some industries, althoughtheir overall LiPact on industrial development was limlted.
1.09 "he Japanese prefectural governments established a number ofinstitutions for testLng and to provLde technical guldance for reglonalindustrlss.!/ Beginning ln 1906, the national government provided fiscalsupport for the establishment of these instltutlons. It ls reported that someof them contributed substantially to the modernLzatLon of traditional small-and diius-ecale industries and to the development of local-resource basedLndustries.
0. Trade nd he Idnclves Re1m
1.10 For 30 years after the Meijl Restoratlon, until around 1900industrial development took place under an almost neutral trade reiame. /This wvs not necessarily a result deslred by the Japanese governmert. It wasnot allowed to have Lndependent authority over the formulation of tariffsuntll 1899. Until that year, tariff rates, whLch had been bound by aninternatLonal treaty, were St or less (export was also taxed to a similarextent). Quantitative restrictlons played no role until 1931.
1.11 After Japan regained authority over tariff formulation and untilWorld War 1, it raised tariffs gradually to increase revenues and to prof;ectdomstic industry. Although Lnflation assticlated with the war eroded tariffssubstantially (with many tariffs specific), durlng the post-war global trendto protectionlsm, tariffs were raised again, with a stronger emphasis onprotection through tariff escalation. The average tariffs (arithmeticaverage) were 4% (1893), 20% (1913), 11% (1924) and 30% (1938).!/
1.12 Sector-speclfic supports outside the tariff regime were providedmainly because of military coneerns. The goverment provided subsidies toshipbuLlding LndustrLes in 1896 after the Sino-Japanese War. The steel andautomobLlo industries also recoLved goverment support, includlng eastablish-ment of a national integrated steel mill ln 1901. However, the aggregateiLportanea of such measures was limited to less than 1% of income ln themanufacturing sector from 1890 to 1938.,
.2/ Forty-sit such institutions were estabUlshed from 1894 to 1925, based onthe inlitiatves of prefectures and lndustrial cooperatives.
k/ Milton Friedman regards the free trade regime of Japan In the Lnitial threedecades of independance as one of the major success factors for industrial-ixation, compared wlth the stagnation of industrial developmnt ln Indiaafter indepandence (Free tO ChMose, 1979, Harcourt Brace JovanovLch,Chapter 2).
1/ Yamzava (1984), oo git., p. 151.
IV Ikb, P. 155.

-4.
1.13 _he i eneiva raglm. LLght industry, *sptciallytoxtiles, which ws the maitsty industry in Japan before World War II("counting for 30t of Industrial production and for 60% of industrial exportin 1927.1936). dveloped under the free trade regime. Tho influence of thegovernmet on light industy devlopmet was lmalted mainly to technologicalsuport for quality improvemet and control. The govnrment made a largerimpact on the development of heavy industries through tariffs, fLscal supportand technological r fluence from the ailitary, although heavy industries hadnot becom major exporters before the war. This shift is more a reflection ofthe global tendency toward protectionism and Increased military tensions inthe early twentieth century than a reflection of a- expllcit Industrial policyobjective.
S. DieeFraign Ivsm
1.14 Foreign firm. began diract foreign investment (DFI) in Japan in1899, mostly in technology-intensive sectors such as electrical machinery andautomobiles. Eost foreign investments were joint ventures, establishedthrough the initiatives of Japanese enterprisos (especially importers) thatencountered demands from foreign enterprises for equity participation inxchange for technology and equipment. Exceptions were rubber and automobileanterprises, vholly-owned by foroign investors.
(D-263a)

TN THE P63?.WAR MCADR=
A. Eeewoue Perfalonna
2.01 The Japanese economy recorded exceptionally hLgh growth in the1950. and 1960s, with annual real economic geowth maintained at an averageannual rate of 10% (see Table 1). The growvtk rate accelorated slightly ln the1960s, and although the growth rate declined sharply in the 1970s (after thefirst vorld oil crisis), the Japanese economy has maintained the best grovthperformsnce =mug developed countrLes. Labor productivity siaLlarly recordeda very hlgh growth rate in the 1950. and 1960. (Table 1).
ZiLa.11 MIN ECOMMIC INDICATOE
..............................................................................................
160.55 1955*46 1%0.65 1965-70 IM-75 19.00..............................................................................................
Rutee Gro left e W) 10.9 A.? 9.7 12.2 5.1 5.66reb Raue In L_w
gm niRiIU 0.2 6.5 6.0 10.4 4.7 4.4Iltmm it bt1ie # 10.8 16.5 18.5 18.5 17.8 14.7Inftation (WPI 0.0 se 0.5 0.4 2.5 9.4 5.6cum-we Amot (NO) r/ 53.0 1.058.0 7,133.0 6,910.0 11,632.0
............................ I.......................................................
A/ Ratio in nominal figures.hi' 1951-55 average.si Total for each period.
Source: Age 2 Hi Econ2c GCrwth (in Japanese), Kosai Y.. 1981, p. 14.
2.02 Table 2 suggests that the productivity performance of the Japaneseeconomy was consLstently superior to that of the other developed countries inthe 1960. and 1970s.
Initial ondition or High EConomic Growth
2.03 The Jar ss.e economy, ravaged by World War II and lagging farbehind the WUsetrn countries in technological levels, inherLted a relativelyvwll-educated population from before the var. In 1930 the percentage of thepopulation enrolled at primary and secondary levels Vas 21.1% for Japancoopared to 23.4% for the United States and 13.6% for Great Britain.:/
2/ Kinaam R.. Economic Dev looment of Ja2an (Ln Japanese), 1981. Toyokeizai,p. 12.

TAbl.2: AVUAGE ANNUAL RATES OF LABOR PRODUCTIVITY GROWTHIN MANUFACTURING
~~~~~~~~... ..... ...... --...... . ...... O.O.O.O.O I..................................... .. ...,,,.
1960-73 1973-80......... 0............... .... ......................... O
Japan 10. 3 6.4UnLted Statcs 3.4 1.3Canada 4.7 15France 5.8 4.4West Germany 5.5 4.5UnLted Kingdom 4.3 1.6Italy 7.3 3.8
.. * ... .. . .. . .. . .. . .. . .. . .. . .. . .. . .. . .. . .. . .. . .. .
Source: Norsworthy J.R. and Malmquist D., "Recent Productivity Grovch inJapamnse and U.S. Manufacturing," in Plgg;tiview Growth ad_UjiSCo ns.Lsjan-sa., edited by Baumol W.J. and MeeLanna K., Oxford 1985.
2.04 Many private enterprises with skilled workforces (iparated in 1Lghtindustries such as textiles and in heavy industry sectors suca as mutals andmaehinery. The share of manufacturing was 30% of domestic output in the1930s, soimlar to the share of more developed countries. / GNf in Japanduring that period is estLmated to have been only US$700-800 per capita in1979 prices.
B. 6netibuion f tchnIo~CAl Pr2ro1 rss to lecnomic growth
Prdutiit roth aital For_a_
2.05 Rapid technological development has been one of the primarypropellants of Japan' s post-war economic bloom. Econometric investigationsbased on a growth-accounting formul& suggest that more than 50% of theeconomic growth in 1950. and 1960s can be attrlbuted to total factor produc-tivity growth, and more than 20% specifically to advances in technicalknowledge (Table 3). The high rate of capital formation, another majorcontributing factor to high econodic growth, was encouraged by continuousacquisit-c and developmnt of tachnology. A hlgh domestic savings rate alsowas at least partly a result of high economic growth. The national grosssaving rate increased from 26% in 1950-54 to 40% in 1970-74.
QVfl Hugh Patick and Henry Rosovsky, 'Japan's Econodmc Performance: AnOverview," in lAasia' New Giant, edited by the sam authors, 1976, TheBrookings Institucion.

.7.
ZaLis Smms OF ICIC UMTN
....... 0 .................. ........................
Japan USA W.GerinV Prace UK_eemiNs 199-71 1948.69 19M-6 1950-62 1950-62
........ 0...................0.---------....... ..............................-.--.----.......................
*tad1aed Ora. late 6.81 4.00 6.2V 4.70 2.38Total Pasto lrtt 3."6 .0 2.78 1.24 1.11Laor 1.5 1.30 1.37 0.41 0.60capital 2.10 0.79 1.41 0.79 0.51
ltpiAt Pr *Wit of IiAt 4.86 1.91 3.49 3.46 1.27(3twrdwdzad)Adam" in b _milds others 1.97 1.19 0.8 1.51 0.79Iowa rest aLtoation 0.9 0.30 1.01 0.95 0.12IconapmlS of stle 1.94 0.Ra 1.61 1.00 0.36
Iows 0oalai S.F. am C"m U.K., Iecanmic Grow" nd Its StcOO."6fn ' edfted by Patrick N. nd lobovsky N., 197y6 Irookings. pp 9699.
2.06 ESthnaeer Poaems. The contribution of technological develop-meant also can be deduced from ahe rapid structural transformation of Japaneselndustry. The share of the machinery sector (general, electrical and preci-sion machinery) expanded from 12% of total industrial production in 1951-55 to40S in 1976-80. Its share in industrial export slXilarly jumped from 13% to65S during the am period (see Table 4). "toughly 40% of Japanese industrialoutput in 1970 was accounted for by new products, those that were included inthe official production index only aftat l9S0.!!/- It is also estimated that35% of the export growth from 1961 to 1971 was accounted for by new productdevelopmeats, compared to 12% by improved price competitiveness.!!/ Tha higheconomic growth of Japan was a process with Schumpetertan attributes, / wherethe sucessive introduction of new industries and technologies was the majordriving force (see Figure 1 in the Appendix 2 for an illustration by aU cardian model).
I1/ Quotation from Ozava. Torutomo, #a mTchnolofical Callepte to theIteE 1950-1974, MIT Press, 1975, p. 1.
12/ Krause L. . and Sekiguchi S., "Japan =A the World Economy, in Asa."aj NewgLM, op. cit, pp. 418-423.
II/ Ozava, 1975, jbIg, pp. 1-4. The growth with structural transformation ofindustries can be illustrated by a Ricardian model of continuum of goods(see FLgure 1 ln Appendix 2). The growth of real income in Japan wasachioved by the combination of productivity growth in existing industriesand the improvennt of the faceoral terms of trade due to the addition ofnew industries in the economy.

. 8 °
5Xtl._i: STRUCTURAL CHANCE IN JAPANESE INDUSTRY
........................ -----.......... 0................... *.--*---.-.- .................................................. --
Industriatl Production Industrial Export... ..... .....-. .*.--- . ..- -........ .. O... .
1951-53 1976-80 1951-55 1976-88* ......... ................ *0*.....O
Food 23.2 8.1 6.0 0.7Textiles 14.0 4.9 41.4 5.3Wood Products 14.5 2.1 2.0 0.2Chueicals 10.0 15.4 4.9 9.8Ceramic Products 4.6 2.8 5.7 1.2Metal Products 17.6 18.5 20.6 14.4Machinery 12.2 40.2 13.2 64.9Miseollneous Products 3.9 7.4 6.2 3.3
. ................................................................. O-o.............--
Source:Ippei Y., "Economic Development of Japan and International Division ofLabor,' (in Japanese). ToyokeLzai, 1983.
C. Inktr l e
2.07 In the initial stage of development (1950s and early 1960s),Japanese industries depended critically on importing foreign technology.Domestic R&D was relatively s_l1l, amed mainly at assimilating foreigntechnology, and sharply focused on the cooinrcLalization of imported technol-ogy, including development of engineering know-how.
2.08 In the second stage of development (late 1960s and 1970s), Japaneseenterprises developed their own extensive R&D capability, which led to anincreasing number of new products and processes. Although Japanese enter-prises kept importing much foreign technology, its content becam more basic.Technolo6r development in each industry followed similar phases of develop-me, although the tiamng varied sglnificantly.
From =omstic Sales to 93R9s
2.09 The two phas of technology development havo been associated withdistinctly dlfferent sales patterns. The first phse (importation and assimi-lation of foreign technology) initially was associated with sales to thedomestic market (i.e., either import substitution or development of a nowmerket in the domestic economy). Substantial export expansion became possibleonly wheu industry reached the second stage (development of Lndigenousproduets and processes).

2.10 Tables 5 and 6 provide crude evidence for the domestic marketorientation of the first phas of technology development. Table 5 shows thesectoral shares of technology Iaports from 1949 to 1956 and the sectoralshares of industrial exports from 1951 to 195S and from 1971 to 1975. Themachinery sector, though accounting for about 50% of the technology importsfrom 1949 to 1956 in numbor of contracts, contributed little more than 10% ofindustrial exports from 1951 to 1955. The contribution of machinery exportsto Industrial exports exceeded 50% only in the 1970s.
Tablu 5: SECTORAL SHARE OF TECHltOLCGY IMPORTS AND GOODS EXPORTS(in percentage)
Share in &/ Share in Industrial Export k/Technology Import ...................
Subsectors (1949-56) 1951.55 1971.75
Textiles 6 41 9Chemicals 22 5 13metal 10 21 18Machinery 51 13 53Others 11 20 7
A/ Shar in the number of technology licensing contracts approved bythe Law concerning Foreign Investment, according to White Paner onR.ationliare,ti of Indust= (in Japanese), MITI.
b/ Y sY zawa I., oQ. cit., p. 20.
2.11 Table 6 shows that sales distribution of licensed manufactures(manufacturing output uLader technology licenses) was highly bIased toward thedomestic market it early 1950s: except for textlles, more than 90% ofproduction (99% for chemicals) was sold in the domestic market.
2.12 Toward the end of the 1950S, the sales of licensed manufactureswere still highly oriented to th domestic market (Table 6) although exportsales of licensed manufactures increased in importance in relation toindustrial exports (Table 7).
2.13 This relationshLp suggests that the technology learning processtnded to be supported by domestic sales In Japan. Exporting was difficultbecouse of initial non-competitiveness and export restrictions associated withlicensing (see Table 1 in the Statistical Appendix for market restrictionsassociated with licensing). It took considerable time and technologicaleffort for newly introduced technology to generate sizeable exports, sinceenterprises had to overcom these obstacles through their own technologicalefforts.

* 10 .
ILtAs SA1 DIvIlRIWlI 0 LICU-MAuACT1WS UIWIS IMT AS OCStIC MAKTS. 1950-60(in prcetse$
...........................................................................................
IfliEtfy 1950 1951 1952 195 94 1955 1956 1957 158 1959 19U0
ulenterfe A 93.1 91.3 96.1 97.6 9T.6 96.2 96.3 96.2 95.2 92.3 89.9nacunwy I 6.9 A.J 1.9 2.4 2.4 1.8 1.7 3.8 4.8 7.7 10.1
montetrica A * 98.5 99.2 96.4 96.3 90.8 91.7 90.9 90.7 93.7 94.3Natinwy a 1.5 0.8 3.6 3.7 9.2 8.3 9.1 9.3 6.3 5.7
O ea A . 99.1 96.9 95.9 90.5 82.1 82.9 83.0 82.0 80.7 85.8a * 0.9 1.1 4.1 9.5 17.9 17.1 17.0 18.0 19.3 14.2
Ilm and ftet A 94.9 95.7 92.3 8.7 85.4 89.5 84.5 8.4 86.8 86.0O 5.1 4.3 7.7 17.3 14.6 10.5 15.5 14.8 15.2 14.0
Tr_owt A 82.4 94.7 96.6 99.7 94.7 96.4 97.8 95.8 97.1 94.6Equtmt I 7.6 1.3 1.4 0.3 5.3 3.6 2.2 4.2 2.9 5.4
atlet A .33.4 34.1 40.7 31.3 '.2 43.4 40.9 42.2 43.4O 66.6 65.9 59.3 68 57.8 56.6 59.1 57.8 56.6
A UOmtislo milesI* a nt m kt
Sates: J_wss Ninlstry of intwttomu Trad ad 1nduatry, Galkaku di iutsu Oahriuogm~Id to Neilu (CurCrut StatuB and Prablam of Foreiwg Todemtoagy Aborpt1io)TIW"s INITI 1961.
IME: 0 OF LICENS FATEOE IN TOTAL VALUE OF EPOTS BT INOtUYT 1950-60(In p }ma)
Inatry 1950 1951 192 193 1954 1955 1956 1957 1956 195 1960................................................. ....................................................................................--. , Z.. .........
Etestricalmcbinury 6.8 11.7 6.3 31.2 24.4 28.2 17.3 29.1 46.5 43.8 50.2
Nnlsetrf cmlmcinuy * O 0.9 4.9 1.9 6.2 7.6 11.9 14.8 9.1 8.8
Chotecls * 0.05 0.2 1.3 2.8 7.6 8.6 10.2 15.7 25.2 24.3
Itrn wd Stpt . 0.2 0.3 3.8 10.3 7.9 10.7 22.0 22.9 39.0 35.6
,api 0.1 0.2 0.1 0.1 1.2 0.6 0.4 1.0 0.7 1.5
Tatle t 1.1 3.1 2.7 4.8 4.0 4.8 6.0 6.1 6.0
Sate.: Japanse Nlnfetry of Intwtat Tr1d wd Irrdutry, Gaikoku il _SuLMiM
OIde to Naideltes (Current Status ad Proebm of PtorlOt Tec0 gy Aa.t1ianTkw:. NITI* 1962.
(D-263a)

* 11 -
M?. CaUALr 2MP!f00W THAT SUPPORTE BAPTD
A. Res
1. Th Educational Sstemn
3.01 The supply of professional manpower, especially ln the field ofscLence and technology, expanded rapldly in the 1950s and 1960s. Science andengineering enrollment lncreased from around 20,000 ln 1955 to 90,000 in 1970.By 1971, Japan was already ahead of West Germany, France and the UnitedKlngdom ln the number of engineers and scientists per 1,000 population (1.9for Japan, 1.4 for West Germany. 1.1 for France and 2.6 for the UnitedStates) .1 The rapid expansLon of professional manpower also was indicatedby the decllne in the ratlo of starting salaries of unLversLty graduates tothose of junior high school graduates--declining from 2.63 in 1954 to 1.54 in1971.!!/
3.02 The rapld .xpansion of the supply of professional manpower wasdemand-drlven to a substantLal degree. The government's plan to increase thenumber of seLontists and engineers was over-achieved" in the 1950s and 1960s,due to the rapid expansion in enrollment at private universitioes.!
2. Trntnff Supoorted bt Ene riss
3.03 A major characteristic of Japanese vocational training is that ithas been supported mainly by enterprises rather than by public vocationalinstitutions, such as in Europe. Training is mostly on-the-job, throughfrequent rotation, but Japaneso enterprises also offer seminars or formaltrainiLg courses for employees. Some enterprises have established quasi-forml one-year education programs for employees. Many large enterprisesfinnee gr%duate education abroad or in Japan. Self-learning also is stronglyencouraged by enterprises, which provide a bonus to employees who obtain acertificate for such skllls as computer programing. Many Japanese researchersobtain doctoral degrees by wrLting their theses after starting their careersin enterprises.
3.04 The extensive investment in training and education by Japaneseenterprlses clearly is supported by the unique lifetime employment" system
JV Science and Technology Agency, White Poer on Sciene and Technolo.y(1974), Table 2.5.1, p. 327.
L/ Peck M. and Tamura S., 'Technology," in Asia's Nev Giant, op clt., p. 575,ibid.
Jj/ Peck and TamAra, id., pp 576-577.

- 12 -
widely adopted In Japan after the war.!!l The abilLty of enterprises toappropriate nvstmants in training ls enhanced If employees work many yearsIn these enterprises. Under thLs system, enterprisos have greater incentlvesfor general and long torm isvestment ln human capital devolopment. Thelifetime _ loymont system also enhances flexibility and employee willingnessto learn new technologies. Employees are thus less concerned about thenegative effect of new technology on thelr jobs. In fact, Japanese workers donot develop "property rights to thelr jobs, as is usual with Amerlcan,British sad European _mployees.!!/
3. TFfeeg on Technolo Develoouent
3.05 The human capital factor (i.e., mple supply of englneers, highlyskllled workers, workers' adaptability and trainability) was a major means forrapid technology development ln Japanese industry. First, an ample supply ofengineers (Table 8) enabled Japanese enterprises quickly to develop commercialproducts. Empirical studies polnt out the cheap supply of engineers az oneof the main sources of the international competitiveness of Japanese industry.
,h.: ANNUAL SUPPLY OF ENGINEERS (INTERNATIONAL COMPARISON)
*......................... ...............................................
Japan USA W. Germany UK1985 1980 1982 1981
.............................................................................
Graduates wLth the Bachelor'sDegree In EngLnearing (thousands) 0.6 0.4 0.1 0.3* . 0. ........ .........
Population (millions).. .... 0.................................................
Source: I eatoru o nce and Technology, Science and Technology Agencyof Japan, 1986.
11/ A recent empirical study, however, suggests that the average length of acareer in an enterprise is not so different in Japan from other countries(Chapter 2 by TachLbanakl in conomig Analvais gf thi Jawan.se Fimsedited by AokL M., North Holland, 1984). The maLn dLstincetion is "whLte.collarizationg of the Japanese bluo-collar workers (i.e., blue-collarworkers enjoy siLilar employment protection as whlte-collar workers)according to Koike K ("Human Resource Development,8 in Tha Poljitg&Ecrnou=u*o JaoSs, edited by Ya mmra C. and Yasuba Y., Stanford, 1987, p.293). L*lbensteLn H. emphasizes the existence of the lIfetim employmentldeal in Japua (Thwide of _he _I_M, Harvard, 1987, pp. 203-208) ratherthan the observed length of career as an actual factor making a dLfference.
XaJ,f LeLbonsctin, oo_f., p. 208. A labor unlon is also organlzed byenterprises, not by skills, in Japan.

* 13 -
3.06 Second. the high skill levels of Japan.ss workers *nablod enter-prises to use now tchnoloV effectively. Third, the high propensity ofJapaese *nterprises to invest in human. capital compensated for a liaitedvocational training mysta *nd facilitated the continuous enhacement andrestructuring of skills in response to technological and economic changes.
5. De.t~ie Cometitio
1. Ea1p tutr
3.07 An empirical study of the Japanese industrial structure suggeststhat seller concentration in Japan was equivalent to or slightly lower thanthat of the United States in 1963, even though the size of the Japaneseeconomy was 15% of that of the US in terms of GNP at that time. .j Theweighted average four-firm concentration ratio was 35S for the Japanesomnufacturing industry and 41% for the US manufacturing industry (Table 9) .M
Zahla.: INDUSTRIAL CONCENTRATION A/ IN JAPAN AND IN THE USA
.............................................................................Japan (1963) USA (1963)
.....................No. of Share in No. of Share in
Concentration Industries k/ Shipmnt Industries b/ Shipment. ................................................
80-100 46 (9.0) 5.4% 27 (6.5%) 12.270-79 21 (4.1) 5.1 18 (4.3) 3.460-69 29 (5.7) 2.7 29 (7.0) 5.750-59 61 (11.9) 15.6 43 (10.3) 11.940-49 56 (10.9) 12.6 49 (11.7) 7.630-39 63 (12.3) 11.2 80 (19.2) 17.520-29 79 (15.4) 14.2 81 (19.4) 21.80-19 157 (30.7) 33.3 90 (21.6) 19.9
Total 512 (100.0) 100.0 417 (100.0) 100.0Slmple Average of
Concentration 37.5% 38.3%Weighted Average ofConcentration 35.4% 40.9%
/ FYour-firm concentration.b/ Four digit industrial classifLceation.Source: Ueisa M., Theew oi n tri&l AntioY' (ln Japanese),
Chikuma, 1982. p. 20.
I/ Rlchard E. Caves and Masu Uekusa, _ ,Brookings Institution, 1976.
2Z Japanese manufacturlng is divided into 512 sectors, whereas US manufactur-ing is divided into 417 sectors. (The US classification is slightly moreaggregated, implying a bias for lower concentration ratios in the US.)The weight is value of shipments.

- 14 -
3.08 Seller concentrations in Japan declined substantially due todeconcentratiol measures taken after the var, with the three-firm concentra-
tion ratio delining by 10 (Table 10). The substantial redirection of
Japaese lndustry tovard higher capital LntensLty and increased technological
sophistication did not markedly lncrease the concentration ratio. It conti-
oned to decllne ln the 1950s and early 1960J, although increasing slightly in
late 1960. and early 1970s (Table 10).!!,
IAUl_M: DEVELOPMHET IN INDUSTRIAL CONCEMTRATION(Indices of concentration ratio over time)
.... … ... …..........................................................
No. ofIndustrLes 1937 1949 1950 1955 1960 1965 1970 1974
O .... ............................................... ,,,,,,O.
C3 33 100 89.1 85.743 100.0 93.5 91.5170 100.0 97.8 104.0
163 100.0 102.9 103.8....... .................. -.-.-.-.-.-.--.---............................ - , ......
64, 43 100.0 96.4 95.5100.0 100.4 102.8
161 100.0 101.2 101.5==,......... - -...--...--. Z*......................................
CS - Three firm concentrationC4 - Four firm concentration
Source: Rotwein B., "EconouLc Concentration and Monopoly ln Japan." ;g, June
1964 and Uekusa I., *Effects of the DeconcentratLon Measures inJapan," Antitrust Bulletin, Fall 1978.
3.09 Hor. detailed investigation of the Japanese market structure also
suggests that although many industries in Japan have oligopolistic market
structures, the number of industries where a single firm dominates the market
(market share of a leading firm exceeding 50%) is very limited.
2. ources of Domestic ComnetitIon
3.10 The major factors supportLng a competitive market structure in
Japan, which contrast with the concentrated market structure in many develop-
ing countries, are: the absence of artificial barriers co entry and growth,
the oligopolistic rivalry among business groups, the large size of the
domestic market, and an active competition policy implemented immediatelyafter the war.
21/ SThe most aggregate measure of concentration (the share of 100 largest non-
financial firms) continuer to decline from 39% in 1964 to 33% in 1970 and
to 25S in 1980.

* 15 -
3.11 (a) Abue. of ArtetAl ba rern eg enry and growth. Althoughthe goversnmet sometimes intervened In the market to consolldate competitLon(e.g., entry restriction and promotion of mergers) before the liberalizatLonof Lapor and dlrect foreLgn lnvestmont, the intervention was highly selec-tlve and largely market conformative. In the 1950s, the government affectedthe entry of new enterprises by regulating thelr access to foreign technologyin those sectors where economies of scale were considered to play a majorrole. Howeovr, the government's Lipact in most cases was limLted to delayingentry. The government also promoted mergers and joLnt business ventures amongdomestic enterprises in some sectors. such as automobiles and computers, whereforeign enterprises were regarded as having overwhelming market power. Theseefforts by the government were a preparatory stop for liberalization in the1960s and 1970s. Mostly, government Lnterventton was not much more thanmaking recommendations for restructuring. In most sectors there was no actualslgnificant barrlir to entry and growth artificially imposed by the govern-Ment.
3.12 (b) Oyalry among business touns. The buslnessgroups of Japan, some wlth their orLglns ln z-asuLM compete fiercely amongthemselves in many business lines. There has been a tendency for these majorbusiness groups to establlsh operations in each major line of business.E/Although the prosence of buslness groups may have been a barrier preventlngentry by lndependent enterprLses, AigopolLstic rivalry among existingbusiness groups has prevented the formatLon of stagnnt maonopolies.
3.13 (c) Laru sige of dg_ stic m . The Japanese market in 1950was already large compared with most developing countries today. The rapidlyexpending domestic market supported a competLtive structure by alloving entryof new firms, even though imports and direct foreign investment wererestricted.
3.14 (d) A9Siv coneAtiion nolic. Antlmonopoly reform measurestaken during occupation ln the late 1940s generally formed the basis forcompetitive behavior among existLng firms and for entry of new firms in thepost-war decads. Family-controlled zaAs= conglomerates were dissolved,and a number of the largest firmn (83 enterprises) were broken up. Cartelsand monopoliLe established during the war were eliminoted. An antimonopolylaw, which outlawed private monopolization and the establishment of holdingcompanies, among others, was enacted (1947); and many corporate executives(1,535 est.) were expelled from managerial positions. These reform measuresreduced market concentration substantially and contributed to the enhancementand preservation of the competitive structure of the Japanese economy.
2/ Such behavior is called "one set principle' in Japan. (Miyazaki Y.onomir Istiturions in Post-War Jan (in Japanese), Shinhyoronsha,
1966).
2,/ For an example, see Uekusa M., Teory oi IdUtrial Ortaization, a cit.

16 -
C. _dustr4al
1. e X- Prot&Ctin and FM
3.15 The Japanese Government provLded temporary protectLon from Laportsand DF5 to allow domestic enterprises opportunities to comme rcLalize importedforeign technology profitably end to develop technological capabllity at home.Although their financial significance was modest. export promotLon measuresencouraged enterprises to sell In the international market, partly offsettingthe antl-export bias of protectLon of domestic market and the overvalued yenln the 1950s.
3.16 (a) , tmeort res*r&G&io. Quantitatlve restrLetLonsadmilistored through the foreign exchange control system played a major roleln the 1950s. In 1955, only 16% of forelgn exchange was allocated on anautomatic approval basis. The primary motivation was the efficient use ofscarce foreign oxchang..!!/ The government adminLstered the foreLgn exchangebudget from 1949 to 1963, with external payments approved by the Government.Lmports of an increasing number of goods were granted automatic approval. By1960, 40% of foreLgn exchange was allocated through automatie approval.
3.17 The foreign exchange system also played a major role In protectinginfant industries by liLiting the supply of foreign exchange allocated forimpots of competing goods while ephasoizing lndustry loport needs.
. 18 In 1960, the Japanese Government lssued a general guLdelLne forliberalizing foreign trade and exchange, to improve the balance of paymentsand to recogpize the importance of lnternatio cal competLtive pressure onrationliLzing enterprises. The guideline aimed at removing all restrlctlonson forelig exchange ransactlons related to current accounts and reducingimport quotas.
3.19 The share of imports not covered by quotas increased substan-tially, from 440 n 1960 to 88% in 1962 and 92% in 1963.!S/ However, theguidelLne made lt clear that quantitative restrictions on imports competingwith infant industrLes would be removed only at an appropriate future time.Consequently, liberalization of several eomrglng sectors proceeded ln a phasedmanner after 1963: automobiles (1965), machlne tools (1970), color film(1971), integrated cLrcuLts (1974), slectronLe computers (1975).
3.20 Tariff protectlon played a relatively small role in the 1950s whenquantLtative restrictLons were pervaslve but lncreased from the late 19SOs tothe early 1960s as quantitative restrLctLons were ratLonalized.!!/ Table 11
IV The yen-dollar exchange rate, set at 360 yen per dollar in 1949, was notadjusted untll 1971, although there were clear symptoms of lts overvalua.tion in the 1950s and of its undervaluation in the late 1960s.
Japan becams an IMP (Article 8) member in 1964.
2W Japan accepted Artiele 11 of the GATT in 1963.

- 17 -
shown the estimated effective rate of protection for Japanese manufacturinginLdustrio in 1963, when the tariff levels were close to their peak.!!/Thereafter, tariff protection was rationalized through a series of initiatives(Kennedy Round. 1967-71; unilateral reductions, 1972, 1976; Tokyo Round, 1980-87) reaching a level comparable to or lower than the other industrialjzedcountries by the middle of the 1970s.
3.21 (b) wra restriggigns an diret foreign Invs=e wereliberallied more slowly than import restrictions. Although the Law concerningForeign Investment (1950) opened up direct foreign investment in Japan, it wasadministered restrictively. The maLn concern in the 1950s wa the foreignexchange shortage. Through a scheme called 'yen-based investment," foreigninvestments that waived the right to repatriate profits and principal wereapproved liberally from 1956 to 1964. This permitted the entry of wholly-owned subsidiaries. Nevertheless, foreign investments outside the yen-basedschem were approved restrictively,E, so that foreign enterprises couldretain only ainority ownership. f/
3.22 When Japan joined the IMF and the OECD in 1964' the yen-basedinvestoctt schem was abolished, and yen became a convertiblo currency.Although the OECD code on the liberalization of capital movement called forliberalization of DnI n Japan, among others, the governrmnt chose gradualliberalization (in five steps from 1967 to 1973). The establishment ofwholly-owned subsidiaries became liberalized in all industries in 1973, with asmall number of exceptions (integrated circuits, 1974, slectronlc computers.1975, information processing and photosensitized material processing. 1976).The main concern remained foreign dominance over Japanese industry.
IV ThLs calculation is not based on international price comparisons so it doesnot reflect the effect of remaining quantitative restrictions nor possible"vater In tariff protection.
2J The Lw concerning Foreign Investment spacified two positive criteria:(1) contribution to the development of important Lndustries or publicutilLty enterprises; and (2) contribution to the improvemenc of the balanceof psyments--end one negative criterion: adverso effect on the recoveryof the Japanese economy.
2. There were 573 foreign ventures in Japan in 1964, out of which 289 wereyeu-based investments; 161 of these were wholly-owned subsidiaries offoreLgn enterprises. Most yen-based investmnts were small, probably dueto the large foreign exchange risk. Seo Tsuruta T., Sent ihon no£snmX2Jaafiaku(Industrial Policy in the Post-War Japan), 1977. Nihon KeizaiShinbun, pp. 115-120.

* 18 .
l£k*.s nIFUCTItAM OF POTCTION AND POUCtIVITY 1T OF tIENACNIUIMII INIOUJTRY f JAPAN
.......... ...... ............. ...... 0..............-----0..................... ----..................
total FactorProductivity Coth
194 9on (1960.73 AawwA AverGe)
NmafattinP 32.3 14.4Tat1tls 54.3 18.6spwMi 2V.1 15.0Fabrics 4.6 15.5 .0.9Gausnts 72.1 22.4 1.3Uow Prudit 14.0 16.1 1., (funf tsa)PwOrd en ulp 9.7 11.0 1.4Pq*tfsbhn aiW PrInt -16.? -0.9 0.?Lether ad Rumr 30.9 12.3 1.5 (rusr)chaicals 33.4 8.8 3.601t am Cost Pe aos 19.5 7.1 -0.2 (petroleuai)Ceracs 22.2 8.1 2.5Steel 30.1 17.1Nonferroui Ntas 30.4 22.1 - 1.1 (prfasry asot)Natal Prdts 13.8 9.9 2.5Neebtiy 36.7 7.7Genera Nmo.inry 33.0 8.7 1.5Ileetrical Neeh1nery 30.9 5.4 3,5Traeorttlon Neshinary 61.1 9.2 0.2 (mator veMlts)Pmeuisis ohin_ry 34.9 10.4 2.3
......... ........................................ .................
Iftot Ca ltateta Is to d an tariff, not ate direct price comperlsmn.
Saw"$ 1uus t., lffettve Rates of Protection In Jap,' Apr1t 1982, Mibh_n LUmDK&, go. II.ad Jorgue O., Kads M. ed Nlehizu N., iJapa1-U.S. Invutry-Leve Pr1astivityCo1ri_m, 1960.9,0 J. of The JapaeW ad Intcernu-4mal Econoemis 1, 1-30 (197).
3.23 (c) Excore Prootion. The government also took various exportpromotion measures in the 1950s and 1960s, the major incentives being thefollowing.M/
o Pvigsity alloatign oi fgreicU exchange. Export performance was amain criterion for allocating foreign exchange.
O ZaJuzzonzua. From 1953 to 1963, income tax could be abated byI% to 5S of export revenues, and from 1964 to 1971, accelerateddepreciation was applicable to investments by export-orientedenterprlses. During the same period, enterprises could alsoestablish spcial reserves for overseas market developmenc. Aduty drawback system also Was administered.
IV Based on Itoh M. and Kiyono K., *Trade and Direct Foreign Investment inIndutrial Poliy of Ja Ian* on. g i. Chapter 5 and Ippei Y. 'Interna-tional Trade Policy during the Era of Hi8h Economic Growthw in EconomLcDeveloumene of Jaoan and Internat Diion of Labor, op. cit..Chapter 8.

*19 ^
o Winancial inggntives. From 1946 to 1972. the Bank of Japanencouraged foreign exchange banks to provide exporters favorablepre- and post-shipment finnce (1% to 2% lower than marketivtoerest rates) by discountlng export bllls at below-marketinterest rates. The Export and Import Bank of Japan wasestablished in 1950 (Lnitially as Japan Export Bank) to facilitatelong-term financing for exports.
o E - r lin8uane. In 1950, the Government established an exportlnsurance scheme, partly to cover the risks related to export andforelgn investmnt, which were not insurable by private companies.
o 9ther. The Japan External Trade Organization was established ln1954 as a promotional lnstitution. The government also hasadmLnistered an export inspection scheme to improve the reputationof Japanese goods.
3.24 Although no comprehensive assessment is available, the financialsignificance of these incentives was modest (the combined size of Incentivesthrough taxes and short- term financial measures ws around 4% of exportvalue).
2. g% 7ActnogX Development
3.25 Pottntiallv a^itive roles of tesaorarv orotetion. A keyquestion is whether protection could have accelerated overall industrialtechnology development in Japan .!/ Several factors that might have madeprotection effective, even though it was not the first-best instrument, areCho following:
o LAI sau gE jaganeent eafter the wVAr.Japanese enterprises derived low profitability using equipmentinherited from war time. They also had not developed adequateinteral financial resources.=/ The financial system, especiallythe capital market, was underdeveloped, with equity marketsplaying a marginal role. Therefore, enterprises mlght have foundit difficult to financ investment and the early learning process
J,/ There is no quantitative assessment available which approves or dlsapprovesthe above proposition. One rare empirical study is Krugman P. and BaldwinR., "Market Access and International Competition - A Simulation Study of16 K RAN," National Aureau f1 SeOnOMic Research WorLeir Paoer No. 1936,1986.
22/ Kosai Y., "Reconstruction Period," p. 36, in Industrial Policyof Janan,(in Japanese) edited by Komiya R., Okumura M., and Suzumura K., 1984.

- 20 -
unless protection roved the financial profltabillty ofIndustrial ventures.
o Prmeinear = tineo _atianally onongiat.i induger. Someindustries for whlch the governunt granted protection domestic-ally were monopolies controlled by foreign filrs globally (e.g.,computers and color film). Even though entry is desirable fromthe national (and possibly global) point of view,!!/ enterprisescould be Inclined not to Lavest since entry in monopoly industriescould drive down prices significantly. ThiLs economic blas againstentry can become serious In technologically progresslve monopolLs-tic Lndustries,!/ since sunk costs in those industries can becumulative.
o edAneg2 of beine the firsg in ehe investment raco. In someLndustries the fast accumulation of market-specific Lnvestments,such as the development of distribution networks and customerrelations, are critical in deteriuning a firm's market share.When the speed of such investment is liaLted by available man-power, for example, temporary restrictLon on DFI could give thefirst moVr advantage over foreign enterprises in the domesticmarket.!!/
3. shin. fat tat nolicy of JAn
3.26 A second question is why protective measures did not lead to industrial stagnation and inefficiency, as happened in many developing countries.There are three distinguishing factors ln the exercise of industrial policy inJapa:
j; SThe recent macroeconomic literature also focuses on the possibllity ofextensive rationing of equity. See Bruce C. Greenwald and Joseph E.Stiglitz, "Financial Market Imperfections and Business Cycles,' WVrksnzPnger No. 24Q, National Bureau of Economic Research, January 1988.
This theoretical possibility was analyzed by Dixit A. K. and Kyle A. S.,'The Use of Protection and Subsidies for Entry Promotion and Deterrence,An. march 1985.
:/ Clbert R. c. and Newberry D. M. G. poLnt out the possible incentive biasfavoring an incumbent monopolLit to preempt technological opportunitiesfrm entrants ('Preemptive Patenting and the Persistence of Monopoly" ha,1982, Vol. 782). When an entrant can obtain at most part of duopolyprofit, even if entry is successful, while an incumbent monopolLst canpreserve monopoly profit by preemptive R&D and patenting, an incumbent haslarger incentive for R&D.
35/ This theoretical possibility was analyzed by Matsuyama K. and Itoh N.,Wfrotection Policy in a Dynamic Ollgopoly Market," Discusasio 1n_er
(University of Tokyo), 1987.
* 21 *
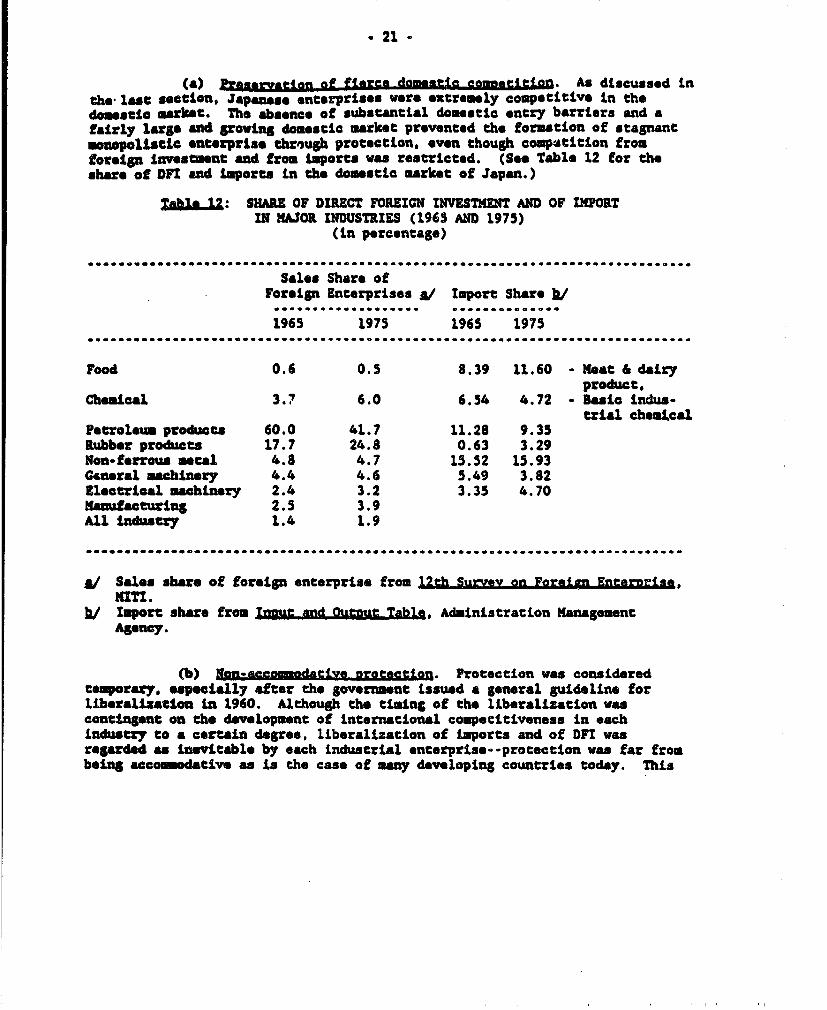
(a) P gagein of flore dog afcflsata.tjton. As discussed inthe last section, Japan.o enterprises were extromoly compoetitive in thedomestic market. Ths absence of substantial domestic entry barriers and afairly large nd growing domestic market prevented the formation of stagnant.onopolisti@ enterprise through protectLon, even though competition fromforeign investeat and from Liports was restricted. (See Table 12 for theshare of DFI and imports in the doomstic market of Japan.)
UaUlS_2: SHARE OF DIRECT FOREIGN INVESTMENT AND OF IMPORTIN MAJOR NDUSTRIES (1965 AND 1975)
(in pereentage)
*.....*. .....................................................
Sales Share ofForeign Enterprises A/ Import share /
................... ...... ...... O.........
1965 1975 1965 1975................... ......................................................
Food 0.6 0.5 8.39 11.60 - Meat & dairyproduct,
Chemical 3.7 6.0 6.54 4.72 - Basic indus-trial chemtcal
Petroleu products 60.0 41.7 11.28 9.35Rubber products 17.7 24.8 0.63 3.29Non-ferrous metal 4.8 4.7 15.52 15.93General machinery 4.4 4.6 5.49 3.82Electrical omchinery 2.4 3.2 3.35 4.70Manufacturing 2.5 3.9All industry 1.4 1.9
J/ Sales share of forelgn enterprise from 12th Su,ve on Foreign Enet2rin,MITI.
hi Import share from rn * and outmie Table, Administration ManagemntAgency.
(b) Nan-accoodative proteetion. Protection was conslderedtemporary, especially after the government issued a general guidelLne forliberalizatlon in 1960. Although the timing of the liberalization wascontingent on the development of international competitiveness in eachindustry to a certain degree, liberalization of imports and of DFI wasregarded as inevitable by each industrial enterprise-protection was far frombeing accoodative as is the case of man developing countries today. This

* 22 *
expectation of liberalization indueed enterprises to invest heavily in theimprovement of technology and to gaLn international competitiveness. H/
(c) Asie da nm an market inielative. and diseiILnen. Itwas rare that the goverment maed direct investments in industrial projectswhen it ws dissatisfied with th market. The basic approach of the govern-ment wa to support initiatives by private enterprises while preserving theirautonomy and accountability. The conflict between the regulatory and owner-ship functions of the government, often observed in many developing countries,did not occur ln Japan.
(D-263a)
fl/ One executive of the Japanese automobile company, recalling the rush forinvestment from the late 1950s to the early 1960s- -the production capacityof this company increased by 10 times from 1956-1966--stated that "ourcompany developed production and marketing plans which positioned ourcompany in the international economy, under the recognition thatliberalization of imports wee inevitable. The countermeasures forliberaLization converged eventually in competition among domestic producersfor investmont and for strengthening the mass production system (ratherthen in the consolidation of industry recommended by the government), (carimports were liberaLzed in 19651.e Recalling the fierce marketingcompetition that started in the early 1960s, he also stated, "The Japaneseautomobilo industry entered into the period of super aggressiv, competitionfor mrketing. The domestic car makers competed fiercely for market sharesamong theoselves. There was cooon recognition among the Japaneseautomoblle producers that lLberalization of direct foreign investment wouldfollow the liberalization of imports, and such expectation contributed tothe highly aggressive nature of competicion. From Morikawa H., TIgttmonyfor She JAi2a Idtrial Histg= in the Post-Var Era-1I, (in Japanese),Kainichi Shinbun, pp. 41-42.

- 23 -
IV. IMPORT OF P01CNM XTECHNOLOGY AND ITS UASTERY
A. Gaen rAl XSzDM
4.01 Technology imports have playtd a critical role ln the developmantof Japanese industrial technology. For example. in sectors such as steel andautomobiles, which had existed as major industries before the Second WorldWa;, Japanese enterprises used foreign technology quickly to narrow thetechnology gap that had developed during the years of war and economicdisruptions. Many now industries were established (petrochemicals andelectronLes), based on the rapid importation and adaptation of foreigntechnology.
4.02 As Tables 13 and 14 show, technology importation increased rapidlyin numober of contracts and cost in the 1950s and 1960s, although the ratio ofexternal payment for technology to the total import bill was modest, amountingto 0.5% in 1953 and 1.8% in 1960. Figure 2 in Appendix 2 shows how quicklythe Japanese cheoical Industry comeorcalized now technologies in succession.After the first world oil crisis, growth in technology assistance contractswas slow. The ratio of technology imports to private research and developmentinvestment declined to around 10% by the 1980s from more than 20% in the early1960..
table 13 GROWTH IN XPEXPDITURES FOR TECHNOLOGYIMPORT AND R&D IMVESTMENT
,..._.......................................................................
Aver¶e Anua Growh BAte it) Tec lo1or IiRgrt kTechnology Import s/ R&D Investment g/ Private R&D Investment
1954-58 29.6 21.01960-64 21.4 21.2 23%1965-69 19.0 21.6 23%1970-74 9.8 20.8 16%1975-79 6.2 11.0 17%1980-82 17.7 15.0 11l
S/ Average annual growth rate of the nominal expenditure for each timeperiod.
i Ratio of expenditures.
Source: Wakasugi R., mig Analysis of Innovat,na R&D, (in Japanese),Toyokeizat, 1986.

* 24 O
Tala-_L: NUMBER AND GROITH OF TECHNOLOGY DMPORT
.......* * **...*........ ... ... . .......... * ...............
Class A A/ Class B b/**@.*....0 ........--- ..... 0 ^ 0 ..¢ . O 0........
Annual Average Annual AverageNumber Growth Rate Number Growth Rate
C.... ..... ............. * CoCo .. *. **..... .... *. ... * _ ......... O .......
1950-54 454 (32) 510 (28) S/1955-59 575 (21) 793 (19)1960.64 2,039 (11) 2,085 (20)1965-69 3,926 (25) 2,853 ( 1)1970-74 8,295 (4) 2,426 (4)1975-80 7,846 (5) 2,052 ( 1)
A/ Technological assistane contract with the terms of contract or terms ofpaymat equal to or more than one year.
hi Technological assistance contract with both the tems of contract and thetorms of paymnt less than one year.
Source: "Annual Report on Introduction of Foreign Technology." (inJapanee). Science and Technology Ageny.
4.03 ° tf eaghnoloy i-nortee. Although dlffLcult to evaluate theeffect of technology isports quantitatively,5! most capital- and knowledge-intensive industries in Japan owe a substantial part of their technologicalfoundation to foreign technology. According to one estimate ,/ the pro-portion of industrial production and of industrial export dlrectly due totechnology licensing was 5.3% and 8.1%, respectively, ln 1955. However, thesas umabers were hlgper for the electrical machinery industry (31% and 24%,respectively). Peirhaps more importantly technology imports have providedopportunities for domestic enterprises to enhance their technological capabil-ities. Upgraded technological capabilLties have in turn enabled theseenterprises to import or develop technologies with hlgher sophistication.Many Japaese enterprises have successfully built up their highly competitivetechnological capabilities today through this process.
4.04 The benefit of technology importation is enhanced when comple-manted by domsdtic R&D. One illustrative case in Japan is the introduction ofthe liquid oxygen process in steeluaking in the late 1950s, one of the most
l3/ One econometric estimation relating the change in TFP to a6D investmentand technology lmports showed the rate of return on technology imports wssextremely high, although the statistical reliability of the estimatedequation is low (Wakasugi R., 1986, OgD.Cit., Chapter 8).
32JUl nar on tndustrial rio, (in JapaneAse), MITI, 1964.
* 25 -
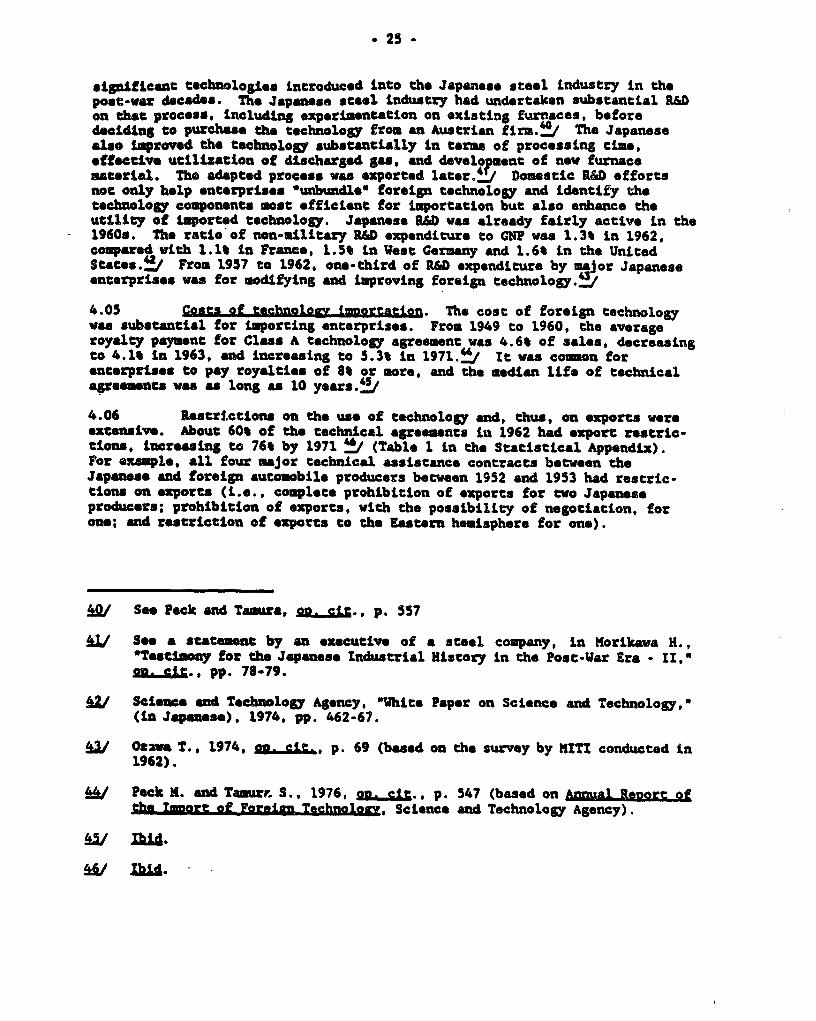
signifLant techUologiL introduced into the Japanese steel industry in thepost-war dcades. The Japanese steel Industry had undertaken substantial R&Don that process, including *XperiDentation on existlng furnaces, beforedecLding to purchase the technology from an Austrian firm.!/ The Japanesealso lmproved the technology substantially in terms of processing cime,offective utilization of dlscharged gas, and development of now furnacematerial. The adapted process wa exported later.Li Domestie R&D effortsnot only help enterprises OunbundleO foreign technology and identify thetechnology components most effiiLent for importation but also enhance theutillty of imported technology. Japanese R&D ws already fairly active in the1960s. The ratio of non-military R&D exponditure to GNP vws 1.3% in 1962,compared with 1.1% in France, 1.5% in Vest Germany and 1.6% in the UnitedStates. / From 1957 to 1962, one-third of R&D expenditure by major Japaneseenterprises was for modifying and improving foreign technology. !
4.05 Cmsra of eehalo? inoreatlon. The cost of foreign technologywas substantial for importing enterprises. From 1949 to 1960, the averageroyalty payment for Class A technology agreemnt was 4.6% of sales, decreasingto 4.1% in 1963, and inereasing to 5.3% in 1971.t/ It was common forenterprises to pay royalties of 8% or more, and the median life of technicalagreements was as long as 10 years.2/
4.06 Restrictions on the use of technology and, thus, on exports wereextenslve. About 60% of the technical agreements in 1962 had export restric-tions, incroasing to 76% by 1971 ±/ (Table 1 in the Statistical Appendix).For example, all four major technical assistance contracts between theJapanese and foreign automobile producers between 1952 and 1953 had restric-tions on exports (i.e., complete prohibltion of exports for two Japaneseproducers; prohibition of exports, with the possibility of negotiatlon, forone; and restriction of exports to the Eastern heuisphere for one).
.Q/ Se Peck and Tamura, ga._..g". p. 557
AL/ See a statement by an executive of a steel company, in Morikawa H.,Testimony for the JapanJse Industrial History in the Post-War Era - II,"
X _S;., pp. 78-79.
g2/ Science and Technology Agency, uWhlie Paper on Science and Technology,w(in Japaense), 1974, pp. 462-67.
3/ OzaOa T., 1974, oo. cit.. p. 69 (based on the survey by MITI conducted in1962).
gg/ Peck M. and Tamurr. S., 1976, g2_qJ%., p. 547 (based on Annual Recort ofthe Imnore -f Foreian Teghnologv, Science and Technology Agency).
w L1.
Wg ZWA.

* 26 -
4.07 Uof Active tughnaloyv impart. Why then were the Japaneseenterprises so active in technology import? A number of factors were respon-sible: high technological capabilLty as illustrated in the above case of theliquid oxygen process, rapid econoiLc growth itself, competitive pressuresfrom domastic rivalry mnd government polLcies encouraging technology import.Among these factors technologLcal capabilLty is most fundamental since theco mercial success of technology import is impossible without the capabilityto effectlvely utlilze the technology in production system.
B. * rmen f
4.08 Here we concentrate our discussLons on the four measures whlchseems to have affected technology Lmport substantially. We do not discusseducatLon and training system nor import restrictions. tho effects of which ontechnology development were discussed in the last chapter.
1. lagion oE the tmortation of Poin TechWlav
4.09 All technological assistance contracts with foreign enterpriseshad to be approved in principle by tho government. Until full-scale liberal-ization in 1968, 'Class A* contracts with the terms of contract or the termsof paymeant excoding one year had to be approved by the government under theframework of the LAw concerning Foreign Investmnt. SiaLlarly, the rest oftechnological assistance contracts (short term or *Class BO contracts) had tobe approved under the requirements of the Foreign Exchange and Foreign TradeControl Law. Restrictions were liberalized only in steps. In 1950, thegovernmont announced a 'positive list' (34 desired technologies, largely for.improving efficiency in exlsting enterprisas). Major liberalization tookplace in 1961 (shLft to a negative list) , 1963 (liberalization of technologyiaportation up to US$30,000), and 1968 (full-scale liberalization with a fewexceptions).
4.10 ObsectIM. Basic motivation for government intervention was tocope efficiently with tho shortage of foreign exchange. The government'sregulation of foreign technology importing was part of the extensive foreignexchage control system adopted in the 1950s. However, the concern clearlywas not lLmteod to the foreign exchange required for importing technology.The broad crtteria set by the Lw concernLng Foreign Investment were:
o contributioan to the developmnat of 'important' and public utilityindustries, and
o contribution to the improvement of the international balance ofpaymnets.
The law also dealt with the fairness of technology contracts and adverseeffects on the national economy's recovery.
4.11 Effects of rulaeIaIon. Government regulatlons affected the amountof technology imported, domestic R&D, the industrial structure, industrialorganLzation, and the price of foreign technology.

'27 -
4.12 Eiffect 2n tbe aMount of technolgrv imported jand oil domesti R&D.The not effect on technology Liports is not clear, since the regulation playedtwo conflicting roles: to restrict technology imports deemed not urgent butto promte technology ioports by securing rationed foreign exchange. In 1964,4.6% of applications were rejected and 4.7% were left p.ndLng.±!/ Therestrictive pollcy may have discrimLiAted against technology importation bysmal non-established fir=s.!/ However, the restrictive effect was limitedmaluly to delaying the timLng of technology Liports, since in any event therewas successive liberalization of the pollcy. Although one of MITI's approvalcriteria wva the possible effect on the development of indLgenous technology,It Is tW orted that ln most cases this criterion did not recelve muchwelght.=/ Therefore, the protective effect on domstic R&D was also unlikelyto have been substantial.
4.13 Effect on the strUre of an. Since technology importa-tion wag closely associated with investments, especially in the 1950s,regaultion of technology imports also affected allocation of investmentresources. The regulations gave priority to industries with high potentialfor foreign exchange earnings or savings and to basic industries (heavy andchemical Industries) produclng intermediate goods and capital goods. Thissuppressed the demand for consumer-goods technology. / Therefore, theregulation tilted the investment pattern toward the trade sector, especiallytoward basic industries, although this effect could not have been permanentgiven the liberalization of the regulation inn the 1960s.
4.14 Effect gn indMtrial organization. Since the regulation wasapplied at the level of specific enterprises, not at the sector level, itaffected industrial organization withLn sectors. It put priority on importingby enterprises with high technological capacLty and dLscouraged dupllcateLiports. The objective in controlling duplicate technology was to useimported technology effectively, filrst ln the construction of plants ofefficient scale, and second, in avoLdlng excess capaclty. !! The government
Kokiya R., 0Direct ForeLgn Investment ln Japan," in Peter Drysdale (ed.)Dire ForilM Ine tment in Asia and the Pacifig, (Australia NationalUnLversity Press, 1972), p. 137.
Wj/ One xecutive of a now giant electronics flrm recalls the initialdlfficulty he had in persuadLng the goverment to approve the Lport oftechnology for transistor clrcuit Ln 1953, when his company was still asomll venture (Morita A., HadsgnJAM, 1986, EP. DUTTON, pp. 65-66).
@/ MSyake Y., in Jaoan in High Growth Era (in Japanese), 1984, MaLnLchiShinbun, pp. 296-310.
Q/ Peck M. and Tamura S., go ci1,. p. 553.
lJ,/ eck M. and Taura S.,.op. cit., p. 553.

* 28 *
was also concerned with enswuing competition in the domestic market so itallowed sequential entries of additional flrms .!!
4.15 The effect on industrial organization could have been permanent ifLncubent firms had pre-empted the market. However, the government allowednew entries even ln the petroch leal sector.! where concern over excesslveentries was serious and the regulation of technology imports played the mostcritdal role for regulating invesment. Therefore, it is not llkely that theregulation on technolog Import substantially shifted industrial organizationin the direction of Lnereased concentration.
4.16 Kn.hnoloav. The government's regulationreduced the price of technology by reducing competition auong Japaneseenterprises in an olLgopolLstic bargaining process. The government alsodelayed lts approval or made it conditional on revisions of agreements thatwould becom favorable to Japanese enterprises.5s One notable example ofcoordinated technology importation involved the introduction of the liquidoxygen process in steel making. Four competing steel producers ln Japanintroduced the technology through one producer under the guldance of thegovrneAnt.!!/ Such Lntervention was not systematic, since cases of competi-tive technology importation also are reported.t/
4.17 The government's attempt to reduce morket restrictions was notsuccessful. howevor, as seen from the high proportion of technology agreemntsthat included export restrictions (Table I in Statistical Appendix).
Analyis, adLegsons fr Qee Reculation of Technolog:,
4.18 f Technolo oreation. One important function ofthe regulation was to secure and guarantee long-term foreign exchange paymentfor imported technology. Within the constraint of fixed parity, the regula-tion appears to have functioned well in financing the expandiLg technologyinflow without causing disruption In spite of the overall shortage of foreignexchange in the 1950s.
13/ .kfiA., p. 554*557.
j/ PeckM. and Tamura S., oo _rt,, pp. 546-550.
.j/ It is reported that three major chemical companies competitively introducedtechnology for polypropylene from a single foreign company (Norikawa H.,gaz.r1.L, pp. 112-113).

29 -
4.19 .a _ltdut tructurs./ Althoue tho regulation ontechnology iports w only one of the policy Lnstruments =/ used forprooting the delopment of basic industries (heavy end chemical Lndustries),the regulation itself ws a blunt instrumnt vith some side effects. It couldnot stop domestic enterprises from livesting in consumr goods Lndustries,based on domestically available technology, and it mlght prevent enterprisesfrom saving resources through the ws, of now technology.
4.20 e ting - xcessive entry. Temporary or even permanent restric-tions on firms entry can increase economic effLieincy through the effect onthe larger scale of production, the quicker learning-by-doing process and theeconomizatlon on entry costs, including royalty payments. !!/ However,government intervention for this purpose requires highly detailed informationon technology ad the nature of competitlon; implementation of entry restric-tions is not easy.!5 Purther, consideration of the optimal domesticindustrial or2nization becomes largely irrelevant when the economy isintograted with the world econcmy, except for international ollgopolisticindustries. Competition will lnduce domestic enterprises to select anadequate scale of operation as vell as adeute speed of learnLng. In thecame of Japan, the necessity for government intorvention in industrillorganizatlon arose partly due to the utliLzation of protection as a tool ofindustrial polliy.
4.21 Ime1n. to af eon=rU. The goverrment's coordination ofthe cooperative importation of technology clearly improves the terms ofcontracts. A caveat ls that it might also facilitate collusive restriction oflwvstmets by doaestic enterprises unless competition ls encouraged expli-citly.
JZ/ Som scholars argue that industrial structurs target itsolf lacked adequatejustification (e.g., KoSya I., Olntroduction, in landMtial PolLga ofJ Komiya R. et al., op cit.). He argus that industries which metthe two criteria set by the goverAment (i. *, high incom elsticity andfast technologieal progress) would delop by themelves.
IV The other instruments include protection, tax credlt and soft loan.
2/ For example, it ca be readily shown that free entry equilibrium can havetoo my enterprises in the Cournot-Nash competition. (Schalensee R.,*Is more Competition Necessarily Cood?- tr1al Organi2ation tevie ,1976, Vol. 4). It can also be shown that productivity growth of smllerlees efficieint enterprises can reduce the national welfare in the Cournot-Mash competition.
hV/ Some scholars, however, argue that the tendency of lexcessive competitionin the Japanes economy wad a result of industrial pollcy pursued ln earlyyears Ltself, since lt offered lnsurance agalnst recession and tended toallocate premum resources (e.g., foreign exchange) accordlng to marketshare (e.g., Imai K., ec al., Price Thgr, (in Japanese), Vol. 3,Iwanami, 1972, p. 254).

. 30
4.22 The direct involvement of the Japanese government in the contractnegotiation process per so may not have been effective.-as the hlgh proportionof export restrictions in the contracts shows.-since the governzent by itselfdoes not affect the alternatives or opportunitLes available to technologybuyers and sellers. The restrictLons on DFI change alternatives available totechoology sellers, howver. (Section B-3 discusses Japan'ls experience.)
2. Fnenv for She IntradueIon of New Tag logy
4.23 ahi tive. * sur The Government introduced varLous fiscalincentives for encouraging the introduction of new technology and/or newproducts. Table 15 1lsts major fiscal incentives (tax and tariff abatementand special deprciation) that were effective in the 1950. and 1960s. These
easures are classified into two groups: Oasures, *such as accelerateddepreciation of iaportant machinery, that encouraged industrial investmentbroadly (introduced in the early 1950s); and measures, such as income taxexemptions for commercializing new products, which vere targeted more to novproducts or processes.
4.24 The estimated size of these fiscal incentives as a percentage ofcorporate taxes is not large. In Table 15. the sun of the first three tax andtariff masures is estimated at only 4.2% of corporate taxes in 1955 (Table 2in Statistical Appendix). The sum of the first four measures of accelerateddepreciation is estimated at 2.6% of corporate taxes in 1958. The lportanceof broad-based investment incentives declined sharply in the early 1960s.
4.25 IU,S;A. Some econometric studies suggest that in the 1950Osfiscal incentives were fairly effective in raising the level of privateinvestment.!!/ It is reported that the accelerated depreciation scheme helpedenterprises not only by increasLng their rate of return from investmont butalso by reducing credit risks for banks. Targeted measures, such as taxexemptions for comarcialiling new products, also played an important role indeveloping new industries ./ In their infant stages, such sectors assynthetic fibers, synthetic rubber, fertilizer, petrochemicals and antibioticsbenefited substantially from thls scheme.
4.26 lwsLvs and lessi. SLnce mwuch technology was introduced inJapan in already embodLed form (i.e., new machinery) in the 1950s, and manyenterprises did not have easy access to financial resources due to theirfinancial fragility, broad fiseal incentives for modernizing capital stocksseem to have been important in pro-oting the introduction of new tchnologyfrom abroad. At a later stage, incentives becam more narrowly focused onresea-rh and development and its co_mercialization.
I/ Peck n J .S. and Kaizuka K. quote two such studies in the chapter ontaxation in la'sNew Giant, op. cit., p. 368.
i/J Koniya, S9Ies in tie Working of thekyo,rar' Ja2anele Eon , (inJapanese), 1975, University of Tokyo, Chapter 3.

- 31 -
Taus 15: FIOCA IW'Y P02 umI uc210N X MM Ts="=
Schem FiSalt Credit Grate
t.AeSe of Tin iTar
As Trn.s8 t amoAfs fog - Th a the Saie guaerce fin tte production d* owcLuJiats v iqieint odueSs ptIuCa dehigDted by th JPwdVs -MM tly ampted for(1923-66). About fetw yess.a/
5. Iiustio ofad the withheldiu t an M withbeldig tax ew r0*ucui by 10 (later 152).smaL pyin:t associated with
iqorern mahAWCal lcamaia(1953'*7)o
C. bof "y arttas tiqtia Imported tim an mk:aew7 wipatui by the printing'imqortmot mbiay (1951-65). were etied. Im eligibl mchUq Wmre (1) rs cc
bghy efficient Alu"wiA maw ry, (2) mhtaedifficult t be mafacut In las, a (3) md=wgincesas for o du-a deaelopmZe_I!
D. bone creit fat the aim 1o II a fim's anl, un meded the _I amountinpeedibra for "eesuteb is' pmev Ye *, 2S2 of the _m e alwi - a cmdeveloyen (r6d )a czs ,ldcr e edI rei o So ft tlh pertu 0
the m11 4Loe 152 of the 4 aPS Is the p_GeIM- _ mew cl esdit m U.itA: to 102 of thecorperute Income cm.
20 Aeglearntd bmigedatine di
A. Topotme m_Sasy (195141). 0Su aIdiotal de°pndacto foe the ?lit tc ee Yeams,relwAve to the oria. deptedacios MulA.
S. ameMiy for SU depreaciao In the .fizt yw.(1952 ).
Co mAdesry fa i m m eb SU, 202 a 202 dsptedatioi fom dh Lr, mlod aed(1f95-1965) tMhi* ea rponivel7.
D. 1_y fa SUu 502 deptsAti. for the tLts: yeam- t - (195-965)o
E. Ip_d p 0 i i for the fine M thin dpreatios for the fit yewtu ui Jq (19 t4 19, ).
1. Xm.rny t the eerd- ft tchiefd tiofal precLatione fo e Lfiz. tke yam.iesA 0* mU ed mUem si"
inecry (1963 to 19__).
Wn do tenses d £957, cMa ehm mod tos be appied ot doLy ts the riaLacio. 0* --P _ am a u t the prnisotius d uu4 peniu in etasa and c_sIA.
S -w tr 's took plams i 1960. M cm w tro o w the perwmei of sedmaipollutsam sta* Lefs euiq InutfuiL deveLopm.
1 Omuy 20 ad the dmm cm he onsnd as a cm cedt.Ri ght hee colm deerie Inamativam applicLe Lrom 1958-60. Major OUrTaletook pun., in 1961,with s iucive Saeated Iu the stabaory schdule 0C depreation.
S s hedy L, "Sudin In the Vorking of the Co ua:pooz7 Japanes Ecomm," (inJapeee). GP sit., a*pe 3.Wakasugi 3e, op cit., Ouaper 12.kodah of 4gemy of InduscrIaj Science and Teologys MiM, 1987.
(D-263b)

* 32 *
4.27 Given adequate access to capital marketa, broad-based investmentincenetives ae a blunt measure for encouraging the Lntroduction of nowtechnology. The size of Lavestment does not necessarily denote signLifcanttechology, and enterprises with adequate financial resources may be en-couraged to undertake inefficient investment because of the incentives.Therefors, the shift to a narow focus wa appropriate.
3. RfAet of e.. Pglt on DireC rei.M IMene
4.28 ale of direc foreg irveseene. Japan offers a uniqueexample of industrial development where DFt played a very liLmted role. Thiswas partly because the Japanse economy was not regarded as an attractlveinvestment just after war and also because the government had instituted itsrestrictive pollices.
4.29 Effes on technolor dvlonuent. Restrictive polLcies on DFIhad two opposing effects on technology development in Japan. Such policies,on the one hand, retard technology dovelopment, leading to the loss of theopportunlty to lntroduce new and more efficient technology through foreLgninvestmnt. Technical Lie6nsing is an imperfect substLtuto because technologyexporters generally are less willing to supply technology without monagementcontrol. They tend to attach restrictlve conditions on the use of technology(i.e., on exports) even lf they license the technology.
4.30 However, in Japan, the cost of restrictLon on DFI does not sees tohave been large. Domestic enterprLses were able to acquLre technology in anunbuAdled maaner and to iqprove and develop it, thus enabling the rapid growthof output and exports in most major industries. IndLrect evLdeanc for thls isthat DPM in Japan has not Lnereased substantially since the 1970s. even afterfull liberalization. Howevr, the cost of restriction would have been largerwithout Japa's strong post-war technologlcal and entrepreneurial ability.
4.31 On the other hand, the restrLction on DFI promoted technologylicensing and protected dsmostic technology development. In some cases ltgae, the Japanese government bargainLag power In obtaining concessions intecnfology 1Lensing. One exceptional case is the governmnt's interventionfor the 1lcensing of integrated Circuit technology by Texas Instmnts.Texas Instrumets was seeking permission to establish a wholly-owned sub.sidiazy La Japa but agreed to estabILsh a Joint venture instead and to grantlice" to four Japaese enterprises./!
gL Quoted in Peck I. and Tamra S., *Technology,' g2. JC.L p. 552. Theeconomic benefits could have outweighed the economic cost in thisparticula case. On the cost side were two elements: the royalty fee paidby the JapQans firms, and the delayed use (four years) of more efficientsemi-conductor technology in Japan. The application for investmnnt wasfiled in 1964, and the matter was not resolved untll 1968. On the econowicbenefit side were three elements: more competitive supply of integratedclrcuits, transfer of part of the rent to the Japanese producers, andpossible technological spillover to other products.
* 33
4.32 IZMIR I and Ifiagao. The LnLted cost of the restriceive policyon DF1 In Japan seems to have depended largely on the following factors:filst, the level of technological capability of Japanese enterprLses wasalready hlgh in the 1930s. Second, enterprise. in developed countrLes,especially the US, were more willlng to sell technology ln the 1950s for
. several reasons (e.g. technologically dominant positLon of the US enter-prises& low expectation of competition from the Japanese enterprises,
4.33 The selectlve restrictLon on foreLgn Livestment in Japan was acomplement to the import restrictions to protect infant Industry. A liberalforeign investment regime, coupled with Lnfant industry protectLon, would haveencouraged investment simply to avoid import restrictions. This cauld havepre-empted opportunities for domestic enterprises to develop technologicalcapability by dominating the market in som industries and would have trans.ferred rents (due to protection) abroad. Thus, a very important characteris-tic of the liberalization process of Japan was that import liberalizationpreceded or took place simultaneously with liberalization of DFt!./
4.34 Using the DFT restriction for increased access to foreign technol-ogy can easily backfire. The host country can lose both technology andinvestment. Even vith access to foreign technology, there is no guaranteethat domastic enterprises can yield profits high enough to pay royalty fees,ad the fees may put firms at a disadvanta ln competition with foreignfirms.
4. TfeQlmediaelon by lic Reah Itituelons ad Universities
4.35 . Foreign technology can be introduced atvarious stages of technology developmet: at the purely scientific stage, thedeveloped but co m_rcially unestablished stage, and the comercially viablestage. The mor developed a country's R&D capabillty, the more technology isimported at earlier stages of that developmnt. Public research institutionsand 'miversities can potentially import tec4nology at the earlier stages ofdevelopment, undertake necessary further developments and transfer thedeveloped technology widely to industrial enterprises. This intermediationplays an important role in quickly exploiting new technological opportunities,when the RD capability of industrial enterprises is still underdeveloped.
4.36 T emediagion nrgce.s in JAM. Most notably in electronics,public institutions such as the Slectrotechnical Laboratory (ETL) of MITI, the
M/ Some of these reasons were discussed by Ozawa, Japan's TechnologicalChallenge to the West, g2,_cle, pp. 25-30.
iL Assuming that temporary import restriction ls the only availabl measurefor infant Industry development and is welfare-improving, the comblnationof different import and foreign inesxtment regimes would be the following:restricted import and foreign investment --> free trade and restrictedforeign investment *-> free trade and free foreLgn investment *->restricted import and free foreign investment.

* 34 -
research laboratory of NTT, and the University of Tokyo played a key rol- Inadvancing the comercial application of now electronics technology. As anexample, ETL played a major role in introducing electronics technology throughits development of transIstor-based computers and its development of semi-conductors.J
o ESL successfully developed the prototype of a transLstor-basedcomputer in Ja'an Ln 1956 .!! Based on thIs, It provided techni-cal guidAnea to several Japanese companLes in their efforti todevelop transistor-based computers comercially. The contributionof m was not limited to the transfer of basie design conceptsbut Included the transfer of design and englnoering know-how.
o 5TL, whLch closely followed the early progress of the US researchand diseovery of semLconductors ln 1947, undertook development ofvarious semiconductor dveices In the 1950s and was successful indeveloping the prototype of integrated circuLts ln Japan ln 1959.SM accepted a number of engineers from prlvate enterprLses astraineos--200 trhtrees In the transistor research office alone.These angIneers subsequently led the development of the semi-conductor busIness in many enterprises.
4.38 n avA a lAsonu A publie research Lnstitution potentiallycan play a useful technology support role even in a country where the tasicmission is to absorb foreign technology. Capablo publie research Institutkonsaccelerate the introduction of foreign technology that is still at thecomeorcially unproven stage but which has substantial potential for wideindustril a1plication.
4.39 It is not necessarlly efficient to confine such institutions'roles to basic research, especially in developing countries. They canundortake development research--which private enterprises cannot, eltherbecause of low appropriability or because of frapented R&D capability ia theprivate sector--and can disseminate the developed technology to enterprlses,to the national advantage. The liportant point is the complementary use oftechnological resources.
4.40 There is a caveat though. Once private industry has developed itsown R&D capabLlity, it is generally a waste of resources for public researchinstLtutions and universities to concinue extensive development work. ETL,for example, withdrew largely from prototype development ln industrialtechnology and reoriented itself to more basic research in the late 19 6 iu,when industrial enterprLses enhanced significantly their own R&D capability.
UV The following cases are based on Matsuo H. E _lectotehnie L.aaS=,,(in Japanese), 1987, Computer Age Corp. , and interviews with a planningofficial of 8TL.
i1/ It was the third in the world, following Sell Laboratory and IBM. It wasthe first as a .rored-program transistor-based computer in the world.

- 35 -
V. DIFFUSIOM OF T!CHNOWTny
A. s-Eg'e Vi CZit of ~,1 nd M.diu. Enemrnrlnse
5.01 Another major characteristic of post-war technology development inJapan has been its rapid diffusion, especially to small and medium enter-prises. Although a substantial gap in productivity and wages still existsbetween large enterprises and small and medium enterprises,!/ the latter havekept up with rapid technological advances and thus have maintained theirimportance in the national economy. The share of enterprises with fewer than300 employees wa 74% of total manufacturing employmont in 1957; it was 74%agiln in 1981. Moreover, small and medium enterprises have recorded a levelof profitability sitilar to large enterprises. Profits por total asset forsmall and medium enterprises were 3.9% on average from 1971 to 1981 and 3.3%for large enterprises.
B. S eY eae nf stewa
5.02 Tho subcontracting system works as an important mechanism oftechnology transfer. In Japan, 65% of small and medium enterprises produceunder subcontracting arrangements, and 82% of them are specialized in sub-contract production.t/ The subcontracting system is most extensLve in themachinery and textile sectors. In the transportation machinery sector, 61% ofsmall and medium enterprises were subcontractors in 1981, and 88% of them are
j1' In 1986, the average wage of manufacturing enterprises with 30-90 employeeswas 65% of that of manufacturing enterprises with more than 500 employees(Table 3 in the Statistical Appendix). The value-added per employee ofmanufacturing enterprisos with 20-99 employees is 49% of that ofmanufacturing enterprises with 300 or more employees. The longer-termstatistics suggost that although tho wage gap expanded in the early 1950s,it natrowed substantially by the early 1960s and has been more or lessstable ever since (Figure 3 ln the Appendix 2). It is generally recognizedthat the Japanese economy shifted from a labor surplus economy to laborshortage economy around 1960 (see Minami, 1981, ibid.).
i2/ The Small and Medium Enterprise Agency of MITI. Basie Suvy on Tndust=r.A small and medium enterprise, which produces 80% or more output undersubcontracting, is defined as a firm specialized in production forsubcontracting. The percentages in the text are in terms of number ofestablishments and are based on a 1981 survey.

- 36
specaliLzed in subcontracting.a/ SubcontractLng is extensive in Japan due toless extenslve vertlcal integratlon.!/
5.03 Subcontracting involves long-term comprehenslve and implicltcontracts, which can involve teachnLcal guidance, supply of worklng capital.leaLng of equlpment, and rLsk sharing by a parent flrm. The system alsoprovides strong Lncentlves and pressures for a subcontractor to innovate (seeAppendix 3 for a typical transactLonal arrangement). A parent fLrm typicallytakes charge of developing design and sa clflcatlons and provides necessarytechnical assistance to subcontractors...J A subcontractor undertakesproductlon accordLng to instructLons. Slnce many subcontractlng firms havehlgh technlcal capabllties, a parent firm's lnspection procedure fordelLvered components may be nonexlstont. Japan substantLally owes its stronginternatlonal compotitLveness in tho machLnery sector to the hlgh efficiencyof its subcontractors.
5.04 Conflicting views on the efficlency of the subcontracting systemexist, hovever. Some claim that lts only advantage ls of second best nature,as a pallatLve to dlstortions in the economy's factor prLces and retirementsystm.!./ A subcontractor is regarded to be viable only ln a segmented labormarket. ThLs view also emphasLzes the possible dlstortion from the monopolypower of a parent firm.2/ Accordingly, as dLstortions in the economy areeliminated, the subcontractlng system should be replaced eLther by vertlcalintogration by a parent flrn, or by development of lndependent large-scalecompovnnt producers.
5.05 A more recent alternative vlev,!/ however, ls that the subcon-tracting system has potential efficLency advantages over vertlcal integrationor puraly market-based transactLon schemes. Slnce subcontractors are indepen-dent economic entities subject to competition among themselves (Appendix III),they have stronger incentives for innovatlon and efficiency than do vertlcally
2/ The subcontractLng system in the machinery sector is multi-layered. Itis reported that one automobile producer has 168 primary subcontractors,4,700 secondary subcontractors and 31,600 tertiary subcontractors (Quotedby Yokokura T., *Small and MedLum Enterprises, in Industrial Policy ofJapa, o- ct., p. 458).
2V The dfference ln the degree of vertLcal integratLon ls very clear in thecomparison of the Japanese automoblle lndustry with the AmrLcan industry.
2l A subcontractor wLth high technical capability develops design andspeclfications of components for approval by a parent fLrm.
fl Cavs and Ubusa, IndusCrial Organization, 1976, op. cit.
2W A law was enacted in 1956 aimed at preventing unfalr business practice bya parent firm such as unfairly delaying payment.
2.11 Hasahlko Aoki, 'Innovative Response Through Quasi Tree Structure (inJapanese), t emorarv Ec2nomies, 1984 su mer.

. 37 -
integrated production units. Moreover. subcontractors can also depend ontechnological lnput from a parent flrm and can share technological informationmore closely among theoselves, to avoid duplication and make up for the lackof coordination in technological efforts, unlike the case of purely indepen.dent fLrms.
5.06 Although not conclusive, the following propositLons may be drawn:
o The persLstence of the subcontracting system may well reflect theefficLency of such organizational arrangements. In particular,the subcontracting system often may be more efficient In technol-ogy diffusion than vertical lntegration, due to strong competLtivepressure among subconeractors and the hLgher appropriabilLty ofsuch innovation for subcontractors.
o Competition aong parent companies has led to the increasingefficLency of the subcontracting network In terms of organization-al structure, such as the development of subcontractors withadvanced and specialized technology, integrated inventory controlsystems, and also sophistication of the contractural relationship.
C. D.va1ogme of a Oualitv CR
HisoryandProotina Effarts =/
5.07 Japanese enterprises have attained an excellent reputation asproducers of hlgh quallty products. This was not the case just after thewar.Z/ when JapaUnse producers were known more for cheap low-qualityproducts.
5.08 One of tho major contributing factors for this rapid and drsmaticimprovement of quality was the national development of a quality controlsystem, whbch took place mostly from 1950 to 1965. A survey conducted by theJapanese Government In 1969 showed that: (a) the percentage of factoriespreparing for the introduction of statistical quality control was 5% from 1945to 1949; 20% from 1950 to 1954; 240 from 1955 to 1959; and 33% from 1960 to1965; (b) by 1969, 91% of surveyed factories practiced statistical qualitycontrol; (c) 85% of factories introduced quality control voluntarily ratherthan in response to outside requests; (d) 54% of factories had completed thedevelopment of enterprise standards. (See Appendix III for the details of the
UV This part is based on trial Sta rd in J - 20 Year History1969, MITI (ln Japanese).
Zl The occupation authority found that many products produced in Japan didnot meet the standard of the United States. For an example, finding thatcomunication equipments produced in Japan had frequent troubles, theoccupation authority sponsored a seminar on statistLcal quality controlfor the Japanse marnufacturers of communication equipment and demonstratedits lplementatlon in one Japanese factory.
- 38 -
survey.) This survey shown that the quality control system had progressedrapLdly ln the 1950s and early 19601 and was extensive by 1969.
5.09 In 1945. two non-profLt organizations promotLng qualLty controlwere established: the Japanese Standards AssocLatLon !/ and the Union ofJapanese Scientists and Engineers. They have played a major role throughreports and journals, research activitieos, seminars, lectures and conferences,and technical consultation. Other promotional associations, such as the JapanProductivity Canter, the Japan Management Association, and the OperationsResearch Socioty of Japan also have contributed to the spread of modernmanagemnt mothods mong Japanese enterprises.
5.10 In 1949, the Industrial Standardization Law was enacted, es-tablishing the legal framwork for developing the industrial standard jstemand for adminLastering the certification system linked to the standard. (National standardization activities had started in 1921.) The certificationsystem apparently encouraged enterprises to adopt quality control systems, asevident in the above survey.5T The government started the 3cheme of prizegrants to the best certifled factories in 1953 and provided technical assist-ance to enterprises planning to introduce standards. The government alsostrengthened its export inspection scheme in 1955 to improve internationalreputation of the quality of Japanese exports.
5.11 Direct contact with foreign experts in the late 1940s and early19SOs also had a significant influence on the spread of the quality controlsystem. In particular, the seminars by Dr. W.E. Deoming conducted at variousplaces in Japan around 1950 aroused great Lnterest among Japanese industrial-ists.!!/ A study group on quality control traveled to the US in 1958, one ofmany study groups organized by the Japan Productivity Center.5
5.12 Televtision and radio courses on quality control in 1956 and 1957contributed to its spread, especially among smoll and =dium enterprises.Increased consumer awareness of quality (from around 1960) also encouraged the
ZJ There existed two predecessor organizations promoting the utilization ofindustrial standards before this tim.
22/ An enterprise is authorized to attach a special certification mark on itsproducts, pending on the government's examination of its factories.
MV Among those factories which introduced quality control system, 30%mentioned preparation for the appiLcation for the JIS (Japan IndustrialStandard) certification as one of the motivations.
Al/ Later a prize named after Dr. Deming was created to commend a factorywhich achieved substantial accomplishments in the practice of qualitycontrol system.
A2/ From 1955 to 1961, the Japan Productivity Center sent about 2,500 personsto the United States under the US governoent's economic assistance program.
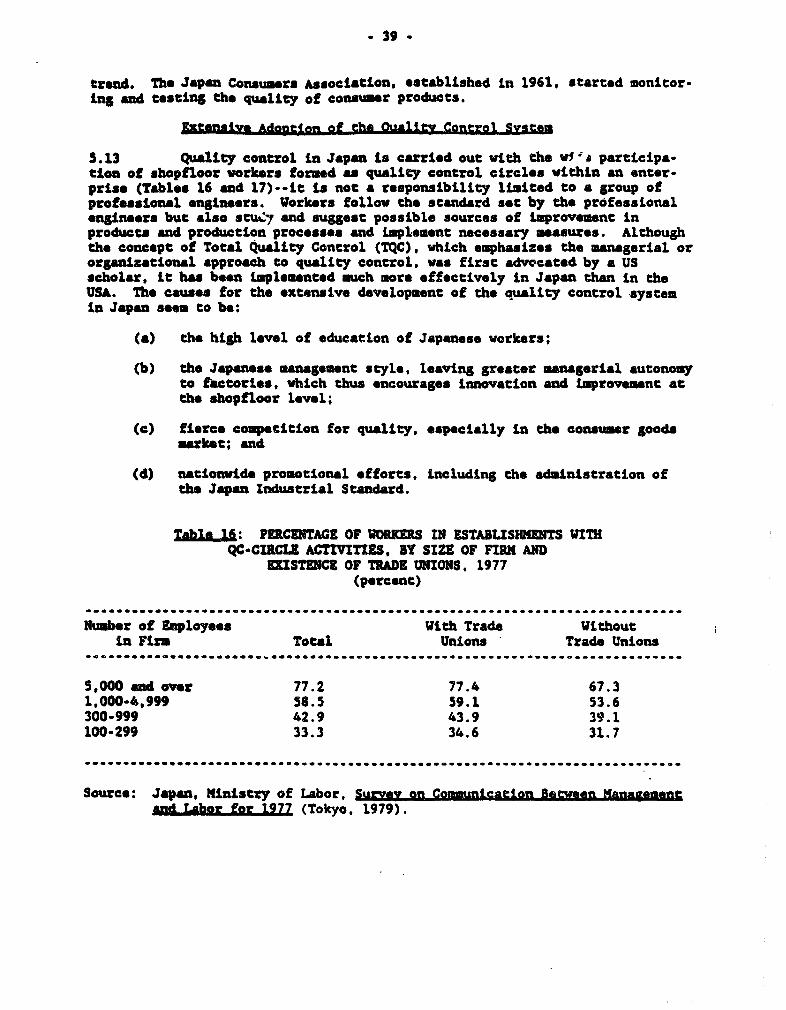
- 39 -
trend. The Japan ConsumerJ Association, established Ln 1961, started monitor-Ing and testing the quallty of consumer products.
KIeBnSLWQ Adotlan of &Uhe A On1tw Control system
5.13 Quality control in Japan iJ carried out with the wv' participa-tion of shopfloor workers formed as quality control circles within an enter-prise (Tables 16 and 17)--it is not a responsibility limited to a group ofprofessional engineers. Workers follow the standard set by the professionalengineors but also stuk.7 end suggest possible sources of improvemnt inproducts and production processes and implement necessary measures. Althoughthe concept of Total Quality Control (TQC), which emphasizes the managerial ororganizational approach to quallty control. was first advocated by a USscholar, it has been ipleamented much more effectively In Japan than in theUSA. The causes for the extensive development of the quality control systemin Japan seem to be:
(a) the high level of education of Japanese workers;
(b) the Japanese management style, leaving great-r mnagerial autonomyto factories, vhlch thus encourages Innovation and Wprovement atthe shopfloor level;
(c) fierce competition for quality, especially in the consumr goodsmarket; and
(d) nationwide promotional efforts, including the administration ofthe Japan Industrial Standard.
3abjL,U1 PERCENTAGE OF WORKERS IN ESTABLISHMENTS WITHQC.CIRCCZ AMTCITTIES, BY SIZE OF FIM AND
RKISTUICE OF TRADE UNIONS. 1977(percent)
_............................................................................
Number of Employees With Trade Withoutin Firm Total Unlons Trade Unions
.................................................................. -
5,000 and over 77.2 77.4 67.31,000-4,999 58.5 59.1 53.6300-999 42.9 43.9 39.1100-299 33.3 34.6 31.7
. .....................................
Source: Japan, MinLstry of Labor, Survy an Cotmmmication B;eadLabor for 1977 (Tokyo, 1979).

- 40 -
Tnblu: ASSESSHEW OF QC-CIRCLES BY MANAGEIENTgY SiZE OF FIRMS, 1977
(percent)
O.-0 ..... -.*-** ....................................-.--. *...................... *O*...... .
Number of Employees Not Inin FLr. Successful Successful Between Unknown
...... ............................................
5.000 and over 83.4 7.6 8.6 0.41,000-4,999 67.2 15.9 16.4 0.5300-999 52.7 28.2 18.9 0.2100-299 45.3 37.6 15.6 1.5
. .........-----..............---.......----................
Source: Same as Table 16.
D. _ign and In_titutions Suslooreing Technology Diffasion _oSmall and Medium Knemrises,
5.14 Tho Japanese government has developed comprehensive policLes andinstitutions supporting small and medLum enterprLses (SME), covering:
(1) flnLacial assistance (o.g., the establishment of specLalizedfinancial instLtutions, small business investment companies and acredit guarantee system);
(2) tax abatement (o.g., lower corporate income taxes, accelerateddepreciation);
(3) assiatance for technology development (see below and Appendix IV);
(4) provLison of consultation and guidaneo, information and training(see below and Appendix V);
(5) assistance for iafrastructure development and for JoLnt businessarrangements (e.g.. industrial estate, Joint facilities);
(6) establishLmnt of the legal framework S"c- che formation of associa-tions (Lncluding posslble formation of rationalization andrecession cartels); and
(7) establiahment of the legal framework protecting SMEs against largeenterprises (e.g., against delays In payment to subcontractors).
5.15 The thrusts of SHE polLcies have shifted over tim. Until thedld-1950s the major objective was to stabillze the distressed financialsituation of SEEs, many of which faced severe constraints ln borrowing and

* 41 -
coop.titi@l d mong theaselves.?/ LAter the main objective ws to promotemodernizatiOn of Sils, especially through modernization of equipment andconsolidatiol of enterprises (expansion of the scale of business) .!/ By the1970s, the mojOr focus had shifted to the promotion of smooth adjustment ofSils to the appreciation of the yen and Increased competition from developingcaountries, as well as to the promotion of knowledge- intensification.
S.16 Assistance for capital formation and for expansion of the businessscale through financial and tax measures may have played a more important rolein raising tho efifclincy and technological level of SiEs during the secondperiod than meo ures specifLcally targeted to technology acquisLtion. ManySill still faced borrowing constraints, as reflected in capital-cost dlfferen-cos (at least 50%) between large enterprises and SiEls The size of thesedifferences is not readlly explainable by transaction costs, as is the case inthe UJSA.!/
Measuren for, Technolog Diffusion
5.17 Measures promoting technology diffusion are classifLed lnto fourares: provisLon of information on new technology, subsLdization of theco=arcializatLon of new technology, provision of training to enhance absorp-tive capacity. and prowtion of adaptive research and development.
3.18 XuLozinaZ. Japan's prefectural governments play a major role inadministering lnformation programs. Regional research and testing institu-tion funded by the prefectural governments provide technical guidance andtesting services, organize lectures and training courses, and disseminateinformtion on new technology through publicatlons for SMZs (see Appendix Vfor an example of the services provided by the Tokyo Metropolltan IndustrialTechnology Center) .
3.19 Although no overall assesmunt of the technology diffusionactivities of regLonal testing and research institutions exists, there are
3/ Yokokura T., "Sall an Medium Enterpriseos (Ln Japanese), in IniuatiaJ.biPte of Japan, op. cit., Chapter 19.
IJ The Small and Medium Enterprise Basic Lw enacted ln 1965 deflned theobjectives of the SiE polLices: (a) rectify the disadvantages faced bySiZs due to ecooamic and socLal constraints, (b) support self-help ofSils, and (c) enhance productivity and transactional condltions.
U/ Caves R. and Uekusa M., Industrial Organization.0 in Agjp'p Rev Giane,pp. 509-510.
Lf,I There exist 184 regional research and testing institutions in industry andmining, across 47 prefectures, many of whLch (around 40%) were establishedbefore the war.

- 42 -
reports an successful caeas and their characteristLes.5' For example, thetesting instltutLon for dyeing and weaving, established in ALchL Prefecture ln1923, played an important role In diffusLng new dyeing and weaving technologyto local lndustry, although the major role was played by weaving machLnedealers. Another case lnvolvod the testLng and research institution es-tablished in 1959 at Hamamatsu, vhich contrlbuted substantially to thedlffusion of preciLion machining technology and qualLty control among thelocal components industry. In both cases, research institutLons were es-tablished in response to the strong demand from local industry.5' Theresearch conducted at the lnstitutions was highly practicall, closely focusingon tasks of direct interest to the factories.
5.20 In addition to information activities of testing and researchinstitutLons, prefectural goverments administer programs for tochnicalassistance through a tochnology exchange forum. These services are used bylocal SHEa on request.!/ They also sponsor moetlngs among SMEs from dlf-forent business sectors to create opportunities for active technology transferand exchange.
5.21 Subsidizatign al the eoMrcializAtign of naw teSbn2o9S. Inaddition to the measures specifLcally applicable te SHEs, fiscal and financialLacentives mentLoned Ln Table 15 all apply to SKIs. In partLcular,'thegoverrment developed equLpment modernLzation and busLness consolidationprograms in many subsectors of SHE and promoted their implementation throughbroad lncentlves ln the 1960s ./ In recent years, the Lncentives becam morefocused on the adoption of new technologies, R&D, training, etc.
5.22 Promotion of adantive reseatch and deelomene. National andregional research institutLons and the Small and Medium SusLness Corporationhave undertaken generle R&D, whlch SMEs cannot tackle adequately. Since 1955
AU/ Kobayahi T. , Trnsfer (in Japese), 1981, Bunshindo, pp. 203-208.
WV/ Kobayashi T. reports as follows: A textile trade associatlon in Aichiprefecture petitioned the prefectural government to establish a testinginstitution for dyeing and weaving in 1925 by offering contrlbution ofland, a factory and some funds. Similarly, enterprises in Haumastsu areapetitioned for the prefectural governmant to establish a testing andresarch insttution ln 1959. SKSE belonging to a metal assocLatLon,together with large enterprLses and Hamamatsu city authorLty, shoulderedfour ninths of the total cost. The rest were paid by the government.
12 SKs are charged only a relatively small fee for thelr access to most ofthese services. The rest of the cost are born by the national and localgovernment (Appendix V).
2Q Yokokura T. reports, however, that no major dlfferences were observedbetween subsectors supported by modernLzatton programs and the othersubsectors In terms of labor productLvitrj and capital labor ratlo(Yokokura, ,oo-Lcit-. 46).

* 43 *
the gov rnUOnt has provtded subsidies selectively to R&D projects of SMEs.9/The government also provides financial assistanco to the commercialization ofnew tochnologY through soft lons from the Small and Medium Business FinanceCorporation and through partial credit guarantees.
5.23 T sn-. Local government Ln Japan administer various trainingprograms for SHE engineers and tech
Finance Corporation administers supplementary training programs and providestraining for the staff of local research and testing institutions.
E. nlvus and L2son
5.25 The Japanese industrial market has strong internal forces fordiffusing technology, due to high degree of competition. Suppliers ofequipments under competitive pressures do not hold back their efforts tomarket new products as widely and quickly as possible. Enterprises incompetitlve markets do not fail to recognize the advancement of technologyintroduced by their competitors and try to iomtate it.
2.26 Subcontractors or subsidiaries prevalent in organizing industrialproduction in Japan are decentralized units, subject to strong competitivepressures. Rapid technology diffusion depends critically on the efforts ofthese decentralized units for higher efficiency.
5.27 No doubt the high absorptive capacity of Japanese enterprises isanother major tactor in technology diffusion. As for government intervention,the most effective diffusion policies may well be the provision of trainingand educational opportunities.
5.28 The government's promotional and information policies also canplay a useful role to accelerate the dlffusion process of technologies, sincethere exist som constraints on the mrket mechanism.!5/ However, theirsuccess depends on how closely their services are in line with industrialneeds. In notable success cases of regional research and testing institutions
.211/ Enterprises, in turn, are obliged to present the research results at anofficial seoinar, in order to promote thelr dissemination. Enterprisesalso are obliged to pay back the subsidy, contingent on the contributionof R&D (in the case of prototype development) to their profits.
22/ There exist several constraints on purely market based technologydiffusions. Since there exists externality in the regutatio' concerningquality, enterprises may wish to have a free ride on the reputationestablished by other enterprises. In fact some regional research andtesting institutions In Japan originate from the testing centersestablished by local cooperatives to internalize reputational externalityat a local lndustry level (see KobayashL , gaci=, pp. 199-203). Otherconstraints include externality due to litation and a2nnnol9LA±cwdersu=2Iv of information.

La Japan, industVLs took the initiative for thelr estabilshment and wereinfluential ia deciding the services these lnstitutlons would provide. Theindustrlal standard system encouraged enterpriles to adopt quallty controlsystm, only becusoe lts certifleatoan had credibility.
5.29 Suceessful dlffusion requires adptivo R6D, but the approprlabil-ity of adaptlve R&D ca be low n somo technology areas for SNUs. Thl Lsbecauso of the large number of imitators and cmompettors and the smallerpossibility for patent protectlon. The provislon of lneentives for this typeof bD. *veen at the devlopment stage, could be useful.
(D-263a)

*45 -
VI. DIStamC aim DEVKLOPEJf
A. D ri. R&D Kfeta
6.01 Japanese R$D grew rapidly for most of the pout-war era. Its realexpenditure maintained high real annual growth: 16% from 1955-1965, 8.8% from196531975 and 7.3% from 1975-1985 (see Table 4 in the Statistical Appendix).The growth of the number of scientists and engineers, real research expendi-tures, and the ratio of R&D expenditure to GNP exceeded those of other majorindustrial countries from the did-1960s to the early 1980. (Table 18). Conse-quently, Japanese R5D intensity compares favorably with any major Industrialcountry in terms of the ratio of R&D expenditure to ONP and the ratio ofresearchers to population (Table 19).
labJL1A: GROWTH IN NATIONAL R&D EFFORTS (ANNUAL GROWTH RATE)(percant)
WestJapan Germany UK France USA
.................................................
Scientists and Engineers A/(1966.81) 5.9 4.7 3.4 2.8 1.9
Real Research Expenditure g/(1965-85) 7.6 6.3 3.2 1.7
R&D Expenditure/GON h/(1965.85) 3.2 2.8 2.3 0
................. ........................
A/ Calculated from the data cLted in Okinoto D. I. and Saxonhouse R., *Tech-
noloVy and the Future of the Economy,' in The Peliti £e2n. of Jipan,Vol. I,' op. cit., 1987, Stanford Universlty.
i Scaence and Techrolo Agency (Japan), Indicators of Science and Technol-gj, 1986. The growth rate of France is from 1965 to 1982.

- 46 -
Tabhg 19: R&D INTENSITY OF NATIONAL ECONOMY
* ------....................... -. - ----- .............................. ..---............................. O.i
Japan Al West Cermay USA France
GNP 3.5 (1985) 3.3 (1985) 3.1 (1985) 2.4 ( 1982)
MRss-MbanPopulation
(1,000) 3.9 (1986) 2.1 (1981) 3.3 (1985) 1.8 (1984).........................................................................
^/ The research expenditure of Japan Ls overstated due to the inclusion ofthe salaries of all faculty of Japanese universities as R&D expenditure.However, its effect is estimated to be around 10% (see Pack K. and TamuraS., 9*;_SUS pp. 558-559).
Source: SeLonce and Technology Agency (Japan), "Indicators of Science andTechnology,' 1986.
6.02 Table 20 shows chat for 1984 Japan was ranked second, after theUnited States, Ln terms of patents granted and was third in receipts fortechnolojy exports .5 The proportion of the Japanese applications in thetotal patent applications in the USA increased from only 0.2% in 1955 to 16.6*in 1984 (see Table 5 in the Statistical Appendix). Quantitative assessment ofR&D perfornance ls diffLcult but tends to show a high return on R&D.2/ Therapid development of Japan's R&D capabliLty has been a major support for thesuccessful importation of technology and for continuing industrial successafter the era of rapid technology importation ended. It enabled Japanese
12/ The number of patents ranted is likely to overstate the technologicaloutput of Japan, partly because patent application is very active in Japan(the rejection rate is about 50% for Japanese applications and 25% forArican applceations ln thelr national patent offices). (See Okimoto D. I.and Saxonhouse R, 'Technology and the Future of the Economy,' in ThsPolir -al Reg RE of Janan, Vol. I, edlted by Yamamura K. and Yasuba K.,1987, Stanford University.)
LV The study by Suzuki (1985) shows that the internal rate of return from R&Dwas 22% for 1965-82,, whllo the study by Mohnon at al. (1984) shows thatit was more modest: 7% to 12% for 1963-77. (See Suxuki K. (1985),'Knowledge Capltal and the Private Rate of Return to R&D in JapaneseManufacturing Industries,' Ie tiglal Journal of In&ustrial OrgazAtion;, 295-306 and Pierre Mohnen, M. Ishab Nadiro and Inpar R. Prucha,("R&D, Production Structure and Productivity Growth in the U.S., Japaneseand German Manufacturing Sector, tional Bureau of *Eonomic ResearchNalhlngZunsz r, No. 1264, 1984.).

* 47 -
enterprises not only to improve the efficiency of established industries butalso to add nov industries continuously.
Table 20: SOME OUTPUT MEASURi OF R&D
Japan USA UK Gormany France~~................. ................................................... 0
Patents Granted toNational Scientists andEngineers in 1984 gJ(1,000) 81 (11) S/ 94 (38) 16 (2) 46 (6) 23 (2)
Receipt for TechnologyExport in 1984 b/(b yen) 165 1,930 205 123 102
A/ World Intollectual Property Organization, Industrial Property Statistics,1985.
V Science and Technology Agency (Japan), 1986, oo ct..i/ The numbers In brackets are patents granted by the US Fatent Office.
6.03 Nuch of the increased R&D effort by Japanese industry has beenfunded and implemnted by the private industry--67% in 1969, both funded andperformd (compared to 38% and 70% respectivel& for the US). These ratiosincreased to 82% and 77% respectively by 1985./
6.04 Further, increased national R&D effort has been supported by thegrowing number of enterpriseo performing R&D--lncreasing by 50% from 1965 to1985. Japanese firms with under 1,000 employees accounted for 14.6% of allR&D expenditures in 1985, / although this ratio has been declining. Thecorresponding number for the US is 4.1%.!/
B. R5D Policeis3. K&12Je±
1. FiScAl and EiRMneAL Ineencives
6.05 The governmnt has taken various measures in order to promote andcomplement RAD efforts by industry: tax incentives (Table 15) and conditionaland soft loan (Table 22 for an explanation of the schee). Counting govern-ment research contracts as subsidies, the ratio of total fiscal and financial
2W/ SceLnce and Technology Agency (Japan). White npjM_e o Scie_- -T-uh.alazy, 1973.
22/ torg gf ScitnCe and Technqlot, p. 68.
2WJ Quoted by Okimoto and Saxonhouse, on,it. p. 398.

- 48 -
incontivos to the su toctl of R4D expenditures and payment for technologyimports has been relatively small (Table 21). From 1957 to 1980, the peakwnxuel ratio was 14% (1958), and the bottom ratio was 1.5% (1966).
labW.LJ1: RATIo OF iNCENTIVES To THE SUN OF R&D EXPENDiTUREAND MXPENDITURE FOR TECHNOLOGY IPORT
.. .. . .. . .. .. .. . ....... .... . . . . . . . . . . . . .
Conditional Loan A/ Tax softand Research Contract Incentive Loan b/ Sum
....... ---. ..*. ........**..*..*.*..................
1957-60 0.7 7.3 0 8.01961-64 0.3 5.4 0 5.81965-68 0.9 2.5 0 3.41969-72 1.5 1.7 0 3.31973-76 1.5 1.5 0 3.11977-80 1.2 1.1 0 2.4
........................
g/ Repaymunt obligation of conditional loans Ls not taken into account, sothat this table is an overstatement of the subsidy.
b/ Includes only the soft loans provided by the Japan Development Bank. Theincentive component is calculated as a dLfference between the primelonding rate and the interest charged by the Bank.
Source: Calculated from Coto A. and Wakasugi R., 'Technology PolLey," g2.iA. ; p. 168.
6.06 4XALSt nL9Ce e. Japaese tax credits for incremental R&D expendi-ture apply broadly to R&D activities without favoring particular technology orphase. Although this tax incentive is generally regarded as a clever schemeto reduce the mrginal coat of R&D substantially without incurring a largefiscal burden,5 doubt has been ex rcssed about whether they have been afactor for rapid expansion of R6D. / First, the net present value of the taxcredit is not large, even Lf a tax credlt Ls fully applied, since greater
22J It is said that the R&D tax credit in Japan served as a model for the UStax credit systcm introduced under the Economic Recovery Act of 1981.(Okimoto and Saxonhouse, 1987, op. cit.).
11/ Peck M. and Tamura S., 'Technology," op. cit., p. 569. MansfLeld (1986)reports that R&D tax Lncentives in the Unlted States, Canada and Sweden,which are similar to that of Japan, are estimated to have increased R&Dexpenditures by only about 1. based on a survey of firms. (Mansfield e.,'The R&D Tax Credlt and Other Technology Pollcy Issues," May 1986, A. PP.190-1983).

- 49 -
Table 22: MLa= fL3N7 SCES IR PRD:CONDITONAL OAN, ThwCTcLASSISTAU ANID GOVERNESPONSAES RPD IN 1960 AND 1970a
ZDinceive Sch_m
1. Couditoal Loan FiwAl upport granted (arcnad 301 of R&D cost)mt be repaid, depending an thm profitgenrated by tim technolcgy or on the sucrs ofthe developmet project. *Ptets or any otherrearch results belong to enterprises.
a. Xaporun technology Elgible R&D projects are dwo.e out of applice-In Industry and mii tioa from ildustry on the competitive basis,(1950- i. accordin to criteria et by the pverae.
b. Tmol improvemen The sawe shem but .liblilty restricted tfor S?s (1967- he smell and mudium enterprpim
COMutr development(1972- ) Ta tted support for te devalol et if
computer ad aircraft inustry.d. Atrcift dsvl I -io t
(1968- ).
2. Financial Incentive Bdelow mrkt interet rate loan to cwer sroun*Z0 of project cot (finanin pnriod up to 15
a. lasn by the Jaa Davel- Soft loan is prowided to thi corcaliationopine Bank (1951- ). of new techology, developmnt af hawy
- hinry, and carmcaliaation o mm
b. la= by Slel md Meium Soft loan is proided to di inerdalizatiouBusiness Finance Corpora- of aw technoloy and to tel prototpetion (1970- ). developnt f new mechinery.
3. Govcnmute-SponsoEd R&D The petas origiated from rsearch usuallybelong tc ip verinnt ad ae available toany enterprise (i.o., nonetclusively), Incudinga purticipating enterpries.
a. taqe-Scele project Mm gm nc Identiies R& projects, siuch(196- ) ' cat be uMertaken by private enterpris in
spite of hlgh scaL reta , and spomnors tiirIaple aeion (16 comple mi projects an 7ongoing projects in 1987).
Sore: Goto A. and Wakasugi R., "Technology Policy," o. cit.Peck H. and Tamua S., 'Technology," op. cit.Brochue of Apncy of Industrial Science and Technology, AIST ot MITI,op* cit.
(D-263d)

- 50 -
xpeanditure in one year will reduce the tax credit the next year by setting ahigher base for that year.t/ if a firm renews its record of R&D expenditureevery year, the not present value of the tax credit for incremental R&D is:
20% (1 - . ) - 1iI+ i
assuming that the real interest rate i is 5%. Exlsting tax incentives reducethe marginal cost of R&D only by a very modest percentage. Second, a taxincentive does not give a further incentive to firms that plan to devote asteady level of resources to lAD, nor to those with small or no incom taxliability relative to R&D spending. It also tends to disfavor R&D-intensiveenterprises, since there is a limit on the tax credit (10% of income tax).
6.07 Financial lncentives for R&D. Conditional loans for the develop-ment of important technology in industry and mining had a substantial incen-tive effect on R&D in its infant stage. R&D projects supported by this typeof loan accounted for 15% to 40% of total expenditures for industrial R&D inthe 1950s' This type of loan's importance in terms of a general lncentivefor R&D declined sharply in the 1960s, however.
6.08 In the 1970s, conditional loans targeted to the development ofstrategic technology for computers and aircraft were important. Notableexamples in the computer industry included development of '3.5 -generationcomputers (from 1972-76) and large-scale integrated circuits (VLSI) (from1976-79). / The first support program was launched in response to thecrisis of the Japanese computer industry, which faced the withdrawal offoreign partners from the computer industry due to the domlnating success ofIBM's system 370 and the liberalization of the domestic market scheduled in1975. National R&D expenditure on information technology trIpled from 1971 to1976. helped partly by targeted support from the government.M/ The secondcomputer support program was launched in response to the challenge of the'future system' that IBM was said to have started developlng. Governmentsupport covered 40% of total R&D expenditure for developing the process
22/ See Table 15 for an explanation of the R&D tax credit ln Japan. 20% ofincremental R&D can be deducted from income tax.
LDD/ Coto A. and Uakakugi R., Technology Policy,* op. cit. , p. 172.
lQlJ Flamm K. , reting the Comouter, The Brookings Institution, 1987, pp.131-136.
Jf2/ The share of government support to total R&D expenditure on informationtechnology jumped from 6% ln 1971 to 25% Ln 1973 with the average of 20%from 1971 to 1976. Flam., 1987, 1987, go _.=., pp. 249-250.

- 51 -
technology of VUSI.2/ Support in these two areas is generally judged highlysuccessful in developing the competitive technology of the Japanese computerindustry .
6.09 Financial neeneives Total Lncentivesprovided through financial schoees were not large , although Table 21 somewhatunderestimates this. Its calculations do not account for any risk premium.Loans provided by the Japan Development Bank focused mainly on the coiner-cialization stage of new technology. Before 1985, no other official financialschem directly supported R&D. R&D was largely financed by private enter-prises through earnings and by borrowing long-term working capital fromcosmercial banks. In 1985, the Japanese Government established the Japan KeyTechnology Center vith private industry. This provides capital investment andloan, with interest contingent on the success of R&D in fundamental tech-nologies. Japan Development Bank loans also were expanded to cover theconstruction of special infrastructure for basic research.
2. Governmeng-SpansaXed R& Schemes
6.10 The government started the national R&D program in 1966 tostrengthen domestic R&D capability. This program was launched in preparationfor foreign investment liberalization, scheduled in the late 1960s. Under theprogram, the government identifies projects, based on close consultation withIndustry, universities and national laboratories,M/ and implements projectsbased on research contracts with private enterprises and complementaryresearch by national laboratories and universities. Participating companiesoften further bonefit from a three-year, non-exclusive, diLcounted royalty, orreduced license fee, for patents resulting from projects.M/ In 1987 sixteenprojects had been completed and eight were in progress.
Io3 ImaL K., "Recent Industrial Policy from the Perspective of Innovation.'in Ind oiril PoliO of Janan, Chapter 7. Participating enterprises repaidfiscal support to the governent by 1987.
3Qk For examples, Flam_, op. cit.. Imi (1987), op. cit., Wakasugi (1986), op.cit.
o1D Peck M. and Taura S.. "Technology," op. cit., pp. 568-569. According tothm, the selection criteria are: (a) high social return, (b) inabilltyof private enterprises to undertake projects because of large investment,long ter= gestation period, absence of profit motives, high risk and soon, (c) projects should utillze technologles that can be clearly speclfied:exteansive basic research should not be requlred, and (d) projects shouldbe carried out cooperatively by universities, government laboratories andindustry.
10/ Completed projects include the development of an earlier generation oflarge-scale computer, an electric car, water desalination system, patterninformation processing. FMS laser, and C1 chemical technology. Peck M. andTaurs, S., ibid. Participating enterprises often shoulder part of the cost(Wekasugi R. (1986), op. cit., p. 130).

- 52 *
6.11 Despite no overall assessment at thls stage, it La safe to saythat just an cond:tional losns private Lnltiatives have beon stronglyreflected in the selection of R&D projects. lOb Given the close link withivdustry, goverment-sponsored R&D did not cause serious inefficiency due tothe detachment from market needs, although the focus on basic areas of R&Dmight have been weak.2/
3. ch Asre AsncAtiattons
6.12 The law on research associations (1961), to give legal status tocooperative research organizatlons, ' had as its main motive the efficientuse of limited R&D resources. From 1961 to 1983, sOventy one researchassociations were established. The governeent took a leading role in theirestabllshment, suce research associations often have been used as implement-ing organLzations for government-assisted R&D projects. For example, thelarge-scale conditional loans in the computer industry were provided to threecopetitive resoarch associations for development of the 3.5-generationcomputer nd to one research assoclation for the VLSI. The government alsoprovide geeral incentives for the formation of research associations byallowing participating enterprises to write off theLr association dues, byallowing research "asociations accelerated depreciation of their fixed assets,and by applying reduced property taxes and registration taxes oan the asets.Reserch associations are dissolved vhen specific research tasks are accom-plished.
6.13 Research associations have two advantages.1!! First, they act asa forum where researchers share inforzmtion and cooperate for the developmentof new technology. This is particularly iLportant in Japan where researchers'mobility is limited due to the lifetime employment system. Second, researchassociations promote research Ln generic or basic areas, where lndividualfirm's appropriability is limited.
1Q2Z/ Uakasugi a. (1986), ga_qU., pp. 129-132.
Jill Vakasugi R. (1986), =bLg.
Q29. The following descriptions are based on Research Associati2n in Ining adlnftgSr (in Japanese), AIST, MITI.
I1QV Coto A. and WakasugL R., ":chnology PolUcy, g2_ cL pp. 174-77.

53 -
6.14 To combat the possible anti-competitiv, effect of cooperativeresiarch,=/, !l!/ credLble competition from imports was effective, (e. g.,from IBM in the case of research cooperation). Also, since cooperationthrough research associations covers only specific research tasks and isdLssolved afterwards, and sLnes such tasks focus on gonerlc areas, comptcltiveR&D for actual product development Ls unhampered. A research cooperative hasno legal authorlty in limiting competing R&D nor R&D done by non-memberenterprLses.
4. rIn Research-LabazAt2r
6.15 These have played en important complementary role for prlvate R&Dalthough they utlilze a modest part of R&D resources (Table 23), 3% of R&Dexpenditure and 2% of researchers.
IMAMS PUIVATE VS. PSLIC UTILIZATIN OF 113 UEWM3
pr§"at e f V"&WiZ Pulir, 1001tf{ n
entowp1 Inat1tuz j/ Ibt1mt lesgilaml Corporati stien
go Lvi twi(b n) 19I) 5,54 27 157 54 105 5u
M6 2.,U 2 4,512 5sug 4,618 2,847 40.926
w Inmiud anly rfem for sc1swe .1 wngtnewin f1.ld.
uew I S1ewe wid Tehnelow Aevwu, Idtcatwe of Sf wasd n Tchnolov.
6.16 The national research labocatories and public research cooperatives 5/have served flve objectives: basic research not undertaken by universitLes;appIled research Lnvolvlng large-scale research equlpment; technologytransfer; research that private industry cannot adequately undertake (e.g..pollution issues); and research for the establishment of standards, testingmethods and norms.=
112/ Sharing R&D reduces the incentive for each enterprise to undertake R&D.possibly le-ding to the decline in industry-wide R&D. Cooperation in R&Dcan also be utilized a a collusive mchanLsm to restrict lndustry-wideR&D. The incentive for uslng cooperative research agreements as amechanism to restrict R&D becomes stronger when product market competitionamong meobers is Lntense. (Se Katz K.L.. "An Analysis of CooperativeReserch and Development,* Rand Jla l gf Economics*, Winter (1986)). Onefamous case is the US anti-crust sult against cooperative R&D among USautomakers for fuel emission control.
112/ Goto A. and WakasugL R., 'Technology Policy," oo cit., pp. 174-77.
11/ Public corporations have been established to undertake large-scale sciencebased R&D (e.g., atomic energy, space and energy).
IW GCoto A. and wakasugi R., Technology Policy." on, cie., pp. 173-74.

- 54 -
6.17 National research laboratories &lSO have promoted private R&D. TheyhUve provided basiL tOchnological information ln the planning stages ofprivate RAD.!!!/ Wlth MITI, they have played a leadership role for coopera-tive R&D. In addition, they have contributed to the assssment of private R&Dassisted by the government. They have also transferred the skills related toR&D to private enterprises by accepting researchers as trainees.
6.18 A specLal characteristic of Japanese national research laboratorLesis that they have beon able to maintain close lLnks with industry for thefollowing roasons:
o Much interactLon between researchers in national laboratories and inenterprLses through seminars, traLnee systems, etC;
o Schemes such as government-sponsored R&D projects to provideopportuaLties for interaction between national laboratories andLndustry; and
o National research laboratorLes maintaining their technologicalleadrship.
: ^|S^|S Cvstem
6.19 Japan has a long history of patent protection and now exhLbits veryactive patenting actlvities.!!!/ One special feature of the patent system isthe protection of a utility model. !!/ In recent years, more than 40% of theworld patent applieations have been flled by the Japanese (closer to 30% if weexclude utility models) .2
UV/ Ibid.
1I/ The first reuldation for patent was established in 1885 and Japan accededto the Paris Conventlon In 1899, accepting applications by foreLgners.
1J2/ The legislation took place in 1905, using the German system as a model.Protection of shorter duration (10 years) ls granted to a utliLty model (15years for patent). Wont Germany, Japan, Italy and Spain are major countriesthat protect utilLty models.
J/ The nu br of patents applied for worldwide in 1984 was 1,107-thousand, ofwhich 487-thousand (586 patenc and 42% utliLty model) were in Japan; 9% ofpatent applications In Japan were made by foreigners.

- 55 -
6.20 The vwll-established patent system has apparently encouraged R&Defforts. BIsides its positive Lpact on the approprLability of R&D. 9 ithas provided a mechaism of evaluating and recognizing the technologicalefforts of vocklts by the patent experts. In particular, many Japaneseenterprlses hav a spcial Lncentive system encouraging .syloyees to createinventLons and malk suggestLons for improving efficLency.L/ The patentsystem has provided a useful criterion for implementing such system. Protece-tion of less-innovative Inventions by utility model has widened the participa-tion In inventing activities in Japan.
C. Awt%xis and Lessogn.
6.21 The goverrnent support to R&D has played only a modest role in therapid growth of Japaneso industry's R&D capability. The Japanese industry hasupgraded its technological capability through tho process of assilmlatingforeign technology. Increaslng production efficioncy due to the sophistica-tlon of the skllls of production workers has allowed the Japanese enterprisesto successfully co_merclalize new technologies (see Appendlx VI for inter-action between production *ffLciency and R&D.) A narrowing technology gap withthe rest of the developed countries and increased competition from newlyindustrialized countries have also pressured Japanese enterprises to investheavily in R&D.
6.22 Government intervention played a lLmted but useful role through:
o General fiscal and financial incentives for R&D. Tax credits basedon incremntal R&D expendLture could be more effectlve, if the baseamount Is fixed or llnked to the averag Industrial R&D instead ofboLng linked to the R&D of the enterpriso in question.!!!/
o Adequately targeted fiscal and financial, incentives. These can befar more effLcient then general R&D incentlves ln improving thenational RhD performance, since the market tends to overinvest in
1J9/ The quantitative assssment of its impact ls difficult. Based on a surveyof emplrlcal evidence in other developed countries, Stoneman (1987)concludes however that in most lndustrios patents are not considered ofvital importance (except in pharmacutLcals) and that other meanis ofprotectLng return are available, although patents might be important formajor innovations (Stoneman, P., , e Analysis oi Uchmolo&Z PolLcZ,Oxford, 1987. p. 114).
J2Q/ Five hundred tweolve Japanese enterprises had a system for suggestlons, and37 million suggestions were made in 1982. (Quoted In Patent Offlce (Japan),"Protection of tntellectual Proprty R1ght," in Indtrial Science andTisahnuJa0. 1985, Vol. 26, MITI, p. 14).
1J./ As proposed by Nensfield (1986). The R&D Credit and Other TechnologyPolicy Issues, gasig.. The US government is currently considering themodification of Its tax code to make the tax credLt for R&D permanent.

* 56 -
patentable or easy.to-comeal technoloy, and underinvest in basicor generic teChnology. Successful cases of government assistancein Japan deaonstrate votential usefulness of such an approach indeveloping countries.!
o cooperative R&D through research associations. Design and manage-mont of cooperative R&D often requires offective and credibleleadership by the goveranent, since cooperative R&D inherentlyinvolves a "free-rider" problem.
o Close link between industry and national research laboratories.They have provided basic information for trh planning of privateR&D, a leadership role for cooperative R&D and assessment ofgovernment-assisted R&D. They have aiso transferred R&D skills toprivate enterprisos through trainee systes. Government fundedresearch progrms in Japan has explieLtly promoted such interaction.
o Patent protection. This plays an important role in cultivating theinventiveness among enterprises and people by providing a mechanismfor evaluating and recognizing their inventions. The protection ofutilLty model may be a useful approach for developing countries.
(D263a)
22/ Nelson L.R. and Winter S.J. (1982) point out Mhe inforation conseraint asa major constraint on the effective design of government support forindustrill RbD. The reason is that an enterprise in rivalry does not wantto disclose information necessary for designing effective governmentprogram if such program can also benefit its competitors. The governmentcould nd up supporting inefficient projects. (Sea An -v lutior Modelof , Harvard, pp. 385-395.) This problem seem to have beenless severe in Japan at least in its catching-up process, since competitionwith a do inant foreign enterprise was often more important than competitionmumg doomstic enterprises, cooperative R&D mainly focused on generic andbasic area, which could be identified by partly utilizing the experienceof foreign countries, and the Government could play a role of effective andcredible agent among participating enterprises.

- 57 -
Viz . CONCLSION
A. fliur!o atrpo
7.01 The ftrst potential lesson from Japan's experLence wLth industrialtechnology development is the importance of a strong mnd flexLble education
AS^M. The remarkable expansLon of science and englneerLng o npower in Japanhas boon one of th eritieal factors enablLng the rapid toechnological absorp-tlon by Japanese enterprLses as well as the rapid growth of their R&D capabil-ity. The conscious government effort to expand sclence and engLneeringeducation, as wvel as the strong response of the private educational system tothe increasing demand for technical manpower from industry, have enabled suchexpansion. In many devloping countries the education and training system isstill weak and nonresponsive to market forces.
7.02 The second potential lesson is the import-ace of a competitiveBUa==. In Japan. although som sectors vere heavily protected fromimports and DFIs, there has been actlve domstic competition mnd protectionfrom Imports ad DFI have been temporary and non-accommodative of LnefficLon-cies. Active copetitlve forces have generated strong pressures for technol-ogy Import, technology diffusion and R&D. Competltion has dLetated the choiceof technology to be Liported nd to bo developed. The main role of governmentand public research instLtutions has not been to target particular commercialappiLctions of technologies and to force them on enterprises but rather toexand the scope of technologLcal opportunitLes available for enterprises.Initiatives for commercialization have been left to enterprises.
7.03 The third potentlal lesson is the importance of a hzaag.huagasWaro-h to lndustrlal technology developent. There exists a hlgh degree of
copleoentarity between technology import, R&D and effLeLont productionsystem. In the cae of Japan active technology iport, active R&D andeffiLient production system have been strongly reinforcing each other. One ofthe major strengths of the Japanese industrial system is high technologicalcapabilLity of the workers in factorLes of large enterprises as well as insmall and medium enterprLses. Their high technological capability has allowedprofitable utlilzation of new technologies and thus ln turn has enabled theJapanese enterprises to actlvely develop and Liport new technologies. In thlssense, technology developmnt in Japan has not been engineered by a laimtednimber of high-technology firms nor by a small group of engineers ln researchlaboratories of lrge anterprLses. It owes moch to the widening technologybase of the economy, *stenslvely involving *m and medium enterprises aswell as production workers. Technology polleles and LnstLtutLons have alsofacLlitated this process through broad based mesures, such as the strongeduction systm, the extensive technology support network for small andmediu enterprises, the development of standards and their dLssealnatlon, andthe introduction of patent protectlon for utllty mnodels.
7.04 Potential lessons in are thefollowing:

- S8 .
(a) Tephwtolog j, 1agg. The Japanese experience suggests that dueto the .@ntPol1iti@ nature of technology markets, the government can poten-tially Lmprove the efficiency of technology import by lLmiting competitionamong dometic enterprises for foreign technology and by restricting DFI.However, #inc such polLices involve complicated tradeoffs, they do not havegenral validity. The regulations of Japan theaselves were flexible andbecame liberalized. The sequencing of liberalization In Japan (liberalizationof DFI preceded by the liberalization of trade) made a good economic sense,coupared with the rovrse sequencing in omny countries. On the promotionalaide the Japanese experience shows that public research LnsetLtutons andunLversities can potentially help domestec enterprises qulckly assiLilate newtechnology opportunities by complementlng theLr week R&D capabilitLes.
(b) i ffous fn o tehnolgy. The extenslve informatlon andpromotional policies developed in Japan seem to have contributed to the rapiddiffusLon of technologLes across the economy, although its contribution lslikely to have been modest. The Japanese experLence confirms that the successof these polleLos depends on how much closely their services are in lLne withLndustrial needs, in turn on the participation of lndustrLes in designlngservices and on the crdible technologlcal leadership of the governmentLnstitutions.
(C) *eMarah And dewlogenC. The Japanese experience shows thatindustrLes have strong Internal forres to upgrade R&D capabillty, given thecompetitive enviroment and strong and flexible technical educatlon system.The Japanese experionce also suggests that the government can potentLallyimprove the national RiD performance by both general and targeted polLcyLnterventions, given the tendency of the market for overLnvostment in proprle-tary technology and for underiLvestuent ln basic or generic technology. Asfor a general policy interventLon, the introduction of patent protection ofutilLty model could be a useful approach for developlng countries. In Japanit has stimulated the participation of a wide class of enterprises andindividuals ia inventions not only by improving the appropriability of theirtechnological efforts but also by providing a system of evaluation andrecognition. As for a targeted policy intervention, a scheme of cooperativeR&D through research associations could be a useful model for developLngcountries too, although targeotd lnterventions require a credible technologi-cal leadership of the governmnt lnstitutions.
S. RuaZrh Agend
7.06 Imne of _9oenction gn technelgay deloometic. Althoughprotection is genrally Inefficient, liberalization by itself does notguarantee the ideal (first-best) outcome. Thls is because there is a theore-tical possibility that selective protection can accelerate the nationalperformace of technology development through lts potentially favorableeffects on iLproving the financial fragility of emerging enterprises, over-coming pecuniary externalities in internationally oligopolistic lndustries,and securing the first mover" advantage, etc. Detailed investigatLon of theJapanese experience might offer Insight regarding the importance of theseconsiderations as well as the characteristics of the first-best intervention.

* 59 *
7.07 DAr"t n, of indunad Jaoene agement.The JApanSe cOnomy hb a distinctlve IndustrLal organization system andmaona6e_nt style. Rapid technology dlffuslon oves much to these institutLonalXMchasas, although not designed explLcitly by the government. Theseodenhlss have recently attracted reneved attention from researchers due tothetr viability, but further evaluation of thelr effLclency and thelrrelevance to developlng countrLes would be useful.
(D263a.WP)

- 60 -
S,, CAL APFD XC
~ K Ar MVa 8 n a4 x JAPAtEg PAWS w
1966 1972 1974 190 12 1985
t iemt rt!Sttcam ((2) 36.2 21.7 22.7 24.0 29.6 27.1
Mic t zut.Lm (Z) 63.8 78.3 77.3 76.1 70.5 73.0
at of £U-ti mietamtieedcmy to:
Jom (A) 10.1 29.2 30.9 463 46.9 %5
Js#, S. Yares, Tatm(B) 5.4 4.4 4.0 1.6 2.6 1.7
ad 3 S Ads (C) 2.7 26.4 22.2 23 10.1 6.2
C ad azua 3.3 0.8 0.3 0.3 0.9 0.3
Amy =&My iPt Xt __ cb1o 4.2 2.5 0.9 0.5 8J 8.0 10.3
3 LS 15.1 14.9 19.0 1.1
952 1,535 1,259 1,860 2,2Z 2,430
S== J4 l Sr4= M1 1 et ApoW G - ohl G1utsu DotWuj!g Rom (Am
R.pt X Inuv*cdt of Fozulp T)mIn').
(D-2a3)

- 61 -
TabUe 21 TAX UAW W 1T0 SPZAL TA WASU (M9S0-65)(100 LO yen)
Fl1950 1953 1960 195
1. Speed*L deptStlactom 0 28 140 283
(a) pat d rtci@lati@omwhL'ory 0 100 110
(b) rIeMary for tD an t6rcoinrciaLatLon of new 0 28 is 45ucRoloa
(c) Other speAl deprec.tioa At 0 25 93
(d) machinery for mtermizaconof umell i.d ini enterprise 0 0 0 35
2. setrodtuti of amw tcboloV 5 81 121 79
(A) incom tax apcid forproducLag Iortang products 3 55 45 12
(b) leductias of wUthbLdAing taxan peyc for 1worant 0 6 16 8
(c) Tariff *eiintion for importlngi ertant actdnery 0 20 60 59
3. Tax-fr reerve aO aLloce _/ 5 147 I71 90
4. Export prosS I/1 0 38 11 275
5. othes 0 53 9 10
5 (0.6)e/ 347 (18.1) 556 (9.1) 737 (8.2-qSua f1 aid 2) 5 (0.6r 109 (5.7) 261 (4.6) 362 (4.0
c. corporeciA m trace (Z)/ 42 40 38 37
* ntlad smcial. deprecAtions for mining, houeing L_veetmat for et and regionald.on cludes rcuorw for prlce -fluctuacLou, extraordinary rink, drought, etc.
Sf lauddie Lc tax deductio for expoat (1953-63), special reserves for ovrses marketdeselojmec (1964-12), special depreciation for eport (1964-71), reserves for overseasiuetsi 1os (1964- _).
g, his table grossly oveescimces the actual tan abetiat, since It neglects complecely chvalu of postp oed tax paymnt.
e/ A ume La bracket is a proportion to corporate incom Ux.]/ Corporate in tax by Che Cencral govermat in FT1987 is 43.32. (302 for smel and
vudi enterprise up Co a cercain Limit.)
Source: sKady R., "StudLes in che Woing of Contemporary Japanes Economies," (ln Japanese)1975, UnLversity of Tjkvo, p. 8t.
(D-263e)

- 62 -
abl* 31 SMHLL AND MDIU4M ENTERPRISES a/ IN JAPAN
Number of EstablShm6nfts No of Employees
Ron-Primary Non-PrimaryManufacturing tddustrles Manufacturing ntudustries
1957 541 (99.4) b/ 3,452 (99.7) 5,475 (73.5) b/ 16,222 (82.8)
1963 616 (99.4) 3,886 (99.6) 7,247 (69.6) 21,763 (79.9)
1969 733 (99.4) 4,624 (99.4) 8,680 (69.0) 27,414 (78.3)
1975 809 (99.3) 53358 (99.4) 8,929 (70.3) 31,530 (79.5)
1981 866 (99.5) 6,230 (99.4) 9,551 (74.3) 37,206 (81.4)
i Employees ess than 300 (or leS than 100 in wholesale, or les than 50In retail and services).
=i Proportion to the total establishents or employment.
Source: Coordinating Agency, "Business Statistics."
(D-263e)

- 63 -
Tot 4s D VPMIN0fWEo JAOAN
hint Yew 1955 MO 1946 1975 1973 190 1965................. ........ *0.........0..........................
(Nesii, Pittllll yen) 62 104 41 11m 2,622 4" 6116
- 5rIesl, 17 a 100) 10 2 43 67 100 132 203
Arn1i Irout IOU of
(th. put 5 V 22 10 15 2.6 5.? 9.0
souest leiw wd T.dwwloW urvy, Adinnisfrt1r atie Nasmni AgW of Jm,.
,a S TM PMMTION OF THE JAPANIN APPLICAT tU IN TNE TaTAL PATETAPPLICATtONS IN TNE NAJON INWD TRIALIZU cDMThS
1955 1960 19f5 1970 1973 196 196400004 0.......................................... ........................................
USA 0.2 1.0 2.4 5.1 6.5 10.1 16.6
wst briny 0.1 0.6 2.0 5.8 7.2 8.1
Ucltaim 0.1 1.2 2.3 5.8 6.8 7.3
Frws 0.1 1.1 2.0 5.3 6.0 6.6
........*****................................................ o...........................
Sou Mus it ines of th P*tmt Office (Jap).
?iia.: IINUSTIAL RD (UNTERTIaNAL Cm.AtISa:
..................................................... - 0
J_i USA vat 0ewnE' Fwe......................................................................................
WE *tw.M() 2.0 3.8 3.0 3.5
.set" (1964) (196) I9U) (1962)
Tbe Pro p1Ion othInnnstaidhuq (2) 3.1 34.2 26.5 .1f li*MM*i R (1986) (19") (1965) (195)
Sswc Sc1in wd Tedtology Indicators of JaM, NITI (196).
(0-2463)

- 64 -
APPENDIX I
ZLaaj: GROUT WITH STIUCTURAL TRANSFORMXTION
B9
A~~~~~~~~~~A
, ~~~~\C
\ e " e\ I
\ \~~~~\ /
A
-xfstrie fndtrf s -_ Uin.- Ir*eAtPffI Isdatrfes
In this diagram of the Rlcardian Model of the continuum of good.,m/
V stans for Real incom of Japann " 1-Real income of the rest of the worldB Trade Balance Lne, andA Competitive ine
The growth process of Japan can be interpreted as a combination of theshift of the competitiveness lne from AA to A CU and the shift fromA'CEA to A C A. The first shlft represents productivity gain ofexisting industries, that bringp about the Lncrease of real incom, theextent of which ls at most the productivity gain of these industries.The second shifts represents the addition of new Lndustries into theindustrial structure due to the import of new technologies. The lattercan bring about the lacrease of real incom, the extent of which excoed.the productivity galn of exlsting Lndustries, due to the lmprovement ofthe factoral term of trade from K to K.
1J A similar account was given to the Korean experience (the combina-tion of worsening relative unlt labor cost and expanding export) byDorubusch R. and Park Y. (Korean Growth Pollcy, Brookina Panersg_ Reon22LLASt1vi=, 1987, 2nd Volume.)

il0 i l ..1 ... ..I ..1 ... .... ...... .. ......l
fi°2*~~~~~~ .................... ........... ...... ... .... . l - z...... . ........
ZSt4 2 - -- - - - --- ........................ -........ W-*|.... ............ 5
C r'' ''' ' '' ' ' ' ' ~ - - -... , aB... . .......... ... .. ....
t s 5 . . ... gB"3 S} _ ^ .b _ ............. ......
| na > ** | *l *l ~~~~~~~.... .. ............ . . ..... ..
I.
et$ ......... . .. . -.
A~~~~~~~~~~~~~~A
3 C
04I . A4so '=m<a
0CyXccka o,I* @. 'a a,^f
P Xw

- 66 -
WAGE DIP!'REWXaL By THE SIZE OF Et@LOThVNTO ENTERPRISES (MANUFACTURING)
(Proportion to the av*rage van of *atesgrlsesvwth 500 or more employees)
1950 1955 1960 1965 1970 1975
Souce: Mtami, R., "Economoc Devoloptat of Japan," 1981, Toyokelzit.

- 68 -
APPENDIX III
NATURE OF CONTRACTS IN SUBCONTRACTING SYSTEM
We decribe briefly the major characteristics of contractsbetween an automobile assembler maker and its subcontractor, in order toIllustrate the existence of powerful incentive scheme for higher effi-ciency, largely based on the insightful empirical work by B. Asanuma(1984).
Incentives for higher efficiency work through the following fourmechanisms:
(a) Competitive selection of a subcontractor. The selection of asubcontractor for a particular component depends heavily oncompetition among subcontractors. It takes place for eachintroduction of a new car model normally in every four years.The amount of contracts which a particular subcontractor can getdepends on the result of competitive bidding process.l/ Theselection, however, also reflects the contribution mae bysubcontractors to a parent firm in the past. Moreover, exclusivereliance on a particular subcontractor is avolded by the practiceof "two-vendor policy," where a parent firm divides the workbetween two or maore suppliers.
(b) Association of subcontractors as technology transfer mechanismand as a safeguard against opportunism.&/ Supplier associationsorganized by types of components provide frequent contactopportunities among suppliers and a parent firm. Through theseassociations subcontractors can diffuse technology and experiencequickly among themselves. They also function as a mutualmonitoring mechanism to prevent opportunism among members.
(c) High a9propriabillty and pressure built in the contract forhigher efficiency. The unit price agreed during the aboveselection process is fairly rigid with respect to the changestaking place within subcontractors, so that they can appropriatecost reduction efforts. Although unit price is adjusted eachtims when renewing a contract and in every six months in order toreflect changes in environment (e.g., design change, priceincrease in raw materials, increased product market competition),a parent firm usually does not allow subcontractors to passthrough wage increase or energy cost increase into the unit priceincrease. Subcontractors are expected to absorb these costincreases by productivity increase.
1/ A parent firm can also both make and buy, although it is rare(Williamson 0. (1985), op. cit., pp. 120-24).
2/ Williamson 0. (1985), ibid.

- 69 -
(d) Incentive for design improvement and for higher technologicalcavabIt The suggestions for better component design byaubcontractors are rewarded through various mechanisms. Even ifdesign revision reduces the material and processing costs, theunit price can be maintained to secure higher margin. The parentfirm may reward subcontractors only by non-pecuniary method(e.g., awarding a prize) but it certainly strengthens theposition of the subcontractor in the negotiation over thecontract for the next round of automobile production. Thesubcontractors with high technological capability can participatein the design of a model itself and thus can secure higher returnfrom subcontracted work.
There exist the following risk bearing relationship (a parentfirm shoulders more of business risk):
(a) Investment cost (e.g., tool or die cost) specific to the produc-tion of subcontracted components are fully born by a parent firm,Irrespective of the realized amount of automobile sales (theinvestment can even be financed by a parent firm for a lease tothe subcontractor).
(b) Amount of order is strictly proportional to the sales of automo-biles0 Subcontractors, therefore, are not guaranteed revenue.
Reference: U. Asanuma. "The Organization of Parts Purchases in theJapanese Automotive Industry," (in Japanese), Comtemporary
icono , Summer 1984.
O. Willismon, The Economic Institution of Ca2italism, 1985,the Free Press.

- 70 -
APPENDIX IV
L969-SURVEY ON STATISTICAL QUALITY CONTROL (SQC)AND ENTERPRISE STANDARD
1. The survey was conducted in February 1969 by MITI.
2. Sample: 5,195 factories (1/3 of faccorles wLth employment of 100or more and 1/174th of factories wLth employment from 10to 99).
Replies: 1,566 factorles (32.82 for factories with employment of 100or more and 5.8% for factories wlth employment from 10 to99).
Distribution by size: 1,041 factories belong to large enterprises(employment with 300 or more or capltal exceeding 50 milllonyen) and 524 factories belong to small and mediumencerprises.
3. Main Results
(a) Ratio of enterprises which practLce SQC
(i) By size of enterprisesFactorLes belonging to large enterprises - 942Factories belongLag to small and medium enterprises - 872
(iL) By sector
-etal -ctric w ood Publi- DallyProcssing Machinary Equipment Chemical Textile Processlng Food cation Necesslties
932 862 92X 952 92X 862 902 772 942
(b) Timlng when preparation for the lntroduction of SQC was started
Proportlon of Enterprises Accumulation
1945-49 52 521950-54 20 25
1955-60 24 49196145 33 821966- 16 98
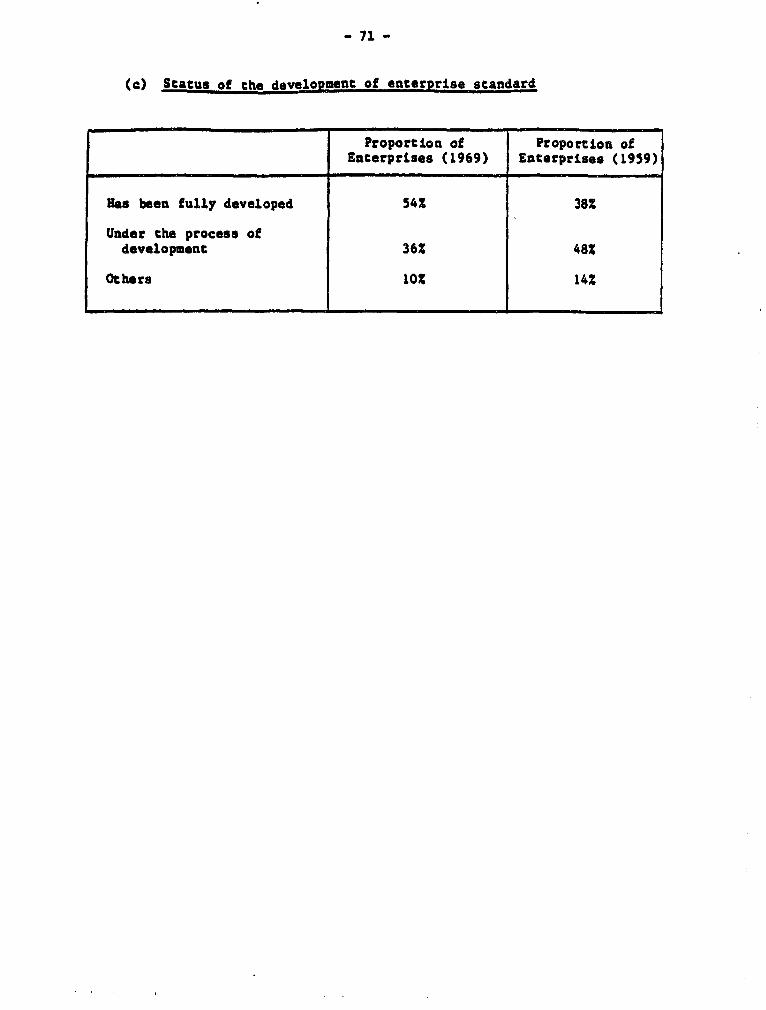
- 71 -
(c) Status of the develODmOnt of enterprise standard
Proportion of Proportion ofEnterprises (1969) Enterprises (1959)
Has been fully developed 54Z 382
Under the process ofdevelopment 362 48Z
Others 102 142

- 72 -
APPENDIX V
THE TOKyo METROPOLITAN INDUSTRIAL TECHNOLOGY CENTER
1. BackgRound
There exist 184 regional. testing and research institutions with a
total staff 7,073 in 1985 in Japan. The Tokyo Metropolitan IndustrialTechnology Center with a staff size of 213 is one of the largest. It wasestablished in 1970, as a result of the merger of the Industrial Promotion
Center established in 1921 and the Electric Research Laboratory establishedIn 1924. This Center provides technological support to small and medium
eanterprises in Tokyo (the number c;f target enterprises is said to be 40,000
to 50,000), as described below. rhe annual budget in FY1985 was about $8
million (converted at $ - 150 yen), (around 20Z of its budget funded by
enterprises).
2. Malor Activities
(a) Testing (Fee is charged)
The Center undertakes various tests, inspections and analysis onequipment, parts and materials for those small and medium business notequipped with testing and inspection facilities and issues certificates ofresults. The Center also provides technical guidance through these testswith a view to assist business in technical development and qualityimprovement. It conducted about 65,000 testing in FY1984.
(b) Research (Mainly funded by the local government. Some supportfrom the national government)
The Center selects those themes which meet industrial and admir-istrative needs and conducts varied research on energy-saving, resource-saving and labor-saving techniques, techniques for preventing pollution,quality improvement, techniques for ensuring safety, development of newproducts and techniques, etc The Center works on about 50 themes, ofwhich three to five constitute larger special studies. The results ofthese studies are supplied to small and medium businesses through technicalconsultations, guidance tours and lecture meetings and are also madeavailable to the public through research reports and meetings. It alsoundertakes research contract from enterprises.
(c) Guldance
(t) Technical guidance (Free). To improve the technical leveland productivity in small and medium businesses, the Center providesguidance and consultation on a wide range of flelds including machinery,metals, electricity, chemistry and industrial arts.
- 73 -
(ii) Open Guidance Room (Fee is charged). For those small andmedium busines'esj not equippedwith testing and research facilities, theCenter has installed various measurLng equLpment, testing equipment andmachine tools whlch can be used for nominal charges, while providLngtechnical guidance for them.
(Wi) SuPoply of technLcal information (Free). The Centerpublishes the TM1IC News once a month. The Center also publlshes varioustechnical pamphlets as technLeal guides foc small and medium businesses.
(iv) Guidance tours (Free). The Center organizes guidance toursto those plants faced with technLcal problems to provlde appropriateguLdance on the spot and to solve such problems. The Center also organizesa touring energy assessment bus to provide better guidance for small andmedium busLnesses on energy-saving. The Center vislts around 800 factoriesannually.
(v) Technical advlsors (Free). The Center also sends out tech-nical advisors commssLoned by the Tokyo Metropolitan Government, whopossess technical skllls, to those small and medium buslnesses engaged inthe development of new products or techniques to help them solve problems.
(vi) Training of technical experts (Fee is charged). The Centerorganizes traLning courses and lecture meetings for techaLcal personnel insmall and medium businesses so that they will acquire advanced techniques.Thes courses and lecture meetings are given in the evening to suit employ-ers and employees* They cover about 40 themes a year for the duratlonranging from 1 to 60 days.
(vii) Technical Exchange Plaza (Free). The Center helps organizegroups of small and medium businesses of dlfferent fields for exchangLagdifferent experiences and vietw to facilitate technical transfer andexchange.
(D-263e)

- 74 - APPENDIX V
ITMERACTION BETVEEN PRODUCTION EPFICIENCY AND R&D
1. Kncreaed R&D Improves production efficiency. ovever we would liketo slso emphasize the reverse causality In the context of theJapanese experience: Righor production efficiency allows an enter-prtse to serve a larger market. The enterprise with a larger marketin turn has a larger incentive to introduce a new technology, sinceit can apply the technology mora widely. Thus higher productionefficiency causes more R&D.
2. Formally we can illustrate the above proposition by using a simplemodel of a monopolistic competition:
(1) 11 * PQ - m (t,c) Q - c
where 1T. stands for profit
P stands for price
Q stands for output
N stands for marginal cost
t stands for production efficiency
C stands for R&D expenditure for cost reduction
We assume that Mt< O, Mc 0, Mcc O and Ptcu -O
The profit max mization requires
(2) P + Q g -M o O
(3) -McQ -1 - 0
For a simplicity we assume that the demand Q(P) has a constantelasticity. In this case
(2') P a # M(t,C); * constant mark up
The second-order condition of the profit maximization requires that
(4) PI -4Mc QQP Mcc + 4 i < O
me Q MkcC
If we differontiate (2') and (3) with respect to t,
(5) P dQ -* (Mt dt + Mc dC)
(6) Mcc Q dC + Mc dn * 0, given Mct - O

- 75 -
Consequently
M t Mc(7) dCc- -(- dt
Q P Me. + ZJ
(8) dQ-- Kee Q dC
Given (4), dC> O and dQ >O for dt>O.
That Is, Increased production efficiency increases not only output butalso R&D. In the following figure, higher production efficiency shiftsthe schedule determining output to the left. Consequently both outputand R&d expenditure increase.
(R&D Expenditure)
output
E R&D
/ / It , ~~~Q (Output)

- 76 -
INDUSTRY SERIES PAPERS
Go. 1 Japanese Direct Foreign Investment: Patterns and Implications forDeveloping Countries, February 1989
go. 2 Emerging Patterns of International Competition in SelectedIndustrial Product Groups
go. 3 Changing Firm Boundaries: Analysis of Technology-SharingAlliances
Go. 4 Technological Advance and Organizational Innovation in theEngineering Industry
No. 5 The Role of Catalytic Agents in Entering International Markets
No. 7 Reform of Ownership and Control Mechanisms in Hungary and China


![HBO Divestiture Opportunity (DRAFT) September [8], 2009.](https://static.fdocuments.in/doc/165x107/5a4d1b6a7f8b9ab0599b2a26/hbo-divestiture-opportunity-draft-september-8-2009.jpg)