Overview of ICHARM’s Case Studies on Disaster Management€¦ · · 2012-07-30Overview of...
34
Overview of ICHARM’s Case Studies on Disaster Management Junichi Yoshitani [email protected] International Centre for Water Hazards and Risk Management under the auspices of UNESCO Disaster Prevention Research Team Public Works Research Institute
Transcript of Overview of ICHARM’s Case Studies on Disaster Management€¦ · · 2012-07-30Overview of...

Overview of ICHARM’s Case Studies oon Disaster Management
Junichi [email protected]
International Centre for Water Hazards and Risk Managementunder the auspices of UNESCODisaster Prevention Research Team
Public Works Research Institute

An ICHARM Challenge: localism
Localism is a principle that takes into account local di it f t l i l d lt ldiversity of natural, social and cultural conditions, being sensitive to local needs priorities development stage etc within theneeds, priorities, development stage, etc., within the context of global and regional experiences and trends <snip> To be needs driven rather than supplytrends. <snip> To be needs driven rather than supply driven, responsive to respective local realities. (ICHARM Strategies and Action Plan for 2006-2008, October 2006). g , )
Research programs coupled with capacity building
Closely work with local engineers/scientists

Local studies and related disaster studiesTakemoto: Factor analysis of flood risksTo demonstrate a better analytical methodology to identify
Chavoshian: Policy analysis of the past large floods in the world T h l / li ki b t
y gy yroot causes of disasters
To help new program/policy making by governments
Adikari: Vulnerability assessment with focus on socio-demographydemographyTo develop a new view and methodology for vulnerability assessment and contribution to UN-WWAPOsti: Local study for Banke District Nepal MEXT KakushinOsti: Local study for Banke District, Nepal, MEXT KakushinProgramTo support climate change adaptation planning
Y hit i S i f i fl d t li i i
Watanabe: Demonstration of debrisflow dehydration break in the Philippines, Asian Development Bank’s Pilot Demonstration Activities
Yoshitani: Series of symposiums on flood management policies in China, Thailand and Japan, JST/CREST Project

General study approach of risk factor analysis
Pre analysis
Country-scale study
Pre-analysis- Selection of region and flood(Hatiya, 1991 cyclone)
- Literature survey
Region - Literature survey
Disaster Profile Sheets
- Disaster External Force ChartFactor analysis
Setting hypothesis
n/disaste Disaster External Force Chart- State of Countermeasures Chart- Regional Characteristics Chart
State of Damage Chart
- Setting hypothesis- Cause and effect- Rough assessment of capacity
er specif - State of Damage ChartVerification by field survey- Joint work with local NGO- Field survey
fic study Field survey- Interview with survivors
y

Hypotheses and findingsNo. Hypotheses
Verification Result Remarks
1Drowned when engulfed by the tidal surge. ○ Verified by field survey.H ifi d?
yp g
1 surge. ○ Verified by field survey.
2 Killed when struck by flying objects. ○ Verified by field survey.
3Because many cyclone warnings had been false alarms. ○ Verified by field survey.
How sacrificed?
Legend
4
Because they feared that if they evacuated, their livestock and property might be stolen, so they remained to protect them. ●
Field survey discovered a new fact (not fear of theft, but fear their assets will be scattered.)Why failed to
Legend○: Facts ≒hypothesis
●:Facts and hypothesis
Why people decided to remain
5Did not evacuate because there were no cyclone shelters near their homes. ○
Quantitatively verified using numerical values.
6 The cyclone is the will of Allah ― Unverifiable.
7Women cannot evacuate because of social and religious restrictions. ― Unverifiable.
evacuate? hypothesis differed. New facts were discovered.
△: Can be
remain home?
g
8If they evacuate, their family members might be separated. ― Unverifiable.
9Could not walk easily because the roads were muddy. ○
Verified by the field survey.
Because they would be asked to pay Why could not evacuate?
△: Can be confirmed only by using documents
―: Hypotheses
Why people were unable to evacuate?
10 a fee to use the shelter. ― Unverifiable.
11
Most fatalities were concentrated among poor people on the ocean side of the dike on the south side (high risk zone). ○
Quantitatively verified using numerical values.
evacuate?
Specific types of
: Hypotheses for which data and testimony necessary for confirmation could not be
1290% of victims were women and children. △
Documents obtained from the Japanese Red Cross Society
13From 30% to 40% of residents of a dike protected island died. ― Unverifiable.
Specific types of people sacrificed?
could not be obtained by this survey.
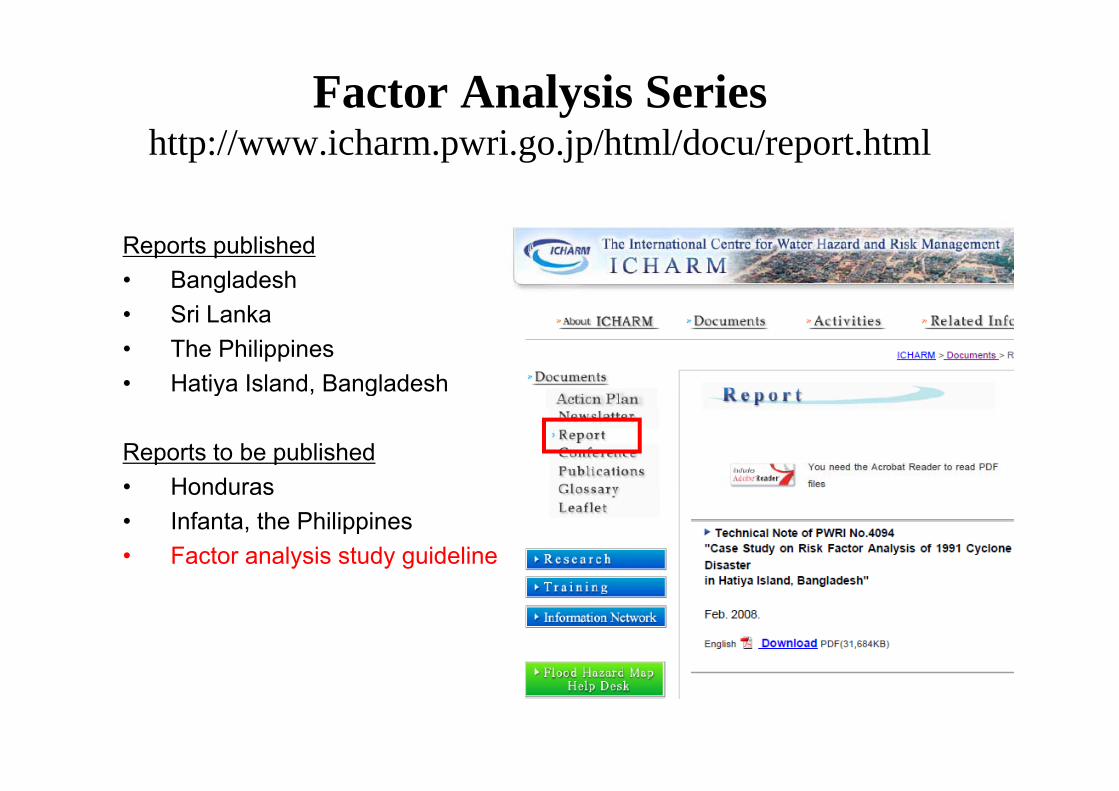
Factor Analysis Serieshttp://www.icharm.pwri.go.jp/html/docu/report.html
Reports published • Bangladesh
S i L k• Sri Lanka• The Philippines• Hatiya Island, Bangladeshy g
Reports to be published• Honduras• Honduras• Infanta, the Philippines• Factor analysis study guideline
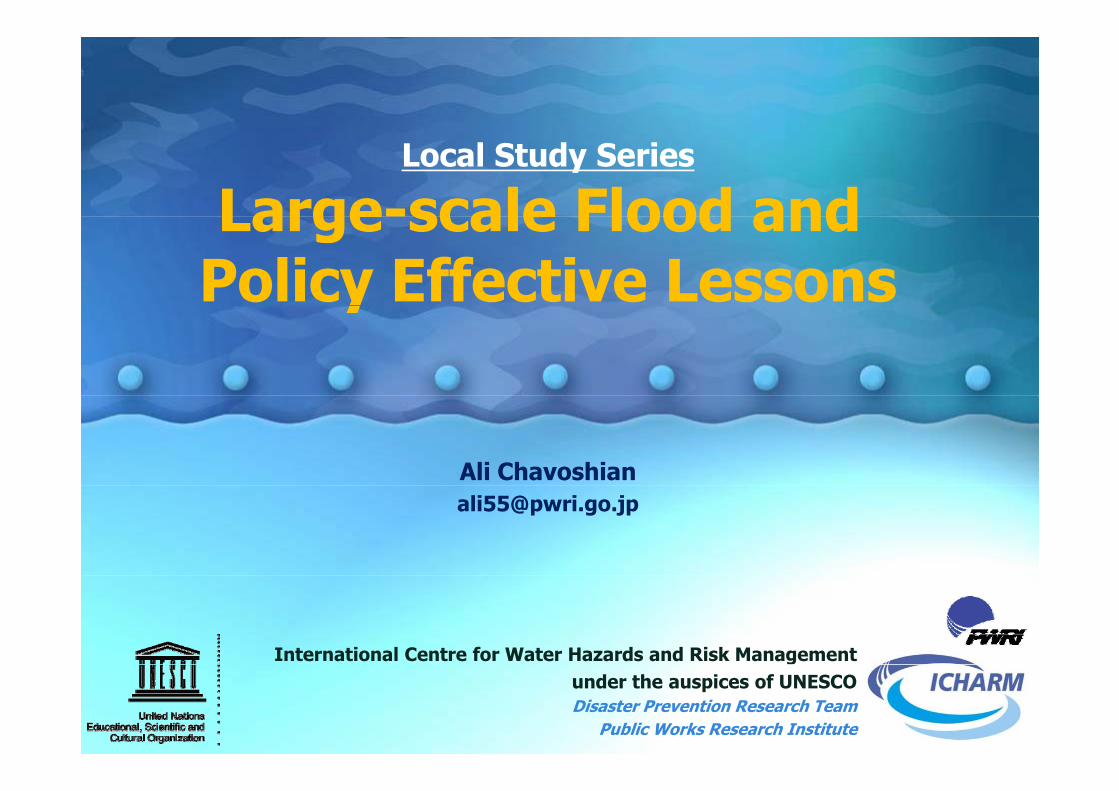
Local Study Series
Large-scale Flood andLarge-scale Flood and Policy Effective Lessonsy
International Centre for Water Hazards and Risk Managementunder the auspices of UNESCODisaster Prevention Research Team
Public Works Research Institute
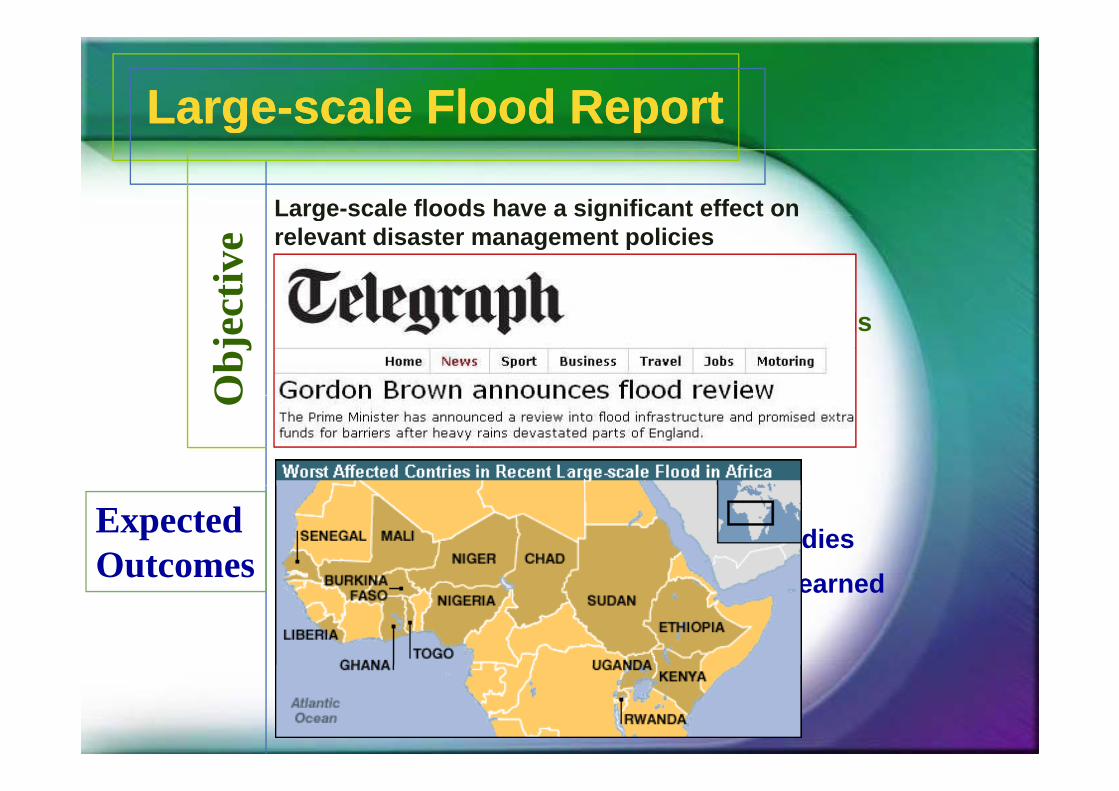
LargeLarge--scale Flood Reportscale Flood Reportgg pp
Large-scale floods have a significant effect onct
ive
Large scale floods have a significant effect on relevant disaster management policies
• Policy-related Lessons of Large-scale Floods
Obj
ec
1) ICHARM Fl d Y B k
O
1) ICHARM Flood Year Book2) Detail Report on the Selected Case Studies3) M h f W ld Fl d L l d
Expected Outcomes 3) Monograph of World Floods: Lesson-learnedOutcomes

Policy Effective Flood Report
I l di li l t i f ti di• Including any policy relevant information regarding occurrence of flood such as
Legal re-arrangement
Institutional framework
Institutionalization
Vietnam
Resources and action Plan
After major floods in 2000, the Government of Vietnam introduced the “Living with Floods” concept that became the strategy for disaster risk reduction in the Mekong
Bangladesh
g griver delta .
The 1998 flood prompted the government to adopt anThe 1998 flood prompted the government to adopt an Integrated Water Resources Policy in the National Water Policy. Roles and responsibilities were reviewed and emphasis shifted toward preparedness, early warning and planning response .

Rating Flood MagnitudeRating Flood MagnitudeFlood Return Period is widely used by hydrologisty y y g
It doesn’t give any sense of death toll and economic damage
Flood Magnitude and Severity Classes (Dartmouth Flood Obs.)
Severity Class:Class 1: large flood events: significant damage to structures or agriculture; fatalities; and/or 1-2 decades-long reported interval since the last similar event. Class 1.5: very large events: greater than 20 yr but less than 100 year recurrence interval, and/or a local recurrence interval of at 10-20 yr.Class 2: Extreme events: with an estimated recurrence interval greater than 100 years
Flood Magnitude =LOG(Duration x Severity x Affected Area)
There is little attention to death toll and flood damages.E ti ti f it l i b d l j d tEstimation of severity class is based on personal judgmentUsing the same weight for the factors
EM-DATEM DATIn fact it is not a rating flood magnitude but criteria to register a flood event in the data base

ICHARM Rating Scale• Easy to estimate• Ubiquitous rating estimation• Considering data availability• Take into account policy related factors
• Tangible damages (weight factor=4)
Death toll– Death toll– Economic damages
• Intangible damages (Weight Factor=2)• Intangible damages (Weight Factor=2)
– Affected area– Affected population
• Mass media coverage (0 to 0.25)
FS=(4 x (∑Tangible DF)+ 2 x (∑Intangible DF)) x (1+ Mass Media CF)FS=(4 x (∑Tangible DF)+ 2 x (∑Intangible DF)) x (1+ Mass Media CF)

Estimation Method• The factors are normalized between 0 to 1 using the • The factors are normalized between 0 to 1 using the
following Eq. ))ln(min()(ln( Xxi −
• The ICHARM Flood Scale can be between 0.01 to 15 for the most severe flood event
))ln(min()(ln(max( XX −
the most severe flood event.• Mass media coverage of each event is estimated using
number of related news in Google newsnumber of related news in Google news.


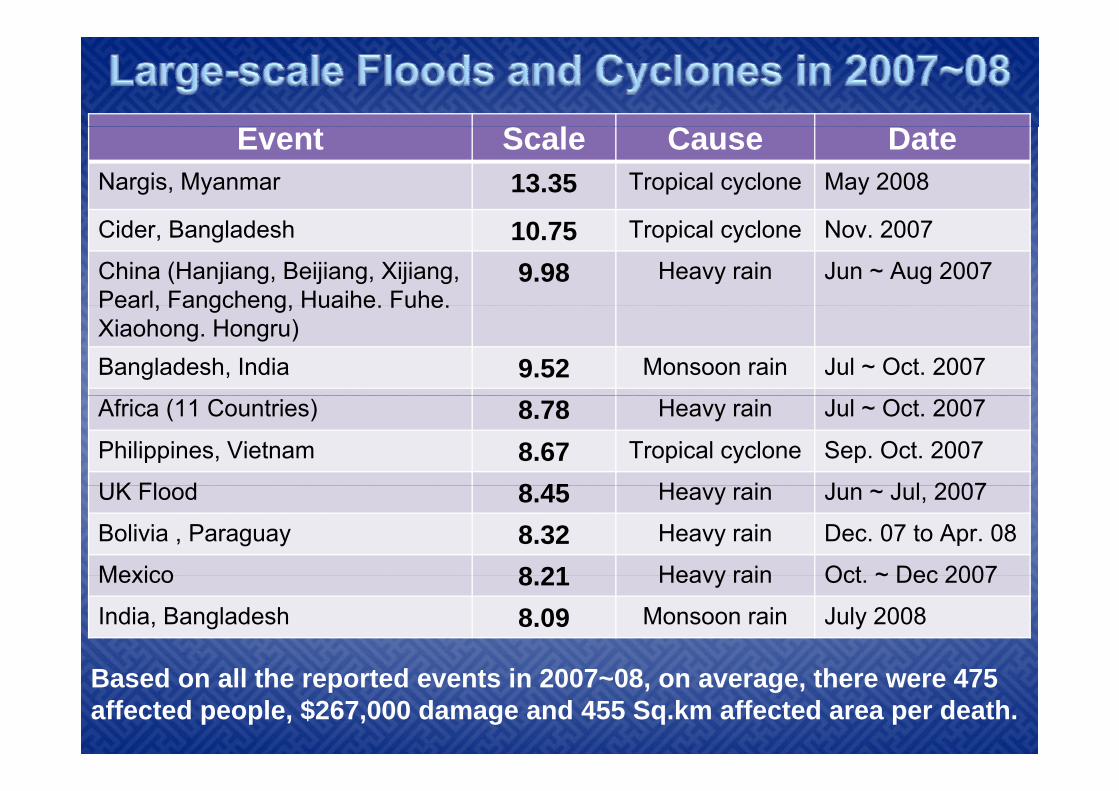
S CEvent Scale Cause DateNargis, Myanmar 13.35 Tropical cyclone May 2008
Cider, Bangladesh 10.75 Tropical cyclone Nov. 2007
China (Hanjiang, Beijiang, Xijiang, Pearl, Fangcheng, Huaihe. Fuhe.
9.98 Heavy rain Jun ~ Aug 2007Pearl, Fangcheng, Huaihe. Fuhe. Xiaohong. Hongru)Bangladesh, India 9.52 Monsoon rain Jul ~ Oct. 2007
Africa (11 Countries) 8.78 Heavy rain Jul ~ Oct. 2007
Philippines, Vietnam 8.67 Tropical cyclone Sep. Oct. 2007
UK Fl d 8 45 H i J J l 2007UK Flood 8.45 Heavy rain Jun ~ Jul, 2007
Bolivia , Paraguay 8.32 Heavy rain Dec. 07 to Apr. 08
Mexico 8 21 Heavy rain Oct ~ Dec 2007Mexico 8.21 Heavy rain Oct. ~ Dec 2007
India, Bangladesh 8.09 Monsoon rain July 2008
Based on all the reported events in 2007~08, on average, there were 475 affected people, $267,000 damage and 455 Sq.km affected area per death.

Policy effective local studiesPolicy effective local studiesPolicy Type UK DE CN IR MX KP JP AF BD IN PH US VN TH
P i ti ti
Policy effective local studiesPolicy effective local studies
FinancialPrivatisationTaxInsurance & SubsidyGender issue
Socio‐economics
Gender issueImmigrationEnergyDevelopmentDevelopmentEducation
G
War & Militarism
Decentrali ed AdminGovernance Decentralized Admin.Political Instability
Climate Change
MiscellaneousInt’l organizationLand use policyPreparedness & Respon.

2007 UK FloodIt was in fact series of destructive floods that occurred in various areas across the country during the summer of 2007.
Two major flooding events occurred: one in late June, the other j gin late July.
heavy rain on 24–25 June. Up to 111 mm of rainfall fell, with some l i i f i h hl i f llplaces receiving over four times the average monthly rainfall.
On 19–20 July, up to 157 mm of rain fell in 48 hours, with some places receiving nearly six times the average monthly rainfallplaces receiving nearly six times the average monthly rainfall.
It was Britain's wettest May–July since records began (in 1776).
Civil and military authorities described the June and July rescue efforts as the biggest in peacetime Britain.

A close look at the UK water privatisation policy and 2007 Flood
Water privatization in England was undertaken in 1989by the government of Margaret Thatcher.
Managing surface water flood risk is intrinsically linked to managing surface water drainage at the local level.
Who is responsible for drainage after privatisation?
Responsibilities for surface water drainage systems are split between various organisations, partly as a consequence of the privatisation of the water industry.
Source: Reported by House of Commons, April-2008

L l dL l dLesson learnedLesson learnedThe current fragmented responsibilities for surface water drainage meant that measures to tackle flood risk were often applied in a piecemeal fashion. The current situation meant that the various organisations would simplyThe current situation meant that the various organisations would simply “shift the problem from one place to another”.It is also highlighted some areas of the confusion with the current system. W t UK h d ib d th t “ ddl ” id it i iblWater UK-who described the system as a “muddle”- said it was impossible to determine when, for example, a highway drain (the responsibility of the local authority as a highways authority) became a public sewer (the responsibility of a water company). Hull City Council had produced a map of the city’s drainage system since the summer floods, which showed there was “some ambiguity” about ownership of certain assets.g y pAs the conclusion local authorities, wanted an organisation to “take the lead” on coordinating surface water drainage in local areas. The law should be changed to grant top-level local authorities a power to take responsibilitybe changed to grant top-level local authorities a power to take responsibility for surface water drainage.

Water-related disaster vulnerability: ya socio-demographic challenge
Yoganath [email protected]
International Centre for Water Hazards and Risk Managementunder the auspices of UNESCODisaster Prevention Research Team
Public Works Research Institute

Symposyum‐2008
500
600
sFlood Windstorm Drought
Slide Wave/Surge Water-related Epidemic
400
sast
ers
300
of d
is
200
umbe
r
0
100Nu
Three year trend of water‐related disasters since 1980 to 2006Three year trend of water‐related disasters since 1980 to 2006. (Technical Note of PWRI No. 4088)

Symposyum‐2008
Country population increase
High birth rate
Increased livelihoodi i
Where and who is affected and how
to protect them?competition
Economic migrationDisaster
to protect them?
City population increase
ExposureSlumsdev..
VulnerabilityHigh
birth rate
The concept of exposure and vulnerability from the view point of population increase
birth rate
view point of population increase1. Slums2. Vulnerable group (women, kids & elderly)

Symposyum‐2008
Definition: a slum household is a household that lacks any one of the following five elements (UN-HABITAT 2003c, p.7):
☞ Access to improved water,☞ Access to improved sanitation,☞ Security of tenure (the right to effective protection
by the state against arbitrary, unlawful eviction),☞ Durability of housing (including living in a non-hazardous
location) and☞ Sufficient living area (no overcrowding).

person/Km2Source: World Population Prospects: The 2006 Revision
Symposyum‐2008
1200
1400 1950
1955
1960
Source: World Population Prospects: The 2006 RevisionPopulation Database, MIdium Varianthttp://esa.un.org/unpp/
800
1000 1965
1970
600
800 1975
1980
1985
200
400 1990
1995
0
2000
2005
2010
2015
Population density increase in some selected countries since 1950 to 2015.

x 1000
Symposyum‐2008
35,000
40,000x 1000
25 000
30,000 1950
1955
1960
Source: World Population Prospects: The 2006 Revision Population Database, MIdium Variant, http://esa.un.org/unpp/
20,000
25,000 1960
1965
1970
1975
10,000
15,0001980
1985
1990
1995
5,000
1995
2000
2005
2010
0 2015
Major city population increase since 1950 to 2015

Symposyum‐2008
100% Urban
% Sl
%Developed countries
Developing countries
60
70
80
90 % Slump
30
40
50
60
0
10
20
30
The percentage urban population of a country (blue) and percent slums (red) population in urban areas.
Source: UN‐HABITAT

Symposyum‐2008
16Millions of people exposed in each city (red bar)
10
12
14
mill
ion)
6
8
10
pula
tion
(m
0
2
4
Pop
Top 20 cities ranked in terms of population exposed to coastal flooding in the 2070 (bars in red). Source: Nicholls et al, 2007, COED, Parisg ( ) , , ,

Symposyum‐2008
When flooded who suffers where? to what extent the slums areWhen flooded who suffers where? to what extent the slums are exposed/vulnerable?
is an unknown fact……W h fi f f t liti b t t lWe have figures of fatalities but not always
categorized into different groups or age classes….
Local realities are….

Symposyum‐2008
[2004 Niigata flood fatalities distribution]
30
40
50
60
%ry
0
10
20
30%
cou
ntr
AN
00 ‐9 10's 20's 30's 40's 50's 60's 70's 80's
[Niigata prefecture population distribution]
velope
dJAPA
810121416
%
Dev
02468
0‐9 10s 20s 30s 40s 50s 60s 70s 80s 90s 100+
Age distribution

s
Symposyum‐2008
40.00
60.00
ge o
f fat
aliti
es
Hurricane Katrina Fatalitiesxample
0.00
20.00
Perc
enta
g
ntry ex
A
Age group frequency (Yr)
14.0016.00
latio
n
Population
ped cou
USA
4.006.008.00
10.0012.00
enta
ge p
opul
Develop
0.002.00
Age gro p freq enc (Yr)
Perc
eD
The percentage frequency distribution of (A) fatalities and (B) total population of *8 parishes hit by Hurricane Katrina , New Orleans, USA (note a significant number of old fatalities in fig A)
Age group frequency (Yr)
*8 Parishes: East Baton Rouge, Jefferson, Orleans, Plaquemines, St. Bernard, St. John the Baptis, St. Tammany and Washington Parishes Source: U.S. Census Bureau,
g )

Symposyum‐2008
15
20
25
%
[Fatalities]mple
Fatalities
0
5
10 MaleFemaleTotal
%
y exam
N
[B]coun
try
AKISTAN
Population[B]
2530354045
%
elop
ing PA
Population
05
101520
Deve
Age group0‐14 15‐24 25‐49 50+
The age group and sex ratio of fatalities of 2001 flood [A] and population of Pakistan [B] in 1998. (note: the ratio of female is very low but usually we hear that women and children are most vulnerable)
Source: JICA Report (A) and UN‐population

ICHARM Symposyum‐2008
25 0030.0035.0040.0045.00
Fatalities
f fat
aliti
es
ample
0 005.00
10.0015.0020.0025.00
Perc
enta
ge o
f
ntry exa
NKA 0.00
0 ‐ 4 5 ‐ 9 10 ‐ 18 19 ‐ 29 30 or more Not Stated
P
PopulationAge group frequency (Yr)
ng cou
nSR
I LAN
6 008.00
10.0012.0014.00
opul
atio
n
Population
velopin S
0.002.004.006.00
Perc
enta
ge p
o
Dev
P
The percentage frequency distribution of (A) fatalities of 2004 Indian Ocean Tunami and (B) total population of a small village in Ampara district Sri Lanka Note more than 35% of the victims are
Age group frequency (Yr)
population of a small village in Ampara district, Sri Lanka. Note more than 35% of the victims are children less than 10 years old.Data source: Source: Final Report - Census on the Buildings and People Affected by the Tsunami Disaster – 2004, Department of Census and Statistics of Sri Lanka

Finally:Symposyum‐2008
there is a grave need to study the disaster vulnerability of slumsespecially against floods because most of the slums are located 1) along low lying flood plains in megacities and 2) coastal cities
grouping fatalities into various age groups gives us an idea that what group of people are exposed and vulnerable in which locality, country
i With thi i f ti ill b bl t i f t liti ttor region. With this information we will be able to recognize fatalities pattern that are linked to local economic development which may help coin future development planning; but the data until today is very scarce and unreliable thus we need to do an intensive study on these themesthus we need to do an intensive study on these themes….
➢ last but not the least, I like to emphasize that slums population increase in low lying floodplains and high kids fatalities is one of the main factors forlow lying floodplains and high kids fatalities is one of the main factors for water‐related disaster vulnerability in the cities and localities especially in developing countries
➢ our examples clearly show that kids are affected in developing countries whereas elderly in developed countries but is not sufficient to draw conclusions…
The way forward is a long and slippery dark trail……we just started to collect basic information and considering further investigations……………………….

Th kThank you