Overview of FY2017 Appropriations for Commerce, Justice ... · Overview of FY2017 Appropriations...
23
Overview of FY2017 Appropriations for Commerce, Justice, Science, and Related Agencies (CJS) Nathan James Analyst in Crime Policy June 13, 2016 Congressional Research Service 7-5700 www.crs.gov R44409
Transcript of Overview of FY2017 Appropriations for Commerce, Justice ... · Overview of FY2017 Appropriations...

Overview of FY2017 Appropriations for
Commerce, Justice, Science, and Related
Agencies (CJS)
Nathan James
Analyst in Crime Policy
June 13, 2016
Congressional Research Service
7-5700
www.crs.gov
R44409

Overview of FY2017 Appropriations for CJS
Congressional Research Service
Summary This report tracks and describes actions taken by the Administration and Congress to provide
FY2017 appropriations for the Commerce, Justice, Science, and Related Agencies (CJS)
accounts. It also provides an overview of FY2016 appropriations for agencies and bureaus funded
as part of annual CJS appropriations.
Division B of the Consolidated Appropriations Act, 2016 (P.L. 114-113), provided $66.000 billion
for CJS, which included $9.246 billion for the Department of Commerce, $29.090 billion for the
Department of Justice (DOJ), $26.754 billion for the science agencies, and $910 million for the
related agencies.
For FY2017, the Administration requests a total of $67.573 billion for CJS, which includes
$9.728 billion for the Department of Commerce, $29.828 billion for DOJ, $26.995 billion for the
science agencies, and $1.022 billion for the related agencies. The Administration proposes
supplementing discretionary appropriations for the National Aeronautics and Space
Administration (NASA) and the National Science Foundation (NSF) with $763 million and $400
million, respectively, in new one-time mandatory funding.
On April 21, 2016, the Senate Committee on Appropriations reported their FY2017 CJS
appropriations bill (S. 2837). The bill would provide a total of $66.309 billion for CJS, an amount
that is 0.5% greater than the FY2016 appropriation, but 0.2% less than the Administration’s
request (excluding the requested $1.163 billion in mandatory funding). S. 2837 includes $9.316
billion for the Department of Commerce, $29.246 billion for the Department of Justice, $26.821
billion for the science agencies, and $925 million for the related agencies.
On June 7, 2016, the House Committee on Appropriations reported their FY2017 CJS
appropriations bill (H.R. 5393). The bill would provide a total of $66.296 billion for CJS, an
amount that is 0.4% greater than the FY2016 appropriation, but 1.9% less than the
Administration’s request (excluding the requested new mandatory funding). H.R. 5393 includes
$9.051 billion for the Department of Commerce, $29.437 billion for the Department of Justice,
$26.920 billion for the science agencies, and $887 million for the related agencies.
Over the past 10 fiscal years, nominal appropriations for CJS increased starting with FY2007,
peaked in FY2010, and generally declined between FY2010 and FY2013. Nominal
appropriations for CJS were relatively flat in FY2014 and FY2015. CJS appropriations increased
by approximately $4 billion in FY2016, largely due to the fact that Congress increased the
discretionary budget cap when it passed, and the President signed, the Bipartisan Budget Act of
2015 (P.L. 114-74).
The data show that the increases in CJS appropriations in FY2009 and FY2010 were largely the
result of Congress appropriating more funding for Commerce in support of the 2010 decennial
census. Although decreased appropriations for Commerce mostly explain the overall decrease in
CJS appropriations between FY2010 and FY2013, cuts in funding for DOJ and NASA and
sequestration in FY2013 also contributed to the decrease. The exception to this trend has been
funding for the NSF, which has generally increased each fiscal year since FY2007.
Appropriations for the Departments of Commerce and Justice and for NASA have generally
increased each fiscal year since FY2013.

Overview of FY2017 Appropriations for CJS
Congressional Research Service
Contents
Overview of CJS ............................................................................................................................. 1
Department of Commerce ......................................................................................................... 2 Department of Justice ................................................................................................................ 3 The Science Agencies ............................................................................................................... 4
Office of Science and Technology Policy ........................................................................... 4 National Aeronautics and Space Administration ................................................................ 4 National Science Foundation .............................................................................................. 5
Related Agencies ....................................................................................................................... 5
FY2016 and FY2017 Appropriations for CJS ................................................................................. 5
FY2016 Appropriations ............................................................................................................. 5 The Administration’s FY2017 Request ..................................................................................... 5 The Senate Committee-Reported FY2017 CJS Appropriations Bill ......................................... 6 The House Committee-Reported FY2017 CJS Appropriations Bill ......................................... 7
Historical Funding for CJS ............................................................................................................ 13
Figures
Figure 1. Nominal and Inflation-Adjusted Appropriations for CJS, FY2007-FY2016 ................. 14
Figure 2. Nominal Total CJS Appropriations, by Major Component, FY2007-FY2016 .............. 15
Tables
Table 1. Commerce, Justice, Science, and Related Agencies (CJS) Appropriations,
FY2016 and FY2017 .................................................................................................................... 8
Table 2. Appropriations for CJS Agencies, by Account, FY2007-FY2016 ................................... 16
Contacts
Author Contact Information .......................................................................................................... 20
Key Policy Staff ............................................................................................................................ 20

Overview of FY2017 Appropriations for CJS
Congressional Research Service 1
his report tracks and describes actions taken by the Administration and Congress to
provide FY2017 appropriations for Commerce, Justice, Science, and Related Agencies
(CJS) accounts. It also provides an overview of enacted FY2016 appropriations for
agencies and bureaus funded as part of annual CJS appropriations.
The amounts in this report reflect only new appropriations. Therefore, the amounts do not include
any rescissions of unobligated or de-obligated balances that may be counted as offsets to newly
enacted appropriations, nor do they include any scorekeeping adjustments (such as the balance on
the Crime Victims Fund).
The FY2016-enacted appropriations were taken from the text of the Consolidated Appropriations
Act, 2016 (P.L. 114-113) and the joint explanatory statement to accompany the act, printed in the
December 17, 2015, Congressional Record. The Administration’s FY2017 requested amounts
were taken from each department’s and agency’s respective budget justification and the report to
accompany S. 2837 (S.Rept. 114-239). The Senate Committee-reported amounts were taken from
S.Rept. 114-239. The House Committee-reported amounts were taken from H.Rept. 114-605.
This report is meant to provide an overview of the FY2017 appropriations for CJS. Please see the
following reports for a more in-depth review of appropriations for certain CJS departments and
agencies:
CRS Report R43908, The National Institute of Standards and Technology: An
Appropriations Overview, by John F. Sargent Jr.
CRS Report R44424, FY2017 Appropriations for the Department of Justice, by
Nathan James.
CRS Report R44430, FY2017 Appropriations for the Department of Justice
Grant Programs, by Nathan James.
CRS Report R43935, Office of Science and Technology Policy (OSTP): History
and Overview, by John F. Sargent Jr. and Dana A. Shea.
CRS Report R44397, NASA: FY2017 Budget and Appropriations, by Daniel
Morgan.
CRS Report RL34016, Legal Services Corporation: Background and Funding,
by Carmen Solomon-Fears.
Overview of CJS The annual CJS appropriations act provides funding for the Departments of Commerce and
Justice, the science agencies, and several related agencies. Appropriations for the Department of
Commerce include funding for agencies such as the Census Bureau, the U.S. Patent and
Trademark Office, the National Oceanic and Atmospheric Administration, and the National
Institute of Standards and Technology. Appropriations for the Department of Justice (DOJ)
provide funding for agencies such as the Federal Bureau of Investigation; the Bureau of Prisons;
the U.S. Marshals; the Drug Enforcement Administration; and the Bureau of Alcohol, Tobacco,
Firearms, and Explosives, along with funding for a variety of grant programs for state, local, and
tribal governments. The vast majority of funding for the science agencies goes to the National
Aeronautics and Space Administration and the National Science Foundation.1 The annual
1 Note that the science agencies funded in the CJS bill are not the only federal agencies that fund science.
T

Overview of FY2017 Appropriations for CJS
Congressional Research Service 2
appropriation for the related agencies includes funding for agencies such as the Legal Services
Corporation and the Equal Employment Opportunity Commission.
Department of Commerce
The mission of the Department of Commerce is to promote “job creation, economic growth,
sustainable development and improved standards of living ... by working in partnership with
businesses, universities, communities and ... workers.”2 The department has wide-ranging
responsibilities including trade, economic development, technology, entrepreneurship and
business development, monitoring the environment, forecasting weather, managing marine
resources, and statistical research and analysis. The Department of Commerce affects trade and
economic development by working to open new markets for U.S. goods and services and
promoting pro-growth business policies. It also invests in research and development to foster
innovation. In addition, the department manages and monitors coastal and ocean resources and
assets to support both environmental and economic health. It also conducts the constitutionally
mandated decennial census. Finally, the Department of Commerce operates the national patent
system.
The following agencies within the Department of Commerce carry out these missions:
International Trade Administration (ITA) seeks to develop the export potential of
U.S. firms and improve the trade performance of U.S. industry;
Bureau of Industry and Security (BIS) enforces U.S. export laws consistent with
national security, foreign policy, and short-supply objectives;
Economic Development Administration (EDA) provides grants for economic
development projects in economically distressed communities and regions;
Minority Business Development Agency (MBDA) seeks to promote private- and
public-sector investment in minority businesses;
Economics and Statistics Administration (ESA), excluding the Census Bureau,
provides (1) information on the state of the economy through preparation,
development, and interpretation of economic data and (2) analytical support to
department officials in meeting their policy responsibilities;
Census Bureau, a component of ESA, collects, compiles, and publishes a broad
range of economic, demographic, and social data;
National Telecommunications and Information Administration (NTIA) advises the
President on domestic and international communications policy, manages the
federal government’s use of the radio frequency spectrum, and performs research
in telecommunications sciences;
United States Patent and Trademark Office (USPTO) examines and approves
applications for patents of claimed inventions and registration of trademarks;
National Institute of Standards and Technology (NIST) assists industry in
developing technology to improve product quality, modernize manufacturing
processes, ensure product reliability, and facilitate rapid commercialization of
products on the basis of new scientific discoveries; and
2 U.S. Department of Commerce, “About Commerce,” at http://www.commerce.gov/about-department-commerce.
Overview of FY2017 Appropriations for CJS
Congressional Research Service 3
National Oceanic and Atmospheric Administration (NOAA) provides scientific,
technical, and management expertise to (1) promote safe and efficient marine and
air navigation; (2) assess the health of coastal and marine resources; (3) monitor
and predict the coastal, ocean, and global environments (including weather
forecasting); and (4) protect and manage the nation’s coastal resources.
Department of Justice
DOJ’s mission is to “enforce the law and defend the interests of the United States according to the
law; to ensure public safety against threats foreign and domestic; to provide federal leadership in
preventing and controlling crime; to seek just punishment for those guilty of unlawful behavior;
and to ensure fair and impartial administration of justice for all Americans.”3 DOJ provides legal
advice and opinions, upon request, to the President and executive branch department heads. It
prosecutes individuals accused of violating federal laws and represents the U.S. government in
court. DOJ enforces federal criminal and civil laws, including antitrust, civil rights,
environmental, and tax laws. DOJ, through agencies such as the Federal Bureau of Investigation;
the Drug Enforcement Administration; and the Bureau of Alcohol, Tobacco, Firearms and
Explosives, investigates organized and violent crime, illegal drugs, and gun and explosives
violations. Through the U.S. Marshals Service, the department protects the federal judiciary,
apprehends fugitives, and detains individuals who are not granted pretrial release. It incarcerates
individuals convicted of violating federal laws. DOJ also provides grants and training to state,
local, and tribal law enforcement agencies.
The major functions of DOJ agencies and offices are described below:
United States Attorneys prosecute criminal offenses against the United States,
represent the federal government in civil actions, and initiate proceedings for the
collection of fines, penalties, and forfeitures owed to the United States;
United States Marshals Service (USMS) provides security for the federal
judiciary, protects witnesses, executes warrants and court orders, manages seized
assets, detains and transports prisoners who have not been sentenced, and
apprehends fugitives;
Federal Bureau of Investigation (FBI) investigates violations of federal criminal
law; helps protect the United States against terrorism and hostile intelligence
efforts; provides assistance to other federal, state, and local law enforcement
agencies; and shares jurisdiction with the Drug Enforcement Administration over
federal drug violations;
Drug Enforcement Administration (DEA) investigates federal drug law
violations; coordinates its efforts with state, local, and other federal law
enforcement agencies; develops and maintains drug intelligence systems;
regulates legitimate controlled substances activities; and conducts joint
intelligence-gathering activities with foreign governments;
Bureau of Alcohol, Tobacco, Firearms and Explosives (ATF) enforces federal law
related to the manufacture, importation, and distribution of alcohol, tobacco,
firearms, and explosives (it was transferred from the Department of the Treasury
to DOJ by the Homeland Security Act of 2002 [P.L. 107-296]);
3 U.S. Department of Justice, “About DOJ,” at http://www.justice.gov/about/about.html.
Overview of FY2017 Appropriations for CJS
Congressional Research Service 4
Federal Prison System (Bureau of Prisons; BOP) provides for the custody and
care of the federal prison population, the maintenance of prison-related facilities,
and the boarding of sentenced federal prisoners incarcerated in state and local
institutions;
Office on Violence Against Women (OVW) coordinates legislative and other
initiatives relating to violence against women and administers grant programs to
help prevent, detect, and stop violence against women, including domestic
violence, sexual assault, and stalking;
Office of Justice Programs (OJP) manages and coordinates the activities of the
Bureau of Justice Assistance, Bureau of Justice Statistics, National Institute of
Justice, Office of Juvenile Justice and Delinquency Prevention, and Office of
Victims of Crime; and
Community Oriented Policing Services (COPS) advances the practice of
community policing by awarding grants to law enforcement agencies to hire and
train community policing professionals, acquire and deploy crime-fighting
technologies, and develop and test innovative policing strategies.
The Science Agencies
The science agencies fund and otherwise support research and development and related activities
across a wide variety of federal missions, including national competitiveness, space exploration,
and fundamental discovery.
Office of Science and Technology Policy
Congress established the Office of Science and Technology Policy (OSTP) through the National
Science and Technology Policy, Organization, and Priorities Act of 1976 (P.L. 94-282). The act
states that “the primary function of the OSTP director is to provide, within the Executive Office
of the President, advice on the scientific, engineering, and technological aspects of issues that
require attention at the highest level of Government.” The OSTP director also manages the
National Science and Technology Council,4 which coordinates science and technology policy
across the executive branch of the federal government, and co-chairs the President’s Council of
Advisors on Science and Technology,5 a council of external advisors that provides advice to the
President on matters related to science and technology policy.
National Aeronautics and Space Administration
The National Aeronautics and Space Administration (NASA) was created by the National
Aeronautics and Space Act of 1958 (P.L. 85-568) to conduct civilian space and aeronautics
activities. It has four mission directorates. The Human Exploration and Operations Mission
Directorate is responsible for human spaceflight activities, including the International Space
Station and development efforts for future crewed spacecraft. The Science Mission Directorate
manages robotic science missions, such as the Hubble Space Telescope, the Mars rover Curiosity,
and satellites for Earth science research. The Space Technology Mission Directorate develops
new technologies for use in future space missions, such as advanced propulsion and laser
4 Executive Order 12881 established the National Science and Technology Council. 5 Executive Order 13539 established the President’s Council of Advisors on Science and Technology.

Overview of FY2017 Appropriations for CJS
Congressional Research Service 5
communications. The Aeronautics Research Mission Directorate conducts research and
development on aircraft and aviation systems. In addition, NASA’s Office of Education manages
formal and informal education programs for schoolchildren, college and university students, and
the general public.
National Science Foundation
The National Science Foundation (NSF) supports basic research and education in the nonmedical
sciences and engineering. Congress established the foundation as an independent federal agency
in 1950 “to promote the progress of science; to advance the national health, prosperity, and
welfare; to secure the national defense; and for other purposes.”6 The NSF is a primary source of
federal support for U.S. university research. It also is responsible for significant shares of the
federal science, technology, engineering, and mathematics (STEM) education program portfolio
and federal STEM student aid and support.
Related Agencies
The annual CJS appropriations act includes funding for several related agencies: the U.S.
Commission on Civil Rights, the Equal Employment Opportunity Commission, the International
Trade Commission, the Legal Services Corporation, the Marine Mammal Commission, the Office
of the U.S. Trade Representative, and the State Justice Institute.
FY2016 and FY2017 Appropriations for CJS
FY2016 Appropriations
On December 18, 2015, President Obama signed into law the Consolidated Appropriations Act,
2016 (P.L. 114-113). Division B of the act (the Commerce, Justice, Science, and Related Agencies
Appropriations Act, 2016) provides $66.000 billion for CJS, which includes $9.246 billion for the
Department of Commerce, $29.090 billion for DOJ, $26.754 billion for the science agencies, and
$910 million for the related agencies.
The Administration’s FY2017 Request
For FY2017, the Administration requests a total of $67.573 billion for CJS, which includes a
proposed $66.410 billion in discretionary funding and a proposed $1.163 billion in new
mandatory funding. The Administration’s FY2017 budget proposal includes $9.728 billion for the
Department of Commerce, $29.828 billion for DOJ, $26.995 billion for the science agencies, and
$1.022 billion for the related agencies. The Administration’s request includes $1.163 billion in
proposed new mandatory funding for NASA and NSF (see Table 1). The proposal is an attempt to
fund what the Administration believes to be critical investments while adhering to the budget caps
on discretionary spending currently in place. The Administration’s FY2017 request includes the
following:
A proposed 22.6% increase ($248 million) for the Census Bureau’s Periodic
Censuses and Programs account to help the agency prepare to conduct the 2020
census.
6 The National Science Foundation Act of 1950 (P.L. 81-507), Purpose.
Overview of FY2017 Appropriations for CJS
Congressional Research Service 6
A proposed $11 million (28.7%) increase for the NTIA for, among other things,
efforts to make more spectrum available for wireless broadband.
A proposed 21.9% increase ($40 million) for the NIST’s Industrial Technology
Services account to support efforts to enhance the competitiveness of U.S.
manufacturers and develop a manufacturing research infrastructure to solve
industry-relevant problems.
A proposed $27 million (85.7%) increase for DOJ’s Justice Information Sharing
account to support increased cybersecurity efforts.
A proposed 8.0% increase ($704 million) for the FBI, which is largely the result
of a proposed $475 million increase in the FBI’s Construction account to help the
FBI as it starts work on building a new headquarters.
A proposed 2.4% reduction ($179 million) for the BOP, which is the result of a
proposed $417 million (78.7%) reduction in the BOP’s Construction account.
The Administration proposes a 3.4% increase for BOP’s Salaries and Expenses
account.
A proposal to transfer $326 million from the CVF to the OVW.
A proposed $74 million (34.9%) increase for the COPS account.
A proposal for $763 million in mandatory funding for NASA. The
Administration’s request would be 1.3% below the FY2016 NASA appropriation
with the mandatory funding and 5.3% below the FY2016 level without the
mandatory funding.
A proposal for $400 million in mandatory funding for the NSF. The
Administration’s request would be 6.7% greater than the FY2016 NSF
appropriation with the mandatory funding and 1.3% greater without the
mandatory funding.
A proposed $90 million (23.4%) increase in funding for the Legal Services
Corporation.
The Senate Committee-Reported FY2017 CJS Appropriations Bill
On April 21, 2016, the Senate Committee on Appropriations reported their FY2017 CJS
appropriations bill (S. 2837). The bill would provide a total of $66.309 billion for CJS, an amount
that is 0.5% greater than the FY2016 appropriation, but 0.2% less than the Administration’s
request (excluding the requested $1.163 billion in mandatory funding). The Senate committee-
reported bill includes $9.316 billion for the Department of Commerce, $29.246 billion for the
Department of Justice, $26.821 billion for the science agencies, and $925 million for the related
agencies. Notably, the Senate Committee on Appropriations rejected the Administration’s request
to provide a total of $1.163 billion in new mandatory funding for NASA and NSF. The Senate
Committee on Appropriations largely rejected the Administration’s proposal to increase funding
for many CJS accounts. The committee proposed funding for many CJS accounts at or near the
FY2016-enacted level. S. 2837 includes the following:
A proposed $148 million (10.8%) increase in funding for the Census Bureau
compared to the FY2016-enacted appropriation. The entire increase in the Census
Bureau’s funding was for the Periodic Censuses and Programs account.
The committee rejected the Administration’s proposal to decrease funding for
NIST’s Construction of Research Facilities account. The Senate Committee on

Overview of FY2017 Appropriations for CJS
Congressional Research Service 7
Appropriations recommends funding the account at the FY2016-enacted level
($119 million). The committee also rejected the Administration’s near-doubling
of NIST funding for the National Network for Manufacturing Innovation
(NNMI), recommending the FY2016-enacted level ($25 million).
A proposed $525 million (169.9%) increase in the FBI’s Construction account.
The proposed increase is to help the FBI plan and build a new headquarters in the
National Capital Region.
S. 2837 bill would transfer $379 million from the Crime Victims Fund to the
Office on Violence Against Women.
The committee proposes reducing funding for the State and Local Law
Enforcement Assistance account by $225 million (16.0%) compared to the
FY2016 appropriation. However, the recommended amount would be $86
million (7.8%) more than the Administration’s request.
The committee proposes $19.306 billion for NASA, which would be a $21
million (0.1%) increase over the FY2016 appropriation.
The committee proposes a $46 million (0.6%) increase for NSF compared to the
FY2016 appropriation.
The House Committee-Reported FY2017 CJS Appropriations Bill
On June 7, 2016, the House Committee on Appropriations reported its FY2017 CJS
appropriations bill (H.R. 5393). The House committee-reported bill would provide a total of
$66.296 billion for CJS, an amount that is 0.4% greater than the FY2016 appropriation, but 1.9%
less than the Administration’s request (excluding the requested new mandatory funding). H.R.
5393 includes $9.051 billion for the Department of Commerce, $29.437 billion for the
Department of Justice, $26.920 billion for the science agencies, and $887 million for the related
agencies. Like S. 2837, the House committee-reported bill does not include the $1.163 billion in
new mandatory funding for NASA and NSF the Administration requested. The House Committee
on Appropriations largely rejected the Administration’s proposal to increase funding for many
CJS accounts, with a few notable exceptions. The House bill includes the following:
A proposed $4 million (1.3%) increase in funding for the Economic Development
Administration compared to the FY2016 appropriation. The amount
recommended by the House Committee on Appropriations would be $6 million
(2.3%) more than the Administration’s request.
The committee proposes reducing funding for NIST by $99 million (10.3%)
compared to last fiscal year’s appropriation, which would largely be the result of
a proposed $20 million (12.9%) reduction in funding for the NNMI in the
Industrial Technology Services account and $69 million (58.0%) reduction in the
Construction of Research Facilities account.
H.R. 5393 bill would provide a $100 million (7.3%) increase for the Census
Bureau, though the proposed amount would be $164 million (10.0%) less than
the Administration’s request.
A proposed $185 million (3.2%) decrease for NOAA, which is largely the result
of a proposed $183 million (7.6%) reduction in the Procurement, Acquisition,
and Construction account.
The House Committee on Appropriations proposes to fund the Executive Office
of Immigration Review (EOIR) and the Office of the Pardon Attorney (OPA)

Overview of FY2017 Appropriations for CJS
Congressional Research Service 8
through separate accounts. Currently, funding for EOIR and OPA comes from the
Administrative Review and Appeals account.
H.R. 5393 does not include a proposal to supplement funding for the Office on
Violence Against Women with a transfer of funds from the Crime Victims Fund.
The committee-reported bill would provide increases for the U.S. Marshals
(1.6%), the FBI (3.2%), the DEA (1.1%), and the ATF (1.4%), compared to the
FY2016-enacted appropriation.
H.R. 5393 would provide $299 million for the COPS account, an amount that is
41.0% greater than the FY2016-enacted appropriation and 4.5% greater than the
Administration’s request.
The House Committee on Appropriations recommends a $223 million (1.2%)
increase for NASA compared to the FY2016-enacted appropriation.
H.R. 5393 would reduce funding for NSF by $57 million (0.8%) compared to
FY2016, which includes a proposed $113 million reduction in the Major
Research Equipment and Facilities Construction account.
The House Committee on Appropriations recommends $65 million for the Office
of the U.S. Trade Representative, a proposed 19.3% increase over the FY2016
appropriation of $55 million. Within the proposed amount, the committee would
provide $15 million from the Trade Enforcement Trust Fund.
Table 1 outlines the FY2016-enacted appropriations, the Administration’s FY2017 request, and
the Senate and the House committee-reported amounts for the Departments of Commerce and
Justice, the science agencies, and the related agencies. Table 2 shows enacted appropriations for
these agencies, in detail, for FY2007 through FY2016 (the FY2013 amounts shown in Table 2
reflect sequestration).
Table 1. Commerce, Justice, Science, and Related Agencies (CJS) Appropriations,
FY2016 and FY2017
(Budget authority in millions of dollars)
Departments and Related Agencies
FY2016 Enacted
FY2017 Request
FY2017 Senate
Committee-
reported
FY2017 House
Committee-
Reported FY2017 Enacted
Department of Commerce
International Trade Administration $483.0 $521.4 $483.0 $483.0
Bureau of Industry and Security 112.5 126.9 112.5 114.0
Economic Development
Administration
261.0 258.5 254.0 264.5
Economic Development
Assistance Programs
(222.0) (215.0) (215.0) (225.0)
Salaries and Expenses (39.0) (43.5) (39.0) (39.5)
Minority Business Development
Agency
32.0 35.6 32.0 34.0
Economics and Statistics
Administration (excluding Census)
109.0 114.6 109.0 107.0
Census Bureau 1,370.0 1,633.6 1,518.3 1,470.0

Overview of FY2017 Appropriations for CJS
Congressional Research Service 9
Departments and
Related Agencies
FY2016
Enacted
FY2017
Request
FY2017
Senate
Committee-
reported
FY2017
House
Committee-
Reported
FY2017
Enacted
Current Surveys and Programs (270.0) (285.3) (270.0) (270.0)
Periodic Censuses and Programs (1,100.0) (1,348.3) (1,248.3) (1,200.0)
National Telecommunications and
Information Administration
39.5 50.8 39.5 36.3
U.S. Patent and Trademark Office
(USPTO)a
3,272.0 3,230.0 3,230.0 3,230.0
Offsetting Fee Receipts (USPTO) -3,272.0 -3,230.0 -3,230.0 -3,230.0
National Institute of Standards and
Technology
964.0 1,014.5 974.0 865.0
Scientific and Technical Research
and Services
(690.0) (730.5) (700.0) (680.0)
Industrial Technology Services (155.0) (189.0) (155.0) (135.0)
Manufacturing Extension
Partnerships
(130.0) (142.0) (130.0) (130.0)
National Network for
Manufacturing Innovation
(25.0) (47.0) (25.0) (5.0)
Construction of Research
Facilities
(119.0) (95.0) (119.0) (50.0)
National Oceanic and Atmospheric
Administration
5,765.6 5,848.2 5,691.2 5,580.6
Operations, Research, and
Facilitiesb
(3,305.8) (3,494.2) (3,339.4) (3,298.0)
Procurement, Acquisition, and
Construction
(2,400.4) (2,270.1) (2,286.9) (2,217.6)
Other Fishery Activities (65.4) (84.4) (65.4) (65.4)
Fisheries Finance Program
Account
(-6.0) (-0.4) (-0.4) (-0.4)
Departmental Management 109.1 123.9 103.0 97.0
Subtotal: Department of Commerce
9,245.6 9,728.2 9,316.5 9,051.4
Department of Justice
General Administration 659.0 714.7 682.5 706.4
General Administration (142.5) (183.5) (164.1) (155.0)
Salaries and Expenses (111.5) (125.9) (114.1) (115.0)
Justice Information Sharing
Technology
(31.0) (57.6) (50.0) (40.0)
Administrative Review & Appeals (422.8) (433.4) (422.8) —
Executive Office of Immigration
Review
— — — (453.2)
Office of the Pardon Attorney — — — (4.5)

Overview of FY2017 Appropriations for CJS
Congressional Research Service 10
Departments and
Related Agencies
FY2016
Enacted
FY2017
Request
FY2017
Senate
Committee-
reported
FY2017
House
Committee-
Reported
FY2017
Enacted
Office of the Inspector General (93.7) (97.8) (95.6) (93.7)
U.S. Parole Commission 13.3 14.0 13.3 13.3
Legal Activities 3,314.6 3,352.9 3,342.6 3,364.3
General legal activities (893.0) (957.4) (893.0) (893.0)
United States Attorneys (2,000.0) (2,074.4) (2,030.0) (2,050.0)
Antitrust Division (165.0) (180.5) (165.0) (165.0)
Offsetting Fee Collections
(Antitrust Division)
(-124.0) (-125.0) (-125.0) (-125.0)
U.S. Trustee Program (225.9) (229.7) (225.9) (225.9)
Offsetting Fee Collections (U.S.
Trustee Program)
(-162.0) (-163.0) (-163.0) (-163.0)
New fees for U.S. Trustee
Programc
— (-125.0) — —
Foreign Claims Settlement
Commission
(2.4) (2.4) (2.4) (2.4)
Fees and Expenses of Witnesses (270.0) (270.0) (270.0) (270.0)
Community Relations Service (14.4) (19.0) (14.4) (15.5)
Assets Forfeiture Fundd (20.5) (20.5) (20.5) (20.5)
Vaccine Injury Compensation
Trust Fund
(9.4) (12.0) (9.4) (10.0)
United States Marshals Service 2,700.0 2,789.2 2,713.5 2,743.0
Salaries and Expenses (1,230.6) (1,275.2) (1,249.0) (1,258.0)
Construction (15.0) (10.0) (10.0) (10.0)
Federal Prisoner Detention (1,454.4) (1,504.0) (1,454.4) (1,475.0)
National Security Division 95.0 97.3 95.0 97.3
Interagency Law Enforcement 512.0 522.1 512.0 522.1
Federal Bureau of Investigation 8,798.8 9,502.4 9,451.1 9,077.9
Salaries and Expenses (8,489.8) (8,718.9) (8,617.1) (8,768.9)
Construction (309.0) (783.5) (834.0) (309.0)
Drug Enforcement Administration 2,080.0 2,103.0 2,103.0 2,103.0
Bureau of Alcohol, Tobacco, Firearms
and Explosives
1,240.0 1,306.1 1,258.6 1,257.8
Federal Prison System 7,481.2 7,301.9 7,094.2 7,159.5
Salaries and Expenses (6,948.5) (7,186.2) (6,978.5) (7,016.8)
Construction (530.0) (113.0) (113.0) (140.0)
Limitation on Administrative
Expenses, Federal Prison
Industries
(2.7) (2.7) (2.7) (2.7)

Overview of FY2017 Appropriations for CJS
Congressional Research Service 11
Departments and
Related Agencies
FY2016
Enacted
FY2017
Request
FY2017
Senate
Committee-
reported
FY2017
House
Committee-
Reported
FY2017
Enacted
Office on Violence Against Women 101.0e 163.0f 102.5g 527.5
Office of Justice Programs 1,883.0 1,675.5 1,662.9 1,566.5
Research, Evaluation, and
Statistics
(116.0) (154.0) (118.0) (93.0)
State and Local Law Enforcement
Assistance
(1,408.5) (1,097.8) (1,183.6) (1,199.9)
Juvenile Justice Programs (270.2) (334.4) (272.0) (184.3)
Public Safety Officers Benefits (88.3) (89.3) (89.3) (89.3)
Community Oriented Policing
Services
212.0 286.0 215.0 299.0
Obligation Cap on the Crime Victims
Fund
3,042.0 2,000.0 2,957.0 2,737.0
Offsetting Receipts -3,042.0 -2,000.0 -2,957.0 -2,737.0
Subtotal: Department of Justice 29,089.8 29,828.1 29,246.2 29,437.5
Science Agencies
Office of Science and Technology
Policy
5.6 5.6 5.6 5.6
National Aeronautics and Space
Administration
19,285.0 19,025.1 19,306.0 19,508.0
Science (discretionary) (5,589.4) (5,302.5) (5,395.0) (5,597.0)
Science (new mandatory) — (298.0) — —
Aeronautics (discretionary) (640.0) (634.5) (601.0) (712.0)
Aeronautics (new mandatory) — (155.9) — —
Space Technology (discretionary) (686.5) (690.0) (686.5) (739.2)
Space Technology (new
mandatory)
— (136.1) — —
Exploration (discretionary) (4,030.0) (3,163.9) (4,330.0) (4,183.0)
Exploration (new mandatory) — (173.0) — —
Space Operations (5,029.2) (5,075.8) (4,950.7) (4,890.3)
Education (115.0) (100.1) (108.0) (115.0)
Safety, Security, and Mission
Services
(2,768.6) (2,836.8) (2,796.7) (2,835.4)
Construction and Environmental
Compliance and Restoration
(388.9) (419.8) (400.0) (398.0)
Inspector General (37.4) (38.1) (38.1) (38.1)
National Science Foundation 7,463.5 7,964.0 7,509.8 7,406.1
Research and Related Activities
(discretionary)
(6,033.6) (6,079.4) (6,033.6) (6,079.4)

Overview of FY2017 Appropriations for CJS
Congressional Research Service 12
Departments and
Related Agencies
FY2016
Enacted
FY2017
Request
FY2017
Senate
Committee-
reported
FY2017
House
Committee-
Reported
FY2017
Enacted
Research and Related Activities
(new mandatory)
— (346.0) — —
Education and Human Resources
(discretionary)
(880.0) (898.9) (880.0) (880.0)
Education and Human Resources
(new mandatory)
— (54.0) — —
Major Research Equipment and
Facilities Construction
(200.3) (193.1) (246.6) (87.1)
Agency Operations and Award
Management
(330.0) (373.0) (330.0) (340.0)
National Science Board (4.4) (4.4) (4.4) (4.4)
Office of the Inspector General (15.2) (15.2) (15.2) (15.2)
Subtotal: Science Agencies 26,754.0 26,994.7 26,821.3 26,919.7
Science Agencies (Discretionary) 26,754.0 25,831.7 26,821.3 26,919.7
Science Agencies (New
Mandatory)
— 1,163.0 — —
Related Agencies
U.S. Commission on Civil Rights 9.2 9.4 9.2 9.2
Equal Employment Opportunity
Commission
364.5 376.6 364.5 364.5
International Trade Commission 88.5 92.9 88.5 90.0
Legal Services Corporation 385.0 475.0 395.0 350.0
Marine Mammal Commission 3.4 3.4 3.4 3.4
Office of the U.S. Trade
Representative
54.5 59.4 59.4 65.0
State Justice Institute 5.1 5.1 5.1 5.1
Subtotal: Related Agencies 910.3 1,021.9 925.2 887.3
CJS Total 65,999.7 67,572.9 66,309.1 66,295.8
CJS Total (Discretionary) 65,999.7 66,409.9 66,309.1 66,295.8
CJS Total (New Mandatory) — 1,163.0 — —
Rescission of Unobligated
Balances
878.7 757.5 840.1 890.8
Sources: The FY2016-enacted amounts were taken from the joint explanatory statement to accompany P.L.
114-113, printed in the December 17, 2015, Congressional Record (pp. H9732-H9759). The Administration’s
FY2017 requested amounts were taken from the departments’ and agencies’ respective budget justifications and
S.Rept. 114-239. The Senate Committee-reported amounts were taken from S.Rept. 114-239. The House
Committee-reported amounts were taken from H.Rept. 114-605.
Notes: Amounts may not add to totals due to rounding. The amounts in Table 1 do not include any rescissions
of unobligated balances, nor do they reflect any scorekeeping adjustments. Amounts in Table 1 in parenthesis
are subaccounts.

Overview of FY2017 Appropriations for CJS
Congressional Research Service 13
a. The U.S. Patent and Trademark Office (USPTO) is fully funded by user fees. The fees collected but not
obligated during the current fiscal year are available for obligation in the following fiscal year and do not
count toward the appropriations totals. Only newly appropriated funds count toward the annual
appropriations totals. Total figures for the Department of Commerce exclude the USPTO.
b. The amount for the Operations, Research, and Facilities account includes a transfer out for the Promote
and Develop Fund.
c. In the FY2017 budget request for the Department of Justice, the Administration proposed an amendment
to 28 U.S.C. § 1930(a) to increase the amount of fees the U.S. Trustees can collect.
d. As a part of the annual CJS appropriations act, Congress traditionally sets a limit on the amount of expenses
that can be paid for the purposes authorized under (B), (F), and (G) of Section 524(c)(1) of Title 28 of the
United States Code.
e. This amount does not include the $379 million transfer from the Crime Victims Fund to the Office on
Violence Against Women per P.L. 114-113.
f. The Administration proposes transferring $326 million from the Crime Victims Fund to the Office on
Violence Against Women.
g. S. 2837 includes a proposal to transfer $379 million from the Crime Victims Fund to the Office on Violence
Against Women.
Historical Funding for CJS Figure 1 shows the total appropriations, in both nominal and inflation-adjusted dollars, for CJS
for FY2007-FY2016 (more detailed historical appropriations data can be found in Table 2).7 The
data show that nominal appropriations for CJS increased between FY2007 and FY2010.
Appropriations for CJS peaked in FY2009 at $76.782 billion if emergency supplemental
appropriations from the American Recovery and Reinvestment Act of 2009 (ARRA; P.L. 111-5)
are included. If ARRA funding is not considered, appropriations peaked in FY2010 at $69.146
billion. ARRA provided a substantial increase in appropriations for FY2009. The $15.992 billion
Congress appropriated for CJS under ARRA was equal to approximately 25% of the amount
Congress provided for CJS through regular appropriations.
Appropriations for CJS decreased in each of the three fiscal years after FY2010. Nominal
appropriations for CJS were relatively flat in FY2014 and FY2015, though appropriations in both
FY2014 and FY2015 were higher than they were in FY2013. If not for sequestration, which cut
nearly $4 billion out of the total amount Congress appropriated for CJS for FY2013, funding for
CJS would have held steady at approximately $61 billion between FY2011 and FY2015. CJS
appropriations increased by approximately $4 billion in FY2016, largely due to the fact that
Congress increased the discretionary budget cap when it passed, and the President signed, the
Bipartisan Budget Act of 2015 (P.L. 114-74).
7 In FY2007, the CJS Appropriations Act included funding for the Department of State. Appropriations for the
Department of State are not reflected in the total appropriations for FY2007. In addition, in FY2007 and FY2008, the
CJS appropriations acts included several “related agencies” (e.g., the Federal Trade Commission, the Federal
Communications Commission, the Small Business Administration) that are no longer funded through the CJS
appropriations act. To make the total appropriations for each fiscal year as comparable as possible, the total only
includes appropriations for the “related agencies” that are currently in the CJS appropriations act.

Overview of FY2017 Appropriations for CJS
Congressional Research Service 14
Figure 1. Nominal and Inflation-Adjusted Appropriations for CJS, FY2007-FY2016
(Appropriations in billions of dollars)
Sources: FY2007-enacted amounts were taken from H.Rept. 110-240 and P.L. 110-28; FY2008-enacted amounts
were taken from the House Committee on Appropriations’ Committee Print on the Omnibus Appropriations
Act, 2009 (P.L. 111-8), Division B; FY2009-enacted amounts were taken from H.Rept. 111-149; FY2010-enacted
amounts were taken from S.Rept. 111-229; FY2011-enacted amounts were taken from H.Rept. 112-169;
FY2012-enacted amounts were taken from H.Rept. 112-463; FY2013 post-sequestration amounts were provided
by the Departments of Commerce and Justice, the Office of Science and Technology Policy, the National
Aeronautics and Space Administration, the National Science Foundation, and each of the respective related
agencies; FY2014-enacted amounts were taken from the joint explanatory statement to accompany P.L. 113-76,
printed in the January 15, 2014, Congressional Record (pp. H507-H532); FY2015-enacted amounts were taken
from the joint explanatory statement to accompany P.L. 113-235, printed in the December 11, 2014,
Congressional Record (pp. H9342-H9363); and FY2016-enacted amounts were taken from the joint explanatory
statement to accompany P.L. 114-113, printed in the December 17, 2015, Congressional Record (pp. H9732-
H9759).
Notes: Inflation-adjusted appropriations are presented in FY2015 dollars. Appropriations were adjusted using
the Gross Domestic Product (Chained) Price Index presented in Table 10.1 of the Historical Tables in the
President’s FY2017 budget submission. The amounts presented in Figure 1 do not include rescissions of
unobligated balances or scorekeeping credits (e.g., the balance on the Crime Victims Fund). The amounts in
Figure 1 include any rescissions of current-year budget authority.
Figure 2 shows total appropriations for CJS for FY2007-FY2016 by major component (i.e., the
Departments of Commerce and Justice, NASA, and the NSF). The data indicate that the increases
in CJS appropriations in FY2009 (not including ARRA funding) and FY2010 resulted from
Congress appropriating more funding for the Department of Commerce in support of the 2010
decennial census.
Although decreased appropriations for the Department of Commerce mostly explain the overall
decrease in CJS appropriations between FY2010 and FY2013 (a 47.4% reduction), cuts in
funding for DOJ (-8.7%) and NASA (-9.8%) also contributed to the decrease. However, despite
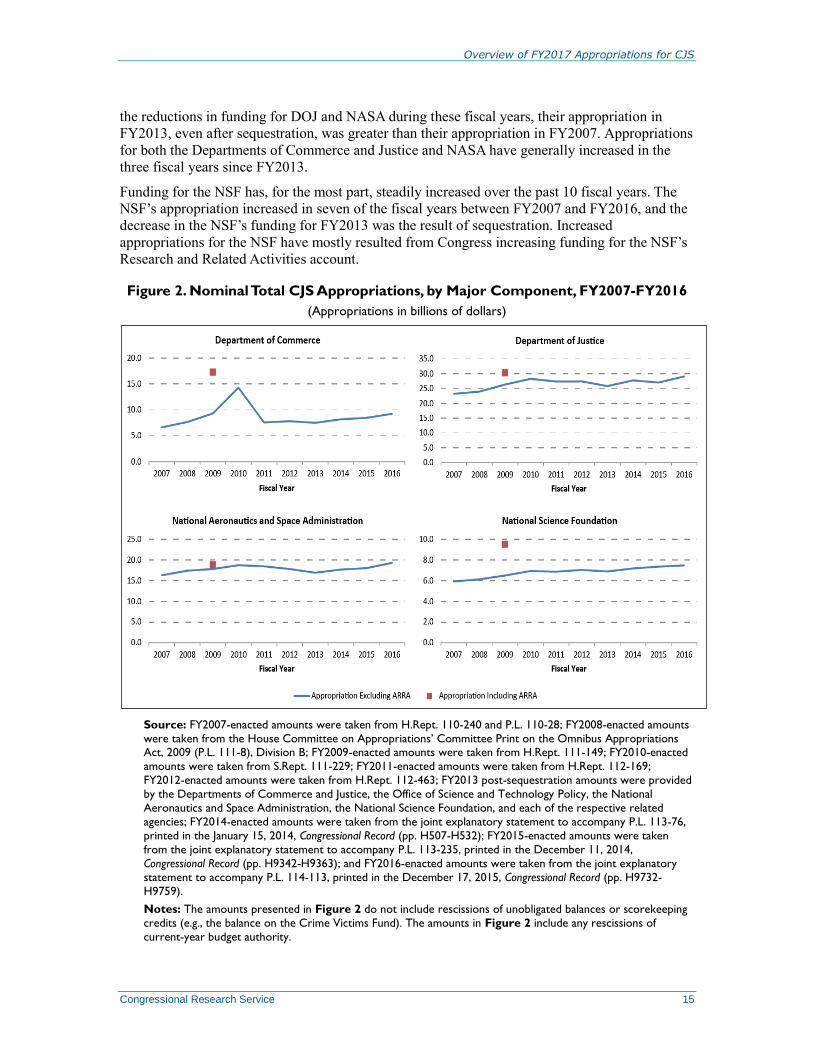
Overview of FY2017 Appropriations for CJS
Congressional Research Service 15
the reductions in funding for DOJ and NASA during these fiscal years, their appropriation in
FY2013, even after sequestration, was greater than their appropriation in FY2007. Appropriations
for both the Departments of Commerce and Justice and NASA have generally increased in the
three fiscal years since FY2013.
Funding for the NSF has, for the most part, steadily increased over the past 10 fiscal years. The
NSF’s appropriation increased in seven of the fiscal years between FY2007 and FY2016, and the
decrease in the NSF’s funding for FY2013 was the result of sequestration. Increased
appropriations for the NSF have mostly resulted from Congress increasing funding for the NSF’s
Research and Related Activities account.
Figure 2. Nominal Total CJS Appropriations, by Major Component, FY2007-FY2016
(Appropriations in billions of dollars)
Source: FY2007-enacted amounts were taken from H.Rept. 110-240 and P.L. 110-28; FY2008-enacted amounts
were taken from the House Committee on Appropriations’ Committee Print on the Omnibus Appropriations Act, 2009 (P.L. 111-8), Division B; FY2009-enacted amounts were taken from H.Rept. 111-149; FY2010-enacted
amounts were taken from S.Rept. 111-229; FY2011-enacted amounts were taken from H.Rept. 112-169;
FY2012-enacted amounts were taken from H.Rept. 112-463; FY2013 post-sequestration amounts were provided
by the Departments of Commerce and Justice, the Office of Science and Technology Policy, the National
Aeronautics and Space Administration, the National Science Foundation, and each of the respective related
agencies; FY2014-enacted amounts were taken from the joint explanatory statement to accompany P.L. 113-76,
printed in the January 15, 2014, Congressional Record (pp. H507-H532); FY2015-enacted amounts were taken
from the joint explanatory statement to accompany P.L. 113-235, printed in the December 11, 2014,
Congressional Record (pp. H9342-H9363); and FY2016-enacted amounts were taken from the joint explanatory
statement to accompany P.L. 114-113, printed in the December 17, 2015, Congressional Record (pp. H9732-
H9759).
Notes: The amounts presented in Figure 2 do not include rescissions of unobligated balances or scorekeeping
credits (e.g., the balance on the Crime Victims Fund). The amounts in Figure 2 include any rescissions of
current-year budget authority.

CRS-16
Table 2. Appropriations for CJS Agencies, by Account, FY2007-FY2016
(Budget authority in millions of dollars)
Bureau or Agency FY2007 FY2008 FY2009 FY2010 FY2011 FY2012 FY2013a FY2014 FY2015 FY2016
Department of Commerce
International Trade Administration $395.6 $405.2 $420.4 $446.8 $440.7 $455.6 $438.5 $460.6 $462.0 $483.0
Bureau of Industry and Security 75.4 72.9 83.7 100.3 100.1 101.0 93.6 101.5 102.5 112.5
Economic Development Administration 280.6 779.9b 312.8 347.0 283.4 457.5 218.3 246.5 250.0 261.0
Minority Business Development Agency 29.7 28.6 29.8 31.5 30.3 30.3 27.5 28.0 30.0 32.0
Economic and Statistical Analysis 79.8 81.1 90.6 97.2 97.1 96.0 93.3 99.0 100.0 109.0
Census Bureau 893.0 1,440.2 3,139.9 7,324.7 1,149.7 888.3 840.6 945.0 1,088.0 1,370.0
National Telecommunications and
Information Administration
39.8 36.3 39.2 40.0 41.6 45.6 42.7 46.0 38.2 39.5
U.S. Patent and Trademark Office
(USPTO)
1,771.0 1,915.5 2,010.1 2,016.0 2,090.0 2,706.3 2,783.7 3,024.0 3,458.0 3,272.0
Offsetting Fee Receipts (USPTO) -1,771.0 -1,915.5 -2,087.0 -1,887.0 -2,090.0 -2,706.3 -2,933.2 -3,024.0 -3,458.0 -3,272.0
Technology Administration 2.0 — — — — — — — — —
National Institute of Standards and
Technology
676.9 755.8 819.0 856.6 750.1 750.8 769.3 850.0 863.9 964.0
National Oceanic and Atmospheric
Administration
4,078.3 3,988.5 4,365.2 4,788.5 4,588.0 4,893.7 5,050.7 5,314.6 5,441.0 5,765.6
Departmental Management 73.7 70.0 83.8 107.5 99.8 88.9 84.6 89.5 91.1 109.1
Commerce Subtotal 6,624.8 7,658.5 9,307.5 14,269.2 7,580.9 7,807.7 7,509.6 8,180.6 8,466.7 9,245.6
Department of Justice
General Administration 1,836.1 1,798.8 2,067.8 2,285.8 2,208.1 2,227.9 503.5 533.2 435.6 659.0
General Administration (310.6) (257.6) (370.8) (456.9) (312.2) (262.1) (135.7) (135.8) (137.3) (142.5)
Administrative Review & Appeals (229.1) (240.6) (266.0) (298.8) (296.1) (301.0) (287.9) (311.0) (347.1) (422.8)
Detention Trusteec (1,225.8) (1,225.9) (1,355.3) (1,445.7) (1,515.6) (1,580.6) — — — —
CRS-17
Bureau or Agency FY2007 FY2008 FY2009 FY2010 FY2011 FY2012 FY2013a FY2014 FY2015 FY2016
Office of the Inspector General (70.6) (74.8) (75.7) (84.4) (84.2) (84.2) (80.0) (86.4) (88.6) (93.7)
U.S. Parole Commission 11.5 11.5 12.6 12.9 12.8 12.8 11.9 12.6 13.3 13.3
Legal Activities 2,567.8 2,724.1 2,918.2 3,108.3 3,177.3 3,187.2 2,989.5 3,180.8 3,220.2 3,314.6
General legal activities (678.8) (747.2) (805.7) (889.0) (863.4) (863.4) (819.3) (867.0) (885.0) (893.0)
United States Attorneys (1,659.9) (1,759.8) (1,851.3) (1,943.2) (1,930.1) (1,960.0) (1,830.3) (1,944.0) (1,960.0) (2,000.0)
Otherd (229.1) (217.1) (261.2) (276.1) (383.8) (363.8) (340.0) (369.8) (375.2) (421.6)
U.S. Marshals Service 825.4 895.1 964.0 1,190.0 1,140.1 1,189.0 2,655.6 2,727.8 1,700.1e 2,700.0
National Security Division 68.7 73.4 85.2 87.9 87.8 87.0 83.8 91.8 93.0 95.0
Interagency Law Enforcement 497.9 497.9 515.0 549.6 527.5 527.5 484.4 514.0 507.2 512.0
Federal Bureau of Investigation 6,298.6 6,763.8 7,336.2 7,922.5 7,926.3 8,118.0 7,558.8 8,343.3 8,436.6 8,798.8
Drug Enforcement Administration 1,757.1 1,887.4 1,959.1 2,053.4 2,015.6 2,035.0 1,907.3 2,018.0 2,033.3 2,080.0
Bureau of Alcohol, Tobacco, Firearms &
Explosives
988.1 1,011.6 1,068.2 1,158.3 1,112.5 1,152.0 1,071.6 1,179.0 1,201.0 1,240.0
Federal Prison System 5,448.2 5,612.6 6,178.9 6,208.1 6,384.1 6,644.0 6,447.2 6,861.7 6,923.7 7,481.2
Office of Violence Against Women
(OVW)
382.6 400.0 415.0 418.5 417.7 412.5 387.9 417.0 430.0 101.0f
Office of Justice Programs (OJP) 1,986.7 1,694.8 2,066.6 2,283.5 1,697.9 1,616.3 1,518.5 1,643.3 1,690.8 1,883.0
Research, Evaluation, and Statistics (238.3) (196.2) (220.0) (235.0) (234.5) (113.0) (119.1) (120.0) (111.0) (116.0)
State and Local Law Enforcement
Assistance
(1,286.8) (1,008.1) (1,328.5) (1,534.8) (1,117.8) (1,162.5) (1,060.5) (1,171.5) (1,241.0) (1,408.5)
Weed and Seed (49.4) (32.1) (25.0) (20.0) — — — — — —
Juvenile Justice Programs (338.4) (383.5) (374.0) (423.6) (275.4) (262.5) (261.0) (254.5) (251.5) (270.2)
Public Safety Officers Benefits (73.8) (74.8) (119.1) (70.1) (70.1) (78.3) (77.9) (97.3) (87.3) (88.3)
Community Oriented Policing Services
(COPS)
541.8 857.2 550.5 791.6 494.9 198.5 209.7 214.0 208.0 212.0

CRS-18
Bureau or Agency FY2007 FY2008 FY2009 FY2010 FY2011 FY2012 FY2013a FY2014 FY2015 FY2016
OVW, OJP, and COPS Salaries and
Expenses
— — 195.0 213.4 186.6 — — — — —
DOJ Subtotal 23,210.4 23,958.3 26,332.3 28,283.7 27,389.2 27,407.7 25,829.7 27,736.6 27,030.2 29,089.8
Science Agencies
Office of Science and Technology Policy 5.5 5.2 5.3 7.0 6.6 4.5 5.5 5.6 5.6 5.6
National Aeronautics and Space Administration
16,284.3 17,401.9 17,782.4 18,724.3 18,448.0 17,800.0 16,879.5 17,646.5 18,010.2 19,285.0
National Science Foundation 5,917.2 6,127.5 6,490.4 6,926.5 6,859.9 7,033.1 6,884.1 7,171.9 7,344.2 7,463.5
Science Agencies Subtotal 22,207.0 23,534.6 24,278.1 25,657.8 25,314.5 24,837.6 23,769.2 24,824.0 25,360.0 26,754.0
Related Agencies
Commission on Civil Rights 9.0 8.5 8.8 9.4 9.4 9.2 8.7 9.0 9.2 9.2
Equal Employment Opportunity
Commission
328.7 329.3 343.9 367.3 366.6 360.0 344.2 364.0 364.5 364.5
International Trade Commission 62.0 68.4 75.1 81.9 81.7 80.0 78.9 83.0 84.5 88.5
Legal Services Corporation 348.6 350.5 390.0 420.0 404.2 348.0 340.9 365.0 375.0 385.0
Marine Mammal Commission 2.9 2.8 3.2 3.3 3.2 3.0 2.9 3.3 3.3 3.4
U.S. Trade Representative 44.2 44.1 47.3 47.8 47.7 51.3 47.6 52.6 54.3 54.5
State Justice Institute 3.5 3.8 4.1 5.1 5.1 5.1 4.8 4.9 5.1 5.1
Related Agencies Subtotal 798.8 807.4 872.4 934.8 917.9 856.6 827.9 881.8 895.9 910.3
Total Appropriation 52,841.0 55,958.7 60,790.3 69,145.5 61,202.5 60,909.6 57,936.4 61,622.9 61,752.7 65,999.7
American Recovery and
Reinvestment Act
— — 15,922.0g — — — — — — —
Rescission of Unobligated Balances 360.5 901.8 610.6 2,559.7h 2,416.0 905.9 881.6 219.3 679.6 878.7
Sources: FY2007-enacted amounts were taken from H.Rept. 110-240 and P.L. 110-28; FY2008-enacted amounts were taken from the House Committee on
Appropriations’ Committee Print on the Omnibus Appropriations Act, 2009 (P.L. 111-8), Division B; FY2009-enacted amounts were taken from H.Rept. 111-149;
FY2010-enacted amounts were taken from S.Rept. 111-229; FY2011-enacted amounts were taken from H.Rept. 112-169; FY2012-enacted amounts were taken from
H.Rept. 112-463; FY2013 post-sequestration amounts were provided by the Departments of Commerce and Justice, the Office of Science and Technology Policy, the

CRS-19
National Aeronautics and Space Administration, the National Science Foundation, and each of the respective related agencies; FY2014-enacted amounts were taken from
the joint explanatory statement to accompany P.L. 113-76, printed in the January 15, 2014, Congressional Record (pp. H507-H532); FY2015-enacted amounts were taken
from the joint explanatory statement to accompany P.L. 113-235, printed in the December 11, 2014, Congressional Record (pp. H9342-H9363); and FY2016-enacted
amounts were taken from the joint explanatory statement to accompany P.L. 114-113, printed in the December 17, 2015, Congressional Record (pp. H9732-H9759).
Notes: Amounts may not add to totals due to rounding. Amounts include all supplemental appropriations, except that the FY2009 amounts do not include
appropriations pursuant to the American Recovery and Reinvestment Act (P.L. 111-5). Amounts also include all rescission of current-year budget authority, but they do
not include rescissions of prior year’s unobligated balances. In FY2005, FY2006, and FY2007, the CJS appropriations acts included funding for the Department of State,
and in FY2005 the act also included funding for the Judiciary. Appropriations for the Department of State and the Judiciary are not reflected in the total appropriations
for FY2005-FY2007. In addition, between FY2005 and FY2008, the CJS appropriations acts included several “related agencies” (e.g., the Federal Trade Commission, the
Federal Communications Commission, the Small Business Administration) that are no longer funded through the CJS appropriations act. To make the total appropriation
for each fiscal year as comparable as possible, the total appropriation only includes appropriations for the “related agencies” that are currently in the CJS appropriations
act.
a. FY2013 appropriations include sequestration.
b. For FY2008, the Economic Development Administration received $100.0 million in supplemental funding under P.L. 110-252 and $400.0 million in supplemental
funding under P.L. 110-329.
c. Under the Consolidated and Further Continuing Appropriations Act (P.L. 113-6), Congress eliminated funding for the Office of the Federal Detention Trustee
account and instead provided funding for a Federal Prisoner Detention account under the U.S. Marshals Service. Funding under this account covers the costs
associated with the care of federal detainees.
d. “Other” includes subaccounts for the Antitrust Division, Vaccine Injury Compensation Trust Fund, U.S. Trustee System Fund, Foreign Claims Settlement
Commission, Fees and Expenses of Witnesses, Community Relations Service, and the Asset Forfeiture Fund.
e. This amount does not include a required transfer of $1.1 billion in unobligated balances from the Assets Forfeiture Fund to the U.S. Marshals Federal Prisoner Detention account.
f. This amount does not include the $379 million transfer from the Crime Victims Fund to the Office on Violence Against Women per P.L. 114-113.
g. A total of $15.922 billion was included in the American Recovery and Reinvestment Act of 2009 (P.L. 111-5) for CJS accounts. This included $150.0 million for the
Economic Development Administration; $1.0 billion for the Census Bureau; $5.4 billion for the National Telecommunications and Information Administration;
$580.0 million for the National Institute of Standards and Technology; $830.0 million for the National Oceanic and Atmospheric Administration; $6.0 million for the
Department of Commerce’s Office of the Inspector General; $2.0 million for the Department of Justice’s Office of the Inspector General; $225.0 million for the
Office on Violence Against Women; $2.765 billion for the State and Local Law Enforcement Assistance account (of which $10.0 million was transferred to the ATF);
$1.0 billion for the Community Oriented Policing Services Office; $10.0 million for the OVW, OJP, and COPS Salaries and Expenses; $1.002 billion for the National
Aeronautics and Space Administration; and $3.002 billion for the National Science Foundation.
h. This amount includes $531.2 million in rescissions of unobligated balances included in P.L. 111-117; $111.5 million in rescissions of unobligated balances included in
P.L. 111-212; $129.0 million in rescissions of unobligated balances included in P.L. 111-224; and $1.788 billion in rescissions of unobligated balance included in P.L.
112-6.

Overview of FY2017 Appropriations for CJS
Congressional Research Service 20
Author Contact Information
Nathan James
Analyst in Crime Policy
[email protected], 7-0264
Key Policy Staff
Area of Expertise Name Phone Email
Departments
Department of Justice Nathan James 7-0264 [email protected]
Department of Commerce Jennifer D. Williams 7-8640 [email protected]
Agencies and Policy Areas
OJP, COPS, BOP, U.S. Marshals Nathan James 7-0264 [email protected]
ATF William J. Krouse 7-2225 [email protected]
Juvenile Justice, U.S. Attorneys Kristin M. Finklea 7-6259 [email protected]
DEA, OVW, FBI Lisa N. Sacco 7-7359 [email protected]
Trade-related agencies: ITA, ITC, and
USTR
M. Angeles Villarreal 7-0321 [email protected]
BIS Ian F. Fergusson 7-4997 [email protected]
EDA, MBDA Eugene Boyd 7-8689 [email protected]
Telecommunications, NTIA Linda K. Moore 7-5853 [email protected]
Census Bureau, ESA Jennifer D. Williams 7-8640 [email protected]
U.S. Patent and Trademark Office Glenn J. McLoughlin 7-7073 [email protected]
NIST John F. Sargent 7-9147 [email protected]
Office of Science and Technology
Policy
John F. Sargent 7-9147 [email protected]
NOAA Harold F. Upton 7-2264 [email protected]
NASA Daniel Morgan 7-5849 [email protected]
NSF Frank Gottron 7-5854 [email protected]
Legal Services Corporation Carmen Solomon-Fears 7-7306 [email protected]


![Legislative Branch: FY2017 Appropriations [June 2, 2016]](https://static.fdocuments.in/doc/165x107/586cfb571a28ab3f0a8c0982/legislative-branch-fy2017-appropriations-june-2-2016.jpg)