Overview of Drought Indicators and their application in the context of a Drought Early Warning and...
30
Overview of Drought Indicators and their Application in the Context of a Drought Early Warning and Information System Mark Svoboda, Climatologist/Monitoring Program Area Leader National Drought Mitigation Center NOAA’s Drought Risk Management Research Center University of Nebraska-Lincoln NENA Regional Water/Drought Platform Stakeholders Workshop Cairo, Egypt, October 27-29, 2015
-
Upload
nenawaterscarcity -
Category
Education
-
view
266 -
download
1
Transcript of Overview of Drought Indicators and their application in the context of a Drought Early Warning and...
Overview of Drought Indicators and their Application in the Context of a
Drought Early Warning and Information System
Mark Svoboda, Climatologist/Monitoring Program Area Leader
National Drought Mitigation Center
NOAA’s Drought Risk Management Research Center
University of Nebraska-Lincoln
NENA Regional Water/Drought Platform Stakeholders Workshop
Cairo, Egypt, October 27-29, 2015

The Cycle of Disaster Management


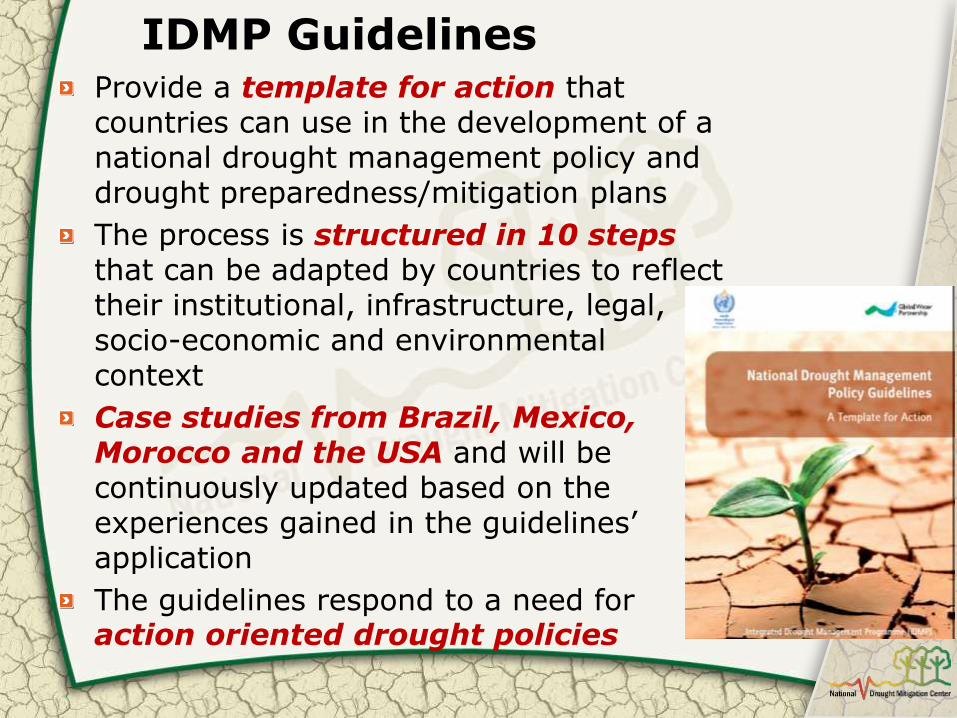
Provide a template for action that countries can use in the development of a national drought management policy and drought preparedness/mitigation plans
The process is structured in 10 steps that can be adapted by countries to reflect their institutional, infrastructure, legal, socio-economic and environmental context
Case studies from Brazil, Mexico, Morocco and the USA and will be continuously updated based on the experiences gained in the guidelines’ application
The guidelines respond to a need for action oriented drought policies
IDMP Guidelines
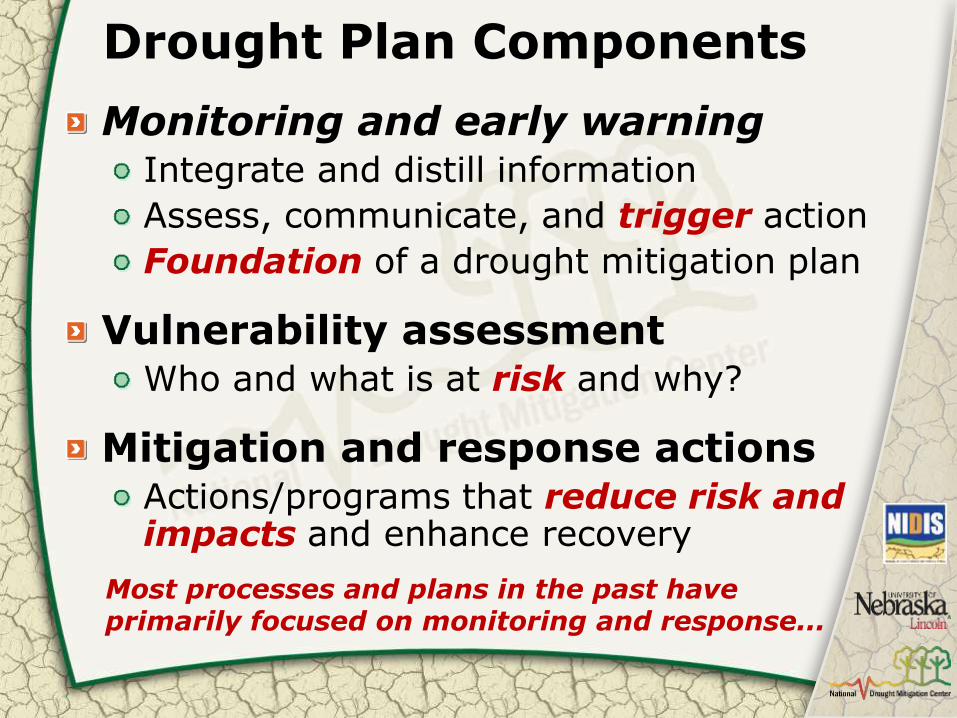
Drought Plan Components
Monitoring and early warning Integrate and distill information
Assess, communicate, and trigger action
Foundation of a drought mitigation plan
Vulnerability assessment Who and what is at risk and why?
Mitigation and response actions Actions/programs that reduce risk and impacts and enhance recovery
Most processes and plans in the past have primarily focused on monitoring and response...

The Importance of Drought Early Warning and Information
Systems (DEWIS)
Allows for early drought detection Improves response (proactive) Data and tools for decision support “Triggers” actions within a drought plan A critical mitigation action Foundation of a drought plan
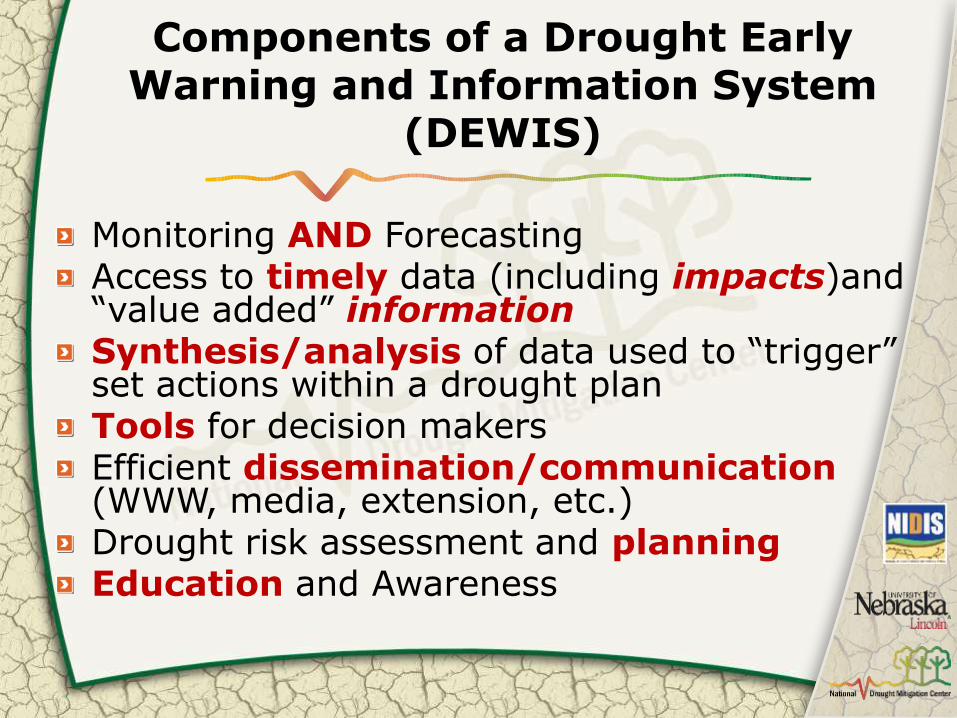
Components of a Drought Early Warning and Information System
(DEWIS)
Monitoring AND Forecasting Access to timely data (including impacts)and “value added” information Synthesis/analysis of data used to “trigger” set actions within a drought plan Tools for decision makers Efficient dissemination/communication (WWW, media, extension, etc.) Drought risk assessment and planning Education and Awareness
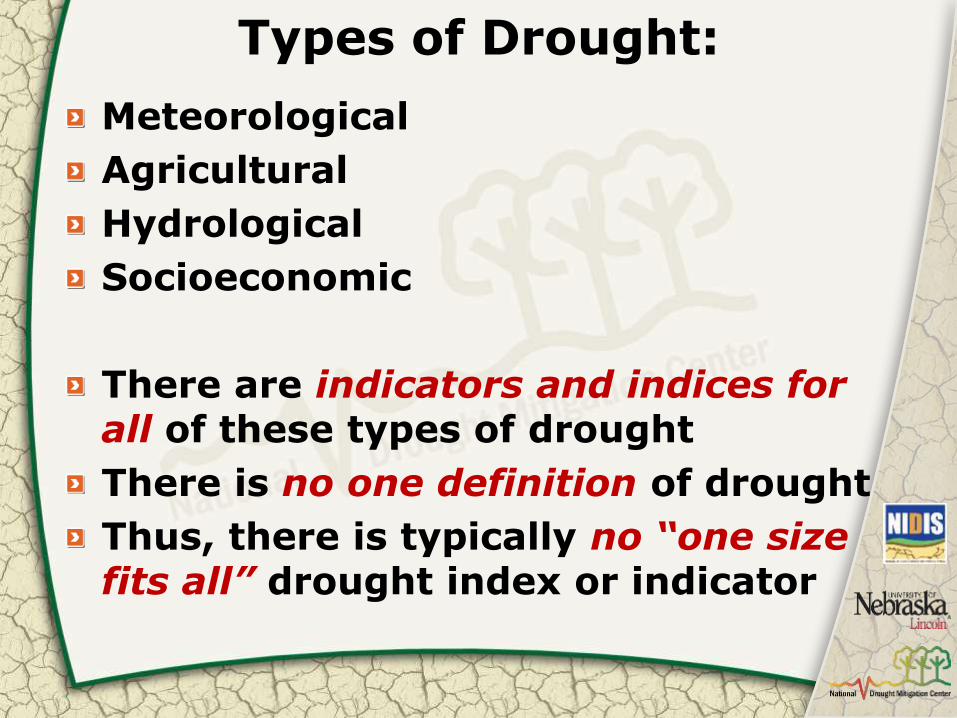
Types of Drought:
Meteorological
Agricultural
Hydrological
Socioeconomic
There are indicators and indices for all of these types of drought
There is no one definition of drought
Thus, there is typically no “one size fits all” drought index or indicator
Spatial Extent
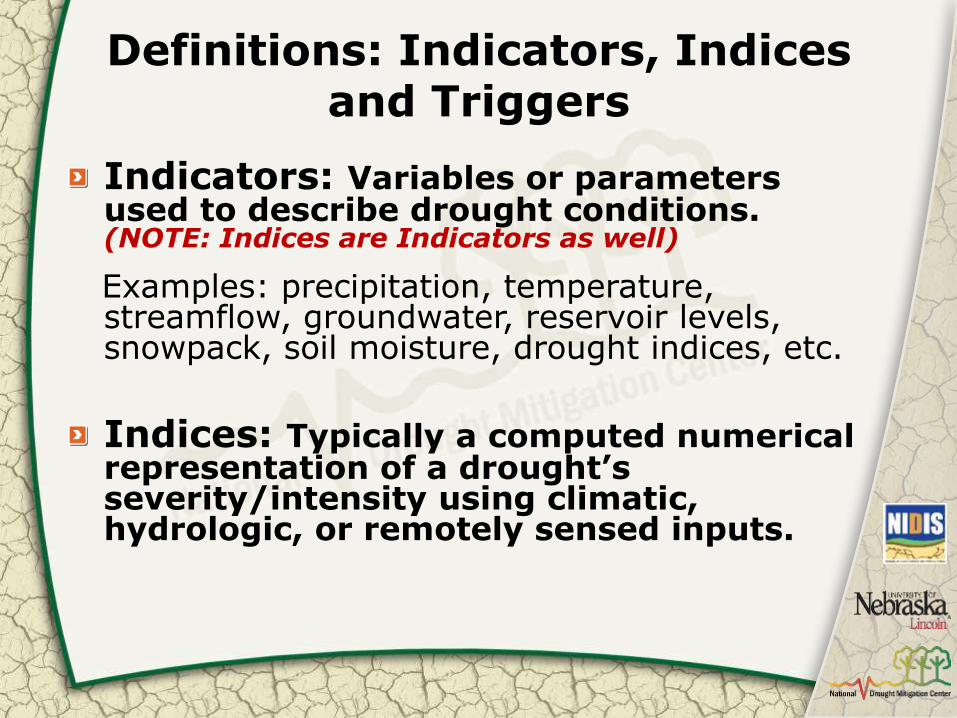
Definitions: Indicators, Indices and Triggers
Indicators: Variables or parameters used to describe drought conditions. (NOTE: Indices are Indicators as well)
Examples: precipitation, temperature, streamflow, groundwater, reservoir levels, snowpack, soil moisture, drought indices, etc.
Indices: Typically a computed numerical representation of a drought’s severity/intensity using climatic, hydrologic, or remotely sensed inputs.
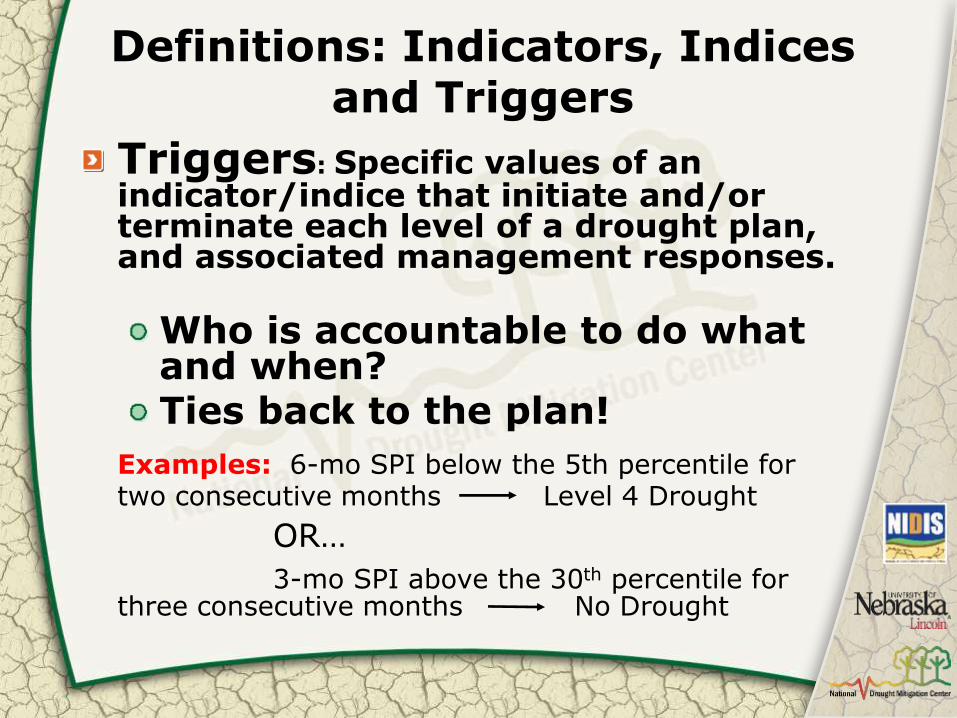
Definitions: Indicators, Indices and Triggers
Triggers: Specific values of an indicator/indice that initiate and/or terminate each level of a drought plan, and associated management responses.
Who is accountable to do what and when? Ties back to the plan!
Examples: 6-mo SPI below the 5th percentile for two consecutive months Level 4 Drought
OR…
3-mo SPI above the 30th percentile for three consecutive months No Drought
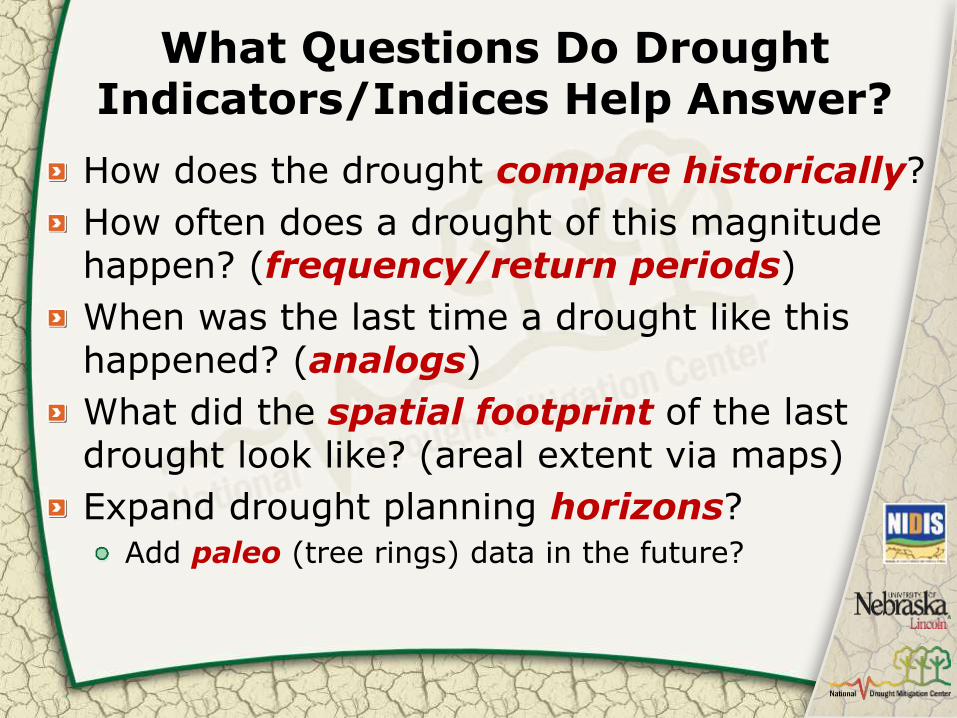
What Questions Do Drought Indicators/Indices Help Answer?
How does the drought compare historically?
How often does a drought of this magnitude happen? (frequency/return periods)
When was the last time a drought like this happened? (analogs)
What did the spatial footprint of the last drought look like? (areal extent via maps)
Expand drought planning horizons? Add paleo (tree rings) data in the future?
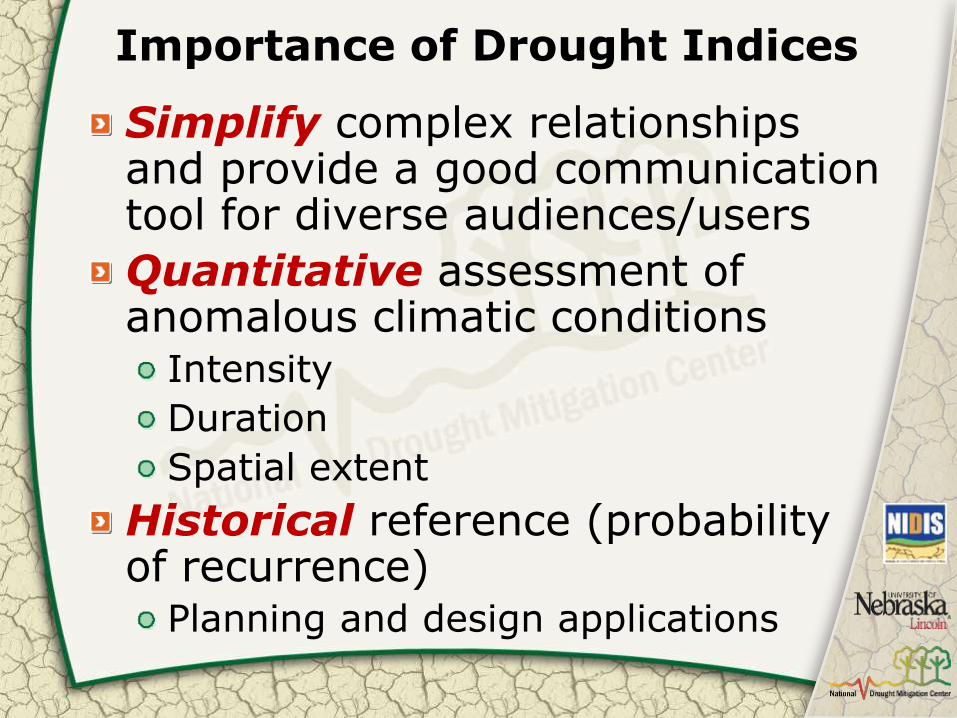
Importance of Drought Indices
Simplify complex relationships and provide a good communication tool for diverse audiences/users
Quantitative assessment of anomalous climatic conditions
Intensity
Duration
Spatial extent
Historical reference (probability of recurrence)
Planning and design applications
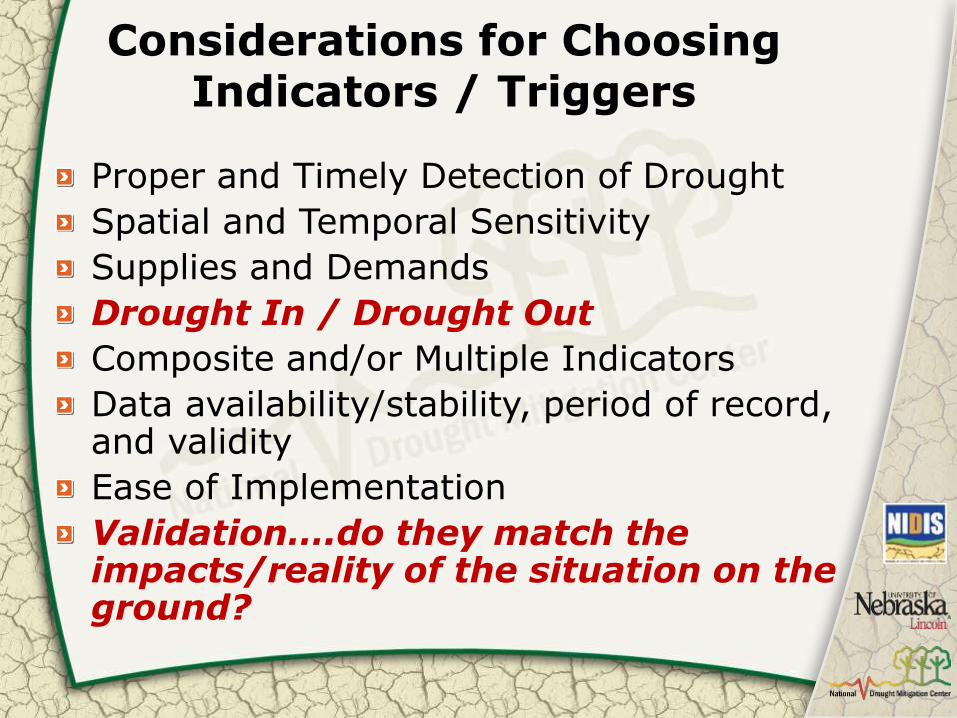
Considerations for Choosing Indicators / Triggers
Proper and Timely Detection of Drought
Spatial and Temporal Sensitivity
Supplies and Demands
Drought In / Drought Out
Composite and/or Multiple Indicators
Data availability/stability, period of record, and validity
Ease of Implementation
Validation….do they match the impacts/reality of the situation on the ground?
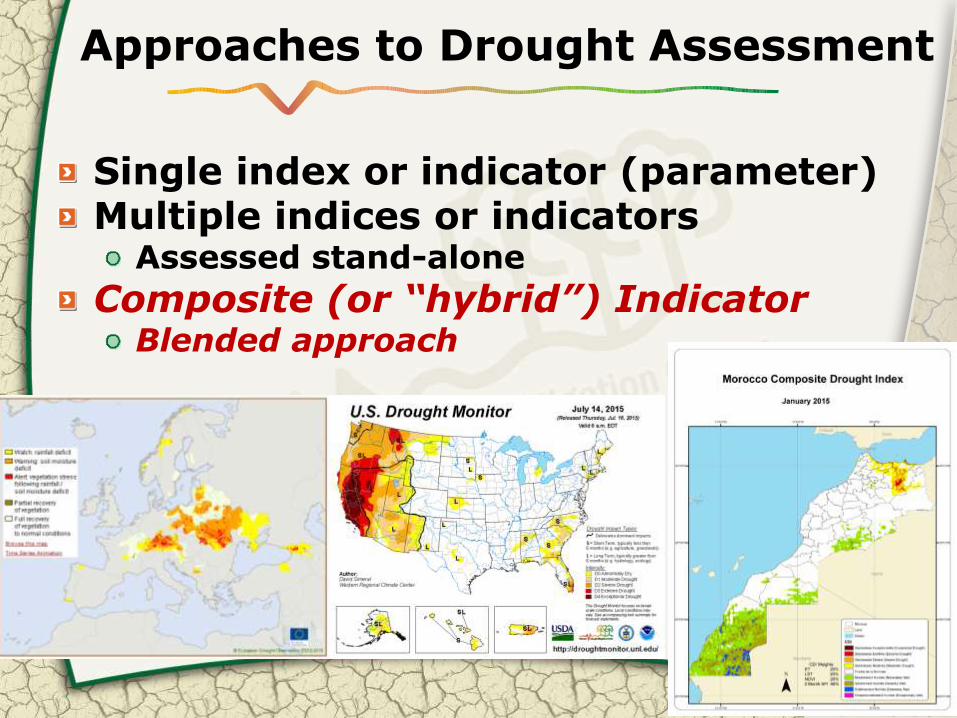
Approaches to Drought Assessment
Single index or indicator (parameter) Multiple indices or indicators
Assessed stand-alone
Composite (or “hybrid”) Indicator Blended approach

http://www.droughtmanagement.info/
The purpose of this handbook is to identify some of the most commonly used physically-based drought indicators/indices that are being applied across drought-prone regions with the goal of advancing monitoring, early warning and information delivery systems in support of risk-based drought management policies and preparedness plans.
Monitoring Drought: A Handbook
of Indicators and Indices

The guide is intended to be used by the general drought practitioner (e.g. Meteorological/Hydrological service, Ministry level, resource managers and other decision makers at various levels) and was intended to serve as a potential starting point to determine which indicators/indices are available and being put into practice around the world.
Monitoring Drought: A Handbook
of Indicators and Indices
The indicators and indices covered are aimed at the physical nature of drought and do not cover overlap issues such as climate change, vulnerability assessment, risk, aridity, desertification or water scarcity, all of which play a role in how drought needs to be monitored and addressed.
Monitoring Drought: A Handbook of
Indicators and Indices
The indicator/index types are grouped into the following classifications: which directly correspond to the meteorological, agricultural and hydrological drought types: 1) temperature and/or precipitation; 2) soil moisture; 3) hydrological; 4) satellite and vegetation; and 5) composite, modeled or experimental
Monitoring Drought: A Handbook of
Indicators and Indices

For the “ease of use” classification, a “traffic light” approach for each indicator/index was adopted where:
Green: Indices are considered to be green if one or more of the following criteria apply:
Code or program to run the index is readily and freely available
Does not require daily data
Does allow for missing data
Output of the index is already being produced operationally and is made available on the web
Monitoring Drought: A Handbook of
Indicators and Indices
Note: While a “green” ease of use classification may imply that the indicator/indice may be the easiest to obtain or use, it does not mean it is the best index/indicator for any given region or locale. This decision as to which indicator(s)/indices to use has to be determined by the user and depends on the given application(s).
Monitoring Drought: A Handbook of
Indicators and Indices

Yellow: Indices are considered to be yellow if one or more of the following criteria apply:
Multiple variables or inputs needed for calculations
Code or program to run the index is not available in a public domain
May only need a single input or variable, but no code is available
The complexity of the calculations needed to produce the index is minimal
Monitoring Drought: A Handbook of
Indicators and Indices
Red: Indices are considered to be red if one or more of the following criteria apply:
Would need to develop code to calculate the index based upon the methodology in the literature
The index or derivative products are not readily available
An obscure index which is not widely used, but may be applicable to some
Any index which contains modeled input or is part of the calculations
Monitoring Drought: A Handbook
of Indicators and Indices
Meteorological Based Page
Ease of
Use Inputs
Required Additional Information
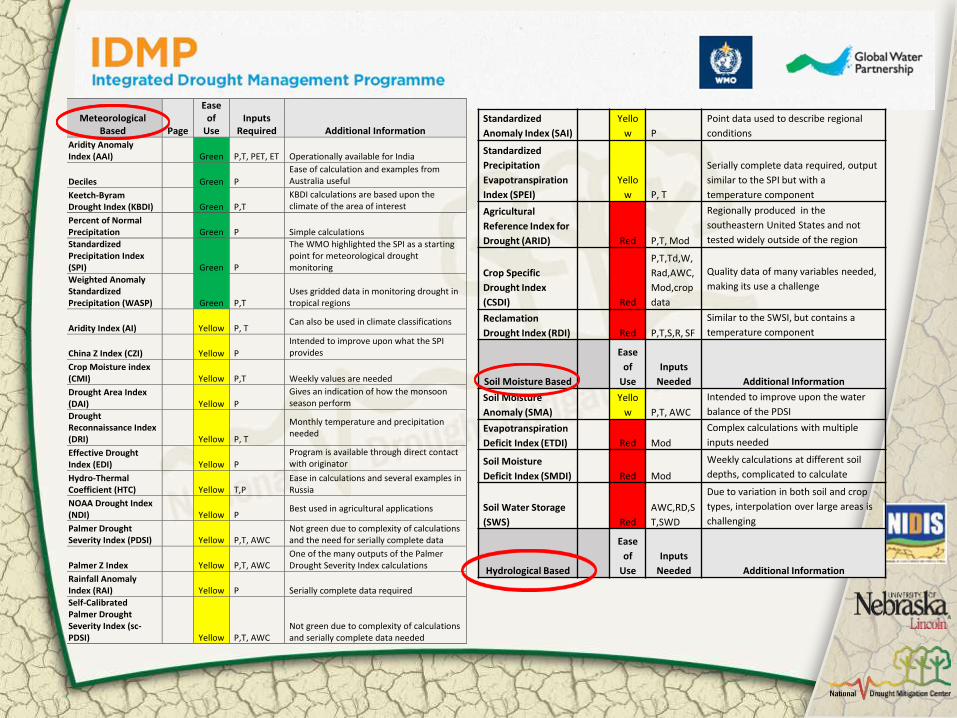
Aridity Anomaly Index (AAI) Green P,T, PET, ET Operationally available for India
Deciles Green P
Ease of calculation and examples from Australia useful
Keetch-Byram Drought Index (KBDI) Green P,T
KBDI calculations are based upon the climate of the area of interest
Percent of Normal Precipitation Green P Simple calculations
Standardized Precipitation Index (SPI) Green P
The WMO highlighted the SPI as a starting point for meteorological drought monitoring
Weighted Anomaly Standardized Precipitation (WASP) Green P,T
Uses gridded data in monitoring drought in tropical regions
Aridity Index (AI) Yellow P, T Can also be used in climate classifications
China Z Index (CZI) Yellow P
Intended to improve upon what the SPI provides
Crop Moisture index (CMI) Yellow P,T Weekly values are needed
Drought Area Index (DAI) Yellow P
Gives an indication of how the monsoon season perform
Drought Reconnaissance Index (DRI) Yellow P, T
Monthly temperature and precipitation needed
Effective Drought Index (EDI) Yellow P
Program is available through direct contact with originator
Hydro-Thermal Coefficient (HTC) Yellow T,P
Ease in calculations and several examples in Russia
NOAA Drought Index (NDI) Yellow P
Best used in agricultural applications
Palmer Drought Severity Index (PDSI) Yellow P,T, AWC
Not green due to complexity of calculations and the need for serially complete data
Palmer Z Index Yellow P,T, AWC One of the many outputs of the Palmer Drought Severity Index calculations
Rainfall Anomaly Index (RAI) Yellow P Serially complete data required
Self-Calibrated Palmer Drought Severity Index (sc-PDSI) Yellow P,T, AWC
Not green due to complexity of calculations and serially complete data needed
Standardized
Anomaly Index (SAI)
Yello
w P
Point data used to describe regional
conditions
Standardized
Precipitation
Evapotranspiration
Index (SPEI)
Yello
w P, T
Serially complete data required, output
similar to the SPI but with a
temperature component
Agricultural
Reference Index for
Drought (ARID) Red P,T, Mod
Regionally produced in the
southeastern United States and not
tested widely outside of the region
Crop Specific
Drought Index
(CSDI) Red
P,T,Td,W,
Rad,AWC,
Mod,crop
data
Quality data of many variables needed,
making its use a challenge
Reclamation
Drought Index (RDI) Red P,T,S,R, SF
Similar to the SWSI, but contains a
temperature component
Soil Moisture Based
Ease
of
Use
Inputs
Needed Additional Information
Soil Moisture
Anomaly (SMA)
Yello
w P,T, AWC
Intended to improve upon the water
balance of the PDSI
Evapotranspiration
Deficit Index (ETDI) Red Mod
Complex calculations with multiple
inputs needed
Soil Moisture
Deficit Index (SMDI) Red Mod
Weekly calculations at different soil
depths, complicated to calculate
Soil Water Storage
(SWS) Red
AWC,RD,S
T,SWD
Due to variation in both soil and crop
types, interpolation over large areas is
challenging
Hydrological Based
Ease
of
Use
Inputs
Needed Additional Information
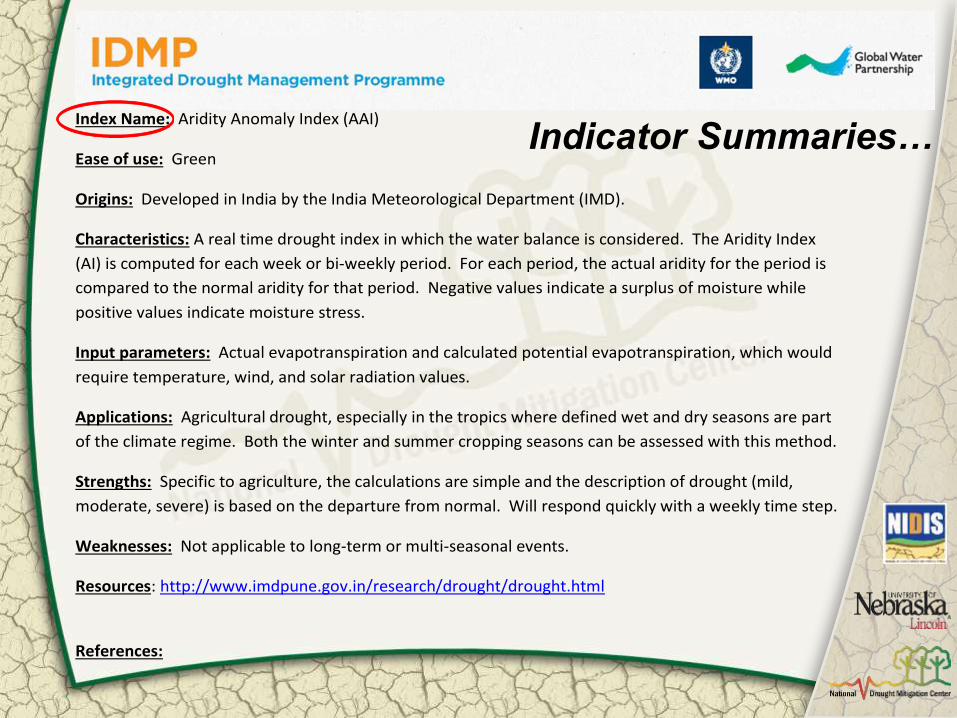
Index Name: Aridity Anomaly Index (AAI)
Ease of use: Green
Origins: Developed in India by the India Meteorological Department (IMD).
Characteristics: A real time drought index in which the water balance is considered. The Aridity Index
(AI) is computed for each week or bi-weekly period. For each period, the actual aridity for the period is
compared to the normal aridity for that period. Negative values indicate a surplus of moisture while
positive values indicate moisture stress.
Input parameters: Actual evapotranspiration and calculated potential evapotranspiration, which would
require temperature, wind, and solar radiation values.
Applications: Agricultural drought, especially in the tropics where defined wet and dry seasons are part
of the climate regime. Both the winter and summer cropping seasons can be assessed with this method.
Strengths: Specific to agriculture, the calculations are simple and the description of drought (mild,
moderate, severe) is based on the departure from normal. Will respond quickly with a weekly time step.
Weaknesses: Not applicable to long-term or multi-seasonal events.
Resources: http://www.imdpune.gov.in/research/drought/drought.html
References:
Indicator Summaries…
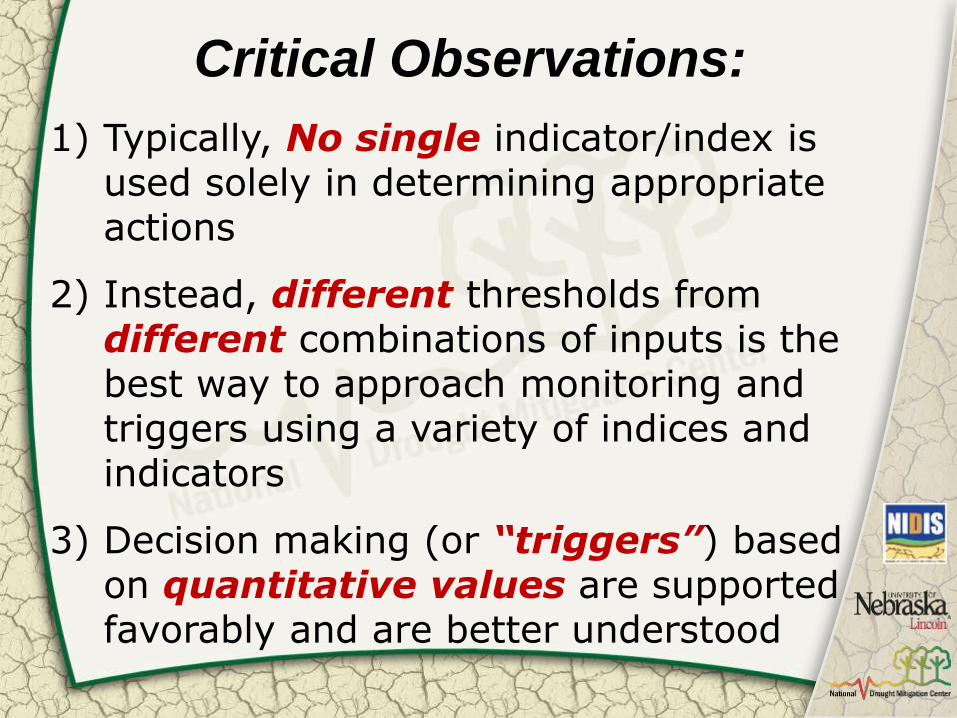
1) Typically, No single indicator/index is used solely in determining appropriate actions
2) Instead, different thresholds from different combinations of inputs is the best way to approach monitoring and triggers using a variety of indices and indicators
3) Decision making (or “triggers”) based on quantitative values are supported favorably and are better understood
Critical Observations:
Lessons Learned
Monitoring is the foundation of risk management planning
Trigger for who does what and when!
One can not manage what is not monitored….and you can’t monitor what you don’t measure!

Mark Svoboda [email protected]
402-472-8238
http:/drought.unl.edu
Questions?
Photo Credit: Daniel Griffin