Overview - Home | ACMA/media/Diversity Localism and... · Web viewRegional Australians’ access to...
45
Regional Australians’ access to local content Community research MAY 2017
Transcript of Overview - Home | ACMA/media/Diversity Localism and... · Web viewRegional Australians’ access to...

Regional Australians’ access to local contentCommunity research MAY 2017

CanberraRed Building Benjamin OfficesChan Street Belconnen ACT
PO Box 78Belconnen ACT 2616
T +61 2 6219 5555F +61 2 6219 5353
MelbourneLevel 32 Melbourne Central Tower360 Elizabeth Street Melbourne VIC
PO Box 13112Law Courts Melbourne VIC 8010
T +61 3 9963 6800F +61 3 9963 6899
SydneyLevel 5 The Bay Centre65 Pirrama Road Pyrmont NSW
PO Box Q500Queen Victoria Building NSW 1230
T +61 2 9334 7700 or 1800 226 667F +61 2 9334 7799
Copyright notice
http://creativecommons.org/licenses/by/3.0/au/
With the exception of coats of arms, logos, emblems, images, other third-party material or devices protected by a trademark, this content is licensed under the Creative Commons Australia Attribution 3.0 Licence.
We request attribution as: © Commonwealth of Australia (Australian Communications and Media Authority) 2017.
All other rights are reserved.
The Australian Communications and Media Authority has undertaken reasonable enquiries to identify material owned by third parties and secure permission for its reproduction. Permission may need to be obtained from third parties to re-use their material.
Written enquiries may be sent to:
Manager, Editorial and DesignPO Box 13112Law CourtsMelbourne VIC 8010Tel: 03 9963 6968Email: [email protected]

OverviewBackground 2Context 2
ACMA research programresearchacma 3About the research 3Methodology 4
Key findingsAccess to local content 5Consumption of local news 12Preferred media sources for local content 19Using online media to access local content 22Reliability and trust in local news 25Descriptions of local area 28
Glossary
Appendix A—Detailed findings
acma | iv

OverviewRegional Australians’ access to local content—Community research (Community research report) examines consumer awareness of, use of and preferences for accessing local content and local news, as well as how important they perceive this content to be. It forms part of the Local content in regional Australia—2017 report (2017 report).
Broadly, the research shows that access to local content and local news is important to the vast majority of regional Australians. Over half (54 per cent) consider access to local information and local content very important. Regional Australians are provided with local content and local news from a variety of sources and the majority are satisfied with the overall quality of local news.
Traditional media is the most identified source of local content and local news in regional Australia, particularly commercial free-to-air television (TV), commercial radio and local print newspapers. TV and local print newspapers are also the most preferred source for accessing local news, local sport and information about community events for the majority of regional Australians. The only exception is a strong preference for using websites to access information about local weather.
In terms of frequency of use, 83 per cent of regional Australians who are aware of the sources of local content in their local area use social media to access local content at least once a week. This is greater than TV (80 per cent) and local print newspapers (71 per cent). The general use of online media to access local news has also significantly increased, with 18 per cent of regional Australians using social media to access local news (seven per cent in 2013) and 26 per cent using websites (17 per cent in 2013).
Trust in social media as a source of local news, however, is low relative to online and traditional platforms. TV is the most trusted source for local news (21 per cent), followed by the local print newspaper (19 per cent) and local ABC radio (15 per cent). Websites (nine per cent) are considered more than twice as trustworthy as social media (four per cent).
Social media is considered a reliable medium for breaking local news (14 per cent, equal with local ABC radio), although TV is considered the most reliable medium for breaking local news (24 per cent).
Age also appears to be a significant factor affecting regional Australians’ experience with local content, including local news. Younger regional Australians (aged 18 to 24) are less likely than other regional Australians to identify traditional media platforms as sources of local content, while older regional Australians (over 65) are more likely. Similarly, younger regional Australians are more likely than other regional Australians to use social media and websites to access local content and local news, while older regional Australians are less likely. Finally, older regional Australians are also more likely than other regional Australians to identify and use traditional media sources of local content, and more likely to be satisfied with the overall quality of local news.
Regional Australians in ‘TV local content obligation areas’ are significantly more likely than those in non-obligation areas to be satisfied with the overall amount of local news (particularly local news presenter read-outs and local news footage on TV) and to have access to all the local content they would like. These findings suggest the local content requirements on free-to-air TV may play an important role in giving regional Australians adequate levels of local content and local news.
acma | 1

BackgroundThe Community research report follows on from the community research undertaken by the ACMA in 2013. The 2013 report was compiled as part of the local content investigation undertaken by the ACMA in 2013 (2013 local content investigation), which examined regional Australians’ access and attitudes to local content.
Findings from the 2017 report will help the ACMA to undertake its statutory responsibilities for local content.
ContextIn recent years, regional media has been subject to several changes. These include economic and technological changes as well as developments affecting the entire industry.
Technological changes—new forms of news and entertainmentTechnological changes are creating economic and demographic opportunities and challenges for regional media. Principal among these is the continued rise of the internet as a platform for the provision of regional media services. Online platforms are challenging traditional funding models for print media and providing new competition for TV services. This is both through the availability of online audio-visual services such as streaming video on demand (SVOD) services (for example, Netflix and Stan) and catch-up television, which can allow audiences to watch Australian free-to-air TV from metropolitan broadcasters and bypass local TV services entirely.
Changes to local media services in regional AustraliaSeveral regional media operators have centralised, reduced or ceased local news services to the extent permitted under the regulatory framework established by the Broadcasting Services Act 1992 (the BSA). For example, Fairfax has undertaken a number of staffing restructures for regional newspapers in New South Wales, Victoria and South Australia. WIN also stopped providing local news bulletins in Mildura and Mackay in May 2015.
In some cases, regional media operators have expanded the provision of local content and local news services. For example, Seven Queensland began local bulletins in Toowoomba (2015) and the Gold Coast (2016).
In February 2017, SCA and the Nine Network began a rollout of 15 local TV news bulletins in regional TV markets of Queensland, Southern New South Wales and Victoria. The local TV news bulletins will be broadcast each weeknight in 15 of the 19 regional sub-markets and provide one hour-long news service, combining local news, sport and weather with Nine’s national and international news.1
In March 2017, the ABC also announced a $15 million increase to regional funding, including the creation of up to 80 new positions in regional areas within the next 18 months.
1 Southern Cross Austereo, ‘Nine news to launch 15 regional news bulletins’, media release, 7 November 2016.
2 | acma
ACMA research programresearchacmaOur research program—researchacma—underpins the ACMA’s work and decisions as an evidence-informed regulator. It contributes to the ACMA’s strategic policy development, regulatory reviews and investigations, and helps the ACMA better understand the agency’s role in fulfilling its strategic intent to make media and communications work for all Australians.
researchacma has five broad areas of interest: > market developments > media content and culture > social and economic participation> citizen and consumer safeguards > regulatory best practice and development.
This research contributes to the ACMA’s media content and culture research theme.
About the researchIn August 2016, the ACMA commissioned McNair Ingenuity Research to conduct quantitative research with regional Australians to determine changes in consumer awareness, use of, perceived importance and preferences for accessing local content and local news since the previous research conducted in 2013.
This research focused on exploring the following:> satisfaction with the provision of local content and local news> perceived importance of local content> awareness and use of sources to access local content> preferred sources for accessing local content> preferred format type and delivery platform for local news> preference for general or local news> levels of trust and confidence in different sources of local news> how regional Australians define their ‘local area’.
This report is one part of broader research conducted to explore changes in access to regional local content. Also available are:> Local content in regional Australia—2017 report (2017 report)—a consolidated
report that incorporates key findings from all pieces of research.> Regional Australian television news—Audiences across regional evening news
services, 2003–16 (Regional TAM report)—an analysis of free-to-air television (TV) audience and ratings data in regional Australia from 2003 to 30 June 2016.
> Availability of local content in regional Australia—Case studies (Case study report)—updated case studies of how local content and local news is provided in 11 regional markets.
These reports are available on the researchacma index on the ACMA website.
acma | 3

MethodologyIn 2016, a total of n=2,457 computer-assisted telephone interviews (CATI) were conducted with a sample of regional Australians aged 18 years and older who did not have access to metropolitan television. Detailed quotas were set based on Australian Bureau of Statistics (ABS) estimated residential population (ERP) June 2015 data in order to ensure the sample was representative by age, gender and location. For regional NSW/ACT, VIC, QLD, TAS and NT, sampling was based on ABS Statistical Area Level 4 (Australian Statistical Geography Standard, July 2011); for regional SA and WA, sampling was based on ABS Statistical Area Level 3 (Australian Statistical Geography Standard July 2011). A total of 55 regional areas were included in the sample. The sample was also boosted by 350 interviews in each of SA and WA to ensure there was adequate representation of respondents who lived in those states.
Households were recruited through random-digit dialling using a dual-frame sample design, and included those who live in a household with a fixed-line telephone (50 per cent) and those who have a mobile phone (50 per cent). A random selection procedure recruited eligible participants within households for the landline sample (last birthday). The mobile-only sample interviewed the main user of the mobile phone. The fieldwork was conducted between 26 September and 19 October 2016.
The weighting strategy included firstly calculating weights to account for the overlapping sample design (landline and mobile) and the relative chance of selection by area. Post-stratification weights were then applied using RIM weighing to adjust for: (1) different response rates by age and gender (as defined by the most recent ABS population figures) within state groupings of the 55 regional areas; and (2) different response rates across the 55 regions.
Statistically significant changes are identified with red and green as follows:
Statistically significant increase since 2013
Statistically significant decrease since 2013
The same profile is provided in Appendix A (Table 4). For details on the 2013 research methodology, refer to Attachment B to the 2013 report, Regional Australians’ access to local content—Community research.
4 | acma
Key findingsThe following section presents results from the 2016 Community research report. The findings examine the following topics:> regional Australians’ access to local content> regional Australians’ consumption of local news> the changing media used to access to local content> the changing definitions of the meaning of ‘local area’.
Where appropriate, the findings include comparisons with the findings of the 2013 Community research report. This provides an opportunity to assess how regional Australians’ opinions may have changed over time.
It should be noted that the 2016 and 2013 surveys differ in the following ways:> the 2013 survey was included as part of an omnibus survey conducted by
Newspoll, whereas the 2016 survey was a standalone questionnaire> the 2013 survey was based on a landline Random Digit Dialling (RDD) sample,
whereas the 2016 survey included mobile-only respondents as well> the question order of the 2016 survey was varied slightly to accommodate the
inclusion of additional questions.
These methodological differences make it difficult to confidently compare results between the years at a sub-group level (age, gender and region). Consequently, comparisons with 2013, where relevant, have been made at the total level. Sub-group differences in 2016 alone, however, are reported where significant.
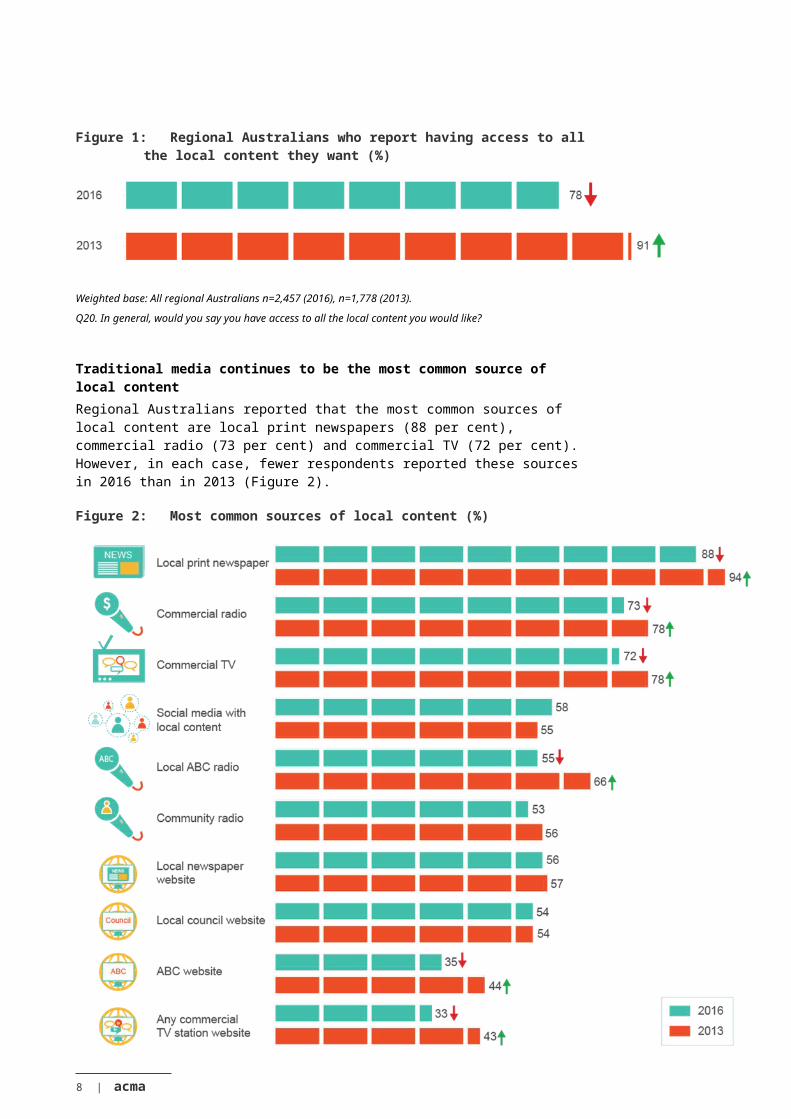
Access to local content Fewer people have access to all the local content they would like The majority (78 per cent) of regional Australians reported they have access to all the local content they would like. This result is significantly lower (by 13 percentage points) than the 91 per cent that reported having access to all the local content they would like in 2013 (Figure 1).
Regional Australians in TV local content obligation areas (79 per cent), however, are significantly more likely than those in non-obligation areas (71 per cent) to have access to all the local content they want.
Figure 1: Regional Australians who report having access to all the local content they want (%)
Weighted base: All regional Australians n=2,457 (2016), n=1,778 (2013).
Q20. In general, would you say you have access to all the local content you would like?
acma | 5

Traditional media continues to be the most common source of local contentRegional Australians reported that the most common sources of local content are local print newspapers (88 per cent), commercial radio (73 per cent) and commercial TV (72 per cent). However, in each case, fewer respondents reported these sources in 2016 than in 2013 (Figure 2).
Figure 2: Most common sources of local content (%)
Weighted base: All regional Australians n=2,457 (2016), n=1,778 (2013).
Q8. Which of these sources provide local content in your local area?
6 | acma

Older regional Australians are also significantly more likely than younger regional Australians to identify traditional media sources, including commercial TV and local ABC radio, as sources of local content (Figure 3).
Figure 3: Most common sources of local content by age (%)
Weighted base: All regional Australians (2016), 18–24 (n=273), 25–39 (n=662), 40–54 (n=561), 55–64 (n=411), 65+ (n=550).
Q8. Which of these sources provide local content in your local area?
acma | 7
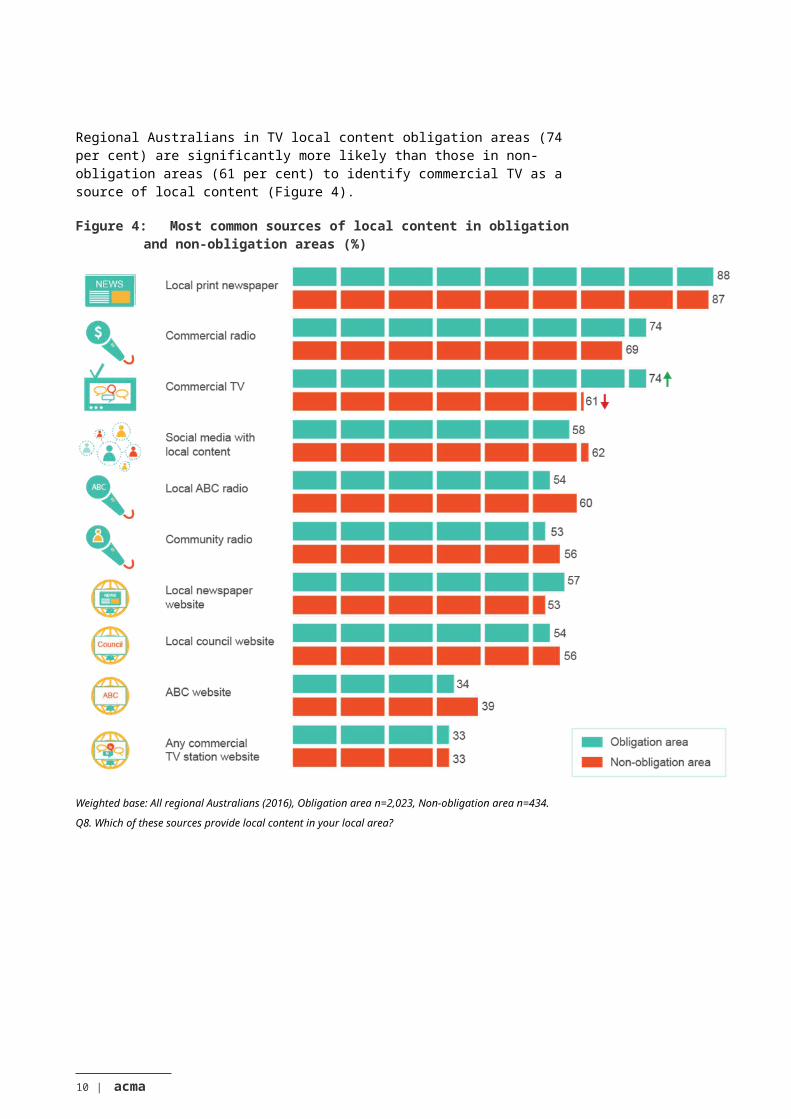
Regional Australians in TV local content obligation areas (74 per cent) are significantly more likely than those in non-obligation areas (61 per cent) to identify commercial TV as a source of local content (Figure 4).
Figure 4: Most common sources of local content in obligation and non-obligation areas (%)
Weighted base: All regional Australians (2016), Obligation area n=2,023, Non-obligation area n=434.
Q8. Which of these sources provide local content in your local area?
8 | acma

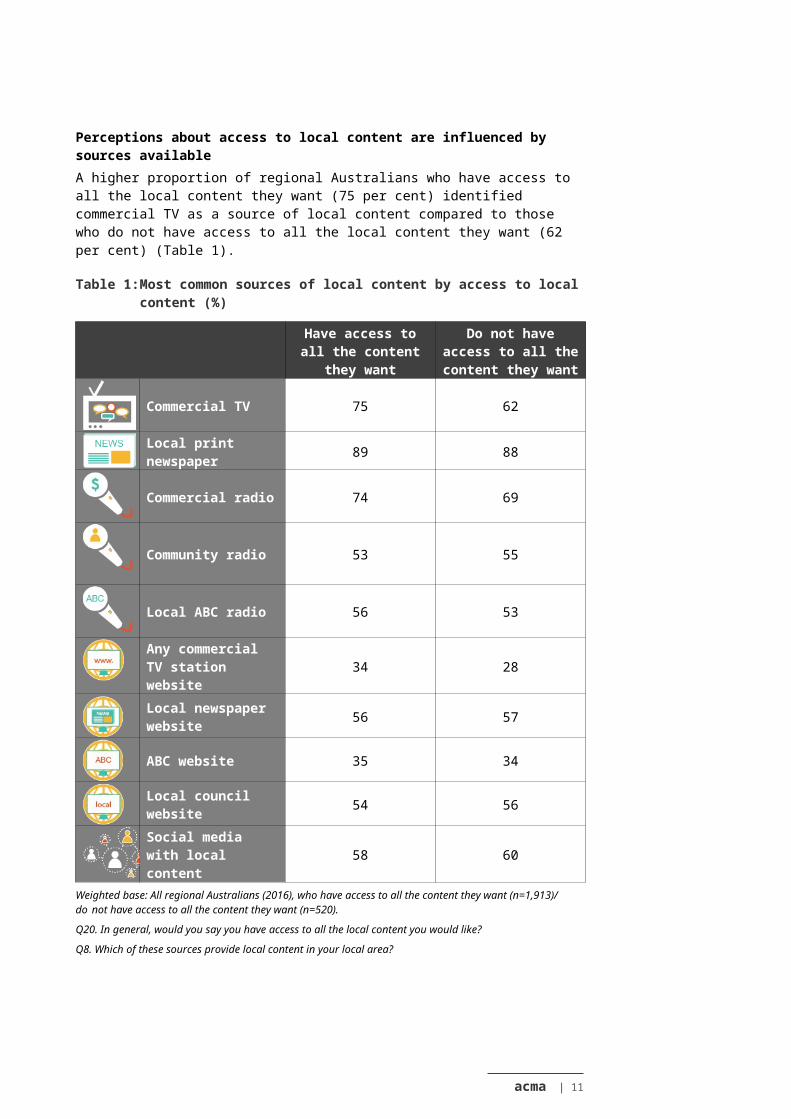
Perceptions about access to local content are influenced by sources availableA higher proportion of regional Australians who have access to all the local content they want (75 per cent) identified commercial TV as a source of local content compared to those who do not have access to all the local content they want (62 per cent) (Table 1).
Table 1: Most common sources of local content by access to local content (%)
Have access to all the content they
want
Do not have access to all the content
they want
Commercial TV 75 62
Local print newspaper 89 88
Commercial radio 74 69
Community radio 53 55
Local ABC radio 56 53
Any commercial TV station website 34 28
Local newspaper website 56 57
ABC website 35 34
Local council website 54 56
Social media with local content 58 60
Weighted base: All regional Australians (2016), who have access to all the content they want (n=1,913)/ do not have access to all the content they want (n=520).
Q20. In general, would you say you have access to all the local content you would like?
Q8. Which of these sources provide local content in your local area?
acma | 9
Access to local content is importantMost (89 per cent) regional Australians reported that having access to local information and local content is important to them, while the majority (54 per cent) consider access to local content very important (62 per cent in 2013) (Figure 5).
Figure 5: Importance of access to local content (%)
Weighted base: All regional Australians n=2,457 (2016), n=1,778 (2013).
Q7. And overall, would you say that having access to local information and local content is important or not important to you?
The majority of regional Australians reported personally seeking information about local news (73 per cent) and local community events (66 per cent). Forty per cent reported seeking information about local sport. In each of these cases, the proportion of regional Australians seeking these types of local content was less than in 2013 (Figure 6).
Figure 6: Proportion of regional Australians who seek local content (%)
Weighted base: All regional Australians n=2,457 (2016), n=1,778 (2013).
Q6. Do you personally ever seek information about ...?
10 | acma
The likelihood that regional Australians would seek information about local content is significantly affected by age. Those aged 18–24 are less likely than other regional Australians to seek information about local news (61 per cent) and local community events (50 per cent). Regional Australians aged 25–39 (75 per cent) and 40–54 (73 per cent) are more likely than other regional Australians to seek information about local community events; those aged 40–54 are also more likely than other regional Australians to seek information about local weather (91 per cent), local sport (46 per cent) and local news (79 per cent). Older regional Australians aged over 65 are less likely than other regional Australians to seek information about local weather (75 per cent), local sport (35 per cent) and local community events (56 per cent) (Figure 7).
Figure 7: Seeking local content by age (%)
Weighted base: All regional Australians (2016), 18–24 (n=273), 25–39 (n=662), 40–54 (n=561), 55–64 (n=411), 65+ (n=550).
Q6. Do you personally ever seek information about ...?
acma | 11

Regional Australians who do not have access to all the content they would like are significantly more likely than those who do to seek information about local community events (78 vs 63 per cent) and local news (81 vs 72 per cent) (Figure 8).
Figure 8: Seeking local content by reported access to local content (%)
Weighted base: All regional Australians (2016), who have access to all the content they want (n=1,913)/ don’t have access to all local content they want (n=520).
Q6. Do you personally ever seek information about ...?
Q20. In general, would you say you have access to all the local content you would like?
Consumption of local newsAccess to local news remains importantAccess to local news still remains important to regional Australians—for 51 per cent it is very important and for 35 per cent it is somewhat important (net somewhat important and very important = 86 per cent). Only four per cent of regional Australians reported that having access to local news is not at all important.
Local news is provided by a variety of sourcesRegional Australians reported that local news is provided by a variety of traditional media sources including local print newspapers (90 per cent), commercial TV (74 per cent), commercial radio (72 per cent) and local ABC radio (58 per cent).
Regional Australians in TV local content obligation areas (77 per cent) are significantly more likely than those in non-obligation areas (61 per cent) to access local news through commercial TV (Figure 9).
12 | acma
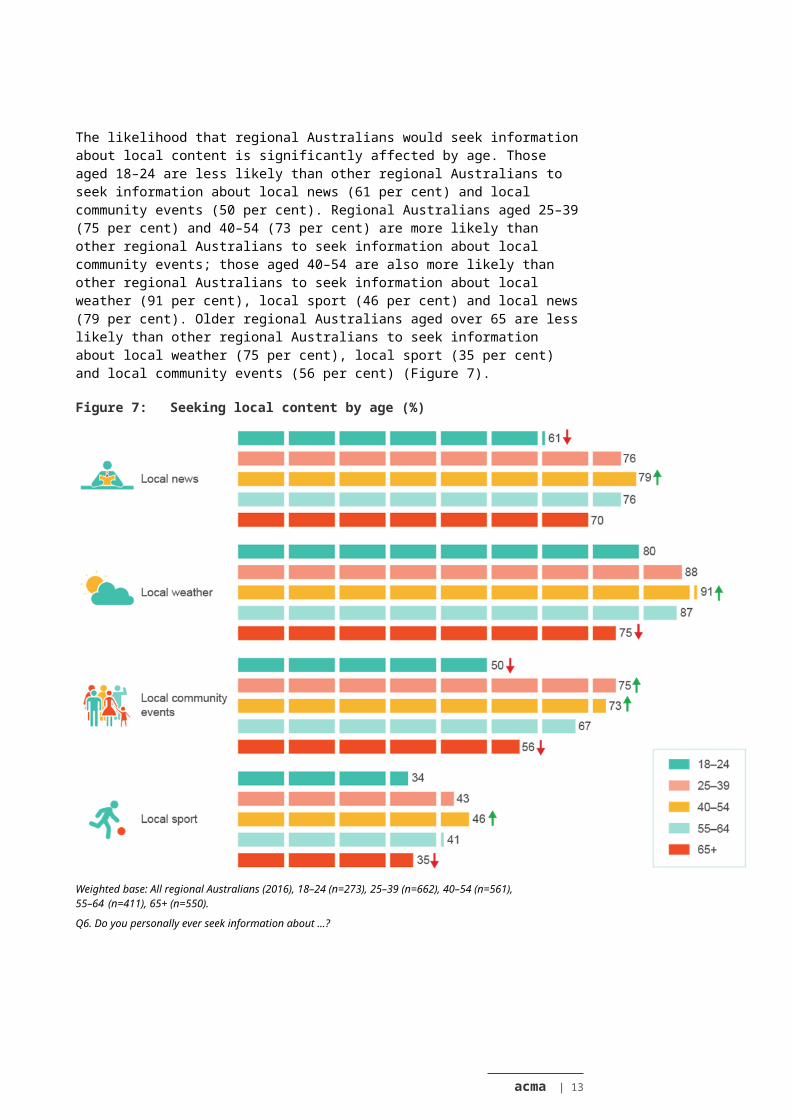
Figure 9: Impact of licence obligation on sources of local news (%)
Weighted base: All regional Australians (2016) n=2,457, Obligation area n=2,023, Non-obligation area n=434
Q14. For each of the following sources please indicate whether or not it provides local news where you live?
acma | 13

Most regional Australians are satisfied with the overall quality of local newsThe majority (87 per cent) of regional Australians are satisfied with the overall quality of local news (Figure 10).
Figure 10: Regional Australians’ satisfaction with aspects of local news (%)
Weighted base: All regional Australians (2016) n=2,457.
Q18. How satisfied overall are you with the quality of the local news available in your local area?
Q19. And how satisfied are you with following aspects of local news available in your local area?
There are differences in satisfaction with aspects of local news coverage between some sub-groups. Males (82 per cent) are significantly less likely than females (89 per cent) to be satisfied with the accuracy of local news. Regional Australians in TV local content obligation areas (84 per cent) are significantly more likely than those in non-obligation areas (76 per cent) to be satisfied with the overall amount and quantity of local news available.
Regional Australians in TV local content obligation areas (73 per cent) are significantly more likely than those in non-obligation areas (63 per cent) to be satisfied with the amount and quantity of television local news presenter read-outs.
Regional Australians in New South Wales (77 per cent) are significantly more likely than other regional Australians to be satisfied with the amount and quantity of local news footage. Those in South Australia (58 per cent) are significantly less likely than other regional Australians to be satisfied with the amount of local news footage. Regional Australians in TV local content obligation areas (75 per cent) are significantly more likely than those in non-obligation areas (58 per cent) to be satisfied with the amount of local news footage (see Table 5 in Appendix A).
Regional Australians who have access to all the local content they would like are significantly more likely to be satisfied with all aspects of local news than those who do not. In particular, fewer than 50 per cent of regional Australians who reported not having access to all the content they would like are satisfied with the amount or quantity of TV local news presenter read outs (49 per cent), and the amount and quantity of TV local news footage (48 per cent) (Figure 11).
14 | acma

Figure 11: Rating of aspects of local news by reported access to local content (%)
Weighted base: All regional Australians (2016) who have access to all the content they want (n=1,913)/ do not have access to all local content they want (n=520).
Q20. In general, would you say you have access to all the local content you would like?
Q18. How satisfied overall are you with the quality of the local news available in your local area?
Q19. And how satisfied are you with following aspects of local news available in your local area?
acma | 15

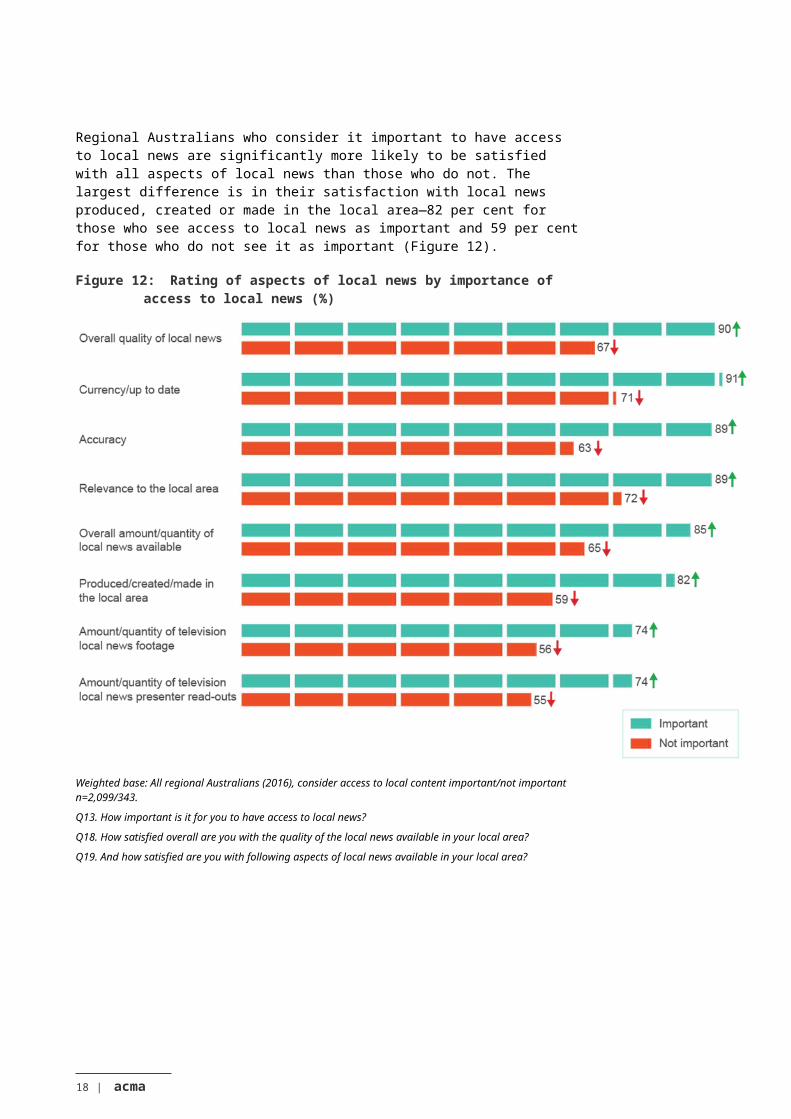
Regional Australians who consider it important to have access to local news are significantly more likely to be satisfied with all aspects of local news than those who do not. The largest difference is in their satisfaction with local news produced, created or made in the local area—82 per cent for those who see access to local news as important and 59 per cent for those who do not see it as important (Figure 12).
Figure 12: Rating of aspects of local news by importance of access to local news (%)
Weighted base: All regional Australians (2016), consider access to local content important/not important n=2,099/343.
Q13. How important is it for you to have access to local news?
Q18. How satisfied overall are you with the quality of the local news available in your local area?
Q19. And how satisfied are you with following aspects of local news available in your local area?
16 | acma

Regional Australians who seek information about local news are significantly more likely to be satisfied with all aspects of local news than those who do not seek information. However, the difference in their satisfaction with the amount of local news presenter read-outs or local news footage was not significant (Figure 13).
Figure 13: Rating of aspects of local news by whether seeks local news (%)
Weighted base: All regional Australians (2016), seek/don’t seek information on local news n=1,805/652.
Q6. Do you personally ever seek information about ...? LOCAL NEWS
Q18. How satisfied overall are you with the quality of the local news available in your local area?
Q19. And how satisfied are you with following aspects of local news available in your local area?
In general, regional Australians who prefer commercial TV as their source of local news are more satisfied with the overall quantity of local news and quality of presenter read-outs, and with the overall quality of local news footage than those who prefer another source. Regional Australians who prefer local print newspapers or commercial radio as their source of local news are more satisfied with the relevance to the local area than those who prefer another source.
acma | 17
Style preferences for local news on commercial televisionThe majority of regional Australians would prefer to receive their local news as one single longer bulletin per day than multiple short regular updates throughout the day (Figure 14).
Figure 14: Preference for receiving local news on TV (%)
Weighted base: All regional Australians (2016) n=2,457.
Q16. Would you prefer to receive your local news on commercial TV as multiple short regular updates throughout the day, or one single longer bulletin per day?
Local footage is an important feature for regional Australians, with the majority preferring shorter but less frequent local filmed footage than longer and more frequent newsreader read-outs (Figure 15).
Figure 15: Preference for style of local news on TV (%)
Weighted base: All regional Australians (2016) n=2,457.
Q17. What is your preference between receiving shorter but less frequent local news content filmed in your local area, versus longer more frequent local news content that only includes the television newsreader presenting read outs?
18 | acma

Preferred media sources for local contentTV and print remain the most popular way to access most local content Commercial TV is regional Australians’ most preferred source for accessing information about local news (34 per cent, down from 39 per cent in 2013), while the local print newspaper is the most preferred source for accessing information about local sport (24 per cent, down from 40 per cent) and local community events (28 per cent, down from 47 per cent). The preferred source for accessing information about local weather is websites, including apps (37 per cent). The Bureau of Meteorology (BoM) is the preferred source for accessing local weather for 17 per cent of regional Australians (12 per cent in 2013).
The proportion of regional Australians who prefer using social media to source local news, local community event information and local sport significantly increased between 2013 and 2016, as did the proportion who prefer websites (including apps), as a source for local news, local community events, local sport and local weather (Table 2).
Compared to other regional Australians, the preference for social media as a source of local news is significantly higher among those aged 18–24 (19 per cent) and 25–39 (17 per cent), and significantly lower among those aged 55–64 (zero per cent) and over 65 (one per cent). Those with internet access at home are significantly more likely than those without to prefer social media as a source of local news. See Table 6 in Appendix A.
Table 2: Preferred media sources for local content (%)Year Local
newsLocal community
eventsLocal sport
Local weather
TV2016 34 9 16 24
2013 39 11 19 31
Weather channel/Pay TV
2016 n/a n/a n/a 2
2013 n/a n/a n/a 3
Local print newspaper
2016 21 28 24 32013 30 47 40 7
Commercial radio
2016 6 4 3 3
2013 5 4 3 4
Community radio
2016 2 3 1 1
2013 2 3 2 2
Local ABC radio2016 7 5 3 5
2013 7 4 3 6
Any website* (incl. apps)
2016 15 18 12 37
2013 11 13 9 26
Social media 2016 9 18 9 4
2013 3 9 4 4
Weighted base: All regional Australians n=2,457 (2016) n=1,778 (2013).Q11. For each of the following types of local information or content, imagine you could use any source to get this content. Would your most preferred source be TV, radio, local print newspaper, the internet or somewhere else? n/a= not asked *excludes BOM.
acma | 19

The main reasons for the chosen preference of regional Australians depends on the source. For example, ease of access and convenience are the main reasons for preferring commercial TV (47 per cent and 45 per cent respectively), local print newspapers (33 per cent and 35 per cent respectively) and social media (67 per cent and 63 per cent respectively) as a source of local news. The main reason for preferring local ABC radio as a source of local news is that it provides the best coverage and detail (52 per cent) (Table 3).
Table 3: Reasons given for the preferred choice for accessing local news (%)
Commercial TV
Local print newspaper
Social media
Local ABC radio
Easy to access 47 33 67 36Convenience 45 35 63 40Best coverage/detail 21 27 11 52Habit 17 16 9 14Comfort 12 8 2 5Other reason 11 18 16 23Covers what I am interested in
10 19 21 25
Up-to-date 10 7 21 23Best quality 6 7 2 30Free 5 5 8 11Don’t like other options 2 2 1 1Don’t know 1 2 0 0
Weighted base: All regional Australians prefer media for LOCAL NEWS (Q11. For each of the following types of local information or content, imagine you could use any source to get this content. Would your most preferred source be) (2016), Commercial TV (n=840), Local print newspaper (n=518), Social media (n=214), Local ABC (n=172)
Q12. For what particular reasons is this your preferred source for this type of local content? (LOCAL NEWS)
Older regional Australians prefer traditional platforms for sourcing local newsAs a source of local news, regional Australians aged over 40 are significantly more likely than those aged 18–39 to prefer traditional platforms—the local print newspaper, commercial radio and local ABC radio.
However, regional Australians aged 18–39 are more than twice as likely as those aged over 40 to prefer local newspaper websites and other websites as a source for local news. The 18–39 group is also more than five times (18 per cent) as likely as the over 40 group (three per cent) to prefer social media as a source for local news (Figure 16).
20 | acma
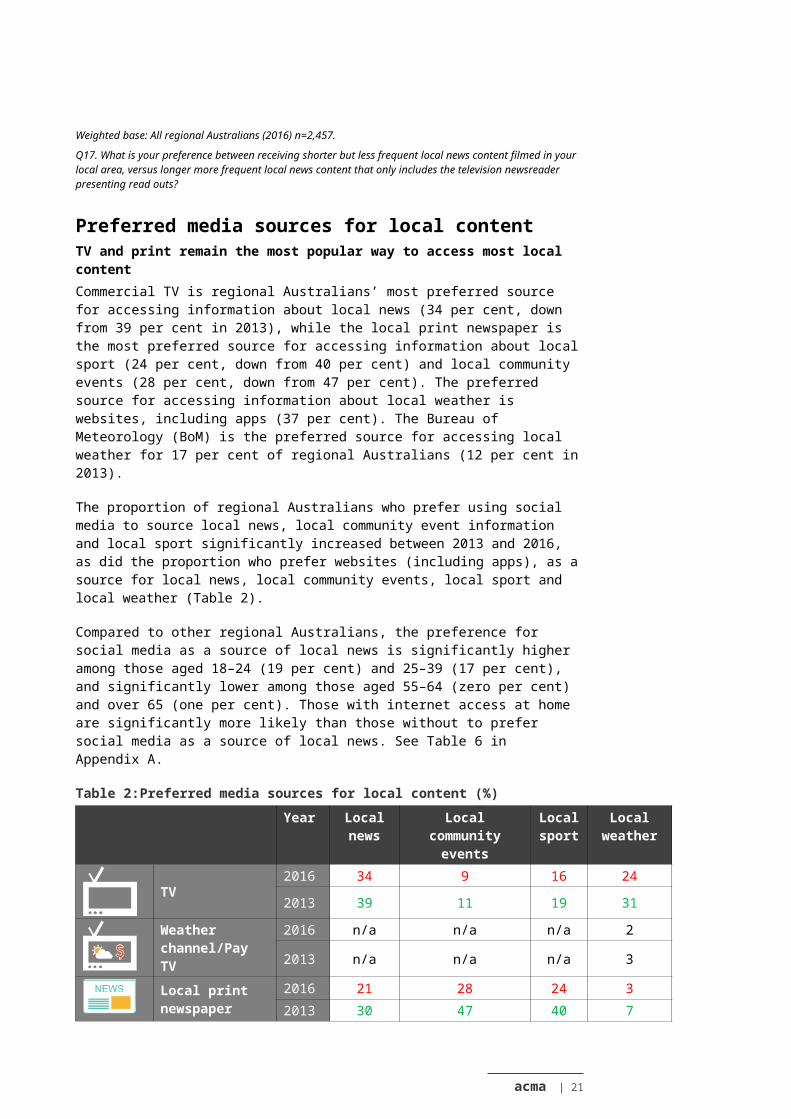
Figure 16: Preference for media use for local news by age (%)
Weighted base: All regional Australians n=2,457 (2016) – n=935 (18–39), n=1,521 (40+).
Q11. For each of the following types of local information or content, imagine you could use any source to get this content. Would your most preferred source be TV, radio, local print newspaper, the internet or somewhere else?
acma | 21

Using online media to access local contentIncrease in the use of social media to access local contentThe use of social media to access local news, local community events and local sport significantly increased between 2013 and 2016 (Figure 17).
Figure 17: Use of social media to access local content (%)
Weighted base: All regional Australians to access local content n=1,805/1,619/992/2,085 (2016) n=1,494/1,290/909/1,533 (2013).
Q10. For each of the following types of local content, please tell me what you use to get this kind of information. Would it be TV, radio, a local newspaper, the internet or something else?
Females are significantly more likely than males to use social media for local news (21 vs 15 per cent) and community events (36 vs 27 per cent).
Younger regional Australians are more likely to use social media to access local news, local community events and local sports:> For local news—those aged 18–24 (31 per cent) and 25–39 (33 per cent) were
significantly more likely than other regional Australians, and those aged 55–64 (nine per cent) and over 65 (four per cent) were significantly less likely, to use social media.
> For local community events—those aged 18–24 (52 per cent) and 25–39 (54 per cent) were significantly more likely than other regional Australians, and those aged 55–64 (14 per cent) and over 65 (five per cent) were significantly less likely, to use social media.
> For local sport—those aged 18–24 (35 per cent) and 25–39 (33 per cent) were significantly more likely than other regional Australians, and those aged 55–64 (three per cent) and over 65 (one per cent) were significantly less likely, to use social media.
Regional Australians aged 25–39 (six per cent) are more likely than other regional Australians, and those aged 55–64 (two per cent) and over 65 (one per cent) are significantly less likely than other regional Australians, to use social media for local weather. Regional Australians in Queensland are significantly less likely than other regional Australians to use social media for local news, and those with internet access at home are more likely than those without to use social media for all local content types.
See Table 7 in Appendix A.
22 | acma

While social media appears to be rarely used to access local weather information (four per cent), there was a significant increase between 2013 (49 per cent) and 2016 (59 per cent) in the use of websites to access local weather information. Figure 18 shows that there were also significant increases between 2013 and 2016 in the use of websites to access local news, local community events and local sport.
Figure 18: Use of websites to access local content (%)
Weighted base: All regional Australians to access local content n=1,805/1,619/992/2,085 (2016) n=1,494/1,290/909/1,533 (2013).
Q10. For each of the following types of local content, please tell me what you use to get this kind of information. Would it be TV, radio, a local newspaper, the internet or something else?
Regional Australians in the Australian Capital Territory (ACT) (46 per cent) are significantly more likely than other regional Australians to use websites to access local news, while those in South Australia (15 per cent) are less likely to.
Regional Australians aged 25–39 are significantly more likely than other regional Australians to use websites for local weather (65 per cent), and those aged 40–54 are significantly more likely than other regional Australians to use websites for local community events (40 per cent).
Regional Australians aged over 65 are significantly less likely than other regional Australians to use websites for local news (10 per cent), local community events (nine per cent), local sport (seven per cent) and local weather (38 per cent).
Compared to other regional Australians, those aged 18–24 (75 per cent) are significantly more likely to use websites for local weather; and those aged 25–39 (38 per cent) are significantly more likely to use websites for local news.
Those with internet access at home are more likely than those without to use websites to access all types of local content.
See Table 8 in Appendix A.
acma | 23

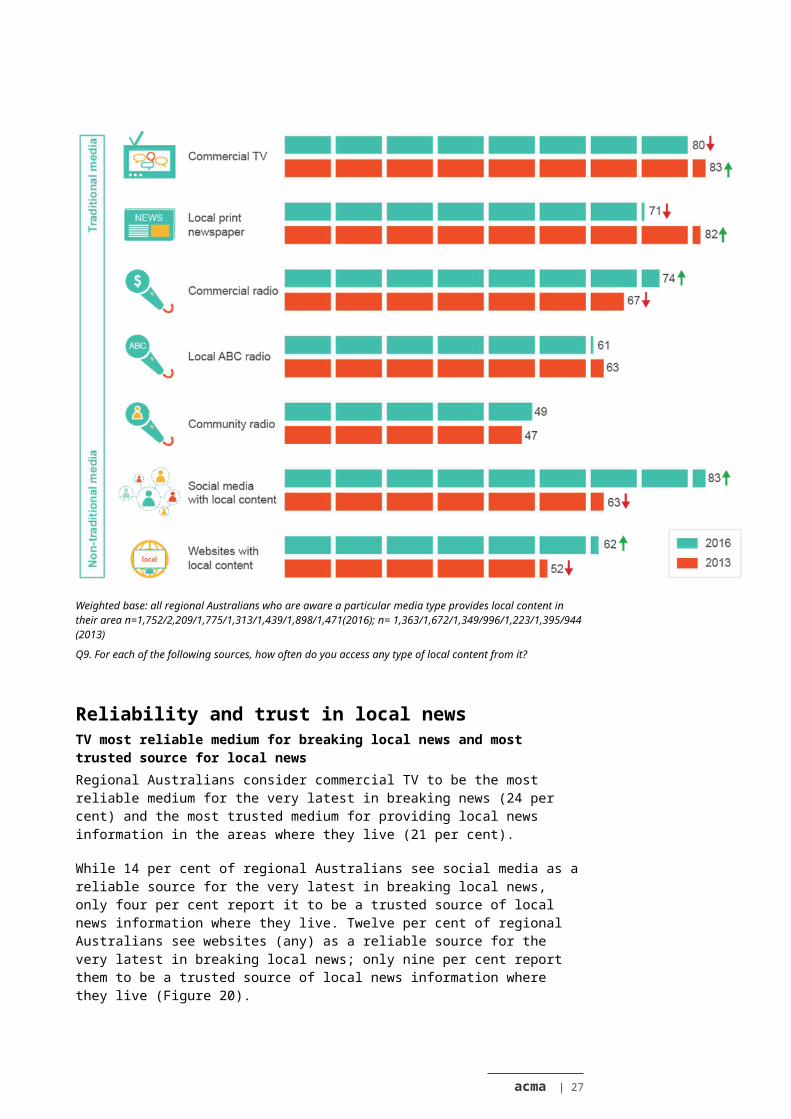
Frequent use of media to access local content (at least once a week)Of the regional Australians who are aware of the sources of local content in their local area, 83 per cent use social media to access local content at least once a week (63 per cent in 2013). This is higher than the reported access to local content via television (80 per cent), commercial radio (74 per cent) and the local print newspaper (71 per cent). Almost two-thirds (62 per cent) of regional Australians use websites to access local content at least once a week (52 per cent in 2013) (Figure 19).
Figure 19: Change in frequent use of media to access local content (%)
Weighted base: all regional Australians who are aware a particular media type provides local content in their area n=1,752/2,209/1,775/1,313/1,439/1,898/1,471(2016); n= 1,363/1,672/1,349/996/1,223/1,395/944 (2013)
Q9. For each of the following sources, how often do you access any type of local content from it?
24 | acma

Reliability and trust in local news TV most reliable medium for breaking local news and most trusted source for local newsRegional Australians consider commercial TV to be the most reliable medium for the very latest in breaking news (24 per cent) and the most trusted medium for providing local news information in the areas where they live (21 per cent).
While 14 per cent of regional Australians see social media as a reliable source for the very latest in breaking local news, only four per cent report it to be a trusted source of local news information where they live. Twelve per cent of regional Australians see websites (any) as a reliable source for the very latest in breaking local news; only nine per cent report them to be a trusted source of local news information where they live (Figure 20).
Figure 20: Reliability and trustworthiness of media types for accessing local news (%)
Weighted base: All regional Australians n=2,457 (2016).
Q15a. Which of the following media would you say is the most reliable for the very latest information about breaking or unfolding local news stories?
Q15b. Which of the following media would you consider to be the most trusted source of local news available where you live?
acma | 25
There were some interesting differences by sub-group in the rating of media reliability and trust. Table 9 in Appendix A shows the differences for all media by demographics and media access for reliability of the four highest rating reliable media (commercial TV, local ABC radio, websites and social media).
Table 10 in Appendix A shows the differences for all media by demographics and media access for trust of the four highest rating trusted reliable media (commercial TV, local ABC radio, websites and social media).
Females (17 per cent) are significantly more likely than males (10 per cent) to say that social media is the most reliable for the very latest information about breaking or unfolding local news.
Regional Australians aged 18–24 are significantly less likely than other regional Australians to view local ABC radio as the most trusted source of local news (five per cent) or as the most reliable for the very latest information about breaking or unfolding local news (six per cent). This group is significantly more likely than other regional Australians to see commercial TV (30 per cent) and social media (nine per cent) as the most trusted source of local news.
Regional Australians aged 25–39 are significantly more likely than other regional Australians to view social media (24 per cent) and websites (any) (18 per cent) as most reliable for the very latest information about breaking or unfolding local news; and are more likely to say websites (any) are the most trusted source of local news (13 per cent).
This age group is also significantly less likely than other regional Australians to see commercial TV (19 per cent), local ABC radio (nine per cent) and ABC TV (four per cent) as most reliable for the very latest information about breaking or unfolding local news; and is less likely to see local ABC radio as a trusted source of local news (11 per cent).
Regional Australians aged 40–54 are significantly less likely than other regional Australians to view local print newspapers as the most trusted source of local news (13 per cent) or as the most reliable for the very latest information about breaking or unfolding local news (five per cent). This age group is also more likely than other regional Australians to see local ABC radio as the most trusted source of local news.
Older regional Australians are significantly less likely than other regional Australians to view social media as most reliable for the very latest information about breaking or unfolding local news. Six per cent of those aged 55–64 have this view; for those over 65, it is only two per cent.
Those over 65 are also significantly less likely (three per cent) than other regional Australians to view websites (any) as most reliable for this purpose. Those aged over 65 are more likely to see commercial TV (30 per cent) and ABC TV (17 per cent) as most reliable for the very latest information about breaking or unfolding local news.
26 | acma
Those aged over 65 are significantly more likely than other regional Australians to view ABC TV (17 per cent) and local print newspapers (24 per cent) as the most trusted source of local news; and less likely to see social media (zero per cent) and websites (any) (two per cent) as the most trusted source of local news.
Regional Australians who live in TV local content non-obligation areas (15 per cent) are significantly less likely than those who live in obligation areas (22 per cent) to view commercial TV as the most trusted source of local news. This group (three per cent) is also significantly less likely than those who live in obligation areas (eight per cent) to see commercial radio as the most trusted source of local news.
Regional Australians who live in non-obligation areas (21 per cent) are significantly more likely than those who live in obligation areas (14 per cent) to view local ABC radio as the most trusted source of local news.
Those in the ACT are significantly more likely than other regional Australians to view websites (any) (34 per cent) and ABC TV (18 per cent) as most reliable for the very latest information about breaking or unfolding local news, but significantly less likely to see commercial TV (eight per cent) as reliable. This group is more likely to view websites (any) (21 per cent) as the most trusted source of local news.
Those in Victoria and South Australia (both 29 per cent) are significantly more likely than other regional Australians to view local print newspapers as the most trusted source of local news, while those who live in the Northern Territory are significantly less likely (four per cent). This group is also significantly more likely to see ABC TV as the most trusted source of local news (26 per cent).
Regional Australians who have internet access at home are significantly less likely than those without to view commercial TV as most reliable for the very latest information about breaking or unfolding local news (22 per cent with internet access compared to 35 per cent without). However, regional Australians who have internet access at home are more likely than those without to see social media (14 per cent) and websites (any) (15 per cent) as most reliable for the very latest information about breaking or unfolding local news. Those with internet access at home are more likely (10 per cent) than those without to see websites (any) as the most trusted source of local news.
acma | 27

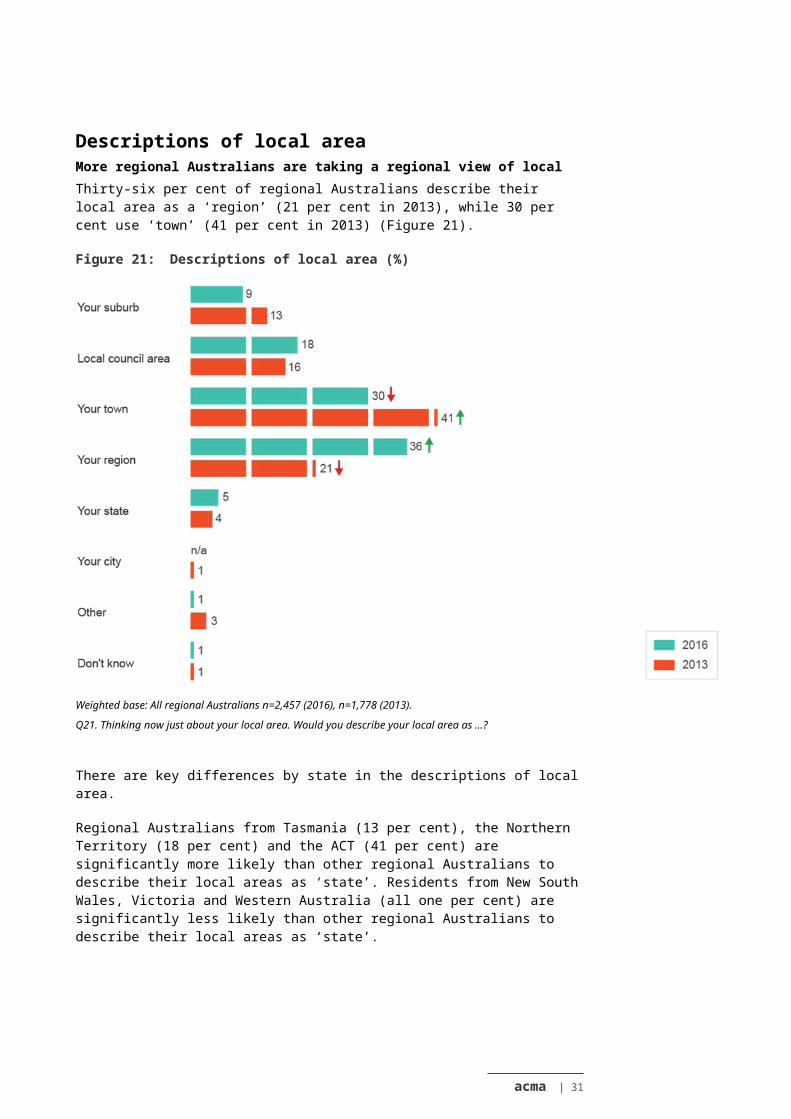
Descriptions of local areaMore regional Australians are taking a regional view of localThirty-six per cent of regional Australians describe their local area as a ‘region’ (21 per cent in 2013), while 30 per cent use ‘town’ (41 per cent in 2013) (Figure 21).
Figure 21: Descriptions of local area (%)
Weighted base: All regional Australians n=2,457 (2016), n=1,778 (2013).
Q21. Thinking now just about your local area. Would you describe your local area as ...?
There are key differences by state in the descriptions of local area.
Regional Australians from Tasmania (13 per cent), the Northern Territory (18 per cent) and the ACT (41 per cent) are significantly more likely than other regional Australians to describe their local areas as ‘state’. Residents from New South Wales, Victoria and Western Australia (all one per cent) are significantly less likely than other regional Australians to describe their local areas as ‘state’.
Regional Australians in Tasmania (20 per cent) are significantly more likely than other regional Australians to describe their local area as ‘suburb’, while those in Victoria (four per cent) and Western Australia (five per cent) are less likely to do so. Those in Western Australia (38 per cent) are significantly more likely to describe their local area as ‘town’.
Regional Australians in Queensland (30 per cent) are significantly less likely than other regional Australians to describe their local area as ‘region’, and those in the ACT are less likely to describe their local area as ‘local council area’ (three per cent) or ‘town’ (12 per cent).
28 | acma
Males (six per cent) are significantly less likely than females (12 per cent) to describe their local area as ‘suburb’, but they are significantly more likely (39 per cent) than females (33 per cent) to describe it as ‘region’.
Regional Australians aged 40–54 (43 per cent) are significantly more likely than other regional Australians to describe their local area as ‘region’. Those aged 18–24 (12 per cent) are significantly more likely than other regional Australians to encompass a wider area and describe their local area as ‘state’. Regional Australians aged over 65 are more likely than other regional Australians to describe their area as ‘local council area’.
Those with no internet access at home (24 per cent) are significantly less likely than those with internet access at home (38 per cent) to define their local area as ‘region’, but twice as likely (16 per cent) than those with internet access at home (eight per cent) to describe their local area as ‘suburb’.
Regional Australians living in obligation areas (10 per cent) are significantly more likely than those in non-obligation areas (six per cent) to describe their area as ‘suburb’; those in non-obligation areas (36 per cent) are significantly more likely than those in obligation areas (28 per cent) to describe their areas as ‘town’.
See Table 11 in Appendix A.
acma | 29

GlossaryFor the purposes of this report, the ACMA has used following definitions:
Frequent use Access to local content at least once a week.
Non-obligation areaA geographical area that is not subject to the regional commercial television local content requirements (see ‘TV local content obligation area’, below). Non-obligation areas include the following commercial television licence areas: Darwin TV1; Remote Central and Eastern Australia,; Mildura/Sunraysia TV1; Griffith and MIA TV1; Broken Hill TV1; Mount Gambier TV1; Riverland TV1; Spencer Gulf TV1; South West and Great Southern TV1; Western Zone TV1; Remote and Regional TV1, and Geraldton TV1.
Online mediaWebsites (including apps) and social media.
Traditional mediaFree-to-air television, radio and local print newspapers.
TVCommercial free-to-air television
TV local content obligation areaA geographical area that is specified in Schedule 1 to the Broadcasting Services (Additional Television Licence Condition) Notice 2014 as being subject to the regional commercial television local content requirements in Part 2 of that licence condition. These areas are located in the Regional Queensland, Northern NSW, Southern NSW, Regional Victoria and Tasmania commercial television licence areas.
30 | acma
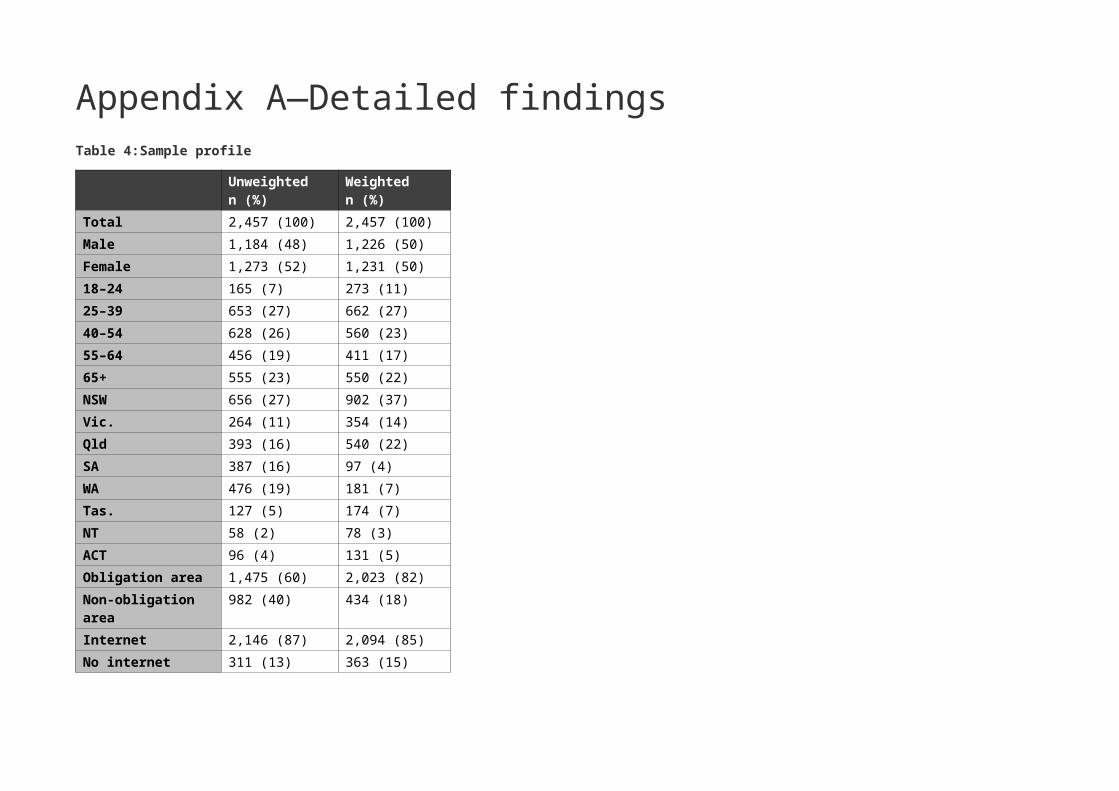
Appendix A—Detailed findingsTable 4: Sample profile
Unweightedn (%)
Weightedn (%)
Total 2,457 (100) 2,457 (100)Male 1,184 (48) 1,226 (50)Female 1,273 (52) 1,231 (50)18–24 165 (7) 273 (11)25–39 653 (27) 662 (27)40–54 628 (26) 560 (23)55–64 456 (19) 411 (17)65+ 555 (23) 550 (22)NSW 656 (27) 902 (37)Vic. 264 (11) 354 (14)Qld 393 (16) 540 (22)SA 387 (16) 97 (4)WA 476 (19) 181 (7)Tas. 127 (5) 174 (7)NT 58 (2) 78 (3)ACT 96 (4) 131 (5)Obligation area 1,475 (60) 2,023 (82)Non-obligation area 982 (40) 434 (18)Internet 2,146 (87) 2,094 (85)No internet 311 (13) 363 (15)

Table 5: Regional Australians’ satisfaction with aspects of local news by age, gender, location and media access (%)
Overall quality of local news
Accuracy Relevance to the local area
Produced/ created/ made in the local area
Currency/ up to date
Overall amount/ quantity of local news available
Amount/ quantity of television local news presenter read-outs
Amount/ quantity of television local news footage
Total 87 86 86 79 88 83 71 72Male 86 82 85 80 87 81 70 69Female 88 89 88 78 90 85 73 7418–24 90 81 84 83 89 82 72 6825–39 85 83 85 80 89 84 69 7440–54 84 85 86 76 88 78 64 6755–64 89 89 89 79 89 83 75 7265+ 90 89 88 80 88 86 79 75NSW 89 86 88 80 89 85 75 77Vic. 89 89 89 81 88 87 65 65Qld 86 82 81 78 87 81 71 73SA 85 90 90 77 91 81 65 58WA 86 86 88 77 90 77 69 66Tas. 85 90 88 79 89 85 82 78NT 83 79 75 73 78 71 54 54ACT 81 82 89 81 87 77 72 65Obligation area 88 86 87 80 89 84 73 75Non-obligation area 83 84 82 75 86 76 63 58Internet 87 86 87 80 89 83 71 71No internet 89 86 84 78 84 81 77 76
Weighted base: All regional Australians n=2,457 (2016).
Q18. How satisfied overall are you with the quality of the local news available in your local area?
Q19. And how satisfied are you with following aspects of local news available in your local area?Table 6: Preference for using social media as a source of local news—differences in demographics, location and access (%)
Local newsTotal 9

Local newsMale 7Female 1118–24 1925–39 1740–54 755–64 065+ 1NSW 10Vic. 12Qld 5SA 7WA 11Tas. 7NT 12ACT 3Obligation area 8Non-obligation area 12Internet 10No internet 2Have all the content they want 8Do not have all the content they want 11
Weighted base: All regional Australians n=2,457 (2016); n=1,778 (2013).
Q11. For each of the following types of local information or content, imagine you could use any source to get this content. Would your most preferred source be TV, radio, local print newspaper, the internet or somewhere else? n/a= not asked.
Table 7: Using social media for local content—differences in demographics, location and access (%)
Local news Local community events Local sport Local weatherTotal 18 32 18 4Male 15 27 16 3Female 21 36 22 518–24 31 52 35 425–39 33 54 33 6
Local news Local community events Local sport Local weather40–54 15 32 19 655–64 9 14 3 265+ 4 5 1 1NSW 18 31 18 4Vic. 23 31 26 3Qld 12 31 14 3SA 19 31 21 4WA 23 39 21 7Tas. 23 28 9 4NT 28 36 14 7ACT 9 37 23 2Obligation area 17 31 18 3Non-obligation area 23 35 20 6Internet 20 35 21 4No internet 5 5 1 0Have all the content they want 17 32 18 4Do not have all the content they want 20 32 19 3
Weighted base: All regional Australians n=2,457 (2016); n=1,778 (2013).
Q10. For each of the following types of local content, please tell me what you use to get this kind of information. Would it be TV, radio, a local newspaper, the internet or something else?
Table 8: Using websites for local content—differences in demographics, location and access (%)
Local news Local community events Local sport Local weatherTotal 26 29 28 59Male 26 28 27 61Female 25 30 29 5718–24 33 33 41 7525–39 38 33 35 6540–54 29 40 35 6555–64 16 25 20 5965+ 10 9 7 38

Local news Local community events Local sport Local weatherNSW 25 26 26 56Vic. 22 27 28 62Qld 23 32 28 60SA 15 21 16 54WA 28 29 27 61Tas. 24 26 29 55NT 43 56 45 77ACT 46 37 33 71Obligation area 26 29 28 59Non-obligation area 26 30 26 62Internet 29 32 32 65No internet 4 6 4 16Have all the content they want 24 29 27 60Do not have all the content they want 30 28 29 57
Weighted base: All regional Australians n=2,457 (2016).
Q10. For each of the following types of local content, please tell me what you use to get this kind of information. Would it be TV, radio, a local newspaper, the internet or something else?
Table 9: Reliability of media for the very latest information about breaking or unfolding local news stories (%)
Commercial TV
ABC TV
Pay TV Local print newspaper
Commercial radio
Community radio
Local ABC radio
Website (any)
Social media
Total 24 8 0 10 9 3 14 12 14Male 24 7 1 10 10 3 16 12 10Female 24 9 0 9 8 3 12 12 1718–24 30 3 0 10 5 4 6 14 2125–39 19 4 0 10 7 4 9 18 2440–54 21 6 1 5 10 3 18 16 1455–64 25 7 1 14 13 2 18 11 665+ 30 17 0 12 9 2 17 3 2NSW 28 6 1 8 10 3 11 12 15Vic. 18 5 1 14 12 4 17 10 14

Commercial TV
ABC TV
Pay TV Local print newspaper
Commercial radio
Community radio
Local ABC radio
Website (any)
Social media
Qld 27 6 0 10 8 3 13 11 13SA 24 11 0 16 5 2 18 7 12WA 26 6 0 9 7 2 19 11 16Tas. 22 14 1 11 6 6 18 7 12NT 16 14 0 5 1 4 22 25 9ACT 8 18 1 4 6 4 11 34 8Obligation area 25 8 0 10 9 3 13 12 13Non-obligation area
21 9 0 11 7 3 19 12 14
Internet 22 7 0 9 9 3 14 14 15No internet 35 10 0 12 11 3 13 2 6
Weighted base: All regional Australians n=2,457 (2016).
Q15a. Which of the following media would you say is the most reliable for the very latest information about breaking or unfolding local news stories?
Table 10: Trusted sources of local news by age, gender, state and media access (%)
Commercial TV
ABC TV Pay TV Local print newspaper
Commercial radio
Community radio
Local ABC radio
Website (any)
Social media
Total 21 10 0 19 7 3 15 9 4Male 20 11 0 19 7 3 17 8 3Female 22 9 0 19 7 3 13 10 518–24 30 8 0 20 4 1 5 13 925–39 21 7 0 19 7 4 11 13 640–54 20 7 1 13 7 3 20 12 555–64 18 10 0 19 7 3 21 5 265+ 19 17 0 24 8 1 16 2 0NSW 24 8 1 18 8 2 12 10 5Vic. 15 7 0 29 9 4 15 8 2Qld 25 9 0 17 7 3 16 8 3SA 18 14 0 29 4 3 16 4 3WA 19 7 0 23 4 2 21 7 6

Commercial TV
ABC TV Pay TV Local print newspaper
Commercial radio
Community radio
Local ABC radio
Website (any)
Social media
Tas. 24 17 0 14 6 3 17 6 5NT 7 26 0 4 0 1 25 15 9ACT 9 18 0 8 8 4 15 21 1Obligation area 22 10 0 18 8 3 14 9 4Non-obligation area
15 11 0 22 3 3 21 8 6
Internet 20 10 0 18 6 3 16 10 4No internet 27 9 0 23 10 1 10 1 2
Weighted base: All regional Australians n=2,457 (2016).
Q15b. Which of the following media would you consider to be the most trusted source of local news available where you live?
Table 11: Differences in description of local areas by age gender state and media access (%)
Your suburb Your local council area Your town Your region Your stateTotal 9 18 30 36 5Male 6 18 29 39 5Female 12 17 30 33 518–24 12 14 33 26 1225–39 10 15 32 37 640–54 6 16 29 43 455–64 8 20 26 38 465+ 11 24 28 31 3NSW 10 20 28 40 1Vic. 4 18 32 44 1Qld 10 22 34 30 4SA 5 15 35 41 2WA 5 17 38 36 1Tas. 20 12 22 28 13NT 10 12 32 26 18ACT 12 3 12 31 41Obligation area 10 18 28 37 5

Your suburb Your local council area Your town Your region Your stateNon-obligation area 6 17 36 34 5Internet 8 17 29 38 6No internet 16 23 32 24 3
Weighted base: All regional Australians n=2,457 (2016), n=1,778 (2013).
Q21. Thinking now just about your local area. Would you describe your local area as ...?