Overview and Opportunity
26
Natural Gas Natural Gas as a Transportation Fuel Overview and Opportunity Sherrie Merrow National Conference of State Legislatures February 2, 2012
Transcript of Overview and Opportunity

Natural GasNatural
Gas as a
Transportation Fuel Overview and Opportunity
Sherrie Merrow National Conference of State Legislatures February 2, 2012

America’s Natural Gas Alliance Members Highlighting the Benefits of Natural Gas

ABUNDANT
Why Natural Gas?
DOMESTIC
CLEAN
JOBS
ABUNDANT
The United States is now the largest producer of natural gas in the world!

Stable Supplies = Stable PricesNew Projections for Natural Gas Price Stability
($ per million BTU)
Source for NG Prices: EIA Annual Energy Outlook 2011Henry Hub Spot prices (actual prices included foryears prior to annual projections)
Source for Fuel Prices: US DOE Alternative Fuels & Advanced
Vehicles Data Center
U.S. Average Retail Fuel Prices
$0.00
$0.50
$1.00
$1.50
$2.00
$2.50
$3.00
$3.50
$4.00
$4.50
$5.004/1/00
7/1/00
10/1/00
1/1/01
4/1/01
7/1/01
10/1/01
1/1/02
4/1/02
7/1/02
10/1/02
1/1/03
4/1/03
7/1/03
10/1/03
1/1/04
4/1/04
7/1/04
10/1/04
1/1/05
4/1/05
7/1/05
10/1/05
1/1/06
4/1/06
7/1/06
10/1/06
1/1/07
4/1/07
7/1/07
10/1/07
1/1/08
4/1/08
7/1/08
10/1/08
1/1/09
4/1/09
7/1/09
10/1/09
1/1/10
4/1/10
7/1/10
10/1/10
1/1/11
4/1/11
7/1/11
Cost per GGE
Propane
E85
B99/B100
B20
Gasoline
Diesel
CNG
U.S. Average Retail Fuel Prices
Natural Gas is consistently the lowest price
< $1.00 in 2000 to about $2.00 in 2011

U.S. Transportation Fuel Portfolio
71.1%
28.7%
0.2%
Gasoline Diesel Alternative Fuel
Source: Energy Information Administration (EIA), 2009, Excludes Oxygenates
U.S. Gasoline – 137.9 B GGE ▪
Diesel – 55.6 B GGE ▪
Alt. Fuels – .4 B GGE
Equivalent to 22.4 Tcf or 61.6 Bcfd
How much foreign oil do we use?
–
4.250 billion barrels imported in 2010
How much does foreign oil cost?
–
$337 billion for imported oil in 2010
–
$1,091 for each person in America
–
In 2009, energy imports made up
nearly 60% of our trade deficit
17.7 Bcfe/d
43.8 Bcfe/d
0.1 Bcfe/d
America currently relies on one primary fuel for transportation –
Petroleum

Taking Action: U.S. Transportation Sector Displacement
Fuel Consumption by Market Segment
0
5
10
15
20
25
30
35
40
45
Light Duty Heavy Duty Medium Duty Marine Rail Upstream
Source: Data and forecast from EIA, Encana, 2010Displacement opportunities exclude Air, International Shipping, Military, Pipeline Fuel
Displaceable Market Volume: 61.6 Bcfe/d69%
18%
5% 5%1%2% (1.3 Bcf/d)
42.4 Bcf/d
10.8 Bcf/d
3.2 Bcf/d 3.2 Bcf/d(0.7 Bcf/d)
Most Commercially
Ready
Industry’s Early
Opportunity
Largest Opportunity
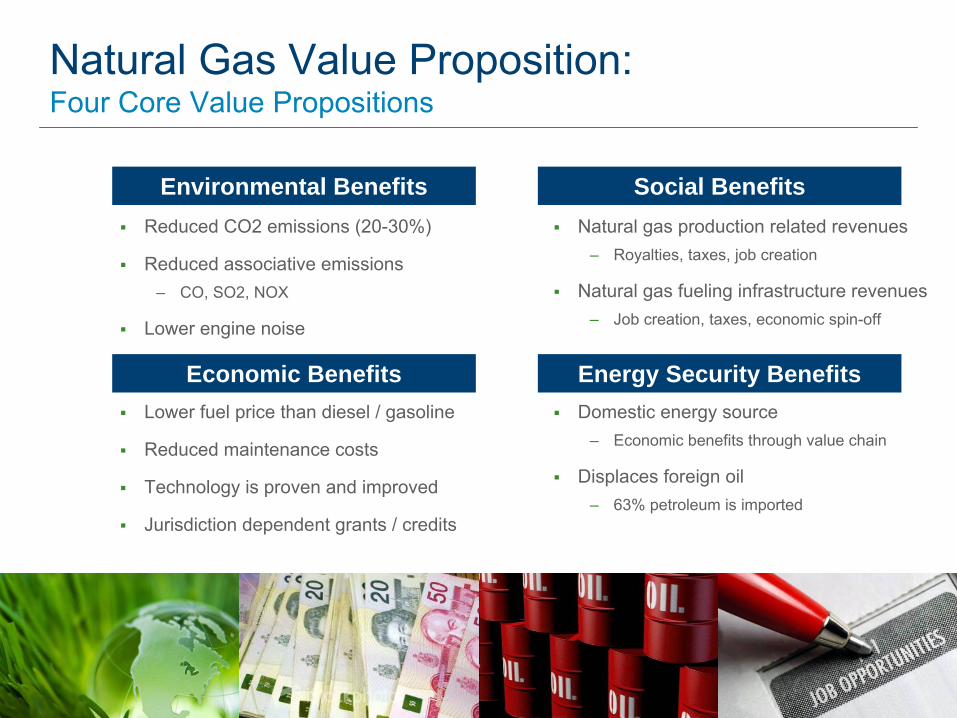
Natural Gas Value Proposition: Four Core Value Propositions
Environmental Benefits Social Benefits
Energy Security BenefitsEconomic Benefits
Reduced CO2 emissions (20-30%)
Reduced associative emissions–
CO, SO2, NOX
Lower engine noise
Lower fuel price than diesel / gasoline
Reduced maintenance costs
Technology is proven and improved
Jurisdiction dependent grants / credits
Domestic energy source–
Economic benefits through value chain
Displaces foreign oil–
63% petroleum is imported
Natural gas production related revenues–
Royalties, taxes, job creation
Natural gas fueling infrastructure revenues–
Job creation, taxes, economic spin-off

Natural Gas FuelsCompressed Natural Gas (CNG)
•
Source: Pipeline
•
Compressed to 3,600 psi
•
Primarily for light and medium duty vehicles
•
Ideal for return‐to base fleets or fleets that
require fast‐filling
•
Time‐fill and fast‐fill capability / stored in
pressurized tanks
Liquefied Natural Gas (LNG)
•
Source: Liquefaction Plant
•
Converted to liquid form for ease of storage and
transport
(Cooled to ‐260 °F and 40 psi)
•
Ideal for medium to heavy duty fleets
•
Fast‐fill / stored in tanks (similar to diesel size)

Vehicle Categories –
Choices Already Exist
Light Duty CNG
Medium to Heavy Duty CNG
Heavy Duty On Road LNG
Heavy Duty Off Road LNG

U.S. Interstate Highway System Linking Green Corridors
ICTC
RMC
TT
I-75 –
Interstate 75 Corridor
TT –
Texas Triangle
RMC –
Rocky Mountain Corridor
ICTC –
Interstate Clean Transportation Corridor
I-75

USA CNG and LNG Stations
0
200
400
600
800
1,000
1,200
1,400
1,600
1992
1993
1994
1995
1996
1997
1998
1999
2000
2001
2002
2003
2004
2005
2006
2007
2008
2009
2010
2011
Ann
ual F
uel D
ispe
nsed
per
Sta
tion,
GG
ECNG Stations LNG Stations
Source: US DOE Alternative Fuels & Advanced Vehicles Data Center
10% CAGR
As of December 31, 2011 –
975 CNG stations and 46 LNG stations
Top States for NGV Stations
California: 260
New York: 103
Utah: 78
Oklahoma; 63
Texas: 38

OEMs Deliver Light-Duty NGVs
Ford and Westport LD
Announce New Natural Gas
System for Super Duty Pickups Spring 2012
Honda Civic Natural Gas Unveils New Name, New
Features
GM to Launch New CNG Bi-
Fuel Pickup Truck in Late
2012
Dodge to Introduce
CNG-Powered Bi-Fuel Pickup
Trucks in March 2012

Types of NGV Legislation
Source: US DOE Alternative Fuels & Advanced Vehicles Data Center
CNG/LNG Fuel Tax Incentives
Vehicle Purchase/Conversion Funding
Infrastructure/Station Funding
Fleet Purchase Requirements
Other–
Use of HOV lanes
–
Use of carpool parking areas
–
Access to State alternative fueling stations
–
Emissions inspection exemption
–
AFV insurance discounts
–
Airport incentives (preferential taxi lanes)
–
Reduction in license / state fees

NGV Incentive ComparisonsFederal Texas West Virginia Oklahoma Oregon Colorado Louisiana
Natural Gas Vehicle Count 117,446 10,440 22 2,932 1,675 1,197 361
Natural Gas Stations (E/P)
960 / 115 41 / 13 0 62 / 5 12 / 0 29 / 5 8 / 12
Infrastructure/
Home fuel
Texas Clean Transportation
Triangle funds up to $2MM
50% of the construction costs up to $250,000
($312,500 if allows public access)
Expires: 01/01/21
75% of infrastructure
Expires: 01/01/14
25% of the incremental cost
or $750 for residents / 35% for businesses
50% of the cost of constructing an
alternative fueling station
No expiration
Vehicle IncentivesAccelerated
depreciation in 2012
Texas Gas Services offers
$2,000 rebate for the purchase of a NGV / $3,000 for the conversion
Texas Clean Transportation
Triangle funds 60- 90% of cost up to
$8MM
35% of the purchase price or 50% of the
conversion cost up to $7,500 for < 26,000 GVWR and up to
$25,000 for > 26,000 GVWR
Expires: 01/01/21
50% of the incremental cost
Expires: 01/01/14
25% of the incremental cost
or $750 for residents / 35% for businesses
55% of incremental cost
in 2012
Decreases: 35% : 2013 25% : 2014 and 2015
50% of the incremental cost, or 10% of the cost of the motor vehicle or up to
$3,000
No expiration
Fuel Credits Preferential NG Fuel rates
Deregulation of CNG as a Motor Fuel
Mandates/Goals Acquisition Requirements
Acquisition Requirements
Acquisition Requirements
Acquisition Requirements
CNG highway/station
every 100 miles by 2015
Acquisition Requirements
Acquisition Requirements
Acquisition Requirements
Funding Grants / Loans Grants / Loans Grants / Loans Infrastructure Loans Loans Grants Loans
Source: AFDC as of 1/27/2012

NGV MOU
Led by CO, OK, PA and WY,
states are joining together
to use NGVs in state fleets─
Aggregate vehicle purchase
numbers for “Detroit”
–
joint RFP
─
Commit to converting state
fleets (county, municipal, and
other government)
─
ME, UT, NM, WV, KY have joined
CO, OK, PA and WY with other
states in progress

Leading the Way•
NGVs in fleets across America─
16 % of all transit buses in U.S.
─
Airports use NGVs for transit and taxis
─
Waste trucks are fastest‐growing segment
─
Medium and heavy duty trucks used by large
fleets like UPS, AT&T, Comcast, Sysco, Ryder,
and many others
─
First CNG‐powered fire trucks and ambulances
are coming into the market

Completed Picture for Market Growth
FLEETS & CONSUMERS
OEMs & MULTIPLE
PLATFORMSFUELING STATIONS
COMPETITIVE PRICING
MAINTAIN INDUSTRY SAFETY &
COMPLIANCE
North America
HOME FUELING
Additional Information

Source: IANGV, NGVA Europe, Fiat
Natural Gas Vehicle Growth by Continent Great North American Opportunity
Natural Gas Vehicles (Millions)
Natural Gas Vehicles by Continent
0.0
1.0
2.0
3.0
4.0
5.0
6.0
2000 2001 2002 2003 2004 2005 2006 2007 2008 2009
Asia Europe N. America S. America Africa
Italy as an Example
~600,000 NGVs
37% growth since 2007
NGVs have 7% market share of all
new vehicles purchased
Cost of CNG is 50% to 60% less
expensive than gasoline
Government incentives
Imports 89% of natural gas
Fiat Qubo Natural Power

Source: EIA, CSUG, IHS Energy
Gas Shale Plays are an Industry
Changing Breakthrough
North American Natural Gas Landscape Increased Reserve and Resource Base
2,600 Tcf of Total Resource
100+ Year Supply at 70 Bcf/d
70+ Year Supply at 100 Bcf/d
Years of Supply Tcf
Canada and U.S. Resource EstimatesLocation of Shale Plays
92102
7585
0
25
50
75
100
125
PGC/NEB 20
06EIA/N
EB 2007
EIA/NEB 20
09PGC/N
EB 2009
PGC/NEB 20
11
RLI
@ 6
5 Bc
f/d (y
ears
)
0
500
1,000
1,500
2,000
2,500
3,000
Tota
l Res
ourc
e Po
tent
ial (
Tcf)
ResourceReserves
110

Natural Gas Usage by Sector
Source: EIA, Natural Gas Year In Review, 2009
How Natural Gas is Used Today
3% Transportation
14% Commercial
32% Industrial 21% Residential
30% Electric Power

Petroleum Fuel By Vehicle Per YearVehicle # Gallons Per Year Today’s Premium*
Freight Truck 12,000 $60,000
Transit Bus 12,000 $50,000
Garbage Truck 9,000 $52,000
Airport Shuttle 5,800 - 7,200 $30,000
Taxi Cab 5,000 $10,000
Delivery Truck 4,500 - 5,500 $30,000
School Bus 2,200 – 2,800 $36,000
Light Duty Truck 2,000 $10,000
Consumer Vehicle 1,000 $7,000
*Premium is today’s price without subsidies or additional volume

Natural Gas Vehicle Option Examples•
Light Duty Vehicles
─
Honda Civic Natural Gas (NG)
─
Chevrolet –
Impala, Silverado, Tahoe, Malibu, Tahoe
─
Ford – Focus, Fusion, F150, Milan, Transit Connect
─
Dodge – Ram
•
Medium Duty Vehicles
─
Chevrolet –W4500, C4500 / 5500, Express, Savana
─
Ford –
F250, F350, E450, F450, F550, F53 / F59
─
Transit Bus –
Blue Bird, Thomas Built, El Dorado, Foton America, NABI, New Flyer,
Orion, Motor Coach Industries
─
Work Trucks –
Workhorse, Sterling, International, MaxxForce
─
Refuse – American LaFrance, Mack, AutoCar, Crane Carrier, Freightliner,
Kenworth, McNeilus
─
Street Sweeper –
Elgin, Freightliner, Schwarze
•
Heavy Duty Vehicles
─
Short‐Haul –
Freightliner, Kenworth, Peterbilt, Volvo Trucks N.A.
─
Long‐Haul – Kenworth, Peterbilt, Volvo Trucks N.A., International Transtar
•
Heavy Duty Engine Manufacturers
─
Cummins Westport 8.9L ISL G
─
Westport 15L

Grant Funding OptionsFederal GrantsDOT Congestion Mitigation and Air Quality Improvement Program (CMAQ)
Generally limited to projects in non-attainment areas
DOE State Energy Program (SEP) Clean Cities program which supports alternative fuel vehicle and
infrastructure.
EPA Supplemental Environment Project and DERA Grants
–Repower: 75% of cost
–Vehicle replacements: 25% of cost
Diesel Emissions Reduction Program (DERP): EPA program which assists government agencies, school districts and other parties to replace older diesel engines.
Diesel Truck Retrofit and Fleet Modernization Program: EPA program provides grants to states to fund fleet modernization programs, with preference to be given to ports and other major hauling operations.
Clean School Bus Program: EPA program provides grants to school districts and related organizations for the replacement, repower or retrofit of school buses, the purchase of alternative fuels for school buses and alternative fuel infrastructure.
Federal Transit Administration (FTA) Clean Fuels Grants
Funds transit projects such as purchasing or leasing clean fuel buses and/or constructing or leasing clean fuel bus facilities.
Federal Aviation Administration (FAA) Voluntary Airport Low Emissions (VALE) Program
National program to reduce airport ground emissions at commercial service airports located in designated air quality nonattainment and maintenance areas,

Resources•
American Natural Gas Alliance (ANGA)
–
http://www.anga.us/
•
Alternative Fuel Stations and Prices
–
http://www.afdc.energy.gov/afdc/stations/advanced.php/
–
http://www.altfuelprices.com/
–
http://www.cngprices.com/
–
http://www.fueleconomy.gov/
•
Clean Vehicle Foundation
http://www.cleanvehicle.org/index.shtml/
•
Natural Gas Vehicle Institute
–
http://www.ngvi.com/
•
Natural Gas Vehicles for America
–
http://www.ngvc.org/index.html/
•
US DOE Alternative Fuels & Advanced Vehicles Data Center
–
http://www.afdc.energy.gov/afdc/
•
Weld County Smart Energy
–
http://www.weldsmartenergy.org/

–
Abundant–
Affordable
–
Clean–
Reliable
–
Domestic Solution
Natural Gas is…