Overview and Considerations for a Nuclear Plant Power Uprate
20
Overview and Considerations for a Nuclear Plant Power Uprate Jim Hill NMC Prairie Island Nuclear Plant
description
Subtitle (Arial 22 to 24). Overview and Considerations for a Nuclear Plant Power Uprate. Jim Hill NMC Prairie Island Nuclear Plant. - Add text to be highlighted here -. Agenda. Overview of an Uprate Reactor Power Turbine/Steam Cycle Optimization (efficiency) Drivers of Uprate - PowerPoint PPT Presentation
Transcript of Overview and Considerations for a Nuclear Plant Power Uprate

Overview and Considerations for aNuclear Plant Power Uprate
Jim Hill NMC
Prairie Island Nuclear Plant

Agenda
• Overview of an Uprate
– Reactor Power
– Turbine/Steam Cycle Optimization (efficiency)
• Drivers of Uprate
• Prairie Island Case Considerations
• Importance of Uprate to Energy Supply

Live steam
Turbine
Generator
Feedwater
Condenser
Cooling waterPump
Feedheating plant
Reactor &Steam Generators
MSR
ReheatPressure
CondenserPressureFinal Feed Temp
Typical Nuclear Steam Cycle

Nuclear Uprate:MWe Sources
LP Turbine efficiency
HP Turbine efficiency
Reactor uprate
Extra Power
Original Equipment Aging Recover aging
Retrofitted Equipment
Steam Cycle/Condenser
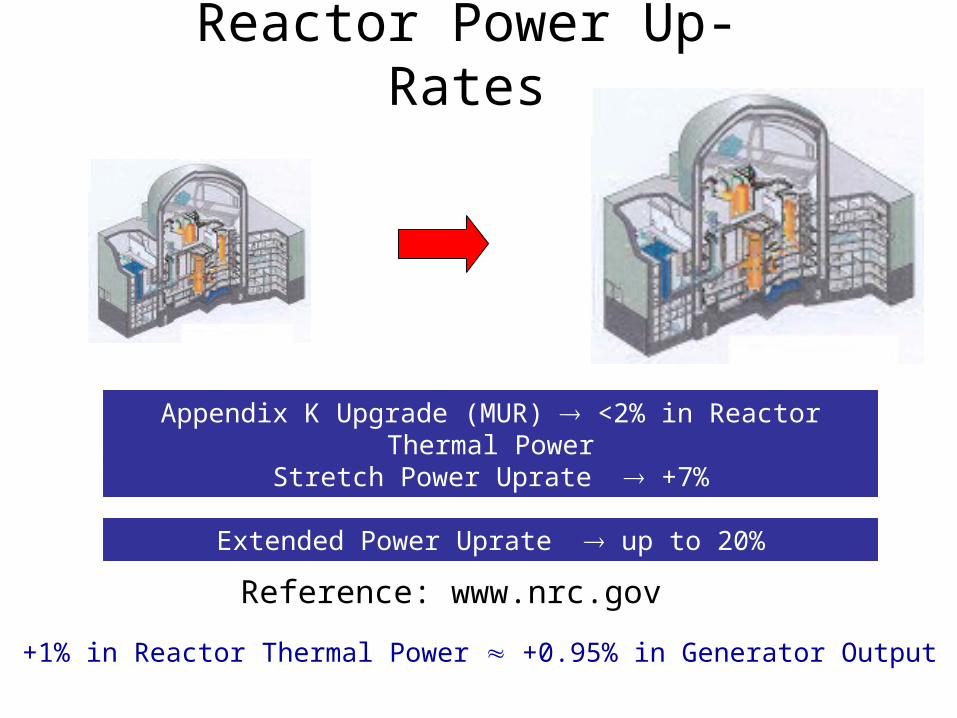
Reactor Power Up-Rates
Stretch Power Uprate +7%
+1% in Reactor Thermal Power +0.95% in Generator Output
Appendix K Upgrade (MUR) <2% in Reactor Thermal Power
Extended Power Uprate up to 20%
Reference: www.nrc.gov

Retrofitting is the replacement of all or part of the steam turbine hardware to improve thermal
performance, reliability,
availability, maintainability and environmental impact
Steam Turbine Retrofits
Original Design Retrofit Solution
Retrofit Drivers
Efficiency
Capacity Reliability

…is the integration of new components into existing equipment, within the defined turbine
island boundary conditions
• New components within the turbine island• Part of a bigger project including environmental control
upgrades• Modification of the thermal cycle• Additional output to compensate for
higher plant consumption• Capabilities in the area of the steam turbine island, boiler
and environmental control systems are required
Retrofit Solution Integration

Uprate/Retrofit Drivers• Improved turbine efficiency and plant heat rate• Reduced fuel consumption and emissions• Increased MW capacity
– Meet obligation to provide power – Added revenue
• Improved reliability and availability • Reduced maintenance • Extended turbine life
Significant additional power from an plant that has already been sited and constructed

Prairie Island Case ConsiderationsPINGP
Case
DescriptionMWt/SG
psia/Fuel
Certainty
Certainty RegulatoryApprovalCertainty
Certainty NSSS
Margin
Certainty BOP
Margin
Certainty of
Schedule
Certainty of no
Summer Derate
Potential
MWe Cost
1 1811/760/HB H H H H H H H
2 1811/810/HB H H H M H H H
3 1811/810/HBw/Steam
Cycle Optimization
M M H M H M H
4 1860/810/HB-IFM
M M-L
M M M L M
5 2100/850/16X16
L L L L L L L

TradeoffsNSSS – Reactor and Steam Supply• Less fuel efficiency with higher steam pressure• Incrementally closer to limits (less operating
margin)BOP – Turbine Generator and Electrical System• More efficiency requires more complexity
(integration of design and implementation) and cost• Incrementally closer to limits (less operating
margin)
Margin can be regained through additional changes

Gross Domestic Product (GDP)
Mature Market EconomiesTransitional EconomiesEmerging Economies
Projected growth in GDP over the next two decades:
2.5% Mature Market Economies
4.4% Transitional Economies5.1% Emerging Economies

World Marketed EnergyConsumption by Region
Increase of 57% Over Only 23 Years
0
100
200
300
400
500
600
700
Qu
adri
llio
n B
tu
1970 1975 1980 1985 1990 1995 2002 2010 2015 2020 2025
Figure 1. World Marketed Energy Consumption by Region, 1970-2025
Mature Market Economies Transitional Economies Emerging Economies
History Projections

World Net ElectricityConsumption by Region
World Electricity Consumption will Nearly Double
0
5000
10000
15000
20000
25000
30000
Bill
ion
Kill
ow
atth
ou
rs
2002 2010 2015 2020 2025
Figure 2. World Net Electricity Consumption by Region, 2002-2025
Mature Market Economies Transitional Economies Emerging Economies
History Projections
Emerging economies: annular growth of 4% versus 2.6% world wide

Environment: A Top Priority
“Environmental questions are amongst my top 3
operational issues”
0
20
40
60
80
100
US Europe Asia
% o
f re
spo
nd
ents
Source: Customer interviews
Increasing Environmental Awareness Worldwide

28 % of Installed Capacity is Older than 30 Years
2004 1974 Year ofCommission
0
20
40
60
80
100
120
140
160
1 6 11 16 21 26 31 36 41 46
Others
Hydro
Nuclear
Conventional Steam
Gas Plant (GT & CC)
Age of Power Plant
Source: ALSTOM, UDI
GW
Technology Share of Old Fleet > 30 Years
1%
30%
4%
60%
5%
Tot. Installed: 4100 GW
Old Fleet: 1138 GW
World Installed Capacityby Age and Technology
1994 1984 1964
Past Technology is Still in Operation

World Installed Capacityby Age and Region
2%
36%
43%3%
3%13%
0
20
40
60
80
100
120
140
160
1 6 11 16 21 26 31 36 41 46
ChinaAsia excl. ChinaSouth & Central AmericaMiddle East & AfricaNorth AmericaEurope
GW
Old Fleet: 1138 GW
Tot. Installed: 4100 GW
Source: ALSTOM, UDI
28 % of Installed Capacity is Older than 30 Years
2004 1974 Year ofCommission
Age of Power Plant
1994 1984 1964
Technology Share of Old Fleet > 30 Years

Global Steam Turbine Retrofit Market Forecast
China, India, S-E Asia and Russia Progressively Become More Important
0
100
200
300
400
500
600
700
800
900
1000
Mar
ket
Vo
lum
e (M
Eu
ro)
01-02 02-03 03-04 04-05 05-06 06-07f 07-08f 08/09f
Mature Market Economies Transitional Economies Emerging Economies
History Projections

Commissioning dateIncludes steam turbines >100MW at coal fired stations
0,00
5.000,00
10.000,00
15.000,00
20.000,00
25.000,00
1947 1957 1967 1977 1987 1997
Inst
alle
d c
apac
ity
(MW
)
older than 20 years315 Gigawatts or 95% of coal fired units are older than 20 years
Retrofit Market USA
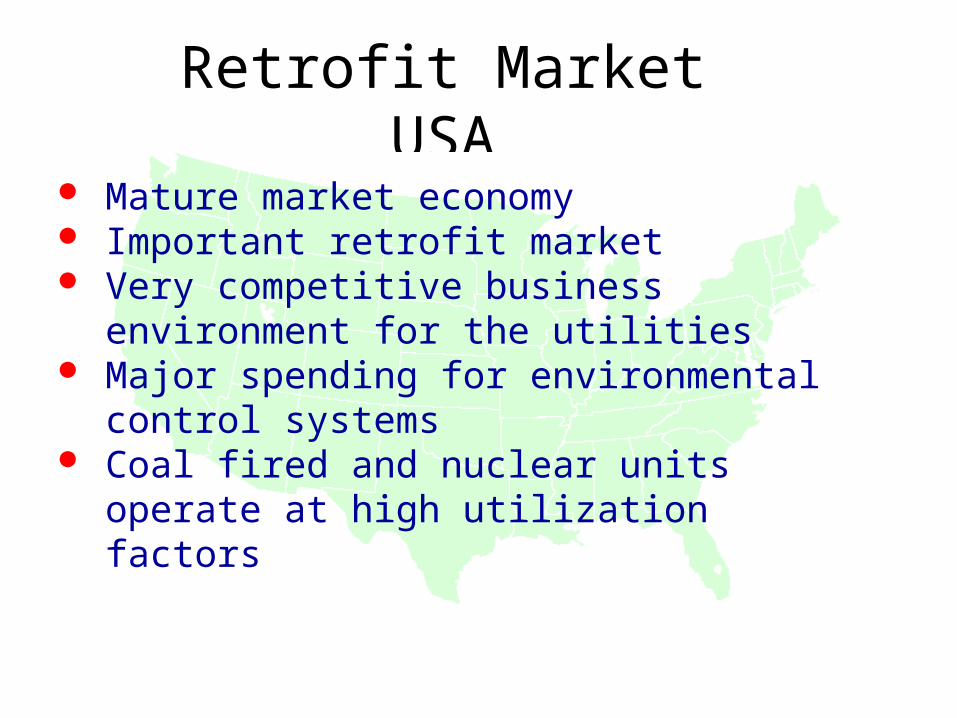
Retrofit Market USA Mature market economy Important retrofit market Very competitive business environment for the
utilities Major spending for environmental control
systems Coal fired and nuclear units operate at high
utilization factors

Questions?
More information at:Nuclear Energy Institutewww.nei.orgNuclear Regulatory Commissionwww.nrc.gov
Thank You!