OVERSTRETCHED: PEOPLE AT RISK OF FINANCIAL DIFFICULTIES
75
OVERSTRETCHED: PEOPLE AT RISK OF FINANCIAL DIFFICULTIES UNIVERSITY OF BRISTOL PERSONAL FINANCE RESEARCH CENTRE Elaine Kempson and Adele Atkinson November 2006 Supported by Genworth Financial
Transcript of OVERSTRETCHED: PEOPLE AT RISK OF FINANCIAL DIFFICULTIES

OVERSTRETCHED: PEOPLE AT RISK OF FINANCIAL DIFFICULTIES
U N I V E R S I T Y O F B R I S T O L
P E R S O N A L F I N A N C E R E S E A R C H C E N T R E
Elaine Kempson and Adele AtkinsonNovember 2006
Supported by Genworth Financial

Overstretched: People at risk of financial difficulties Elaine Kempson and Adele Atkinson November 2006 (Revised December 2006)

Overstretched: People at risk of financial difficulties___________________________
2
Acknowledgements We are very grateful to Genworth Financial, Inc1 for both the financial support that they provided for this work and for the complete intellectual freedom they allowed us with its content. Stephen McKay, Nicola Jentsch and Steve Nuttall read and offered constructive comments on the draft of this report and it is a great deal more rigorous as a result of their input. We particularly appreciate their willingness to work to a very tight deadline. Stephen McKay also provided technical advice on the analysis, which we greatly appreciated. We would also like to acknowledge the use of the data from the Financial Services Authority baseline survey of financial capability, on which the report is based. Finally, this report would not have been possible without the assistance and persistence of David Collings who was responsible for copy editing and proof reading, as well as producing all the tables and seeing the report through to completion.
1 Genworth Financial, Inc (NYSE:GNW) is a leading insurance holding company, serving the lifestyle protection, retirement income, investment and mortgage insurance needs of more than 15 million customers, with operations in 24 countries. For more information visit www.genworth.com.

Contents Contents ........................................................................................................................1 Summary.......................................................................................................................3
The current situation...................................................................................................3 Expenditure shocks ....................................................................................................4 Risk of income shocks................................................................................................6
1 Introduction..........................................................................................................9 About the research....................................................................................................10 Structure of the report ..............................................................................................11
2 The current situation .........................................................................................12 How well people thought they were making ends meet...........................................12 Overdrafts.................................................................................................................13 Use of credit cards to make ends meet .....................................................................14 Overview of financial stress .....................................................................................15 Who is facing financial stress?.................................................................................17 Levels of borrowing and saving ...............................................................................22 Attitudes to money management..............................................................................26 Exceptional expenditure...........................................................................................28 Summary ..................................................................................................................28
3 Risks associated with expenditure increases ...................................................30 Fuel bills ...................................................................................................................31 Mortgage repayments ...............................................................................................38 Summary ..................................................................................................................48
4 Risk of income shocks........................................................................................51 Recent experiences of income shocks......................................................................51 Ability to manage a future drop in income ..............................................................59 Ability to deal with a fall in income through job loss..............................................60 People at risk of not making ends meet following job loss by the main wage earner..................................................................................................................................61 Links between the risk of financial difficulties following job loss and people’s level of financial stress......................................................................................................67 Summary ..................................................................................................................67
References...................................................................................................................69 Technical Appendix A ...............................................................................................71
Imputing fuel bills. ...................................................................................................71 Calculating an increase in payments ........................................................................71

Overstretched: People at risk of financial difficulties___________________________
2
Erratum Chapter 2, page 16 In the first paragraph on this page the fourth sentence (which reads: “In fact group five included a high proportion…”) should read: “In fact group four included a high proportion of people in unbanked households”. This correction is only typographical in nature, and none of the results or conclusions of the report are affected.

____________________________________________________________Summary
3
Summary In the autumn of 2006, the economic situation is still relatively benign and most people are keeping up with their financial commitments without too much difficulty. This study investigates how many people would be at risk should they face an economic shock. It looks at the possible effects of increases in expenditure, such as the recent rise in fuel bills and the 0.5 per cent increase in the Bank of England base rate, and also of the significant drop in income that would result from the main wage earner losing their job. The current situation In the summer of 2005, most of the UK population were keeping up with bills and commitments, were not constantly in overdraft nor were they using a credit card they did not repay in full to buy food, pay bills or get cash. However, a minority of people were exhibiting at least one of these strains, some of whom showed two or more. Using a statistical technique known as cluster analysis we have been able to segment the population according to the degree of financial strain they exhibited. This showed that almost six in ten people seemed financially sound and showed no real signs of financial strain. They tended to be older people and especially those past retirement. Although their incomes were not especially high, they owed remarkably little money as either unsecured credit or mortgages and were cautious money managers. They divided into those with little or no savings and those with substantial amounts put by. The second largest group – a quarter of the population – were managing reasonably well financially. These people were well-qualified, disproportionately well-off and included many living in households with two earners. Indeed most of them were couples – either with or without dependent children. They had relatively light unsecured credit commitments, but included the highest proportion of mortgagors so that, on average, a fifth of their household incomes was spent repaying money they had borrowed. Most had savings or investments and many had significant amounts put by. We then have a group – just under one in ten of the population – who were showing signs of financial stress – all said they were always overdrawn as well as showing other signs of financial stress. Yet as a group they seemed to be burying their heads in the sand as many of them considered that they were living well within their means. They were relatively young but well-qualified and quite well-off. Their levels of borrowing were high for both unsecured credit and mortgages and they had very little money saved or invested. They tended to be spenders, who bought things on impulse, using credit rather than saving up. They also included an above-average proportion of people with exceptional expenditure to meet.

Overstretched: People at risk of financial difficulties___________________________
4
That leaves two groups who were clearly struggling financially and included most of those already in arrears. The first of these – six per cent of the population – were generally living on low incomes. But although many were falling behind with bills and other commitments, they were not relying on overdrafts or credit cards to make ends meet and a third of them did not even have a bank account. Indeed, given their incomes, many would not have passed the score cards for either of these sources of credit. More than six in ten lived in a household with no-one in either full or part-time work and they had the lowest levels of educational attainment of the five groups. They also included a high proportion of lone parents and of local authority and housing association tenants. On the whole, these people were not heavy users of unsecured credit nor were they likely to have a mortgage. At the same time, they had very little money saved. They were, however, particularly likely to describe themselves as spenders and impulsive shoppers, although they were generally opposed to using credit. The smallest group – just two per cent of the population – were struggling financially mainly because they were over-indebted. In many respects they were similar to those who were showing financial strain, but included more of the types of people at greatest risk of financial difficulties. They were the youngest of the five groups – indeed two-thirds of them were aged under 40. Most were families with dependent children. They were concentrated in the middle of the income range but had very heavy unsecured credit and mortgage commitments relative to their income. They also had little money saved or invested. They were the most financially profligate of the five groups. Most described themselves as spenders, not savers; said they bought things on impulse; preferred to buy things on credit rather than wait until they could afford them; and they included the largest group of people who said they were willing to put everyday spending on a credit card rather than cut back – indeed, many of them were doing just this. They, too, included an above-average proportion of people with exceptional expenditure to meet. Expenditure shocks We investigated two possible expenditure shocks – a 40 per cent increase in fuel bills, and a 10 per cent increase in mortgage repayments – both of which are highly likely in the current economic climate and have given rise to concern – albeit for different reasons. Fuel Household fuel bills averaged £58 a month across the year: 4.1 per cent of household income. This would have left the average household with £1,155 a month. People in Northern Ireland paid more for fuel than people living elsewhere in the UK. The impact of fuel bills on household incomes was greatest for people with low household2 incomes; people aged over 60; local authority and housing association tenants, single adults living alone and lone parents. They had a large impact in 2 Strictly speaking this is the ‘family unit’, that is the respondent and their partner, if they had one. We have, however, used the term ‘household’ as, in common parlance, ‘family’ tends to mean families with children and not to include single people living alone.

____________________________________________________________Summary
5
households that said they were either facing a constant struggle to make ends meet or falling behind with bills and other commitments. They also had a disproportionate effect on the household budgets of people who were struggling on a low income. When we controlled for the number of people living on the household income, it was clear that the likelihood of people saying they were not making ends meet fell as incomes rose – up to £1,000 equivalised income a month. It then flattened out. Between July 2005 (when the survey data were collected) and October 2006, the six energy suppliers had raised prices by between 23 and 49 per cent, with larger increases for gas than for electricity. There was a comparable increase in the cost of oil for domestic heating over the same period. We have, therefore, investigated the likely impact of a 40 per cent increase in expenditure on fuel. As might be expected this would bear most heavily on people with the very lowest incomes and the very elderly (aged over 70). People who said they were currently finding it difficult to make ends meet and those struggling on a low income would also be hit harder than the rest of the population. Mortgages The Bank of England announced a 0.25% increase in base rates in August 2006 and a further increase of a similar size is widely predicted at the time of writing. This would effectively increase mortgage repayments by 10 per cent. Mortgage repayments averaged £400 a month, or 20 per cent of household income, leaving the average household with £1,750 a month for other expenditure. The effects of repayments on the household budget were highest among young mortgagors and declined with age. They also declined with household income. There were clear regional variations, but although repayments were highest in London, followed by the rest of the South of England, so too were household incomes. Consequently, on average, mortgagors living in the South still retained higher than average incomes after paying their mortgage. There was a fairly strong link between mortgage repayments and three different measures of mortgagors’ economic well-being: • how easy they said they found it to meet their mortgage repayments, • how well they said they were making ends meet generally, and • the extent to which they were showing signs of financial strain. Most people said they were keeping up with their mortgage repayments without any difficulty, but four per cent admitted to finding it a ‘constant struggle’ and one per cent admitted to being in arrears. Mortgagors were asked how well they anticipated being able to make ends meet if their mortgage repayments went up by a tenth. Taking into account how well they were making ends meet at the time of the interview, this showed that: • 55 per cent of mortgagors believed they would continue to meet all their
commitments • 13 per cent said they would find it difficult occasionally

Overstretched: People at risk of financial difficulties___________________________
6
• 23 per cent said they would begin to have real financial difficulties, of which: - 17 per cent said they would keep up with their mortgage but would begin to have real difficulty meeting other commitments - 6 per cent would have begin to have real difficulty meeting both their mortgage repayments and other commitments
• 9 per cent were already in financial difficulty In other words, the proportion of mortgagors who thought they would face financial difficulties was more than double the proportion currently in difficulty. It should be noted, however, that they were more likely to say they would struggle with paying other household commitments than with their mortgage. The types of mortgagors who were mostly likely (three in ten or more) to say they would begin to have difficulty with either their mortgage or other commitments included people: • aged under 30 • on middle incomes (in the third income quintile) • with no qualifications and likely, therefore, to be in blue collar work, and • living in London or the South West of England. Six in ten of the mortgagors who were currently finding it an occasional struggle to make ends meet said that they would begin to have difficulties, as would four in ten of those showing financial stress. A 10 per cent increase in mortgage repayments would mean a two per cent rise in the proportion of income the average household would have to spend on this commitment, leading to a £40 decline in the money left for other expenditure. Those who said they would begin to experience financial difficulty would see a £57 a month drop – compared with a fall of £31 that would be experienced by those who believed they would continue to make ends meet. Mortgagors aged under 30, living in London or the South West would experience the biggest declines in their disposable income. Those on middle incomes or likely to be in unskilled employment would experience smaller falls but would be left with very low disposable incomes. Modelling the effects of a 10 per cent increase in mortgage repayments showed that, in addition to the nine per cent of mortgagors currently struggling financially, a further one per cent would begin to do so. This falls well short of the 23 per cent of people who, when asked, said that an increase in their mortgage repayments by this amount would cause them to get into difficulty. This is almost certainly because they over-estimated the likely impact. Risk of income shocks The financial capability baseline survey showed that large numbers of people did not have adequate provision to deal with a substantial drop in income. Yet further analysis indicates almost three in ten people (28 per cent) had experienced a major income shock in the past three years and that people in all circumstances had been affected.

____________________________________________________________Summary
7
The most common strategy to deal with an income drop was to cut back on spending and half of the people affected had done so. No other strategy was anything like as common, although minorities had drawn on savings, received help from family or friends or had borrowed commercially. Often these other strategies were accompanied by cutting back expenditure. People showing financial stress or who were struggling and over-indebted were the most likely to have borrowed to make ends meet. A third of the people (32 per cent) who had experienced a large fall in income had subsequently fallen into arrears with household commitments. The most common types of arrears were rent/mortgage payments; council tax and utility bills. Although arrears on credit commitments were lower this was only because fewer people had to make credit repayments than needed to pay the household bills above. Expressed as a proportion of those with credit repayments to make, the level of arrears was higher than it was for rent/mortgage payments. The great majority of people who were struggling on a low income or struggling and over-indebted had fallen into arrears following a drop in income and a significant number in each case had experienced multiple arrears. The odds of falling into arrears were higher the younger people were and being educated to A level or above reduced the odds. Attitudes to saving and borrowing were also important. Effect of a future job loss We then restricted the analysis to people who were either in paid employment themselves, and/or living with a partner who was, to gauge the possible impact of losing the main wage. In doing this we took account of the levels of savings people had, along with the ways they said that they would make ends meet. This showed that almost three in ten people (27 per cent) were at very high risk of not making ends meet and, therefore, of getting into financial difficulty. They did not have savings that would replace the lost earnings and indicated that they would either need to borrow to make ends meet or they would be unable to meet their existing commitments. There was a fairly strong link between falling into this category and both age and household income. The younger and poorer people were the higher the risk they faced. There was also a strong link with educational qualifications – the risk being highest among people with no qualifications who were likely, therefore, to be in unskilled jobs. The likelihood was higher in families with a single earner than where there were two; and among single people. Tenants ran a higher risk than home owners, and people living in London had the highest risk in the UK. There was also a strong link to people’s attitudes towards saving and spending. The more profligate they were the greater the risk they faced of getting into difficulty if the main wage earner lost their job. In cross tabular analysis the risk increased the more of their household income people were paying to service unsecured credit agreements; in multivariate analysis, however, this effect was reduced when attitudes to spending and saving were taken into account.

Overstretched: People at risk of financial difficulties___________________________
8
There was a strong link between the level of financial stress people were currently experiencing and whether they would be able to make ends meet following the loss of the main wage. Nine in ten of the people struggling on a low income or who were struggling and over-indebted who currently had a wage coming in, would be in real difficulty in such circumstances. At the same time, it is important to note that two in ten of the people who were financially sound or managing reasonably well when they were interviewed would also be likely to face difficulties.

__________________________________________________________Introduction
9
1 Introduction The baseline survey of financial capability in the UK, which was undertaken for the Financial Services Authority, showed that most people were doing quite well in terms of day-to-day money management (Atkinson, McKay, Kempson and Collard, 2006). On the other hand, levels of capability with regard to long-term planning were much less encouraging. This was based on a series of questions relating to provision made in case of a major loss of earnings, a large and unexpected expense, known future expenditure and retirement and showed that there was wide diversity in levels of financial capability. While some people had made considerable efforts to plan ahead, it was equally common for people to have made little or no provision. The economic situation in Autumn 2006 is relatively benign, but the findings of the baseline survey shed doubt on some people’s ability to make ends meet if there was an economic downturn and either unemployment or interest rates were to increase to any marked extent. There are also some indications that additional financial strains are being experienced by the UK population. Although still relatively low, the unemployment rate is beginning to creep up. In the period of April to June 2006, the number of unemployed on the ILO definition was 1.68 million (5.5 per cent) – up 243,000 from the same period in 2005. Likewise, although interest rates are still low, the Bank of England raised base rates from 4.5% to 4.75% in August 2006 and a further rise is anticipated before the end of 2006. There have also been significant increases in the cost of essential services. Fuel bills have also increased markedly, with British Gas, for example, increasing the price of gas by almost half between September 2005 and 2006. All these changes have taken place against a backdrop of rapidly rising levels of borrowing. Bank of England statistics show that, at the end of July 2006, the total amount outstanding in consumer borrowing was £1,237.3 million, of which the bulk - £1,025.4 million was in the form of mortgages and secured loans; £211.9 million as unsecured credit. The growth rate for the total amount outstanding was 10.5 per cent over the previous 12 months, and was higher for mortgages (11.2 per cent) than it was for unsecured credit (7.2 per cent). There are, however, signs that the rates of growth of unsecured credit has been slowing down and the Bank of England notes that over the first six months of 2006, there was ‘hardly any growth’ on credit card lending in particular. There are signs that these factors, in combination, are beginning to have an impact on the numbers of people facing financial difficulty. Advice agencies are reporting an increase in the numbers of people seeking advice with debt problems. The Consumer Credit Counselling service reported a 21 per cent increase in the number of people calling them for help in 2005 and a marked increase in the proportion of clients who were in ‘extreme’ debt, owing more than £100,000 in unsecured credit (CCCS, 2006).

Overstretched: People at risk of financial difficulties___________________________
10
Bad debt write-offs by banks were up by a third in the first half of 2006, compared with the same period in 2005. And figures from the Council of Mortgage Lenders also show small rises over the last couple of years in both the numbers of people in arrears with their mortgage and the number of possessions. Concerns about the high levels of borrowing have caused both the Bank of England and the Financial Services Authority to monitor the situation through regular surveys and to issue warnings about possible debt problems in the future (Barwell, May and Pezzini, 2006; Financial Services Authority, 2006b). The Government has also set up a Ministerial Group on Over-indebtedness, comprising Ministers from the Department of Trade and Industry, Department of Constitutional Affairs, Department for Work and Pensions, Department for Communities and Local Government; Department for Education and Skills and HM Treasury. The terms of reference of this Group are:
To oversee the development and implementation of the Government’s policies on over-indebtedness, with special regard to its relationship with poverty and social exclusion.
The work of this Ministerial Group is informed by an Advisory Group on Over-indebtedness, with wide ranging membership from commercial bodies, not-for-profit organisations, Government departments and academic and research bodies. The roles of this Advisory Group are to:
• advise on the development of Government strategy and policy on over-indebtedness;
• develop specific actions and, where appropriate, champion implementation by the sectors they represent;
• monitor and comment on trends in over-indebtedness and their impact; and • monitor progress on measures taken to tackle over-indebtedness by
commenting on annual monitoring statistics.
Three annual reports have been produced by officials as a result of the work of these two groups. In its most recent report, the Department of Trade and Industry notes that levels of financial difficulty in the UK population remain low, thanks largely to the benign macro-economic climate, but that others are at risk of getting into difficulty if they experience an economic shock of some kind (Department of Trade and Industry 2006). About the research This research is intended to inform those debates by exploring the extent to which the UK population is at risk of financial stress should they experience a financial shock. It includes analysis of the impact of both economy-wide shocks which have been giving rise to concern, such as an increase in fuel prices or mortgage interest rates, and shocks limited to individual households, such as job loss. We are fortunate to have been able to undertake secondary analysis of the financial capability baseline survey data to research this topic. The baseline survey included a wide range of questions about people’s current financial situation, including, for example, their household income, their level of savings and/or investments, their current repayments on both mortgages and unsecured credit. It also included details of

__________________________________________________________Introduction
11
how respondents thought they would handle a sudden loss of the main wage earner’s income and their attitudes towards spending, borrowing and saving. Structure of the report Chapter two begins with a detailed exploration of the respondents situations at the time of the survey. It looks at various indicators of how well people were making ends meet, including their own reported ability to do so, as well as their use of credit cards and overdrafts to cover daily living expenses. From this we have used a statistical technique known as cluster analysis to identify five groups exhibiting distinctly different levels and kinds of financial stress. The chapter concludes with a detailed overview of the types of people in each of these groups. Chapter three is the first of two forward-looking chapters and examines the possible impact of two areas where expenditure increases have already occurred or are highly likely to occur. The first half of the chapter is an overview of the likely effect of recent fuel price increases on people’s ability to make ends meet. The second half looks at the possible consequences of a rise in mortgage interest rates from two perspectives: how well mortgagors themselves felt they would cope if their repayments increased by 10 per cent and a more objective assessment of the possible impact using a statistical model. Both areas have generated widespread concern in the media and we assess how far that concern is justified. Chapter four concludes the report with an investigation of the risks people would face of being unable to make ends meet if the main wage earner lost their job. It begins by describing the extent to which people had experienced a substantial loss of income in the past three years and the consequences in terms of arrears on household commitments. It then looks at the provision (if any) that people had should they face a major loss of income through job loss in the future, with a detailed investigation of the circumstances and characteristics of the people who faced a high risk of being unable to make ends meet.

Overstretched: People at risk of financial difficulties___________________________
12
2 The current situation The baseline survey of financial capability showed that, in mid-2005, the great majority of people in the UK were living within their means although a minority were clearly exhibiting signs of financial strain (Atkinson, McKay, Kempson and Collard, 2006). This is consistent with research undertaken both by the Bank of England (Barwell, May and Pezzini, 2006) and by the Financial Services Authority for its 2006 Financial Risk Outlook report. The UK Government’s third report on tackling over-indebtedness (Department of Trade and Industry, 2006) also concludes that, despite the large increases in consumer borrowing there has been little change in households’ views of their ability to cope with their bills and credit commitments. The report does, however, identify a small but growing number of consumers who are showing signs of financial distress. In this chapter we provide a detailed picture of various indicators of financial strain, including people’s own assessment of how well they were managing, the frequency with which they were overdrawn and the extent to which they used extended facilities on credit cards to meet daily living costs. From this we categorise people into one of five groups depending on the extent to which they were showing signs of financial strain. We show that most people were either financially sound or managing reasonably well. There were, however, three small minorities who were showing financial stress, struggling on a low income or struggling and over-indebted. We then look at the personal characteristics and economic circumstance of these five groups of people; their levels of unsecured credit and mortgage commitments; the amounts they had in savings and their approach to money management. How well people thought they were making ends meet When asked for their own account of how well they were keeping up with bills and credit commitments. Two-thirds of people said that their household3 was doing so without any difficulty and a further quarter said that it was sometimes a struggle. However, one in ten reported that they were facing a constant struggle or were actually falling behind with their payments, although just one in a hundred admitted to having real financial difficulties. As we note above this is consistent with recent
3 Where have used the term ‘household’ it should be noted that this refers to the ‘family unit’ – that is the respondent and their partner if they had one. We have avoided the term ‘family’ because in common parlance this would be interpreted as families with children and not to include single adults living alone. It is also important to note that the baseline survey was a survey of individuals although it did collect information at the family unit level. Figures on borrowing, saving and investments that were in a partner’s name only were, however, imputed (see FSA, 2006a for further details of this)

___________________________________________________The current situation
13
research conducted by the Bank of England (Barwell, May and Pezzini, 2006) and by the Financial Services Authority (Financial Services Authority, 2006). A third of respondents were currently repaying a mortgage and they were asked a similar question about the ease with which their household met their repayments. Again most managed to do so without any problems, but a small proportion of people (four per cent of all respondents) said that they faced a constant struggle or were falling behind with their mortgage repayments. We have combined the replies to the two questions described above to give an overview of the extent to which people were struggling to meet any of their commitments (Figure 2.1). As might be expected this shows that the great majority were keeping up without any difficulty or with the occasional struggle. It was, however, a constant struggle for seven per cent of people and a further three per cent admitted to being in arrears.
Figure 2.1 How well people were currently keeping up with commitments including mortgage
64%
26%
7%3%
Keeping up withoutdifficulty
Keeping upsometimes a struggle
Keeping up a constantstruggle
Falling behind
Base (weighted): 5,328
Perc
enta
ge
Overdrafts The baseline survey asked a number of questions about the extent to which individuals (and their partners where they had them) were overdrawn on the various bank accounts they held. We have created a new variable which combines these replies to provide an overview of the situation within the household. This showed that around 15 per cent of people lived in a household that was overdrawn on at least one account. It is important to note that this is likely to underestimate the situation as some respondents did not know the balance on their partner’s account.

Overstretched: People at risk of financial difficulties___________________________
14
Moreover, this data provides only a ‘snapshot’ and on average, some people will have been interviewed on or near to their pay-day while others will have been interviewed near the end of the month, when they may have been more likely to dip into the red. We can overcome this complication to some extent as respondents were also asked how often they were overdrawn on the main account they personally used for day-to-day money management. The great majority were ‘never’ or ‘hardly ever’ overdrawn, although nine per cent said that they ‘sometimes’ overdrew their account; five per cent said that they were ‘usually overdrawn by the time they got paid’ and six per cent admitted to being ‘constantly overdrawn’. We have combined the responses to all the questions on current overdrafts to give an overview of the extent to which people lived in households that were overdrawn. We can see from this that two-thirds of people lived in households that did not use an overdraft but that one in ten were virtually always overdrawn (Figure 2.2). Figure 2.2 How regularly people were overdrawn on current accounts
64%
14% 12% 10%
Never Overdrawn, but don’tknow how regularly
Sometimes Virtually always
Base (weighted): 5,328
Perc
enta
ge
Use of credit cards to make ends meet The people interviewed were asked a series of questions about any credit cards they held, including how much of the balance they settled each month and, for any that were not settled in full, whether they had used their card to pay bills, buy food or get cash. If people were using the extended credit facility on their card to make ends meet in these ways, it may well be an indicator of financial pressures. Altogether 12 per cent of people were using a credit card in this way:
• three per cent to pay regular bills; • nine per cent to buy food; and • four per cent to get cash.

___________________________________________________The current situation
15
While this may be a sign of distress, it could also indicate a lack of organisation. We have, therefore, looked at how often people used their cards in this way and identified those who used their card to pay for essentials or withdraw cash at least six times a year and did not repay the balance. In fact, two-thirds (67 per cent) of people who had used their credit card to make ends meet had done so more than six times in the previous 12 months. Overview of financial stress In addition to looking at individual signs of stress it is valuable to consider whether people indicate such strain in more than one way. For example, were respondents who said they faced difficulties meeting their financial commitments also running up large overdrafts and using their credit card for basic payments? If so, they would very clearly be in financial distress. In fact 44 per cent of those who were continuously overdrawn and 23 per cent of people who had used a credit card to make ends meet at least six times in the past 12 months admitted to either being behind with bills or other commitments, or that they were finding it a constant struggle to keep up with them. Moreover, by using a statistical technique known as cluster analysis, we can identify groups (or clusters) of people who reported broadly similar patterns of behaviour with regard to keeping up with payments, overdrafts and frequent use of a credit card to make ends meet. The results of this analysis show that categorising people into five groups provides a useful indicator of the risk they might be at if they faced an economic shock. We show in Table 2.1 how these clusters are related to the indicator variables. These five groups have quite different profiles with regard to making ends meet. Group one (the largest group – 58 per cent of people) seemed not to be exhibiting any real signs of financial strain (Table 2.1). Most said they were keeping up with their regular commitments easily, all were never or hardly ever overdrawn, and only a very small number frequently used a credit card to meet daily living expenses. We have, therefore called them the ‘Financially sound’. Hardly any of these people said that they regularly ran out of money (Table 2.2). It also is interesting to note that this group was one of only two that included people who were unbanked – 10 per cent of them did not have an account in their household and a further nine per cent did have one but did not use it for day-to-day money management. Group two (the second largest – 25 per cent) were managing reasonably well financially, and did not appear to be at imminent risk of financial distress (Table 2.1). Compared with the financially sound they were more likely both to have overdrawn their accounts from time-to-time and to have made frequent use of a credit card to make ends meet. While most were keeping up with their commitments a significant number found it a struggle to do so, with a minority saying it was a constant struggle. We have, therefore described these as ‘Managing reasonably well’. Again hardly any of them said that they regularly ran out of money, although a quarter said that they sometimes did (Table 2.2).

Overstretched: People at risk of financial difficulties___________________________
16
Table 2.1 Indicators of making ends meet by cluster groups Column percentages
Cluster group 1 2 3 4 5 All
How well keeping up with commitments including mortgage Keeping up easily 78 58 43 0 0 64 Keeping up occasional struggle 22 36 45 0 0 26 Constant struggle 0 5 12 55 57 7 Falling behind 0 0 0 45 43 3
How regularly overdrawn on current account Virtually always 0 0 100 0 81 10 Sometimes 0 44 0 6 19 12 Overdrawn, but don’t know how regularly 0 56 0 9 0 14 Never 100 0 0 85 0 64
Has used credit card to make basic payments every other month on mortgage No 97 88 86 93 25 92 Yes 3 12 14 7 75 8
Base (weighted) 3,115 1,332 478 320 83 5,328
Group three (nine per cent) is interesting in that these people exhibited behaviour that suggests they may have been financially distressed – they were all constantly overdrawn and a minority had frequently used their credit card to make ends meet (Table 2.1). Most of them claimed to be keeping up with repayments on their household commitments, though many occasionally found it a struggle and one in eight said it was a constant struggle. This would seem to suggest that they were possibly on the brink of financial difficulties. We have therefore coined the term ‘Showing financial stress’ for this group. Moreover, when asked how often they ran short of money, four in ten said they ‘hardly ever’ or ‘never did’ and a further three in ten said that it happened ‘sometimes’ (Table 2.2). Given that they were all constantly overdrawn, this indicates they may possibly have been burying their heads in the sand. Table 2.2 Frequency of running out of money before end of the week/month, by level of financial stress
Column percentages
Financially sound
Managing reasonably
well
Showing financial
stress
Struggling on low income
Struggling and over-indebted
Total
Always 2 1 12 18 14 4Most of the time 4 6 20 28 35 8Sometimes 10 26 28 29 40 17Hardly ever 15 31 19 15 8 19Never 68 35 20 10 2 51Don’t know 0* 1 0* 0 0 0*
Base (weighted) 3,115 1,332 478 320 83 5,328
* Less than one per cent.

___________________________________________________The current situation
17
Groups four (six per cent) and five (two per cent) both show clear signs of financial difficulties (Table 2.1). In both cases, four in ten admitted to falling behind with bills and other commitments and more than half said that they were keeping up with them but found it a constant struggle. However, whilst three-quarters of group five (the smallest group) was making regular use of both credit cards and overdrafts to make ends meet, hardly any of those in group four were doing so. In fact group five included a high proportion of people in unbanked households. Six in ten (59 per cent) did not use a bank account for day-to-day money management and a third (32 per cent) had no bank account at all. Also, as we show below, people in group four were quite disproportionately people on low incomes. We have, therefore, called group four ‘Struggling on a low income’ and group five ‘Struggling and over-indebted’. Even so, only around half of people who were struggling on a low income and a similar number of those who were struggling and over-indebted admitted to running out of money regularly (Table 2.2). In the latter case at least, this almost certainly represents a degree of self-delusion given their reliance on credit to make ends meet. These findings are consistent with other recent research which has identified only a minority of people facing financial difficulties, most of whom do so as a result of low income (Kempson, 2002; Kempson, McKay and Willits, 2004). At the same time, it also lends support to the emergence of evidence that there is a smaller group of people who are getting into difficulty through over-borrowing (DTI, 1996; Elliott, 2005; Kempson, 2002). Who is facing financial stress? There were clear differences between the five groups of people both in terms of their economic circumstances and their personal characteristics that go some way towards explaining the financial strain they faced. Economic circumstances For the most part, the economic circumstances of the financially sound were typical of the population as a whole (Table 2.3). Their median (equivalised4) household incomes were slightly below the national average (£1,000 a month) and they included slightly more people in the lowest two income deciles. More notably, they included fewer people in full-time work and rather more who were retired than the population at large. They also included the second smallest proportion of self-employed people. Unfortunately, the financial capability data set does not include details of the type of work done by respondents or their partners. It does, however, include the highest educational attainment which can be used as a proxy for the nature of employment people are likely to undertake. As can be seen at the bottom of Table 2.3, this group had educational levels that were broadly equivalent to the population as a whole. Reflecting their older age, they included a slightly above-average number of people without qualifications.
4 In all cases incomes refer to total net household incomes and have been adjusted (‘equivalised’) to take account of the number of people living in the household

Overstretched: People at risk of financial difficulties___________________________
18
In contrast, those who were managing reasonably well were disproportionately those who were better-off (Table 2.3). They had by far the highest median incomes of the five groups (£1,700 a month) and six in ten of them were in the top two income quintiles. Two-thirds of them lived in households where the main earner was in full-time work and they included the highest proportion of people in two-earner households. They included the largest proportion of people in households that were headed by someone who was self-employed and were the most highly educated of the five groups. In many ways those who were showing financial stress had rather similar economic circumstances to those who were managing reasonably well (Table 2.3). Their median household incomes were slightly lower (£1,400 a month) but even so, almost half were in the top two income quintiles. Although most lived in households headed by someone in full-time work, they included the largest proportion of people in full-time education (nine per cent). Hardly any were retired. Compared with the people managing reasonably well they included more people living in a household with a single earner and fewer with two earners. They were the second most highly qualified of the five groups. As we have indicated above, the group we have termed struggling on a low income were, indeed on very low incomes (Table 2.3). More than six in ten were in the lowest two income quintiles and their median household incomes were just £780 a month, compared with an average of £1,179. More than six in ten lived in households where no-one was in employment and they included by far the largest proportions of households headed by people who were unemployed (20 per cent), not working through sickness or disability (12 per cent) or caring full-time for a family (19 per cent). They included the smallest number of self-employed people and had the lowest level of educational qualifications of all. Indeed, almost half had none at all. The final group - those seriously struggling and over-indebted – was disproportionately people on middle-incomes (55 per cent) and their median monthly incomes (£1,309) were only slightly above the average (Table 2.3). Although they included above-average proportions of people living in households headed by someone in work, they also included the second-highest proportions of people not working through sickness or disability (10 per cent) or caring full-time for a family (11 per cent). They included above-average numbers of people living in a household headed by someone who was self-employed. They were also particularly unlikely to be educated beyond A level.

___________________________________________________The current situation
19
Table 2.3 Economic circumstances, by level of financial stress Column percentages
Financially sound
Managing reasonably
well
Showing financial
stress
Struggling on low income
Struggling and over-indebted
Total
Median equivalised monthly household income (£) £1,000 £1,700 £1,400 £780 £1,309 £1,179
Quintiles of equivalised household income 1 (lowest) 23 12 15 34 17 202 24 12 14 27 20 203 21 18 25 18 18 204 17 27 22 15 34 205 (highest) 16 31 25 6 11 20
Number of full or part-time earners None 51 22 22 63 29 42One 30 38 45 26 45 33Two 19 40 33 12 26 25
Work status of main earner Full-time work 39 66 67 27 57 48Part-time work 8 9 10 8 12 9At home 4 4 3 19 11 5Retired 34 10 3 9 0 23Unemployed 6 4 5 21 2 6Sick or disabled 4 2 4 12 10 4Full-time education 4 5 9 3 7 5
Household headed by self-employed person? Yes 7 11 9 5 10 8No 93 89 91 95 90 92
Highest educational qualification Degree or above 16 27 24 8 14 19HND/HNC 10 14 11 7 14 11A level 12 18 22 12 33 15Trade apprenticeships 6 5 4 4 4 6
GCSE 17 18 20 21 21 18None of the above 38 18 19 48 14 31
Base (weighted) 3,115 1,332 478 320 83 5,328
Personal and household characteristics Turning now to the personal characteristics, we can see that the youngest of the five groups was those who were struggling and over-indebted (Table 2.4). They had an average age of 35 – indeed two-thirds of them were aged under 40 and they included no-one aged over 60. Reflecting their age profile, they included above average proportions of families with children – with lone parents, in particular, being twice as common as in the population as a whole. They included the highest proportion of larger families, with three or more children. The group who were showing financial stress also included a large proportion (almost six in ten) of people aged under 40, with an average age of 38 (Table 2.4). In this

Overstretched: People at risk of financial difficulties___________________________
20
case, couples - both with and without dependent children - were over-represented. Lone parents, however, were not. At the other extreme, those who were financially sound were appreciably older, with an average age of 53 and more than four in ten were aged 60 or over; while under 30’s were greatly under-represented (Table 2.4). Again this age profile was reflected in their family circumstances and people in both single and couple pensioner households were far more common than in any of the other four groups. The group of people who were struggling on a low income were slightly younger than average with a median age of 42 (Table 2.4). Although young people, aged under 40 were more common than in the population as a whole, they were not nearly as numerous as among the people who were either struggling and over-indebted or showing financial stress (Table 2.4). They included the largest groups of single non-pensioners and of lone parents. Indeed lone parents were three times as common as in the general population. They also included the second highest proportion of larger families, with three or more dependent children. Table 2.4 Personal characteristics by level of financial stress
Column percentages
Financially sound
Managing reasonably
well
Showing financial
stress
Struggling on low income
Struggling and over-indebted
Total
Average age (Mean) 53 44 38 42 35 48
Age of older partner 18-19 4 2 3 2 2 320-29 10 16 27 18 29 1430-39 14 26 26 28 33 1940-49 15 23 23 22 26 1850-59 16 18 14 17 10 1660-69 19 10 5 7 0 1570+ 23 5 1 6 0 15
Family type Single adult (not retired) 11 11 10 17 12 11
Single (retired) 14 3 1 4 0 9Couple with no children (not retired) 14 22 20 10 19 17
Couple with no children (retired) 17 6 1 3 0 12
Lone parent with children 9 10 12 31 23 11
Couple with children 17 33 30 19 30 22Other 18 16 26 15 17 18
Base (weighted) 3,115 1,332 478 320 83 5,328
People who were managing reasonably well were a little older – 44 on average but all age groups under 50 were over-represented (Table 2.4). Three types of families were

___________________________________________________The current situation
21
particularly common among them – couples without children, couples with dependent children and couples living with adult children. Housing and geographical distribution There were also significant differences in housing tenure across the groups (Table 2.5). The proportion of mortgagors was highest among people who were managing reasonably well, although those showing financial stress and people who were seriously struggling and over-indebted also included well above-average numbers of home buyers (Table 2.5). The key differences between these three groups were that those managing reasonably well included the second highest proportion of outright owners; the people showing financial stress included the largest group of non-householders; while those who were seriously struggling and over-indebted included an above-average proportion of local authority and housing association tenants. Given their age and incomes, it is not surprising to find that a high proportion of the financially sound were outright owners, although, having said that, the proportion of social tenants was about average (Table 2.5). In contrast, over half of those who were struggling on a low income were tenants in the social rented sector – two and a half times the national average. Table 2.5 Housing and geographical distribution by level of financial stress
Financially sound
Managing reasonably
well
Showing financial
stress
Struggling on low income
Struggling and over-indebted
Total
Housing tenure Mortgage 26 54 48 22 48 35Private rent 9 11 16 16 16 10Local authority rent 21 14 18 52 28 21Own outright 37 14 5 4 0 26Other 7 7 13 7 8 8
Geographic region North East 5 3 4 3 0 4North West 12 11 10 11 5 11Yorkshire/Humber 9 7 8 7 1 8East Midlands 8 7 7 6 6 7West Midlands 9 10 7 11 10 9East 10 9 6 5 4 9London 10 14 14 18 22 12South East 12 15 20 12 21 14South West 8 9 8 6 18 9Wales 5 5 6 6 5 5Scotland 9 8 8 12 6 9Northern Ireland 3 2 1 6 2 3
Base (weighted) 3,115 1,332 478 320 83 5,328

Overstretched: People at risk of financial difficulties___________________________
22
There were also some important variations by region (Table 2.5). So people who were financially sound were most likely to live in the three regions in the North of England and included the smallest proportions in London or the South East. Those showing financial stress were particularly likely to live in the South East of England; while people who were struggling and over-indebted disproportionately lived in London, the South East or the South West and included very few people in the North of England, Scotland or Northern Ireland (Table 2.5). Taken together with their housing tenure, this is the first indication that these two groups of people might be struggling with high mortgages. People struggling on a low income included relatively high proportions of people who lived in the North West, West Midlands and London – indicating a concentration in the main urban conurbations (Table 2.5). They also included disproportionate numbers of people living in Northern Ireland and Scotland. Finally for completeness sake, it should be noted that people managing reasonably well were distributed across the UK in a similar way to the population as a whole (Table 2.5). Levels of borrowing and saving Across the population as a whole, two-thirds of people said they had no regular repayments to make on unsecured credit and a little over a half had none on either unsecured credit or a mortgage. The average (median) amount owed among people with unsecured loans, overdrafts or credit cards was £2,000. Only a small minority (six per cent) of people had repayments on unsecured credit that were equivalent to a fifth or more of their net household income; and a similar number (five per cent) were paying more than a half of their income on unsecured credit and/or mortgage repayments (Tables 2.6 and 2.7). It is interesting to note that, although levels of borrowing have increased appreciably over the past 15 years, the proportion of income devoted to paying unsecured credit and mortgages in 2005 was very similar to that found in the late 1980s (just before the economic downturn and rapid rise in arrears) when interest rates were far higher (Berthoud and Kempson, 1992). A little over half (55 per cent) of the people interviewed had something in savings; the average (median) amount being £3,500. One in five had substantial amounts – equivalent to five or more months’ household income (Table 2.8). Borrowing Levels of unsecured borrowing were at their lowest among those who were financially sound – two thirds of whom owed nothing at the time they were interviewed (Table 2.6). The average amounts owed by the people who had borrowed were half the national average at £1,000. Consequently, fewer than one in twelve of people who were financially sound were spending more than 10 per cent of their income repaying unsecured credit. As we saw earlier, this group of people included below-average numbers of mortgagors, consequently two-thirds of them had no repayments on either

___________________________________________________The current situation
23
unsecured or secured borrowing and only a small minority (one in eight) were spending more than 20 per cent of their household income on these combined payments (Table 2.7). The average amount spent by people who did have these commitments was just over 14 per cent of their monthly income. People who were managing reasonably well also had about average unsecured credit commitments – three in ten owed nothing and the borrowers among them owed £2,000 on average (Table 2.6). Consequently eight in ten paid less than a tenth of their income on repaying unsecured credit. They were, however, rather more likely to be mortgagors and, consequently, only a third of them was making no repayments on either a mortgage or unsecured credit (Table 2.7). That said, two thirds paid less than 20 per cent of their income repaying money they had borrowed. On average those with mortgages or unsecured credit commitments were paying 20 per cent of their monthly income servicing them. Table 2.6 Levels of unsecured borrowing by level of financial stress
Financially sound
Managing reasonably
well
Showing financial
stress
Struggling on low income
Struggling and over-indebted
Total
Percentage owing any money 33 71 100 65 100 51Total amount owed (median) – borrowers only £1,000 £2,000 £3,345 £805 £3,200 £2,000 Monthly repayments as % of net household income (median) – borrowers only 6.4 7.4 9.9 11.5 14.8 7.5
Monthly repayments as % of net household income – column percentages No debt repayments 79 52 37 56 14 6610 per cent or less 14 31 31 20 33 2011-20 per cent 4 11 15 9 16 721-30 per cent 1 3 8 7 15 331-40 per cent 1 1 4 3 6 141-50 per cent 0* 1 2 2 7 1More than 50 per cent 1 1 2 3 7 1Don’t know 0* 0* 1 0* 2 0*
Base (all) (weighted) 3,115 1,332 478 320 83 5,328Base (borrowers) (weighted) 798 426 781 189 79 2,273
* Less than one per cent. Note: The proportion of people owing any money is greater than the proportion repaying credit commitments as some people only had an overdraft. The two groups of people who were most heavily committed to repaying money they had borrowed were those showing financial stress and, in particular, the group who were struggling and over-indebted. Taking those showing financial stress first, almost all of them had some form of unsecured credit and the average amount they owed was £3,345 each – the highest of the five groups (Table 2.6). Six in ten had regular credit repayments to make and a minority of them (16 per cent) were spending

Overstretched: People at risk of financial difficulties___________________________
24
more than 20 per cent of their income repaying unsecured credit commitments. As they were also very likley to be mortgagors, three-quarters of them had regular repayments to make on a mortgage and/or unsecured credit and in almost three in ten cases this accounted for 30 per cent or more of their income (Table 2.7). One in ten of them were very heavily committed, spending half or more of their income in this way. People with a mortgage and/or unsecured credit commitments spent, on average 24 per cent of their monthly income on the repayments. In all respects, the small group of people who were struggling and over-indebted exhibited the most marked signs of having over-committed themselves with borrowing. All of them owed money and only 14 per cent of them said they had no regular repayments on unsecured credit (although all of them, of course, had an overdraft) (Table 2.6). The average amounts they owed were £3,200 and one in five of them was paying 30 per cent or more of their income in unsecured credit repayments. They were also very likely to have a mortgage, so more than nine in ten of them made regular repayments on either a mortgage or unsecured credit (Table 2.7). Over four in ten of them were spending 30 per cent or more of their income in this way, including one in five who were paying out more than half of their income. The average amount spent on repayments by those who did owe money on mortgages or unsecured credit was 29 per cent of their monthly income. One in five spent more than half of their income this way. Table 2.7 Total borrowing (unsecured credit and mortgages) by level of financial stress
Financially sound
Managing reasonably
well
Showing financial
stress
Struggling on low income
Struggling and over-indebted
Total
Percentage owing any money 47 84 100 72 100 63
Monthly repayments as % of net household income (median) – borrowers only 14.4 19.9 23.6 19.7 28.6 18.3
Monthly repayments as % of net household income – column percentages No debt repayments 66 34 25 49 8 5210 per cent or less 13 17 17 17 17 1511-20 per cent 9 16 13 8 11 1121-30 per cent 6 14 17 8 18 931-40 per cent 3 8 12 4 11 541-50 per cent 1 4 6 3 12 3More than 50 per cent 2 6 9 10 21 5Don’t know 0* 0* 1 0* 2 0*
Base (all) (weighted) 3,115 1,332 478 320 83 5,328Base (borrowers) (weighted) 1,035 871 350 159 74 2,489
* Less than one per cent. Note: The proportion of people owing any money is greater than the proportion repaying credit commitments as some people only had an overdraft.

___________________________________________________The current situation
25
That leaves the group of people who were struggling on a low income. On the whole, these people were not heavy users of unsecured credit. Although two-thirds of them owed money, the average amount owed by borrowers was £805. Three-quarters of them were paying 10 per cent or less of their income on unsecured credit repayments. They did, however, include an above average proportion (eight per cent) of people whose unsecured credit repayments consumed 30 per cent or more of their income. In their case though, it was low income, rather than heavy borrowing that accounted for this. As they were also unlikely to be buying a home on a mortgage almost half of them had no regular payments on either a mortgage or unsecured credit (Table 2.7). Indeed, as six in ten of them were tenants and lived in a household where no-one was in work, their housing costs would have been met in full by Housing Benefit. Even so, they did include one in ten people whose combined mortgage and unsecured credit repayments were more than half their income – again largely due to low income (Table 2.7). On average, people in this group who did have repayments to make were paying 20 per cent of their income doing so. Savings There were noticeable differences across the five groups in terms of savings and investments that complement the picture with regard to borrowing (Table 2.8). Table 2.8 Levels of saving by level of financial stress
Financially sound
Managing reasonably
well
Showing financial
stress
Struggling on low income
Struggling and over-indebted
Total
Percentage with any saving 52 62 59 34 58 54
Total amount saved (median) – savers only £6,000 £3,300 £800 £200 £400 £3,501
Total saved as a % of net household income (median) 432 200 64 21 30 256Total saved as % of net household income – column percentages No savings 48 38 41 66 42 460-25 per cent 8 13 20 17 25 1126-50 per cent 3 5 6 2 8 451-100 per cent 4 7 6 4 10 5101-200 per cent 4 7 5 4 2 5201-500 per cent 8 11 9 2 7 8More than 500 per cent 24 20 11 5 4 20
Don’t know 1 0* 1 0* 2 1
Base: all (weighted) 3,115 1,332 478 320 83 5,328Base: savers (weighted) 1,636 831 281 109 48 2,904
* Less than one per cent.

Overstretched: People at risk of financial difficulties___________________________
26
The people who appeared to be financially sound tended to be polarised. Over half had some savings or investments (about the average for the population as a whole), a little under a quarter had a sufficient amount saved to cover their total household income for five months or more (Table 2.8). Those with savings had an average of £6,000 put by - equivalent to almost four and a half months of their total household income. Likewise almost six in ten people who were managing reasonably well had money put by (Table 2.8). In this case the average amount was £3,300 – or the equivalent of two months’ income. While almost one in five had less than a half of their total monthly income set aside a similar number had the equivalent of five or more months’ income saved. Although six in ten of those who were showing financial stress said they had something in savings or investments, most of these had only small amounts (Table 2.8). The average sum they had saved was £800 – about three-fifths of their total monthly income. In fact one in five had the equivalent of less than a quarter of their income put by; although one in ten did claim to have the equivalent of five months’ income either saved or invested. The situation for the people who were struggling and over-indebted was very similar. The main difference was that most of those with savings had small amounts and very few had less than five months’ income put by. That leaves the people who were struggling on a low income, whose savings profile reflected their financial situation generally (Table 2.8). On average those with savings had only £200 put by – less than a week’s income. Two-thirds of them had nothing at all saved and most of the rest had less than a month’s income. Attitudes to money management On the whole, people’s attitudes to money management went a long way towards explaining the degrees of financial strain they felt. The financial capability survey included a series of attitude statements and people were asked how strongly they agreed or disagreed with them (Table 2.9). They included: ‘I am impulsive and tend to buy things even when I can't really afford them’ ‘I am more of a saver than a spender’ ‘I prefer to buy things on credit rather than wait and save up’ ‘I would rather cut back than put everyday spending on a credit card I couldn't repay in full each month’ These statements had been subject to rigorous testing5 and seemed to capture people’s attitudes well. It is, however, important to note that while most of this chapter relates to households as a whole, the attitudes reported are those of the person interviewed only. 5 E Kempson, N Moore and S Collard (2005) Measuring financial capability: an exploratory study. Financial Services Authority

___________________________________________________The current situation
27
People who were financially sound almost all said they did not agree that they were inclined to buy things on impulse and they largely described themselves as savers. They were strongly opposed to buying things on credit and were very much in agreement with not putting everyday spending on a credit card they couldn’t repay at the end of the month (Table 2.9). People who were managing reasonably well held similar views but not as strongly (Table 2.9). They included slightly more people who described themselves as spenders, and slightly more people who were prepared to buy things on credit rather than wait and save up. Table 2.9 Attitudes to money by level of financial stress
Column percentages
Financially sound
Managing reasonably
well
Showing financial
stress
Struggling on low income
Struggling and over-indebted
Total
I’m impulsive Agree strongly 5 6 12 20 20 7Tend to agree 10 17 23 23 30 14Tend to disagree 25 38 36 24 28 29Disagree strongly 60 40 27 32 22 50Don’t know 0* 0 1 0* 0 0*
I’m more of a saver than a spender Agree strongly 26 12 8 8 8 19Tend to agree 43 36 21 19 12 37Tend to disagree 23 39 42 36 37 30Disagree strongly 8 11 29 37 42 13Don’t know 1 1 0* 0 0 1
I prefer to buy things on credit Agree strongly 3 5 10 9 18 5Tend to agree 10 23 25 18 31 15Tend to disagree 26 33 32 23 29 28Disagree strongly 60 39 32 49 22 51Don’t know 0* 0* 0* 0 0 0*
I would rather cut back on everyday spending than use a credit card Agree strongly 68 56 46 50 31 61Tend to agree 19 28 30 26 35 23Tend to disagree 6 11 17 12 24 9Disagree strongly 6 5 7 10 10 6Don’t know 1 0* 1 2 0 1
Base (weighted) 3,115 1,332 478 320 83 5,328
* Less than one per cent. Those who were struggling on a low-income were particularly likely to describe themselves as spenders and as impulsive shoppers but were, on the whole, against using credit either for everyday purchases or to buy things they could not afford (Table 2.9). People showing financial stress also included large proportions of people who described themselves as spenders and/or as impulsive shoppers (Table 2.9). Although

Overstretched: People at risk of financial difficulties___________________________
28
they were largely against using a credit card for everyday spending they were much more likely than average to say they preferred to buy things on credit rather than wait until they had saved the money. It was, however, those who were struggling and over-indebted who showed the strongest signs of financial profligacy (Table 2.9). Half of them described themselves as impulsive shoppers and eight in ten said they were more of a spender than a saver. Half agreed that they would buy things they could not afford on credit and a third that they would put everyday spending on a credit card they could not afford to repay rather than cut back. Exceptional expenditure People had been asked if they (or their partner if they had one) spent more than £200 a month on any of a list of key areas of exceptional expenditure. These included travel to work; rent on a second home needed for work; child care; care for someone else (e.g. nursing home fees); school fees; or financial support for someone not living with them, such as child support, or supporting a young adult at university. Altogether 15 per cent of people said that they did. This proportion was lowest among people who were financially sound and below-average for those struggling on a low income (Table 2.10). The remaining three groups all included disproportionate numbers of people with exceptional expenditure of this kind. Table 2.10 Major expenditure of £200 a month or more by level of financial stress
Column percentages
Financially sound
Managing reasonably
well
Showing financial
stress
Struggling on low income
Struggling and over-indebted
Total
Yes 11 21 22 13 21 15No 89 79 78 87 79 85
Base (weighted) 3,115 1,312 478 320 83 5,328
Summary Focussing on the current situation, this chapter shows that most of the UK population were keeping up with bills and commitments, were not constantly in overdraft nor were they using a credit card they did not repay in full to buy food, pay bills or get cash. However, a minority of people were exhibiting at least one of these strains, some of whom showed two or more. Using a statistical technique known as cluster analysis we have been able to segment the population according to the degree of financial strain they exhibited. This showed that almost six in ten people seemed financially sound and showed no real signs of financial strain. They tended to be older people and especially those in retirement.

___________________________________________________The current situation
29
Although their incomes were not especially high, they owed remarkably little money as either unsecured credit or mortgages and were cautious money managers. They divided into those with little or no savings and those with substantial amounts put by. The second largest group – a quarter of the population – were managing reasonably well financially. These people were well-qualified, disproportionately well-off and included many living in households with two earners. Indeed most of them were couples – either with or without dependent children. They had relatively light unsecured credit commitments, but included the highest proportion of mortgagors so that, on average, a fifth of their incomes was spent repaying money they had borrowed. Most had savings or investments and many had significant amounts put by. We then have a group – just under one in ten of the population – who were showing signs of financial stress – all said they were always overdrawn as well as showing other signs of financial stress. Yet as a group they seemed to be burying their heads in the sand as many of them considered that they were living well within their means. They were relatively young but well-qualified and quite well-off. Their levels of borrowing were high for both unsecured credit and mortgages and they had very little money saved or invested. They tended to be spenders, who bought things on impulse, using credit rather than saving up. They also included an above-average proportion of people with exceptional expenditure to meet. That leaves two groups who were clearly struggling financially and included most of those already in arrears. The first of these – six per cent of the population – were generally living on low incomes. But although many were falling behind with bills and other commitments, they were not relying on overdrafts or credit cards to make ends meet. Indeed, given their incomes, many would not have passed the score cards for either of these sources of credit. More than six in ten lived in a household with no-one in either full or part-time work and had the lowest levels of educational attainment of the five groups. They also included a high proportion of lone parents and of local authority and housing association tenants. On the whole, these people were not heavy users of unsecured credit nor were they likely to have a mortgage. At the same time, they had very little money saved. They were, however, particularly likely to describe themselves as spenders and impulsive shoppers, although they were generally opposed to using credit. The smallest group – just two per cent of the population – were struggling financially mainly because they were over-indebted. In many respects they were similar to those who were showing financial strain, but included more of the types of people at greatest risk of financial difficulties. They were the youngest of the five groups – indeed two-thirds of them were aged under 40. Most were families with dependent children. They were concentrated in the middle of the income range but had very heavy unsecured credit and mortgage commitments relative to their income. They also had little money saved or invested. They were the most financially profligate of the five groups. Most described themselves as spenders, not savers; said they bought things on impulse; preferred to buy things on credit rather than wait until they could afford them; and they included the largest group of people who said they were willing to put everyday spending on a credit card rather than cut back – indeed, many of them were doing just this. They, too, included an above-average proportion of people with exceptional expenditure to meet.

Overstretched: People at risk of financial difficulties___________________________
30
3 Risks associated with expenditure increases Having taken stock of people’s financial situation at the time they were interviewed, in this chapter we investigate the impact of two areas of expenditure increase: fuel bills and mortgages. Although these are by no means the only expenditure increases to have hit consumers, they are the ones that have attracted most comment. The Trade and Industry Select Committee has conducted an inquiry into fuel price rises (Trade and Industry Select Committee, 2005a and 2005b) and both the Bank of England and the Financial Services Authority have issued warnings about the high level of mortgage borrowing (Financial Services Authority, 2006b). At the time of writing, both fuel charges and mortgages have attracted considerable media attention, albeit for rather different reasons. Although fuel bills account for a relatively small proportion of household budgets (averaging £58 a month, or 4.1 per cent of net household income, at the time of the baseline survey of financial capability), they have risen far faster than the rate of inflation. Between July 2005 and October 2006, the six largest energy suppliers in the UK raised prices by between 23 and 49 per cent, giving rise to concerns about how well households who are already over-stretched and / or living on low incomes would cope with the increase. In this chapter we look first at levels of expenditure before these price increases and how these varied across the population. In doing so, we use three measures: monthly expenditure on fuel; the percentage of income (after tax) spent in this way and the money left after fuel bills had been paid. We then examine the likely impact of the increase in prices, finding that, as expected, they will have had the greatest impact on poor people and those aged over 70, but that they will not have had a major effect on most households’ ability to make ends meet. This is consistent with evidence given by Citizens Advice to the Trade and Industry Select Committee inquiry (Citizens Advice, 2005). With mortgages the chief concern has been the large increase in the sums of money that have been borrowed, raising questions about the ability of some mortgagors to keep up with repayments should interest rates rise. In contrast, with fuel bills, mortgages account for a far higher proportion of household income (averaging £400 a month, or 20 per cent of net household income, at the time of the baseline survey of financial capability). At the time of writing, there had already been a 0.25% rise in the Bank of England base rate since the financial capability survey (increasing mortgage repayments by around five per cent) and a further increase of this size seemed imminent. We, again, use three measures to look at mortgage expenditure before the 0.25% rise in base rate: monthly expenditure; the percentage of income (after tax) consumed by mortgage repayments and the money left after the mortgage had been paid. We then investigate the link between mortgage repayments and three measures of economic

________________________________Risks associated with expenditure increases
31
well-being to identify the level at which repayments are potentially problematic. This shows that, for the majority of mortgagors, their monthly repayments were relatively modest and could be met without difficulty. But the ability to make ends meet declined the more of their income people spent repaying their mortgage. To assess the impact of interest rate increases we first looked at how well mortgagors believed they would cope with a rise that would increase their monthly repayments by 10 per cent, and then developed a statistical model to predict how many would get into difficulty. This showed that far fewer people would actually get into difficulty than feared that it might happen. While more than two in ten mortgagors anticipated financial difficulties following a rise of this size, in fact only one in a hundred seemed likely to do so. Taken together, the findings in this chapter are consistent with previous research which has shown that, across the population as a whole, increases in expenditure are not a major cause of financial difficulties. They are, however, often a contributory factor (Ford, Kempson and Wilson, 1995; Herbert and Kempson, 1995) Fuel bills Data imputed from the 2004/5 Expenditure and Food Survey and added to the financial capability data6 set shows that average (median) fuel bills across the year averaged £58 a month7 - or 4.1 per cent of household income. This would leave households with an average disposable income of £1,155 a month after tax and meeting their fuel bills. There were, however, considerable variations in these figures across the UK and between people in different circumstances (Table 3.1). People in Northern Ireland had by far the highest fuel bills, both in cash terms (averaging £74 (median) a month) and as a proportion of their net household income (6.5 per cent.) They also had amongst the lowest disposable incomes after meeting the costs of fuel (£974 a month). At the other end of the spectrum, people living in England spent the least on fuel and as a proportion of income (3.9 per cent)8. People in England also had the highest incomes after meeting housing costs (£1,212). As might be expected, those on low incomes spent less on fuel than those who were better off (Table 3.1). People in the poorest fifth of households9 spent £45 a month on fuel, compared with a monthly expenditure of £60 among people in the richest fifth of households. But, despite paying less in cash terms fuel bills had a much larger impact on household budgets the poorer people were. So, people in the poorest fifth of households spent 11.1 per cent of their income on fuel and were left with £371 after doing so. In contrast, those in the richest fifth of households spent an average of 1.9 per cent of income and had £3,100 left over. 6Because expenditure on fuel was not collected in the FSA baseline survey of financial capability, we have imputed data using the 2004/5 Expenditure and Food Survey data. See Appendix 1 for details of how this was done. It should also be noted that non-householders (mostly young people living with their parents) have been omitted from this analysis). 7 Note all averages in this chapter are medians. 8 Because of the way that this data was imputed it is not possible to break this down further into region. 9 As before the unit of analysis was strictly the ‘family unit’ – that is the respondent and their partner if they had one.

Overstretched: People at risk of financial difficulties___________________________
32
Table 3.1 Fuel expenditure by family and economic circumstances (householders only)
Amount of
fuel per month (£)
Base % of incomeon fuel
Disposable income after
fuel bills
Base (weighted)
All 58 4,991 4.1 1,173 4,917
Country England 58 4,188 3.9 1,212 4,121 Wales 59 245 4.8 971 244 Scotland 56 431 4.6 1,023 424 Northern Ireland 74 128 6.5 974 128
Quintiles of equivalised income 1 (lowest income quintile) 45 901 11.1 371 827 2 45 996 6.7 685 996 3 53 996 4.5 1,098 996 4 58 1,043 3.1 1,756 1,043 5 (highest income quintile) 60 1,055 1.9 3,100 1,055
Housing tenure Mortgage 62 1,875 3.0 1,968 1,863 Private rent 45 543 3.9 1,038 525 Local authority rent 41 1,124 5.0 724 1,114 Own outright 59 1,371 5.6 930 1,339
Age Up to 29 45 620 4.3 952 590 30-39 58 974 3.3 1,579 969 40-49 58 966 3.2 1,705 964 50-59 58 857 3.5 1,459 840 60-69 58 778 5.3 899 763 70+ 50 797 6.2 698 790
Family type Single adult (not retired) 44 584 4.1 889 573 Single adult (retired) 45 491 6.0 580 484 Couple, no children (not retired) 58 885 2.8 1,854 883 Couple, no children (retired) 59 629 6.0 849 610 Lone parent with children 44 544 4.7 839 542 Couple with children 68 1,175 3.0 2,029 1,172 Other 58 683 5.4 942 653
Number of earners None 45 2,061 6.6 624 1,995 One 54 1,596 3.6 1,357 1,590 Two 62 1,334 2.4 2,396 1,332
Education Degree or above 58 1,124 3.1 1,659 1,109 A Level 58 660 3.5 1,477 640 Apprenticeship 58 290 5.1 1,000 290 GCSE C and above 58 875 4.1 1,255 865 GCSE below C 50 330 4.8 956 329 Other 47 201 5.6 752 195 None 47 1,104 5.9 721 1,091

________________________________Risks associated with expenditure increases
33
Variations by family characteristics were also what might have been expected (Table 3.1). So couples spent a good deal more than single people and the presence of dependent children in a household also increased the amounts spent on fuel. However, we found that single people spent a higher proportion of their income on fuel than couples and, in each case, the presence of children increased the proportion slightly. Likewise single people had less income left over after paying their bills.
Interestingly, pensioner households spent a much higher proportion of their income on fuel than younger households of a similar size (Table 3.1). They also had very much lower incomes after meeting the costs of fuel. They would, however, qualify for the winter fuel allowance which in the winter of 2005/6 was £200 for many people aged 60 to 79 and £300 for people aged 80 or over10.
There was little variation in the amount spent on fuel across the age groups, although people in their seventies did spend nearly £8 less a month than people aged between 30 and 70 (Table 3.1). In part, this will be because of the larger number of single person households in this age group, but it may also indicate a propensity to cut back on heating that has been highlighted in previous studies (Dominy and Kempson, 2006). It was clear that the proportion of income spent on fuel began to increase beyond the age of 60 and there was a steep decrease in the income left from that age too. This is a reflection both of the decline in incomes taking place at retirement and of the lower retirement incomes among the very elderly, who are much less likely to have occupational pensions.
Differences across housing tenures largely reflected these variations by income, age and household characteristics. So, local authority and housing association tenants spent much less on fuel than people living in other tenures, while mortgagors spent the most (£41 and £62 a month respectively). But because they were also living on low incomes local authority and housing association tenants had the least left over after meeting fuel costs. On the other hand, it was outright owners (who tend to be elderly) who paid the largest proportion of their income on fuel. Table 3.1 also shows the links between expenditure on fuel bills and the number of earners in the household and people’s educational attainment (as a proxy for type of work done). Not unexpectedly these mirror the findings by income. When do fuel bills become problematic? To assess the levels at which energy prices potentially pose a problem, we have looked at the relationship between reported difficulties making ends meet and both the proportion of household income spent on fuel and the money left after paying fuel bills (Table 3.2). 10 Strictly speaking these amounts apply to pensioners living alone or who are receiving Pension Credit. Generally speaking the amounts are halved for pensioners living as a couple who are not getting Pension Credit

Overstretched: People at risk of financial difficulties___________________________
34
Table 3.2 Expenditure on fuel by measures of financial well-being (householders only)
Amount of
fuel per month (£)
Base (weighted)
% of incomeon fuel
Disposable income after
fuel bills
Base (weighted)
All 58 4,991 4.1 1,173 4,917
How well making ends meet generally Keeping up easily 58 3,185 4.0 1,235 3,124 Keeping up with occasional struggle 53 1,303 4.1 1,201 1,297
Constant struggle 47 331 4.6 948 325 Falling behind 45 172 5.1 826 170
Extent of financial stress Financially sound 58 2,934 4.8 978 2,882 Managing reasonably well 58 1,252 3.1 1,710 1,246 Showing financial stress 58 424 3.4 1,477 414 Struggling on low income 45 305 5.6 768 301 Struggling and over-indebted* 54 76 3.7 1,372 73
* Figures in this row should be treated with caution due to low base. This shows that people almost certainly economise on fuel consumption when they experience difficulty making ends meet. So average expenditure by people who reported that their household was keeping up with bills easily was £58 a month and this declined to £45 a month among those who said they were falling behind with household bills or other commitments. There was also a link between the income left over after paying for fuel and the extent to which people said that they were able to make ends meet. In this case, we also looked at the link between how well people said they were making ends meet and the household income available after paying fuel bills, taking into account of the number of people in the household (that is equivalised income). This showed that there was a relatively large increase in the proportion of people who said that they were either facing a constant struggle to make ends meet or were falling behind with payments on household commitments as equivalised disposable income fell, but that this flattened out when it reached less than £1,000 a month. Turning now to the extent to which people were showing signs of financial stress, we can see that fuel bills had the largest effect on the group of people who were struggling on a low income. Compared with the UK population as a whole, they included almost twice the proportion of people with less than £500 a month (equivalised) left after paying for fuel (51 per cent, compared with the average of 27 per cent). On average they were paying 5.6 per cent of their income on fuel – compared with the national average of 4.1. Interestingly the group where fuel bills had the second-highest impact was those who were financially sound – who as we saw in Chapter 2 were disproportionately pensioners. There are a number of possible reasons for the apparently weak link between the level of fuel bills and the measures of economic well-being just reported. First, despite the

________________________________Risks associated with expenditure increases
35
large increases in charges for domestic fuel, it continues to account for a relatively small proportion of income – certainly compared with mortgages, which we investigate later in this chapter. Secondly, the poorest people and pensioners (most of whom have low incomes) receive a winter fuel payment on top of their normal income to assist with fuel bills and this was not reflected in the data used. Thirdly it is clear from previous research that the effects will be mediated through people’s willingness and/or ability to cut fuel expenditure rather than get into financial difficulties (see, for example, Dominy and Kempson, 2006; Kempson, 1996; Whetstone, 2002). This has shown that there is a divergence in which of these courses of action people are most likely to pursue that is unrelated to income or other economic circumstances. Older people, in particular, tend to cut back far more than younger people on similar incomes. Finally, the lack of a clear relationship might well have arisen because the fuel expenditure data was imputed and added to the financial capability baseline survey data. In other words, we did not have the actual level of expenditure for the people interviewed and the imputation will have under-estimated the numbers of people with very high or very low expenditure.
Effect of fuel price increases Fuel prices have increased in recent years. Between July 2005, the time of the baseline survey of financial capability, and October 2006 the six largest energy suppliers in the UK had increased prices by between 23 and 49 per cent, with increases being slightly higher for gas than for electricity (Table 3.3). Over the same period, there was a comparable increase in the cost of oil for domestic heating. We have, therefore, looked at the impact of a 40 per cent increase in fuel bills in the analysis that follows. However, as we have seen above, when faced with bills that are high relative to income some people cut back their consumption and we might expect this to happen in the face of such large increases in energy costs. An adjustment was therefore made in the following analysis to take this into account (see Appendix 1 for details). Table 3.4 shows the outcome for people in different circumstances, in terms of the increased percentage of their household income they would be paying on fuel. As might be expected, energy price rises bear most heavily on people with low incomes. So, following a 40 per cent rise people in the poorest fifth of households would see fuel bills consume an additional 3.8 per cent of their income, compared with a 0.6 per cent increase in the richest fifth of households. The rises would also impact most on the very young (under twenties)11 and very elderly (over seventies). The other figures included in Table 3.4 largely reflect these income and age differences. So, tenants and outright owners (who tend to be elderly) would experience a larger increase than mortgagors, and households with no earners a much larger one than households with one or two people in paid employment.
11 Note: Non-householders, most of whom were young people living with their parents, have been excluded from this analysis.

Overstretched: People at risk of financial difficulties___________________________
36
Table 3.3 Percentage price increase calendar for the top UK energy suppliers12
Increase effective
British Gas EDF Energy NPower Powergen Scottish Power
Scottish Southern Energy
Gas Elec Gas Elec Gas Elec Gas Elec Gas Elec Gas Elec
2005 July 9.1 6.7 August 15.5 10.7 11.9 7.2 September 14.2 14.2 October 12 5-8 November December 2006 January 13.7 12 13.6 12* February March 22 22 14.7 4.7 15 13.4 24.4 18.4 15 8 April
May 15.9 or 19.4**
9.4
June July 19 8 17 10 August 18.4 9.7 September 12.4 9.4 October 17.2 9.9 November
Total increase 48.6 45.6 49.2 23.4 45.9 35.3 54.7 35.3 44 23-
26 38.6 or
42.1 28.1
* Exact increases for each of SSE’s brands are Scottish Hydro 11.9%, Southern 12% and Swalec 8.9%.. ** 15.9% for dual fuel customers, 19.4% for gas-only customers. There was also a link between how well people said they were making ends meet and the increase they would experience in their fuel bills – but the effect was not large (Table 3.5). Looking, finally, at the extent to which people were showing signs of financial stress, we can see that the price increases would have the greatest impact on the group of people who were struggling on a low income and the much larger group of people who were financially sound (Table 3.5). We had hoped to model the influence of rising fuel prices to see the effect on people’s ability to make ends meet generally without a constant struggle. However, as we note above, it was not possible to identify a strong link with either the proportion of income spent on fuel or the disposable income left after meeting fuel bills. As a consequence we did not pursue this line of enquiry further. 12 Source: www.energywatch.org.uk. The increases shown in Table 3.3 have either taken effect or been announced.

________________________________Risks associated with expenditure increases
37
Table 3.4 Percentage of income spent on fuel before and after energy price increases (householders only)
% of income
on fuel before price rise
% of income on fuel after price
rise
Increase in % after price rise
Base (weighted)
All 4.1 5.5 1.4 4,917
Country England 3.9 5.3 1.4 4,121 Wales 4.8 6.4 1.6 244 Scotland 4.6 6.2 1.6 424 Northern Ireland 6.5 8.8 2.2* 128
Quintiles of equivalised income 1 (lowest) 11.1 14.9 3.8 827 2 6.7 8.9 2.2 996 3 4.5 6.1 1.6 996 4 3.1 4.1 1.0 1,043 5 (highest) 1.9 2.5 0.6 1,055
Housing tenure Mortgage 3.0 4.0 1.0 1,863 Private rent 3.9 5.3 1.4 525 Local authority rent 5.0 6.7 1.7 1,114 Own outright 5.6 7.6 2.0 1,339
Age 18-29 4.3 5.9 1.6 590 30-39 3.3 4.4 1.1 969 40-49 3.2 4.3 1.1 964 50-59 3.5 4.7 1.2 840 60-69 5.3 7.1 1.8 763 70+ 6.2 8.4 2.1 790
Family type Single adult (not retired) 4.1 6.5 1.4 573 Single adult (retired) 6.0 8.1 2.1 484 Couple, no children (not retired) 2.8 3.8 1.0 883 Couple, no children (retired) 6.0 8.1 2.1 610 Lone parent with children 4.7 6.3 1.6 542 Couple with children 3.0 4.1 1.1 1,172 Other 5.4 7.3 1.9 653
Number of earners None 6.6 8.9 2.3 1,995 One 3.6 4.8 1.2 1,590 Two 2.4 3.2 0.8 1,332
*Note: % increase in Northern Ireland likely to be lower than 40% as there is gas supply, and rises in electricity prices have been lower than 40%. ** Figures in this row should be treated with caution due to low base.

Overstretched: People at risk of financial difficulties___________________________
38
Table 3.5 Percentage of income spent on fuel before and after energy price increases by measures of financial well-being (householders only)
% of income on fuel before
price rise
% of income on fuel after price
rise
Increase in % after price rise
Base (weighted)
All 4.1 5.5 1.4 4,917
How well making ends meet Keeping up easily 4.0 5.4 1.4 3,124 Keeping up with occasional struggle 4.1 5.5 1.4 1,297
Constant struggle 4.6 6.2 1.6 325 Falling behind 5.1 6.9 1.8 170
Extent of financial stress Financially sound 4.8 6.5 1.7 2,882 Managing reasonably well 3.1 4.3 1.2 1,246 Showing financial stress 3.4 4.5 1.1 414 Struggling on low income 5.6 7.5 1.9 301 Struggling and over-indebted* 3.7 5.0 1.3 73
* Figures in this row should be treated with caution due to low base. Many of those on the very lowest incomes will face a difficult, and potentially dangerous choice between cutting back on their use of fuel or getting into financial difficulty. Our overall conclusion then, supports the conclusion of the Trade and Industry Committee inquiry that:
While these increases are uncomfortable for all customers, their effect on those with lower incomes is potentially very grave.
(Trade and Industry Committee 2005a). Mortgage repayments After a long period when interest rates were falling and then became relatively stable, the Bank of England announced an increase in the base rate of 0.25% (25 basis points) in August 2006, and a second 25 basis point increase is anticipated before the end of 2006. This will take the base rate to 5.0% and effectively increase the repayments of many mortgage holders by about a tenth. Coupled with historically high levels of borrowing, this has given rise to fears that there will be an increase in financial difficulties among home buyers. Indeed, the June 2006 figures from the Council Of Mortgage Lenders show small increases in the numbers of home buyers with mortgage arrears of three or more months. The financial capability baseline survey data shows that 35 per cent of people were mortgagors, with repayments that averaged (median) £400 a month or 20 per cent of household income. This left them with a net income of £1,750 after making their repayments.

________________________________Risks associated with expenditure increases
39
Table 3.6 Mortgage expenditure by family and economic circumstances (mortgagors only)
Amount on
mortgage per month (£)
Mortgage repayments as % of income
Disposable income after
mortgage
Base (weighted)
All 400 19.7 1,750 1,553 Age Up to 29 479 25.1 1,559 132 30-39 460 21.1 1,809 456 40-49 418 19.6 1,846 506 50-59 300 16.6 1,850 314 60+ 189 14.1 1,144 146 Education Degree or above 445 18.7 1,962 475 A Level 420 21.3 1,615 259 Apprenticeship * 320 16.7 1,407 76 GCSE C and above 389 20.3 1,583 295 GCSE below C 401 21.2 1,498 91 None 280 19.6 1,317 144 Geographic region North East * 314 16.4 1,544 54 North West 355 19.1 1,616 197 Yorkshire and the Humber 316 19.2 1,497 121 East Midlands 350 17.3 1,898 106 West Midlands 370 19.4 1,690 152 East 480 21.0 1,753 146 London 600 22.8 2,200 144 South East 510 23.1 2,000 238 South West 443 20.7 1,753 159 Wales * 329 18.9 1,549 75 Scotland 300 16.7 1,750 120 Northern Ireland * 312 18.6 1,340 43 Quintiles of equivalised income 1 (lowest income quintile) * 292 93.5 196 85 2 200 25.6 575 107 3 310 25.1 900 224 4 384 20.6 1,451 459 5 (highest income quintile) 510 15.5 2,650 678
Family type Single adult (not retired) 300 22.4 1,000 185 Couple, no children (not retired) 430 19.2 1,968 415 Lone parent with children 394 27.3 1,120 145 Couple with children 450 18.8 2,017 651 Other 270 16.7 1,566 157
Number of earners None 213 25.1 695 159 One 375 22.4 1,285 599 Two 466 17.6 2,150 795
* Figures in this row should be treated with caution due to low base. As might be expected repayments varied widely between different groups of mortgagors (Table 3.6). Young people, aged under 30, had the highest levels in both

Overstretched: People at risk of financial difficulties___________________________
40
cash terms and also as a proportion of their income. Both the repayments and the proportion decreased steeply with age. It was, however, the mortgagors aged over 60 who had the least money left after paying their mortgage and there was remarkably little difference in the residual incomes of those aged between 30 and 60. There was also a clear link with income (Table 3.6). In this case, although the level of repayments increased with rising income the percentage of income spent decreased and the amount of income left over after making the mortgage repayments was very much higher the better off people were. These findings were also reflected in the relationship with the number of earners. Couples had lower mortgage repayments than single people both in cash terms and as a proportion of their income (Table 3.6). They also had higher disposable incomes after paying their mortgage. The presence of children in the household also increased the level of repayments in cash terms but only affected the proportion of household income spent on mortgages by lone parents. Mortgage repayments also varied quite widely by geographical region, which mirrored house prices across the UK (Table 3.6). So repayments, in both cash terms and expressed as a proportion of household income, were highest in London, and above average elsewhere in the South of England (that is in the South East, East and South West). They were lowest in Scotland, Northern Ireland and the North East of England. However, incomes also tended to be rather higher in the South of England than they were elsewhere, so people living in these regions still had above-average levels of disposable incomes after paying their mortgage. When do mortgage repayments become problematic? To understand the level at which mortgage repayments are potentially problematic we investigated the link between mortgage repayments and three different measures of financial well-being: • how easy people said they found it to meet their mortgage repayments, • how well they said they were making ends meet generally, and • the extent to which people were showing signs of financial stress (note that due to
the small base of those who were struggling and over-indebted we have combined them with people who were struggling on a low income) (Table 3.7).
How easy people said it was to pay their mortgage Most (83 per cent) of people with mortgages said that they were keeping up with payments without any difficulty. One in eight (12 per cent) said that they kept up with payments but it was a ‘struggle from time to time’. That left four per cent who admitted to finding it a ‘constant struggle’ and one per cent who said they had fallen behind with their repayments. By way of comparison, it is worth noting that the June 2006 figures from the Council of Mortgage Lenders show that about one per cent of mortgagors were three months or more in arrears with their mortgage. In other words, for every one mortgagor who is currently in arrears there are another four who are only just keeping their heads above water. These findings are also consistent with research undertaken both by the Bank of England (Barwell, May and Pezzini, 2006)

________________________________Risks associated with expenditure increases
41
and by the Financial Services Authority for its 2006 Financial Risk Outlook report (Financial Services Authority, 2006b). Table 3.7 Mortgage repayments by measures of financial well-being (mortgagors only)
Mortgage repayments amount per month (£)
Mortgage repayments as % of income
Disposable income after
mortgage Base
All 400 19.7 1,750 1,553
Ease of keeping up with mortgage payments Keeping up without difficulty 390 18.4 1,850 1,284 Keeping up sometimes a struggle 497 27.1 1,348 194 Constant struggle/ falling behind * 440 30.1 1,060 73
How well making ends meet generally Keeping up easily 379 17.3 1,953 959 Occasional struggle 440 21.9 1,569 450 Constant struggle or falling behind 461 26.8 1,186 143
Extent to which showing signs of financial stress Financially sound 320 16.4 1,770 644 Managing reasonably well 450 19.7 1,866 608 Showing financial stress 480 23.0 1,735 202 Struggling 478 28.2 1,152 99
* Figures in this row should be treated with caution due to low base. If we look at the level of mortgage repayments people had to make it is clear that the ones who were struggling or falling behind with their mortgage were paying more in cash terms than those who were keeping up-to-date without difficulty – but slightly less than those who kept up with the occasional struggle (Table 3.7). They were, however, spending by far the largest proportion of their income on their mortgage repayments and had much less money left afterwards. How well people said they were making ends meet generally Mortgagors who said that they were generally able to make ends meet without difficulty had the lowest repayments; while those who said they faced a ‘constant struggle’ to make ends meet or had fallen into arrears with household commitments had the largest amounts to find (Table 3.8). The differences in these cash payments were not, however, as great as might have been expected. On the other hand there was a more noticeable difference in the proportion of their income people had to spend on their mortgage and the amount they had left after making the repayments. So while people who said they made ends meet easily paid, on average, 16 per cent of their income on their mortgage, leaving them with £1,953 a month; those who said they were constantly struggling or falling into arrears were paying an average of 27 per cent of their income and had only £1,186 left after paying their mortgage.

Overstretched: People at risk of financial difficulties___________________________
42
Table 3.8 Proportion of income spent on mortgage payments by how well people said they were making ends meet (mortgagors only) Row percentages
Keeping up easily
Occasional struggle
Constant struggle or
falling behind
Base (weighted)
All 62 29 9 1,553
10 per cent or less 81 16 4 277 11-20 per cent 65 29 6 510 21-30 per cent 53 36 12 388 31-40 per cent 56 34 10 163 41-50 per cent* 49 33 18 73 More than 50 per cent 44 35 21 123
* Figures in this row should be treated with caution due to low base. We also looked in more detail at the link between the proportion of income consumed by mortgage repayments and how well people said they were making ends meet. This showed that when repayments accounted for up to 10 per cent of net household income, just four per cent of people faced a constant struggle or arrears while 81 per cent were making ends meet easily (Table 3.8). There was a clear decline in people’s ability to make ends meet as the proportion of their household income consumed by mortgage repayments increased. So when payments reached 50 per cent of their income the proportion of people who said they constantly struggled or had fallen into arrears had increased five-fold to 21 per cent and fewer than half of them (44 per cent) were making ends meet easily. The extent to which people were showing signs of financial stress There was an equally clear link between mortgage repayments and the extent to which people were showing signs of financial stress (Table 3.7). Mortgagors who were financially sound paid £320 a month on their mortgage – 16 per cent of their income – leaving them with £1,770 a month. Table 3.9 Proportion of income spent on mortgage payments by extent of financial stress (mortgagors only)
Row percentages
Financially sound
Managing reasonably
well
Showing financial
stress Struggling Base
(weighted)
All 41 39 13 6 1,554
10 per cent or less 62 29 7 2 277 11-20 per cent 41 45 10 4 511 21-30 per cent 34 41 29 8 389 31-40 per cent 32 45 16 7 163 41-50 per cent* 31 30 25 14 71 More than 50 per cent 34 33 15 19 123
* Figures in this row should be treated with caution due to low base.

________________________________Risks associated with expenditure increases
43
At the other end of the spectrum, the two groups of mortgagors who were struggling paid £478 a month – 28 per cent of their income – and had £1,152 a month left (Table 3.7). As we note above, because the numbers of mortgagors were small in the two groups who were struggling on a low income or struggling and over-indebted we have combined them for this analysis. It should, however, be noted that there appeared to be considerable differences between these two groups. Although they spent a very similar proportion of their income on their mortgage repayments, people who were struggling and over-indebted had higher mortgage repayments but higher incomes after paying them than people who were struggling on a low income. Of particular interest are the mortgagors who we considered were showing financial stress (Table 3.7). This group of people had above-average mortgage repayments in cash terms (£480 a month) and spent an above-average proportion of their income on them (23 per cent). But this still left them with a disposable income that was about average (£1,735 a month) and considerably higher than those who were struggling. Again there were clear links between the proportion of income spent on mortgage repayments and the extent to which people were facing financial stress (Table 3.9). So six in ten mortgagors who were paying a tenth or less of their income on their mortgage were financially sound and only two per cent were struggling. At the other extreme, only a third of people spending at least half of their income on mortgage repayments were financially sound while one in five of them were struggling. How well people anticipated making ends meet if their mortgage repayments increased by ten per cent Before looking at the effects of people’s mortgage repayments increasing by 10 per cent, we first investigated how well people thought they would cope with an increase of this size. Two-thirds (68 per cent) of mortgagors thought that they would face no financial difficulties at all; two in ten (21 per cent) said that they would struggle to meet other commitments but would probably keep up with their mortgage and one in ten (11 per cent) anticipated difficulties paying their mortgage as well as other regular commitments. We then looked at the relationship between this reply and how easy mortgagors said it was to make ends meet at the time of the interview. This showed that some of those who said that they were currently not making ends meet had given fairly optimistic replies when asked how they would manage following a 10 per cent increase in their mortgage13. We have assumed that it is unlikely that people’s ability to make ends meet would increase but rather that, as a consequence, they would continue to face financial problems. We have, therefore, created a new categorisation of mortgagors to summarise their own assessment of the impact of their mortgage repayments increasing by 10 per cent, taking into account how well they were making ends meet currently. This shows that:
13 The question asked was ‘How easy would it be if your monthly mortgage repayments were to increase by 10% - that means an extra £10 per month for every £100 that you pay at present’. This immediately followed a question asking about the ease of keeping up with payments at present.

Overstretched: People at risk of financial difficulties___________________________
44
• 55 per cent of mortgagors believed they would continue to meet all their commitments
• 13 per cent said they would find it difficult occasionally • 23 per cent said they would begin to have real financial difficulties, of which:
- 17 per cent said they would keep up with their mortgage but would begin to have real difficulty meeting other commitments - 6 per cent would have begin to have real difficulty meeting both their mortgage repayments and other commitments
• 9 per cent were already in financial difficulty. In other words, the proportion of mortgagors who thought they would get into financial difficulties was more than double the number actually in difficulty at the time of the interview. Many of these people thought they would default on other household commitments before they fell into arrears on their mortgage. This accords with other research which has shown that mortgages are given a much higher priority than other household commitments when money is tight (see for example Ford, Kempson and Wilson, 1995). Who believed they would be at risk of starting to get into financial difficulties? The people who believed they would be at risk of falling into financial difficulty following an increase in their mortgage repayments had high repayments at the time they were interviewed – higher in cash terms than those already in financial difficulty and only slightly less when expressed as a proportion of their net household income (Table 3.10). They did, however, have about £350 more in disposable income after making their mortgage repayments than those currently facing financial difficulties. Table 3.10 Mortgage expenditure by how well people anticipated coping with a 10 per cent increase in their mortgage repayments (mortgagors only)
Mortgage repayment amount per month (£)
Base (weighted)
Mortgage repayments as % of income
Disposable income after
mortgage
Base (weighted)
All 400 1,553 19.7 1,750 1,505
Could pay or with only occasional difficulties 360 1,042 17.0 1,910 1,019
Would fall into financial difficulty 474 368 24.8 1,521 351
Already in financial difficulty 461 143 26.8 1,186 135
The types of mortgagors who said they would have a very high risk of getting into difficulty with either their mortgage or other commitments included people: • aged under 30 (35 per cent of whom would start to face difficulties, compared with
the average of 23 per cent) • on middle incomes (in the third income quintile) (30 per cent)
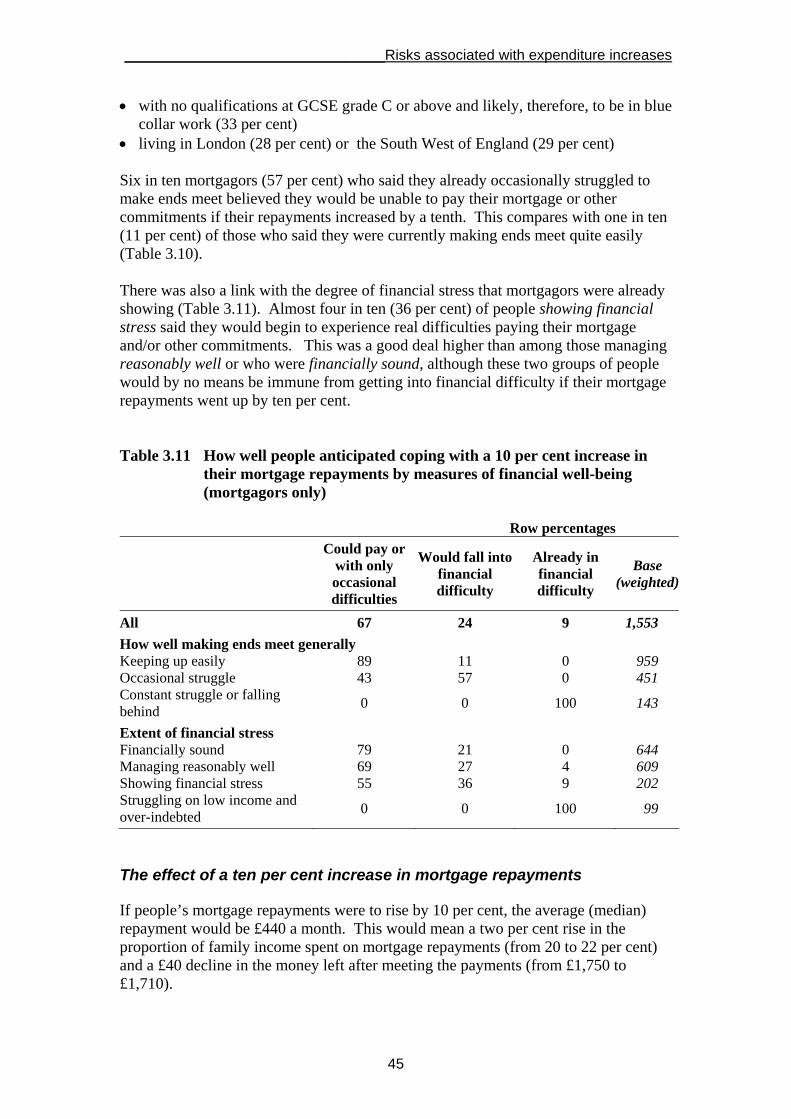
________________________________Risks associated with expenditure increases
45
• with no qualifications at GCSE grade C or above and likely, therefore, to be in blue collar work (33 per cent)
• living in London (28 per cent) or the South West of England (29 per cent) Six in ten mortgagors (57 per cent) who said they already occasionally struggled to make ends meet believed they would be unable to pay their mortgage or other commitments if their repayments increased by a tenth. This compares with one in ten (11 per cent) of those who said they were currently making ends meet quite easily (Table 3.10). There was also a link with the degree of financial stress that mortgagors were already showing (Table 3.11). Almost four in ten (36 per cent) of people showing financial stress said they would begin to experience real difficulties paying their mortgage and/or other commitments. This was a good deal higher than among those managing reasonably well or who were financially sound, although these two groups of people would by no means be immune from getting into financial difficulty if their mortgage repayments went up by ten per cent. Table 3.11 How well people anticipated coping with a 10 per cent increase in their mortgage repayments by measures of financial well-being (mortgagors only) Row percentages
Could pay or with only occasional difficulties
Would fall into financial difficulty
Already in financial difficulty
Base (weighted)
All 67 24 9 1,553
How well making ends meet generally Keeping up easily 89 11 0 959 Occasional struggle 43 57 0 451 Constant struggle or falling behind 0 0 100 143
Extent of financial stress Financially sound 79 21 0 644 Managing reasonably well 69 27 4 609 Showing financial stress 55 36 9 202 Struggling on low income and over-indebted 0 0 100 99
The effect of a ten per cent increase in mortgage repayments If people’s mortgage repayments were to rise by 10 per cent, the average (median) repayment would be £440 a month. This would mean a two per cent rise in the proportion of family income spent on mortgage repayments (from 20 to 22 per cent) and a £40 decline in the money left after meeting the payments (from £1,750 to £1,710).

Overstretched: People at risk of financial difficulties___________________________
46
We have already seen that people who anticipated getting into difficulty if their mortgage repayments increased by ten per cent had higher mortgage repayments than either people already in financial difficulty or those who thought the increase would not seriously affect their ability to make ends meet. They would, in fact, also face the largest fall in their disposable family income: £56 compared with a £37 fall among those already in financial difficulty and £31 for those who thought they would continue to make ends meet. Even so, that would still leave them with more in disposable income than those already in difficulty (£1,521 compared with £1,186), although it would be appreciably less than the people who would make ends meet (£1,910). If we look again at the types of people who were identified above as most likely to say they would get into difficulties following a rise in their mortgage repayments we find that some of them would face large declines in their disposable income. So mortgagors: • aged under 30 would face a £57 drop in their disposable family income to £1,502 • living in London would face a £62 drop to £2,138, and • living in the South West of England would have to deal with a £40 drop to £1,713. While the others would experience a smaller decline but be left with low disposable incomes. • Those with about average family incomes (in the third income quintile) would
face a £32 drop to £868, and • people with no qualifications and likely to be in blue collar work would face a £30
drop to £1,287 Modelling the potential impact of a ten per cent increase We have used regression analysis on the mortgagors’ data to understand more fully the relationship between falling behind with commitments and a range of characteristics and personal factors, including the monthly amount paid in mortgage repayments. The analysis suggests that people with mortgage repayments over £500 a month had considerably higher odds of being in difficulties than those with repayments of less than £200 (Table 3.12). However, income and attitudes had the biggest impact. People who did not describe themselves as the kind of person who would save for a rainy day had five times the odds of being in difficulty as those who did describe themselves that way. Those in the lowest two income quintiles had between four and six times the odds of being in difficulties as those with the highest incomes. Even taking household income into account, households with no earners were more likely to be in difficulties than those with two incomes. The logistic regression was used to predict the likelihood of each individual ‘facing a constant struggle to make ends meet, or already falling behind’. This analysis indicated that most of those people who were actually in this category had a predicted propensity of (about) 0.31 or above. The regression gives nine per cent of people a value in this range, in other words predicts that nine per cent of mortgagors would be

________________________________Risks associated with expenditure increases
47
expected to struggle at the original level of mortgage repayments, based on the key characteristics included in the model. Table 3.12 Logistic regression of being in financial difficulty (mortgagors only) Pseudo R squared 0.309
B Sig. Exp(B)
Intercept -4.373 .000 .013
Monthly mortgage repayment Up to £200 -1.072 .002 .342 £201-£300 -.787 .013 .455 £301-£400 -.546 .075 .579 £401-£500 -.542 .090 .582 Over £500 Reference category
Number of earners None .976 .009 2.653 One .186 .432 1.204 Two Reference category
Geographical Region North East -.620 .410 .538 North West -.763 .133 .466 Yorkshire and the Humber -.299 .610 .741 East Midlands .239 .672 1.270 West Midlands .333 .500 1.395 Northern Ireland .682 .126 1.977 London .819 .080 2.269 South East -.034 .943 .966 South West .082 .875 1.086 Wales .148 .743 1.160 Scotland .079 .875 1.082 East Reference category
Lives for today No -.359 .079 .698 Yes
Rainy day saver No 1.626 .000 5.084 Yes Reference category
Age of eldest partner 18-29 .426 .451 1.531 30-39 .408 .419 1.503 40-49 1.236 .010 3.440 50-59 1.124 .021 3.079 60+ Reference category
Table continued on next page

Overstretched: People at risk of financial difficulties___________________________
48
Table 3.12 Logistic regression of being in financial difficulty (mortgagors only) (continued)
Pseudo R squared 0.309
B Sig. Exp(B)
Credit repayments Repays up to £25 a month .091 .825 1.095 Repays between £26 and £50 .076 .870 1.079 Repays between £51 and £100 .384 .301 1.469 Repays between £101 and £200 .231 .448 1.260 Repays between £201 and £300 .559 .116 1.749 Repays more than £300 a month .771 .008 2.162 Pays nothing Reference category
Income quintiles 1 (lowest income quintile) 1.516 .002 4.556 2 1.860 .000 6.424 3 1.222 .001 3.395 4 1.224 .000 3.401 5 (highest income quintile) Reference category
Total investments and savings .000 .015 1.000
We have used the resulting regression model with increased levels of mortgage repayments to predict the new propensity of facing difficulties. We find that the model predicts that 10 per cent of mortgagors would face difficulties after paying an additional 10 per cent; that is, another one per cent of mortgagors would get into difficulty. The model, therefore, suggests that not nearly as many people would fall into difficulties as said that they thought they would do so. There are at least two plausible explanations for this. The people interviewed had to make a mental assessment of their ability to make ends meet, and they have almost certainly overestimated the difficulties that they would face – possibly stimulated by press coverage about levels of over-borrowing. At the same time, the model may be missing an important predictor of financial difficulties that was recognised and taken into account by the respondents. It does, however, include the key characteristics that earlier research has shown to be associated with arrears on household commitments (Kempson, McKay and Willits, 2004). Summary We investigated two possible expenditure shocks – a 40 per cent increase in fuel bills, and a 10 per cent increase in mortgage repayments. Both of these are highly likely in the current economic climate, and have given rise to considerable concern and speculation on how they will affect households’ ability to make ends meet, but they have very different impacts on household budgets.

________________________________Risks associated with expenditure increases
49
Fuel Household fuel bills averaged £58 a month across the year: 4.1 per cent of household income. This would have left the average household with £1,155 a month. People in Northern Ireland paid more for fuel than people living elsewhere in the UK. The impact of fuel bills on household incomes was greatest for people with low incomes; people aged over 60; local authority and housing association tenants, single adults living alone and lone parents. They had a large impact in households that said they were either facing a constant struggle to make ends meet or falling behind with bills and other commitments. They also had a disproportionate effect on the household budgets of people who were struggling on a low income. When we controlled for the number of people living on the household income, it was clear that the likelihood of people saying they were not making ends meet fell as incomes rose – up to £1,000 equivalised income a month. It then flattened out. Between July 2005 (when the survey data were collected) and October 2006, the six energy suppliers had raised prices by between 23 and 49 per cent, with larger increases for gas than for electricity. There was a comparable increase in the cost of oil for domestic heating over the same period. We have, therefore, investigated the likely impact of a 40 per cent increase in expenditure on fuel. As might be expected this would bear most heavily on people with the very lowest incomes and the very elderly (aged over 70). People who said they were currently finding it difficult to make ends meet and those struggling on a low income would also be hit harder than the rest of the population. Most households, however, would be able to accommodate these rises. Mortgages The Bank of England announced a 0.25% increase in base rates in August 2006 and a further increase of a similar size seemed imminent in the autumn of 2006. This would effectively increase mortgage repayments by 10 per cent. Mortgage repayments averaged £400 a month, or 20 per cent of household income, leaving the average household with £1,750 a month for other expenditure. The effects of repayments on the household budget were highest among young mortgagors and declined with age. They also declined with household income. There were clear regional variations, but although repayments were highest in London, followed by the rest of the South of England, so too were household incomes. Consequently, on average, mortgagors living in the South still retained higher than average incomes after paying their mortgage. There was a fairly strong link between mortgage repayments and three different measures of mortgagors’ economic well-being: how easy they said they found it to meet their mortgage repayments; how well they said they were making ends meet generally, and the extent to which they were showing signs of financial strain.

Overstretched: People at risk of financial difficulties___________________________
50
Most people said they were keeping up with their mortgage repayments without any difficulty, but four per cent admitted to finding it a ‘constant struggle’ and one per cent admitted to being in arrears. Mortgagors were asked how well they anticipated being able to make ends meet if their mortgage repayments went up by a tenth. Taking into account how well they were making ends meet at the time of the interview, this showed that: • 55 per cent of mortgagors believed they would continue to meet all their
commitments • 13 per cent said they would find it difficult occasionally • 23 per cent said they would begin to have real financial difficulties, of which:
- 17 per cent said they would keep up with their mortgage but would begin to have real difficulty meeting other commitments - 6 per cent would have begin to have real difficulty meeting both their mortgage repayments and other commitments
• 9 per cent were already in financial difficulty. In other words, the proportion of mortgagors who thought they would face financial difficulties was more than double the proportion currently in difficulty. It should be noted, though, that they were more likely to say they would struggle with paying other household commitments than with their mortgage. The types of mortgagors who were mostly likely (three in ten or more) to say they would begin to have difficulty with either their mortgage or other commitments included people: • aged under 30 • on middle incomes (in the third income quintile) • with no qualifications and likely, therefore, to be in blue collar work, and • living in London or the South West of England. Six in ten of the mortgagors who were currently finding it an occasional struggle to make ends meet said that they would begin to have difficulties, as would four in ten of those showing financial stress. A 10 per cent increase in mortgage repayments would mean a two per cent rise in the proportion of their income the average household would have to spend on this commitment, leading to a £40 decline in the money left for other expenditure. Those who said they would begin to experience financial difficulty would see a £57 a month drop – compared with a fall of £31 that would be experienced by those who believed they would continue to make ends meet. Mortgagors aged under 30, and those living in London or the South West would experience the biggest declines in their disposable income. Those on middle incomes or likely to be in unskilled employment would experience smaller falls but would be left with very low disposable incomes. Modelling the effects of a 10 per cent increase in mortgage repayments showed that, in addition to the nine per cent of mortgagors currently struggling financially, a further one per cent would begin to do so. This falls well short of the 23 per cent of people who, when asked, said that an increase in their mortgage repayments by this amount would cause them to get into difficulty. This is almost certainly because, stimulated by media coverage, they over-estimated the likely impact.

__________________________________________________Risk of income shocks
51
4 Risk of income shocks This final chapter explores the impact of a substantial economic shock – namely a loss of income from the main wage earner. Previous research has shown a very strong link between loss of income and financial difficulties (Berthoud and Kempson, 1992; Ford, Kempson and Wilson, 1995; Herbert and Kempson, 1995; Kempson, 2002), with job loss being one of the main causes of income falls even when levels of unemployment are low. Indeed a third of people who had experienced a fall in income in the previous year also reported financial difficulties over the same period (Kempson, 2002). As the Department of Trade and Industry note in their 2006 report on over-indebtedness, the low level of unemployment in 2006 almost certainly explains why arrears remain low, despite the very high levels of consumer borrowing (Department of Trade and Industry, 2006). We begin this chapter by investigating how many people had experienced a major loss of income for any reason in the past three years; who they were; how they dealt with it and whether they fell into arrears with any of their household bills or other commitments. The second half of the chapter then looks at how people with a wage coming into the family would fare following the loss of the main wage through job loss for at least a month. We identify both the number and the types of people who have no provision to cover this job loss and would be unable to make ends meet without borrowing or falling into arrears with regular commitments. We show that many more people would be at substantial risk of financial difficulties should they lose the main wage than would do so as a result of fuel bills increases or rises in mortgage interest rates. Recent experiences of income shocks The financial capability baseline survey showed that large numbers of people did not have adequate provision to cope with a drop income. Yet such shocks were fairly common, despite the benign economic climate at that time. Indeed when we asked whether they had faced a large and unexpected fall in their household income, almost one in three people said that they had experienced an income shock of this magnitude in the last three years (Table 4.1). Most commonly this followed either redundancy or job loss, or the onset of a long-term illness or disability, but only slightly fewer had suffered a large drop in wages for some other reason. A small proportion (three per cent) had suffered from two or more of these income shocks.

Overstretched: People at risk of financial difficulties___________________________
52
Table 4.1 Experience of any large drop in income in past three years Column percentages
Experienced loss of income in this way (%)
Any fall in income 28 Redundancy/job loss 8 Unable to work through disability 7 Large drop in wages 5 Drop in benefits 3 Relationship breakdown 3 Death of a spouse / partner 1 Income from investments 1 Other reason 4 No fall in income 72 Don’t know -
Base(weighted) 5,328
Note: Percentages will not total 100% as a small number of people had experienced a drop in income for more than one reason.
To identify the factors that might predispose someone to a fall in income, we ran a regression analysis which included age, educational qualifications and region (the only variables that could be correlated with an income drop but were unlikely to have changed as a result of it) (Table 4.2). Although all were statistically significant to some extent, together they explained very little of the variation. A likely explanation of this is that almost no-one is immune to a ‘large and unexpected’ income fall. People were asked not to include a fall in income on retirement, which for the majority of people is anticipated – although it is clear from the data that some did. People aged over 70 were significantly less likely to have experienced an income drop than all other age groups; while people educated to A level or above were significantly less likely to have suffered a fall in income than those who had no qualifications. Finally people living in Northern Ireland were much less likely to have had a fall in income than the remainder of the UK population (Table 4.2). It was, however, clear that people showing different levels of financial stress had fared rather differently in recent years. Six in ten (58 per cent) of people who were struggling and over-indebted had experienced a large fall in their income, as had half (53 per cent) of those struggling on a low income. The next largest proportion (35 per cent) was found among those who were showing financial stress. In fact, a surprising number of those who were managing reasonably well or who were financially sound had also had income drops (29 and 23 per cent respectively), offering further weight to our suggestion that nobody is immune. However, as we saw in Chapter 2, they were also the ones most likely still to have a substantial financial cushion.

__________________________________________________Risk of income shocks
53
Table 4.2 Logistic regression analysis of income falls in the past three years Pseudo R Squared 0.061
Has experienced income fall Coefficient Significance Exp(B)
Intercept -2.108 .000
Age of eldest partner 18-29 1.252 .000 3.49730-39 1.553 .000 4.72540-49 1.468 .000 4.34250-59 1.464 .000 4.32560-69 .936 .000 2.55070+ Reference category
Education Degree or above -.250 .011 .779A Level -.309 .005 .734Apprenticeship -.016 .914 .984GCSE C and above -.038 .711 .963GCSE below C -.205 .151 .815Other -.069 .690 .933None Reference category
Geographic region North East .842 .842 1.042North West .920 .920 1.016Yorkshire and the Humber .127 .127 1.299East Midlands .501 .501 1.123West Midlands .216 .216 1.220Northern Ireland .005 .005 .625London .220 .220 1.204South East .137 .137 1.261South West .769 .769 1.055Wales .085 .085 1.303Scotland .285 .285 1.182East Reference category
How people managed the income fall People who had experienced a large and unexpected drop in income over the past three years were subsequently asked to describe in their own words how they had managed financially (Table 4.3). They were asked to mention all the strategies that they had employed. Most had used more than one. The most common strategy by far was to cut back on spending (Table 4.3) and half the people affected had done this. A sizeable minority said they had withdrawn money from a savings account or sold investments. A small number had received help from family or friends – either in the form of loans or as cash gifts, and a minority had used some form of commercial credit to tide them over. Only a very small number said they had claimed on an insurance policy of some kind. It is also interesting to see how the way people had dealt with a drop in income varied with the level of financial stress they were showing at the time of the interview (Table

Overstretched: People at risk of financial difficulties___________________________
54
4.4). The biggest variations were in the proportions that had drawn on savings and investments and the proportions who had borrowed money to tide them over. People who were struggling and over-indebted included by far the largest proportion of people who had borrowed money; but this was also relatively common among those showing financial stress. The ones most likely to have drawn on savings or investments were the people who were managing reasonably well and those who were financially sound. Family help was most common among those struggling on a low income. Table 4.3 How people made ends meet when they experienced a large and unexpected drop in income (all experiencing a drop in income)
Used this strategy (%)
Mean number of strategies
Cut back on spending 53 1.6 Drew money from savings account 15 2.0 Drew money from current account 4 2.4 Sold investments 3 2.5 Claimed on insurance policy 2 2.2 Used credit card or overdraft 6 2.2 Took out loan 4 2.4 Borrowed from family/friends 9 2.2 Friends/family gave money 9 1.9 Got a job/second job/ overtime 6 1.9 Used redundancy payment 4 2.1 Claimed social security benefits 11 2.0 Other way 11 1.3 Didn’t make ends meet 3 0.7
Base (weighted) 1,496 1,496
Note: Percentages will not total 100% as many people had used more than one strategy.
Table 4.4 Strategies used to make ends meet by level of financial stress (all experiencing a drop in income)
Financially sound
Managing reasonably
well
Showing financial
stress
Struggling on low income
Struggling and over-indebted*
Total
Cut back 53 57 48 50 50 53Used savings or investments 22 25 16 7 8 20
Borrowed 11 18 28 18 44 17Cash from family 7 8 11 15 13 9
Base (weighted) 724 387 168 170 49 1,498
* The percentages in this column should be treated with caution due to low base. Note: Percentages will not total 100% as many people had used more than one strategy.

__________________________________________________Risk of income shocks
55
Only a very small number of the people who had experienced a drop in income spontaneously indicated that they did not make ends meet and fell behind with household commitments. However, when asked directly a third of them admitted to falling into arrears (see Table 4.5). This level of financial difficulties is consistent with previous research (Kempson, 2002; Kempson, McKay and Willitts, 2004). Most said they had fallen behind with only one commitment, but one in twelve people said they had fallen into arrears with three or more. People were most likely to have fallen behind with rent or mortgage payments, which is perhaps not surprising as housing costs will represent the largest commitment for most households, but it is a particular concern given their importance. This was followed closely by council tax payments and utility bills (Table 4.5). Again this is consistent with earlier research (Berthoud and Kempson, 1992; Kempson, 2002; Kempson, McKay and Willitts, 2004). Table 4.5 Arrears following a large unexpected drop in income (all experiencing a drop in income)
Column percentages
Number of payment types in arrears None 68 One 16 Two 9 Three 4 Four 2 Five 1 Six 1
Type of payment in arrears Rent or mortgage 15 Council tax 14 Gas/electricity/water bills 10 Phone/mobile phone bills 10 Repayment of loans, credit or store cards 9 Income tax bill 1 Other payments 3 None of these 67
Base (weighted) 1,496
Note: Percentages on types of payment will not total 100% as some people had fallen behind with more than one commitment. Almost one in ten (nine per cent) people said they had fallen behind with repayments on unsecured credit commitments, although this would represent a much higher proportion of those who owed money in this way. We do not know how many people were repaying unsecured credit at the time they experienced a drop in income, although we saw in Chapter 2 that just under half of people said that they or their partner had credit commitments at the time they were interviewed. Previous research also showed that about half of households had unsecured credit commitments and that this proportion had remained fairly steady in recent years despite increases in the

Overstretched: People at risk of financial difficulties___________________________
56
overall amounts outstanding (Kempson, 2002; Kempson, McKay and Willitts, 2004). In all probability, then, around one in five of all those who owed money on unsecured credit had fallen behind with their payments following a drop in income. Again, it is interesting to look at the outcomes for people showing differing levels of financial stress (Table 4.6). This shows that the great majority of people struggling on a low income or struggling and over-indebted fell into arrears with household commitments following a fall in income and a significant number in each case had got into multiple arrears. In contrast, most of the people who had had a large drop in income and were either financially sound or managing reasonably well had managed to avoid getting in arrears altogether. Table 4.6 Number of payment types in arrears following a drop in income by level of financial stress (all experiencing a drop in income)
Column percentages
Financially sound
Managing reasonably
well
Showing financial
stress
Struggling on low income
Struggling and over-indebted*
Total
None 77 71 66 31 36 68One 14 14 19 23 21 16Two 7 9 10 15 23 9Three or more 3 5 5 31 19 7
Base (weighted) 724 387 168 170 49 1,498
* Figures in this column should be treated with caution due to low base. Once again we ran a regression analysis of the characteristics unlikely to have changed as a result of a drop in income – but this time to predict who had fallen behind with payments (Table 4.7). Included in our model was age, level of education, and region, as before, but we also added the reasons for the income drop and a series of attitude statements relating to saving, spending and using credit. This showed that, other things being equal, the under forties were at much higher risk of falling into arrears than the over seventies, and the odds of doing so increased as age decreased. So people in their forties had five and a half times the odds of falling into arrears as those aged seventy or above; people in their thirties had seven times the odds and twenty year olds eight times the odds. People educated to degree level or above had half the odds of falling into arrears as those with no educational qualifications at all. Turning to geographical region, compared with people in similar circumstances in East, Londoners were almost two and a half times more likely to fall into arrears. Attitudes also played an important role. People who agreed strongly that they were more of a saver than a spender had only half the odds of falling into arrears as those who disagreed strongly with this statement. Otherwise none of the other attitude statements was significant. These included:

__________________________________________________Risk of income shocks
57
‘I am impulsive and tend to buy things even when I can't really afford them’ ‘I prefer to buy things on credit rather than wait and save up’ ‘I would rather cut back than put everyday spending on a credit card I couldn't repay in full each month’ We also included within the regression the causes of the income falls to see whether arrears were strongly associated with any of them. In fact, there was very little variation that was statistically significant. The only differences of any note were the higher odds of arrears following a fall in the amount received in social security benefits and the fact that people who had suffered a drop in the income from their investments were very unlikely to have fallen into arrears as a consequence. It is almost certain that these effects would have disappeared if we had known the level of savings people had at the time of the fall in income. Table 4.7 Logistic regression of the odds of falling into arrears following a fall in income Pseudo R Squared 0.237
Coefficient Significance Exp(B)
Intercept -1.893 .003
Age of eldest partner 18-19 2.211 .000 9.12520-29 2.217 .000 9.18030-39 1.891 .000 6.62340-49 1.498 .003 4.47250-59 .328 .547 1.38860-69 2.211 .000 9.12570+ Reference category
Geographical Region North East -.107 .803 .899North West .463 .132 1.589Yorkshire and the Humber .350 .300 1.419East Midlands .384 .259 1.468West Midlands .244 .434 1.277Northern Ireland -.625 .082 .535London .845 .004 2.328South East .084 .790 1.088South West .141 .707 1.151Wales .348 .247 1.416Scotland .285 .360 1.329East Reference Category
Table continued on next page

Overstretched: People at risk of financial difficulties___________________________
58
Table 4.7 Logistic regression of the odds of falling into arrears following a fall in income (continued) Pseudo R Squared 0.237
Coefficient Significance Exp(B)
Education Degree or above -.700 .000 .497A Level -.572 .008 .564Apprenticeship -.004 .989 .996GCSE C and above -.302 .121 .740GCSE below C -.163 .545 .849Other .289 .389 1.335None Reference category
Reason for loss of income Other reason -.470 .029 .625Redundancy or job loss -.331 .069 .718Large drop in wages -.487 .021 .615Relationship breakdown .378 .104 1.459Death of a partner -.222 .618 .801Drop in benefits .655 .004 1.926Drop in investment income -2.743 .009 .064Accident ill health/ disability Reference category
Attitudes I am impulsive Agree strongly .496 .031 1.643Tend to agree .298 .115 1.348Don’t know .161 .888 1.174Tend to disagree .005 .977 1.005Disagree strongly Reference category
Saver not spender Agree strongly -.717 .002 .488Tend to agree -.444 .020 .642Don’t know -.406 .653 .666Tend to disagree .047 .785 1.048Disagree strongly Reference category
Buy on credit rather than save Agree strongly -.009 .974 .991Tend to agree -.304 .115 .738Don’t know .822 .632 2.275Tend to disagree -.385 .013 .680Disagree strongly Reference category
Rather cut back than spend on credit Agree strongly -.054 .830 .948Tend to agree -.003 .992 .997Don’t know -.120 .871 .887Tend to disagree -.143 .631 .867Disagree strongly Reference category

__________________________________________________Risk of income shocks
59
Ability to manage a future drop in income People taking part in the survey were asked to tell us in their own words how they would manage if their household income was significantly reduced for three or more months. This was framed slightly differently depending on whether there was an earner in the household or not. Those in a household with an earned income were asked how they would make ends meet if the main earner was unable to work for three months or more. Workless households were asked how they would make ends meet if their income was to fall by a quarter for three months or more. Slightly fewer than half (44 per cent) of the people interviewed either had some money saved or invested that they said they would draw on, or they had payment protection insurance. Around a third, (32 per cent) said they would cut back or raise extra money, and a minority (14 per cent) said they would be able to manage on their remaining income. At the same time, a sizeable number (25 per cent) gave replies that clearly indicated that they would not be able to make ends meet on their income; they would need to borrow money commercially, seek a loan or cash gift from their family or would be unable to meet their commitments in full. Only a minority of these people, however, (four per cent) expected to be unable to meet their commitments – far fewer than had fallen into arrears when they had actually experienced a drop in income in the recent past. Table 4.8 Length of time respondent could make ends meet if faced with an unexpected drop in income
Column percentages
All respondents
Less than one week 3 More than one week but less than one month 8 More than one month but less than three months 15 More than three months but less than six months 16 More than six months but less than twelve months 13 Twelve months or more 39 Don't know 6
Base (weighted) 5,328
Respondents were also asked how long they thought they would be able to make ends meet, using the strategies they had cited. One in ten said that it would be less than one month; at the other extreme, four in ten thought they would be able to make ends meet for a year or more (Table 4.8). We also know from elsewhere in the interview, exactly how much money people had in savings or investments and were able to calculate this as a proportion of their monthly income. In fact some of those who indicated that they would not be able to make ends meet did not say they would draw on savings even though they had at least a month’s income put by. It could be that they did not mention using these should they face a job loss because the money had been saved for something specific. We

Overstretched: People at risk of financial difficulties___________________________
60
have, however, taken a conservative approach and assumed that they would be able to make ends meet if they had more than a month’s income put by. As we saw in the previous chapter, some people were already in arrears or facing a constant struggle to make ends meet. It transpired that some of these people were being over-optimistic in their assessments of how they would manage following the loss of the main wage – often indicating that they would make ends meet if they cut back. We have assumed that if they had less than a month’s income in savings they would find it very difficult to cope following a major loss of earnings. Bringing all this information together, we have allocated people to one of three groupings:
• People who were very unlikely to experience financial difficulties: who had at least three months income in savings and indicated that they could make ends meet without borrowing, although they might need to cut back their spending (20 per cent).
• People at low-to-middle risk of financial difficulties (50 per cent) • People who were at very high risk of financial difficulties: who had less than a
month’s income in savings and were either in difficulties already or would have to borrow to make ends meet or fall behind with payments (30 per cent).
It is striking how close this last percentage is to the proportion of people (32 per cent) who had actually fallen into arrears following a drop in income in the recent past. Ability to deal with a fall in income through job loss We then restricted this analysis to those either in paid employment themselves, or living with a partner who was, in order to gauge the possible impact of job loss. This showed that half (51 per cent) such people said that they had savings, investments or payment protection insurance they could draw on; a quarter (24 per cent) felt they would be able to manage to make ends meet on their remaining income and a similar number (24 per cent) said they would need to cut back or raise extra money. But about one in five (21 per cent) said they would be unable to make ends meet, at least without borrowing – including seven per cent who said they would fall behind with their commitments. We also assigned people to one of three groups depending on whether they had sufficient savings to cover the loss of the main wage for a month or more. This showed that:
• 20 per cent of working households seemed very unlikely to face financial difficulties if they lost the main wage in the household for a month or more;
• 53 per cent at low-to-middle risk of being unable to make ends meet; and • 27 per cent who were at very high risk and could well fall into financial
difficulties. This last group were unable to cover the loss of the main wage for a month or more by drawing on savings and said that they would need to borrow to make ends meet and/or they would be unable to meet their existing commitments.

__________________________________________________Risk of income shocks
61
People at risk of not making ends meet following job loss by the main wage earner Economic circumstances There was a fairly strong link with household (equivalised) income among working households so that the more they had coming in the lower the risk of being unable to make ends meet (Table 4.9). The risk was, however, markedly lower for people in the richest one fifth of households than it was among the rest. Not unexpectedly, the risk of failing to make ends meet was greater if there was only one earner in the household than if there were two (Table 4.9). There was, however, only a small decline in risk the more highly qualified people were (Table 4.9). Again education is being used as a proxy for the type of work people were undertaking as this was not asked directly in the survey. Table 4.9 Risk of financial difficulties following a fall in income by economic circumstances (those with a wage earner only)
Would have difficulty making ends meet
No Yes Base (weighted)
Quintiles of equivalised household income 1 (lowest income quintile) 59 41 156 2 60 40 346 3 67 33 673 4 73 27 925 5 (highest income quintile) 85 15 1,013
Number of full or part-time earners One 68 32 1,774 Two 80 20 1,341
Education Degree or above 79 21 858 A Level 72 28 526 Apprenticeship 72 28 156 GCSE grade C and above 66 34 605 GCSE below grade C 64 36 191 Other* 64 36 73 None 72 28 379
* Figures in this row should be treated with caution due to low base. Personal and household characteristics There was a very strong relationship between age and not being able to makes ends meet. More than half of people in their teens and almost four in ten people in their twenties would fail to make ends meet. The proportion then fell steadily with age (Table 4.10). There was also a link with the type of household. Households headed by a single adult were at greater risk of financial difficulties than those headed by a couple and the presence of children also increased the risk appreciably. So lone parent

Overstretched: People at risk of financial difficulties___________________________
62
households had by far the highest risk, couples with no dependent children had the lowest (Table 4.10). Clearly this is in part a reflection of the number of earners in the household but will also be because children put strains on the family budget. Home owners faced less of a risk than tenants – especially if they owned their home outright (Table 4.10). We also looked for any geographical variations and, although there were some differences they were not especially large and did not vary in a consistent way. Table 4.10 Risk of financial difficulties following a fall in income by personal circumstances and housing tenure (those with a wage earner only)
Would have difficulty making ends meet
No Yes Base (weighted)
Age of eldest partner 18-19 * 49 51 63 20-29 55 45 448 30-39 70 30 800 40-49 75 25 810 50-59 82 18 645 60+ 92 8 346
Family type Single adult (not retired) 73 27 350 Couple with no children (not retired) 80 20 776
Couple with no children (retired)* 94 6 87 Lone parent with children 62 38 282 Couple with children 74 26 1,064 Other 65 35 554
Housing tenure Mortgage 80 20 1,653 Private rent 57 43 345 Local authority rent 50 50 404 Own outright 89 11 495 Other 58 42 217
* Figures in this row should be treated with caution due to low base. Borrowing and attitudes to saving As in other research (Kempson, 2002), there was a clear link between the level of use of unsecured credit and being unable to make ends meet if the main wage were lost. Four in ten people whose credit commitments accounted for more than a fifth of their income would be at risk of failing to make ends meet. We did not, contrary to expectations, find such a clear link with the proportion of income spent on unsecured credit and/or mortgages (Table 4.11).

__________________________________________________Risk of income shocks
63
Table 4.11 Risk of financial difficulties following a fall in income by levels of credit use (those with a wage earner only)
Would have difficulty making ends meet
No Yes Base (weighted)
Monthly repayments on unsecured debt as % of net household income No debt repayments 75 25 1,777 10 per cent or less 72 28 819 11-20 per cent 76 24 313 More than 20 per cent 62 38 136
Monthly repayments on unsecured debt and mortgage as % of net household income No debt repayments 70 30 1,143 10 per cent or less 71 29 529 11-20 per cent 80 20 486 21-30 per cent 80 20 418 31-40 per cent 78 22 249 41-50 per cent 69 31 115 More than 50 per cent 65 35 171
Total saved as % of net household income No savings 61 39 1,247 0-25 per cent 49 51 403 26-50 per cent 63 37 145 51-100 per cent 57 43 190 101-200 per cent 100 0 342 201-500 per cent 100 0 180 More than 500 per cent 100 0 607
Attitudes to money management were also related to the propensity to be unable to make ends meet. So people who faced the highest risk described themselves as: ‘impulsive and tend to buy things even when I can’t really afford them’ while the lowest risks were faced by people who considered themselves ‘more of a saver than a spender’. The links with attitudes to financial planning were equally clear. High risks were faced by people who agreed that they ‘tend to live for today and let tomorrow take care of itself’ or that they ‘found it more satisfying to spend money rather than to save it for the long-term’. While low risks were faced by people who agreed that they ‘always have money saved for a rainy day’ (Table 4.12).

Overstretched: People at risk of financial difficulties___________________________
64
Table 4.12 Risk of financial difficulties following a fall in income by attitudes to money and saving (those with a wage earner only)
Would have difficulty making ends meet
No Yes Base (weighted)
I’m impulsive Agree strongly 53 47 207 Tend to agree 63 37 473 Tend to disagree 74 26 1,036 Disagree strongly 79 21 1,393
I’m more of a saver than a spender Agree strongly 84 16 529 Tend to agree 81 19 1,107 Tend to disagree 68 32 1,050 Disagree strongly 51 49 406
I tend to live for today and let tomorrow take care of itself Agree strongly 52 48 421 Tend to agree 63 37 752 Tend to disagree 79 21 1,137 Disagree strongly 87 13 796
I find it more satisfying to spend money than to save for the long-term Agree strongly 58 42 398 Tend to agree 71 29 962 Tend to disagree 77 23 1,202 Disagree strongly 80 20 522
I always make sure I have money saved for a rainy day Agree strongly 88 12 1,127 Tend to agree 77 23 1,175 Tend to disagree 50 50 563 Disagree strongly 41 59 248
Regression analysis Some of the characteristics described above are related to one another, for example, social tenants tend to be on very low incomes, while outright owners are both older and better off than the average. Consequently we cannot be certain whether housing tenure itself influences the risk of being unable to make ends meet, or whether the tenure differences can be explained by incomes. We therefore ran a regression analysis to identify which factors are the ones most closely related to being unable to make ends meet following a drop in income. The results are shown in Table 4.13.

__________________________________________________Risk of income shocks
65
Table 4.13 Logistic regression of being at risk of financial difficulties following a drop in income (those with a wage earner only) R Squared 0.295
Coefficient Significance Exp(B)
Intercept -3.179 .000
Income quintiles*** 1 (lowest income quintile) .912 .000 2.4902 .979 .000 2.6623 .545 .000 1.7254 .434 .001 1.5435 (Highest income quintile) Reference category.
Family type Single adult (not retired) .342 .030 1.407Couple with no children (not retired) -.042 .809 .959
Couple with no children (retired)* .184 .173 1.201Lone parent with children -.114 .809 .892Couple with children .097 .576 1.102Other Reference category
Age of older partner *** 18-29 1.451 .000 4.26730-39 1.126 .000 3.08440-49 .926 .000 2.52450-59 .542 .023 1.72060+ Reference category
Geographical Region*** North East .181 .560 1.199North West .245 .289 1.278Yorkshire and the Humber .048 .856 1.049East Midlands .011 .967 1.011West Midlands .296 .216 1.344Northern Ireland .215 .360 1.240London .849 .000 2.337South East .502 .029 1.652South West .251 .338 1.285Wales .466 .045 1.594Scotland -.048 .845 .954East Reference category
Housing tenure*** Mortgage .067 .708 1.069Private rent .646 .002 1.908Local authority rent .772 .000 2.163Own outright -.004 .987 .996Other Reference category
Significance level <0.001 Table continued on next page

Overstretched: People at risk of financial difficulties___________________________
66
Table 4.13 Logistic regression of being at risk of financial difficulties following a drop in income (those with a wage earner only) (continued) R Squared 0.295
Coefficient Significance Exp(B)
Education Degree or above -.229 .156 .795A Level -.169 .325 .844Apprenticeship .016 .945 1.016GCSE C and above .086 .597 1.089GCSE below C .091 .667 1.095Other .343 .241 1.409None Reference category
Spender not a saver No .245 .016 1.277Yes Reference category
Lives for today*** No -.350 .000 .705Yes Reference category
Rainy day saver*** No 1.178 .000 3.246Yes Reference category
Credit repayments Repays up to £25 a month .130 .460 1.139Repays between £26 and £50 -.124 .558 .883Repays between £51 and £100 -.287 .141 .751Repays between £101 and £200 -.110 .484 .896Repays between £201 and £300 -.389 .055 .677Repays more than £300 a month .113 .503 1.120Has no repayments Reference category
Significance level <0.001 This shows that age had by far the largest effect, with the odds increasing the younger people were. Compared with people in their sixties, young people aged under thirty had four times the odds of not making ends meet following a drop in income. There was also a link with equivalised household income, with people in the lowest three income quintiles having increased odds of financial difficulties compared with people in the highest income quintile. Indeed the odds in the lowest two quintiles were two and a half times higher than they were in the highest quintile. Even controlling for income, housing tenure was also statistically significant, with tenants facing twice the odds of outright owners. In other words, regardless of incomes, tenants had fewer reserves they could draw on in a crisis. This time it was also possible to see some regional effects. Compared with the Eastern Region (which cross tabular analysis identified as having the lowest risk) Londoners had 2.3 times the odds of having problems making ends meet, and people living in the South East 1.7 times the odds.

__________________________________________________Risk of income shocks
67
Attitudes, too, played an important part. In particular, people who were not inclined to put money away for a rainy day had more than three times the odds of not making ends meet as those who were rainy day savers. But surprisingly, weekly repayments on unsecured credit were not statistically significant – although when the attitude statements were removed from the model it was clear that people with high levels of repayment did face a higher risk. Links between the risk of financial difficulties following job loss and people’s level of financial stress Relating this analysis to the level of financial stress that people were experiencing at the time of the interview we can see that, although none of them was immune from high risk, the two groups of people who were financially sound or managing reasonably well would fare best if they experienced a large drop in income. Four in ten of the people showing signs of financial stress would be unable to make ends meet as would almost nine in ten of the two groups of people who were currently either struggling on a low income or struggling and over-indebted (Table 4.14) Table 4.14 Risk of financial difficulties following a fall in income by level of financial stress (those with a wage earner only) Column percentages
Financially sound
Managing reasonably
well
Showing financial
stress
Struggling on low income
Struggling and over-indebted*
Total
Would have difficulty making ends meet No 80 78 61 15 12 73Yes 20 22 39 85 88 27
Base (weighted) 1,520 374 1,041 120 59 3,114
* the percentages in this column should be used with caution, given the low base Summary The financial capability baseline survey showed that large numbers of people did not have adequate provision to deal with a substantial drop in income. Yet further analysis indicates almost three in ten people (28 per cent) had experienced a major income shock in the past three years and that people in all walks of life had been affected. The most common strategy to deal with an income drop was to cut back on spending and half of the people affected had done so. No other strategy was anything like as common, although minorities had drawn on savings, received help from family or friends, or had borrowed commercially. Often these other strategies were accompanied by cutting back on expenditure. People showing financial stress or who were struggling and over-indebted were the most likely to have borrowed to make ends meet.

Overstretched: People at risk of financial difficulties___________________________
68
A third of the people (32 per cent) who had experienced a large fall in income had subsequently fallen into arrears with household commitments. The most common types of arrears were rent/mortgage payments; council tax and utility bills. Although arrears on credit commitments were lower this was only because fewer people had to make credit repayments than needed to pay the household bills above. Expressed as a proportion of those with credit repayments to make, the level of arrears was higher than it was for rent/mortgage payments. The great majority of people struggling on a low income or who were struggling and over-indebted had fallen into arrears following a drop in income, and a significant number in each case had experienced multiple arrears. The odds of falling into arrears were higher the younger people were, whilst being educated to A level or above reduced the odds. Attitudes to saving and borrowing were also important. We then restricted the analysis to people who were either in paid employment themselves, and/or living with a partner who was, to gauge the possible impact of losing the main wage. In doing this we took account of the levels of savings people had, along with the ways they said that they would make ends meet. This showed that almost three in ten people (27 per cent) were at very high risk of not making ends meet and, therefore of getting into financial difficulty. They did not have savings to replace the lost earnings and indicated that they would either need to borrow to make ends meet or they would be unable to meet their existing commitments. There was a fairly strong link between falling into this category and both age and family income. The younger and poorer people were the higher the risk they faced. There was also a strong link with educational qualifications – the risk being highest among people with no qualifications who were likely, therefore, to be in unskilled jobs. The likelihood was higher in families with a single earner than where there were two; and among single people. Tenants ran a higher risk than home owners, and people living in London had the highest risk in the UK. There was also a strong link to people’s attitudes towards saving and spending. The more profligate they were the greater the risk they faced of getting into difficulty if the main wage earner lost their job. In cross tabular analysis the risk increased the more of their family income people were paying to service unsecured credit agreements; in multivariate analysis, however, this effect was reduced when attitudes to spending and saving were taken into account. There was a strong link between the level of financial stress people were currently experiencing and whether they would be able to make ends meet following the loss of the main wage. Nine in ten of the people struggling on a low income or who were struggling and over-indebted who currently had a wage coming in, would be in real difficulty in such circumstances. At the same time, it is important to note that two in ten of the people who were financially sound or managing reasonably well when they were interviewed would also be likely to face difficulties.

__________________________________________________________References
69
References A Atkinson, S. McKay, E. Kempson and S.Collard (2006) Levels of financial capability in the UK: Results of a baseline survey. Financial Services Authority. R Barwell, O. May and S. Pezzini (2006) ‘The distribution of assets, income and liabilities across UK households: results from the NMG Research survey. Bank of England Quarterly Bulletin: Spring 2006. R. Berthoud and E. Kempson (1992) Credit and debt: the PSI report. Policy Studies Institute. Citizens Advice (2005) Inquiry into fuel price increases. Citizens Advice. Consumer Credit Counselling Service (2006) CCCS statistical yearbook, 2005. CCCS. Department of Trade and Industry (2006) Tackling over-indebtedness. Annual report, 2006. DTI. N. Dominy and E. Kempson (2006) Understanding older people’s experiences of poverty and material deprivation. Department for Work and Pensions. A. Elliott (2005) Not waving but drowning: over-indebtedness by misjudgement. Centre for the Study of Financial Innovation. Financial Services Authority (2006a) Financial capability baseline survey: methodological report. FSA. Financial Services Authority (2006b) Financial risk outlook 2006. FSA. J. Ford, E. Kempson and M. Wilson (1995) Mortgage arrears and possessions: perspectives from borrowers, lenders and the courts. HMSO (Department of the Environment). A. Herbert and E. Kempson (1995) Water debt and disconnection. Policy Studies Institute. E. Kempson (1996) Life on a low income. York Publishing. E. Kempson (2002) Over-indebtedness in Britain. Department of Trade and Industry. E. Kempson, S. McKay and M. Willitts (2004) Characteristics of families in debt and the nature of indebtedness. Department for Work and Pensions.

Overstretched: People at risk of financial difficulties___________________________
70
E Kempson, S. Collard and N. Moore (2005) Measuring financial capability: an exploratory study. Financial Services Authority Trade and Industry Committee (2005a) Fuel prices: Twelfth Report of Session 2004-05. HMSO (HC 279). Trade and Industry Committee (2005b) Fuel prices: Responses to the Committee’s Twelfth Report of Session 2004-05. HMSO (HC 363). M.Whetstone (2002) Hard times; a study of pensioner poverty. Centre for Policy on Ageing.

____________________________________________________Technical Appendix
71
Technical Appendix Imputing fuel bills. The baseline survey of financial capability did not ask respondents about the amount of money that they spent on fuel. It did, however, ask about many aspects of their personal and family characteristics that would impact on the amount they spent, such as the number of people in the household, and the country in which they lived. It would be possible to make basic assumptions about the likely levels of payments from this information. However, we wanted the expenditure information to be as robust as possible in order to be able to use it in additional analysis. We therefore turned to the 2004/5 Expenditure and Food Survey (EFS) which has detailed accounts of the amount spent on fuel in different households. The EFS includes many of the same background characteristics as the baseline survey. We were therefore able to create a detailed model of fuel payments from the EFS and apply it to the baseline survey. We took fuel to include all expenditure on gas, electricity and oil, and calculated a single amount for expenditure at family level. We then used regression analysis on the EFS data to understand the relationship between fuel bills and: tenure, quarter of the year, number of adults, number of children and country within the UK (Table A.1). We applied the results of the EFS regression analysis to the baseline survey of financial capability to predict the fuel expenditure amongst these respondents. The baseline survey was completed within the second quarter of the year, and this was taken into account when applying the regression coefficients. However, we also knew from the regression analysis how the fuel bills varied by quarter, and so applied this to our data to impute a monthly payment figure from predicted annual expenditure. Calculating an increase in payments Fuel prices have increased notably in the year since fieldwork was completed for the baseline survey. We have assumed an increase of 40 per cent, based on the average rise across different firms for gas and electricity. Gas and electricity are essential goods with few (if any) substitutes, and as such, we would not expect demand to decrease markedly when prices go up However, it is unreasonable to expect that a price rise will leave demand entirely unchanged. We have thus assumed a price elasticity of 0.1 and have calculated that demand would decrease by four per cent. We have taken this decrease in demand into account in our reporting of the impact of price increases. It is important to note that we are not writing about the impact of this reduction in demand – which could have severe health consequences for the most vulnerable. In this report we focus on the financial impact of increases in expenditure.

Overstretched: People at risk of financial difficulties___________________________
72
Table A.1 Fuel expenditure by household characteristics R squared 0.189
Unstandardised Coefficients
Standardized Coefficients
B Std. Error Beta t Significance
(Constant) 12.407 .236 52.584 .000
Tenure Outright owner occupier .282 .218 .018 1.296 .195 Mortgagor Reference category Local authority -3.901 .281 -.180 -13.866 .000 Private rental -2.881 .369 -.096 -7.802 .000 Other tenure -2.022 .508 -.048 -3.981 .000
Quarter of the year Quarter 1 1.200 .250 .068 4.809 .000 Quarter 2 Reference category Quarter 3 .725 .245 .042 2.954 .003 Quarter 4 1.724 .243 .101 7.083 .000
Number of adults 1 -3.207 .207 -.198 -15.460 .000 2 Reference category 3 1.480 .295 .061 5.021 .000 4 or more 2.553 .454 .067 5.622 .000
Number of children 0 Reference category 1 1.014 .289 .044 3.505 .000 2 2.266 .280 .102 8.087 .000 3 2.880 .476 .073 6.048 .000 4 or more 4.397 .791 .066 5.557 .000
Country within UK England Reference category Scotland 1.247 .324 .045 3.856 .000 Wales .420 .410 .012 1.026 .305 Northern Ireland 4.592 .326 .167 14.096 .000