Overfilling Protection for Weak Tanks · Overfilling Protection for Weak Tanks Rahul Raman...
12
GCPS 2015 __________________________________________________________________________ Overfilling Protection for Weak Tanks Rahul Raman, Justin Phillips Provenance Consulting LLC 1820 S. Mason Rd., Katy, TX 77450 Email [email protected] Dr. Davide Moncalvo, Dr. Thomas Heidermann, Frank Heinrich Braunschweiger Flammenfilter GmbH (PROTEGO ® ) Industriestraße 11, 38110 Braunschweig, Germany Email [email protected] Steve Kostos Bayer Business and Technology Services LLC 8500 West Bay Road, MS 52, Baytown, TX 77523-8727, USA [Insert here any copyright claims you wish to assert] Prepared for Presentation at American Institute of Chemical Engineers 2015 Spring Meeting 11th Global Congress on Process Relief Austin, Texas April 27-29, 2015 UNPUBLISHED AIChE shall not be responsible for statements or opinions contained in papers or printed in its publications
Transcript of Overfilling Protection for Weak Tanks · Overfilling Protection for Weak Tanks Rahul Raman...
GCPS 2015 __________________________________________________________________________
Overfilling Protection for Weak Tanks
Rahul Raman, Justin Phillips
Provenance Consulting LLC
1820 S. Mason Rd., Katy, TX 77450
Email [email protected]
Dr. Davide Moncalvo, Dr. Thomas Heidermann, Frank Heinrich
Braunschweiger Flammenfilter GmbH (PROTEGO®)
Industriestraße 11, 38110 Braunschweig, Germany
Email [email protected]
Steve Kostos
Bayer Business and Technology Services LLC
8500 West Bay Road, MS 52, Baytown, TX 77523-8727, USA
[Insert here any copyright claims you wish to assert]
Prepared for Presentation at
American Institute of Chemical Engineers
2015 Spring Meeting
11th Global Congress on Process Relief
Austin, Texas
April 27-29, 2015
UNPUBLISHED
AIChE shall not be responsible for statements or opinions contained
in papers or printed in its publications
GCPS 2015 __________________________________________________________________________
Overfilling Protection for Weak Tanks
Rahul Raman
Provenance Consulting LLC
1820 S. Mason Rd., Katy, TX 77450
Email [email protected]
Dr. Davide Moncalvo, Dr. Thomas Heidermann, Frank Heinrich
Braunschweiger Flammenfilter GmbH (PROTEGO®)
Justin Phillips
Provenance Consulting LLC
Steve Kostos
Bayer Business and Technology Services LLC
Keywords: overfilling protection, pressure vacuum relief valves, atmospheric tanks, weak tanks
Abstract
In this paper the use of pressure relief valves for protection against overfilling is discussed. Two
practical approaches are herein discussed and their strengths are pin-pointed. The validation
against measurements with two PROTEGO® relief valves has been successful for both methods.
Nevertheless, further research should be done on this topic.
1. Introduction
The protection of near atmospheric or low pressure non-refrigerated aboveground tanks with a
design pressure of 15 psig (1.034 bar-g) or below from overpressure due to overfilling by using
low pressure relief valves is discussed in this paper. Low pressure relief valves are normally
sized for gas flows according to API 2000 [1] and are generally installed at the top of the non-
refrigerated tanks. Indeed, API 2000 suggests other solutions for liquid overfilling, like the
installation of two repairable level sensing instruments and an independent actuator to close the
filling valves and it refers to API RP 2350 [2] for full details.
However, electrical transducers and actuators must be maintained accurate by regular calibration
and inspection as specified in API RP 2350, which may be a burden especially for remote tanks,
where relief valves are usually already installed. In this context it may be conceivable to use the
low pressure relief valve to discharge the liquid overfilling so that acceptable accumulation can
be built up in the tank. This solution can be considered as an independent additional measure of
protection for the case that the filling sensors are not recently calibrated or the electricity supply
GCPS 2015 __________________________________________________________________________
to them is interrupted. Indeed, one of the main hindrances in the application of low pressure
relief valves for the prevention of liquid overfilling is the paucity of available data to estimate
even roughly if an available valve would suffice to prevent overfilling.
In this paper the authors offer two simple and immediate approaches to estimate the liquid
capacity of low pressure relief valves. The accuracy of the predictions is compared against
measurements performed with two PROTEGO®
valves at an independent testing partner. One
approach is applicable when little information is available about the pressure relief valve and
general literature data must be used, while the second approach may be useful when the air
capacity of a selected valve is available.
2. Experimental background
PROTEGO® has several years of experience and a large database of dedicated water capacity
measurements through flame arresters and low pressure relief valves.
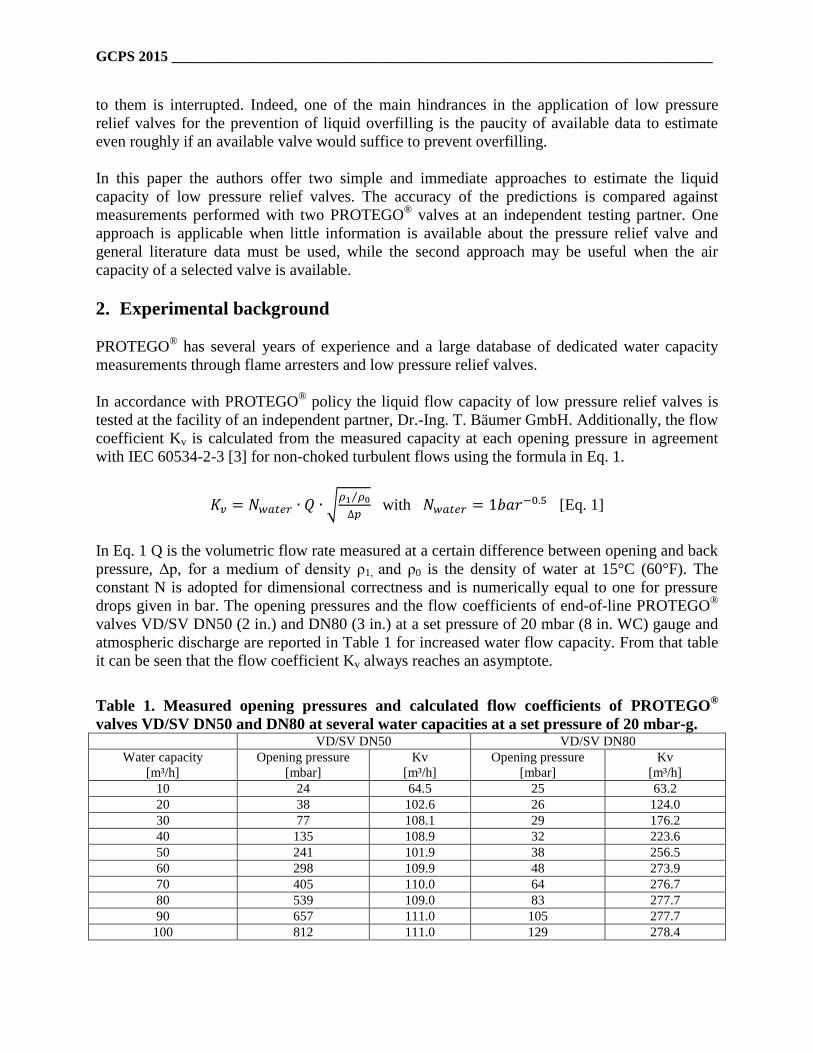
In accordance with PROTEGO® policy the liquid flow capacity of low pressure relief valves is
tested at the facility of an independent partner, Dr.-Ing. T. Bäumer GmbH. Additionally, the flow
coefficient Kv is calculated from the measured capacity at each opening pressure in agreement
with IEC 60534-2-3 [3] for non-choked turbulent flows using the formula in Eq. 1.
𝐾𝑣 = 𝑁𝑤𝑎𝑡𝑒𝑟 ∙ 𝑄 ∙ √𝜌1 𝜌0⁄
∆𝑝 with 𝑁𝑤𝑎𝑡𝑒𝑟 = 1𝑏𝑎𝑟−0.5 [Eq. 1]
In Eq. 1 Q is the volumetric flow rate measured at a certain difference between opening and back
pressure, Δp, for a medium of density ρ1, and ρ0 is the density of water at 15°C (60°F). The
constant N is adopted for dimensional correctness and is numerically equal to one for pressure
drops given in bar. The opening pressures and the flow coefficients of end-of-line PROTEGO®
valves VD/SV DN50 (2 in.) and DN80 (3 in.) at a set pressure of 20 mbar (8 in. WC) gauge and
atmospheric discharge are reported in Table 1 for increased water flow capacity. From that table
it can be seen that the flow coefficient Kv always reaches an asymptote.
Table 1. Measured opening pressures and calculated flow coefficients of PROTEGO®
valves VD/SV DN50 and DN80 at several water capacities at a set pressure of 20 mbar-g. VD/SV DN50 VD/SV DN80
Water capacity
[m³/h]
Opening pressure
[mbar]
Kv
[m³/h]
Opening pressure
[mbar]
Kv
[m³/h]
10 24 64.5 25 63.2
20 38 102.6 26 124.0
30 77 108.1 29 176.2
40 135 108.9 32 223.6
50 241 101.9 38 256.5
60 298 109.9 48 273.9
70 405 110.0 64 276.7
80 539 109.0 83 277.7
90 657 111.0 105 277.7
100 812 111.0 129 278.4

GCPS 2015 __________________________________________________________________________
The test apparatus is schematically described below.
2.1 Description of the test rig
The test facility for the flow capacity measurement of low pressure relief valves is reproduced in
Fig. 1a. Water is pumped out from a 1 m³ (35.3 ft³) collection tank to the test valve from where it
either flows back to the tank or is discharged in the sewers. The distances of the pressure sensors
from the valve are in agreement with IEC 60534-2-3 [3]. A temperature sensor is located
upstream from the valve to calculate the medium density ρ1. The volumetric flow capacity is
measured with a magnetic inductive mass flow meter in position FIR II.
The accuracy of instrumentation meets the requirements of IEC 60534-2-3, namely for the
thermometers ± 1°C ( ± 1.8°F) and for the flow meter within 2 % of the measured value.
Fig. 1a. Test rig for measurement of relief valves water capacity.
TIR PIR PDIR
FIR I
FIR II
TANK
TEST VALVE

GCPS 2015 __________________________________________________________________________
Fig. 1b VD/SV tested with water Fig. 1c. Example of Valve function test
2.2 Valve function
PROTEGO® relief valves start to open at the set pressure and require 10 % overpressure to
achieve full lift. The full lift type technology allows the valve to be set just 10% below the
maximum allowable pressure in the tank or equipment.
The opening characteristic is well defined for gas and vapors. But, does the relief valve, like the
one in Fig. 1b, show the same characteristic for liquid flows? For any capacity estimation or
calculation the valve characteristic curve should be known. To verify the valve characteristic
curve the same test apparatus as given in Fig. 1a was used. The valve pallet was equipped with a
distance sensor as a lift meter, which was used to indicate the position of the valve pallet, so that
the sensor reads zero, when the valve is closed.
Figure 1c shows the lift as a function of tank pressure for air and water. The full lift type valve
with a set pressure of 30 mbar-g (12 in. WC-g) shows a hysteresis, with different curves for the
opening (pallet moving upwards) and closing (pallet moving downwards) of the valve. The
valve opens with an overpressure of 10% for both air and water. For Newtonian liquids with a
viscosity close to water, the opening characteristic of full lift relief valves is similar to that of
gaseous fluids.
GCPS 2015 __________________________________________________________________________
3. Approach using literature data
There are currently limited methods for sizing low pressure relief valves for liquid flow. The
method in this section is a quick calculation to estimate the liquid flow through low pressure
relief valves based on conventional techniques readily available for engineers at their disposal. A
step-by-step approach is suggested and the reader is cautioned to follow all local and federal
regulations, and internal company guidelines. Standard formulae are available for performing
hydraulic analysis and engineers use a variety of tools at their disposal.
This method is based on first estimating the ideal flow capacity of a relief valve using available
methods. The ideal flow capacity is then compared with experimental test data to correlate the
calculation and test results. A correction factor is proposed as a function of the percentage
overpressure and multiplied by the ideal flow capacity to obtain the corrected flow rate values.
The correction factor is generated for both United States Customary System (USCS) and metric
units. This is an extension of a previous work already presented at the DIERS User Group Spring
2014 Meeting [9].
3.1 Calculating flow coefficient
Relief system designers often use flow curves or software provided by vendors to size low
pressure relief valves for weak tanks. PROTEGO® sizing program offers flow curves for valves
in the product catalog [4]. It is suggested to use standard control valve sizing equations to back
calculate Cv, the flow coefficient of the valve [3], or control valve manufacturer’s method. Eq. 2
calculates the flow coefficient for a given pressure drop, upstream pressure P1a, W flow rate of
the pressure relief valve, and thermo-physical properties of the gas.
𝐶𝑣 =𝑊
39.612 √𝐹𝛾𝑃1𝑎𝜌1 [Eq. 2]
The absolute upstream pressure, P1a, should be evaluated 100% overpressure, i.e. at least two
times the set pressure. At lower pressures the effect of the weighted pallets are more pronounced
and the coefficients therefore need to be calculated at higher overpressures. Essentially at higher
overpressure, the resistance of the weights becomes negligible and the valve can be treated as a
pipefitting. However, the low pressure vents are typically used for low pressure tanks that have
design pressure less than 15 psig.
In addition to the above constraints, the design pressure of the tank is defined at the tangent line
and a relief system designer must consider the effects of static head especially for liquid flow
through the relief valve. The resulting relief pressure is a combination of the static pressure at
which sizing is done, the static head from tangent line to the seat of the atmospheric vent or top
face of outlet flange on a pipe away model, and the velocity head to accelerate the fluid from
tank nozzle to vent entrance. The relief pressure must not exceed the maximum allowable
accumulation pressure of the tank. The capacity calculated using this method should exceed or
equal the required capacity of the overpressure scenario.
GCPS 2015 __________________________________________________________________________
The set pressure of such devices is typically well below the design pressure of the tank. Typical
overpressures that are allowed for such valves range from 10% to roughly 200% of set pressure;
see the paper of Moncalvo et al. on the effect of overpressure on valve performance [5].
3.2 Sizing Calculations
Hydraulic analysis of a piping system is a common practice and a day-to-day activity for
engineers. CRANE Technical paper no. 410, published in both USCS and Metric units is a useful
resource for engineers [6]. A basic review of the required methodology is highlighted here and is
not all-inclusive. The pressure drop through valves, fittings, and pipe is calculated using,
∆𝑃 = 1.801 ∗ 10−5 ∗𝐾∗𝜌∗𝑄2
𝑑4 USCS Units [Eq. 3]
∆𝑃 = 225.2𝐾∗𝜌∗𝑄2
𝑑4 Metric Units [Eq. 4]
The total resistance to flow in the system is defined as a unit-less resistance coefficient, K. This
is the sum of the valves, fittings, and pipes. For the purpose of this method, Eq. 4 is considered to
be the ideal flow through the system and is next compared with experimental values to obtain a
correction factor multiplier to estimate the corrected flow. The flow coefficient calculated using
Eq. 1 can be converted to resistance coefficient using the following equations,
𝐾𝑣 = 0.865 ∗ 𝐶𝑣 [Eq. 5]
𝐾 = 890.3 ∗𝑑4
𝐶𝑣2 USCS Units [Eq. 6]
𝐾 = 0.0016 ∗𝑑4
𝐾𝑣2 Metric Units [Eq. 7]
The diameter for the above equations can equal the throat diameter of the relief valve. Typically
this can be considered equal to the inlet nominal pipe size of a low pressure relief valve.
3.2.1 Estimation of overpressure correction factor
The flow through the relief valve is affected by the weights of the pallet. At lower pressures the
flow is lower than calculated ideal flow through a short piece of pipe. The flow coefficient is
added as a resistance coefficient to find the actual resistance caused by the valve without
additional resistance created by the weights. In addition to the above, a sharp edged conservative
entrance plus the length from the vessel nozzle to the throat of the vent should be considered. In
the example calculations shown below, the characteristic nozzle length of 12 inches was
considered. The relieving fluid was water and its properties at standard conditions were
incorporated for the calculations. The example calculations are shown for a DN80 (3-inch)
VD/SV PROTEGO® relief valve in USCS units and the same approach was repeated in Metric
units. Eq. 8 calculates Kp, the overpressure correction parameter. See Table. 2 for value of Kp for

GCPS 2015 __________________________________________________________________________
the given data obtained from flow test. Qest for Table. 2 are calculated using Eq. 3 and Eq. 4
using an iterative calculation.
𝐾𝑝 =𝑄𝑒𝑠𝑡
𝑄𝑑𝑎𝑡𝑎 [Eq. 8]
Table 2. Estimated flow rate from Eq. 3 & Eq. 4 for a DN80 (3 inch) VD/DV relief valve
ΔP % OP Qest Qdata Kp Qest Qdata Kp
[psi] 0% [gpm] [gpm] [--] [m3 / hr] [m
3 / hr] [--]
0.363 25% 129 44 0.343 10 28.98 0.345
0.377 30% 131 88 0.672 20 29.58 0.676
0.421 45% 138 132 0.954 30 31.32 0.959
0.464 60% 145 176 1.211 40 32.88 1.216
0.551 90% 159 220 1.389 50 35.88 1.395
0.696 140% 178 264 1.482 60 40.32 1.489
0.928 220% 206 308 1.497 70 46.56 1.504
1.204 315% 234 352 1.502 80 53.04 1.509
1.523 425% 264 396 1.502 90 59.64 1.509
1.871 545% 292 440 1.506 100 66.12 1.513
Overpressure correction factor, Kp as a function of percent overpressure is shown in Figure 2 for
both valves. A sum of least square method with a third order polynomial was regressed with a
maximum constraint of 1.3 for the correction factor. This maximum constraint of 1.3 is chosen in
order to obtain conservative flow rates, i.e. lower flow rates and is the lower bound. For higher
overpressures the factor does not exceed 1.3 and is considered to be a conservative estimate.
Figure 2 shows the Eq. 9 obtained by a sum of least squares method.
Figure 2. Overpressure Correction Factor Vs % Overpressure USCS Units

GCPS 2015 __________________________________________________________________________
𝐾𝑃 = 0.577 ∗ %𝑂𝑃3 − 2.595 ∗ %𝑂𝑃2 + 3.645 ∗ %𝑂𝑃 − 0.299 USCS Units [Eq. 9]
𝐾𝑃 = 0.559 ∗ %𝑂𝑃3 − 2.517 ∗ %𝑂𝑃2 + 3.535 ∗ %𝑂𝑃 − 0.25 Metric Units [Eq. 10]
3.2.3 Equations for sizing low pressure relief valves
The correction factors are multiplied to Eq.3 and Eq. 4 to obtain the following equations that can
calculate the flow through the relief valve as a function of pressure drop across the valve, throat
diameter of the valve, density of fluid, and resistance coefficient.
𝑄 = √∆𝑃∗𝑑4
1.801∗10−5∗𝐾∗𝜌∗ 𝐾𝑝USCS Units [Eq. 11]
𝑄 = √∆𝑃∗𝑑4
225.2∗𝐾∗𝜌∗ 𝐾𝑝 Metric Units [Eq. 12]
The flow capacities of the valves are calculated and compared with test data. Table 3 shows the
values for both DN50 (2”) and DN80 (3”) valves along with error percentages. The Kp curve is
modeled using a constraint of 1.3 to ensure that we do not over predict the capacity of the valve.
The error percentages can be within a ± 7.5 % error if an unconstrained sum of least square
method is performed. .
Table 3. Percentage flow error against measured data for PROTEGO® VD/SV valves
VD/SV DN50 (2 inch) VD/SV DN80 (3 inch)
Qdata
(gpm)
Qdata
(m3 / hr)
% OP Qerror
(USCS)
Qerror
(Metric)
%OP Qerror
(USCS)
Qerror
(Metric)
44 10 20% -57% 53% 25% 35% 40%
88 20 90% 7% -6% 30% -14% -11%
132 30 285% 2% -1% 45% -8% -8%
176 40 575% 1% 0% 60% -11% -11%
220 50 1105% 8% -7% 90% -6% -7%
264 60 1390% 0% 1% 140% -12% -13%
308 70 1925% -0.1% 1% 220% -13% -14%
352 80 2595% 1% 0% 315% -13% -14%
396 90 3185% -1% 2% 425% -13 % -14%
440 100 3960% -1% 2% 545% -13% -14%
The method proposed here seems to be a quick, accurate, and easy technique that can be easily
adopted by process engineers for calculating liquid flow capacities through low pressure relief
valves. The reader is cautioned not to use the above method in the range of overpressures below
30% as less conservative values are obtained. The estimated capacities for overpressures above

GCPS 2015 __________________________________________________________________________
30% are within reasonable tolerances. The user is cautioned that this provides the relief capacity
of the valve only and effects of static and velocity head must be accounted for in determining the
adequacy of the entire relief system.
4. Approach using manufacturer’s relief valve air capacity data
This experimental rule-of-thumb consists of finding a relationship between the capacity of air
and water flowing through the valve.
In order to develop such a relationship a connection between the flow rates and the pressure drop
through the device for both media must be derived. By a cross comparison among several
manufacturers a polynomial relationship like the one in Eq. 13 between air capacity and pressure
drop seems to fit the curves at best. In that equation the parameter Kair can be treated as the flow
coefficient for air flows and the safety factor φ is a fitting parameter to consider the ratio
between the certified and the measured flow capacity. If no exact value for φ is given by the
manufacturer for the specific valve, it can be assumed equal to 1.1.
𝑄𝑎𝑖𝑟 = 𝜑 ∙ 𝑁𝑎𝑖𝑟 ∙ 𝐾𝑎𝑖𝑟 ∙ ∆𝑝𝑎 with 𝑁𝑎𝑖𝑟 = 1 𝑏𝑎𝑟−𝑎 [Eq. 13]
For water flows a similar polynomial relationship can be derived by adjusting Eq. 1 as shown in
Eq. 14. For sake of simplicity, the flow coefficient can be assumed roughly constant and equal to
the asymptotic value extracted from Table 1.
𝑄𝑤𝑎𝑡𝑒𝑟 = 𝑁𝑤𝑎𝑡𝑒𝑟 ∙ 𝐾𝑤𝑎𝑡𝑒𝑟 ∙ ∆𝑝0.5 with 𝑁𝑤𝑎𝑡𝑒𝑟 = 1𝑏𝑎𝑟−0.5 [Eq. 14]
In this case the flow coefficient for water is measured but that is not the case in the normal
practice. The simplest method to estimate it is to consider that at near atmospheric pressures air
tends to behave as a weakly compressible or almost incompressible medium. Therefore, on
behalf of the ideal nozzle theory applied to safety valves as in ISO 4126 [4] or API 520 [8] the
ratio of the flow coefficients is equal to the square root of the inverse of the density ratio, Eq. 15.
𝐾𝑤𝑎𝑡𝑒𝑟 𝐾𝑎𝑖𝑟 ≈⁄ 𝑁𝑎𝑖𝑟 𝑁𝑤𝑎𝑡𝑒𝑟⁄ ∙ 𝜑 ∙ 𝑄𝑤𝑎𝑡𝑒𝑟 𝑄𝑎𝑖𝑟 ∙ ∆𝑝𝑎−0.5⁄
≈ 𝑁𝑎𝑖𝑟 𝑁𝑤𝑎𝑡𝑒𝑟⁄ ∙ 𝜑 ∙ √𝜌𝑎𝑖𝑟 𝜌𝑤𝑎𝑡𝑒𝑟⁄ ∙ ∆𝑝𝑎−0.5
≈ (∆𝑝/𝑏𝑎𝑟)𝑎−0.5 ∙ 𝜑 ∙ 0.03165 [Eq. 15]
For the two valves VD/SV DN50 and DN80 based on Eq. 15 the approximated water flow
coefficients obtained from the TÜV certified air flow curves are respectively 105.7 and 231.2
Nm³/h, assuming the parameter a close to 0.5. The roughly estimated water flow coefficients are
rather close to the measured ones, respectively 111 and 278 Nm³/h. based on the obtained water
flow coefficients the water flow capacities are calculated using Eq. 3 and compared against the
measured values of Table 1 in Table 4.
From Table 4 it can be easily seen that the proposed rule of thumb results in reasonable
agreement with the measured water flow rates except for the range of very low opening
pressures. The authors recommend for very low capacities to modify the control valve equation
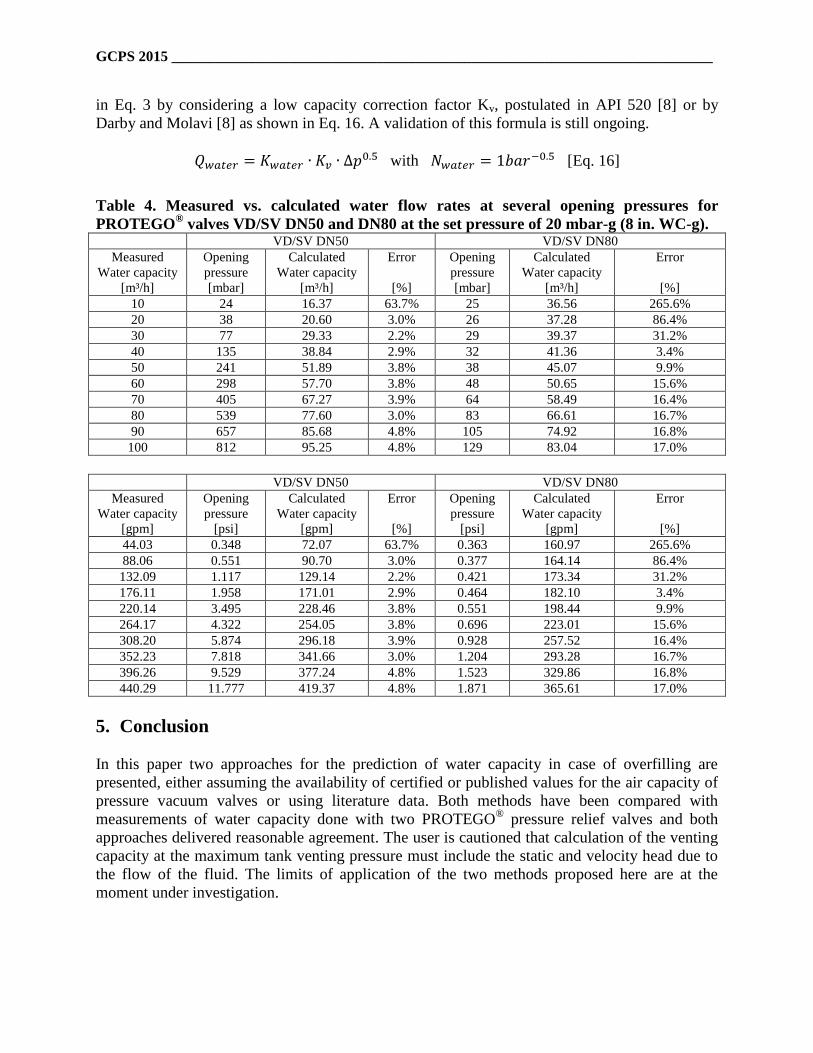
GCPS 2015 __________________________________________________________________________
in Eq. 3 by considering a low capacity correction factor Kv, postulated in API 520 [8] or by
Darby and Molavi [8] as shown in Eq. 16. A validation of this formula is still ongoing.
𝑄𝑤𝑎𝑡𝑒𝑟 = 𝐾𝑤𝑎𝑡𝑒𝑟 ∙ 𝐾𝑣 ∙ ∆𝑝0.5 with 𝑁𝑤𝑎𝑡𝑒𝑟 = 1𝑏𝑎𝑟−0.5 [Eq. 16]
Table 4. Measured vs. calculated water flow rates at several opening pressures for
PROTEGO® valves VD/SV DN50 and DN80 at the set pressure of 20 mbar-g (8 in. WC-g).
VD/SV DN50 VD/SV DN80
Measured
Water capacity
[m³/h]
Opening
pressure
[mbar]
Calculated
Water capacity
[m³/h]
Error
[%]
Opening
pressure
[mbar]
Calculated
Water capacity
[m³/h]
Error
[%]
10 24 16.37 63.7% 25 36.56 265.6%
20 38 20.60 3.0% 26 37.28 86.4%
30 77 29.33 2.2% 29 39.37 31.2%
40 135 38.84 2.9% 32 41.36 3.4%
50 241 51.89 3.8% 38 45.07 9.9%
60 298 57.70 3.8% 48 50.65 15.6%
70 405 67.27 3.9% 64 58.49 16.4%
80 539 77.60 3.0% 83 66.61 16.7%
90 657 85.68 4.8% 105 74.92 16.8%
100 812 95.25 4.8% 129 83.04 17.0%
VD/SV DN50 VD/SV DN80
Measured
Water capacity
[gpm]
Opening
pressure
[psi]
Calculated
Water capacity
[gpm]
Error
[%]
Opening
pressure
[psi]
Calculated
Water capacity
[gpm]
Error
[%]
44.03 0.348 72.07 63.7% 0.363 160.97 265.6%
88.06 0.551 90.70 3.0% 0.377 164.14 86.4%
132.09 1.117 129.14 2.2% 0.421 173.34 31.2%
176.11 1.958 171.01 2.9% 0.464 182.10 3.4%
220.14 3.495 228.46 3.8% 0.551 198.44 9.9%
264.17 4.322 254.05 3.8% 0.696 223.01 15.6%
308.20 5.874 296.18 3.9% 0.928 257.52 16.4%
352.23 7.818 341.66 3.0% 1.204 293.28 16.7%
396.26 9.529 377.24 4.8% 1.523 329.86 16.8%
440.29 11.777 419.37 4.8% 1.871 365.61 17.0%
5. Conclusion
In this paper two approaches for the prediction of water capacity in case of overfilling are
presented, either assuming the availability of certified or published values for the air capacity of
pressure vacuum valves or using literature data. Both methods have been compared with
measurements of water capacity done with two PROTEGO®
pressure relief valves and both
approaches delivered reasonable agreement. The user is cautioned that calculation of the venting
capacity at the maximum tank venting pressure must include the static and velocity head due to
the flow of the fluid. The limits of application of the two methods proposed here are at the
moment under investigation.

GCPS 2015 __________________________________________________________________________
Future work would be to further test both approaches with additional types of pressure relief
valves to broaden the range of applications. Nevertheless, the authors still recommend to contact
the valve manufacturer for dedicated certified water capacity measurements.
6 Notation
Notation USCS Units Metric Units
Mass flow rate, W Lbsm/hr Kg/h
Fγ, Specific heat ratio factor Dimensionless Dimensionless
XT, Pressure differential ratio
factor
Dimensionless Dimensionless
Upstream pressure, P1a Psia Pa
Static pressure at valve inlet,
P1
psig Pa-g
Flow coefficient Cv = GPM of water per psi
pressure drop
Kv = cubic meters per hour at
a pressure drop of one
kilogram per square
centimeter.
Pressure drop, ΔP Psi Pa
Resistance Coefficient, K Dimensionless Dimensionless
Volumetric flow rate, Q Gpm (US) Liters per minute (lpm)
Density of fluid, ρ Lbm/ft³ Kg/m³
Diameter of piping system, d Inches Millimeter
Overpressure correction factor Dimensionless Dimensionless
7 References [1] API 2000 Seventh Edition, Venting Atmospheric and Low pressure Storage Tanks, 2014.
[2] API Recommended Practice 2350 Third Edition, Overfill Protection for Storage Tanks in Petroleum
Facilities 2005.
[3] IEC 60534-2-3: Industrial Process Control Valves. Part 2-3: Flow Capacity. Test Procedures, 1997.
[4] PROTEGO® sizing program, Available at http://www.protego.com/engineering/design.html,
Accessed on February 8, 2015.
[5] D. Moncalvo, M. Davies, M. Barfield, C. Mason, Influence of Overpressure in Pressure Vacuum
Safety Valves on Emission Reduction and Explosion Risk Minimization of Atmospheric Storage
Tanks, Proc. 11th GCPS, Auston, TX, 2015.
[6] CRANE Technical Paper No. 410, Flow of fluids through valves, fittings and pipe, 2014.
[7] ISO 4126-1, Safety devices for protection against excessive pressure -- Part 1: Safety valves, 2013.
[8] R. Darby and K. Molavi, Viscosity correction factor for emergency relief valves, Proc. Saf. Prog. 16
(1997), 80 -82. [9] Raman - Overflow Protection for Weak Tanks, DIERS User Group Spring 2014 Meeting.