Overcoming barriers to cycling to intermediate …‘I want to ride my bike’: overcoming barriers...
94
‘I want to ride my bike’: overcoming barriers to cycling to intermediate schools August 2009 Hamish Mackie TERNZ Limited NZ Transport Agency research report 380
Transcript of Overcoming barriers to cycling to intermediate …‘I want to ride my bike’: overcoming barriers...
‘I want to ride my bike’: overcoming barriers to cycling to intermediate schools
August 2009 Hamish Mackie TERNZ Limited
NZ Transport Agency research report 380
ISBN: 978-0-478-34667-1 (PDF)
ISBN: 978-0-478-34668-8 (paperback)
ISSN: 1173-3764 (PDF)
ISSN: 1173-3756 (paperback)
© 2009, NZ Transport Agency
Private Bag 6995, Wellington 6141, New Zealand
Telephone 64 4 894 5400; facsimile 64 4 894 6100
www.nzta.govt.nz
Mackie, H. 2009. ‘I want to ride my bike’: overcoming barriers to cycling to intermediate schools. NZ
Transport Agency research report no. 380. 94pp.
Keywords: Active transport, cycling, physical activity, safety, school, travel
An important note for the reader
The NZ Transport Agency is a Crown entity established under the Land Transport Management Act
2003. The objective of the Agency is to undertake its functions in a way that contributes to an
affordable, integrated, safe, responsive and sustainable land transport system. Each year, the NZ
Transport Agency funds innovative and relevant research that contributes to this objective.
The views expressed in research reports are the outcomes of the independent research, and should not
be regarded as being the opinion or responsibility of the NZ Transport Agency. The material contained
in the reports should not be construed in any way as policy adopted by the NZ Transport Agency or
indeed any agency of the NZ Government. The reports may, however, be used by NZ Government
agencies as a reference in the development of policy.
While research reports are believed to be correct at the time of their preparation, the NZ Transport
Agency and agents involved in their preparation and publication do not accept any liability for use of
the research. People using the research, whether directly or indirectly, should apply and rely on their
own skill and judgment. They should not rely on the contents of the research reports in isolation from
other sources of advice and information. If necessary, they should seek appropriate legal or other
expert advice.
Acknowledgments
The author would like to thank the schools, parents and students who participated in this research, and
in particular the main contacts for each school. These people were:
Chris Stuart – Avondale Intermediate School
Paul Douglas – Kowhai Intermediate School
Nigel Davis – Wesley Intermediate School
Richard Thompson – Devon Intermediate School
Mike Bibby – Tauranga Intermediate School
Stuart Taylor – Mount Maunganui Intermediate School
School travel representatives from local authorities also provided a great deal of assistance. I would
particularly like to thank Claire Dixon from Auckland City Council for her involvement. Mike Calvert
(Tauranga City Council) and Angela James (New Plymouth District Council) were also very helpful.
Abbreviations and acronyms
ARTA Auckland Regional Transport Authority
BCR Benefit cost ratio
BMI Body mass index
EEM Economic evaluation manual (NZTA)
NAP Neighbourhood accessibility plan
NZTA New Zealand Transport Agency
OECD Organisation for Economic Co-operation and Development
SER Self-explaining roads
SRTS Safe routes to school
TERNZ Transport Engineering Research NZ
5
Contents
Executive summary ............................................................................................................. 7
Abstract ............................................................................................................................. 10
1 Introduction .............................................................................................................. 11
2 Review of literature .................................................................................................. 14
2.1 School cycling-related research........................................................................ 15
2.2 School cycling initiatives and policy.................................................................. 16
2.3 The health benefits of active transport ............................................................. 18
2.4 Children and road safety .................................................................................. 20
2.5 Summary.......................................................................................................... 21
3 Research approach ................................................................................................... 23
4 Combined research findings.................................................................................... 27
4.1 Initial information ............................................................................................ 27 4.1.1 Location............................................................................................... 27 4.1.2 Where students live ............................................................................. 28 4.1.3 School travel surveys ........................................................................... 28 4.1.4 Key points from meetings with school representative, school travel
surveys and student focus groups ....................................................... 28
4.2 Development of cycling routes and other recommendations for action ............ 29
4.3 Theoretical maximum proportion of student cyclists........................................ 32
4.4 Parents’ survey................................................................................................. 33
5 Discussion ................................................................................................................ 37
5.1 Collective themes............................................................................................. 37
5.2 Recommendations for overcoming barriers to cycling to school....................... 40
5.3 Future research and strategic leadership.......................................................... 44
6 Conclusion ................................................................................................................ 45
7 References ................................................................................................................ 46
Appendix A ......................................................................................................................... 49
Appendix B.......................................................................................................................... 91

6
7
Executive summary
Introduction
Cycling as a travel option for school students has decreased significantly in the past 20 years.
Meanwhile, there is increasing evidence that the benefits of active transport, including cycling to
school, are significant yet understated in transport planning. This suggests that there is a rationale for
exploring how barriers to cycling to school might be overcome. The objective of this research was to
identify the barriers to students cycling to school for six intermediate schools and recommend specific
interventions for the schools, along with more general, national level recommendations.
Review of literature
Commuter cycling literature, guidance material and government initiatives tend to focus on adult
cycling. Information that relates specifically to cycling to school is very limited. An exception to this is
a large study carried out on the North Shore of Auckland. The key message from this study was that a
healthy proportion of school students would like to cycle to school but many road environments
presented significant barriers. Parents also perceived roads as being unsafe for cycling to school, which
was another significant barrier. Correspondingly, it has been shown that school travel plans have been
successful in increasing levels of walking, but not cycling, to school.
An increasingly risk-averse society in general also has a part to play in preventing students from
cycling to school. Literature suggests that an erosion of ‘social capital’ within communities has led to
more individualised behaviour and less awareness of others, which has contributed to an increased fear
of dangerous roads and ‘stranger danger’. Achieving independent child mobility is cited as an
important part of restoring social capital within communities.
Although there is an increased risk of injury or death when cycling to school compared with other
modes, on a per trip basis the risk is still small and New Zealanders in the 10–14-year age range are
more likely to drown than be killed in a cycling accident. There also appears to be a ‘safety in numbers’
effect and countries that have lower rates of cycling tend to have higher cycling crash rates.
Furthermore, the health benefits of cycling have been shown to far outweigh the accident costs of
cycling. Current evidence suggests that instead of responding to safety fears by avoiding cycling to
school, cycling to school should be promoted with a corresponding emphasis on safety.
Obesity is an epidemic in the developed world and should be a significant factor when the merits of
cycling initiatives are considered. Energy balance (the balance between energy intake and energy
expenditure) is at the core of the obesity problem and overseas there is a growing recognition that
active transport, including cycling for children, has an important role to play in fighting obesity. Within
New Zealand, research has shown that those who use active transport modes to commute to a place of
work or study are more likely to be classified as sufficiently active for health benefits and be of normal
body mass index (BMI) classification when compared with those who use automobile modes to reach
their destination. Increasing evidence for the health benefits of active transport has led to larger health
benefit allocations within active transport economic evaluation processes although the benefits of
active transport may still be understated within these processes.
‘I want to ride my bike’: overcoming barriers to cycling to intermediate schools
8
The literature suggests that a number of approaches are needed to increase school commuter cycling,
but user-friendly road environments for cyclists appear to be a priority. Safe routes to school,
neighbourhood accessibility plans, lower speed limits, and ‘self-explaining roads’ are all approaches
that have relevance. Practical road safety training and effective bike storage have also been cited as
important.
However, many are still unsure of the right approach for considering cycling to school. Therefore, the
objective of this research was to identify the specific barriers to students cycling to school for six
intermediate schools and recommend interventions that would be effective, acceptable to parents and
schools and favourable to students at the schools. These specific barriers and solutions were then used
to identify common themes, issues and solutions that might be considered at a national level, and give
more confidence to those who are responsible for considering and acting on school cycling initiatives.
Research approach
Six schools participated in the research – three within Auckland and three outside Auckland.
The research was carried out in four stages:
1 Gathering initial information
2 Student focus groups
3 Recommendations for each school, theoretical maximum number of student cyclists and parents’
survey
4 Collective themes, consideration of benefits and costs and national level recommendations.
For stage one, an initial site visit (examining the school environment and surrounding streets and a
meeting with a school representative) provided an understanding of the key cycling issues faced by
each school. At the next stage, for each school:
student focus groups gave greater insight into the barriers and solutions
a package of proposed cycling specific interventions was then developed
there was a significant focus on the development of a school cycle network
secure bike storage, cycle training, bike buddies, a school cycling officer, low-speed zones,
enforcement around the school and cycle trains were also included as options.
When parents were asked to rank the cycling initiatives, the most important were the school cycle
network, cycle training, low-speed zones and secure bike storage. The theoretical maximum number
of cyclists that might realistically be possible at each school was then estimated using roll maps for
each school and a set of rules to capture potential cyclists.
The data collection concluded with a parents’ survey, which asked parents a number of questions to
determine the importance they placed on each of eight proposed cycling initiatives. Parents were also
asked to comment openly on initiatives they felt might be implemented to allow their child to cycle to
school safely.
Executive summary
9
Finally, the findings from each of the six schools were compared to create overall themes that might
have relevance at a national level. Brief and preliminary consideration of the costs and benefits of
school cycle networks were also given.
Research findings
For all schools, except Mount Maunganui Intermediate, the number of students cycling to school was
considerably lower than the number who would like to cycle to school or the maximum theoretical
number of students who might cycle to each school. This supports previous literature and highlights
that there is a demand for cycling to school, especially at the intermediate school age. Across all
schools, and in support of previous research, the most significant barriers were seen to be the route to
school, the amount and speed of traffic, crossing busy roads, and personal and bike security. The need
for safe routes to school was a very clear priority for students and parents. Training, slower traffic and
effective bike storage were consistently identified as priorities and in some cases, stranger danger and
access to a bike were also important considerations. In general, intermediate school students (and their
parents) preferred to use quiet residential streets, footpaths, short-cuts and reserves to get to school.
One of the most striking differences between schools was that there appeared to be more of a cycling
culture at ‘non-Auckland’ schools, despite the fact that none of these had received any school travel
planning assistance. This generalisation requires caution as there are some Auckland schools with
significant numbers of commuter cyclists.
Key recommendations
1 Genuinely safe and attractive school cycle networks should be implemented or given higher
priority. These should be characterised by the identification and promotion of quiet residential
streets, short-cuts, pathways and reserves and the engineering of safe and attractive routes
through or across arterial ‘trouble spots’ nearer to the school. Shared pathways and slow speed
zones may have significant roles at these locations. Promotional activities should accompany
school cycle networks. Such networks may sometimes be feasible within typical school travel plan
budgets, although there is a risk that current funding levels do not deliver genuinely attractive or
safe environments for cycling to school.
2 Cycle training, secure bike storage and more slow speed environments should also be given
priority. It is encouraging that slow zones around schools, and more recently cycle training, are
becoming established in New Zealand. In some countries 30km/h speed limits are routinely used
where vulnerable road users are expected. There would be considerable safety and travel
behaviour benefits by adopting lower speed limits at appropriate locations in New Zealand. In the
United Kingdom, ‘BikeIt’ (cycling culture development) officers in schools have been very
successful and may be a useful initiative for New Zealand. Cycle trains may also provide an
encouraging step towards independent cycling in some circumstances.
3 By more carefully considering the benefits that cycling to school (and active transport in
general) delivers, higher priority should be given to school active transport projects and in
particular school cycle network projects. This would help to ‘future proof’ New Zealand’s
transport system and improve social and environmental well-being. Countries that have had
traditionally low levels of cycling such as the United Kingdom, have realised this and are taking
active steps to facilitate cycling, including cycling to school. There is increasing evidence that
‘I want to ride my bike’: overcoming barriers to cycling to intermediate schools
10
cycling infrastructure is cost effective when the wider benefits are considered and especially when
the infrastructure involves the use of existing road corridors.
Conclusion
In New Zealand, cycling to school could have a role in fighting obesity, reducing transport emissions,
alleviating traffic congestion and contributing to more cohesive communities. Unfortunately, the
current form of New Zealand’s transport system, and corresponding parental concerns, are major
barriers despite recent and commendable efforts by school travel coordinators. In order to overcome
barriers to cycling to school, a number of initiatives have been recommended, with an emphasis on the
development of school cycle networks. In addition to giving higher priority to active transport, and in
particular, school cycling projects, greater leadership is needed within the wider area of school
transport. Only then will New Zealand start to realise the benefits that cycling to school has to offer.
Abstract
Transport modes such as walking and cycling, including cycling to school, could play a key role in
combating obesity, climate change and traffic congestion as well as restoring ‘social capital’ within
communities. The objective of this research was to identify the specific barriers to school students
cycling to school for six intermediate schools and recommend interventions that would be effective,
acceptable to parents and schools, and favourable to school students for each of the schools. These
specific barriers and solutions were then used to identify common themes, issues and solutions that
might be considered at a national level, and give more confidence to those who are responsible for
considering and acting on school cycling initiatives. Four stages of data collection were carried out
including the collection of existing school travel information, site visits, interviews, focus groups and
questionnaires. In order to overcome barriers to cycling to school it is proposed that the development
of genuinely safe and attractive school cycle networks, cycle training, effective bike storage and the
continued implementation of slow zones around schools (or widespread lower speed limits) be
implemented or given higher priority.
1 Introduction
11
1 Introduction
Cycling to school in New Zealand used to be common practice. As late as the end of the 1980s it was
common to see the bike racks of primary, intermediate and high schools filled with bikes. In Auckland,
between 1978 and 1980, approximately 20% of all intermediate school students cycled to school
(Auckland Regional Authority 1980) and at some schools the proportion of cyclists was even greater. At
Weymouth, Northcote, Papatoetoe, Mount Roskill and Greenmeadow Intermediates, ridership was
between 45 and 70% of the school roll. Today, there is still the odd school that has a culture of
commuter cycling. Approximately 22% of all students at Belmont Intermediate School on the North
Shore of Auckland regularly cycle to school. Broadgreen Intermediate School in Nelson is situated next
to a cycle way that has been formed from an old rail corridor and a huge 60–70% of students regularly
cycle to school on a good day, and closer to 50% on days of poor weather. Unfortunately, these
examples tend to be the exception rather than the norm.
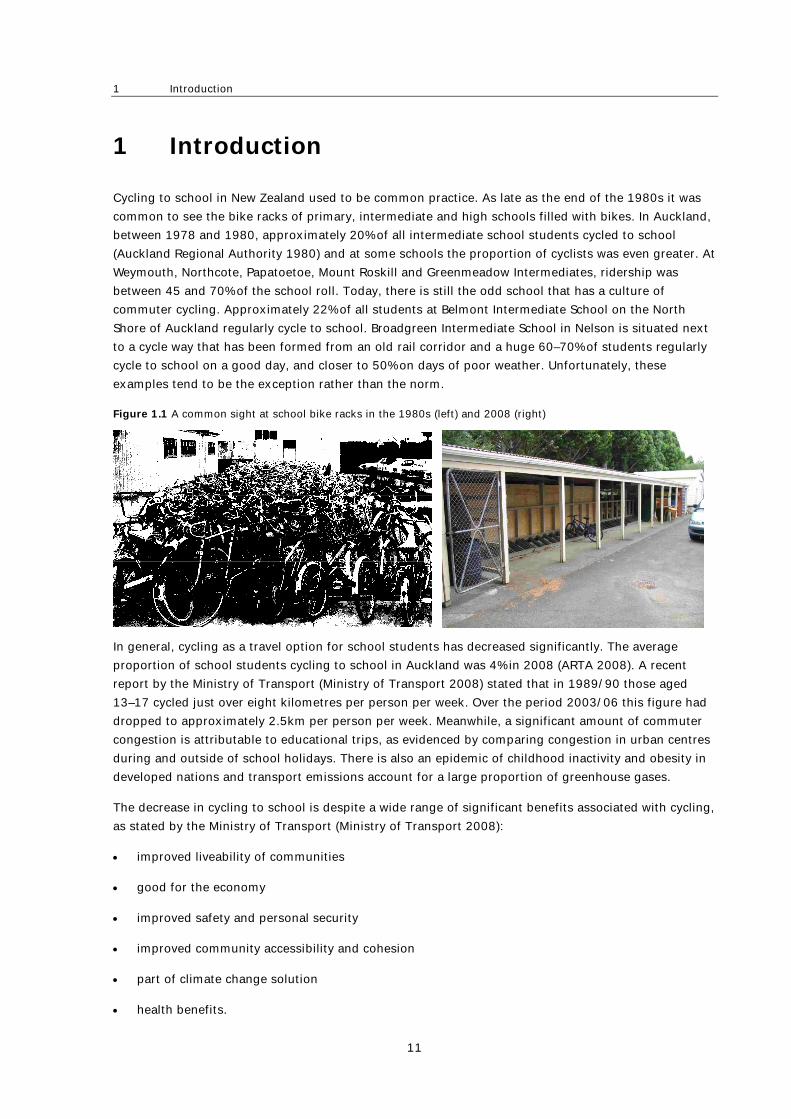
Figure 1.1 A common sight at school bike racks in the 1980s (left) and 2008 (right)
In general, cycling as a travel option for school students has decreased significantly. The average
proportion of school students cycling to school in Auckland was 4% in 2008 (ARTA 2008). A recent
report by the Ministry of Transport (Ministry of Transport 2008) stated that in 1989/90 those aged
13–17 cycled just over eight kilometres per person per week. Over the period 2003/06 this figure had
dropped to approximately 2.5km per person per week. Meanwhile, a significant amount of commuter
congestion is attributable to educational trips, as evidenced by comparing congestion in urban centres
during and outside of school holidays. There is also an epidemic of childhood inactivity and obesity in
developed nations and transport emissions account for a large proportion of greenhouse gases.
The decrease in cycling to school is despite a wide range of significant benefits associated with cycling,
as stated by the Ministry of Transport (Ministry of Transport 2008):
improved liveability of communities
good for the economy
improved safety and personal security
improved community accessibility and cohesion
part of climate change solution
health benefits.
‘I want to ride my bike’: overcoming barriers to cycling to intermediate schools
12
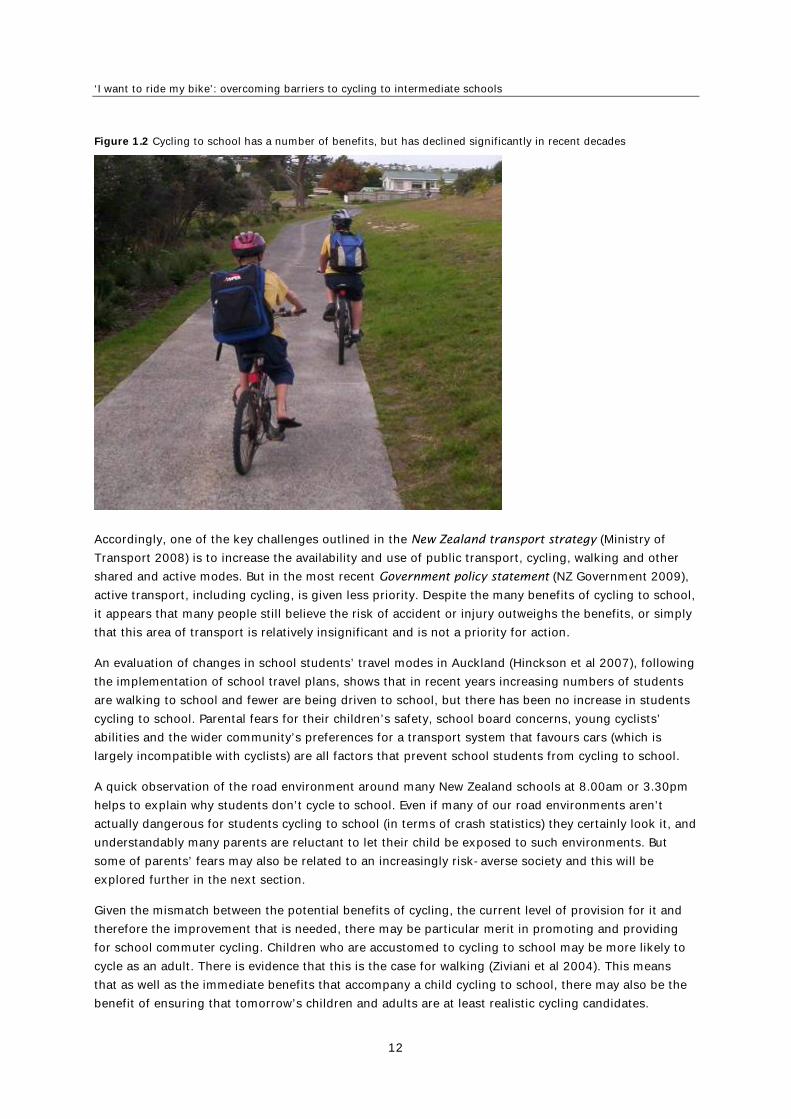
Figure 1.2 Cycling to school has a number of benefits, but has declined significantly in recent decades
Accordingly, one of the key challenges outlined in the New Zealand transport strategy (Ministry of
Transport 2008) is to increase the availability and use of public transport, cycling, walking and other
shared and active modes. But in the most recent Government policy statement (NZ Government 2009),
active transport, including cycling, is given less priority. Despite the many benefits of cycling to school,
it appears that many people still believe the risk of accident or injury outweighs the benefits, or simply
that this area of transport is relatively insignificant and is not a priority for action.
An evaluation of changes in school students’ travel modes in Auckland (Hinckson et al 2007), following
the implementation of school travel plans, shows that in recent years increasing numbers of students
are walking to school and fewer are being driven to school, but there has been no increase in students
cycling to school. Parental fears for their children’s safety, school board concerns, young cyclists’
abilities and the wider community’s preferences for a transport system that favours cars (which is
largely incompatible with cyclists) are all factors that prevent school students from cycling to school.
A quick observation of the road environment around many New Zealand schools at 8.00am or 3.30pm
helps to explain why students don’t cycle to school. Even if many of our road environments aren’t
actually dangerous for students cycling to school (in terms of crash statistics) they certainly look it, and
understandably many parents are reluctant to let their child be exposed to such environments. But
some of parents’ fears may also be related to an increasingly risk-averse society and this will be
explored further in the next section.
Given the mismatch between the potential benefits of cycling, the current level of provision for it and
therefore the improvement that is needed, there may be particular merit in promoting and providing
for school commuter cycling. Children who are accustomed to cycling to school may be more likely to
cycle as an adult. There is evidence that this is the case for walking (Ziviani et al 2004). This means
that as well as the immediate benefits that accompany a child cycling to school, there may also be the
benefit of ensuring that tomorrow’s children and adults are at least realistic cycling candidates.
1 Introduction
13
Unfortunately the reverse may also be true. A generation of children who have no experience of cycling
to school may be less likely to cycle to work or promote cycling to their children later in life. Schools
also tend to be focal points for communities. Cycling facilities directed towards the needs of school
students may have much wider benefits as other members of the community can also use these
facilities. Furthermore, school cycling facilities are likely to be compatible with beginner adult cyclists,
who may be the source of future cycling growth.
Another strategic focus might be the final years of primary school and intermediate school (years 7 and
8) students. This is an age that most parents and teachers agree is appropriate for starting to cycle to
school. It is also an age when students are naturally very keen to cycle to school and have not yet been
influenced by the prospect of driving or getting their driver licence. Perhaps if environments for cyclists
improved and cycling once again became a commonly used mode for intermediate school students,
then a significant proportion of them might persist into high school years and into adulthood as
mentioned earlier.
It is important to recognise that there are different types of cyclists. Many adult commuters and sport
cyclists prefer to be within a traffic lane or on-road cycle lane and these cyclists probably prefer lower
traffic speeds and more courteous driver behaviour as cycling facilitators. Younger school students are
different and they may prefer (or may only be permitted) to ride on the footpath or another separated
facility when they must use busier road corridors. They may also prefer to use short-cuts through
parks and reserves, away from motorised traffic. In an ideal world this avoidance of road cycling may
not be necessary, but in reality it may be that the combined concerns of parents and the mismatch
between the capabilities of younger cyclists and New Zealand’s traffic environments require younger
cyclists to be separated from busier traffic environments. Besides, even in cycling friendly
environments in Europe, separation between cyclists and motorists is common practice on busier
routes.
This report has two main components. First, further evidence for the barriers that prevent students
cycling to and from school (termed ‘cycling to school’ throughout this report) is given in order to
emphasise the problem that exists and to provide a rationale for possible solutions. Second,
recommendations for how the barriers might be overcome are set out to aid those who have a
responsibility to improve transport to school. In the next section, a review of literature will provide a
rationale for the report’s objectives.
‘I want to ride my bike’: overcoming barriers to cycling to intermediate schools
14
2 Review of literature
Attempting to identify and overcome the barriers to cycling in New Zealand is not a new concept. In
1980, the Auckland Regional Authority (ARA) completed a report titled Cycling in Auckland (Auckland
Regional Authority 1980), fuelled partly by an increase in cycling popularity following the oil price
shocks of the 1970s. This comprehensive report outlined issues that cyclists faced (in the 1970s) and
proposed a number of general and specific recommendations ranging from promotion to specific
cycleways in parts of the city. The sudden increase in cycling at this time was at odds with a road
network that predominantly catered for the increasing numbers of cars in the 1950s and 1960s. The
report included the findings of a survey, conducted by Auckland University, which provided a great deal
of information regarding cycling in Auckland at that time.
An example of earlier proposals for walking and cycling networks was the Greenprint plan (mooted in
the mid-1970s in Auckland) where existing reserves and open spaces were to be linked together to
form a network of walkways and cycleways. In 1980 ‘greenways’ were proposed for west Auckland to
complement a system of electrified rail and bus routes, in order to provide a transport system less
dependent on the private car. This proposal was favourably received by the Regional Planning
Committee of the ARA. But obviously these proposals were not implemented as no such facilities exist
in Auckland 29 years later, apart from the cycleway that follows the northwestern motorway. The issues
and suggestions in the ARA report are strikingly similar to those commonly raised and suggested
today. Clearly there has been little political will to progress cycling as a transport mode (in Auckland at
least) and subsequently there has been little provision for this mode over the last three decades. It is
acknowledged that this lack of progress is not consistent throughout New Zealand. For example,
Nelson and Christchurch have been proactive in providing for cyclists and this is evident in the cycling
friendly infrastructure and culture that exists today.
However, the potential of cycling throughout New Zealand is still seen by some, and there has been a
significant amount of research, policy and guidance information in New Zealand and overseas related
to cycling in general, usually with a focus on sport, and experienced commuter or adult cyclists. There
is also an increasing recognition that there are different types of cyclists and they often have very
different requirements. In New Zealand, the course (and guidelines) for transport professionals
Fundamentals of planning and design for cycling (Wilke 2008) and the Cycle network and route
planning guide (LTSA 2004) have helped to raise awareness of the different types and needs of cyclists.
Because there is a very wide range of cycling literature topics, and the requirements of adult commuter
cyclists and young school commuter cyclists are often very different, this review will focus mainly on
school cycling literature and research that has direct relevance to cycling to school. A problem is that
research and other strategic documentation that relate specifically to cycling to school are very limited.
For example, the national walking and cycling strategy Getting there – on foot, by cycle (Ministry of
Transport 2005) mentions cycling to school but does not give specific importance to it. Furthermore,
the lack of guidance and leadership in this area, and subsequent lack of action, may be one of the
reasons for the low numbers of children cycling to school today.
School cycling initiatives will also be covered by the review of literature. Although much of this is not
research, current cycling initiatives are a measure of the current commitment to cycling to school.
Through the implementation of these initiatives, much can also be learned about the opportunities and
challenges that exist for school commuter cycling.
2 Review of literature
15
Lastly, the review of literature includes research that addresses the wider area of active transport and
the associated health and community benefits. School cycling is usually included as a component of
active transport in general.
2.1 School cycling-related research
A survey of 2355 school students on the North Shore of Auckland (Horspool 2006) is currently
New Zealand’s most comprehensive examination of the barriers to cycling to school faced by school
students. The purpose of the report was to understand how teenagers perceived cycling, including the
barriers faced by those considering cycling to school, the health benefits of cycling, environmental
benefits, the change in attitude towards cycling in the transition from intermediate to secondary school
and safety issues relating to cycling. The key findings of the survey were:
75% of year 8, 9 and 10 students on the North Shore owned bikes
9% of year 8 and 3% of year 9 and 10 students regularly cycled to school
boys were seven times more likely to cycle to school than girls
33% of year 8, 16% of year 9 and 11% of year 10 students would prefer to cycle to school
40% of students lived between 1 and 3km from the school gate, a suitable distance for cycling to
school
safe crossings, safe routes and the need for on-road cycle lanes were cited as the most important
barriers to cycling to school
secure, covered bike sheds would entice more students to cycle to school
more than half of the students indicated that having friends to ride to school with was important
more than 60% of those who regularly rode to school rode on the footpath
32% of year 8, 9 and 10 students reported doing less than three hours of exercise per week
cycle skills training was also shown to be very important for potential riders.
A key message from this report is that there is significantly more demand for cycling to school than
‘supply’ of cycling infrastructure and initiatives. Based on these findings, one would expect that if
suitable cycling existed, then it would be likely that many more students would actually cycle to and
from school.
The demand for cycling to school is also highlighted by O’Fallon (2007) who evaluated a trial for school
cycle trains. Earlier work found that 87 out of 184 families who responded to a survey would allow
their children to cycle to school in a group with another adult supervising their ride. This interest,
along with the implementation of cycle trains for school students in other countries, lead to a trial and
evaluation of cycle trains at six Nelson schools in 2006. The trial cycle trains were a success and the
author points out that they provide an important developmental stage before independent cycling.
However, fears for their child’s safety have led many parents not to allow their children to bike to
school. Although there is an increased risk of injury or death when cycling to school compared with
other modes on a per trip basis (Badland et al 2008) the risk is still small and New Zealanders in the
‘I want to ride my bike’: overcoming barriers to cycling to intermediate schools
16
10–14-year age range are more likely to drown than be killed in a cycling accident (Injury Prevention
Research Unit 2007). Furthermore, and in support of the cycle train concept, Turner et al (2006) found
that a ‘safety in numbers’ effect is observed for cycle accidents at traffic signals, roundabouts and
mid-block sites and that an increase in cycle numbers is likely to lead to a reduction in cycle accidents
per kilometre travelled. This finding was also reflected within previous modelling studies of cyclist and
pedestrian accident rates that have been conducted (Brude and Larsson 1993; Jacobsen 2003). The
health benefits of cycling have also been shown to far outweigh the accident risks of cycling (British
Medical Association 1992) and correspondingly it has been suggested that cycling should be
promoted, with an associated focus on safety.
Nevertheless, road safety for vulnerable road users such as students walking or cycling to school
remains a concern. Wigmore et al (2007) proposed a selection of engineering devices that would create
safer environments and assist in the promotion of active transport by school students. Their research
also concluded that no one ‘quick fix’ could be applied, engineering devices needed to be
individualised to specific environments, the addition of complementary devices and detail could
enhance safety gains, and the difference between urban and rural environments needed to be
recognised. The authors also reiterated the Austroads (1999) guidelines for cyclists which suggested
that appropriate cycling facilities for primary school students included off-road paths and quiet
residential streets.
2.2 School cycling initiatives and policy
In the United Kingdom, sustainable transport charity, Sustrans, has been promoting cycling since 1977,
but has increased its activity substantially in recent years. Bike It (Sustrans 2009) is a recent yet very
successful initiative that works with schools wanting to increase their levels of cycling. The main aim of
Bike It is to create a pro-cycling culture that lasts beyond the intervention of Bike It officers. Bike It
officers work with schools by explaining the benefits of cycling, contributing to classroom work,
addressing concerns about safety and liability with the help of the local authority and other partners,
sharing good practice with school management teams, organising practical cycling activities and
generating positive publicity. Prior to Bike It interventions, approximately 2–3% of students cycled to
school every day. Following Bike It interventions, this number of students has typically risen to
approximately 10%. Additionally, the number of students who bike to school at least once per week has
increased from 10% to 27% at Bike It schools.
Sustrans also run a programme called ‘Links to Schools’ which is funded by the Department for
Transport (Department for Transport 2006). The Sustrans Links to Schools project connects schools
and their communities to the National Cycle Network and projects come in a variety of forms, from new
cycle routes to pedestrian crossings, all providing the safe routes that young people need to cycle and
walk to school. There are many elements of this programme that might have relevance for improved
cycling routes to school for New Zealand students.
Evidence for the commitment to cycling within the United Kingdom, including cycling to school, is
given by the Department for Transport’s A sustainable future for cycling. (2008). Increased
government funding for cycling, agencies working together to implement programmes (eg Department
for Transport and Sustrans) and a commitment to implement and monitor infrastructure (such as the
National Cycle Network, Links to Schools and cycling demonstration towns) shows that cycling is being
taken seriously in the United Kingdom. There is also a clear message that cycling is part of the British
government’s sustainability strategy. The establishment of Cycling England by the Department for
2 Review of literature
17
Transport is further evidence of this. Cycling England was established in 2005 and is an independent,
expert body working to promote cycling with the ultimate goal of increasing the number of people
safely cycling as a legitimate mode of transport within the United KIngdom. Cycling England promotes
the growth of cycling in England by championing best practice and channelling funding to partners
engaged in training, engineering and marketing projects. Cycling to school is a key part of the work of
Cycling England as the Bike It programme is run by their partner Sustrans (as explained earlier).
The Cycling England initiative in the United KIngdom would be the equivalent of the NZ Transport
Agency (NZTA) setting up and funding a dedicated organisation to develop cycling in New Zealand.
Currently in New Zealand, school travel coordinators funded by local authorities are responsible for the
development of cycling facilities in conjunction with schools, usually as part of school travel plans. In
principle, school travel plans should assist with promoting cycling but as mentioned earlier, Hinckson
et al (2007) found there had been little uptake in cycling within the Auckland region since the start of
school travel plan implementation. This is understandable given that there has been much more focus
on walking school buses and travel initiatives other than cycling. In part, this has been a result of
reluctance by local authorities to promote cycling to school due to safety concerns.
In other parts of New Zealand excellent cycle training has been in place for some time. The
Christchurch City Council cycle training programme ‘Cycle Safe’ is considered one of the best in
New Zealand. The Cycle Safe programme is for year 6 pupils and most Christchurch schools offer it as
part of the school curriculum. Working through five modules, children learn everything from properly
fitting their helmet to navigating intersections safely, to learning the road code and maintaining their
bike. The final module is the road riding test. If they pass, children are given the go ahead to ride on
the road. Another excellent cycle training programme ‘Kids Can Ride’ in Tauranga has an emphasis on
riding on the road as a legitimate road user.
The NZTA has now released a document called Cyclist skills training: A guide for the set-up and
delivery of cyclist training in New Zealand (NZTA 2008). The guide outlines:
the guidelines for a consistent approach to the delivery of cyclist training in New Zealand
the cyclist skill sets to be achieved in order to attain each level.
Although the guidelines are not specifically for cycling to school, there is recognition that this is where
most cycle training will occur.
A number of other cycling initiatives have been established around New Zealand. For example, in
Auckland, the Bike Buddies programme involves pairing up a current cyclist with a friend who is
interested in cycling to school. Before the buddies begin cycling together, both need to demonstrate
that they are equipped for safe cycling.
As mentioned earlier, 60–70% of students at Broadgreen Intermediate School in Nelson cycle to school
on a good day. The school is an example of what can be achieved when every opportunity is given to
students who might cycle to school. The school actively promotes cycling – all classes receive a module
on cycling in the first term. All bikes must pass a warrant of fitness and lunch-time activities include
cycle skills courses. The school has been very involved in Bikewise promotions run by Nelson City
Council. Bikes are securely stored with a lock-up bike cage. It is also school policy that students must
use the off-road cycle path (old railway reserve) to the rear of the school to avoid the busy road
frontage at 3pm, as the school is neighboured by a college, primary school, kindergarten and
‘I want to ride my bike’: overcoming barriers to cycling to intermediate schools
18
swimming pool. The cycle path is very well used. Students living up to five kilometres away commonly
cycle to school using the cycleway.
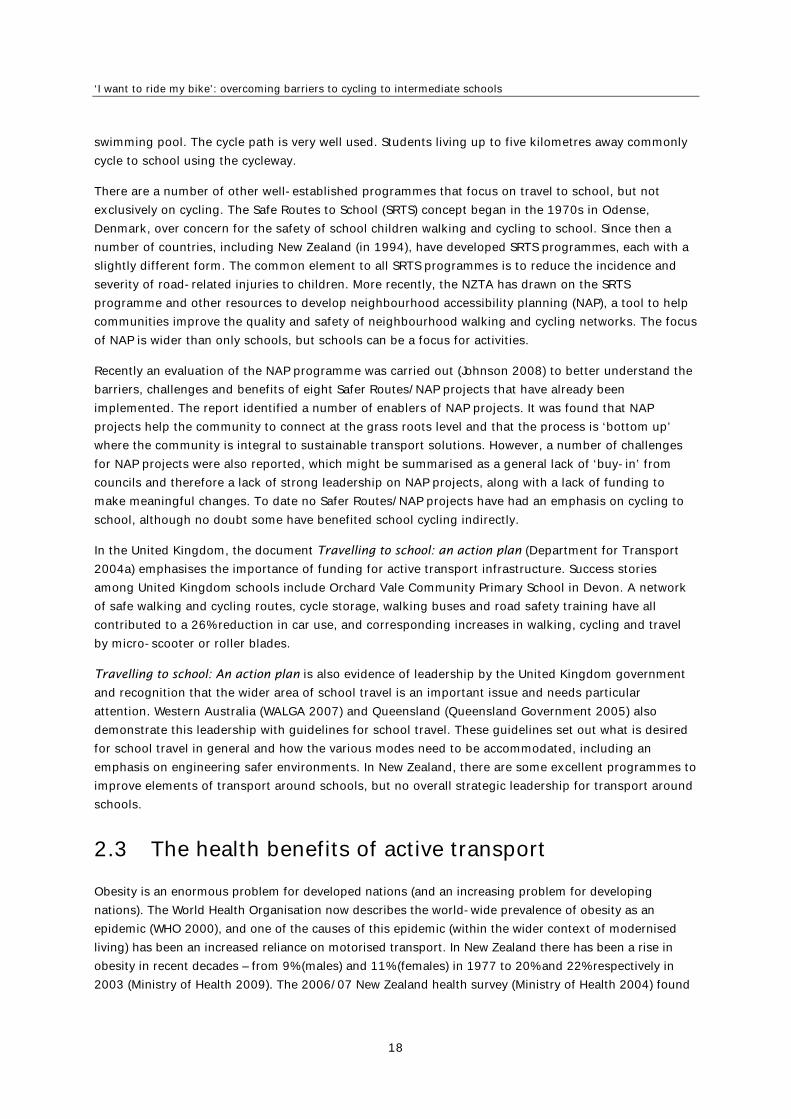
There are a number of other well-established programmes that focus on travel to school, but not
exclusively on cycling. The Safe Routes to School (SRTS) concept began in the 1970s in Odense,
Denmark, over concern for the safety of school children walking and cycling to school. Since then a
number of countries, including New Zealand (in 1994), have developed SRTS programmes, each with a
slightly different form. The common element to all SRTS programmes is to reduce the incidence and
severity of road-related injuries to children. More recently, the NZTA has drawn on the SRTS
programme and other resources to develop neighbourhood accessibility planning (NAP), a tool to help
communities improve the quality and safety of neighbourhood walking and cycling networks. The focus
of NAP is wider than only schools, but schools can be a focus for activities.
Recently an evaluation of the NAP programme was carried out (Johnson 2008) to better understand the
barriers, challenges and benefits of eight Safer Routes/NAP projects that have already been
implemented. The report identified a number of enablers of NAP projects. It was found that NAP
projects help the community to connect at the grass roots level and that the process is ‘bottom up’
where the community is integral to sustainable transport solutions. However, a number of challenges
for NAP projects were also reported, which might be summarised as a general lack of ‘buy-in’ from
councils and therefore a lack of strong leadership on NAP projects, along with a lack of funding to
make meaningful changes. To date no Safer Routes/NAP projects have had an emphasis on cycling to
school, although no doubt some have benefited school cycling indirectly.
In the United Kingdom, the document Travelling to school: an action plan (Department for Transport
2004a) emphasises the importance of funding for active transport infrastructure. Success stories
among United Kingdom schools include Orchard Vale Community Primary School in Devon. A network
of safe walking and cycling routes, cycle storage, walking buses and road safety training have all
contributed to a 26% reduction in car use, and corresponding increases in walking, cycling and travel
by micro-scooter or roller blades.
Travelling to school: An action plan is also evidence of leadership by the United Kingdom government
and recognition that the wider area of school travel is an important issue and needs particular
attention. Western Australia (WALGA 2007) and Queensland (Queensland Government 2005) also
demonstrate this leadership with guidelines for school travel. These guidelines set out what is desired
for school travel in general and how the various modes need to be accommodated, including an
emphasis on engineering safer environments. In New Zealand, there are some excellent programmes to
improve elements of transport around schools, but no overall strategic leadership for transport around
schools.
2.3 The health benefits of active transport
Obesity is an enormous problem for developed nations (and an increasing problem for developing
nations). The World Health Organisation now describes the world-wide prevalence of obesity as an
epidemic (WHO 2000), and one of the causes of this epidemic (within the wider context of modernised
living) has been an increased reliance on motorised transport. In New Zealand there has been a rise in
obesity in recent decades – from 9% (males) and 11% (females) in 1977 to 20% and 22% respectively in
2003 (Ministry of Health 2009). The 2006/07 New Zealand health survey (Ministry of Health 2004) found
2 Review of literature
19
that more than one in three adults were overweight (36.3%) and more than one in four obese (26.5%). One
in five children aged two to 14 years was overweight (20.9%) and one in 12 was obese (8.3%).
In the United Kingdom, the seriousness of obesity has prompted the Government Office for Science to
commission a report which reviews the scientific evidence for the mechanisms of obesity and provides
a framework for long-term intervention (Foresight 2007). Only projects that address issues of
significant national importance are carried out by Foresight. Within the conclusions, the magnitude of
the obesity problem is highlighted by the following statement:
... The rate of increase in overweight and obesity, in children and adults, is striking.
Obesity threatens the health and well-being of individuals and will place an intolerable
burden on the Exchequer in terms of health costs, on employers through lost productivity
and on families because of the increasing burden of long-term chronic disability.
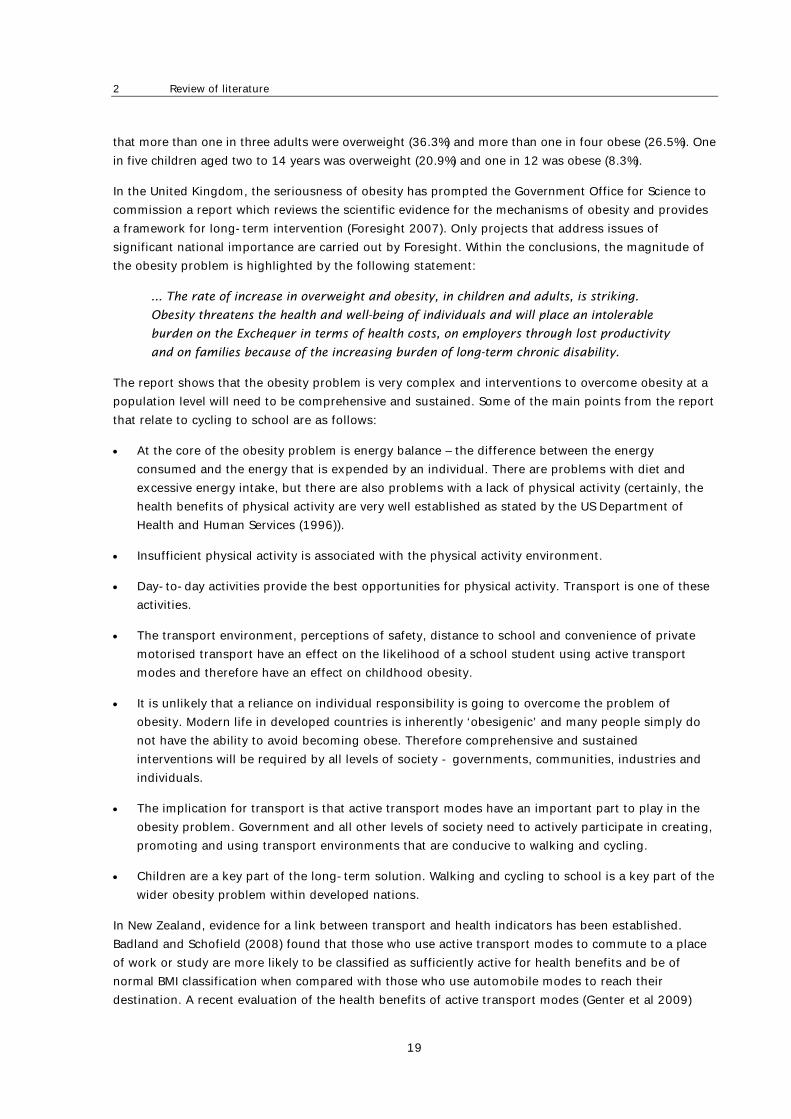
The report shows that the obesity problem is very complex and interventions to overcome obesity at a
population level will need to be comprehensive and sustained. Some of the main points from the report
that relate to cycling to school are as follows:
At the core of the obesity problem is energy balance – the difference between the energy
consumed and the energy that is expended by an individual. There are problems with diet and
excessive energy intake, but there are also problems with a lack of physical activity (certainly, the
health benefits of physical activity are very well established as stated by the US Department of
Health and Human Services (1996)).
Insufficient physical activity is associated with the physical activity environment.
Day-to-day activities provide the best opportunities for physical activity. Transport is one of these
activities.
The transport environment, perceptions of safety, distance to school and convenience of private
motorised transport have an effect on the likelihood of a school student using active transport
modes and therefore have an effect on childhood obesity.
It is unlikely that a reliance on individual responsibility is going to overcome the problem of
obesity. Modern life in developed countries is inherently ‘obesigenic’ and many people simply do
not have the ability to avoid becoming obese. Therefore comprehensive and sustained
interventions will be required by all levels of society - governments, communities, industries and
individuals.
The implication for transport is that active transport modes have an important part to play in the
obesity problem. Government and all other levels of society need to actively participate in creating,
promoting and using transport environments that are conducive to walking and cycling.
Children are a key part of the long-term solution. Walking and cycling to school is a key part of the
wider obesity problem within developed nations.
In New Zealand, evidence for a link between transport and health indicators has been established.
Badland and Schofield (2008) found that those who use active transport modes to commute to a place
of work or study are more likely to be classified as sufficiently active for health benefits and be of
normal BMI classification when compared with those who use automobile modes to reach their
destination. A recent evaluation of the health benefits of active transport modes (Genter et al 2009)
‘I want to ride my bike’: overcoming barriers to cycling to intermediate schools
20
based on overseas literature included updated per km health benefits for cycling. Low and high figures
of $1.77 and $2.51 per km were given for cycling. Subsequently the updated version of the NZTA
Economic evaluation manual (EEM) assigned health benefits of new cycling facilities at $1.30 per km
for new cyclists. This represents a significant increase on the previous (2005 version of the EEM) figure
of 16c per km for existing and new cyclists, and will help to present more favourable economic cases
for cycling projects. Within their review of studies that have evaluated the health benefits of active
transport, Genter et al (2008) found that many of the health outcomes associated with being physically
active were more pronounced in those who engaged in active transport when compared with those who
participated only in leisure-time physical activity (Andersen et al 2000; Hayashi et al 1999; Hou et al
2004; Hu et al 2001; Hu et al 2002; Wagner et al 2001).
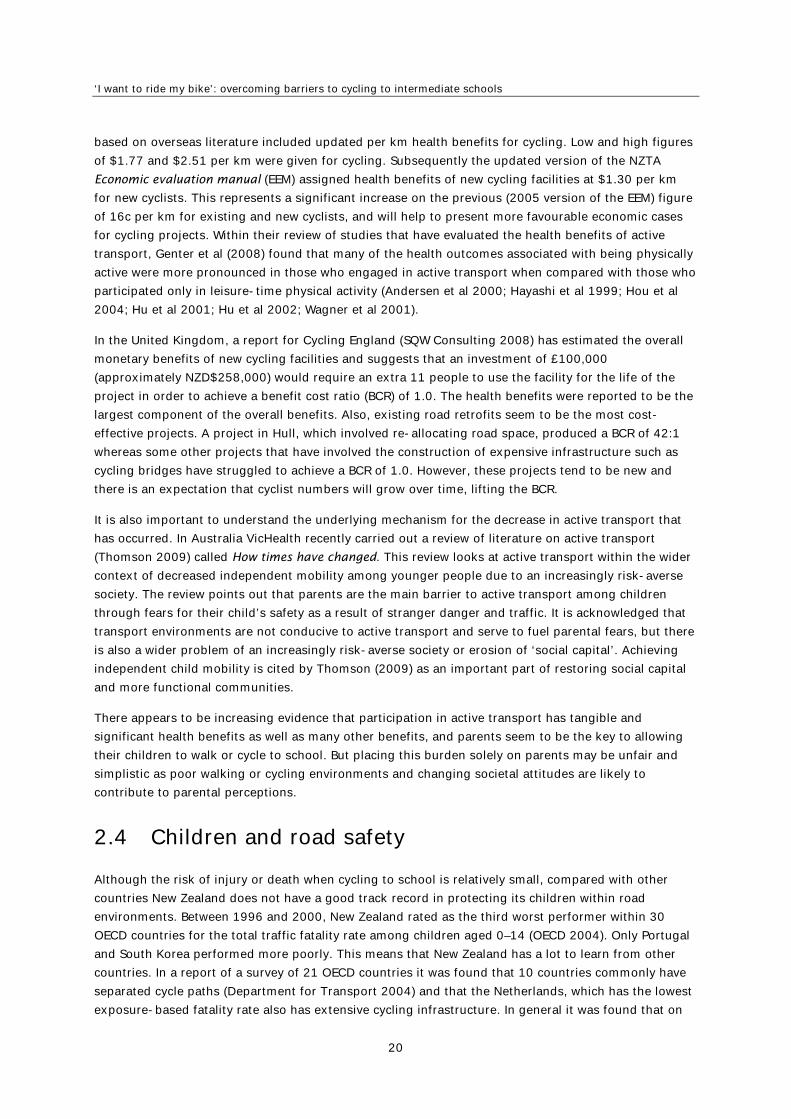
In the United Kingdom, a report for Cycling England (SQW Consulting 2008) has estimated the overall
monetary benefits of new cycling facilities and suggests that an investment of £100,000
(approximately NZD$258,000) would require an extra 11 people to use the facility for the life of the
project in order to achieve a benefit cost ratio (BCR) of 1.0. The health benefits were reported to be the
largest component of the overall benefits. Also, existing road retrofits seem to be the most cost-
effective projects. A project in Hull, which involved re-allocating road space, produced a BCR of 42:1
whereas some other projects that have involved the construction of expensive infrastructure such as
cycling bridges have struggled to achieve a BCR of 1.0. However, these projects tend to be new and
there is an expectation that cyclist numbers will grow over time, lifting the BCR.
It is also important to understand the underlying mechanism for the decrease in active transport that
has occurred. In Australia VicHealth recently carried out a review of literature on active transport
(Thomson 2009) called How times have changed. This review looks at active transport within the wider
context of decreased independent mobility among younger people due to an increasingly risk-averse
society. The review points out that parents are the main barrier to active transport among children
through fears for their child’s safety as a result of stranger danger and traffic. It is acknowledged that
transport environments are not conducive to active transport and serve to fuel parental fears, but there
is also a wider problem of an increasingly risk-averse society or erosion of ‘social capital’. Achieving
independent child mobility is cited by Thomson (2009) as an important part of restoring social capital
and more functional communities.
There appears to be increasing evidence that participation in active transport has tangible and
significant health benefits as well as many other benefits, and parents seem to be the key to allowing
their children to walk or cycle to school. But placing this burden solely on parents may be unfair and
simplistic as poor walking or cycling environments and changing societal attitudes are likely to
contribute to parental perceptions.
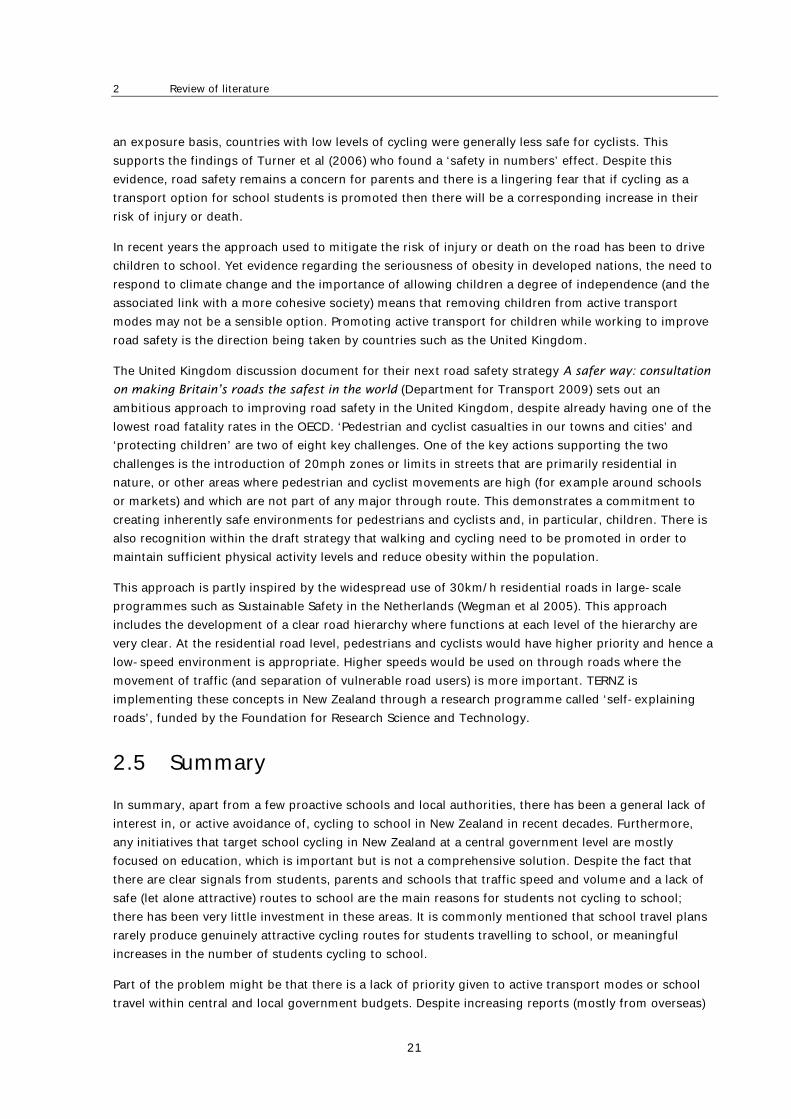
2.4 Children and road safety
Although the risk of injury or death when cycling to school is relatively small, compared with other
countries New Zealand does not have a good track record in protecting its children within road
environments. Between 1996 and 2000, New Zealand rated as the third worst performer within 30
OECD countries for the total traffic fatality rate among children aged 0–14 (OECD 2004). Only Portugal
and South Korea performed more poorly. This means that New Zealand has a lot to learn from other
countries. In a report of a survey of 21 OECD countries it was found that 10 countries commonly have
separated cycle paths (Department for Transport 2004) and that the Netherlands, which has the lowest
exposure-based fatality rate also has extensive cycling infrastructure. In general it was found that on
2 Review of literature
21
an exposure basis, countries with low levels of cycling were generally less safe for cyclists. This
supports the findings of Turner et al (2006) who found a ‘safety in numbers’ effect. Despite this
evidence, road safety remains a concern for parents and there is a lingering fear that if cycling as a
transport option for school students is promoted then there will be a corresponding increase in their
risk of injury or death.
In recent years the approach used to mitigate the risk of injury or death on the road has been to drive
children to school. Yet evidence regarding the seriousness of obesity in developed nations, the need to
respond to climate change and the importance of allowing children a degree of independence (and the
associated link with a more cohesive society) means that removing children from active transport
modes may not be a sensible option. Promoting active transport for children while working to improve
road safety is the direction being taken by countries such as the United Kingdom.
The United Kingdom discussion document for their next road safety strategy A safer way: consultation
on making Britain’s roads the safest in the world (Department for Transport 2009) sets out an
ambitious approach to improving road safety in the United Kingdom, despite already having one of the
lowest road fatality rates in the OECD. ‘Pedestrian and cyclist casualties in our towns and cities’ and
‘protecting children’ are two of eight key challenges. One of the key actions supporting the two
challenges is the introduction of 20mph zones or limits in streets that are primarily residential in
nature, or other areas where pedestrian and cyclist movements are high (for example around schools
or markets) and which are not part of any major through route. This demonstrates a commitment to
creating inherently safe environments for pedestrians and cyclists and, in particular, children. There is
also recognition within the draft strategy that walking and cycling need to be promoted in order to
maintain sufficient physical activity levels and reduce obesity within the population.
This approach is partly inspired by the widespread use of 30km/h residential roads in large-scale
programmes such as Sustainable Safety in the Netherlands (Wegman et al 2005). This approach
includes the development of a clear road hierarchy where functions at each level of the hierarchy are
very clear. At the residential road level, pedestrians and cyclists would have higher priority and hence a
low-speed environment is appropriate. Higher speeds would be used on through roads where the
movement of traffic (and separation of vulnerable road users) is more important. TERNZ is
implementing these concepts in New Zealand through a research programme called ‘self-explaining
roads’, funded by the Foundation for Research Science and Technology.
2.5 Summary
In summary, apart from a few proactive schools and local authorities, there has been a general lack of
interest in, or active avoidance of, cycling to school in New Zealand in recent decades. Furthermore,
any initiatives that target school cycling in New Zealand at a central government level are mostly
focused on education, which is important but is not a comprehensive solution. Despite the fact that
there are clear signals from students, parents and schools that traffic speed and volume and a lack of
safe (let alone attractive) routes to school are the main reasons for students not cycling to school;
there has been very little investment in these areas. It is commonly mentioned that school travel plans
rarely produce genuinely attractive cycling routes for students travelling to school, or meaningful
increases in the number of students cycling to school.
Part of the problem might be that there is a lack of priority given to active transport modes or school
travel within central and local government budgets. Despite increasing reports (mostly from overseas)
‘I want to ride my bike’: overcoming barriers to cycling to intermediate schools
22
of a comprehensive range of significant benefits associated with walking and cycling, particularly
within urban areas, investment in walking and cycling initiatives in New Zealand remain at
approximately 0.6% of the total central government transport budget (NZ Government 2009). All too
often, walking and cycling projects are left to enthusiastic and highly committed travel coordinators
within local authorities with a minimal budget and without significant support from more senior
management or elected councils.
Meanwhile, there is a clear desire from students to be able to cycle to school safely and easily.
However, the barriers preventing students from cycling to school need to be understood very well at
local and national levels, and targeted, well-considered solutions will need to be developed in order to
remove the barriers. The literature suggests that a number of approaches are needed to address this,
but within New Zealand the right approach for increasing the numbers of students cycling to school is
still not clear.
The objective of this research was to identify the specific barriers to students cycling to school for six
intermediate schools and recommend interventions that would be effective, acceptable to parents and
schools and favourable to students for each of the six schools. These specific barriers and solutions
were then used to identify common themes, issues and solutions that might be considered at a
national level. This research built on existing school travel planning techniques and the research
carried out by Horspool (2006) in order to take a much closer look at what might be done to increase
the numbers of students cycling to and from school and give more confidence to those who are
responsible for implementing school cycling initiatives.
3 Research approach
23
3 Research approach
Six urban schools participated in the research:
Avondale Intermediate (Auckland)
Wesley Intermediate (Auckland)
Kowhai Intermediate (Auckland)
Devon Intermediate (New Plymouth)
Tauranga Intermediate (Bay of Plenty)
Mount Maunganui Intermediate (Bay of Plenty)
Intermediate schools were chosen as this period represents a time of transition and increasing
independence, when cycling is likely to become a viable transport option for students. The schools
represented a range of socioeconomic levels (more details for each school can be found in
Appendix A). Three Auckland schools were deliberately chosen as it was felt that other cities such as
Christchurch and Nelson had made good progress with cycling to school whereas Auckland had made
less progress and might need particular attention. The three Auckland schools were chosen for their
commitment to the school travel planning process and/or their relationship with Auckland City
Council’s school travel team. This ensured reasonable access to the schools by the research team.
For initial and on-going access to schools, the researchers worked closely with Auckland City Council
staff who were responsible for school travel plans (for Auckland schools) and interested individuals
within each school such as associate principal, administrator or board of trustee’s member (for the
other schools). The three Auckland schools were in the process of, or had already participated in,
school travel plans, while the other schools had not received any school travel planning assistance at
the time of data collection.
For each school background, information similar to that gathered for school travel plans was
employed. However, there was a single and much more detailed focus on cycling to school. By
following this process, barriers and solutions for each school and themes between schools were
identified.
The research was carried out in three stages:
1 Gathering initial information: Initial travel survey (from ARTA school travel survey or plan for
Auckland schools), initial meeting with key school contact to discuss issues and ideas, roll maps,
modal maps, site visits, photographs and previous comments and concerns from students and
parents.
2 Student focus groups: A meeting with approximately 13–17 students to discuss their school travel
environment, specific barriers to cycling to and from their school and their ideas for making it
easier to cycle to school.
3 Recommendations for each school, theoretical maximum number of student cyclists and
parents’ survey: Based on previous information, a selection of cycling initiatives for each school
was developed including a proposed map of routes to school. The roll/modal maps and routes to
‘I want to ride my bike’: overcoming barriers to cycling to intermediate schools
24
school were used to estimate the maximum number of students who might cycle to school. Parents
were asked to rank their preferred initiatives and choose the level of intervention that would be
required before they let their son or daughter cycle to school.
4 Collective themes, consideration of benefits and costs and national level recommendations:
The findings of each school were grouped to create themes for barriers and solutions, national
level recommendations were developed based on the themes and preliminary comparisons of
benefits and costs were also considered.
For stage one, the process began by retrieving school travel survey information, carrying out an initial
site visit, taking photos and then meeting with the school representative. Completing these tasks
meant that a solid understanding of the key issues facing each school was obtained relatively quickly.
For schools that had not participated in the school travel planning process, an initial questionnaire was
administered to students. The questionnaire asked them about the actual and preferred modes used to
get to school, specific cycling issues around their school, solutions for improving cycling to and from
their school and the route they used to get to and from school (drawn on a map).
The student focus groups (between 13 and 17 students at each school) provided an opportunity for
students to comment on the barriers to cycling to school and the possible solutions. The focus groups
started with an introduction and very brief powerpoint presentation that included a number of
photographs of the road environment around their school followed by a directed discussion, repeating
the questions that were asked in the initial student survey but at greater depth and focusing very
specifically on problem areas around their school and their ideas for solutions. Students were asked to
record their comments on a feedback form and notes were also taken by the research team.
A selection of interventions to improve cycling to school was then developed for each school. At this
stage, contact was made with territorial local authorities (TLAs) associated with each school so that the
interventions recommended as part of this project were aligned with the plans of transport officers
within each TLA. There was a heavy emphasis on identifying possibilities for safe and attractive routes
to school as previous literature had identified this as one of the largest barriers to cycling to school.
Maps were created of proposed cycling routes to school. This included proposing engineering work
where it was considered necessary in order to provide safe and attractive cycling routes to school.
Other education and enforcement interventions were also proposed for each school and were
presented as options within the parents’ survey:
secure bike storage
cycle training
cycling to school with a buddy
school cycling officer (modelled on Sustrans Bike It officers)
low-speed zone on roads around school
enforcement of illegal parking and other road user misbehaviour around the school gate
cycle trains.
For each school the local brand of each intervention being presented was used. For example, for
Auckland schools cycle training was presented as the city’s ‘Bike Better’ programme.
3 Research approach
25
The modal and roll maps along with the proposed cycling routes to school were then used to estimate
the theoretical maximum number of cyclists that might be possible at each school. The theoretical
maximum number of cyclists is a blunt measure and does not consider individual situations where it is
not practical or sensible to cycle to school (for example the child of a plumber who gets a lift as part of
their father’s journey to work in his van) or where access to a bike does not exist. Rather the
theoretical maximum number of cyclists is intended to be the maximum number of students who
might cycle if conditions were favourable for them.
In order to obtain the theoretical maximum number of cyclists at each school, the following conditions
were used:
For Auckland schools:
current percentage of students cycling to school
PLUS all car trips less than a 2km radius from the school on reasonable(a) cycling routes to school
PLUS all walkers and public transport users between a 1–2km radius from the school on
reasonable cycling routes to school
PLUS other non-cyclists who lived more than 2km from school on good(a) cycling routes to school
(a) Routes to school were considered reasonable where there was a relatively direct way of getting to school with
no significant barriers such as water or very busy roads with no crossing facilities. Such routes may not
necessarily be suitable for younger cyclists due to a lack of facilities or connectivity. Good routes to school
were where there was an off-road or direct route that avoided heavy traffic.
It is debatable whether students who already walk or use public transport to travel to school or live
further than a 2km radius from the school could or should be convinced to cycle to school. Therefore
figures for the theoretical percentage of students who might cycle to school were given including and
excluding pedestrians, public transport users and those who lived greater than a 2km radius from the
school.
For the other schools, although initial school travel survey information was gathered, matching the
location of every student’s residence with their mode of travel to school was not easily achievable and
so a slightly different approach was used. For these schools the following conditions were used:
all students who lived within a 0.75–2km radius from the school on reasonable cycling routes to
school
PLUS all students who lived greater than a 2km radius from the school on good cycling routes to
school.
The proposed initiatives were then used in a parents’ survey (Appendix B). At the beginning of the
research it was planned to include parent focus groups, but organising this proved to be problematic
and so it was decided to use a survey instead.
The initiatives proposed in the survey were all existing initiatives that had been either proposed or
used to some degree within New Zealand. Other questionnaire items were chosen based on their
relevance to parents’ perceptions to cycling to school, as identified by school travel coordinators and
the research team. Some of the items were designed to explore the same issues that had earlier been
discussed in the student focus groups.
‘I want to ride my bike’: overcoming barriers to cycling to intermediate schools
26
Parents were first asked to locate their home on a map. This was used for referencing specific
problems that parents highlighted (which were subsequently raised with the school). After reading the
selection of cycling initiatives, parents were asked the following question:
After you have read the accompanying document, please rank the most important
initiative to you with the number ‘1’, the next most important initiative with the number
‘2’ etc. Please also circle yes or no to indicate whether you feel each initiative is essential
before you would let your child bike to school.
Parents were also asked if their child already biked to school and also if none of the proposed
initiatives would be sufficient to allow their child to bike to school (as well as their reason). Finally,
parents were openly asked what other things could be done to allow their child to bike to school safely.
For data processing the average rank of each initiative was calculated for each school. The average
rank, weighted by respondent numbers at each school, was then used to combine all the school data to
estimate the overall most important initiatives to parents. The percentage of parents who indicated it
was essential that each initiative be implemented before they would let their child cycle to school was
also calculated.
Additional comments regarding barriers or ideas for improving cycling to school that emerged from
individual schools were grouped with the rankings to create overall themes. These overall themes
provided the basis for recommendations for school cycling initiatives.
Finally, a brief discussion of the benefits and likely approximate costs of the initiatives was given in
order to provide a preliminary evaluation of the value for money that might be expected by
implementing such initiatives.
4 Combined research findings
27
4 Combined research findings
The specific results and proposals for each school can be found in Appendix A. This section outlines
some of the combined findings including trends and variation that were exhibited between the schools.
4.1 Initial information
The most striking aspect of the first stage of the research was the different levels of awareness of, or
priority given to, cycling between schools. For one school, cycling initiatives were low on their priority
list and they seemed much more interested in issues within the school, while another school had
already completed a school travel plan, had some excellent cycling initiatives in place and was in a
great position to take their cycling initiatives to another level. This was useful as it probably
represented the range of situations among New Zealand schools.
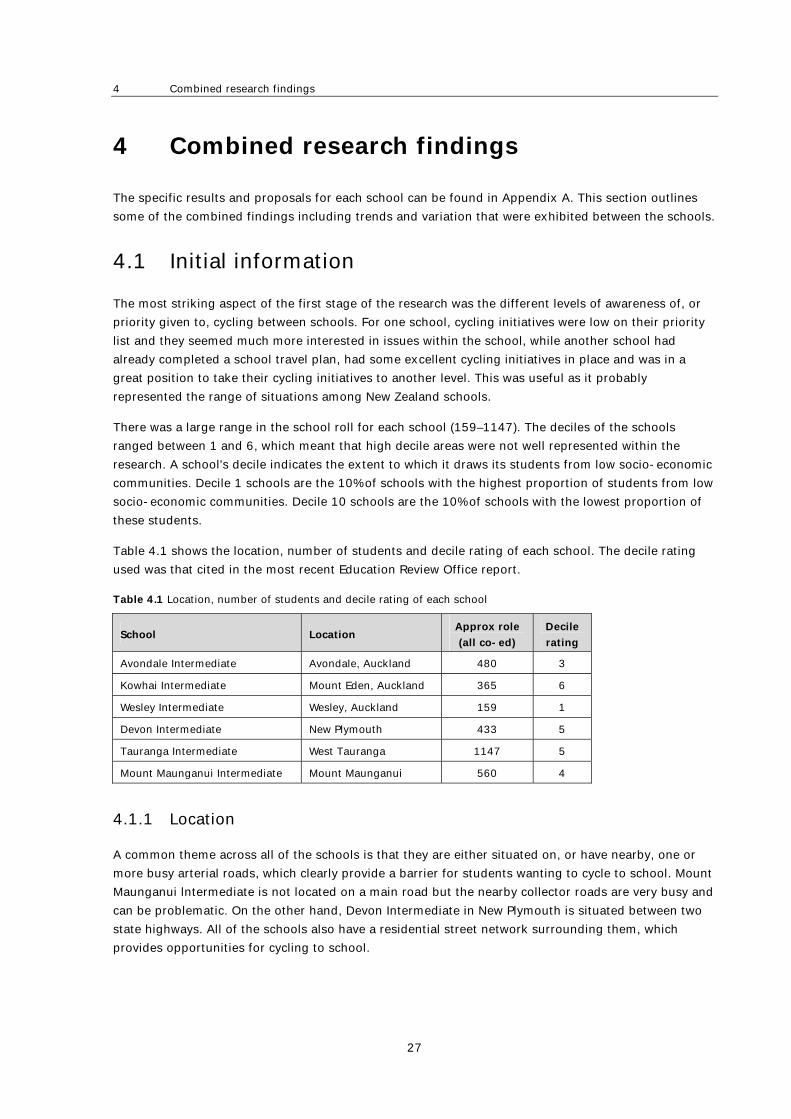
There was a large range in the school roll for each school (159–1147). The deciles of the schools
ranged between 1 and 6, which meant that high decile areas were not well represented within the
research. A school's decile indicates the extent to which it draws its students from low socio-economic
communities. Decile 1 schools are the 10% of schools with the highest proportion of students from low
socio-economic communities. Decile 10 schools are the 10% of schools with the lowest proportion of
these students.
Table 4.1 shows the location, number of students and decile rating of each school. The decile rating
used was that cited in the most recent Education Review Office report.
Table 4.1 Location, number of students and decile rating of each school
School Location Approx role
(all co-ed)
Decile
rating
Avondale Intermediate Avondale, Auckland 480 3
Kowhai Intermediate Mount Eden, Auckland 365 6
Wesley Intermediate Wesley, Auckland 159 1
Devon Intermediate New Plymouth 433 5
Tauranga Intermediate West Tauranga 1147 5
Mount Maunganui Intermediate Mount Maunganui 560 4
4.1.1 Location
A common theme across all of the schools is that they are either situated on, or have nearby, one or
more busy arterial roads, which clearly provide a barrier for students wanting to cycle to school. Mount
Maunganui lntermediate is not located on a main road but the nearby collector roads are very busy and
can be problematic. On the other hand, Devon Intermediate in New Plymouth is situated between two
state highways. All of the schools also have a residential street network surrounding them, which
provides opportunities for cycling to school.
‘I want to ride my bike’: overcoming barriers to cycling to intermediate schools
28
4.1.2 Where students live
Modal maps (for Auckland schools) and roll maps (for all schools) are an effective way to visualise
where students live around a school and the likely routes they use to travel to school. Although the
proportion of students living various distances from the school differed considerably between schools,
clusters of student residences can be seen for all schools. For roll or modal maps for each school see
Appendix A.
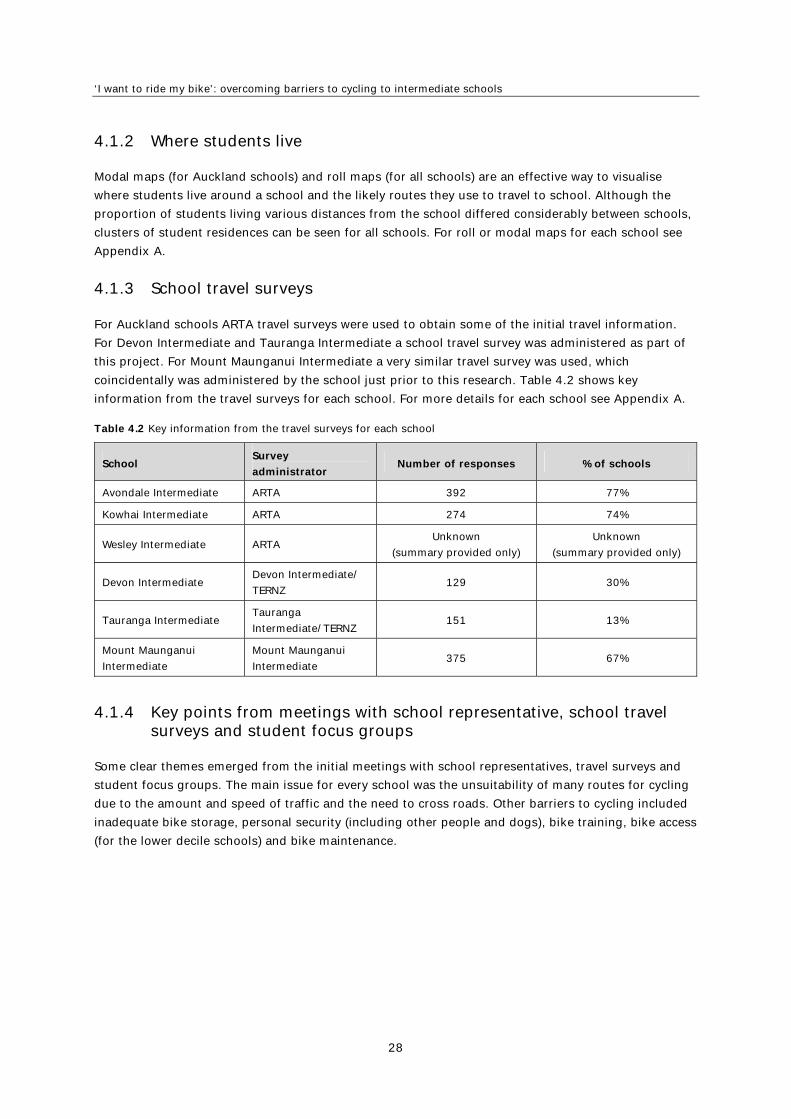
4.1.3 School travel surveys
For Auckland schools ARTA travel surveys were used to obtain some of the initial travel information.
For Devon Intermediate and Tauranga Intermediate a school travel survey was administered as part of
this project. For Mount Maunganui Intermediate a very similar travel survey was used, which
coincidentally was administered by the school just prior to this research. Table 4.2 shows key
information from the travel surveys for each school. For more details for each school see Appendix A.
Table 4.2 Key information from the travel surveys for each school
School Survey
administrator Number of responses % of schools
Avondale Intermediate ARTA 392 77%
Kowhai Intermediate ARTA 274 74%
Wesley Intermediate ARTA Unknown
(summary provided only)
Unknown
(summary provided only)
Devon Intermediate Devon Intermediate/
TERNZ 129 30%
Tauranga Intermediate Tauranga
Intermediate/TERNZ 151 13%
Mount Maunganui
Intermediate
Mount Maunganui
Intermediate 375 67%
4.1.4 Key points from meetings with school representative, school travel surveys and student focus groups
Some clear themes emerged from the initial meetings with school representatives, travel surveys and
student focus groups. The main issue for every school was the unsuitability of many routes for cycling
due to the amount and speed of traffic and the need to cross roads. Other barriers to cycling included
inadequate bike storage, personal security (including other people and dogs), bike training, bike access
(for the lower decile schools) and bike maintenance.
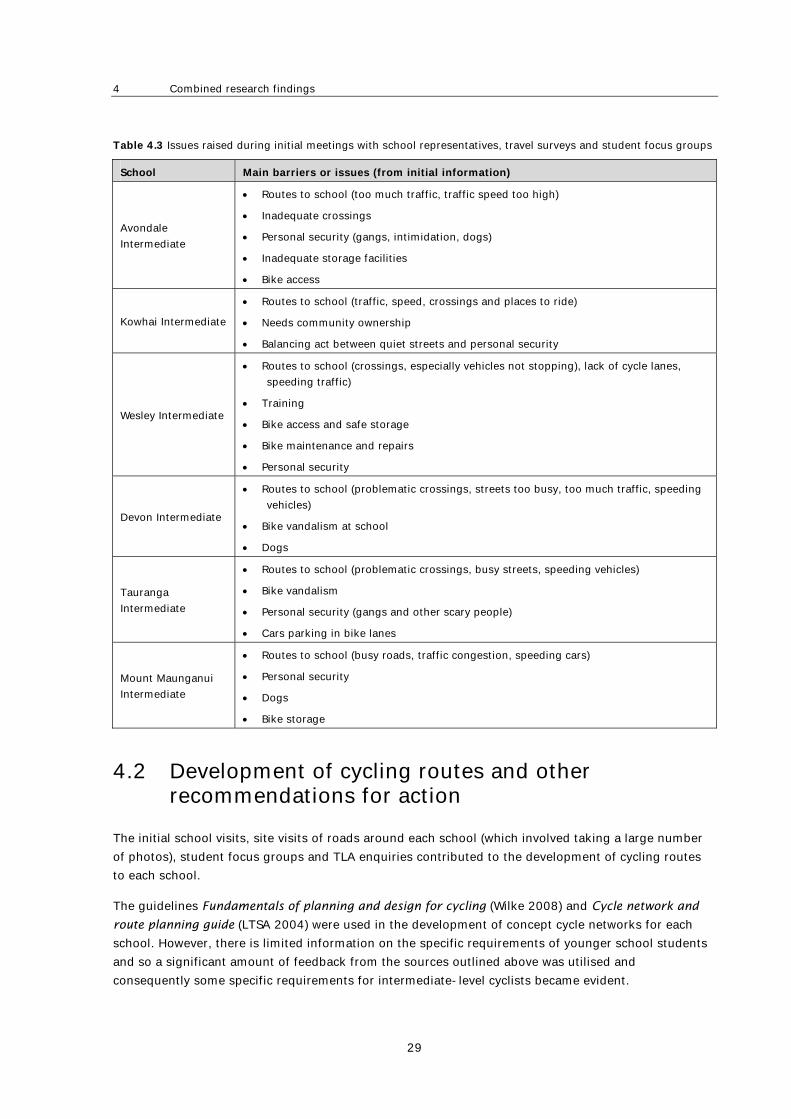
4 Combined research findings
29
Table 4.3 Issues raised during initial meetings with school representatives, travel surveys and student focus groups
School Main barriers or issues (from initial information)
Avondale
Intermediate
Routes to school (too much traffic, traffic speed too high)
Inadequate crossings
Personal security (gangs, intimidation, dogs)
Inadequate storage facilities
Bike access
Kowhai Intermediate
Routes to school (traffic, speed, crossings and places to ride)
Needs community ownership
Balancing act between quiet streets and personal security
Wesley Intermediate
Routes to school (crossings, especially vehicles not stopping), lack of cycle lanes,
speeding traffic)
Training
Bike access and safe storage
Bike maintenance and repairs
Personal security
Devon Intermediate
Routes to school (problematic crossings, streets too busy, too much traffic, speeding
vehicles)
Bike vandalism at school
Dogs
Tauranga
Intermediate
Routes to school (problematic crossings, busy streets, speeding vehicles)
Bike vandalism
Personal security (gangs and other scary people)
Cars parking in bike lanes
Mount Maunganui
Intermediate
Routes to school (busy roads, traffic congestion, speeding cars)
Personal security
Dogs
Bike storage
4.2 Development of cycling routes and other recommendations for action
The initial school visits, site visits of roads around each school (which involved taking a large number
of photos), student focus groups and TLA enquiries contributed to the development of cycling routes
to each school.
The guidelines Fundamentals of planning and design for cycling (Wilke 2008) and Cycle network and
route planning guide (LTSA 2004) were used in the development of concept cycle networks for each
school. However, there is limited information on the specific requirements of younger school students
and so a significant amount of feedback from the sources outlined above was utilised and
consequently some specific requirements for intermediate-level cyclists became evident.
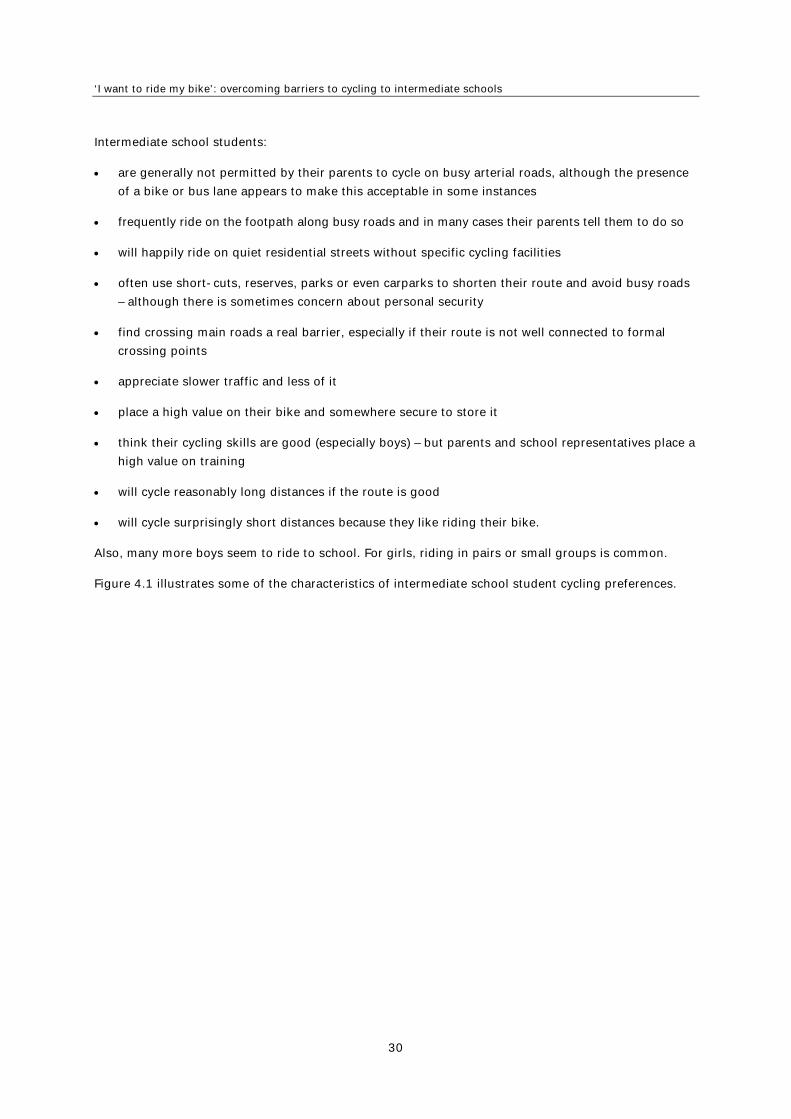
‘I want to ride my bike’: overcoming barriers to cycling to intermediate schools
30
Intermediate school students:
are generally not permitted by their parents to cycle on busy arterial roads, although the presence
of a bike or bus lane appears to make this acceptable in some instances
frequently ride on the footpath along busy roads and in many cases their parents tell them to do so
will happily ride on quiet residential streets without specific cycling facilities
often use short-cuts, reserves, parks or even carparks to shorten their route and avoid busy roads
– although there is sometimes concern about personal security
find crossing main roads a real barrier, especially if their route is not well connected to formal
crossing points
appreciate slower traffic and less of it
place a high value on their bike and somewhere secure to store it
think their cycling skills are good (especially boys) – but parents and school representatives place a
high value on training
will cycle reasonably long distances if the route is good
will cycle surprisingly short distances because they like riding their bike.
Also, many more boys seem to ride to school. For girls, riding in pairs or small groups is common.
Figure 4.1 illustrates some of the characteristics of intermediate school student cycling preferences.
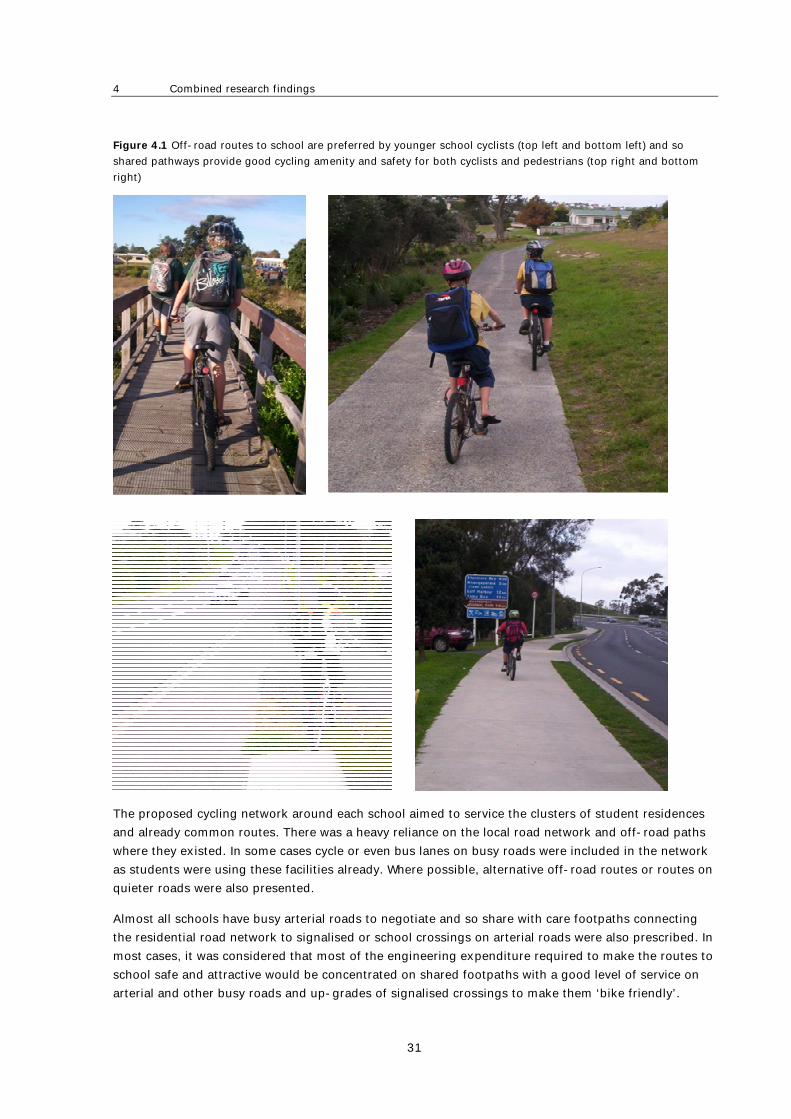
4 Combined research findings
31
Figure 4.1 Off-road routes to school are preferred by younger school cyclists (top left and bottom left) and so
shared pathways provide good cycling amenity and safety for both cyclists and pedestrians (top right and bottom
right)
The proposed cycling network around each school aimed to service the clusters of student residences
and already common routes. There was a heavy reliance on the local road network and off-road paths
where they existed. In some cases cycle or even bus lanes on busy roads were included in the network
as students were using these facilities already. Where possible, alternative off-road routes or routes on
quieter roads were also presented.
Almost all schools have busy arterial roads to negotiate and so share with care footpaths connecting
the residential road network to signalised or school crossings on arterial roads were also prescribed. In
most cases, it was considered that most of the engineering expenditure required to make the routes to
school safe and attractive would be concentrated on shared footpaths with a good level of service on
arterial and other busy roads and up-grades of signalised crossings to make them ‘bike friendly’.
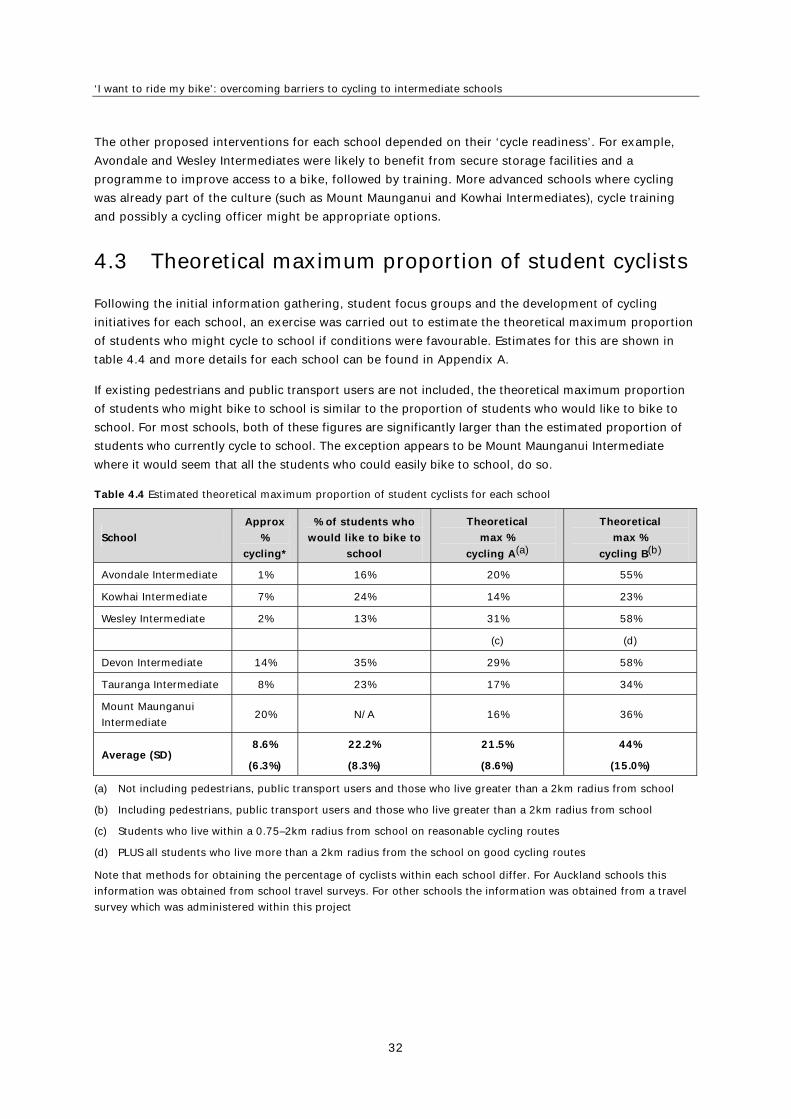
‘I want to ride my bike’: overcoming barriers to cycling to intermediate schools
32
The other proposed interventions for each school depended on their ‘cycle readiness’. For example,
Avondale and Wesley Intermediates were likely to benefit from secure storage facilities and a
programme to improve access to a bike, followed by training. More advanced schools where cycling
was already part of the culture (such as Mount Maunganui and Kowhai Intermediates), cycle training
and possibly a cycling officer might be appropriate options.
4.3 Theoretical maximum proportion of student cyclists
Following the initial information gathering, student focus groups and the development of cycling
initiatives for each school, an exercise was carried out to estimate the theoretical maximum proportion
of students who might cycle to school if conditions were favourable. Estimates for this are shown in
table 4.4 and more details for each school can be found in Appendix A.
If existing pedestrians and public transport users are not included, the theoretical maximum proportion
of students who might bike to school is similar to the proportion of students who would like to bike to
school. For most schools, both of these figures are significantly larger than the estimated proportion of
students who currently cycle to school. The exception appears to be Mount Maunganui Intermediate
where it would seem that all the students who could easily bike to school, do so.
Table 4.4 Estimated theoretical maximum proportion of student cyclists for each school
School
Approx
%
cycling*
% of students who
would like to bike to
school
Theoretical
max %
cycling A(a)
Theoretical
max %
cycling B(b)
Avondale Intermediate 1% 16% 20% 55%
Kowhai Intermediate 7% 24% 14% 23%
Wesley Intermediate 2% 13% 31% 58%
(c) (d)
Devon Intermediate 14% 35% 29% 58%
Tauranga Intermediate 8% 23% 17% 34%
Mount Maunganui
Intermediate 20% N/A 16% 36%
Average (SD) 8.6%
(6.3%)
22.2%
(8.3%)
21.5%
(8.6%)
44%
(15.0%)
(a) Not including pedestrians, public transport users and those who live greater than a 2km radius from school
(b) Including pedestrians, public transport users and those who live greater than a 2km radius from school
(c) Students who live within a 0.75–2km radius from school on reasonable cycling routes
(d) PLUS all students who live more than a 2km radius from the school on good cycling routes
Note that methods for obtaining the percentage of cyclists within each school differ. For Auckland schools this
information was obtained from school travel surveys. For other schools the information was obtained from a travel
survey which was administered within this project
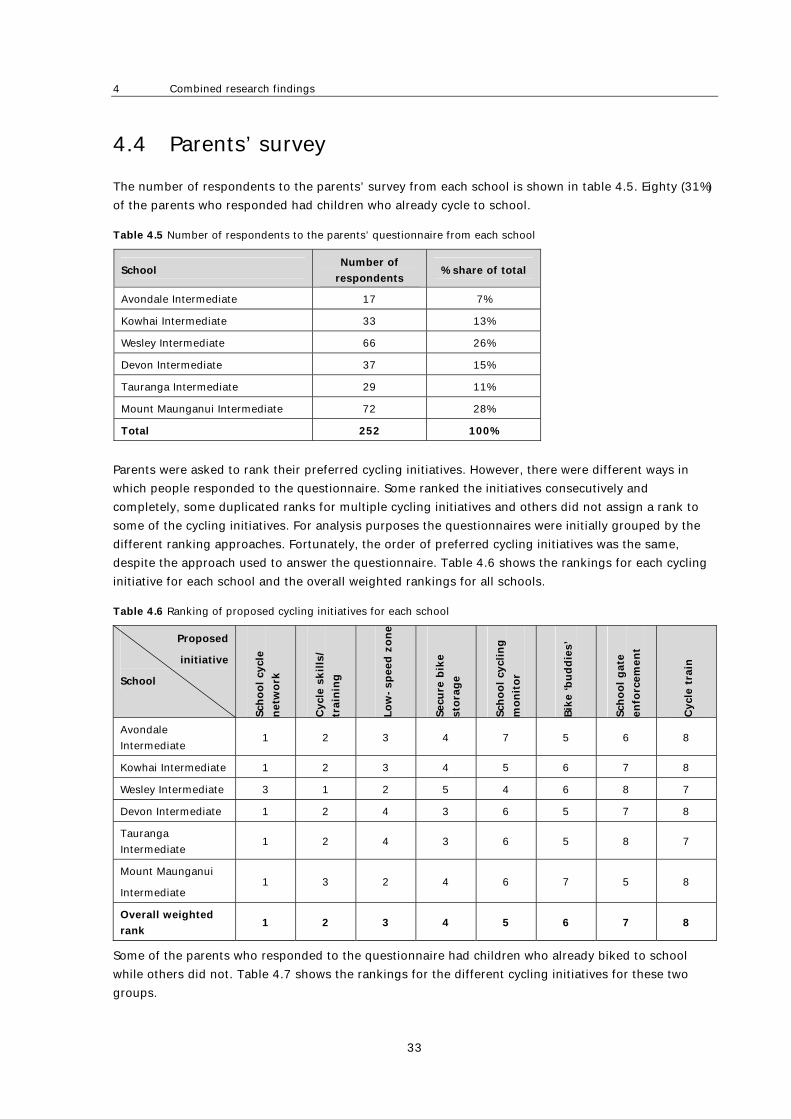
4 Combined research findings
33
4.4 Parents’ survey
The number of respondents to the parents’ survey from each school is shown in table 4.5. Eighty (31%)
of the parents who responded had children who already cycle to school.
Table 4.5 Number of respondents to the parents’ questionnaire from each school
School Number of
respondents % share of total
Avondale Intermediate 17 7%
Kowhai Intermediate 33 13%
Wesley Intermediate 66 26%
Devon Intermediate 37 15%
Tauranga Intermediate 29 11%
Mount Maunganui Intermediate 72 28%
Total 252 100%
Parents were asked to rank their preferred cycling initiatives. However, there were different ways in
which people responded to the questionnaire. Some ranked the initiatives consecutively and
completely, some duplicated ranks for multiple cycling initiatives and others did not assign a rank to
some of the cycling initiatives. For analysis purposes the questionnaires were initially grouped by the
different ranking approaches. Fortunately, the order of preferred cycling initiatives was the same,
despite the approach used to answer the questionnaire. Table 4.6 shows the rankings for each cycling
initiative for each school and the overall weighted rankings for all schools.
Table 4.6 Ranking of proposed cycling initiatives for each school
Proposed
initiative
School
School cy
cle
netw
ork
Cycl
e s
kills
/
train
ing
Low
-sp
eed
zone
Secu
re b
ike
stora
ge
School cy
clin
g
monit
or
Bik
e ‘b
ud
die
s’
School g
ate
enfo
rcem
ent
Cycl
e t
rain
Avondale
Intermediate 1 2 3 4 7 5 6 8
Kowhai Intermediate 1 2 3 4 5 6 7 8
Wesley Intermediate 3 1 2 5 4 6 8 7
Devon Intermediate 1 2 4 3 6 5 7 8
Tauranga
Intermediate 1 2 4 3 6 5 8 7
Mount Maunganui
Intermediate 1 3 2 4 6 7 5 8
Overall weighted
rank 1 2 3 4 5 6 7 8
Some of the parents who responded to the questionnaire had children who already biked to school
while others did not. Table 4.7 shows the rankings for the different cycling initiatives for these two
groups.
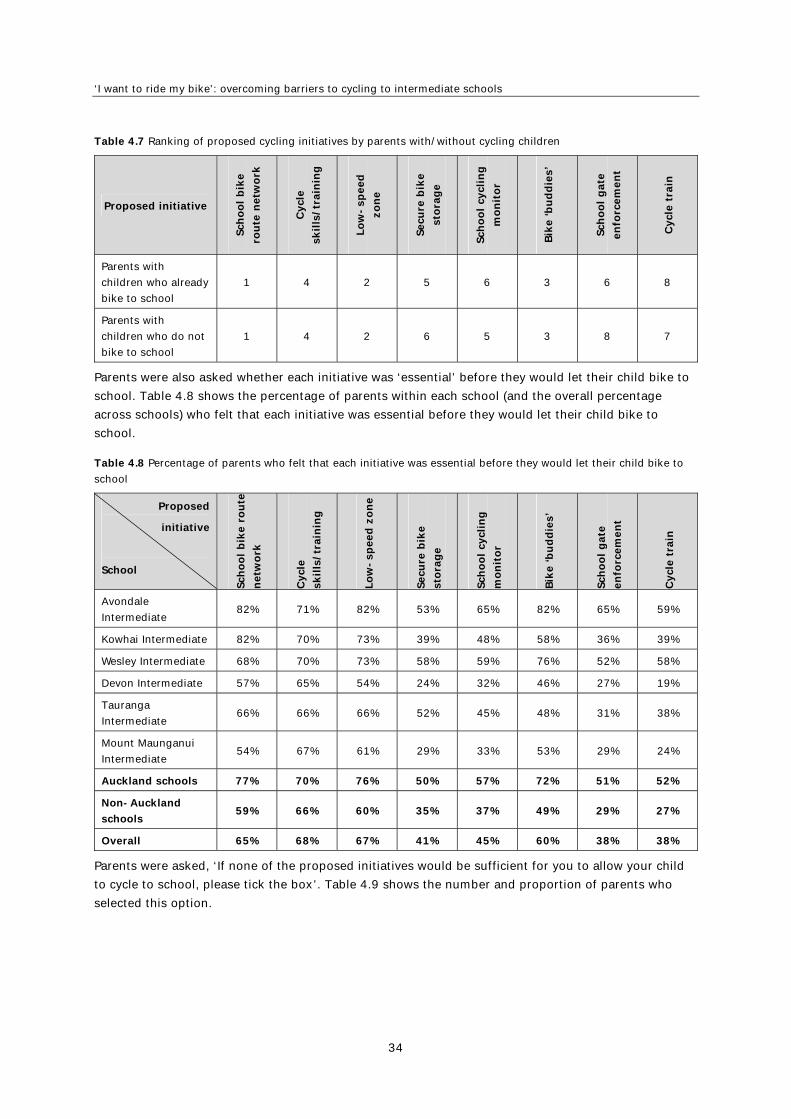
‘I want to ride my bike’: overcoming barriers to cycling to intermediate schools
34
Table 4.7 Ranking of proposed cycling initiatives by parents with/without cycling children
Proposed initiative
School
bik
e
route
netw
ork
Cycl
e
skills
/tra
inin
g
Low
-sp
eed
zone
Secu
re b
ike
stora
ge
School cy
clin
g
monit
or
Bik
e ‘b
ud
die
s’
School g
ate
enfo
rcem
ent
Cycl
e t
rain
Parents with
children who already
bike to school
1 4 2 5 6 3 6 8
Parents with
children who do not
bike to school
1 4 2 6 5 3 8 7
Parents were also asked whether each initiative was ‘essential’ before they would let their child bike to
school. Table 4.8 shows the percentage of parents within each school (and the overall percentage
across schools) who felt that each initiative was essential before they would let their child bike to
school.
Table 4.8 Percentage of parents who felt that each initiative was essential before they would let their child bike to
school
Proposed
initiative
School
School
bik
e r
oute
netw
ork
Cycl
e
skills
/tra
inin
g
Low
-sp
eed
zone
Secu
re b
ike
stora
ge
School cy
clin
g
monit
or
Bik
e ‘b
ud
die
s’
School g
ate
enfo
rcem
ent
Cycl
e t
rain
Avondale
Intermediate 82% 71% 82% 53% 65% 82% 65% 59%
Kowhai Intermediate 82% 70% 73% 39% 48% 58% 36% 39%
Wesley Intermediate 68% 70% 73% 58% 59% 76% 52% 58%
Devon Intermediate 57% 65% 54% 24% 32% 46% 27% 19%
Tauranga
Intermediate 66% 66% 66% 52% 45% 48% 31% 38%
Mount Maunganui
Intermediate 54% 67% 61% 29% 33% 53% 29% 24%
Auckland schools 77% 70% 76% 50% 57% 72% 51% 52%
Non-Auckland
schools 59% 66% 60% 35% 37% 49% 29% 27%
Overall 65% 68% 67% 41% 45% 60% 38% 38%
Parents were asked, ‘If none of the proposed initiatives would be sufficient for you to allow your child
to cycle to school, please tick the box’. Table 4.9 shows the number and proportion of parents who
selected this option.
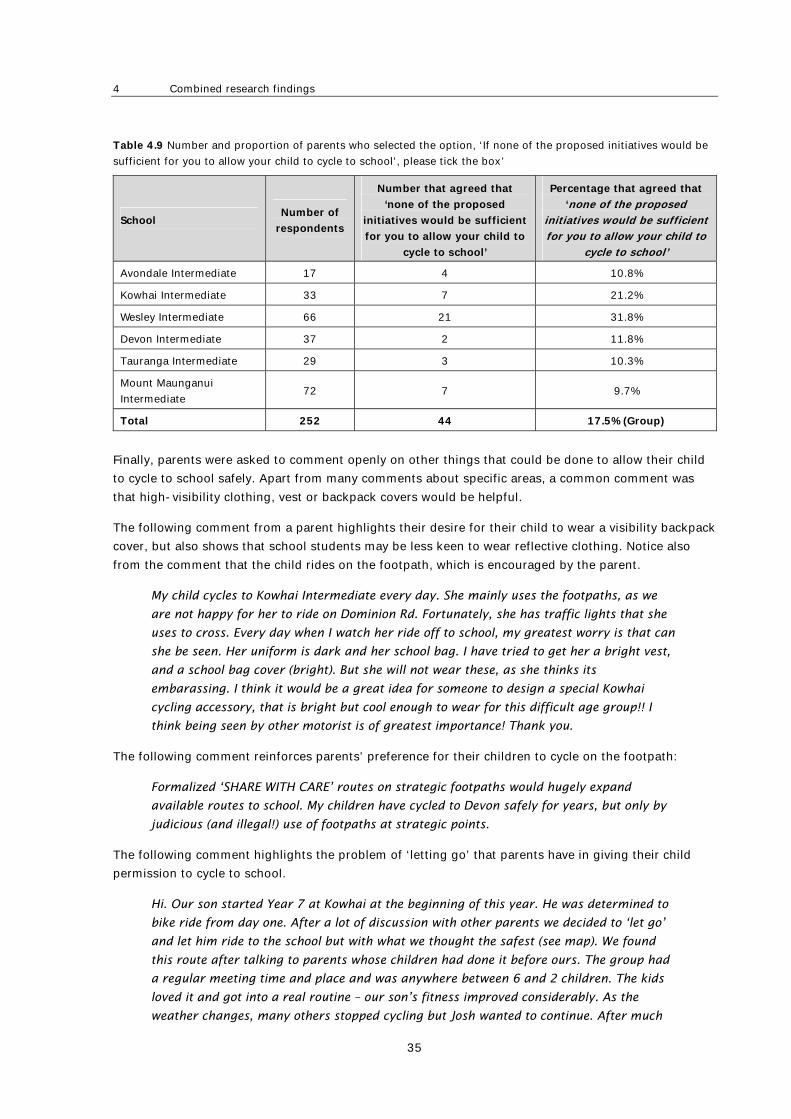
4 Combined research findings
35
Table 4.9 Number and proportion of parents who selected the option, ‘If none of the proposed initiatives would be
sufficient for you to allow your child to cycle to school’, please tick the box’
School Number of
respondents
Number that agreed that
‘none of the proposed
initiatives would be sufficient
for you to allow your child to
cycle to school’
Percentage that agreed that
‘none of the proposed initiatives would be sufficient for you to allow your child to
cycle to school’
Avondale Intermediate 17 4 10.8%
Kowhai Intermediate 33 7 21.2%
Wesley Intermediate 66 21 31.8%
Devon Intermediate 37 2 11.8%
Tauranga Intermediate 29 3 10.3%
Mount Maunganui
Intermediate 72 7 9.7%
Total 252 44 17.5% (Group)
Finally, parents were asked to comment openly on other things that could be done to allow their child
to cycle to school safely. Apart from many comments about specific areas, a common comment was
that high-visibility clothing, vest or backpack covers would be helpful.
The following comment from a parent highlights their desire for their child to wear a visibility backpack
cover, but also shows that school students may be less keen to wear reflective clothing. Notice also
from the comment that the child rides on the footpath, which is encouraged by the parent.
My child cycles to Kowhai Intermediate every day. She mainly uses the footpaths, as we
are not happy for her to ride on Dominion Rd. Fortunately, she has traffic lights that she
uses to cross. Every day when I watch her ride off to school, my greatest worry is that can
she be seen. Her uniform is dark and her school bag. I have tried to get her a bright vest,
and a school bag cover (bright). But she will not wear these, as she thinks its
embarassing. I think it would be a great idea for someone to design a special Kowhai
cycling accessory, that is bright but cool enough to wear for this difficult age group!! I
think being seen by other motorist is of greatest importance! Thank you.
The following comment reinforces parents’ preference for their children to cycle on the footpath:
Formalized ‘SHARE WITH CARE’ routes on strategic footpaths would hugely expand
available routes to school. My children have cycled to Devon safely for years, but only by
judicious (and illegal!) use of footpaths at strategic points.
The following comment highlights the problem of ‘letting go’ that parents have in giving their child
permission to cycle to school.
Hi. Our son started Year 7 at Kowhai at the beginning of this year. He was determined to
bike ride from day one. After a lot of discussion with other parents we decided to ‘let go’
and let him ride to the school but with what we thought the safest (see map). We found
this route after talking to parents whose children had done it before ours. The group had
a regular meeting time and place and was anywhere between 6 and 2 children. The kids
loved it and got into a real routine – our son’s fitness improved considerably. As the
weather changes, many others stopped cycling but Josh wanted to continue. After much
‘I want to ride my bike’: overcoming barriers to cycling to intermediate schools
36
soul searching, we decided to let him cycle on his own. We had to trust him and hope that
he didn’t put himself in any dangerous situations. (The drivers we can’t have the same
faith in.) Whatever the time of day he leaves/returns he uses his fluorescent bag/backpack
cover. He has a cellphone and contact details inside his bag. Since we decided to let him go
it alone Dad has begun a new job and bicycles also (with his bag cover!) and night lights,
etc. He has discovered the pros and cons of cycling and still feels comfortable for Josh to
continue. No doubt as the weather improves so will his cycling buddies. I do prefer him
cycling with one other as the large group spread out considerably (although waited at
major intersections) and I was fearful that a driver backing out of a driveway may after 2
bikes as some they had past and not expect 3/4/5 more to zoom along. Josh loves his new
independence (he’s home before the train and gets just as wet walking to the station as he
does cycling). And his fitness has shown in his soccer and cricket games. It was a matter
of trusting him and letting go, something I’m not as sure I will be willing to do when my 8
year old daughter hits Year 7! Thanks for taking the time to make the roads safer for our
kids.
However, for some parents concerns about their child’s decision-making abilities plays a large factor in
not letting their child cycle to school, as highlighted by the following comment:
All the proposed initiatives are great. But I won’t allow my kid to cycle to school at that
school level – too risky in that age group, easily dragged into childish acts, vulnerable, etc.
Poor risk assessment.
Finally, there was one comment from a parent (whose child bikes to school) who was keen to emphasis
the concept of individual responsibility:
Stop the PC bullshit – kids this age can cycle to school on their own steam/responsibility
without ‘buddie’ and cycle trains–- too many ‘normal’ activities are been ‘dumbed’ down –
enough!! How much did this survey cost us ratepayers??!! Waste of time – Let kids have a
bit of freedom/responsibility and consequences.
Apart from the clearly emotional nature of the comment, there may be an important point here which
is, in a sense, related to the concept of the erosion of social capital (Thomson 2009) and the problem
of an increasingly risk-averse society. It may be no coincidence that this comment was made by a
parent from Mount Maunganui Intermediate. Approximately 20% of Mount Maunganui students bike to
school, which is very similar to the ‘theoretical’ number of students who might bike to school. This
suggests that cycling to this school is a ‘normal’ activity for those where it is practically feasible and
therefore this research project might seem unnecessary to some (although there are many more Mount
Maunganui parents and teachers who are concerned about the safety of their children cycling to school
and were thankful for the study). A culture of cycling to school appears to be less evident in the
Auckland schools within this study, with a consistently larger number of Auckland parents who stated
that each of the suggested cycling initiatives was ‘essential’ before they would let their child cycle to
school.
5 Discussion
37
5 Discussion
5.1 Collective themes
Across all six schools 8.6% (range 1–20%) of students currently cycle to school, 22.2% (range 13–35%)
of students would like to cycle to school and the average maximum theoretical number of students
cycling to school is 21.5% (range 14–31%), if pedestrian and public transport trips are not converted
into cycling trips. This suggests that there is a significant demand for cycling. These findings are
consistent with Horspool (2006) who found that 9% of year 8 students on the North Shore of Auckland
currently cycle to school, yet more would like to cycle to school.
Across all schools the most obvious concern was about the amount and speed of traffic. Accordingly,
the need for safe routes to school was a very clear priority for students and parents. Initiatives aimed at
increasing the number of students cycling to school should therefore include the development of a safe
and attractive environment for cycling to school.
Literature (Thomson 2009) suggests that an increasingly risk-averse society is a barrier to children’s
active transport. This suggests that an element of parents’ negative perceptions of cycling is related to
a generalised tendency to avoid risk and therefore protect their child, which may be unrelated to the
actual traffic environment. However, increases in traffic and increased provision for motor vehicles
probably contributes to parents’ perceptions (ie something must shape parents’ perceptions), which
creates a self-fuelling problem. Although the origins of parents’ perceptions have not been
significantly explored, clearly education or publicity to address parental concerns should be carried out
in parallel with or after any physical work to improve cycling environments for school students.
When the routes to school were planned there was a consistent theme in the design of the routes. In
most cases there was a heavy reliance on residential streets with less traffic, pathways through
reserves and footpaths on busier roads. These routes reflected both students’ and parents’ preferences
for students avoiding traffic as much as possible and a physical separation from traffic on busier roads.
This approach also reflects the principles that have been adopted in successful cycling cities in Europe
(Pucher and Buehler 2008). Typically this involves the development of low-speed shared environments
on local and less trafficked roads and separated cycling facilities on busier arterial roads, where traffic
conditions cannot be made safe for cycling.
There is another school of thought in that cyclists are legitimate road users who are to be encouraged
and therefore have high priority for safe access on the road. In New Zealand significant and widespread
change in driver behaviour, supported by appropriate policy and reduction of traffic speed would be
needed before parents would be comfortable with their children cycling to school on many roads. As
mentioned earlier, even in the most pro-cycling cities in Europe, separation from the general traffic
flow via dedicated facilities is the norm on higher-speed or arterial routes, and like these cities, safe
shared road environments for local and other minor roads should be a goal in New Zealand. There are
some arterial roads near schools within this study on which many experienced adult commuter cyclists
would not be comfortable cycling (such as Great North Road at Waterview, in Auckland), let alone
young school students. Separation from the general traffic is clearly a sensible option in these
situations. In any case, despite the physical differences, New Zealand can learn from many European
cities by aiming for more liveable urban spaces, including those that make road environments more
‘I want to ride my bike’: overcoming barriers to cycling to intermediate schools
38
user-friendly for cyclists and pedestrians. Cyclists should not be solely responsible for their safety on
the road.
There needs to be clearer direction on whether younger school students should be encouraged to cycle
on the footpath or on the road. Although it is illegal to ride a bicycle on the footpath, most school
students do this and they are encouraged or required to do so by their parents, especially in busy
traffic environments. This is supported by Horspool (2006) who found that approximately 80% of year
8 students ride on the footpath (reducing to around 50% in years 9 and 10). These findings suggest
that riding on the footpath, with appropriate education and a goal of up-grading footpaths to ‘share
with care’ specification at key locations is likely to be a reasonable strategy for busier roads.
Another consistent theme in the development of the routes to school was the presence of specific
‘problem’ areas – usually busy arterial roads that need to be crossed, or worse, travelled along. All of
the schools had busy arterial or collector roads nearby and, accordingly, had a few significant ‘problem
areas’. On busier residential roads and collector roads in particular, there was variation in the way the
roads were used by students cycling to school. Some students would use on-road bike and bus lanes
or even the road space without any facilities, while others tended to use the footpath on all but the
quietest of roads. If significant cycling uptake is sought then provision must be made for less confident
cyclists. It is also reasonable that cyclists’ confidence in traffic should be developed through training
and a focus on better driver behaviour around cyclists.
The lower decile schools (Avondale and Wesley) appeared to place a higher emphasis on the need for
access to a bike, bike maintenance and the need for secure bike storage than the other schools.
However, between students and parents, routes to school still ranked highly for these schools. Uptake
of cycling does seem to be socio-economically related although it is acknowledged that this has not
been well tested within this research.
It appeared that parents of students at Auckland schools required more intervention and provision for
cycling before they would be happy for their child to cycle to school (table 4.8). This may not
necessarily mean that they are less likely to ever let their children cycle to school, as table 4.9 showed
that apart from Wesley Intermediate, there was little difference between Auckland and non-Auckland
schools who agreed that ‘none of the proposed initiatives would be sufficient for you to allow your
child to cycle to school’. Nonetheless, it may be that Auckland schools require more intervention and
infrastructure to reverse the trend of declining numbers of students cycling to school, than schools in
other regions. Of course, there are exceptions to this generalisation with Auckland Schools Belmont
Intermediate and Pasadena Intermediate having 22% and 17% of their rolls respectively cycling to
school (ARTA 2008), indicating that a culture of cycling to school is alive and well within these schools.
Because parents ultimately determine whether (or not) their children bike to school, there is merit in
giving some priority to the initiatives that ranked highly in the parents’ survey. Apart from safe routes
to school, cycle skills training, low-speed zones around schools and secure bike storage also ranked
highly. It is therefore encouraging that initiatives to improve cycle training and create 40km/h zones
around schools are already in place, although clearly much more needs to be done. In general, the
parents’ rankings were reflected in the proportion of parents who considered that each initiative was
‘essential’ before they would let their child cycle to school. The exception was the bike buddies (or
partner) initiative, where 72% of Auckland parents indicated that this was essential yet it was only
ranked 5th/6th by these parents.
The school cycling monitor, bike buddies, school gate enforcement and cycle train initiatives were
ranked less highly by parents, indicating that with limited resources, parents would rather see
5 Discussion
39
improvements in route infrastructure, training, bike storage and low-speed zones. Nonetheless, it is
important not to confuse the rankings with good or bad ideas. Also, it might be that parents were not
as familiar with the cycling monitor, bike buddies or cycle train initiatives in particular and therefore
ranked them lower. Horspool (2006) found that more than half the students surveyed indicated that
having friends to ride to school with was important. The present study found that this may be more
important for girls.
The school cycling monitor was proposed as an idea by the Kowhai Intermediate school principal (a
school that already has a small but advanced cycling culture) and Bike It officers have been a very
successful initiative in United Kingdom schools. So it might be that this initiative is more popular in the
future or as a ‘second generation’ cycling initiative following basic provision for cycling. Parents are
likely to support students cycling together in pairs or groups, but perhaps bike buddies and cycle
trains may be seen by parents as an extra responsibility that needs effort and attention and they may
prefer non-formalised variations. Cycle trains have been shown to be effective in Nelson (O’Fallon
2007), so their potential has at least been proven and it has been suggested that cycle trains might
serve as a step towards independent cycling rather than as a long-term solution for individual
students. The low ranking given to enforcement or ‘Chaos at the school gate’ type initiatives may have
been because this is seen as less of a cycling initiative but more as a congestion and general road
safety initiative.
As a group, approximately 17% of parents responded that none of the initiatives suggested would be
sufficient to allow their child to cycle to school. It is very difficult to determine whether parents’
comments would translate into action, but this low number suggests that most parents would allow
their child to cycle to school if conditions were favourable. The lower estimate for the group maximum
theoretical number of students who would cycle to school was 21.5% and in support of Horspool
(2006), many more intermediate school students reported that they would like to cycle to school than
currently do so. These findings may suggest that if good provision for cycling to school was made
available, practical considerations like distance to school, rather than parental safety fears, might limit
the number students who choose to cycle to school. The findings of this research are that in general
approximately 20% of students cycling to school would be a reasonable target, with variation
depending largely on where students live in the school district. In 1980, it was reported that
approximately 20% of students cycled to intermediate schools in Auckland (Auckland Regional
Authority 1980), when cycling was clearly still an integral part of the transport system. It is important
that targets for individual schools are based on the proportion of eligible cyclists – those who live
within a reasonable cycling range and who have reasonable routes to school.
There may be some schools that can achieve greater proportions of students cycling to school.
Broadgreen Intermediate school in Nelson had a phenomenal 60% of 750 students cycling to school in
2003 (Ministry of Transport 2005), and this level of cycling has recently been confirmed by the school
principal. Nelson’s excellent cycleway, converted from a disused rail corridor, runs along the back of
the school. Along with safe access to the school and a lock-up bike cage, these factors have
contributed significantly to cycling uptake at the school.
It is also worth considering why there is such a high proportion of eligible students cycling to school at
Mount Maunganui Intermediate. For those who live to the north-west of the school (towards Mount
Maunganui), there are good options for direct routes to school almost entirely along residential roads
and off-road pathways. For those who travel from the south-east, the closer students also have
relatively good routes to school (except they must cross Concord Avenue). It might also be that there is
a different attitude towards school commuting at Mount Maunganui Intermediate or within the
‘I want to ride my bike’: overcoming barriers to cycling to intermediate schools
40
surrounding community, compared especially with the Auckland schools. Mount Maunganui is a
popular holiday and lifestyle location. Perhaps people who prefer to live in this type of environment are
more likely to value activities associated with freedom and independence, but this is purely speculative.
Yet despite the high numbers of cyclists, at Mount Maunganui Intermediate there are plenty of
concerned students and parents, and just because there is a good balance of modes used to get to
school, it doesn’t necessarily mean that the environment is inherently safe and that further provision
for walking and cycling is not needed. In fact, it is pleasing to learn very recently that Mount
Maunganui will be receiving improved cycling infrastructure around the school in the near future.
5.2 Recommendations for overcoming barriers to cycling to school
Previous literature and the present study have demonstrated a number of key points related to cycling
to school:
In recent years, school travel plans have helped to increase the number of children walking to
school, mostly through walking school buses. This increase has not occurred for cycling.
There is strong evidence from New Zealand and overseas that active transport, including cycling to
school, has an important role for health benefits and in reducing obesity, which is an epidemic in
developed countries. There are also many other benefits.
There is evidence that children who regularly walk as a mode of transport are more likely to do so
as adults (and may be more likely to encourage their own children to do so), which may give
longer-term benefits to school active transport initiatives than are currently given.
There is a strong ‘demand’ for cycling to school, especially at intermediate school age. Generally,
approximately 20% of students want to cycle to school and are realistic cycling candidates, but this
varies between schools.
The main barrier to cycling to school is the traffic environment and lack of infrastructure provision
at busy traffic locations, and related to this, parental concerns about their child’s safety.
For children cycling to school, parents place a high priority on safe routes to school, cycle training,
secure bike storage and slow zones, but there is also support for high-visibility clothing. Other
initiatives such as cycle monitors or officers, bike buddies and cycle trains may also be useful but
are probably less well known or supported among parents.
Overseas initiatives (including the development of safer routes, education, training and bike
storage) to increase the number of students cycling to school have been successful.
There appear to be different cycling participation rates and perceptions of safety requirements for
cycling in different parts of the country. Auckland may be a region that faces larger challenges
than other regions, and may need particular attention if a significant increase in cycling to school
is desired.
Based on the key points above, the main recommendations for promoting cycling to school at a
nationwide level are as follows:
5 Discussion
41
1 Genuinely safe and attractive school cycle networks should be implemented or given higher
priority
Taking a step beyond the routes to school that students plan for themselves in conjunction with
their parents or with their school/TLA (eg Bike Better in Auckland city), school cycle networks
should be developed. For school cycle networks, the focus should be on linking significant clusters
of students to the school using local streets, parks, pathways and share with care footpaths on
busier roads. Connectivity of routes is very important. Formalised crossings should be bike friendly
unless they are very close to the school, where students can be expected to dismount and push
their bike. At some problem locations a deliberate shift in priority from motorists to cyclists would
greatly enhance the amenity of a school cycle network. It should be noted that where possible the
area’s existing cycle network should be used. However, existing cycle networks that have been
identified by TLAs often have adult cyclists in mind and elements are often not suitable for younger
cyclists.
Having identified routes to school would have the effect of increasing the concentration of cyclists
in places. This is likely to result in a greater awareness of cyclists on the route by motorists.
Sufficient engineering should be carried out to make the bike network genuinely safe and
attractive. At the moment many traffic environments make it understandable that parents won’t let
their children cycle to school. However, if there is a heavy reliance on quieter residential roads,
parks, reserves, pathways etc then the majority of engineering works may be needed at a few
trouble spots where busy roads must be negotiated. For example, a wider share with care footpath
might be constructed to link the residential road network safely and easily with a signalised
crossing on a busy arterial.
Separating younger cyclists from traffic as opposed to integrating them with traffic as legitimate
road users is likely to be a cause of debate. In some regions there might be a preference for
intermediate school-level cyclists joining the traffic as adult cyclists might. If this approach is
adopted it is strongly recommended that steps be taken to significantly change driver behaviour on
the roads used by school cyclists and that the priority of cyclists is significantly elevated when
engineering upgrades are considered.
Further thought needs to be given to lower speed limits, not only around schools, but within the
wider road network. Earlier in this report examples of literature that demonstrate widespread gains
from lower speed limits were given. Current work on a national road hierarchy and its functional
elements, such as the desired speeds at each level of a hierarchy, and concepts such as self-
explaining roads and liveable streets have significant implications for school active transport.
There should be a heavier emphasis on the school cycle network closer to the school to ensure
maximal usage. Further away, students can link in to the school network with their own planned
routes to school.
There should be an associated publicity and education process to accompany school cycle
networks. This may include coloured road markings, signage along the route or publicity within the
school, community or nation. Whatever the approach, it is crucial that parents are targeted as part
of the publicity in order to help alleviate their fears about their child’s safety. Promotion of a
proposed school cycle network is important so that the potential of engineering improvements is
realised. Like a cake, promotional activities may be the ‘baking powder’ needed to activate the
increased use of improved engineering measures. The goal should be the establishment of a
‘I want to ride my bike’: overcoming barriers to cycling to intermediate schools
42
culture of cycling at schools. This cycling culture certainly appears to be a hallmark of schools
where cycling to school is more common.
Students and parents should be part of the school cycle network planning process. Existing school
travel plan processes already engage students and parents and should be used to plan for school
cycling facilities. Given the growth potential of cycling to school, it is recommended that greater
priority is given to cycling initiatives within school travel plans in the future. For additional
guidance on school cycle route development, the Department for Transport ‘Links to Schools’
programme (Department for Transport 2006) offers useful material.
If school cycle networks are carefully planned, there will also be benefits for pedestrians and the
wider community. For example, a wider, strategically placed section of a share with care path will
not only provide an attractive route for cycling to school, but will make it safer and more attractive
for students walking to school and other pedestrians within the community. If extra space is
needed to create the path, using road space can help to narrow the road and slow traffic and give a
signal that for this section of road, there is a change in emphasis from through traffic to school
active travel. There are a number of overseas examples where ‘road diets’ have retained traffic
throughput while creating a much more user friendly environment for pedestrians and cyclists
(Burden and Lagerwey 1999).
Benefits and costs. In the NZTA EEM, standardised ‘benefits’ are given to school travel plans on a
per student, per year basis. For secondary and intermediate schools a typical school travel plan
budget in Auckland might be in the order of $200,000–$300,000 for the engineering works
required to improve amenity for walking and cycling. Economies of scale can be achieved by
clustering schools that use common infrastructure. This usually happens where there is any
combination of primary, intermediate or secondary schools in the same area.
In the short to medium term, engineering for school cycle networks will need to cost no more than
typical school travel plan budgets, and probably less, so that walking and other safety measures
can also be provided. There are obviously advantages of infrastructure that provides for walking as
well as cycling. Some work may be able to be funded or partly funded out of footpath upgrade
programmes.
Funding for transport projects will always be an issue, yet the development of school cycle
networks may not be as costly as expected, although this will depend heavily on the length of
shared footpath that is required. This research has demonstrated that intermediate school
students are happy to ride on quiet residential roads without any further infrastructure provision.
In many cases, in order to reach their school, the residential road network (and its associated
short-cuts through pathways and reserves) can account for a good proportion of a student’s trip
by bike. Often the problem areas are short lengths of arterial road connecting the residential road
network to a signalised crossing or crossings at a few key points and upgrades at these locations
may be manageable within current levels of funding.
A mixture of concentrated engineering at problem areas, and education/publicity at other parts of
the school cycle network, might be sufficient to provide acceptable routes to school. The course
notes for the Land Transport NZ (now NZTA) cycling course Fundamentals of planning and design
for cycling (Wilke 2008) give approximate costs for various treatments to which costs from other
sources have been added (table 5.1). Clearly these costs may vary, but in order to estimate the
approximate magnitude of expenditure that might be required for the routes that have been
proposed within this project some example costs are given:
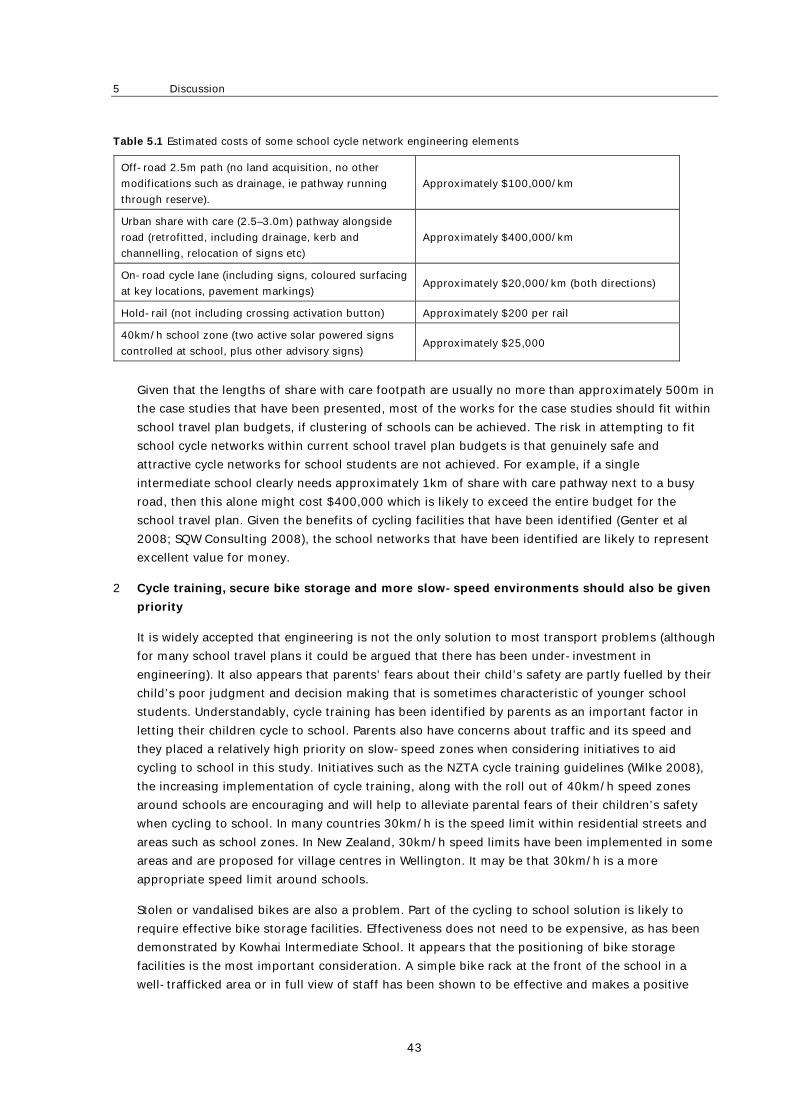
5 Discussion
43
Table 5.1 Estimated costs of some school cycle network engineering elements
Off-road 2.5m path (no land acquisition, no other
modifications such as drainage, ie pathway running
through reserve).
Approximately $100,000/km
Urban share with care (2.5–3.0m) pathway alongside
road (retrofitted, including drainage, kerb and
channelling, relocation of signs etc)
Approximately $400,000/km
On-road cycle lane (including signs, coloured surfacing
at key locations, pavement markings) Approximately $20,000/km (both directions)
Hold-rail (not including crossing activation button) Approximately $200 per rail
40km/h school zone (two active solar powered signs
controlled at school, plus other advisory signs) Approximately $25,000
Given that the lengths of share with care footpath are usually no more than approximately 500m in
the case studies that have been presented, most of the works for the case studies should fit within
school travel plan budgets, if clustering of schools can be achieved. The risk in attempting to fit
school cycle networks within current school travel plan budgets is that genuinely safe and
attractive cycle networks for school students are not achieved. For example, if a single
intermediate school clearly needs approximately 1km of share with care pathway next to a busy
road, then this alone might cost $400,000 which is likely to exceed the entire budget for the
school travel plan. Given the benefits of cycling facilities that have been identified (Genter et al
2008; SQW Consulting 2008), the school networks that have been identified are likely to represent
excellent value for money.
2 Cycle training, secure bike storage and more slow-speed environments should also be given
priority
It is widely accepted that engineering is not the only solution to most transport problems (although
for many school travel plans it could be argued that there has been under-investment in
engineering). It also appears that parents’ fears about their child’s safety are partly fuelled by their
child’s poor judgment and decision making that is sometimes characteristic of younger school
students. Understandably, cycle training has been identified by parents as an important factor in
letting their children cycle to school. Parents also have concerns about traffic and its speed and
they placed a relatively high priority on slow-speed zones when considering initiatives to aid
cycling to school in this study. Initiatives such as the NZTA cycle training guidelines (Wilke 2008),
the increasing implementation of cycle training, along with the roll out of 40km/h speed zones
around schools are encouraging and will help to alleviate parental fears of their children’s safety
when cycling to school. In many countries 30km/h is the speed limit within residential streets and
areas such as school zones. In New Zealand, 30km/h speed limits have been implemented in some
areas and are proposed for village centres in Wellington. It may be that 30km/h is a more
appropriate speed limit around schools.
Stolen or vandalised bikes are also a problem. Part of the cycling to school solution is likely to
require effective bike storage facilities. Effectiveness does not need to be expensive, as has been
demonstrated by Kowhai Intermediate School. It appears that the positioning of bike storage
facilities is the most important consideration. A simple bike rack at the front of the school in a
well-trafficked area or in full view of staff has been shown to be effective and makes a positive
‘I want to ride my bike’: overcoming barriers to cycling to intermediate schools
44
statement that cycling to school is important. It is acknowledged that some schools may prefer
lockable and/or sheltered facilities.
Other initiatives such as bike officers, cycle trains and bike buddies may also be appropriate for
certain schools. Bike officers have been used very successfully in the United Kingdom.
3 By more carefully considering the benefits that cycling to school (and active transport in
general) delivers, greater priority should be given to school active transport projects and in
particular school cycle network projects.
In New Zealand, walking and cycling in general are still seen as relatively trivial components of the
transport system. Meanwhile most developed countries have acknowledged that obesity has reached
epidemic proportions and that transport is one of the greatest greenhouse gas emitters, neither of
which is a trivial matter. There is increasing evidence that walking and cycling can have a significant
part in the solution for these issues if there is genuine provision for these modes. Cycling to school
declined significantly over the last few decades, yet this is where future active transport growth could
come from. Cycling has a longer range than walking so is more likely to replace car trips at school
age and then later in adulthood. Greater provision (and therefore funding) for school cycle networks
will help to ‘future proof’ our transport system and overall well-being.
Transport is essentially a human system – people are at the core of all types of transport. As we
learn that transport must increasingly serve the needs of people, including their health and the
health of their environments and communities, there will be increased pressure to provide for
active transport modes, including cycling to school.
5.3 Future research and strategic leadership
The next step towards more students cycling to school could be the development, implementation and
evaluation of a ‘model cycling school’. Using the findings of this research as a starting point, this might
involve the implementation of a package of cycling interventions for a school. Cycling uptake and
students’ and parents’ perceptions could be measured to evaluate the effectiveness of the cycling
interventions. Such an exercise may help to provide a better understanding of the level of intervention
and amenity that is required for cycling to school and alleviate the concerns of parents and transport
authorities who might be reluctant to promote cycling to school.
Further information about the health, environmental and community benefits of cycling is needed so
that cycling can be objectively prioritised within land transport programmes. The few studies that have
begun to address this have already helped in this regard.
The lack of attention given to cycling to school in New Zealand may be partly due to a lack of
leadership regarding the wider school transport system, and how school transport fits within the wider
transport system. Other countries such as the United Kingdom and Australia have this leadership and
in these countries it is clear what outcomes are desired for school transport. In New Zealand, aims and
objectives and a corresponding plan of action for the wider school transport system need to be
developed. This would help to pull together and build on some excellent, yet fragmented, existing
work programmes and identify gaps where further work is needed.
6 Conclusion
45
6 Conclusion
There is evidence that active transport has many (and possibly understated) benefits and that more
students would like to cycle to school than currently do so. This research has confirmed that the
greatest barrier to cycling to school (from both student and parent perspectives) is the route to school
or more specifically, high traffic volumes and speed and problematic crossings. In order to overcome
barriers to cycling to school it is proposed that the development of genuinely safe and attractive school
cycle networks, cycle training, effective bike storage and the continued implementation of slow zones
around schools (or widespread lower speed limits) be implemented or given higher priority. Supporting
education for parents would also help to alleviate their fears for their children’s safety and possibly
make them more likely to allow their child to cycle to school. In general, higher priority should be given
to active transport, and in particular, school cycling projects within land transport funding programmes
and within New Zealand’s transport system in general. Greater leadership is also needed within the
wider area of school transport. Only then will New Zealand realise the benefits that cycling to school
has to offer.
‘I want to ride my bike’: overcoming barriers to cycling to intermediate schools
46
7 References
Auckland Regional Authority (1980) Cycling in Auckland. Interim Report by the Auckland bicycle
planning committee.
Auckland Regional Transport Authority (ARTA) (2008) Manual cycle monitoring in the Auckland region
March 2008 (Prepared for Regional Cycle Monitoring Working Group by Gravitas Research and
Strategy Limited). Accessed 20 July 2009. www.arta.co.nz/home/regional_cycle_monitoring.html
Andersen, L, P Schnohr, M Schroll and H Hein (2000) All-cause mortality associated with physical
activity during leisure time, work, sports, and cycling to work. Arch Intern Med 160: 1621–1628.
Austroads (1999) Guide to traffic engineering practice – part 1: bicycles. Sydney: Austroads
Badland, HM and GM Schofield (2008) Health associations with transport related physical activity and
motorised travel to destinations. International Journal of Sustainable Transportation 2: 77–90.
British Medical Association (1992) Cycling: towards health and safety. London: BMA.
Brude, U and J Larsson (1993) Models for predicting accidents at junctions where pedestrians and
cyclists are involved. How well do they fit? Accident Analysis and Prevention 25: 499–509.
Burden, D and P Lagerwey (1999) Road diets, fixing the big roads. Accessed 16 June 2009.
www.walkable.org/assets/downloads/roaddiets.pdf
Department for Transport (2004) Children’s road traffic safety: an international survey of policy and
practice. Road Safety Research Report no. 47. London.
Department for Transport (2004a) Travelling to school: an action plan. Accessed 10 June 2009.
www.dft.gov.uk/pgr/sustainable/schooltravel/travelling/
Department for Transport (2006) Walking and cycling: links to schools. Accessed 17 June 2009.
www.dft.gov.uk/pgr/sustainable/cycling/kingandcyclinglinkstoschools.pdf
Department for Transport (2008) A sustainable future for cycling. Accessed 17 June 2009.
www.dft.gov.uk/pgr/sustainable/cycling/cyclingfuture.pdf
Department for Transport (2009) A safer way: Consultation on making Britain’s roads the safest in the
world. Accessed 10 June 2009. www.dft.gov.uk/consultations/open/roadsafetyconsultation/
Foresight (2007) Tackling obesities: future choices – project report. United Kingdom: Government
Office for Science.
Genter J A, S Donovan, B Petrenas and H Badland (2008) Valuing the health benefits of active transport
modes. NZ Transport Agency research report no. 359. 72pp.
Hayashi, T, K Tsumura, C Suematsu, K Okada, S Fujii and G Endo (1999) Walking to work and the risk
for hypertension in men: the Osaka health survey. Annals of Internal Medicine 130: 21–26.
Hinckson, E, N Snowling, P Batts, H Badland and G Schofield (2007) Auckland Regional Transport
Authority school travel plan evaluation 2007. Auckland: AUT University.
7 References
47
Horspool, B (2006) Tempting teenagers to cycle. North Shore City Council Strategic Cycling Plan 2003.
New Zealand: North Shore City.
Hou, L, J Bu-Tian, A Blair, Q Dai, Y Gao and W Chow (2004) Commuting physical activity and risk of
colon cancer in Shanghai, China. American Journal of Epidemiology 160, no. 9: 860–867.
Hu, G, H Pekkarinen, O Hanninen, H Tian and Z Guo (2001) Relation between commuting, leisure time
physical activity and serum lipids in a Chinese urban population. Annals of Human Biology 28,
no. 4: 412–421.
Hu, G, H Pekkarinen, O Hanninen, Z Yu, Z Guo and H Tian (2002) Commuting, leisure-time physical
activity, and cardiovascular risk factors in China. Medicine & Science in Sports & Exercise 34, no. 2:
234–238.
Injury Prevention Research Unit (2007) Child injury: deaths and hospitalisations. Factsheet no. 40.
Dunedin: University of Otago.
Jacobsen, PL (2003) Safety in numbers: More walkers and bicyclists, safer walking and bicycling. Injury
Prevention 9: 205–209.
Johnson, A (2008) Land Transport NZ Neighbourhood accessibility planning case study research.
Accessed 08 June 2009. www.landtransport.govt.nz/road-user-safety/walking-and-
cycling/neighbourhood-accessibility-planning/docs/nap-case-studies-2008.pdf
Land Transport Safety Authority (LTSA) (2004). Cycle network and route planning guide. Accessed 8
April 2009. www.ltsa.govt.nz/road-user-safety/walking-and-cycling/cycle-network/docs/cycle-
network.pdf
Ministry of Health (2009) Obesity in New Zealand. Accessed 11 June 2009. www.moh.govt.nz/obesity
Ministry of Health (2004) A portrait of health: key results of the 2002/03 New Zealand health survey.
Wellington.
Ministry of Transport (2005) Getting there – on foot, by cycle. Wellington. Accessed 15 June 2009.
www.transport.govt.nz/ourwork/Land/Gettingthere-onfoot,bycycle
Ministry of Transport (2008) New Zealand transport strategy 2008. Accessed 19 June 2009.
www.transport.govt.nz/ourwork/Documents/NZTS2008.pdf
Ministry of Transport (2008) Raising the profile of walking and cycling in New Zealand. A guide for
decision makers. Accessed 26 June 2009.
www.transport.govt.nz/ourwork/Documents/RaisingtheProfileWalkingCyclinginNZ.pdf
New Zealand Government (2009) Government policy statement on land transport funding 2009/10–
2018/19. Accessed 25 June 2009. www.transport.govt.nz/Documents/Final-GPS-May-09.pdf
New Zealand Transport Agency (2008) Cyclist skills training: a guide for the set-up and delivery of
cyclist training in New Zealand. Wellington: NZTA.
OECD (2004) Keeping children safe in traffic.
O’Fallon, C (2007) Developing school-based cycle trains in New Zealand. Land Transport NZ research
report no. 338.
‘I want to ride my bike’: overcoming barriers to cycling to intermediate schools
48
Pucher, J and R Buehler (2008) Making cycling irresistible: lessons from the Netherlands, Denmark, and
Germany. Transport Review 28, no. 4.
Queensland Government (2005) School environment safety guidelines. Queensland, Australia.
SQW Consulting (2008). Planning for cycling. Report to Cycling England.
www.cyclingengland.co.uk/site/wp-content/uploads/2009/03/planning-for-cycling-report-10-3-
09.pdf
Sustrans (2009) BikeIT. Accessed 05 June 2009. www.sustrans.org.uk/what-we-do/bike-it
Thomson, L (2009) How times have changed. Active transport literature review. VicHealth. Accessed 05
June 2009. www.vichealth.vic.gov.au
Turner, SA, AP Roozenburg and T Francis, (2006) Predicting accident rates for cyclists and pedestrians.
Land Transport NZ research report no.289. 180pp.
US Department of Health and Human Services (1996) A report of the surgeon general. Accessed 10
February 2009. www.cdc.gov/nccdphp/sgr/sgr.htm
Wagner, A, C Simon, P Ducimetiere, M Montaye, V Bongard, J Yarnell, A Bingham, G Hedelin, P Amouyel,
J Ferrieres, A Evans and D Arveiler (2001) Leisure-time physical activity and regular walking or
cycling to work are associated with adiposity and 5y weight gain in middle-aged men: the PRIME
study. International Journal of Obesity 25: 940–948.
Wegman, F, A Dijkstra, G Schermers and P van Vliet, P (2005) Sustainable Safety in the Netherlands: the
vision, the implementation and the safety effects. Contribution to the 3rd International Symposium
on Highway Geometric Design. 26 June –2 July 2005, Chicago, Illinois.
Western Australian Local Government Association (WALGA) (2007) Guidelines for road safety around
schools. Western Australia.
Wigmore, B J, CP Baas, WB Wade and PH Baas (2007) School journey safety: a comparative study of
engineering devices. Land Transport NZ research report no. 271.
Wilke, A (2008) Fundamentals of planning and design for cycling. Course notes, version 3.4.
Wellington: Land Transport NZ.
World Health Organisation (WHO) (2000) Obesity, preventing and managing the global epidemic. WHO
Technical Report Series 894. Geneva.
Ziviani, J, J Scott and D Wadley (2004) Walking to school: incidental physical activity in the daily
occupations of Australian Children. Occupational Therapy International 11, no. 1.
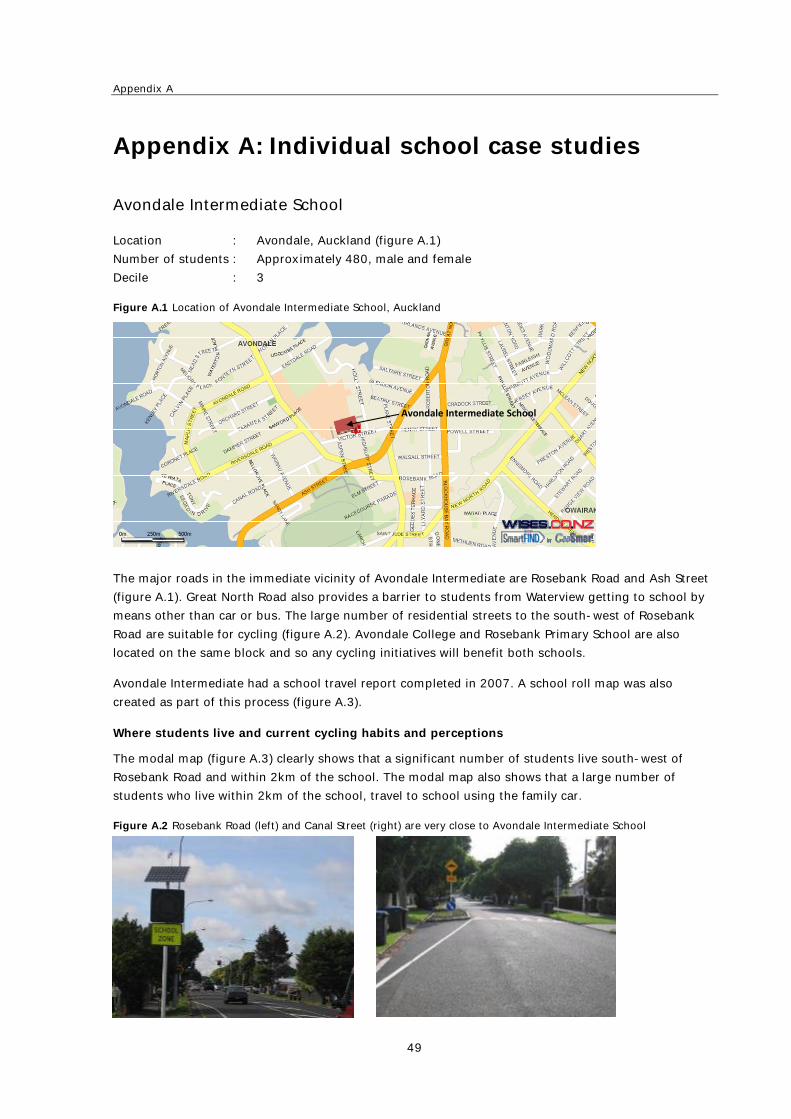
Appendix A
49
Appendix A: Individual school case studies
Avondale Intermediate School
Location : Avondale, Auckland (figure A.1)
Number of students : Approximately 480, male and female
Decile : 3
Figure A.1 Location of Avondale Intermediate School, Auckland
The major roads in the immediate vicinity of Avondale Intermediate are Rosebank Road and Ash Street
(figure A.1). Great North Road also provides a barrier to students from Waterview getting to school by
means other than car or bus. The large number of residential streets to the south-west of Rosebank
Road are suitable for cycling (figure A.2). Avondale College and Rosebank Primary School are also
located on the same block and so any cycling initiatives will benefit both schools.
Avondale Intermediate had a school travel report completed in 2007. A school roll map was also
created as part of this process (figure A.3).
Where students live and current cycling habits and perceptions
The modal map (figure A.3) clearly shows that a significant number of students live south-west of
Rosebank Road and within 2km of the school. The modal map also shows that a large number of
students who live within 2km of the school, travel to school using the family car.
Figure A.2 Rosebank Road (left) and Canal Street (right) are very close to Avondale Intermediate School
Avondale Intermediate School
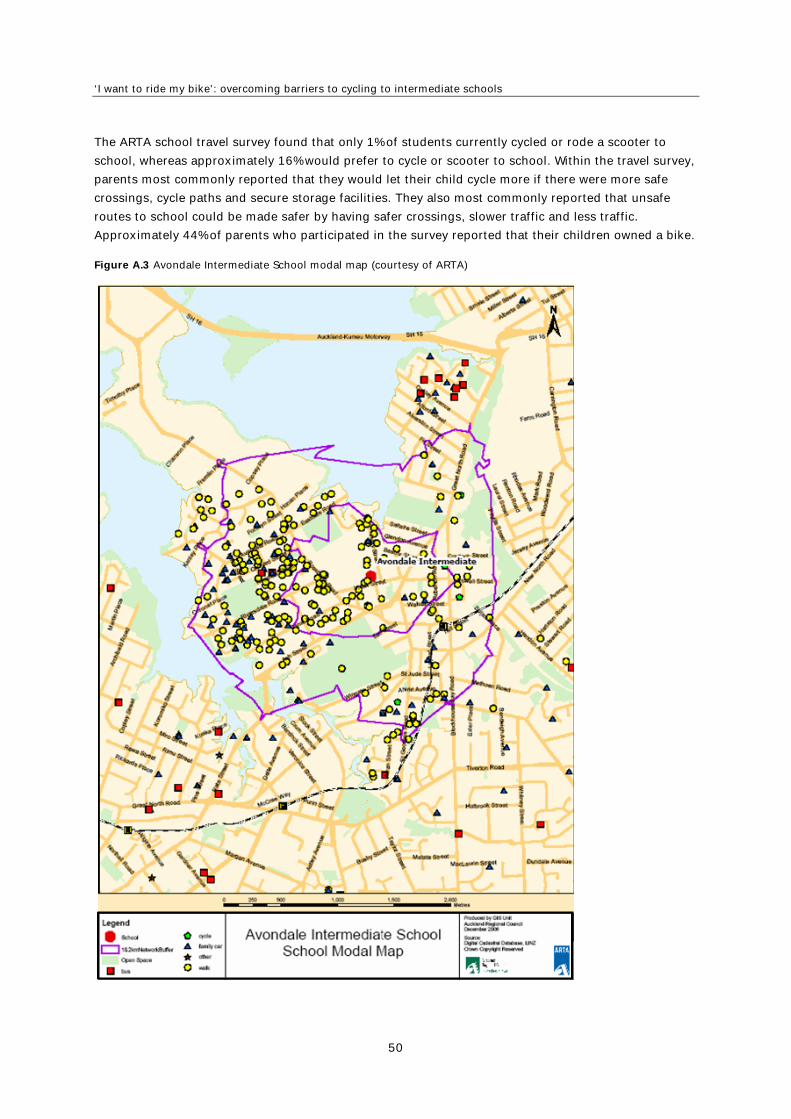
‘I want to ride my bike’: overcoming barriers to cycling to intermediate schools
50
The ARTA school travel survey found that only 1% of students currently cycled or rode a scooter to
school, whereas approximately 16% would prefer to cycle or scooter to school. Within the travel survey,
parents most commonly reported that they would let their child cycle more if there were more safe
crossings, cycle paths and secure storage facilities. They also most commonly reported that unsafe
routes to school could be made safer by having safer crossings, slower traffic and less traffic.
Approximately 44% of parents who participated in the survey reported that their children owned a bike.
Figure A.3 Avondale Intermediate School modal map (courtesy of ARTA)
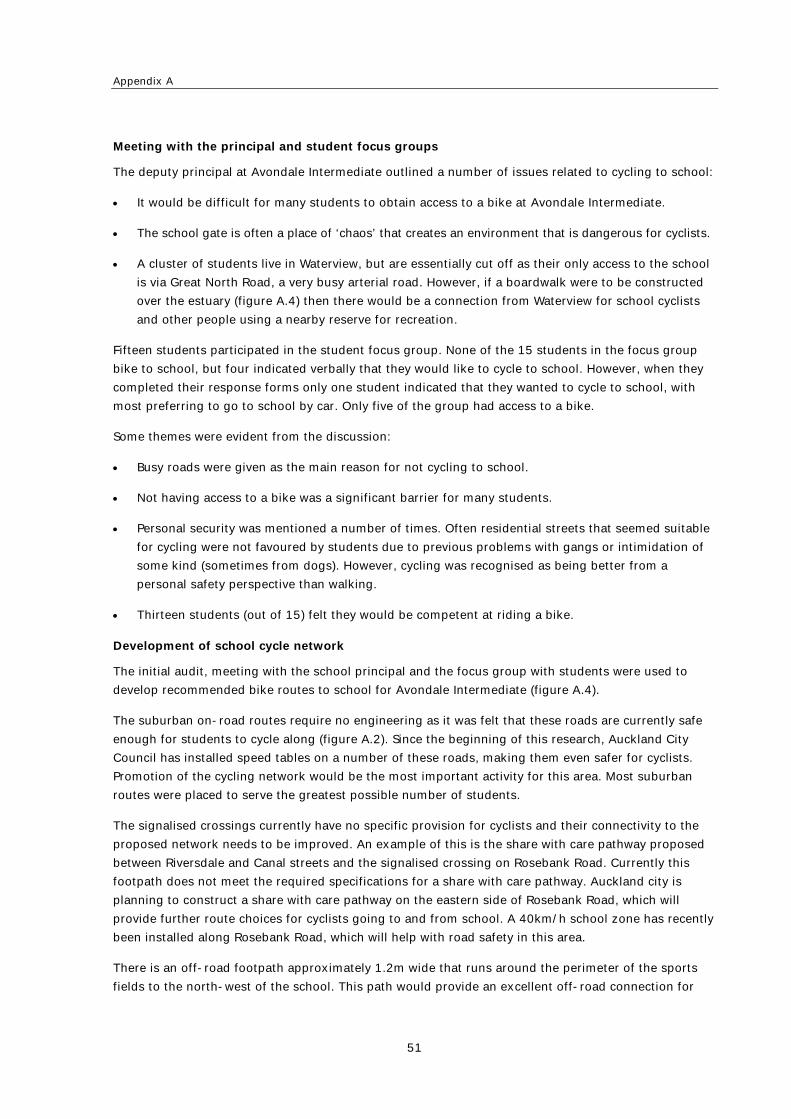
Appendix A
51
Meeting with the principal and student focus groups
The deputy principal at Avondale Intermediate outlined a number of issues related to cycling to school:
It would be difficult for many students to obtain access to a bike at Avondale Intermediate.
The school gate is often a place of ‘chaos’ that creates an environment that is dangerous for cyclists.
A cluster of students live in Waterview, but are essentially cut off as their only access to the school
is via Great North Road, a very busy arterial road. However, if a boardwalk were to be constructed
over the estuary (figure A.4) then there would be a connection from Waterview for school cyclists
and other people using a nearby reserve for recreation.
Fifteen students participated in the student focus group. None of the 15 students in the focus group
bike to school, but four indicated verbally that they would like to cycle to school. However, when they
completed their response forms only one student indicated that they wanted to cycle to school, with
most preferring to go to school by car. Only five of the group had access to a bike.
Some themes were evident from the discussion:
Busy roads were given as the main reason for not cycling to school.
Not having access to a bike was a significant barrier for many students.
Personal security was mentioned a number of times. Often residential streets that seemed suitable
for cycling were not favoured by students due to previous problems with gangs or intimidation of
some kind (sometimes from dogs). However, cycling was recognised as being better from a
personal safety perspective than walking.
Thirteen students (out of 15) felt they would be competent at riding a bike.
Development of school cycle network
The initial audit, meeting with the school principal and the focus group with students were used to
develop recommended bike routes to school for Avondale Intermediate (figure A.4).
The suburban on-road routes require no engineering as it was felt that these roads are currently safe
enough for students to cycle along (figure A.2). Since the beginning of this research, Auckland City
Council has installed speed tables on a number of these roads, making them even safer for cyclists.
Promotion of the cycling network would be the most important activity for this area. Most suburban
routes were placed to serve the greatest possible number of students.
The signalised crossings currently have no specific provision for cyclists and their connectivity to the
proposed network needs to be improved. An example of this is the share with care pathway proposed
between Riversdale and Canal streets and the signalised crossing on Rosebank Road. Currently this
footpath does not meet the required specifications for a share with care pathway. Auckland city is
planning to construct a share with care pathway on the eastern side of Rosebank Road, which will
provide further route choices for cyclists going to and from school. A 40km/h school zone has recently
been installed along Rosebank Road, which will help with road safety in this area.
There is an off-road footpath approximately 1.2m wide that runs around the perimeter of the sports
fields to the north-west of the school. This path would provide an excellent off-road connection for
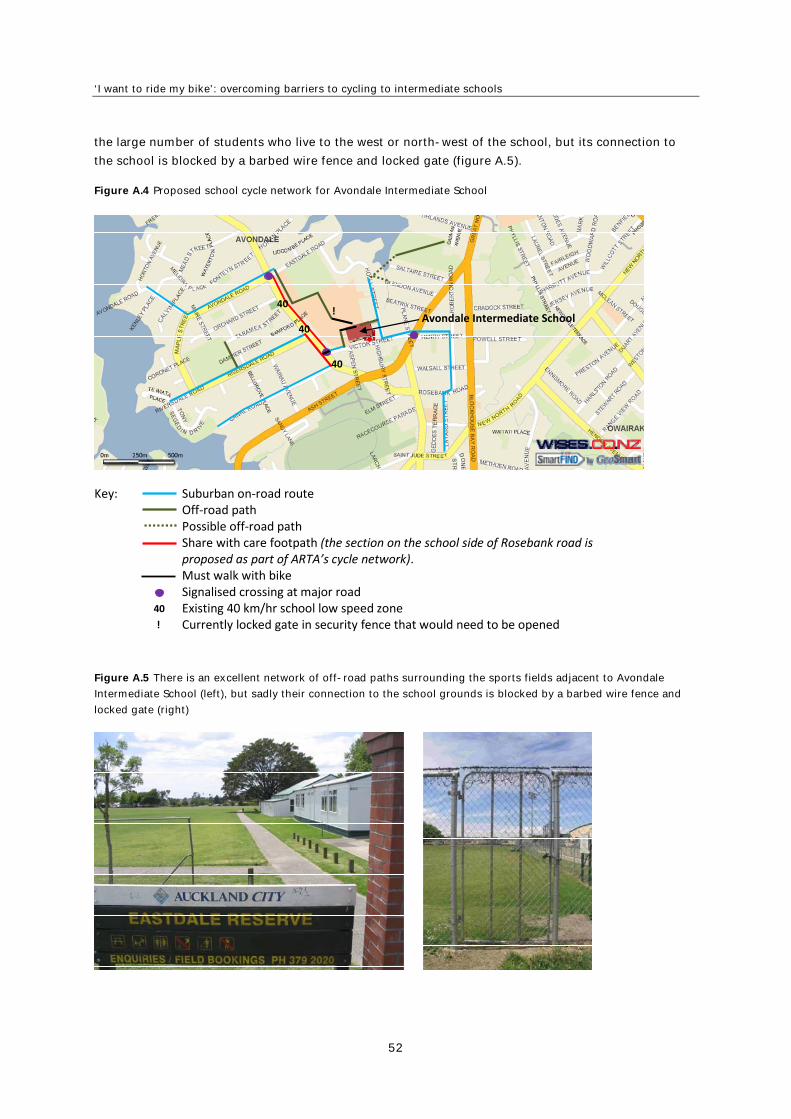
‘I want to ride my bike’: overcoming barriers to cycling to intermediate schools
52
the large number of students who live to the west or north-west of the school, but its connection to
the school is blocked by a barbed wire fence and locked gate (figure A.5).
Figure A.4 Proposed school cycle network for Avondale Intermediate School
Figure A.5 There is an excellent network of off-road paths surrounding the sports fields adjacent to Avondale
Intermediate School (left), but sadly their connection to the school grounds is blocked by a barbed wire fence and
locked gate (right)
Key: Suburban on‐road route Off‐road path Possible off‐road path Share with care footpath (the section on the school side of Rosebank road is proposed as part of ARTA’s cycle network). Must walk with bike Signalised crossing at major road Existing 40 km/hr school low speed zone Currently locked gate in security fence that would need to be opened
!Avondale Intermediate School
40
40
40
!
40
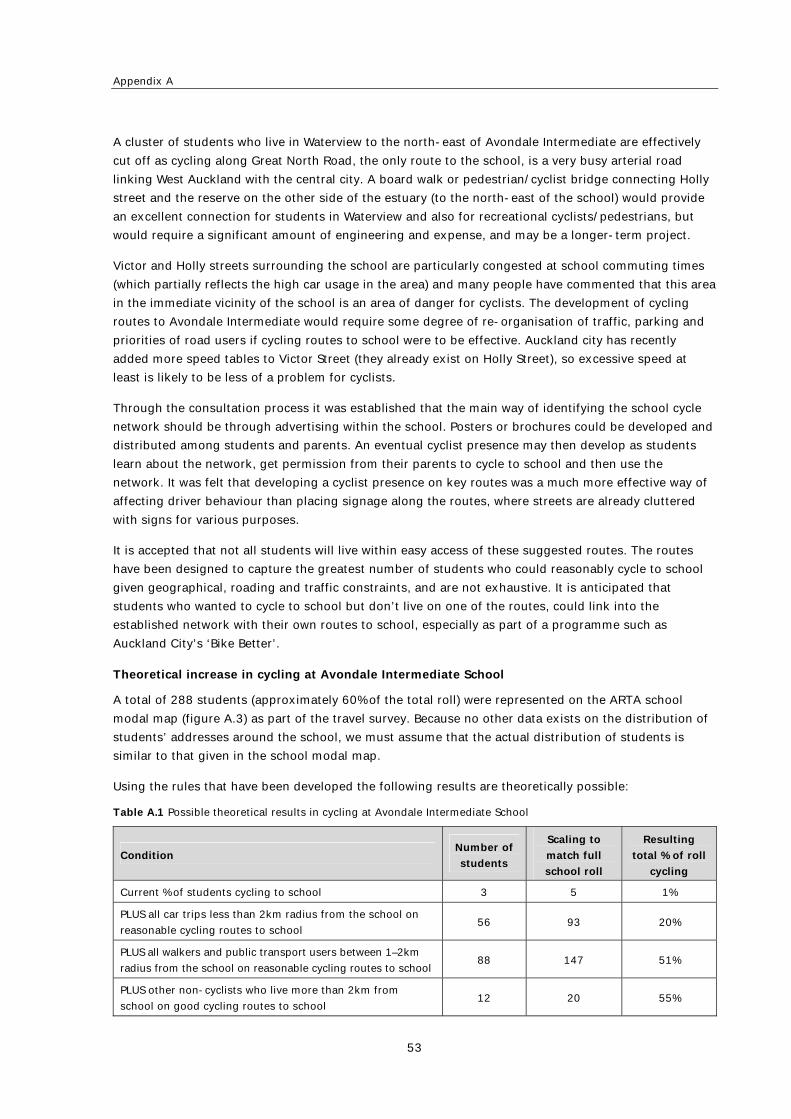
Appendix A
53
A cluster of students who live in Waterview to the north-east of Avondale Intermediate are effectively
cut off as cycling along Great North Road, the only route to the school, is a very busy arterial road
linking West Auckland with the central city. A board walk or pedestrian/cyclist bridge connecting Holly
street and the reserve on the other side of the estuary (to the north-east of the school) would provide
an excellent connection for students in Waterview and also for recreational cyclists/pedestrians, but
would require a significant amount of engineering and expense, and may be a longer-term project.
Victor and Holly streets surrounding the school are particularly congested at school commuting times
(which partially reflects the high car usage in the area) and many people have commented that this area
in the immediate vicinity of the school is an area of danger for cyclists. The development of cycling
routes to Avondale Intermediate would require some degree of re-organisation of traffic, parking and
priorities of road users if cycling routes to school were to be effective. Auckland city has recently
added more speed tables to Victor Street (they already exist on Holly Street), so excessive speed at
least is likely to be less of a problem for cyclists.
Through the consultation process it was established that the main way of identifying the school cycle
network should be through advertising within the school. Posters or brochures could be developed and
distributed among students and parents. An eventual cyclist presence may then develop as students
learn about the network, get permission from their parents to cycle to school and then use the
network. It was felt that developing a cyclist presence on key routes was a much more effective way of
affecting driver behaviour than placing signage along the routes, where streets are already cluttered
with signs for various purposes.
It is accepted that not all students will live within easy access of these suggested routes. The routes
have been designed to capture the greatest number of students who could reasonably cycle to school
given geographical, roading and traffic constraints, and are not exhaustive. It is anticipated that
students who wanted to cycle to school but don’t live on one of the routes, could link into the
established network with their own routes to school, especially as part of a programme such as
Auckland City’s ‘Bike Better’.
Theoretical increase in cycling at Avondale Intermediate School
A total of 288 students (approximately 60% of the total roll) were represented on the ARTA school
modal map (figure A.3) as part of the travel survey. Because no other data exists on the distribution of
students’ addresses around the school, we must assume that the actual distribution of students is
similar to that given in the school modal map.
Using the rules that have been developed the following results are theoretically possible:
Table A.1 Possible theoretical results in cycling at Avondale Intermediate School
Condition Number of
students
Scaling to
match full
school roll
Resulting
total % of roll
cycling
Current % of students cycling to school 3 5 1%
PLUS all car trips less than 2km radius from the school on
reasonable cycling routes to school 56 93 20%
PLUS all walkers and public transport users between 1–2km
radius from the school on reasonable cycling routes to school 88 147 51%
PLUS other non-cyclists who live more than 2km from
school on good cycling routes to school 12 20 55%
‘I want to ride my bike’: overcoming barriers to cycling to intermediate schools
54
This would require that all students have access to a bike, that the suggested cycle routes to school are
constructed to required specifications and that students have the necessary skills to cycle to school (a
cycle skills programme would also be required). These theoretical figures are unlikely, but give an
indication of the maximum proportion of students who might cycle to school if they were given every
opportunity.
Parents’ survey
The rankings of parents’ preferred cycling initiatives for Avondale Intermediate are provided in
table 4.6 in section 4.4. Some of the more useful comments provided by parents in response to the
question, ‘What other things might be done to allow your child to cycle to school safely?’ are given
below:
My daughter is not really interested in cycling to school. There are three very busy roads to cross,
steep hills and prefers to walk with friends.
If the plan is really implemented, no problem. But I doubt the cars in the morning do not follow the
rules – they are unruly and speed up to any level after the intersection of Rata Street – signal lights
– rushes although up to Ash Street – Rosebank Road, then to Rosebank Road. This is very risky.
Specific recommendations for Avondale Intermediate
Rosebank Road clearly provides a barrier for students cycling to school and a reasonable amount of
engineering works is needed to provide a truly connected cycle route to school for the large number of
students who live to the west of Rosebank Road. Apart from this there are many opportunities for well-
connected routes to school, especially if the barbed wire gate at the rear of the school is opened
during commuting hours.
Because cycling to school at Avondale Intermediate is not yet a normal part of the school’s culture it is
recommended that cycling to school (along with other active travel initiatives) be promoted at the
board of trustees/management level in the first instance. When there is a higher level desire to
prioritise cycling to school, then the surrounding environment should allow some relatively cost-
effective initiatives to be implemented. Perhaps collaboration with Avondale College next door would
help. A programme that gives students access to a bike should also be prioritised.
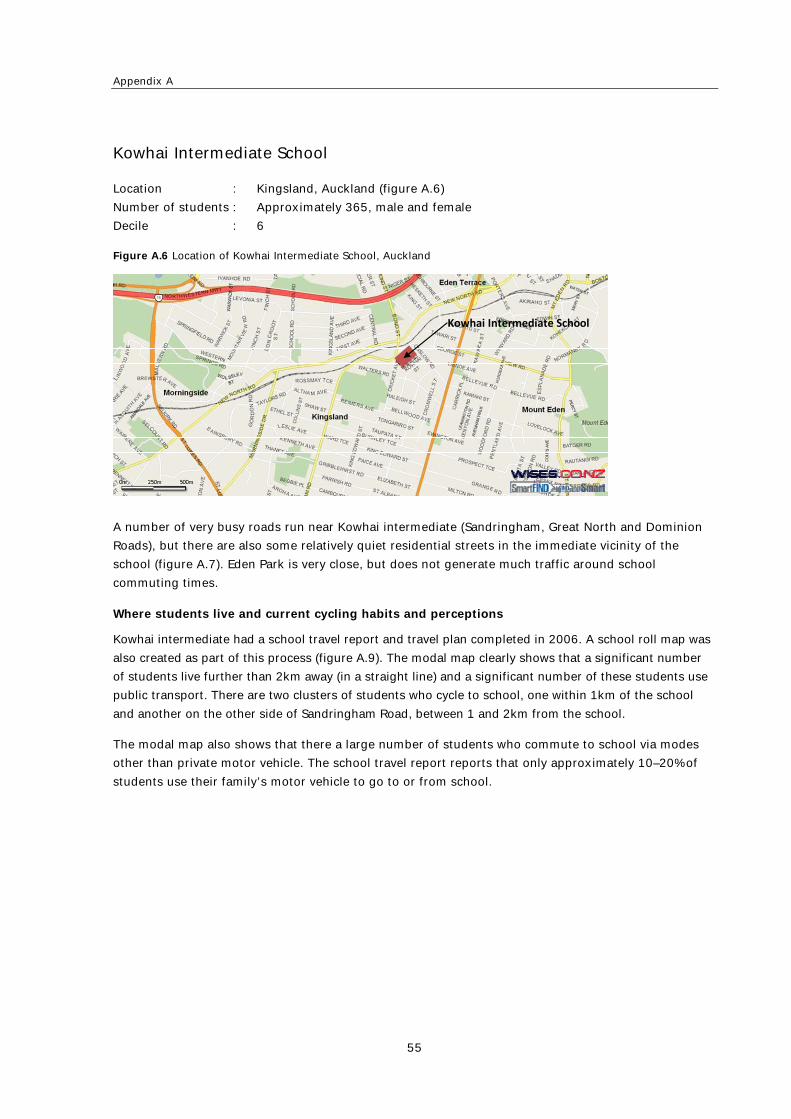
Appendix A
55
Kowhai Intermediate School
Location : Kingsland, Auckland (figure A.6)
Number of students : Approximately 365, male and female
Decile : 6
Figure A.6 Location of Kowhai Intermediate School, Auckland
A number of very busy roads run near Kowhai intermediate (Sandringham, Great North and Dominion
Roads), but there are also some relatively quiet residential streets in the immediate vicinity of the
school (figure A.7). Eden Park is very close, but does not generate much traffic around school
commuting times.
Where students live and current cycling habits and perceptions
Kowhai intermediate had a school travel report and travel plan completed in 2006. A school roll map was
also created as part of this process (figure A.9). The modal map clearly shows that a significant number
of students live further than 2km away (in a straight line) and a significant number of these students use
public transport. There are two clusters of students who cycle to school, one within 1km of the school
and another on the other side of Sandringham Road, between 1 and 2km from the school.
The modal map also shows that there a large number of students who commute to school via modes
other than private motor vehicle. The school travel report reports that only approximately 10–20% of
students use their family’s motor vehicle to go to or from school.
Kowhai Intermediate School
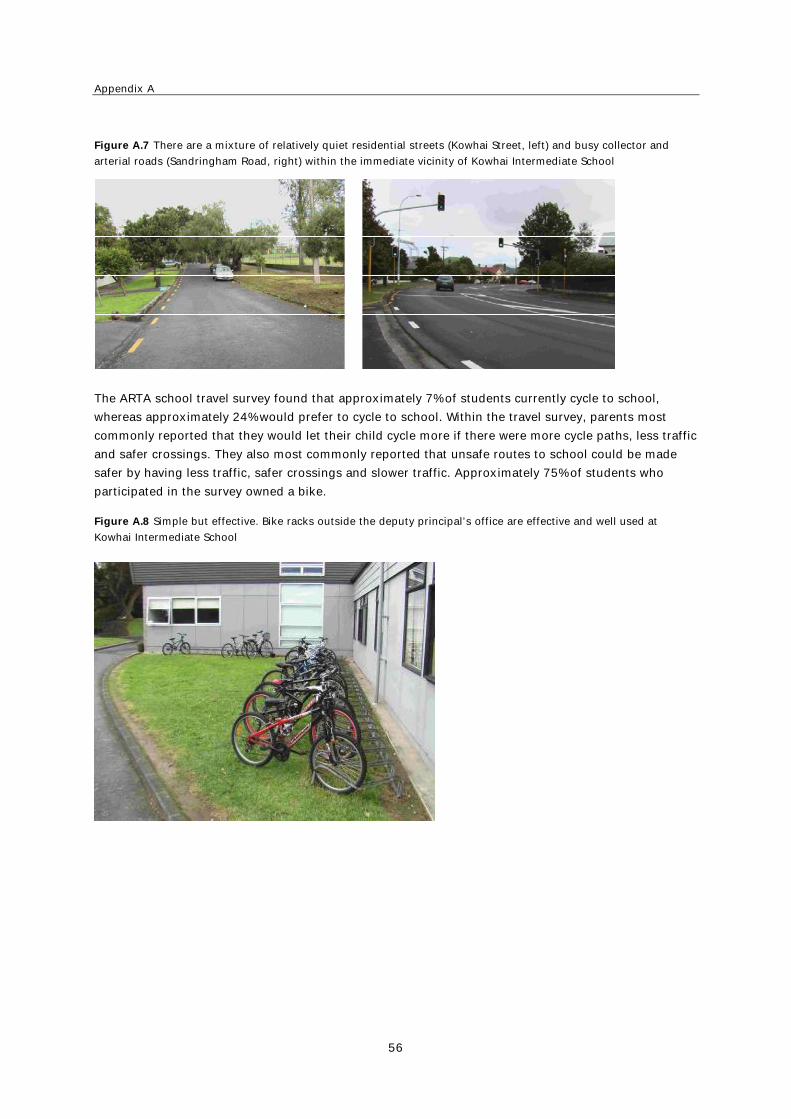
Appendix A
56
Figure A.7 There are a mixture of relatively quiet residential streets (Kowhai Street, left) and busy collector and
arterial roads (Sandringham Road, right) within the immediate vicinity of Kowhai Intermediate School
The ARTA school travel survey found that approximately 7% of students currently cycle to school,
whereas approximately 24% would prefer to cycle to school. Within the travel survey, parents most
commonly reported that they would let their child cycle more if there were more cycle paths, less traffic
and safer crossings. They also most commonly reported that unsafe routes to school could be made
safer by having less traffic, safer crossings and slower traffic. Approximately 75% of students who
participated in the survey owned a bike.
Figure A.8 Simple but effective. Bike racks outside the deputy principal’s office are effective and well used at
Kowhai Intermediate School
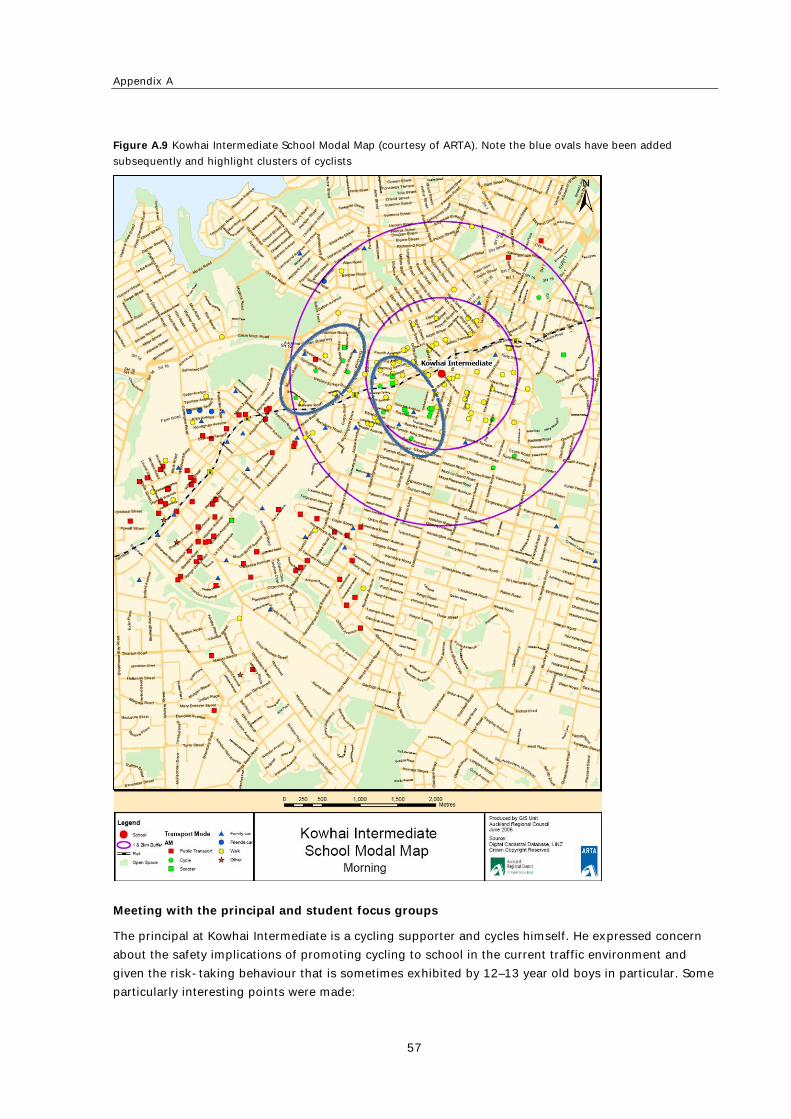
Appendix A
57
Figure A.9 Kowhai Intermediate School Modal Map (courtesy of ARTA). Note the blue ovals have been added
subsequently and highlight clusters of cyclists
Meeting with the principal and student focus groups
The principal at Kowhai Intermediate is a cycling supporter and cycles himself. He expressed concern
about the safety implications of promoting cycling to school in the current traffic environment and
given the risk-taking behaviour that is sometimes exhibited by 12–13 year old boys in particular. Some
particularly interesting points were made:
‘I want to ride my bike’: overcoming barriers to cycling to intermediate schools
58
Unfortunately, schools are increasingly taking on the role of care-givers and they are already
overloaded with responsibilities. Encouraging students to bike to school and the associated issues
and responsibilities should be owned by the community and local authorities. A parent who is
interested in cycling could volunteer or even be employed for a few hours per week to audit cycle
routes to school, talk to students about any bike or safety problems they are having (and refer to
bike shop/city council when needed) and coordinate with the city council for any cycling initiatives.
A local bike shop offers students free bike checks. There is a mutual benefit in that students’ bikes
are being checked and the bike shop is getting business from any maintenance or repair work that
needs to be done.
The school has purposely located the bike racks at the front of the school, next to the deputy
principal’s office which improves security but also sends a clear message about the importance of
cycling and the priority of bikes. There was also a conscious decision to leave the racks uncovered
to further improve security (bikes get wet on the ride to and from school anyway).
Fourteen students participated in the student focus group. Two of the 14 students reported that they
cycled at least some of the way to school or on some days, whereas a total of seven students reported
that they would like to cycle to school. When asked about specific problems cyclists might encounter
on their journey to and from school, seven students specifically mentioned that there was too much
traffic, two students specifically mentioned speeding motor vehicles and two students specifically
mentioned personal security problems (bullies, gangs etc). When asked what could be done to make
cycling to school safer, six students made comments relating to improved routes to school and three
students (all girls) mentioned that riding in a group would help.
Some interesting points from the discussion were:
The girls in the group were more receptive to cycling in groups than alone.
A couple of students regularly cycled on Sandringham Road (a busy arterial road heading in and
out of the city that carries approximately 20,000 vehicles per day), using the bus lanes. Both of
these students had the endorsement of their parents.
Students pointed out that although quiet streets were good from a road safety perspective, they
were not so good for personal security. On a busy road, there were plenty of people around to help
if they were harassed or attacked.
Development of school cycle network
The initial audit, meeting with the school principal and the focus group with students were used to
develop a recommended cycle network for Kowhai Intermediate (figure A.10).
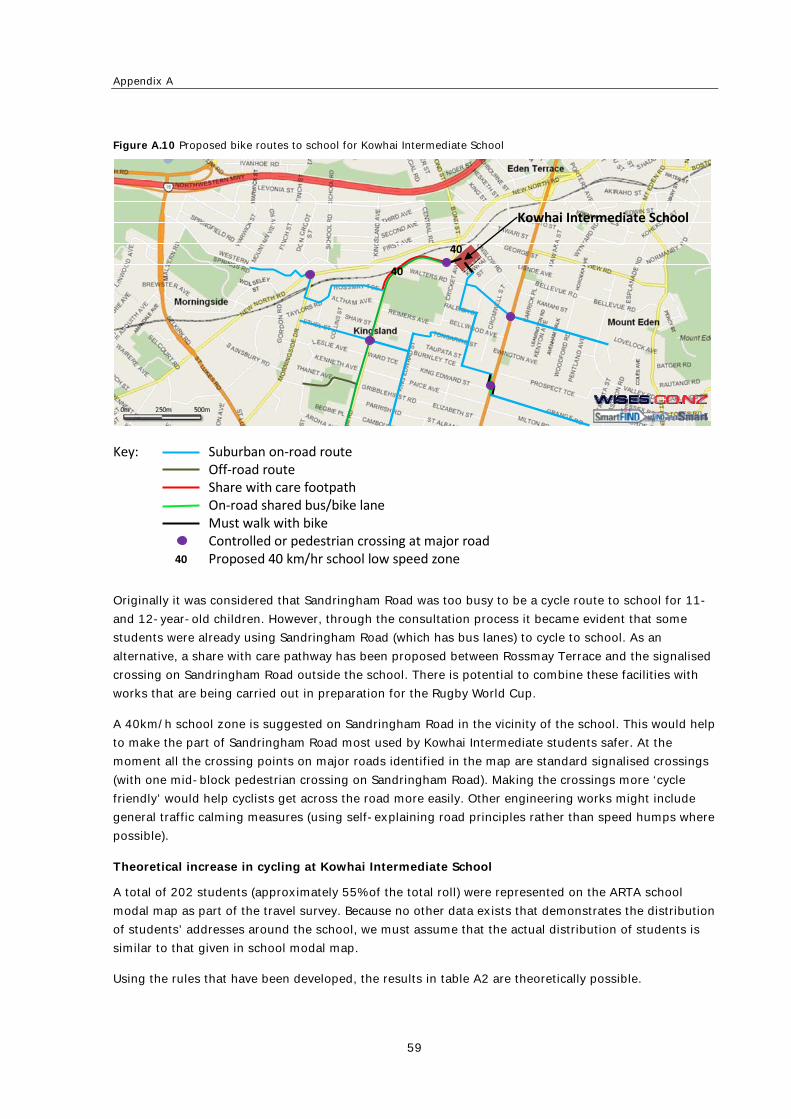
Appendix A
59
Figure A.10 Proposed bike routes to school for Kowhai Intermediate School
Key: Suburban on‐road route Off‐road route Share with care footpath On‐road shared bus/bike lane Must walk with bike Controlled or pedestrian crossing at major road Proposed 40 km/hr school low speed zone
40
40
40
Kowhai Intermediate School
Originally it was considered that Sandringham Road was too busy to be a cycle route to school for 11-
and 12-year-old children. However, through the consultation process it became evident that some
students were already using Sandringham Road (which has bus lanes) to cycle to school. As an
alternative, a share with care pathway has been proposed between Rossmay Terrace and the signalised
crossing on Sandringham Road outside the school. There is potential to combine these facilities with
works that are being carried out in preparation for the Rugby World Cup.
A 40km/h school zone is suggested on Sandringham Road in the vicinity of the school. This would help
to make the part of Sandringham Road most used by Kowhai Intermediate students safer. At the
moment all the crossing points on major roads identified in the map are standard signalised crossings
(with one mid-block pedestrian crossing on Sandringham Road). Making the crossings more ‘cycle
friendly’ would help cyclists get across the road more easily. Other engineering works might include
general traffic calming measures (using self-explaining road principles rather than speed humps where
possible).
Theoretical increase in cycling at Kowhai Intermediate School
A total of 202 students (approximately 55% of the total roll) were represented on the ARTA school
modal map as part of the travel survey. Because no other data exists that demonstrates the distribution
of students’ addresses around the school, we must assume that the actual distribution of students is
similar to that given in school modal map.
Using the rules that have been developed, the results in table A2 are theoretically possible.
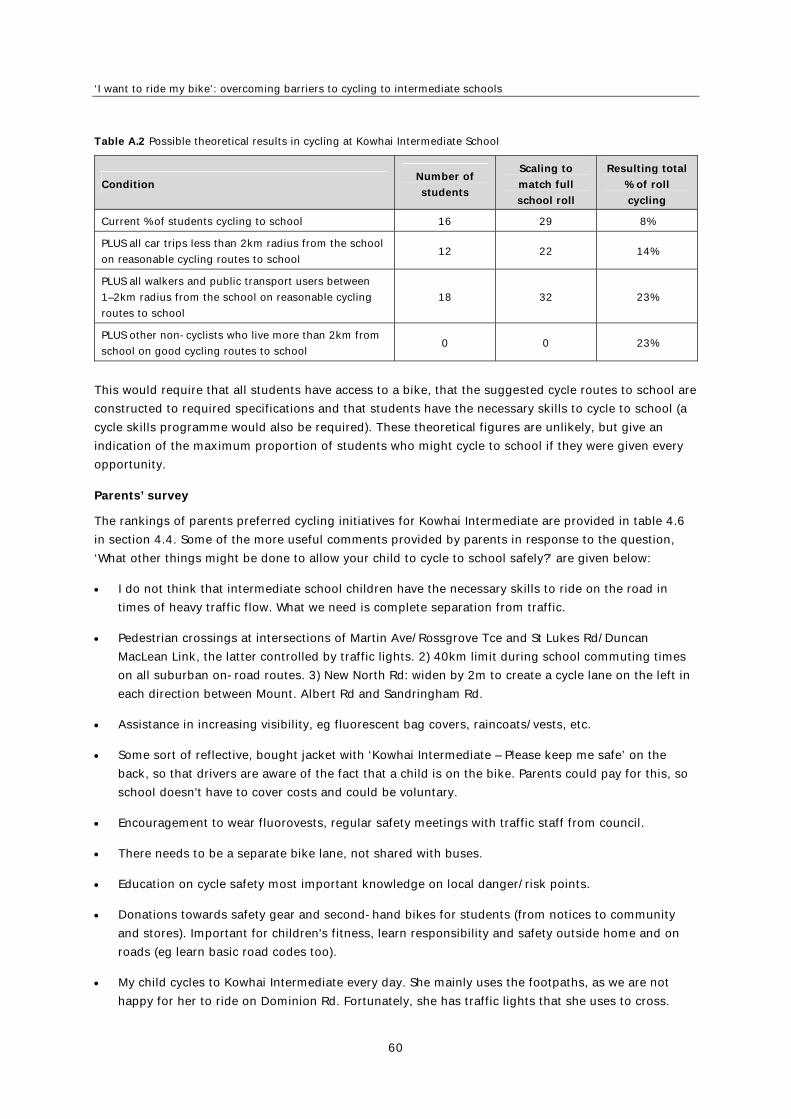
‘I want to ride my bike’: overcoming barriers to cycling to intermediate schools
60
Table A.2 Possible theoretical results in cycling at Kowhai Intermediate School
Condition Number of
students
Scaling to
match full
school roll
Resulting total
% of roll
cycling
Current % of students cycling to school 16 29 8%
PLUS all car trips less than 2km radius from the school
on reasonable cycling routes to school 12 22 14%
PLUS all walkers and public transport users between
1–2km radius from the school on reasonable cycling
routes to school
18 32 23%
PLUS other non-cyclists who live more than 2km from
school on good cycling routes to school 0 0 23%
This would require that all students have access to a bike, that the suggested cycle routes to school are
constructed to required specifications and that students have the necessary skills to cycle to school (a
cycle skills programme would also be required). These theoretical figures are unlikely, but give an
indication of the maximum proportion of students who might cycle to school if they were given every
opportunity.
Parents’ survey
The rankings of parents preferred cycling initiatives for Kowhai Intermediate are provided in table 4.6
in section 4.4. Some of the more useful comments provided by parents in response to the question,
‘What other things might be done to allow your child to cycle to school safely?’ are given below:
I do not think that intermediate school children have the necessary skills to ride on the road in
times of heavy traffic flow. What we need is complete separation from traffic.
Pedestrian crossings at intersections of Martin Ave/Rossgrove Tce and St Lukes Rd/Duncan
MacLean Link, the latter controlled by traffic lights. 2) 40km limit during school commuting times
on all suburban on-road routes. 3) New North Rd: widen by 2m to create a cycle lane on the left in
each direction between Mount. Albert Rd and Sandringham Rd.
Assistance in increasing visibility, eg fluorescent bag covers, raincoats/vests, etc.
Some sort of reflective, bought jacket with ‘Kowhai Intermediate – Please keep me safe’ on the
back, so that drivers are aware of the fact that a child is on the bike. Parents could pay for this, so
school doesn't have to cover costs and could be voluntary.
Encouragement to wear fluorovests, regular safety meetings with traffic staff from council.
There needs to be a separate bike lane, not shared with buses.
Education on cycle safety most important knowledge on local danger/risk points.
Donations towards safety gear and second-hand bikes for students (from notices to community
and stores). Important for children's fitness, learn responsibility and safety outside home and on
roads (eg learn basic road codes too).
My child cycles to Kowhai Intermediate every day. She mainly uses the footpaths, as we are not
happy for her to ride on Dominion Rd. Fortunately, she has traffic lights that she uses to cross.
Appendix A
61
Every day when I watch her ride off to school, my greatest worry is that can she be seen?? Her
uniform is dark and her school bag. I have tried to get her a bright vest, and a school bag cover
(bright). But she will not wear these, as she thinks it’s embarrassing. I think it would be a great
idea for someone to design a special Kowhai cycling accessory, that is bright but cool enough to
wear for this difficult age group!! I think being seen by other motorists is of greatest importance!
Thank you.
Not convinced about sharing bus lanes – buses would need to be part of the education programme
to watch out for bikes.
Compulsory wearing bright cycling fluorescent jackets to be seen by car drivers.
It's not that they (bike facilities) are insufficient – it is just that the bus service is very good and
safe especially on rush hour – 8am to 9am.
Specific recommendations for Kowhai Intermediate School
Kowhai Intermediate has already been proactive by actively participating in the school travel plan
process and developing initiatives such as their ‘buddy up bike challenge’ which involves some
education about road sense followed by a bike check by the local bike shop. Students then plan a
clever travel route to school and buddy up to cycle to school in pairs. By carefully considering bike
storage, students at Kowhai Intermediate almost never have problems with bike tampering or theft.
Although Kowhai Intermediate is limited in the maximum theoretical number of cyclists it might
expect, in many ways Kowhai Intermediate is well placed to implement the next level of cycling
initiatives to attract those who might potentially cycle to and from school. The research that has been
conducted suggests the next focus should be on developing and promoting safe routes to school and
working with Auckland City Council to provide the necessary engineering modifications. The
development of Eden Park nearby for the 2011 Rugby World Cup may provide opportunities for Kowhai
Intermediate. Roading improvements in the area could also accommodate improved cycle routes to
school as part of a contribution to the community. Cycle skills training and working with Auckland City
Council to implement slow speed zones should also be a priority.
Another option is to focus on developing the idea of a ‘school bike officer’ as suggested by the
principal earlier. It is important that this role is filled by a city council representative, parent or
community representative and does not place a significant extra burden on the school. This type of
initiative has been very successful in the United Kingdom (Sustrans 2009).
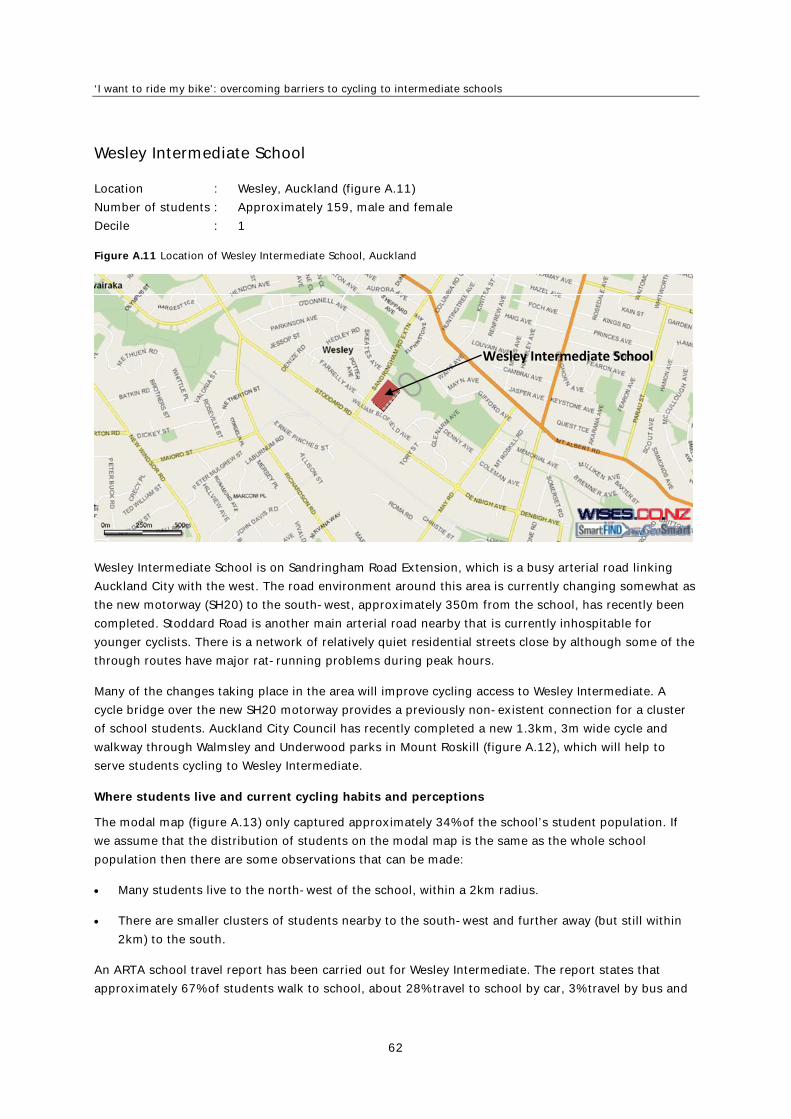
‘I want to ride my bike’: overcoming barriers to cycling to intermediate schools
62
Wesley Intermediate School
Location : Wesley, Auckland (figure A.11)
Number of students : Approximately 159, male and female
Decile : 1
Figure A.11 Location of Wesley Intermediate School, Auckland
Wesley Intermediate School
Wesley Intermediate School is on Sandringham Road Extension, which is a busy arterial road linking
Auckland City with the west. The road environment around this area is currently changing somewhat as
the new motorway (SH20) to the south-west, approximately 350m from the school, has recently been
completed. Stoddard Road is another main arterial road nearby that is currently inhospitable for
younger cyclists. There is a network of relatively quiet residential streets close by although some of the
through routes have major rat-running problems during peak hours.
Many of the changes taking place in the area will improve cycling access to Wesley Intermediate. A
cycle bridge over the new SH20 motorway provides a previously non-existent connection for a cluster
of school students. Auckland City Council has recently completed a new 1.3km, 3m wide cycle and
walkway through Walmsley and Underwood parks in Mount Roskill (figure A.12), which will help to
serve students cycling to Wesley Intermediate.
Where students live and current cycling habits and perceptions
The modal map (figure A.13) only captured approximately 34% of the school’s student population. If
we assume that the distribution of students on the modal map is the same as the whole school
population then there are some observations that can be made:
Many students live to the north-west of the school, within a 2km radius.
There are smaller clusters of students nearby to the south-west and further away (but still within
2km) to the south.
An ARTA school travel report has been carried out for Wesley Intermediate. The report states that
approximately 67% of students walk to school, about 28% travel to school by car, 3% travel by bus and
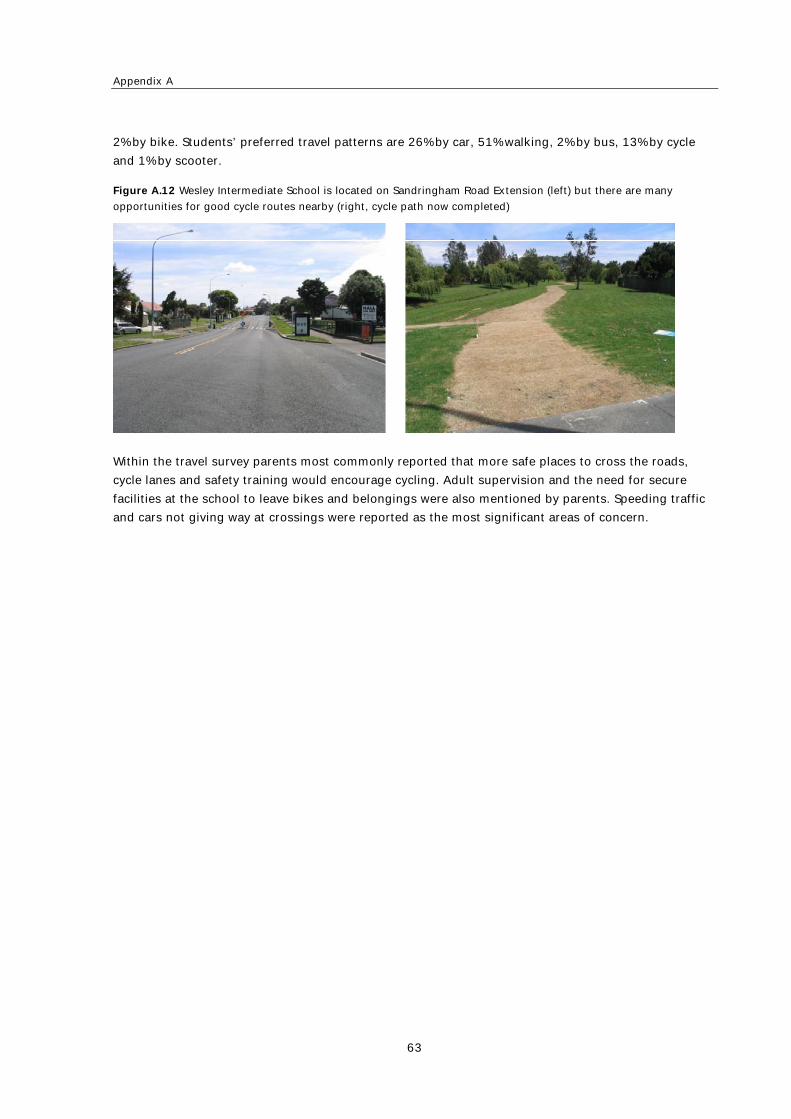
Appendix A
63
2% by bike. Students’ preferred travel patterns are 26% by car, 51% walking, 2% by bus, 13% by cycle
and 1% by scooter.
Figure A.12 Wesley Intermediate School is located on Sandringham Road Extension (left) but there are many
opportunities for good cycle routes nearby (right, cycle path now completed)
Within the travel survey parents most commonly reported that more safe places to cross the roads,
cycle lanes and safety training would encourage cycling. Adult supervision and the need for secure
facilities at the school to leave bikes and belongings were also mentioned by parents. Speeding traffic
and cars not giving way at crossings were reported as the most significant areas of concern.
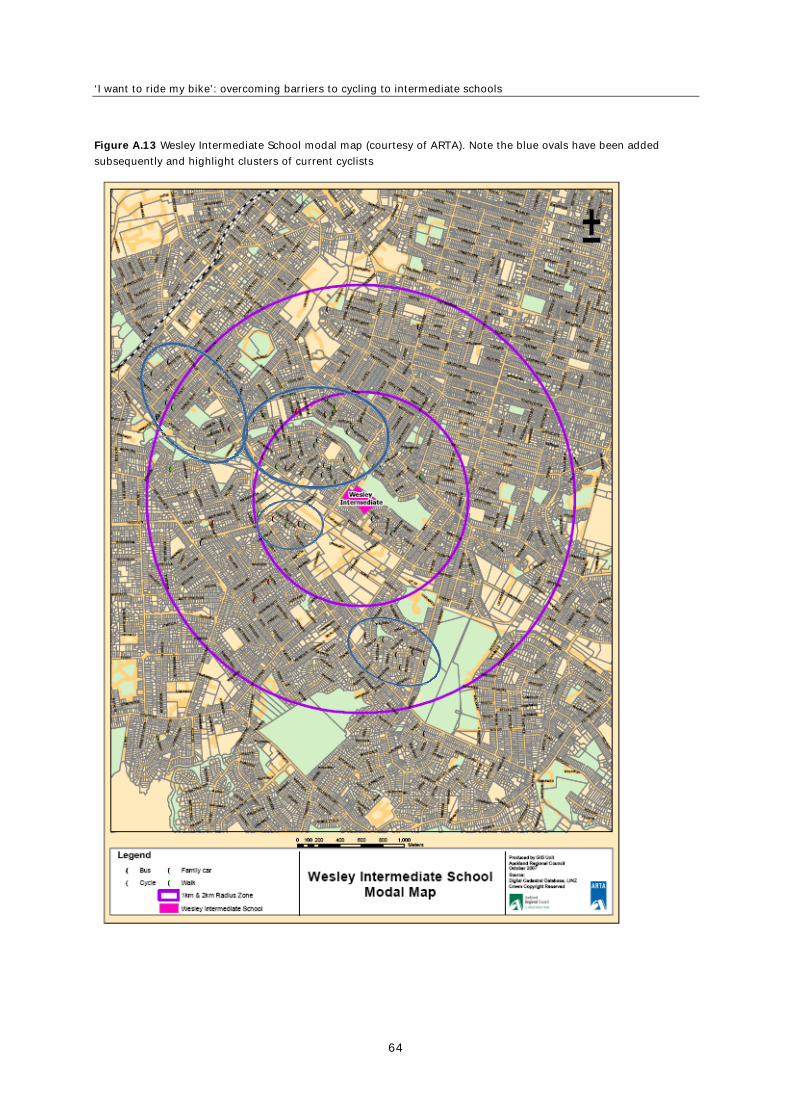
‘I want to ride my bike’: overcoming barriers to cycling to intermediate schools
64
Figure A.13 Wesley Intermediate School modal map (courtesy of ARTA). Note the blue ovals have been added
subsequently and highlight clusters of current cyclists
Appendix A
65
Meeting with the principal and student/teacher focus groups
The principal at Wesley Intermediate expressed some concern about the safety of Sandringham Road
that serves the school. He also runs a breakfast and exercise programme before school that is very
popular with students and it helps with students’ concentration on school work during the day. Having
students cycle to school could fit in with this programme by providing exercise at the beginning of the
day. The principal also pointed out that bike maintenance and ownership was likely to be a factor in
preventing students cycling to and from school due to the low socioeconomic nature of the community
surrounding the school.
Fifteen students and four parent/teachers participated in focus groups (in separate groups). Seven of
the 15 students indicated that they sometimes cycled to school or had recently cycled to school. This is
a greater number than the three cyclists mentioned in the school travel survey. Interestingly, three of
the cyclists at the focus group indicated they would prefer to get to school by car. When asked about
specific problems cyclists might encounter on their journey to school, nine students mentioned road
safety issues such as speeding motor vehicles and lack of crossing opportunities, three students
mentioned personal security problems (bullies, gangs etc) and two students mentioned bike
maintenance issues. When asked what could be done to make cycling to school safer, six students
suggested improved routes to school and four students mentioned that their bikes needed repair or
replacement. Three of the four parent/teachers mentioned that bullies were a problem.
Apart from completing their focus group forms other themes were evident from the discussions:
There were concerns about the space and facilities available to cyclists getting to and from school.
Areas of focus for future interventions should be: cycle training/road rules, assistance with bike
access and maintenance, and personal safety, particularly regarding bullies and gangs.
Development of a school cycle network
The initial audit, meeting with the school principal and the focus group with students were used to
develop a school cycle network for Wesley Intermediate (figure A.14).
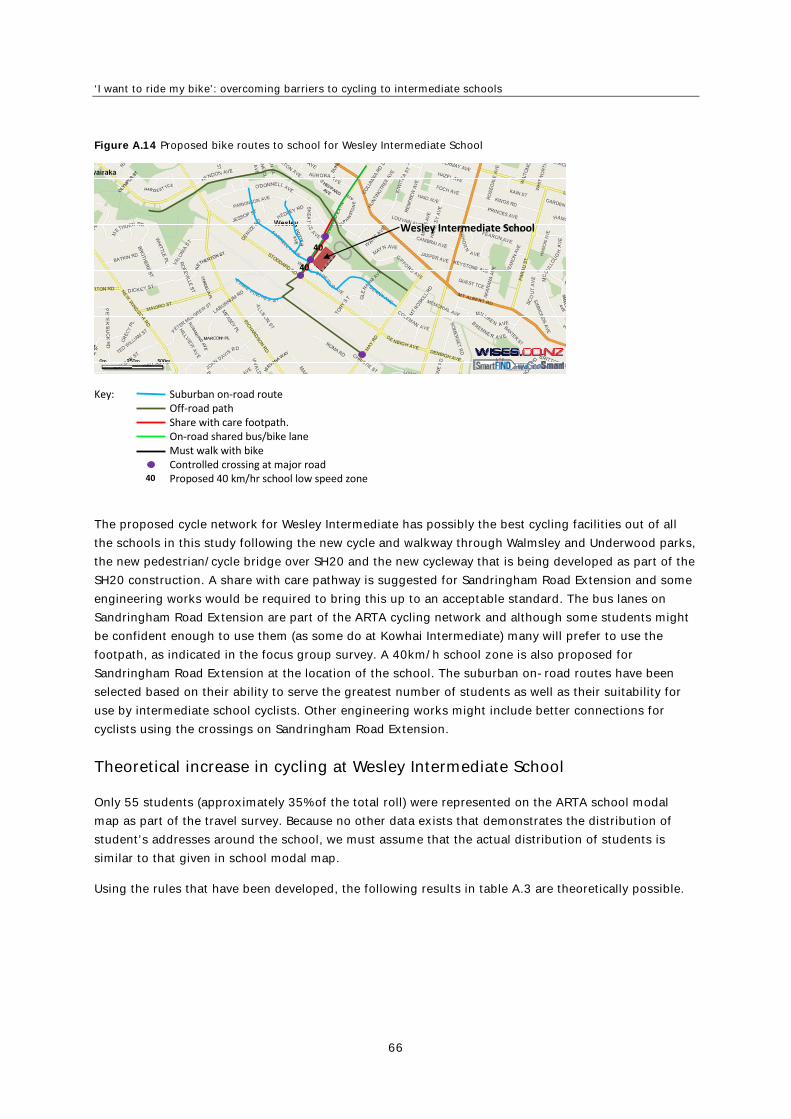
‘I want to ride my bike’: overcoming barriers to cycling to intermediate schools
66
Figure A.14 Proposed bike routes to school for Wesley Intermediate School
Key: Suburban on‐road route Off‐road path Share with care footpath. On‐road shared bus/bike lane Must walk with bike Controlled crossing at major road Proposed 40 km/hr school low speed zone
40
Wesley Intermediate School
40
40
The proposed cycle network for Wesley Intermediate has possibly the best cycling facilities out of all
the schools in this study following the new cycle and walkway through Walmsley and Underwood parks,
the new pedestrian/cycle bridge over SH20 and the new cycleway that is being developed as part of the
SH20 construction. A share with care pathway is suggested for Sandringham Road Extension and some
engineering works would be required to bring this up to an acceptable standard. The bus lanes on
Sandringham Road Extension are part of the ARTA cycling network and although some students might
be confident enough to use them (as some do at Kowhai Intermediate) many will prefer to use the
footpath, as indicated in the focus group survey. A 40km/h school zone is also proposed for
Sandringham Road Extension at the location of the school. The suburban on-road routes have been
selected based on their ability to serve the greatest number of students as well as their suitability for
use by intermediate school cyclists. Other engineering works might include better connections for
cyclists using the crossings on Sandringham Road Extension.
Theoretical increase in cycling at Wesley Intermediate School
Only 55 students (approximately 35% of the total roll) were represented on the ARTA school modal
map as part of the travel survey. Because no other data exists that demonstrates the distribution of
student’s addresses around the school, we must assume that the actual distribution of students is
similar to that given in school modal map.
Using the rules that have been developed, the following results in table A.3 are theoretically possible.
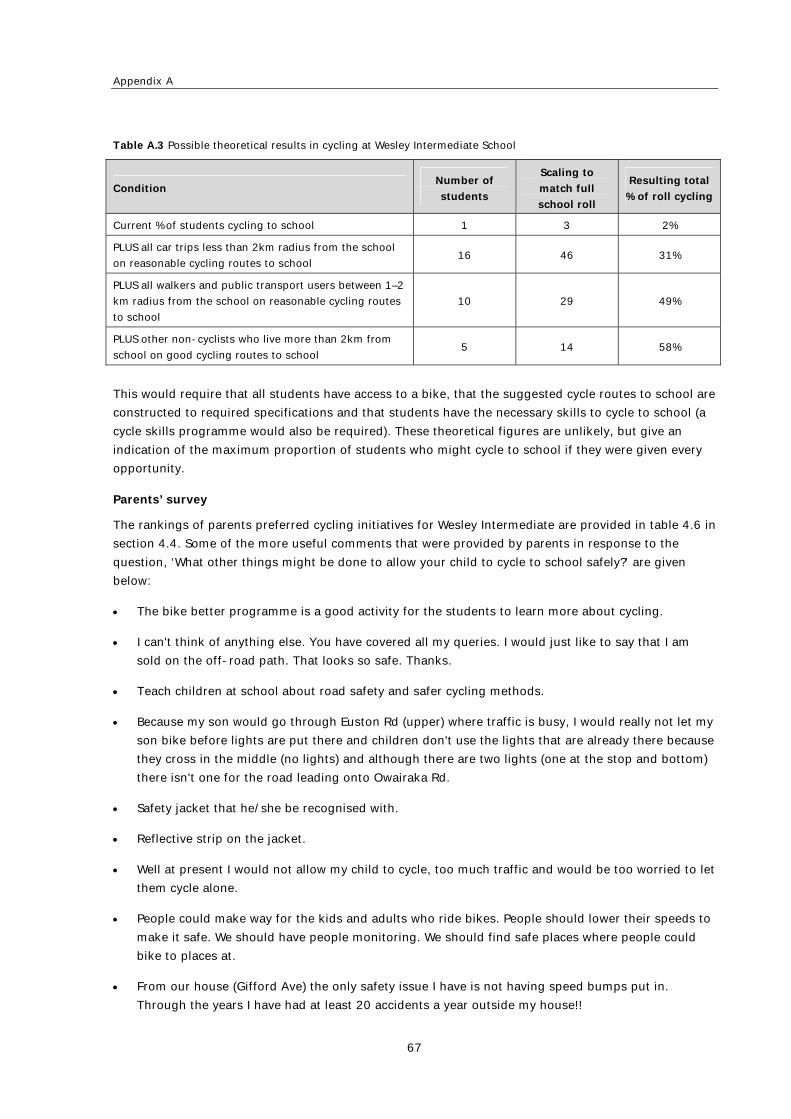
Appendix A
67
Table A.3 Possible theoretical results in cycling at Wesley Intermediate School
Condition Number of
students
Scaling to
match full
school roll
Resulting total
% of roll cycling
Current % of students cycling to school 1 3 2%
PLUS all car trips less than 2km radius from the school
on reasonable cycling routes to school 16 46 31%
PLUS all walkers and public transport users between 1–2
km radius from the school on reasonable cycling routes
to school
10 29 49%
PLUS other non-cyclists who live more than 2km from
school on good cycling routes to school 5 14 58%
This would require that all students have access to a bike, that the suggested cycle routes to school are
constructed to required specifications and that students have the necessary skills to cycle to school (a
cycle skills programme would also be required). These theoretical figures are unlikely, but give an
indication of the maximum proportion of students who might cycle to school if they were given every
opportunity.
Parents’ survey
The rankings of parents preferred cycling initiatives for Wesley Intermediate are provided in table 4.6 in
section 4.4. Some of the more useful comments that were provided by parents in response to the
question, ‘What other things might be done to allow your child to cycle to school safely?’ are given
below:
The bike better programme is a good activity for the students to learn more about cycling.
I can't think of anything else. You have covered all my queries. I would just like to say that I am
sold on the off-road path. That looks so safe. Thanks.
Teach children at school about road safety and safer cycling methods.
Because my son would go through Euston Rd (upper) where traffic is busy, I would really not let my
son bike before lights are put there and children don't use the lights that are already there because
they cross in the middle (no lights) and although there are two lights (one at the stop and bottom)
there isn't one for the road leading onto Owairaka Rd.
Safety jacket that he/she be recognised with.
Reflective strip on the jacket.
Well at present I would not allow my child to cycle, too much traffic and would be too worried to let
them cycle alone.
People could make way for the kids and adults who ride bikes. People should lower their speeds to
make it safe. We should have people monitoring. We should find safe places where people could
bike to places at.
From our house (Gifford Ave) the only safety issue I have is not having speed bumps put in.
Through the years I have had at least 20 accidents a year outside my house!!
‘I want to ride my bike’: overcoming barriers to cycling to intermediate schools
68
If I have to accompany her/him to school then I will allow her/him to cycle to school. Otherwise
there is no way he/she will be allowed to cycle.
It helps to know more about safety of traffic and to develop self-confidence. It helps them to be
more fear conscious.
I don't trust my child to cycle to school.
It's safer to walk, too many traffic on Sandringham Road.
We don't need to bike our children because we're close to school.
Specific recommendations for Wesley Intermediate School
Like Avondale, Wesley Intermediate has very few cyclists but huge potential. The SH20 roadworks will
probably improve access for cyclists as will the new foot and cycle path through Walmsley and
Underwood parks. Also like Avondale, most of the engineering work needs to focus on rebalancing
road user priorities on the main road in the immediate vicinity (Sandringham Road Extension in the
case of Wesley) so that school cyclists have a safe, connected and convenient route to school.
Wesley Intermediate is a decile 1 school and major issues that need to be addressed include access to a
bike (with associated cycle training), fears of personal security en-route to school and bike security at
school.
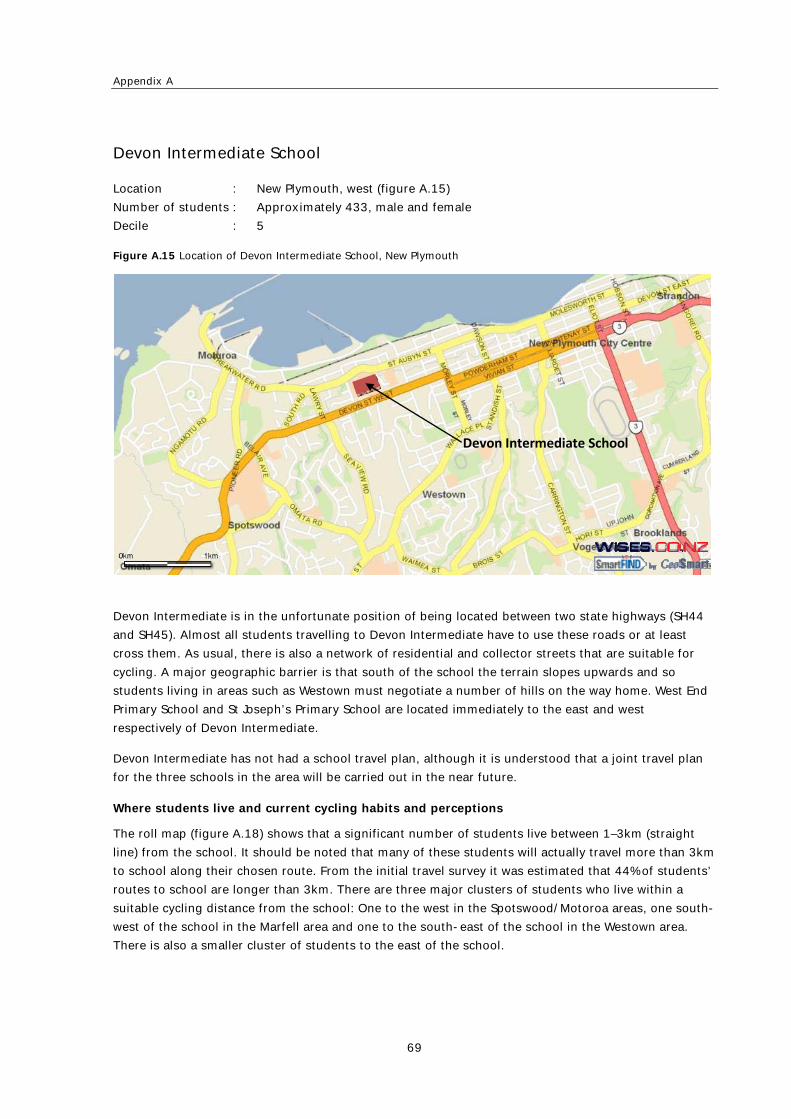
Appendix A
69
Devon Intermediate School
Location : New Plymouth, west (figure A.15)
Number of students : Approximately 433, male and female
Decile : 5
Figure A.15 Location of Devon Intermediate School, New Plymouth
Devon Intermediate School
Devon Intermediate is in the unfortunate position of being located between two state highways (SH44
and SH45). Almost all students travelling to Devon Intermediate have to use these roads or at least
cross them. As usual, there is also a network of residential and collector streets that are suitable for
cycling. A major geographic barrier is that south of the school the terrain slopes upwards and so
students living in areas such as Westown must negotiate a number of hills on the way home. West End
Primary School and St Joseph’s Primary School are located immediately to the east and west
respectively of Devon Intermediate.
Devon Intermediate has not had a school travel plan, although it is understood that a joint travel plan
for the three schools in the area will be carried out in the near future.
Where students live and current cycling habits and perceptions
The roll map (figure A.18) shows that a significant number of students live between 1–3km (straight
line) from the school. It should be noted that many of these students will actually travel more than 3km
to school along their chosen route. From the initial travel survey it was estimated that 44% of students’
routes to school are longer than 3km. There are three major clusters of students who live within a
suitable cycling distance from the school: One to the west in the Spotswood/Motoroa areas, one south-
west of the school in the Marfell area and one to the south-east of the school in the Westown area.
There is also a smaller cluster of students to the east of the school.
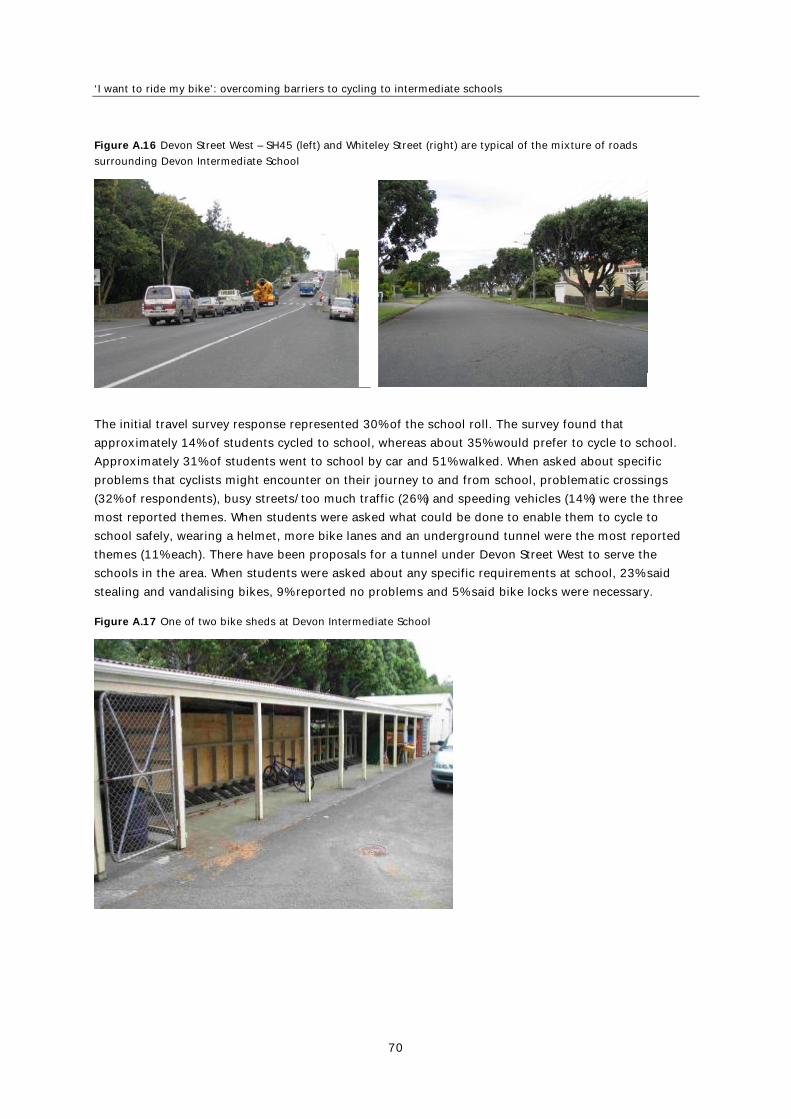
‘I want to ride my bike’: overcoming barriers to cycling to intermediate schools
70
Figure A.16 Devon Street West – SH45 (left) and Whiteley Street (right) are typical of the mixture of roads
surrounding Devon Intermediate School
The initial travel survey response represented 30% of the school roll. The survey found that
approximately 14% of students cycled to school, whereas about 35% would prefer to cycle to school.
Approximately 31% of students went to school by car and 51% walked. When asked about specific
problems that cyclists might encounter on their journey to and from school, problematic crossings
(32% of respondents), busy streets/too much traffic (26%) and speeding vehicles (14%) were the three
most reported themes. When students were asked what could be done to enable them to cycle to
school safely, wearing a helmet, more bike lanes and an underground tunnel were the most reported
themes (11% each). There have been proposals for a tunnel under Devon Street West to serve the
schools in the area. When students were asked about any specific requirements at school, 23% said
stealing and vandalising bikes, 9% reported no problems and 5% said bike locks were necessary.
Figure A.17 One of two bike sheds at Devon Intermediate School
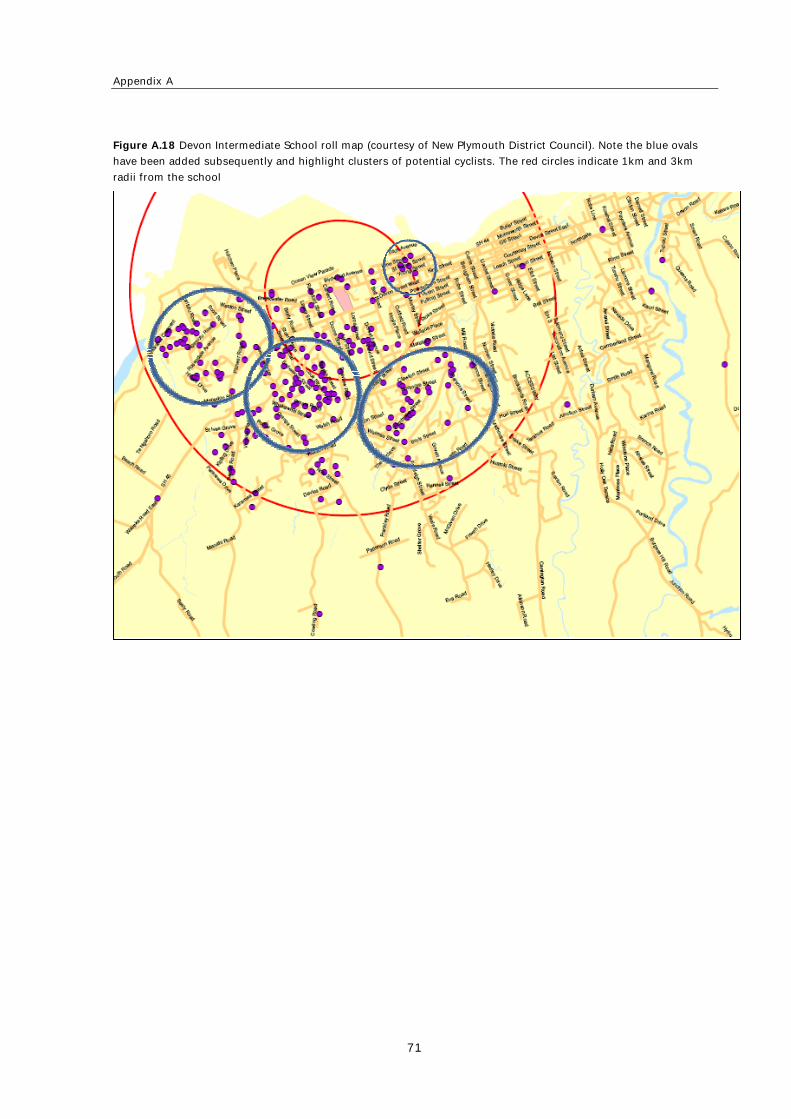
Appendix A
71
Figure A.18 Devon Intermediate School roll map (courtesy of New Plymouth District Council). Note the blue ovals
have been added subsequently and highlight clusters of potential cyclists. The red circles indicate 1km and 3km
radii from the school
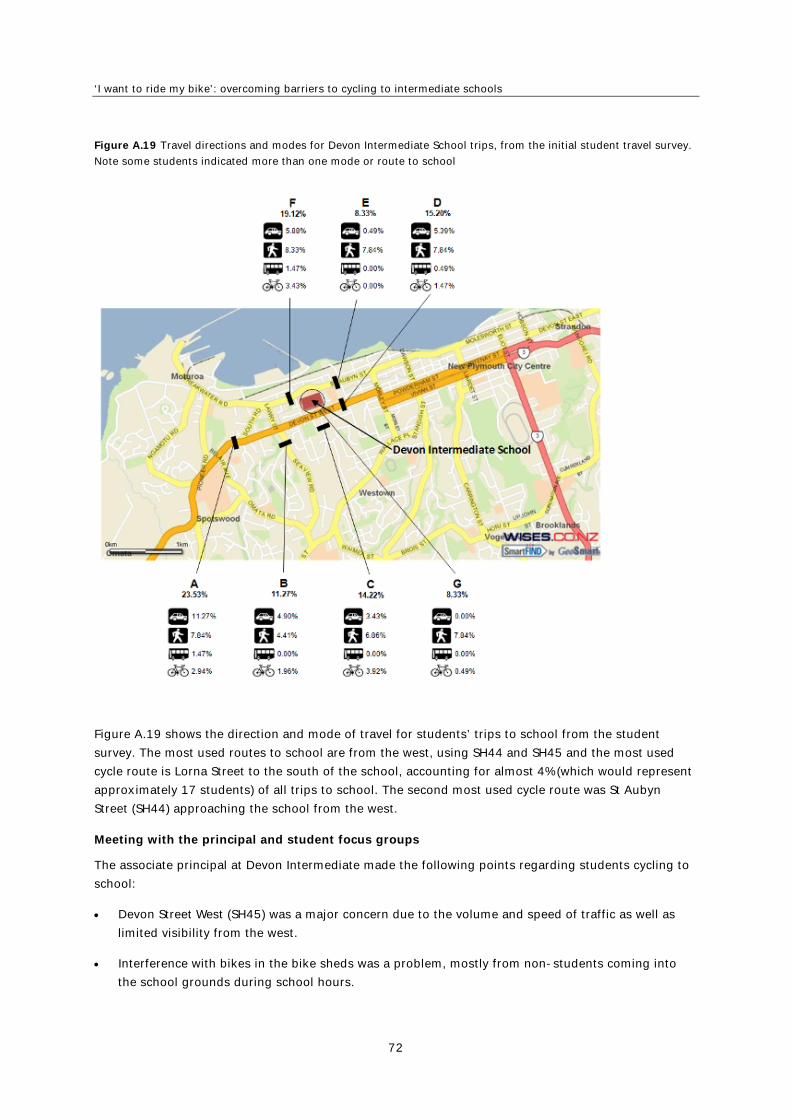
‘I want to ride my bike’: overcoming barriers to cycling to intermediate schools
72
Figure A.19 Travel directions and modes for Devon Intermediate School trips, from the initial student travel survey.
Note some students indicated more than one mode or route to school
Figure A.19 shows the direction and mode of travel for students’ trips to school from the student
survey. The most used routes to school are from the west, using SH44 and SH45 and the most used
cycle route is Lorna Street to the south of the school, accounting for almost 4% (which would represent
approximately 17 students) of all trips to school. The second most used cycle route was St Aubyn
Street (SH44) approaching the school from the west.
Meeting with the principal and student focus groups
The associate principal at Devon Intermediate made the following points regarding students cycling to
school:
Devon Street West (SH45) was a major concern due to the volume and speed of traffic as well as
limited visibility from the west.
Interference with bikes in the bike sheds was a problem, mostly from non-students coming into
the school grounds during school hours.
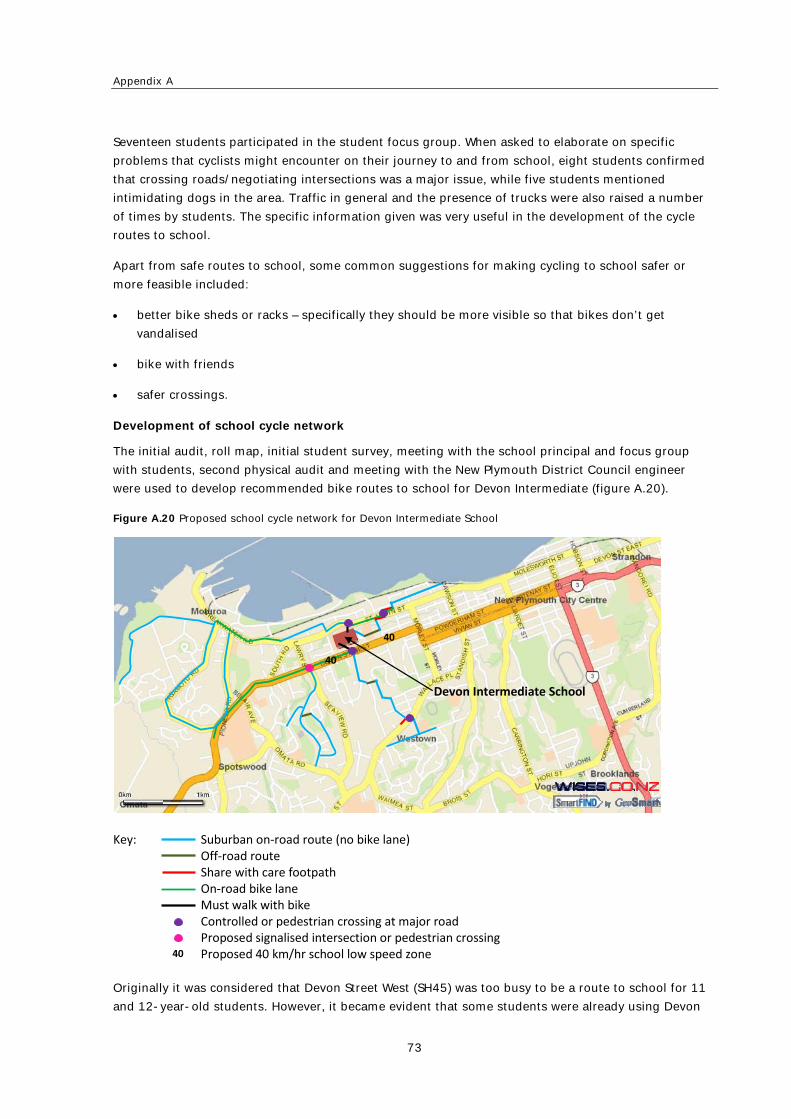
Appendix A
73
Seventeen students participated in the student focus group. When asked to elaborate on specific
problems that cyclists might encounter on their journey to and from school, eight students confirmed
that crossing roads/negotiating intersections was a major issue, while five students mentioned
intimidating dogs in the area. Traffic in general and the presence of trucks were also raised a number
of times by students. The specific information given was very useful in the development of the cycle
routes to school.
Apart from safe routes to school, some common suggestions for making cycling to school safer or
more feasible included:
better bike sheds or racks – specifically they should be more visible so that bikes don’t get
vandalised
bike with friends
safer crossings.
Development of school cycle network
The initial audit, roll map, initial student survey, meeting with the school principal and focus group
with students, second physical audit and meeting with the New Plymouth District Council engineer
were used to develop recommended bike routes to school for Devon Intermediate (figure A.20).
Figure A.20 Proposed school cycle network for Devon Intermediate School
Key: Suburban on‐road route (no bike lane) Off‐road route Share with care footpath On‐road bike lane Must walk with bike Controlled or pedestrian crossing at major road Proposed signalised intersection or pedestrian crossing Proposed 40 km/hr school low speed zone
40
40
Devon Intermediate School
40
Originally it was considered that Devon Street West (SH45) was too busy to be a route to school for 11
and 12-year-old students. However, it became evident that some students were already using Devon
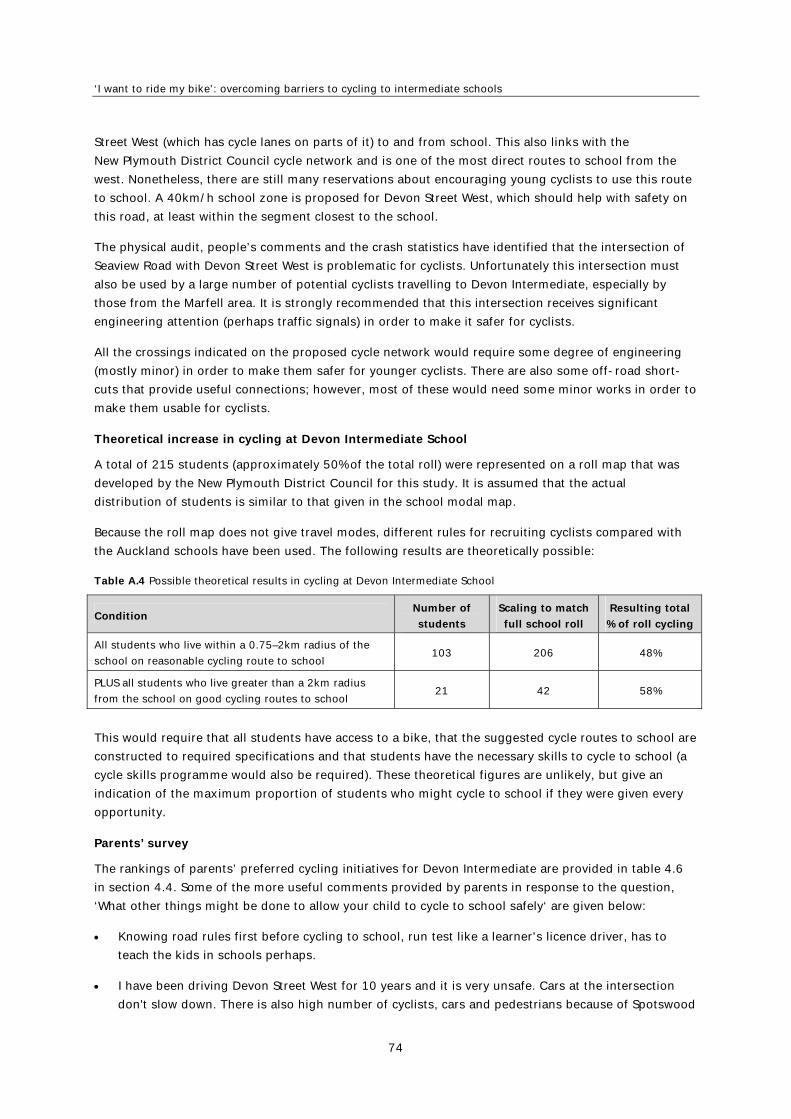
‘I want to ride my bike’: overcoming barriers to cycling to intermediate schools
74
Street West (which has cycle lanes on parts of it) to and from school. This also links with the
New Plymouth District Council cycle network and is one of the most direct routes to school from the
west. Nonetheless, there are still many reservations about encouraging young cyclists to use this route
to school. A 40km/h school zone is proposed for Devon Street West, which should help with safety on
this road, at least within the segment closest to the school.
The physical audit, people’s comments and the crash statistics have identified that the intersection of
Seaview Road with Devon Street West is problematic for cyclists. Unfortunately this intersection must
also be used by a large number of potential cyclists travelling to Devon Intermediate, especially by
those from the Marfell area. It is strongly recommended that this intersection receives significant
engineering attention (perhaps traffic signals) in order to make it safer for cyclists.
All the crossings indicated on the proposed cycle network would require some degree of engineering
(mostly minor) in order to make them safer for younger cyclists. There are also some off-road short-
cuts that provide useful connections; however, most of these would need some minor works in order to
make them usable for cyclists.
Theoretical increase in cycling at Devon Intermediate School
A total of 215 students (approximately 50% of the total roll) were represented on a roll map that was
developed by the New Plymouth District Council for this study. It is assumed that the actual
distribution of students is similar to that given in the school modal map.
Because the roll map does not give travel modes, different rules for recruiting cyclists compared with
the Auckland schools have been used. The following results are theoretically possible:
Table A.4 Possible theoretical results in cycling at Devon Intermediate School
Condition Number of
students
Scaling to match
full school roll
Resulting total
% of roll cycling
All students who live within a 0.75–2km radius of the
school on reasonable cycling route to school 103 206 48%
PLUS all students who live greater than a 2km radius
from the school on good cycling routes to school 21 42 58%
This would require that all students have access to a bike, that the suggested cycle routes to school are
constructed to required specifications and that students have the necessary skills to cycle to school (a
cycle skills programme would also be required). These theoretical figures are unlikely, but give an
indication of the maximum proportion of students who might cycle to school if they were given every
opportunity.
Parents’ survey
The rankings of parents’ preferred cycling initiatives for Devon Intermediate are provided in table 4.6
in section 4.4. Some of the more useful comments provided by parents in response to the question,
‘What other things might be done to allow your child to cycle to school safely‘ are given below:
Knowing road rules first before cycling to school, run test like a learner’s licence driver, has to
teach the kids in schools perhaps.
I have been driving Devon Street West for 10 years and it is very unsafe. Cars at the intersection
don't slow down. There is also high number of cyclists, cars and pedestrians because of Spotswood
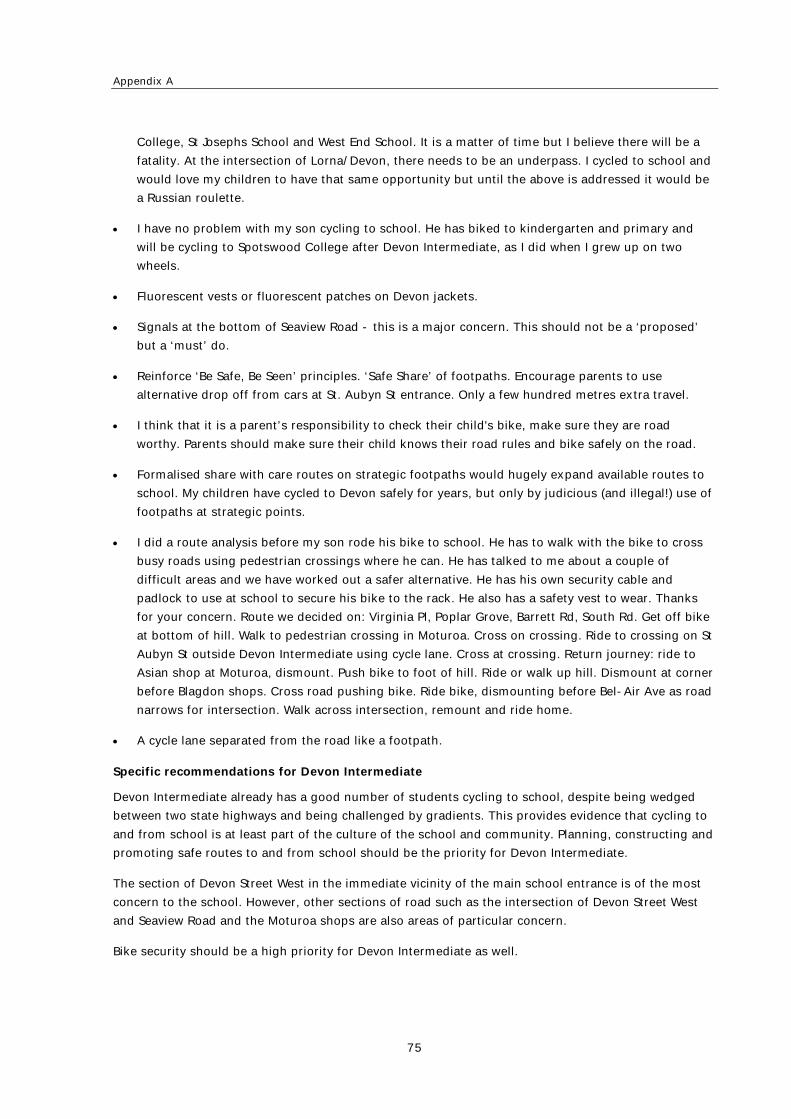
Appendix A
75
College, St Josephs School and West End School. It is a matter of time but I believe there will be a
fatality. At the intersection of Lorna/Devon, there needs to be an underpass. I cycled to school and
would love my children to have that same opportunity but until the above is addressed it would be
a Russian roulette.
I have no problem with my son cycling to school. He has biked to kindergarten and primary and
will be cycling to Spotswood College after Devon Intermediate, as I did when I grew up on two
wheels.
Fluorescent vests or fluorescent patches on Devon jackets.
Signals at the bottom of Seaview Road - this is a major concern. This should not be a ‘proposed’
but a ‘must’ do.
Reinforce ‘Be Safe, Be Seen’ principles. ‘Safe Share’ of footpaths. Encourage parents to use
alternative drop off from cars at St. Aubyn St entrance. Only a few hundred metres extra travel.
I think that it is a parent’s responsibility to check their child's bike, make sure they are road
worthy. Parents should make sure their child knows their road rules and bike safely on the road.
Formalised share with care routes on strategic footpaths would hugely expand available routes to
school. My children have cycled to Devon safely for years, but only by judicious (and illegal!) use of
footpaths at strategic points.
I did a route analysis before my son rode his bike to school. He has to walk with the bike to cross
busy roads using pedestrian crossings where he can. He has talked to me about a couple of
difficult areas and we have worked out a safer alternative. He has his own security cable and
padlock to use at school to secure his bike to the rack. He also has a safety vest to wear. Thanks
for your concern. Route we decided on: Virginia Pl, Poplar Grove, Barrett Rd, South Rd. Get off bike
at bottom of hill. Walk to pedestrian crossing in Moturoa. Cross on crossing. Ride to crossing on St
Aubyn St outside Devon Intermediate using cycle lane. Cross at crossing. Return journey: ride to
Asian shop at Moturoa, dismount. Push bike to foot of hill. Ride or walk up hill. Dismount at corner
before Blagdon shops. Cross road pushing bike. Ride bike, dismounting before Bel-Air Ave as road
narrows for intersection. Walk across intersection, remount and ride home.
A cycle lane separated from the road like a footpath.
Specific recommendations for Devon Intermediate
Devon Intermediate already has a good number of students cycling to school, despite being wedged
between two state highways and being challenged by gradients. This provides evidence that cycling to
and from school is at least part of the culture of the school and community. Planning, constructing and
promoting safe routes to and from school should be the priority for Devon Intermediate.
The section of Devon Street West in the immediate vicinity of the main school entrance is of the most
concern to the school. However, other sections of road such as the intersection of Devon Street West
and Seaview Road and the Moturoa shops are also areas of particular concern.
Bike security should be a high priority for Devon Intermediate as well.
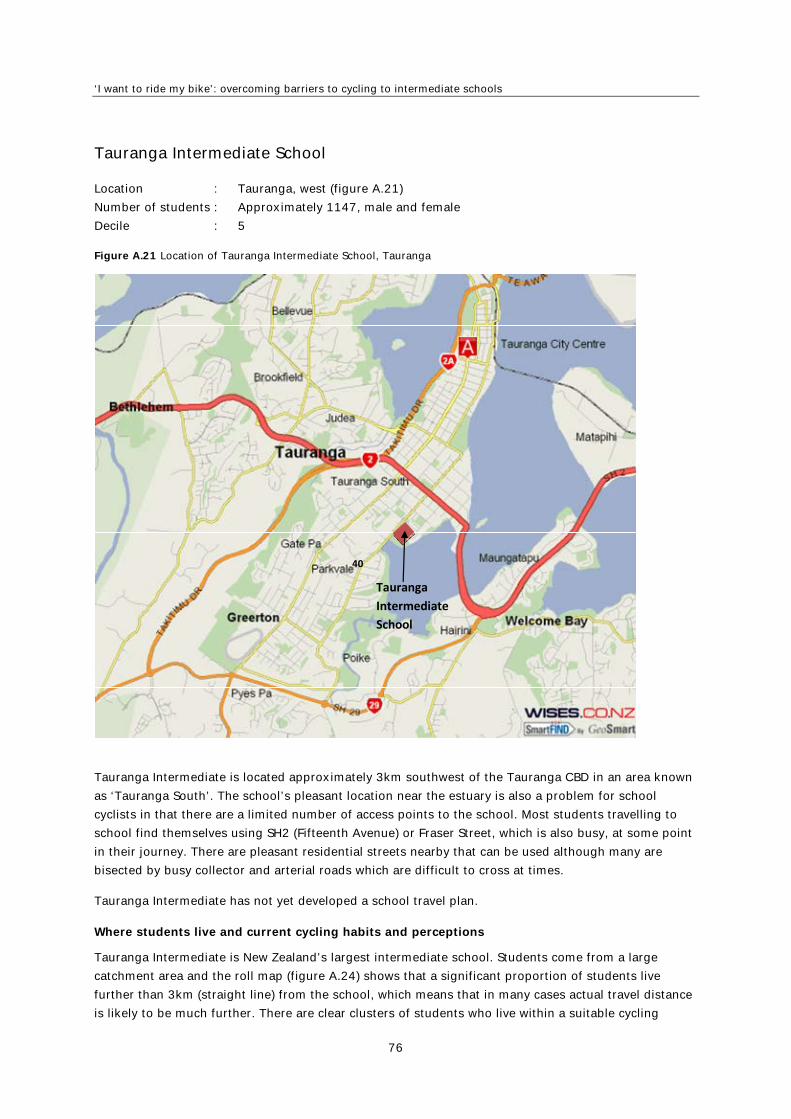
‘I want to ride my bike’: overcoming barriers to cycling to intermediate schools
76
Tauranga Intermediate School
Location : Tauranga, west (figure A.21)
Number of students : Approximately 1147, male and female
Decile : 5
Figure A.21 Location of Tauranga Intermediate School, Tauranga
Tauranga
Intermediate
School
40
Tauranga Intermediate is located approximately 3km southwest of the Tauranga CBD in an area known
as ‘Tauranga South’. The school’s pleasant location near the estuary is also a problem for school
cyclists in that there are a limited number of access points to the school. Most students travelling to
school find themselves using SH2 (Fifteenth Avenue) or Fraser Street, which is also busy, at some point
in their journey. There are pleasant residential streets nearby that can be used although many are
bisected by busy collector and arterial roads which are difficult to cross at times.
Tauranga Intermediate has not yet developed a school travel plan.
Where students live and current cycling habits and perceptions
Tauranga Intermediate is New Zealand’s largest intermediate school. Students come from a large
catchment area and the roll map (figure A.24) shows that a significant proportion of students live
further than 3km (straight line) from the school, which means that in many cases actual travel distance
is likely to be much further. There are clear clusters of students who live within a suitable cycling
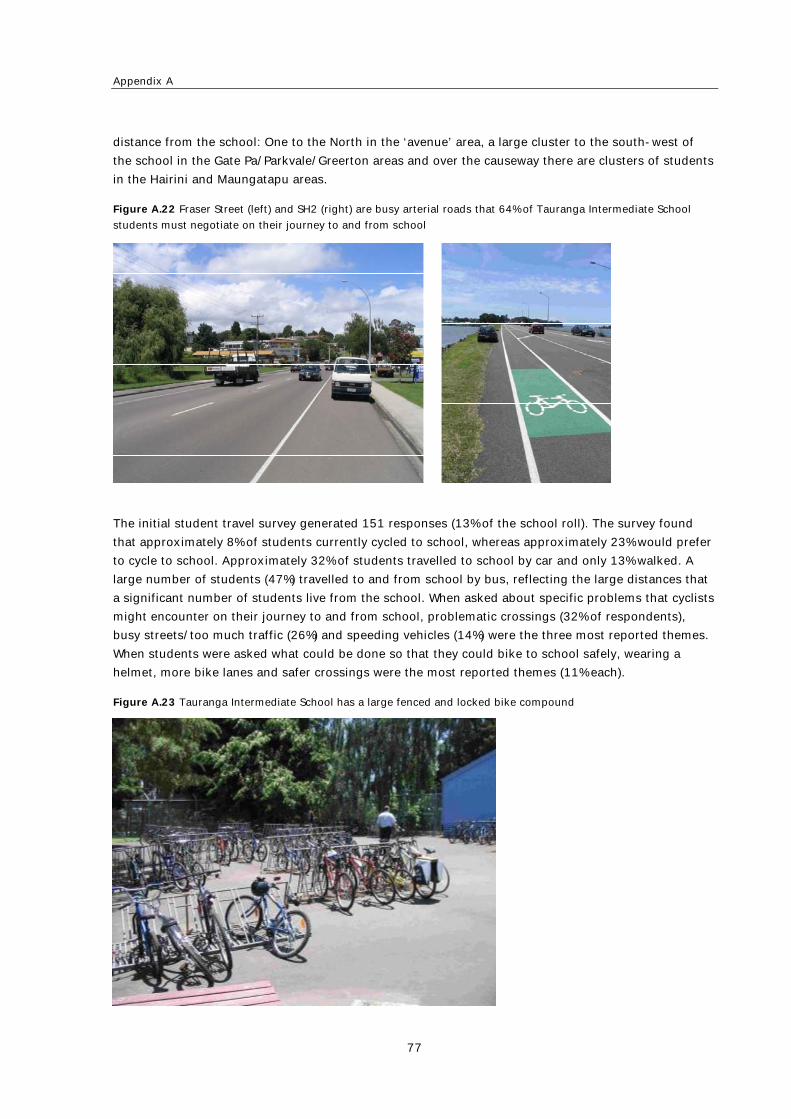
Appendix A
77
distance from the school: One to the North in the ‘avenue’ area, a large cluster to the south-west of
the school in the Gate Pa/Parkvale/Greerton areas and over the causeway there are clusters of students
in the Hairini and Maungatapu areas.
Figure A.22 Fraser Street (left) and SH2 (right) are busy arterial roads that 64% of Tauranga Intermediate School
students must negotiate on their journey to and from school
The initial student travel survey generated 151 responses (13% of the school roll). The survey found
that approximately 8% of students currently cycled to school, whereas approximately 23% would prefer
to cycle to school. Approximately 32% of students travelled to school by car and only 13% walked. A
large number of students (47%) travelled to and from school by bus, reflecting the large distances that
a significant number of students live from the school. When asked about specific problems that cyclists
might encounter on their journey to and from school, problematic crossings (32% of respondents),
busy streets/too much traffic (26%) and speeding vehicles (14%) were the three most reported themes.
When students were asked what could be done so that they could bike to school safely, wearing a
helmet, more bike lanes and safer crossings were the most reported themes (11% each).
Figure A.23 Tauranga Intermediate School has a large fenced and locked bike compound
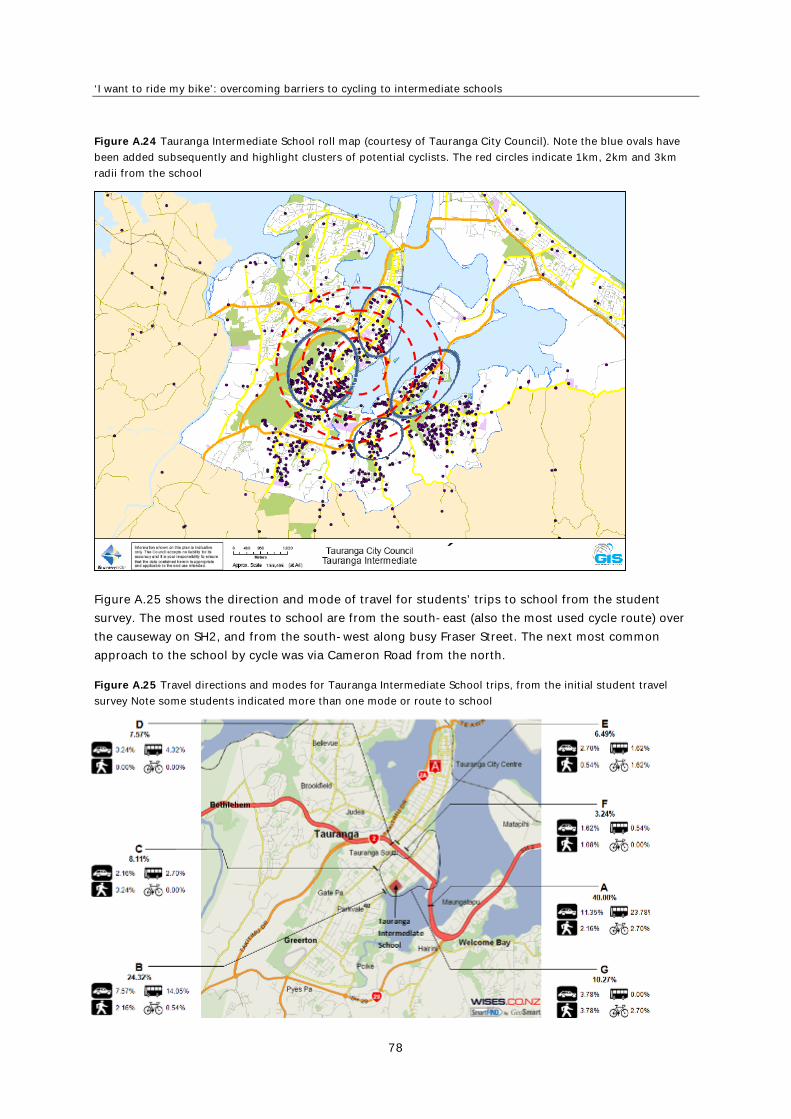
‘I want to ride my bike’: overcoming barriers to cycling to intermediate schools
78
Figure A.24 Tauranga Intermediate School roll map (courtesy of Tauranga City Council). Note the blue ovals have
been added subsequently and highlight clusters of potential cyclists. The red circles indicate 1km, 2km and 3km
radii from the school
Figure A.25 shows the direction and mode of travel for students’ trips to school from the student
survey. The most used routes to school are from the south-east (also the most used cycle route) over
the causeway on SH2, and from the south-west along busy Fraser Street. The next most common
approach to the school by cycle was via Cameron Road from the north.
Figure A.25 Travel directions and modes for Tauranga Intermediate School trips, from the initial student travel
survey Note some students indicated more than one mode or route to school
Appendix A
79
Perceptions from meeting with the principal and student focus groups
Thirteen students participated in the student focus group. Six of the students currently bike to school
whereas 11 stated that they would like to bike to school.
When asked to elaborate on specific problems that cyclists might encounter on their journey to and
from school, students mentioned the following: unsafe roads (five students); unsatisfactory cycling
facilities (five students); encountering gangs or scary people (three students); cars running red lights
(two students). Specific locations of concern included Fraser Street and the Welcome Bay roundabout,
where students mentioned there was a lack of provision for cyclists. The physical audit of the road
environment around the school confirmed the students’ concerns.
When asked what might be done to ensure that students could cycle to school safely, 12 of the 13
students suggested that more or better bike lanes and dedicated cycling facilities would help. Some
other common suggestions for making cycling to school safer included:
enforcement for motorists who park on bike lanes
better bike crossings at busy intersections
teach students the road code.
Development of a school cycle network
The initial audit, initial student survey, meeting with a school representative, roll map, focus group
with students and second physical audit were used to develop a recommended school cycle network
for Tauranga Intermediate (figure A.26). Also the Walking and Cycling Network Plan by Tauranga City
Council was used to help guide the form of the school cycling network.
The large clusters of students who live to the south-west and south-east of the school (figure A.24)
suggest that in order to make any tangible progress towards increasing the number of students cycling
to school, the routes that service these groups need to be considered as part of the school cycle
network.
Cameron Road, which serves students living to the south-west of the school, already has bike lanes on
a good length of it. However, the bike lanes on Fraser Street are incomplete (figure A.22), there are
often cars parked on them and students wanting to cycle still report this as a road of concern. It is
suggested that a 40km/h school zone be implemented on Fraser Street to assist with school cyclist and
pedestrian safety. Despite the large number of students who are served by these roads, very few use
these routes to bike to school (figure A.25).
More students cycle on the route from the south-east, which takes them over the causeway. There are
still challenges on this route though, especially at the Welcome Bay roundabout which many students
have mentioned as a trouble spot. There are physical works planned for this area which should include
some cycling improvements. This route appears to be more attractive with good cycle lanes on the
causeway (figure A.22) and an off-road route that skirts the edge of the estuary to link up with local
roads near the school. In order to make this route truly attractive to students, this entire route still
needs a certain level of upgrading. At the moment Ohauiti, Welcome Bay and Maungatapu Roads have
been left without cycle lanes (largely because they have not been identified as problem areas). These
roads might be busy enough to warrant cycle lanes but further investigation is needed.
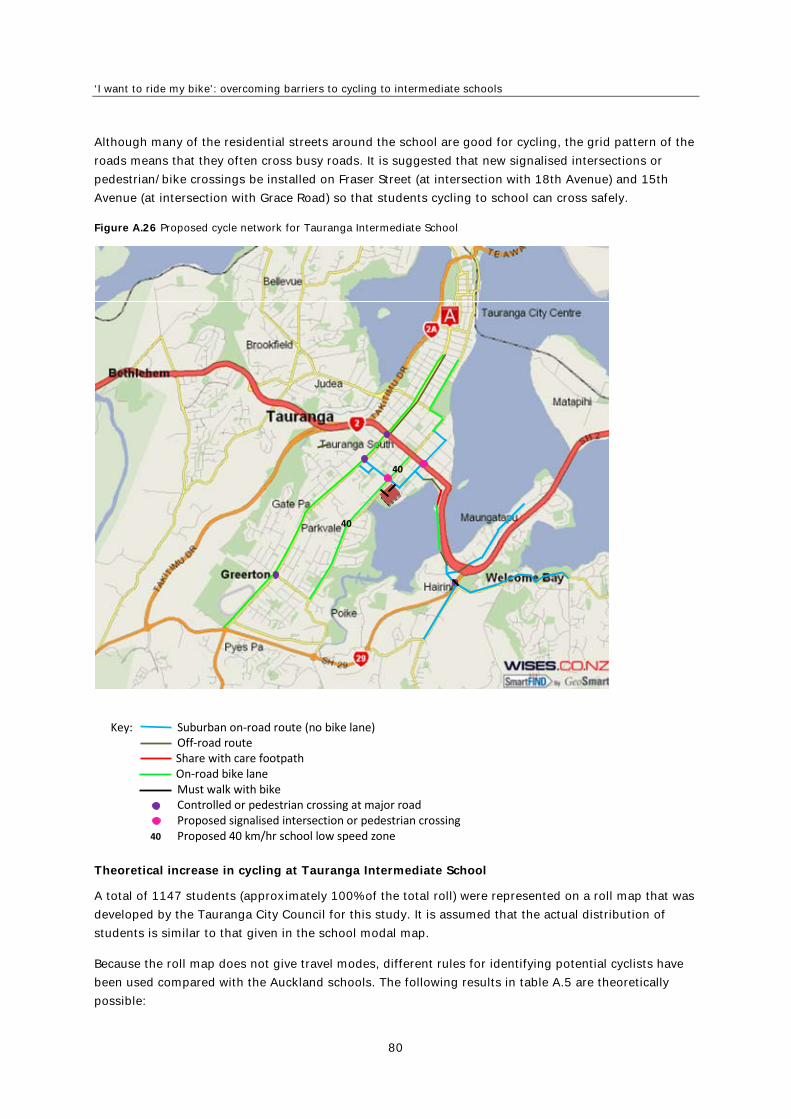
‘I want to ride my bike’: overcoming barriers to cycling to intermediate schools
80
Although many of the residential streets around the school are good for cycling, the grid pattern of the
roads means that they often cross busy roads. It is suggested that new signalised intersections or
pedestrian/bike crossings be installed on Fraser Street (at intersection with 18th Avenue) and 15th
Avenue (at intersection with Grace Road) so that students cycling to school can cross safely.
Figure A.26 Proposed cycle network for Tauranga Intermediate School
40
Key: Suburban on‐road route (no bike lane) Off‐road route
Share with care footpath On‐road bike lane Must walk with bike Controlled or pedestrian crossing at major road Proposed signalised intersection or pedestrian crossing Proposed 40 km/hr school low speed zone
40
40
Theoretical increase in cycling at Tauranga Intermediate School
A total of 1147 students (approximately 100% of the total roll) were represented on a roll map that was
developed by the Tauranga City Council for this study. It is assumed that the actual distribution of
students is similar to that given in the school modal map.
Because the roll map does not give travel modes, different rules for identifying potential cyclists have
been used compared with the Auckland schools. The following results in table A.5 are theoretically
possible:
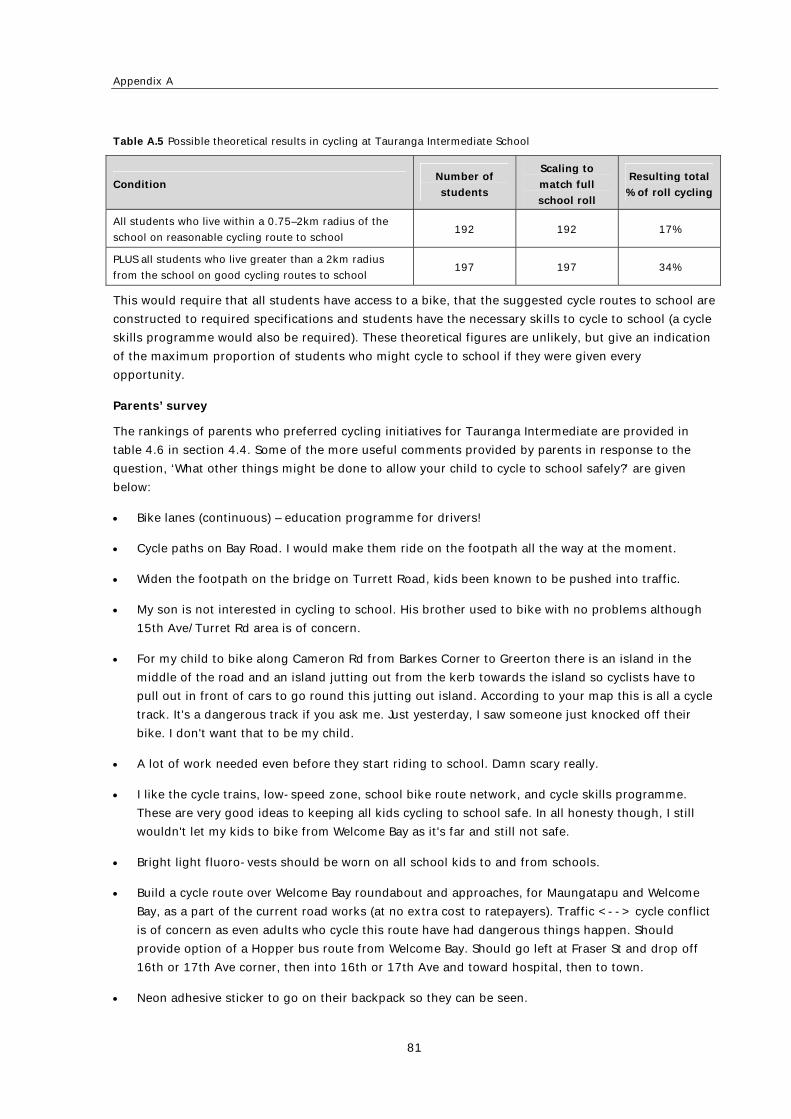
Appendix A
81
Table A.5 Possible theoretical results in cycling at Tauranga Intermediate School
Condition Number of
students
Scaling to
match full
school roll
Resulting total
% of roll cycling
All students who live within a 0.75–2km radius of the
school on reasonable cycling route to school 192 192 17%
PLUS all students who live greater than a 2km radius
from the school on good cycling routes to school 197 197 34%
This would require that all students have access to a bike, that the suggested cycle routes to school are
constructed to required specifications and students have the necessary skills to cycle to school (a cycle
skills programme would also be required). These theoretical figures are unlikely, but give an indication
of the maximum proportion of students who might cycle to school if they were given every
opportunity.
Parents’ survey
The rankings of parents who preferred cycling initiatives for Tauranga Intermediate are provided in
table 4.6 in section 4.4. Some of the more useful comments provided by parents in response to the
question, ‘What other things might be done to allow your child to cycle to school safely?’ are given
below:
Bike lanes (continuous) – education programme for drivers!
Cycle paths on Bay Road. I would make them ride on the footpath all the way at the moment.
Widen the footpath on the bridge on Turrett Road, kids been known to be pushed into traffic.
My son is not interested in cycling to school. His brother used to bike with no problems although
15th Ave/Turret Rd area is of concern.
For my child to bike along Cameron Rd from Barkes Corner to Greerton there is an island in the
middle of the road and an island jutting out from the kerb towards the island so cyclists have to
pull out in front of cars to go round this jutting out island. According to your map this is all a cycle
track. It's a dangerous track if you ask me. Just yesterday, I saw someone just knocked off their
bike. I don't want that to be my child.
A lot of work needed even before they start riding to school. Damn scary really.
I like the cycle trains, low-speed zone, school bike route network, and cycle skills programme.
These are very good ideas to keeping all kids cycling to school safe. In all honesty though, I still
wouldn't let my kids to bike from Welcome Bay as it's far and still not safe.
Bright light fluoro-vests should be worn on all school kids to and from schools.
Build a cycle route over Welcome Bay roundabout and approaches, for Maungatapu and Welcome
Bay, as a part of the current road works (at no extra cost to ratepayers). Traffic <--> cycle conflict
is of concern as even adults who cycle this route have had dangerous things happen. Should
provide option of a Hopper bus route from Welcome Bay. Should go left at Fraser St and drop off
16th or 17th Ave corner, then into 16th or 17th Ave and toward hospital, then to town.
Neon adhesive sticker to go on their backpack so they can be seen.
‘I want to ride my bike’: overcoming barriers to cycling to intermediate schools
82
Parental training and practice cycling with child in non-peak times.
From where we live – 5.8km away from TGA Intermediate. I am [expletive] scared of letting my
child ride a bike out on the main roads of TGA at all. There would have to be a lot of work done in
and around TGA, before I even started thinking about it.
Sorry but none of these initiatives would make a difference to my son cycling!! It's not the children
on bikes it's the adults in cars that need educating!! Australia has really good separate cycle lanes
with barriers from traffic!! Expensive but I would bike too if we had them!! Educate people in cars!!
Check mirrors when parked. Check and watch for children. You're missing bullying from other
school children (pushing kids off bikes, etc!!).
I think our current bike lanes are unsafe – my son rides on the footpath. They are too close to cars
and parked cars. If a car opens its door, it forces the cyclist onto the road with cars.
Specific recommendations for Tauranga Intermediate School
Like Devon Intermediate, cycling to school is a normal part of life for some students and yet there are a
number of particularly busy and unattractive roads around the school. The focus needs to be on
developing safe routes to school and this is heavily supported by parents’ comments. One advantage
Tauranga Intermediate has is that there are some very well-defined routes and any attention would
benefit a large number of students.
Cycle skills training is also another initiative that should be prioritised for Tauranga Intermediate and
based on parents’ comments, education of motorists in the area would also help.
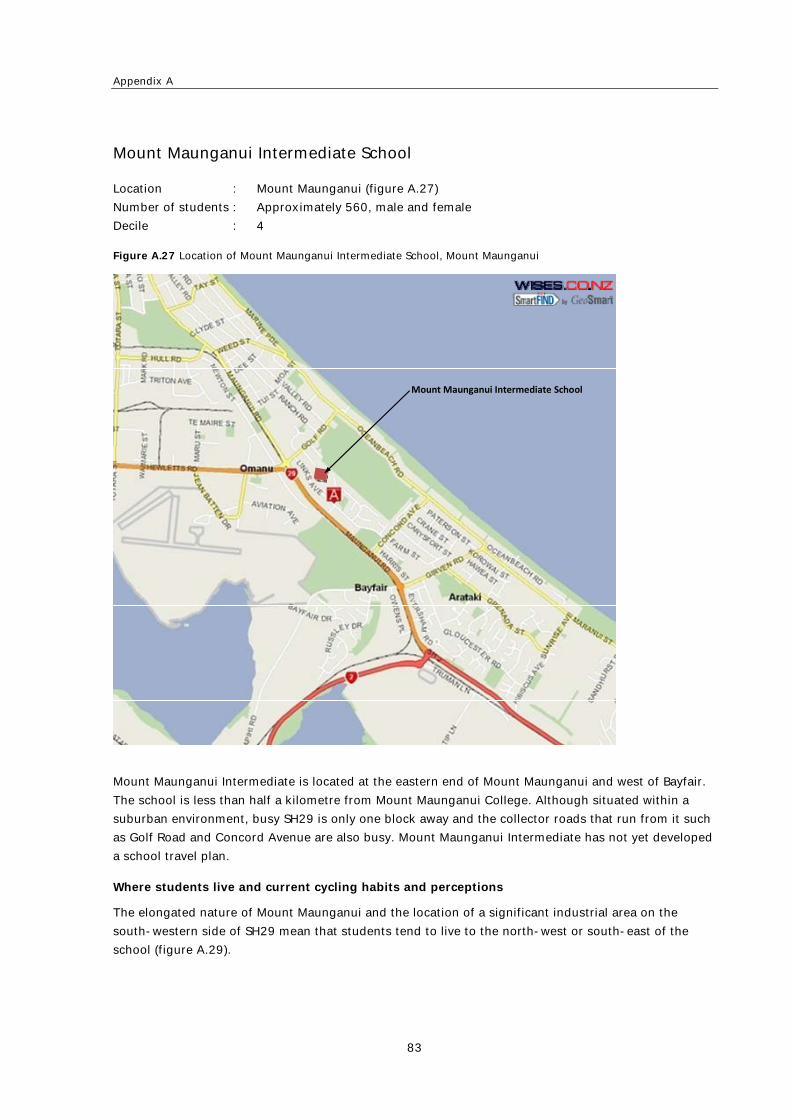
Appendix A
83
Mount Maunganui Intermediate School
Location : Mount Maunganui (figure A.27)
Number of students : Approximately 560, male and female
Decile : 4
Figure A.27 Location of Mount Maunganui Intermediate School, Mount Maunganui
Mount Maunganui Intermediate School
Mount Maunganui Intermediate is located at the eastern end of Mount Maunganui and west of Bayfair.
The school is less than half a kilometre from Mount Maunganui College. Although situated within a
suburban environment, busy SH29 is only one block away and the collector roads that run from it such
as Golf Road and Concord Avenue are also busy. Mount Maunganui Intermediate has not yet developed
a school travel plan.
Where students live and current cycling habits and perceptions
The elongated nature of Mount Maunganui and the location of a significant industrial area on the
south-western side of SH29 mean that students tend to live to the north-west or south-east of the
school (figure A.29).
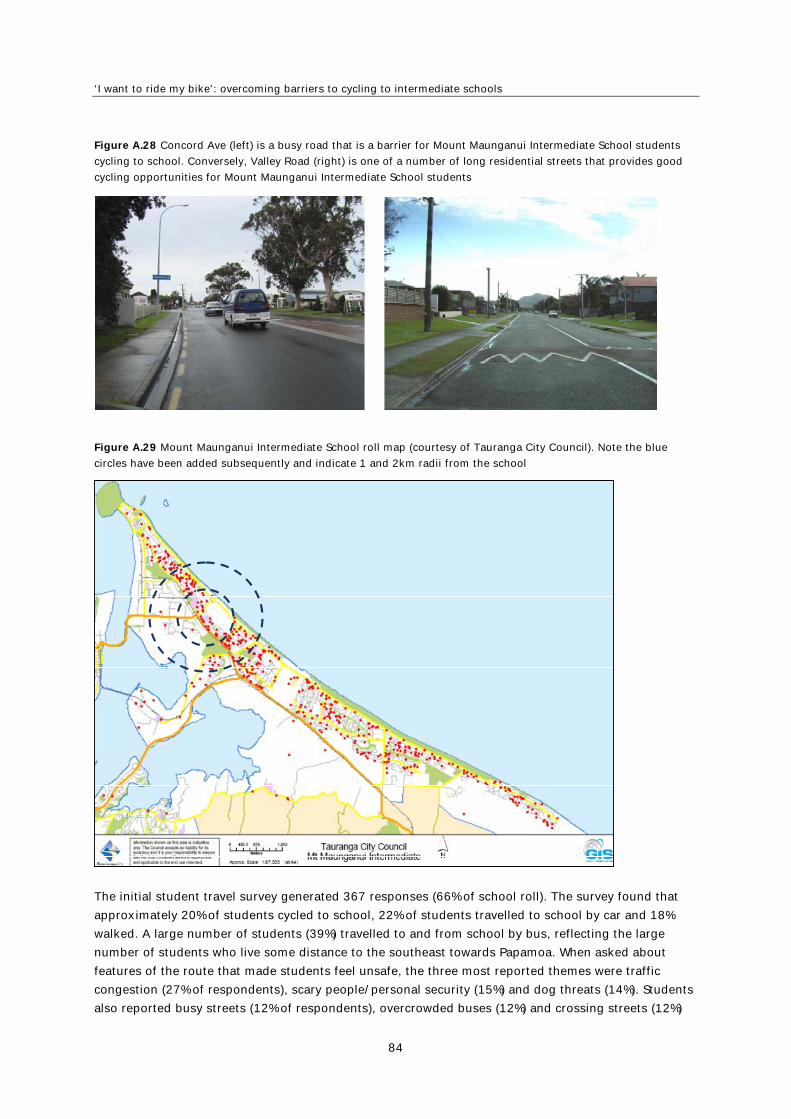
‘I want to ride my bike’: overcoming barriers to cycling to intermediate schools
84
Figure A.28 Concord Ave (left) is a busy road that is a barrier for Mount Maunganui Intermediate School students
cycling to school. Conversely, Valley Road (right) is one of a number of long residential streets that provides good
cycling opportunities for Mount Maunganui Intermediate School students
Figure A.29 Mount Maunganui Intermediate School roll map (courtesy of Tauranga City Council). Note the blue
circles have been added subsequently and indicate 1 and 2km radii from the school
The initial student travel survey generated 367 responses (66% of school roll). The survey found that
approximately 20% of students cycled to school, 22% of students travelled to school by car and 18%
walked. A large number of students (39%) travelled to and from school by bus, reflecting the large
number of students who live some distance to the southeast towards Papamoa. When asked about
features of the route that made students feel unsafe, the three most reported themes were traffic
congestion (27% of respondents), scary people/personal security (15%) and dog threats (14%). Students
also reported busy streets (12% of respondents), overcrowded buses (12%) and crossing streets (12%)
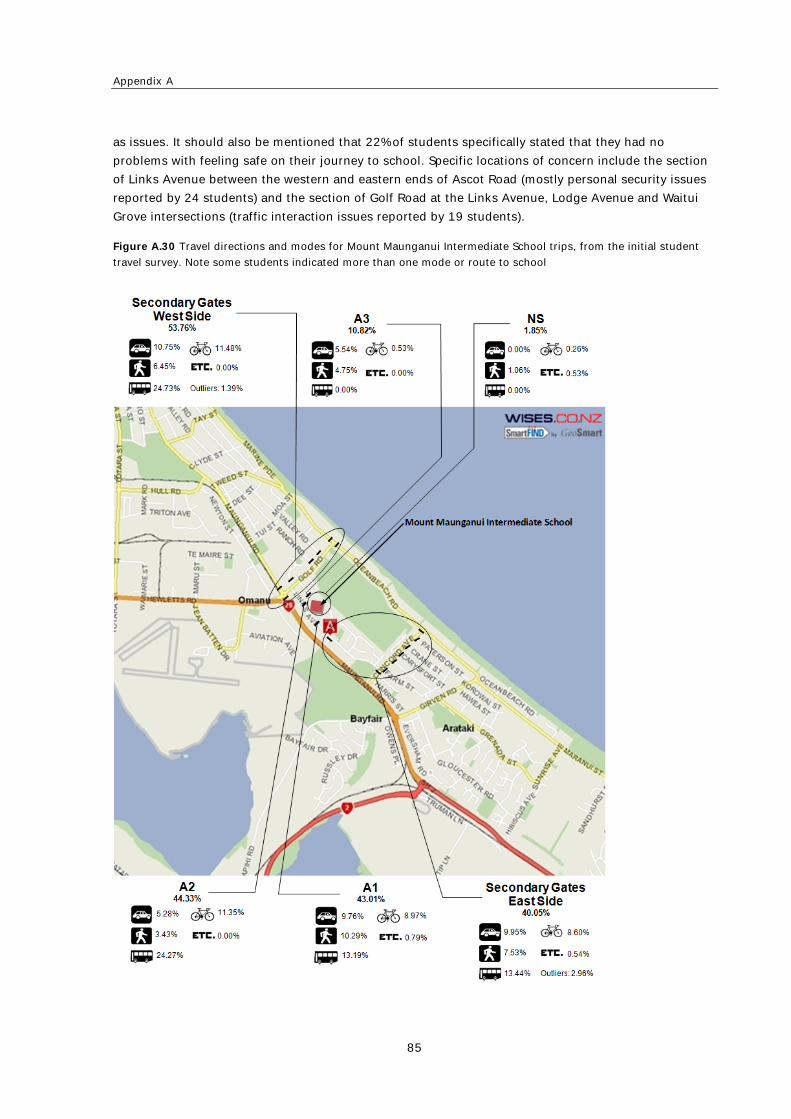
Appendix A
85
as issues. It should also be mentioned that 22% of students specifically stated that they had no
problems with feeling safe on their journey to school. Specific locations of concern include the section
of Links Avenue between the western and eastern ends of Ascot Road (mostly personal security issues
reported by 24 students) and the section of Golf Road at the Links Avenue, Lodge Avenue and Waitui
Grove intersections (traffic interaction issues reported by 19 students).
Figure A.30 Travel directions and modes for Mount Maunganui Intermediate School trips, from the initial student
travel survey. Note some students indicated more than one mode or route to school
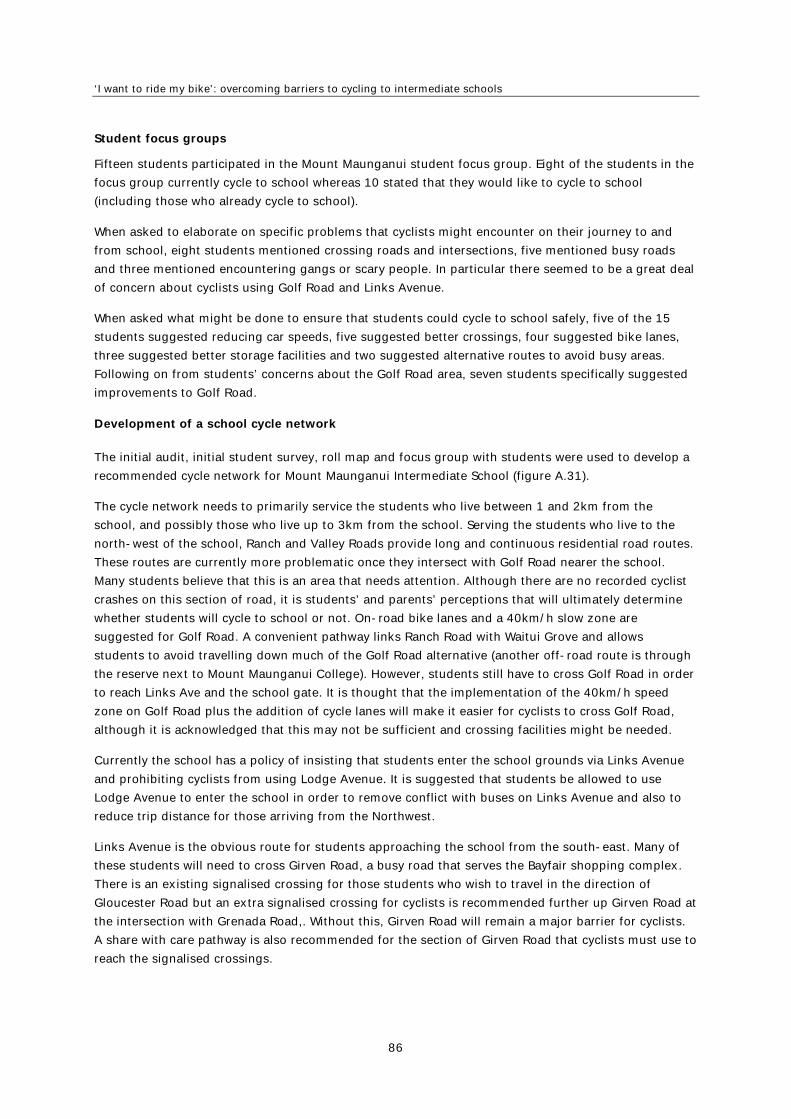
‘I want to ride my bike’: overcoming barriers to cycling to intermediate schools
86
Student focus groups
Fifteen students participated in the Mount Maunganui student focus group. Eight of the students in the
focus group currently cycle to school whereas 10 stated that they would like to cycle to school
(including those who already cycle to school).
When asked to elaborate on specific problems that cyclists might encounter on their journey to and
from school, eight students mentioned crossing roads and intersections, five mentioned busy roads
and three mentioned encountering gangs or scary people. In particular there seemed to be a great deal
of concern about cyclists using Golf Road and Links Avenue.
When asked what might be done to ensure that students could cycle to school safely, five of the 15
students suggested reducing car speeds, five suggested better crossings, four suggested bike lanes,
three suggested better storage facilities and two suggested alternative routes to avoid busy areas.
Following on from students’ concerns about the Golf Road area, seven students specifically suggested
improvements to Golf Road.
Development of a school cycle network
The initial audit, initial student survey, roll map and focus group with students were used to develop a
recommended cycle network for Mount Maunganui Intermediate School (figure A.31).
The cycle network needs to primarily service the students who live between 1 and 2km from the
school, and possibly those who live up to 3km from the school. Serving the students who live to the
north-west of the school, Ranch and Valley Roads provide long and continuous residential road routes.
These routes are currently more problematic once they intersect with Golf Road nearer the school.
Many students believe that this is an area that needs attention. Although there are no recorded cyclist
crashes on this section of road, it is students’ and parents’ perceptions that will ultimately determine
whether students will cycle to school or not. On-road bike lanes and a 40km/h slow zone are
suggested for Golf Road. A convenient pathway links Ranch Road with Waitui Grove and allows
students to avoid travelling down much of the Golf Road alternative (another off-road route is through
the reserve next to Mount Maunganui College). However, students still have to cross Golf Road in order
to reach Links Ave and the school gate. It is thought that the implementation of the 40km/h speed
zone on Golf Road plus the addition of cycle lanes will make it easier for cyclists to cross Golf Road,
although it is acknowledged that this may not be sufficient and crossing facilities might be needed.
Currently the school has a policy of insisting that students enter the school grounds via Links Avenue
and prohibiting cyclists from using Lodge Avenue. It is suggested that students be allowed to use
Lodge Avenue to enter the school in order to remove conflict with buses on Links Avenue and also to
reduce trip distance for those arriving from the Northwest.
Links Avenue is the obvious route for students approaching the school from the south-east. Many of
these students will need to cross Girven Road, a busy road that serves the Bayfair shopping complex.
There is an existing signalised crossing for those students who wish to travel in the direction of
Gloucester Road but an extra signalised crossing for cyclists is recommended further up Girven Road at
the intersection with Grenada Road,. Without this, Girven Road will remain a major barrier for cyclists.
A share with care pathway is also recommended for the section of Girven Road that cyclists must use to
reach the signalised crossings.
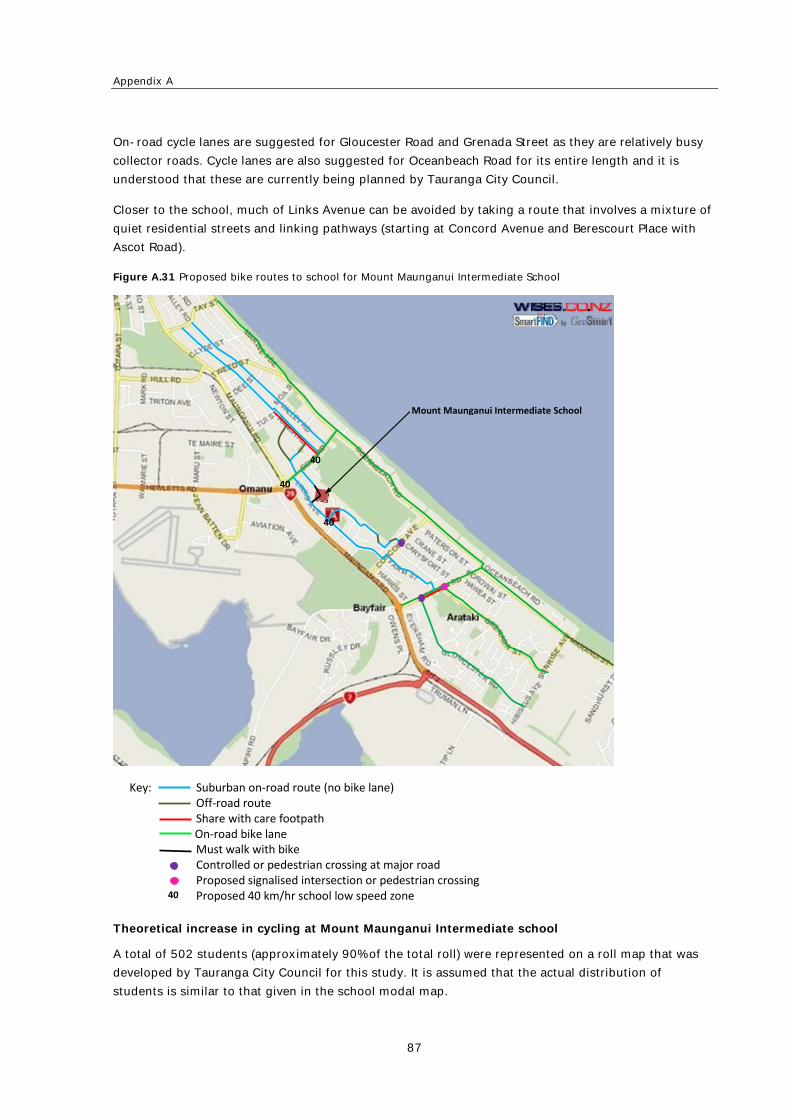
Appendix A
87
On-road cycle lanes are suggested for Gloucester Road and Grenada Street as they are relatively busy
collector roads. Cycle lanes are also suggested for Oceanbeach Road for its entire length and it is
understood that these are currently being planned by Tauranga City Council.
Closer to the school, much of Links Avenue can be avoided by taking a route that involves a mixture of
quiet residential streets and linking pathways (starting at Concord Avenue and Berescourt Place with
Ascot Road).
Figure A.31 Proposed bike routes to school for Mount Maunganui Intermediate School
Key: Suburban on‐road route (no bike lane) Off‐road route Share with care footpath On‐road bike lane Must walk with bike Controlled or pedestrian crossing at major road Proposed signalised intersection or pedestrian crossing Proposed 40 km/hr school low speed zone
40
40
40
40
Mount Maunganui Intermediate School
Theoretical increase in cycling at Mount Maunganui Intermediate school
A total of 502 students (approximately 90% of the total roll) were represented on a roll map that was
developed by Tauranga City Council for this study. It is assumed that the actual distribution of
students is similar to that given in the school modal map.
‘I want to ride my bike’: overcoming barriers to cycling to intermediate schools
88
Because the roll map does not give travel modes, different rules for recruiting cyclists compared with
the Auckland schools have been used. The following results are theoretically possible:
Table A.6 Possible theoretical results in cycling at Mount Maunganui Intermediate School
Condition Number of
students
Scaling to
match full
school roll
Resulting total
% of roll
cycling
All students who live within a 0.75–2km radius of the
school on reasonable cycling route to school 79 88 16%
PLUS all students who live greater than a 2km radius
from the school on good cycling routes to school 101 112 36%
This would require that all students have access to a bike, that the suggested cycle routes to school are
constructed to required specifications and that students have the necessary skills to cycle to school (a
cycle skills programme would also be required). These theoretical figures are unlikely, but give an
indication of the maximum proportion of students who might cycle to school if they were given every
opportunity.
Parents’ survey
The rankings of parents’ preferred cycling initiatives for Mount Maunganui Intermediate are provided in
table 4.6 in section 4.4. Some of the more useful comments provided by parents in response to the
question, ‘What other things might be done to allow your child to cycle to school safely?’ are given
below:
The children require supervision as they (many of them) ride their bikes dangerously. Doubling
veering into traffic, acting the fool.
A crossing guard on duty at the busy intersection at top of Links Avenue near KFC roundabout.
And Concord Avenue Links intersection.
Stop the bus route down Valley Road! I believe from my children that the bus gets in such close
proximity to cycling students that they are fearful for their lives. Perhaps Valley Road needs
widening to accommodate the diverse traffic on it. It was not a bus route when it was designed.
Ranch Rd also has college traffic so it was a decision for our students and friends to bike on Valley
Rd instead of Ranch. Learner drivers versus a bus! A road lane for bikes on Ocean-Beach Rd looks
interesting but the Golf Rd intersection could be a safety issue.
A crossing point (or two) on Tweed Street would be a good idea. Tweed Street is virtually an
extension of Oceanbeach Road. It is relatively narrow for a busy road and often has numerous cars
parked either side, especially nearer New World Supermarket and this can inhibit students vision
significantly and ability to react accordingly. Suggest Valley Rd, Campbell Rd, Oarkney Rd, and
Maunganui Rd. Crossing points on Golf Road at a variety of locations are necessary to ensure
student safety. Ranch Rd, Waitui Grove, and Maunganui Rd as a minimum.
We're lucky to live close enough to walk - would be good if cycling was ‘cooler’. Helmet storage
important too – maybe ok with bikes. Lots of the kids that bike seem to use the alleyway and quiet
roads, which seems sensible: Concord, Berescourt, alleyway to Solway, Compton, alleyway to
Bervick or Kinron, Ascot, Links.
Appendix A
89
Speed on Links Ave, Golf Rd; Main problem for my boys is the persons living on Links Ave trying to
bully them and trying to steal bikes they are currently using on alleyway and by-passing Links Ave
(part closest to Bayfair) and coming out at Ascot Rd not only is this a problem for cycling but also
for walking something needs to be done to ensure these persons are stopped - police drive-bys? I
don't know upsetting for parents and children. I am lucky for my children can go together and my
older son bikes to college with them and are safe on way to school just when coming home they
are by themselves. Sorry for messy writing!
One of our main concerns at the moment is Oceanbeach Rd with cars parked on kerbside. If this
was no parking during ‘school travel times’ that would make a huge difference.
Bright fluoro vests so they are more visible; pedestrian crossing on Concord Ave; pedestrian
crossing on Oceanbeach Rd near Omanu dairy (Surf Rd) – always kids crossing there – very, very
dangerous!!!; cycle tracks on Oceanbeach Rd that are not obstructed by parked cars.
I have already complained to my child's teacher and the BOT re the route to school. No action has
been taken. Students coming from north of the school are not allowed to enter the school via
Lodge Ave. They have to bike into Links Ave (which is a busy intersection of cars and walkers) and
then enter the bike rack area from Links Ave. This is stupid and forces children to enter a busy area
unnecessarily. When my older child was at Intermediate five years ago the children were allowed to
bike into Lodge Ave then walk their bikes to the bike racks. I cannot believe this is no longer
allowed.
Share care footpath extension of Ranch Rd along Campbell. Changing access to Mount. Int to
Lodge Ave – takes too long and unsafe to be let out in small groups on Links adds extra 10 mins
on Links Ave crossing too close to cars coming off Maung. Rd (too fast). A secure lock up for biker
is essential due to tyres being stabbed, pedals being loosened and wheels as well. Big issue with
tampering at intermediate. Very costly for those that bike and potential for a fatality.
Get the transport team to bike to school to see for themselves how dangerous Grenada St, Girvin
Rd, Links Ave, Golf Rd and Maunganui Rd actually are it's crazy. It's not on!!! They don't need a
survey. They're intelligent enough to just do something surely!!!??
They could also wear fluorescent vest (green) so they could be seen on the road with the school
logo at the back.
Stop being so overprotected!
Speed zones reduced cycle lanes a must and fluoro-vests a must to be worn to and from school
and fines if not worn just like helmets.
We live about 11km away from Mount Maunganui Intermediate so it is too far and too busy for my
11-year-old to cycle to school. But I do have a couple of points that I would like to mention. My
daughter had a head injury this year so I drove her to school for about three weeks (she said that
catching the bus was a contact sport which she was not allowed to do till injury healed). So I was
watching the children who do ride bikes for about 3 weeks. Some of these kids certainly need skills
courses and do downright stupid things - no crash helmet, wobble all over the centre of the road
totally unaware that cars are coming up behind them - ride bikes that are way too small to mention
but a few of the things. On the subject of skills programmes. My daughter did a skills programme
at her primary school. I thought yeah great she can ride her bike to school approx 500m away. But
she said she had to ride on the road which would mean riding turning right on to a busy 70km
‘I want to ride my bike’: overcoming barriers to cycling to intermediate schools
90
Domain Rd Papamoa and then turning right again off the 70km road about 100m away. I said just
ride around on the pavement but no she said that she was not allowed because the lady from
Tauranga City Council said that since she had an adult bike she had to ride on the road. There is
no way I would let her and there was no way she was going to break the rule and ride around on
the pavement. So she never did ride her bike to school. In a situation like this where the child can
ride 100m on the pavement and it's the safest and most practical option isn't that the best thing to
do. Actually she hasn't really rode her bike since taking the skills course. She could ride to the
shopping plaza about 1km on the pavement which has a huge grass verge but riding on the road
would be a busy road with huge trucks etc. Is that what the Tauranga City Council want?
Stop the PC bull [expletive] – kids this age can cycle to school on their own steam/responsibility
without ‘buddies’ and cycle trains - too many ‘normal’ activities are been ‘dumbed’ down -
enough!! How much did this survey cost us ratepayers??!! Waste of time - Let kids have a bit of
freedom/responsibility and consequences.
Specific recommendations for Mount Maunganui Intermediate School
Even more so than at Devon Intermediate and Tauranga Intermediate, cycling to school is a normal part
of life for many students at Mount Maunganui Intermediate. In general the environment seems to be
slightly more attractive than the roads around Tauranga and Devon Intermediates. However, the focus
still needs to be on developing safe routes to school. Relatively little engineering would be needed to
provide good routes for students.
Another initiative that should be seriously considered is allowing students to enter the school via
Lodge Ave as this route would reduce the trip length for many students and avoid some unpleasant
sections of road and conflicts with buses.
Personal security also appears to be a major issue for many students walking or cycling to school. For
this reason bike buddies or cycle trains might be a good idea, especially for those travelling on Links
Avenue. More importantly, the school should work closely with the police to address this matter.
Appendix B
91
Appendix B: Parents’ survey – students cycling to school (example: Tauranga Intermediate School)
Dear Sir/Madam,
Although many school students would like to bike to school, many parents are still very concerned
about the safety of their children cycling to school - and often for good reason. We would like to learn
more about parents’ attitudes towards their children cycling to and from school. In this survey we
would like to learn about the influence of various cycling initiatives on parents’ willingness to let their
child bike to school. This project is funded by Land Transport New Zealand.
In conjunction with Tauranga Intermediate School and Tauranga City Council, a selection of ‘cycling to
school’ initiatives are presented that might make cycling to school more attractive to students and
parents. These initiatives include engineering or physical changes, education initiatives and
enforcement initiatives. We would like you to complete this quick and short survey form. Please
note that any specific information from your survey form will be treated as confidential. We will
only share summarised or grouped findings.
Following this survey, the main findings will be shared with the school and Tauranga City Council so
that they can incorporate the findings into their plans to develop better transport for school students.
Please note that these are possible cycling initiatives and are not necessarily planned for
implementation by Tauranga City Council. However, your feedback will be considered by the school
and the Council for future cycling projects.
Please read the accompanying document titled “Possible cycling initiatives – Tauranga
Intermediate” prior to answering the following questions:
1. Please mark where you live on the map below with an “X”. If you live outside of the map, please
mark the map border at the location closest to your home.
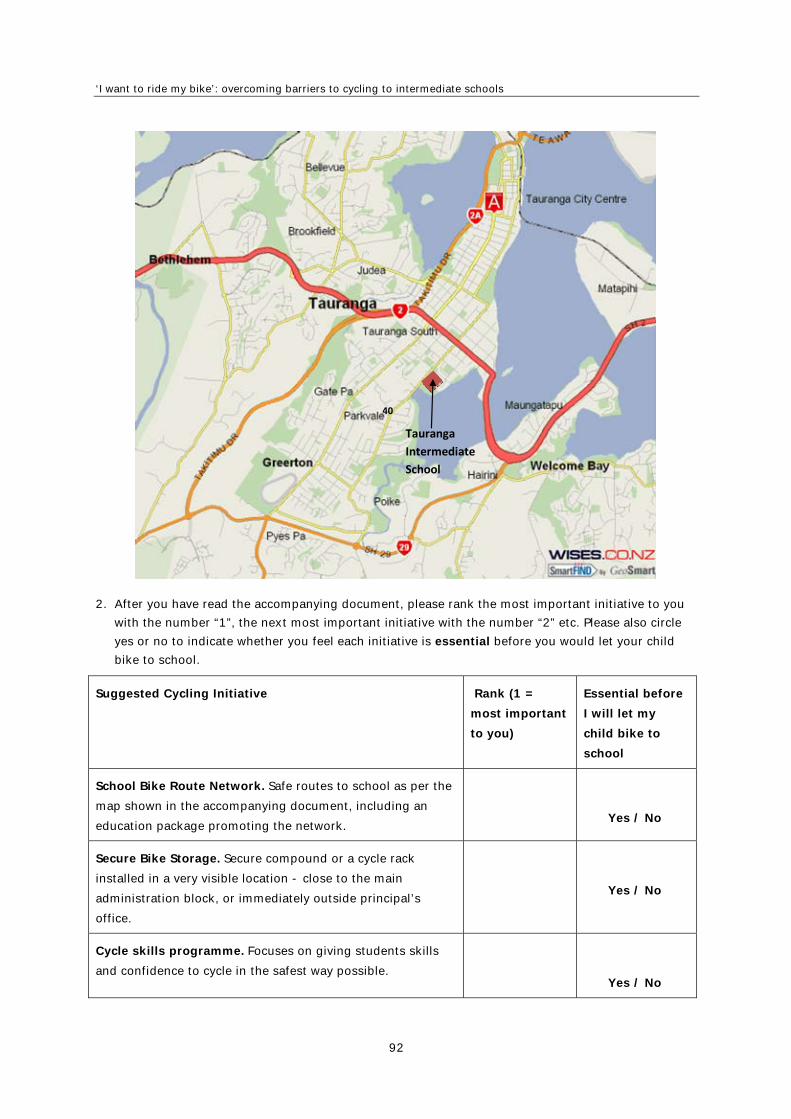
‘I want to ride my bike’: overcoming barriers to cycling to intermediate schools
92
Tauranga
Intermediate
School
40
2. After you have read the accompanying document, please rank the most important initiative to you
with the number “1”, the next most important initiative with the number “2” etc. Please also circle
yes or no to indicate whether you feel each initiative is essential before you would let your child
bike to school.
Suggested Cycling Initiative Rank (1 =
most important
to you)
Essential before
I will let my
child bike to
school
School Bike Route Network. Safe routes to school as per the
map shown in the accompanying document, including an
education package promoting the network.
Yes / No
Secure Bike Storage. Secure compound or a cycle rack
installed in a very visible location - close to the main
administration block, or immediately outside principal’s
office.
Yes / No
Cycle skills programme. Focuses on giving students skills
and confidence to cycle in the safest way possible.
Yes / No
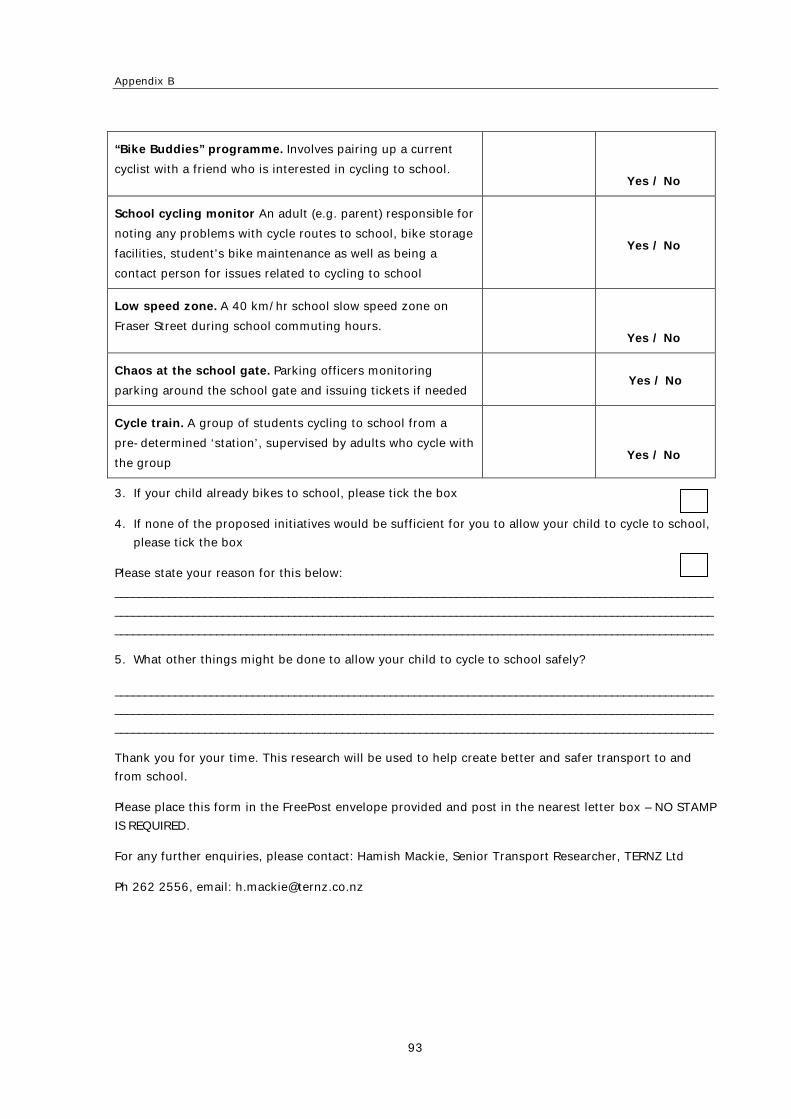
Appendix B
93
“Bike Buddies” programme. Involves pairing up a current
cyclist with a friend who is interested in cycling to school.
Yes / No
School cycling monitor An adult (e.g. parent) responsible for
noting any problems with cycle routes to school, bike storage
facilities, student’s bike maintenance as well as being a
contact person for issues related to cycling to school
Yes / No
Low speed zone. A 40 km/hr school slow speed zone on
Fraser Street during school commuting hours.
Yes / No
Chaos at the school gate. Parking officers monitoring
parking around the school gate and issuing tickets if needed
Yes / No
Cycle train. A group of students cycling to school from a
pre-determined ‘station’, supervised by adults who cycle with
the group
Yes / No
3. If your child already bikes to school, please tick the box
4. If none of the proposed initiatives would be sufficient for you to allow your child to cycle to school,
please tick the box
Please state your reason for this below:
____________________________________________________________________________________________________
____________________________________________________________________________________________________
____________________________________________________________________________________________________
5. What other things might be done to allow your child to cycle to school safely?
____________________________________________________________________________________________________
____________________________________________________________________________________________________
____________________________________________________________________________________________________
Thank you for your time. This research will be used to help create better and safer transport to and
from school.
Please place this form in the FreePost envelope provided and post in the nearest letter box – NO STAMP
IS REQUIRED.
For any further enquiries, please contact: Hamish Mackie, Senior Transport Researcher, TERNZ Ltd
Ph 262 2556, email: [email protected]

‘I want to ride my bike’: overcoming barriers to cycling to intermediate schools
94