Overcapacity in Steel - Amazon Web Services in Steel: China’s Role in a Global Problem iii Table...
62
Overcapacity in Steel China’s Role in a Global Problem SEPTEMBER 2016
Transcript of Overcapacity in Steel - Amazon Web Services in Steel: China’s Role in a Global Problem iii Table...

Overcapacity in SteelChina’s Role in a Global Problem
SEPTEMBER 2016


Author:Lukas Brun
Overcapacity in SteelChina’s Role in a Global Problem
SEPTEMBER 2016

Copyright © 2016 Center on Globalization, Governance & Competitiveness, Duke University
All rights reserved. Except for brief quotations in a review, this book, or parts thereof, must not be reproduced in any form without permission in writing from the publisher.For information, address:Alliance for American Manufacturing711 D Street NW, 3rd FloorWashington, D.C. 20004202-393-3430americanmanufacturing.org
First published August 2016 by the Alliance for American Manufacturing
Photos by Getty Images & Shutterstock
Printed in the United States of America.

Overcapacity in Steel: China’s Role in a Global Problem iii
Table of ContentsEXECUTIVE SUMMARY ...........................................................................................................1
What is overcapacity? ..............................................................................................2
Why is it a problem? ................................................................................................2
What causes overcapacity? .....................................................................................2
What can be done to address overcapacity? ..........................................................3
1. INTRODUCTION ...................................................................................................................5
2. DEFINING OVERCAPACITY .................................................................................................7
2.1 What is overcapacity? ........................................................................................7
2.2 Measures of overcapacity in steel .....................................................................8
2.3 Future steel capacity additions ........................................................................12
2.4 The effects of overcapacity ..............................................................................16
2.5 Conclusion .......................................................................................................19
3. THE CAUSES OF OVERCAPACITY ....................................................................................20
3.1 Overcapacity caused by variable demand (“cyclical overcapacity”) ...............20
3.2 Overcapacity caused by excessive supply (“structural overcapacity”) ...........22
3.3 China ................................................................................................................23
3.3.1 Subsidies and loose lending policies ........................................................26
3.3.2 National-local dynamics ...........................................................................29
3.3.3 High exit barriers ......................................................................................30
3.4 Conclusion .......................................................................................................31
4. POLICY ACTIONS ...............................................................................................................33
4.1 China’s commitments in bilateral dialogues ....................................................33
4.2 China’s domestic policy commitments to address overcapacity ....................36
4.2.1 Macro policies ..........................................................................................37
4.2.2 Forced closures ........................................................................................38
4.3.3 Improving environmental quality ................................................................39
4.2.4 Encouraging M&A activity ........................................................................40
4.2.5 FDI ...........................................................................................................42
4.2.6 “One Belt, One Road” ..............................................................................42
4.2.7 Concluding thoughts ................................................................................44
4.3 U.S. efforts .......................................................................................................45
ENDNOTES ..............................................................................................................................47

iv Overcapacity in Steel: China’s Role in a Global Problem
FiguresFigure 1: Global crude steel production, capacity, and overcapacity, 1980-2017(f) .......................8
Figure 2: Regional production, capacity, and overcapacity, 2000-2015 ......................................10
Figure 3: Crude steel capacity additions by region, 2000-2014 ..................................................11
Figure 4: Regional contribution to steel overcapacity, 2015 ........................................................11
Figure 5: Underway and planned steel capacity additions, by region, 2014-2017 ......................12
Figure 6: Historical and projected capacity utilization rates in the global steel industry, 1980-2017(f) .......................................................................................................16
Figure 7: 2015 Steel capacity utilization, by region .....................................................................17
Figure 8: Profitability and capacity utilization rate in the steel industry, 1992-2014 ......................18
Figure 9: The effect of state subsidies on steel production capacity ...........................................22
Figure 10: Crude steel production and capacity utilization rates in China, 2000-2015 ................24
Figure 11: 2009 survey results regarding causes for overcapacity in China ................................25
Figure 12: Central government actions to curb overcapacity (2006-2015) ..................................36
Figure 13: Output of the top 10 steel groups in China, as percentage of total production ...........41
TablesTable 1: 2015 crude steel production, top 30 countries ...............................................................9
Table 2: Underway and planned capacity additions by 2017, by country....................................13
Table 3: Major importers and exporters of steel ..........................................................................14
Table 4: 2015 steel imports and exports, by region ....................................................................15
Table 5: Energy subsidies to Chinese steel, 2000-2007 (US$) ....................................................27
Table 6: Chinese steel capacity, closures, and net capacity additions (in MT), 2010-2014 ..........38

Overcapacity in Steel: China’s Role in a Global Problem v
AbbreviationsBRIC Brazil. Russia, India, China
CIS Commonwealth of Independent States
CISA China Iron and Steel Association
EBITDA Earnings Before Interest, Taxes, Depreciation and Amortization
ECU European Currency Unit
EPB Environmental Protection Board
EU European Union
FDI Foreign Direct Investment
FSU Former Soviet Union
GDP Gross Domestic Product
M&A Mergers and Acquisitions
MIIT Ministry of Industry and Information Technology (China)
MT Million metric tons
NDRC National Development and Reform Commission (China)
NME Non-Market Economy
OECD Organization for Economic Coordination and Development
RMB Renminbi (China’s currency)
S&ED Strategic and Economic Dialogue (US-China)
SASAC State Assets Supervision and Administration Commission (China)
SOE State Owned Enterprises
USITC United States International Trade Commission
USTR United States Trade Representative
VAT Value Added Tax
WTO World Trade Organization

vi Overcapacity in Steel: China’s Role in a Global Problem
AcknowledgmentsDuke CGGC gratefully acknowledges the Alliance for American Manufacturing (AAM) for sponsoring the research for this report. We also thank 10 anonymous reviewers for their extensive comments and suggestions. The opinions expressed or conclusions made in this study are those of the author, and are not necessarily shared or endorsed by the project sponsor. The author holds exclusive responsibility for errors of fact or interpretation. Duke CGGC welcomes comments and suggestions. The author may be contacted at [email protected].
About the AuthorLukas Brun is a Senior Research Analyst at Duke CGGC and project manager for the study. His research at CGGC uses global value chain analysis to understand the competitiveness of firms and regions. Lukas holds master’s degrees with concentrations in economic development and international political economy from the University of North Carolina at Chapel Hill and bachelor’s degrees in economics and political science from Texas Christian University. Lukas has more than 10 years of experience in economic analysis and managing economic development research projects.
About the Duke Center on Globalization, Governance & CompetitivenessThe Duke University Center on Globalization, Governance & Competitiveness (Duke CGGC) undertakes client-sponsored research that addresses economic and social development issues for governments, foundations, and international organizations. As a university-based research center, we address clients’ real world questions with transparency and rigor. Learn more about us at www.cggc.duke.edu.
About the Alliance for American ManufacturingThe Alliance for American Manufacturing (AAM) is a non-profit, non-partisan partnership formed in 2007 by some of America’s leading manufacturers and the United Steelworkers. Our mission is to strengthen American manufacturing and create new private-sector jobs through smart public policies. We believe that an innovative and growing manufacturing base is vital to America’s economic and national security, as well as to providing good jobs for future generations. AAM achieves its mission through research, public education, advocacy, strategic communications, and coalition building around the issues that matter most to America’s manufacturers and workers. More information about AAM is available at www.americanmanufacturing.org.

Overcapacity in Steel: China’s Role in a Global Problem 1
The global steel sector is once again in a state of overcapacity. The sector, predominantly fueled by China’s expansion since 2000, has grown to over 2,300 million metric tons (MT) while only needing 1,500 MT to meet global demand. The result is a global steel sector at unviable profit levels and an influx of cheap steel in the global trading system adversely affecting companies, workers, and the global trading regime.
The reaction of countries to overcapacity is predictable: trading partners with domestic steelmaking capacity seek commitments from China to reduce its excess capacity and eliminate further subsidies to the sector, while filing trade cases and taking other necessary actions to protect their domestic industry. China’s response has been to acknowledge the overcapacity problem in its steel sector and make repeated commitments to reduce capacity, yet due to either an unwillingness or inability to honor its commitments, it struggles to address overcapacity in its steel sector. Since 2007, when overcapacity in the Chinese steel sector became apparent in its own planning documents, China has added 552 MT of new capacity, equivalent to seven times total U.S. steel production in 2015.
The last time significant overcapacity existed in the global steel sector in the 1970s and 1980s, European countries made hard choices about reducing subsidies, addressing resulting unemployment, and finding a way for market-based competition to flourish. The current status quo — which has resulted in lost profits for companies, lost jobs for workers, and an increasingly contentious trading relationship among countries — is untenable for the future of a global trading regime presumed to be based on the comparative and competitive advantages of nations, not state-based subsidies. Rising trade frictions have led to trade cases, which, even if successful, occur after damage has already been done. The companies that file the cases end up with diminished power, as they must file and pay for the lengthy litigation, suffer the effects of reduced profits, and idle production lines.
China’s “state capitalism” model, still heavily influenced and controlled by Beijing, is at the core of the current overcapacity problem in the steel sector. To address overcapacity, China must reform to reduce the systemic nature of state-led development in the country and become more aligned with market economy principles as generally practiced.
Overcapacity in Steel: China’s Role in a Global Problem E X E C U T I V E S U M M A RY

2 Overcapacity in Steel: China’s Role in a Global Problem
What is overcapacity?Overcapacity is industrial capacity not utilized by production. Although a certain amount of unutilized capacity in capital-intensive sectors, like steel, over the short-term is normal due to fluctuations in demand, persistent overcapacity indicates overinvestment in the stock of facilities constituting aggregate supply in a sector. This is where we are today.
Why is it a problem?Overcapacity affects the profitability of companies in the sector because mills cannot produce at economically sustainable levels, which for many steel mills is around 80 percent capacity utilization. Reduced company profitability affects the incentives of companies to invest in their facilities and workers, which ultimately reduces the competitiveness of the sector in the national economy, leading to sectoral unemployment. In the United States, 14,500 steel workers have been unemployed due to the current economic condition of the industry. In addition, overcapacity caused by
government subsidies and access to cheap finance incentivizes production to cover bond payments and the fixed costs necessary to maintain productive capacity. The result is cheap steel flooding the international trading system, whose price is determined by the amount of government subsidies and the requirement to make bond payments. This runs counter to the comparative or competitive advantage of nations serving as the basic assumption of the international trading regime. Long-term overcapacity, in short, affects companies, their workers, and the stability of the international trading system developed since World War Two.
What causes overcapacity?Cyclical overcapacity is caused by variability in demand. When economic downturns occur, factories have more productive capacity than existing demand for a product can support.
Structural overcapacity is caused by overinvestment in industrial steelmaking facilities. Overinvestment in the most recent era has been created by China’s “state
Quantity
Pric
e
D
S
S1
P1
Q1
P2
Q2
State subsidies shift the supply curve from S to S1, increasing quantity supplied from Q1 to Q2, and reducing price from P1 to P2.

Overcapacity in Steel: China’s Role in a Global Problem 3
capitalism” model, which designates “pillar” and “strategic” industries for special growth targets and financial incentives that are received largely independent of market conditions. The result of this overinvestment is a rightward shift in the supply curve, whereby more units of a good are supplied than what the market alone would provide. In particular, overcapacity in China’s steel sector is caused by subsidized energy and other inputs, access to cheap finance, and national versus subnational government dynamics, notably the financial and tax incentives of provincial and local government to increase steelmaking capacity independent of market prices and the mandates of China’s central government.
What can be done to address overcapacity?In a market economy, cyclical overcapacity can be managed through the actions of private actors reducing capacity in their production facilities as a result of market signals, and macroeconomic policies supporting economic growth. Structural overcapacity is a more intractable problem. At the heart of the solution is reducing incentives for growing the industrial stock in steelmaking facilities, and removing exit barriers to allow unprofitable capacity to permanently close. To achieve these goals, China should implement announced reforms regarding its tax structure, the career-advancement criteria of local and provincial officials, and the role of subsidies and cheap finance in the economy to make the steel industry more subject to market signals. Ongoing consolidation of large steelmaking state-owned enterprises (SOEs) should be matched with permanent net reductions in steelmaking capacity, government funding should focus on reducing the negative social effects of widespread unemployment in the
sector, and stricter environmental controls in China may be part of the solution in placing the national government in a stronger bargaining position vis-à-vis subnational governments. Until the reforms promised by China show tangible results in addressing oversupply in steelmaking facilities, its trading partners should pursue traditional trade remedies when specific instances of harm can be substantiated, fully pursue the rights of domestic producers, and postpone the decision to grant market economy status for purposes of the World Trade Organization (WTO). At the same time, net capacity additions in steelmaking facilities by developing countries other than China should be seriously reconsidered in light of extremely low profitability levels in the industry. The path forward requires addressing both demand and supply imbalances in the steel sector to return it to profitability, and to develop an international trading system recognizing that market and nonmarket economies follow different incentives and goals, and to find a basis for mutually beneficial exchange despite them.
“Excess capacity has a distorting and damaging effect on global markets and implementing policies to substantially reduce production in a range of sectors suffering from overcapacity – including steel and aluminum – is critical to the function and stability of international markets.”
– U.S. Treasury Secretary Jack Lew, 2016 Strategic and Economic Dialogue, June 5-7, 2016

“The steel market is in a state of
crisis, resulting primarily from
massive global excess capacity,
much of which has stemmed from
the trade-distortive government
policies and actions.... Unless
China starts to take timely and
concrete actions to reduce its
excess production and capacity
in industries including steel, and
works with others to ensure
that future government actions
do not once again contribute to
excess capacity, the fundamental
structural problems in the
industry will remain and affected
governments – including the United
States – will have no alternatives
other than trade action to avoid
harm to their domestic industry
and workers.”
– U.S. Commerce Secretary Penny Pritzker, April 18, 2016

Overcapacity in Steel: China’s Role in a Global Problem 5
The global steel sector is once again in a state of overcapacity. China’s expansion of its steel sector since 2000 has grown capacity in the global steel sector to over 2,300 million metric tons (MT) while only 1,500 MT is needed to meet global demand. The result is a global steel sector with record low profits and an influx of cheap steel in the global trading system affecting companies, workers, and the global trading regime.
The reaction of countries to overcapacity is to be expected: trading partners with domestic steelmaking capacity seek commitments from China to reduce its capacity and eliminate further subsidies to the sector. China’s response has been to acknowledge the overcapacity problem in its steel sector and make repeated commitments to reduce capacity, yet due to either an unwillingness or inability to honor its commitments, it continues to add capacity in its steel sector. Since 2007, when overcapacity in the Chinese steel sector became apparent in its own planning documents, China has added 552 MT, equivalent to seven times U.S. steel production in 2015.
The last time significant overcapacity existed in the global steel sector was in the 1970s and 1980s, when European countries made hard choices about reducing subsidies, addressing unemployment, and finding a way for market-based competition to flourish. China’s “state capitalism” model, which is at the core of the current overcapacity problem
in the steel sector, may be harder to reform because of the systemic nature of state-led development in the country. But the current status quo, in which the result is lost profits for companies, lost jobs for workers, and an increasingly contentious trading relationship among countries, is untenable for the future of a global trading regime presumed to be based on the comparative and competitive advantages of nations, not state-based subsidies. Rising trade frictions have led to trade cases, which, even if successful, lead to the diminished power of companies that must file and pay for the lengthy litigation, suffer the effects of reduced profits, and idle production lines.
Industrial overcapacity — the difference between potential output and current production — is caused by multiple factors, including overinvestment and insufficient demand. Industrial overcapacity occurs in many sectors, particularly in capital-intensive industries in which investments are made with long-term planning horizons. The effects of overcapacity are to reduce or eliminate profits in an industry, a condition currently being experienced in the global steel industry. Remedies to overcapacity are either to reduce capacity — through mothballing capacity, consolidating capacity through mergers and acquisition, or exiting the market — or to increase demand for the industry’s product until price recovers to profitable levels.
1Introduction

6 Overcapacity in Steel: China’s Role in a Global Problem
The purpose of this report is to investigate the concept of industrial overcapacity by first defining what is meant by the term. The term has been discussed in academic articles and consultant reports for a number of years, often used interchangeably with the term “excess capacity.” We shed light on what is meant by overcapacity to have a more precise debate on its causes, effects, and public policy solutions.
The second goal of this report is to quantify global industrial overcapacity in the steel industry. What measures exist regarding the amount of global overcapacity in the steel industry, and what are future expectations regarding the growth or decline of overcapacity in the steel industry?
The third goal of the report is to investigate the causes of global industrial overcapacity. The rise of state capitalism, in which SOEs rather than private corporations are dominant actors, is often mentioned in the literature as a cause for global industrial overcapacity. We investigate the support for the claim within the steel industry.
Finally, the fourth goal of the report is to discuss the effectiveness of policies seeking to address the issue of overcapacity at the international and national level. Industrial overcapacity is recognized as contributing to trade frictions among nations. What policy levers exist within current WTO rules to help address the issue? What can be done within the bilateral trading relationships between countries to reduce trade frictions related to industrial overcapacity?
The answers to these questions are complex, and their solutions require coordination between sovereign actors. At the outset, we posit that legitimate concerns regarding the fairness of the international trade system can be explored without coloring the conversation with appeals to protectionism and xenophobia. We seek a better functioning international trade system, and the analysis covered herein should be read with that goal in mind.
A crane operator looks onto a floor filled with steel products in a warehouse in Shanghai, China, on April 10, 2009.

Overcapacity in Steel: China’s Role in a Global Problem 7
2.1 What is overcapacity?The term overcapacity is commonly used to describe a situation in which productive capacity is greater than current production. Stated simply, overcapacity is capacity unutilized by current production. Industrial overcapacity can be measured at the firm, national, and international level, and is the difference between production capacity and actual production, meaning overcapacity is the complementary proportion of the capacity utilization rate.
To quantify overcapacity, one needs measures of capacity and production. Capacity can be measured as nameplate capacity, which is the intended full-load sustained output of a facility. Alternatively, it can be measured as “effective capacity,” which is nameplate capacity minus some standard percentage allowed for maintenance and other scheduled downtimes.1 We use nameplate capacity reported by the Organization for Economic Co-operation and Development (OECD) and the German Steel Federation as the basis for our overcapacity calculations.2
The second part of the overcapacity calculation is a production measure. The World Steel Association and World Steel Dynamics maintain data on steel production widely used by industry. We use annual production data provided by the World Steel Association to calculate crude steel production. Capacity and production measures allow the calculation of overcapacity, which is the difference between productive capacity and its utilization in current production, i.e., residual capacity.3
2Defining overcapacity
“We recognize that global excess capacity in industrial sectors, especially steel, is a pressing structural challenge with global implications and this issue needs to be urgently addressed through elimination of market distorting measures and, thereby, enhancement of market function.”
– G-7 meeting, May 26-27, 2016

8 Overcapacity in Steel: China’s Role in a Global Problem
2.2 Measures of overcapacity in steelFigure 1 provides a time series of global crude steelmaking capacity, production, and nominal overcapacity from 1980-2014, and forecasts for 2015-2017.
The figure illustrates that nominal steelmaking capacity averaged 1,000 MT from 1980-1994, grew gradually through 2000 to 1,056 MT, and then accelerated rapidly after 2001 to reach 2,371 MT in 2015. From 2000-2015, nominal global steelmaking capacity additions averaged 82MT per year, which is roughly equivalent to total annual U.S. steel production.4 In other words, the world was adding steelmaking capacity equivalent to U.S. annual steel production for more than a decade, a remarkable rate of growth in
steelmaking capacity, most of it centered in China.5 Production generally kept up with the rise in global capacity until 2009, when the financial crisis affected global demand for steel, and overcapacity for the first time exceeded 500 MT. Nominal overcapacity averaged 242 MT from 1980-2007; estimates for 2015 place overcapacity at 750 MT. To put that number in context, existing overcapacity is equivalent to the combined 2015 crude steel production of the top 30 nations (except China), including the United States, European Union (EU), Japan, South Korea, and Russia — the traditional powerhouses of global steel production. See Table 1
The rise in nominal global steel overcapacity parallels the 2008-2009 global economic crisis and China’s rapid development in steelmaking capacity. Figure 2 illustrates the major steel producing regions in the world6 and their
Figure 1: Global crude steel production, capacity, and overcapacity, 1980-2017(f)
Source: Duke CGGC, capacity from OECD (2000-2017) and German Steel Federation (1980-1999); production from World Steel Association. Forecasted production for 2016-2017 from World Steel Dynamics.
0
500
1,000
1,500
2,000
2,500
1980
1981
1982
1983
1984
1985
1986
1987
1988
1989
1990
1991
1992
1993
1994
1995
1996
1997
1998
1999
2000
2001
2002
2003
2004
2005
2006
2007
2008
2009
2010
2011
2012
2013
2014
2015
2016
2017
Mill
ions
of
Met
ric
To
ns
nominal capacity
production
overcapacity
1980–2007 avg: 242MT
2008–2017 (est) avg: 540MT

Overcapacity in Steel: China’s Role in a Global Problem 9
capacity, production and overcapacity from 2000-2015, the most recent year for which regional data are available. Over the period, the U.S., Japan and the former Soviet Union (FSU) each averaged around 25 MT of overcapacity, while the EU averaged 50 MT. In contrast, China’s overcapacity grew steadily from almost zero in 2000 to 336 MT in 2015.7
China’s role in contributing to the global overcapacity problem in the steel sector is reinforced by an examination of the source of global capacity additions since 2000. As shown in Figure 3, China exceeded all other regions in adding capacity since 2000 with 990 MT, accounting for more than 75 percent of steelmaking capacity additions in the world since 2000. As a percentage of existing stock, China added 662 percent to its existing crude steelmaking capacity since 2000. Other Asian countries (excluding Japan and China) added
a significant amount of capacity (173 MT), while the United States and Japan slightly reduced crude steelmaking capacity since 2000.
In 2015, 46 percent (336.2 MT) of nominal global overcapacity in steel was located in China, 9 percent (62.9 MT) was located in Europe, 6 percent (37.8 MT) in the FSU, 5 percent (35 MT) in the US, 3 percent (25.4 MT) in Japan, and 31 percent in all other countries (see Figure 4).
Table 1: 2015 crude steel production, top 30 countries
Rank Country MT Rank Country MT Rank Country MT
1 China 803.3 11 Italy 22 21 Belgium 7.3
2 Japan 105.2 12 Taiwan, China 21.4 22 Netherlands 7
3 India 89.4 13 Mexico 18.2 23 South Africa 6.4
4 United States 78.8 14 Iran 16.1 24 Vietnam 6.1
5 Russia 70.9 15 France 15 25 Egypt 5.5
6 South Korea 69.7 16 Spain 14.8 26 Czech Republic 5.3
7 Germany 42.7 17 Canada 12.5 27 Saudi Arabia 5.2
8 Brazil 33.3 18 United Kingdom 10.9 28 Argentina 4.9
9 Turkey 31.5 19 Poland 9.2 29 Australia 5.0
10 Ukraine 23.0 20 Austria 7.7 30 Slovak Republic 4.6
Top 30 1,552.9
Top 30 (ex. China) 749.6 Source: World Steel Association, World Steel in Figures 2016

10 Overcapacity in Steel: China’s Role in a Global Problem
Figure 2: Regional production, capacity, and overcapacity, in MT, 2000-2015
Note: figures represent nominal raw steelmaking capacity, production and overcapacity in million metric tons (MT) across the major steel producing regions in the world. Please note the difference in scale for China and all other regions.Source: Duke CGGC, calculated from the German Steel Federation (capacity) and World Steel Association (production).
overcapacity
production
capacity
China
EU (28) FSU
USA Japan
0
50
100
150
200
250
2000
2001
2002
2003
2004
2005
2006
2007
2008
2009
2010
2011
2012
2013
2014
2015
2000
2001
2002
2003
2004
2005
2006
2007
2008
2009
2010
2011
2012
2013
2014
2015
0
50
100
150
200
250
0
50
100
150
200
250
2000
2001
2002
2003
2004
2005
2006
2007
2008
2009
2010
2011
2012
2013
2014
2015
2000
2001
2002
2003
2004
2005
2006
2007
2008
2009
2010
2011
2012
2013
2014
2015
0
50
100
150
200
250
0
200
400
600
800
1,000
1,200
2000
2001
2002
2003
2004
2005
2006
2007
2008
2009
2010
2011
2012
2013
2014
2015
2000
2001
2002
2003
2004
2005
2006
2007
2008
2009
2010
2011
2012
2013
2014
2015

Overcapacity in Steel: China’s Role in a Global Problem 11
Figure 4: Regional contribution to steel overcapacity, 2015
Note: ROW is “rest of the world.” Data represents the calculated nominal overcapacity across major steel producing regions for 2015. See also Note 7.Source: Duke CGGC, based on German Steel Federation (capacity) and World Steel Association (production)
Japan25.4
FSU 37.8
China336.2
ROW227.3
EU (28) 62.9
USA35.0
Japan4%
FSU6%
ROW31%
EU (28)9%
USA5%
China46%
Nominal Overcapacity (MT) Share of Global Overcapacity (%)
Figure 3: Crude steel capacity additions by region, 2000-2014
Source: Duke CGGC, calculated from the German Steel Federation, Statistische Jahrbuch der Stahlindustrie (2015)
2%
105%
24%
-2%
22%
56%
34%
296%
-10%
662%
132%
7%
49%
4.1
29.2
29.3
(1.9)
3.8
25.5
8.3
45.3
(15.2)990.4
172.8
0.6
9.8
EU
FSU
USA
Canada
Latin America
Africa
Middle East
Japan
China
Asia (ex. China & Japan)
Australia
Rest of World (ROW)
W. Europe (non-EU)
EU
FSU
USA
Canada
Latin America
Africa
Middle East
Japan
China
Asia (ex. China & Japan)
Australia
Rest of World (ROW)
W. Europe (non-EU)
Nominal Capacity Additions (MT) Percent Capacity Additions

12 Overcapacity in Steel: China’s Role in a Global Problem
2.3 Future steel capacity additionsDespite already high levels of existing global steelmaking overcapacity, and continued forecasts for weak global steel demand, more than 100 MT of new capacity additions are underway and a further 352 MT of new capacity are planned to be completed by 2017.8 The largest sources for planned new capacity additions are in Asia, where 328 MT, or 73 percent of expected world capacity additions, is expected to come into production by 2017, most of it in India. The Middle East is expected to add 52 MT of additional capacity by 2017 to its existing 58.1 MT steelmaking capacity, accounting for 12 percent of global underway and planned capacity additions. (See Figure 5. Note that the specific countries contributing to the capacity additions are discussed immediately below.)
The countries with the largest additions to steelmaking capacity are listed in Table 2 below. India leads with underway and planned additional capacity, with 237.5 MT, consistent with its 2013 policy announcement that steelmaking capacity would have to increase to 300 MT by 2025-2026 to meet expected demand.9 Already expanding capacity at an annual rate of 9.5 percent, the OECD considers it likely that India will become the second largest global producer of steel in the medium term.10 “Other Asian” countries have 49.4 MT of underway and planned capacity, of which Vietnam (8.7 MT), Indonesia (1.7 MT), and the Philippines (1.4 MT) makeup the largest share of underway capacity additions.11 China plans to add 41 MT of steelmaking capacity by 2017, with 28 MT underway, and another 13 MT planned. Iran also plans significant capacity additions, with 12 MT underway and 23 MT planned.
Figure 5: Underway and planned steel capacity additions, by region, 2014-2017
Note: Projects include projects underway and investments planned. As such, there is significant uncertainty as to how many projects will come on stream; some planned projects may not be realized due to market pressures in the current period of economic weakness.Source: OECD (2015) “Capacity Developments in the World Steel Industry (December).”
Nominal Capacity Additions (MT) Percent Capacity Additions
16.6327.6
13.6
4.4
21.4
52.1
11.3
5.0
Africa
FSU
Europe
Latin America
Middle East
NAFTA
Oceana
Asia
Africa
FSU
Europe
Latin America
Middle East
NAFTA
Oceana
Asia
3.7%72.5%
3.0%
1.0%
4.7%
11.5%
2.5%
1.1%
Total capacity additions from 2014: 452MT Total capacity additions from 2014: 19%

Overcapacity in Steel: China’s Role in a Global Problem 13
The global capacity additions are indicative of a trend wherein net importers of steel in the developing world are creating domestic steelmaking capacity to supply their export-oriented product markets and domestic development objectives.12 Just as China changed from being a net importer before December 2004 to being the world’s largest net exporter since the first half of 2006 (see Table 3), countries are seeking to substitute steel imports with domestic production and achieve self-sufficiency in steel demand.13 However, self-sufficiency in steel production has already been reached for many of the countries with the largest capacity additions planned or underway, notably India and China.14
As shown in Table 4, Asian countries other than China and Japan (India, Thailand, Vietnam, Philippines, Indonesia, and Malaysia) are the largest net importers of steel in the world, representing almost 64 MT of net imports into the region. China and Japan are the largest suppliers of steel imports to these Asian countries, but new domestic steelmaking capacity is rapidly increasing in these countries and could replace Chinese imports of commodity grade steel in these markets, while higher grade steel imports from Japan could rise due to increased automobile production in the region.15 Vietnam’s Master Plan targets the steel sector to grow to 40 MT by 2025, up from 12 MT in 2014. The strategic plan in the Philippines targets the steel sector to grow to 20 MT by 2030, up
Table 2: Underway and planned capacity additions by 2017, by countryCountry 2017 (underway) 2017 (planned) Total
India 30.8 206.7 237.5
Other Asia* 13.0 36.4 49.4
China 27.7 13.3 41.0
Iran 11.8 22.9 34.7
Brazil 2.0 12.8 14.8
Russia 4.1 7.0 11.1
Saudi Arabia 4.7 6.2 10.9
Australia - 5.0 5.0
Other Europe - 4.4 4.4
Turkey - 4.4 4.4
Egypt 2.0 2.0 4.0
Korea 0.9 0.8 1.7
Ukraine - 1.5 1.5
Japan (2.0) - (2.0)
Others 5.2 28.4 33.6
Total 100.2 351.8 452.0
* “Other Asia” includes Taiwan, Indonesia, Malaysia, Pakistan, Philippines, Thailand, and VietnamNote: Projects include projects underway and investments planned. As such, there is significant uncertainty as to how many planned projects will come on stream due to market pressures in the current period of economic weakness.Source: OECD 2015 (updated December 2015)

14 Overcapacity in Steel: China’s Role in a Global Problem
from 2 MT in 2014.16 Countries in the Middle East, particularly Iran and Saudi Arabia, have some of the fastest annual rates of growth in steelmaking capacity in the world (14.6 percent and 12.6 percent, respectively).17 Iran announced plans to increase its domestic production to 55 MT by 2025 with intentions to become a net steel exporter after it achieves self-sufficiency in steel.18 Currently, China is the largest steel exporter to the Middle East. As in Asia, it could face increased competition from domestic steelmaking capacity in the region.
The implications of these trends are three-fold. First (and somewhat less related to the topic of this paper), some export markets will be increasingly tough for foreign companies to penetrate and maintain market share as domestic production replaces some steel
imports, especially in commodity grade steel. Second, global overcapacity in steel will likely remain at historic levels if net increases in steel production capacity are not paired with even greater increases in steel demand. However, to date, the likelihood of a global recovery in demand necessitating further net increases in steelmaking capacity is extremely low.19 The OECD forecasts that GDP growth will be 3.3 percent in 2016 and 3.6 percent in 2017.20 Instead, increases in steel production capacity will further exacerbate an already historic level of overcapacity in the sector. Third, and perhaps most importantly, the goal of achieving self-sufficiency in steelmaking is anathema to a global trading system in which factors of production are presumably exchanged based on the comparative and competitive advantage of nations. The opportunity costs for developing indigenous
Table 3: Major importers and exporters of steel
RankNet Imports (imports - exports) MT Rank
Net Exports (exports - imports) MT
1 United States 26.5 1 China 98.4
2 Viet Nam 14.9 2 Japan 34.9
3 Thailand 13.4 3 Russia 25.3
4 Indonesia 9.4 4 Ukraine 16.9
5 Mexico 8.6 5 Brazil 10.5
6 Egypt 7.7 6 South Korea 9.5
7 Saudi Arabia 6.4 7 Netherlands (2) 3.8
8 Algeria 6.4 8 Taiwan, China 3.7
9 United Arab Emirates 6.0 9 Austria (2) 3.2
10 India 5.7 10 Belgium (2) 3.1
11 Poland (2) 4.1 11 Slovakia (2) 2.2
12 Bangladesh 4.0 12 Luxembourg 1.8
13 European Union (28) (1) 3.9 13 Singapore 1.7
14 Iran 3.8 14 Kazakhstan 1.2
15 Turkey 3.7 15 Finland (2) 0.9
(1) Excluding intra-regional trade(2) Data for individual European Union (28) countries include intra-European tradeSource: World Steel Association, World Steel in Figures 2016

Overcapacity in Steel: China’s Role in a Global Problem 15
Tab
le 4
: 201
5 st
eel i
mp
ort
s an
d e
xpo
rts,
by
reg
ion
Exp
ort
ing
Reg
ion
/ C
oun
try
Eur
op
ean
Uni
on
Oth
er
Eur
op
eC
ISN
AF
TAO
ther
A
mer
ica
Afr
ica
&
Mid
dle
E
ast
Chi
naJa
pan
Oth
er
Asi
aO
cean
aTo
tal
Imp
ort
s
of
whi
ch:
extr
a-re
gio
nal
imp
ort
s
Importing Region / Country
Eur
op
ean
Uni
on
106.
45.
514
.50.
42.
01.
48.
50.
34.
90.
114
4.1
37.7
Oth
er E
uro
pe
10.3
0.7
8.8
0.0
1.0
0.1
3.2
0.4
1.3
0.0
25.8
25.2
CIS
1.3
0.4
8.7
0.0
0.0
0.0
1.6
0.1
0.3
0.0
12.5
3.7
NA
FTA
7.3
2.5
3.1
17.4
6.4
0.6
4.4
4.3
9.1
0.4
55.5
38.1
Oth
er A
mer
ica
1.4
1.1
0.6
1.3
2.9
0.0
8.4
1.4
1.3
0.0
18.3
15.5
Afr
ica
7.3
3.2
6.8
0.2
0.4
1.6
9.2
1.3
1.4
0.0
31.3
29.7
Mid
dle
Eas
t1.
84.
94.
70.
10.
20.
010
.71.
74.
90.
029
.129
.1
Chi
na1.
30.
20.
00.
10.
10.
00.
05.
26.
10.
113
.213
.2
Jap
an0.
10.
00.
00.
00.
00.
01.
30.
04.
50.
05.
95.
9
Oth
er A
sia
2.9
0.1
4.4
0.4
1.7
0.8
63.5
25.9
23.0
0.3
122.
999
.9
Oce
ana
0.2
0.0
0.0
0.0
0.0
0.1
0.8
0.2
2.2
0.3
3.8
3.5
Tota
l Exp
orts
140.
218
.551
.719
.914
.84.
711
1.6
40.8
59.0
1.2
462.
430
1.4
of w
hich
: ext
ra-
regi
onal
exp
orts
33.8
17.8
43.0
2.5
11.9
3.1
111.
640
.836
.00.
930
1.4
Net
Exp
orts
(e
xpor
ts -
impo
rts)
-3.9
-7.3
39.2
-35.
6-3
.5-5
5.7
98.4
34.9
-63.
9-2
.6
Not
e: T
otal
s m
ay n
ot a
dd
due
to
roun
din
g.S
ourc
e: W
orld
Ste
el A
ssoc
iatio
n, W
orld
Ste
el in
Fig
ures
201
6

16 Overcapacity in Steel: China’s Role in a Global Problem
steelmaking capacity are likely to be much greater than if nations simply traded for required inputs like steel.
Clearly, additional investment leading to net capacity additions in industries like steel that have existing overcapacity is a choice driven by considerations other than economic return, since the return on investment in these industries is already extremely low. In China, for example, the average return on iron and steel companies is typically below 3 percent, the lowest level in the industrial sector21, leading observers to comment that the profit of a ton of steel is not sufficient to buy an ice cream cone.22 The Chinese model may have worked for China due to its great domestic demand for steel during an unprecedented time of economic growth from 2000 to 2008. But in the post-boom era, countries developing indigenous capacity in industries experiencing overcapacity should consider on
what economic grounds these investments are being made, what development goals they are trying to achieve, and especially, what the opportunity costs are for additional investments.
2.4 The effects of overcapacityAt the firm and industry level, low capacity utilization (high overcapacity) affects profitability, with effective capacity utilization rates of around 80 percent generally considered necessary for steel plants to remain profitable.23 As illustrated in Figure 6, the average nominal capacity utilization rate from 1980-2014 averaged 76 percent, ranging from 65 percent in 1982 to a high of 86 percent in 2006. The World Steel Association estimates that global capacity
Figure 6: Historical and projected capacity utilization rates in the global steel industry, 1980-2017(f)
Note: I: 1980’s steel crisis; 2: recovery; 3: Soviet collapse; 4: China boom; 5: financial crisis; 6: current overcapacitySource: Duke CGGC, capacity from OECD (2000-2017) and German Steel Federation (1980-1999); production from World Steel Association. Forecasted production for 2016-2017 from World Steel Dynamics.
I IIIII IV V VI
50.0%
60.0%
70.0%
80.0%
90.0%
100.0%
1980
1981
1982
1983
1984
1985
1986
1987
1988
1989
1990
1991
1992
1993
1994
1995
1996
1997
1998
1999
2000
2001
2002
2003
2004
2005
2006
2007
2008
2009
2010
2011
2012
2013
2014
2015
f
2016
f
2017
f35-year average: 76%

Overcapacity in Steel: China’s Role in a Global Problem 17
utilization averaged 69.4 percent in June 2016, well below the 80 percent necessary for long-term viability.24
Six periods of fluctuating capacity levels have occurred since 1980. The first period is the 1980s steel crisis, resulting from the effect of the 1970s oil crises, high inflation and low growth in the mid- to late-1970s.25 Recovery from the 1980s steel crisis (period 2) increased capacity utilization rates throughout the 1980s until the end of the Cold War, and the Soviet collapse left former Soviet Union steel producing countries with unutilized capacity throughout much of the 1990s (period 3). The period also included the Asian financial crisis beginning in 1997, which deepened the crisis in the steel sector, and resulted in the some of the worst financial conditions the steel industry had seen until the current period.26 The period ended with the rapid growth of Chinese steel demand, which increased global capacity utilization rates from 2000 to 2008 (period 4). The global
financial crisis dramatically reduced capacity utilization in steel (period 5), from which full recovery has not occurred in the current period (period 6). Global capacity utilization rates in the steel industry are now slightly below what they were during the worst years of the global financial crisis.
Capacity utilization rates vary across regions. In 2015, capacity utilization rates ranged from 69 percent in the United States to almost 81 percent in Japan. Capacity utilization in China averaged 70.5 percent. (see Figure 7). Future expectations about capacity utilization are consistent with these averages. Morgan Stanley expects that global capacity utilization will remain low through 2017.
Low capacity utilization affects company profitability. At the firm level, the relationship between capacity utilization and steel industry profitability was examined by the OECD. Its preliminary study estimates that the effect of a 1 percent increase in capacity utilization
Figure 7: 2015 Steel capacity utilization, by region
Source: Duke CGGC, based on German Steel Federation (capacity) and World Steel Association (production)
72.9%
71.0%
69.2%
80.6%
70.5%
EU (28) FSU USA Japan China
World average: 68.9%

18 Overcapacity in Steel: China’s Role in a Global Problem
is around a 0.3 percentage point increase in the Earnings before Interest, Taxes, Depreciation and Amortization EBITDA/sales ratio, a common measure of profitability.27 Overcapacity affects industry profits because plant-level efficiencies are not maximized, leading to higher production costs, and because steel prices tend to be lower during periods of low capacity utilization, leading to lower per unit revenues.28 The OECD noted that world steel prices have declined since 2011, and in 2015 declined by 20 percent.29 The result of declining prices is declining profitability, which have resulted in “… the financial performance of the industry is perhaps worse now than it was during the global steel crisis of the late 1990’s, in large part due to the significant excess capacity that exists today.”30 Indeed, a recent report by the OECD states that the overall financial health of steelmaking companies is now worse than during the steel crisis of 1997 to
2002, and that “recent trends in key financial indicators raise serious concerns and suggest that the global industry is in a very difficult economic and financial situation.”31 It further states that “[s]teel market developments during 2015 suggest that the financial situation is rapidly deteriorating, leading to bankruptcy events, closures of steel plants across the world and mounting trade disputes.”32
The impacts of overcapacity extend beyond firm-level profitability, as weak profitability can lead to bankruptcies and job losses. In the current period, steel plant closures have already been announced. From January 2015 – June 2016, the U.S. steel industry lost 14,500 jobs due to significant increases in steel imports and decreases in steel exports.33 Similar effects regarding job losses are being experienced by steel companies in the United Kingdom and Japan.34
Figure 8: Profitability and capacity utilization rate in the steel industry, 1992-2014
Source: OECD (2015) “Evaluating the financial health of the steel industry” DSTI/SU/SC(2015)12/FINAL
1992
1993
1994
1995
1996
1997
1998
1999
2000
2001
2002
2003
2004
2005
2006
2007
2008
2009
2010
2011
2012
2013
2014
0%
5%
10%
15%
20%
25%
60
65
70
75
80
85
90
95
100
EBITDA/SALES (left scale) CUR (right scale)

Overcapacity in Steel: China’s Role in a Global Problem 19
In addition, excess capacity contributes to trade friction, as export surges can develop, leading to lower prices and the loss of market share for import-competing domestic producers.35 Steel exports from China to the world have quadrupled since 2005, from 27.4 MT to 111.6 MT in 2015; and doubled just since 2012.36 The displaced production creates incentives for governments to undertake trade action and government intervention to protect domestic industries.37 For example, during the 1997 to 2002 steel crisis, trade actions escalated against East Asian and FSU countries, with the United States, EU, Canada, and Mexico filing the majority of antidumping and countervailing duty cases. President George W. Bush also announced in 2002 a 30 percent tariff on certain steel imports based upon a determination by the United States International Trade Commission (USITC) that the domestic industry was seriously injured from imports, permitting Section 201 trade actions.38 In the current period, from January to mid-May 2015, the WTO announced that G-20 economies had applied 145 new trade restrictive measures, a record average of 20 per month, with many in the metals industry.39 U.S. Commerce Secretary Penny Pritzker stated in August 2016 that 161 anti-dumping and countervailing duty cases on steel products are currently being enforced.40 In short, the effects of overcapacity in the steel industry are low prices, weak profitability, bankruptcies, job losses, and increased trade frictions.
2.5 ConclusionIt is important to take note of some summary findings. First, we find that global nominal overcapacity has grown from an average of 250 MT from 1980 to 2007 to 750 MT in 2015. Second, we find that the increase in nominal global steel overcapacity parallels China’s development of crude steelmaking capacity. While other major steel producing regions maintained excess capacity levels
from 2000 to 2015, and Japan and the United States even reduced overall capacity, China’s capacity grew steadily from 150 MT to 1,140 MT in 2015.41 Today, China has the largest nominal share in steel overcapacity, accounting for about 336 MT, or 46 percent, of global steel overcapacity. Third, we find that future global steel overcapacity levels will be exacerbated by planned steel capacity additions in China and other developing countries in Asia, notably India, Vietnam, and Indonesia. Fourth, we find that overcapacity reduces profitability in the global steel industry, with each percentage point decrease in capacity utilization associated with around a 0.3 percentage point decrease in the EBITDA/sales ratio. Thus, we agree with the summary assessment of industry observers that overcapacity is the biggest threat to the steel sector because it leads to low profit margins, subsequent plant closures and job losses, and increased friction in the global trading system.42 The next two sections summarize what we found about the causes for steel overcapacity (section 3), and the policies undertaken to address industrial overcapacity in the steel sector (section 4).
“The G-20 has added to the chorus of voices calling for tackling the root causes of excess capacity for the benefit of both developing and developed countries.”
– U.S. Trade Representative Michael Froman, July 10, 2016

20 Overcapacity in Steel: China’s Role in a Global Problem
The causes of overcapacity can be discussed at the firm, national, and international levels and can be divided into two major categories: 1) cyclical overcapacity caused by variable demand and other industry specific factors occurring over the short term; and 2) structural overcapacity caused by excessive supply, which includes factors such as government interventions in the steel sector, particularly subsidies and other forms of government support occurring over the longer term. We discuss each category of causes below.
3.1 Overcapacity caused by variable demand (“cyclical overcapacity”)In theory, overcapacity ought to be a short-term phenomenon. When demand and prices fall, profit-maximizing firms should reduce production and idle capacity. If the situation persists, firms will seek to permanently reduce capacity because the costs of maintaining capacity, notably maintaining furnaces and rolling facilities, decrease profits. Firms not maximizing profits will exit the market, while more efficient producers will capture market share, effectively eliminating excess capacity in the industry.
In practice, however, economic downturns cause overcapacity because capacity is price insensitive in the short-term; that is, the physical plant has limited, if any, ability to rapidly reduce its total capacity in response to changes in price. High exit barriers in the steel industry prevent rapid adjustments to capacity. The costs of reducing capacity include the dismantling and demolition of mills, environmental clean-up and remediation, and legacy pension or other labor-related costs. Expectations about increases in future demand and the cyclical nature of the industry also limit the incentives of steel producers to reduce plant capacity in the face of economic downturns. Many countries seek to preserve steelmaking capacity during economic downturns in order to mitigate increases in unemployment. Public subsidies or tax rebates are rationalized as preserving a strategic industry and reducing the effects of social problems caused by unemployment. Therefore, many steel producers find that the marginal cost of reducing capacity exceeds the marginal benefit, and prefer to continue production at lower levels to cover fixed costs, while either holding inventory or shipping the excess tonnage to spot markets where it is sold at lower prices.43 The result is overcapacity.44
3The Causes of Overcapacity

Overcapacity in Steel: China’s Role in a Global Problem 21
Global overcapacity caused by variable demand was most recently experienced during the 2008 financial crisis, although periodic sharp increases in global overcapacity (decreases in capacity utilization) occurred globally in the early 1980s (see Figure 6). In addition to global industrial overcapacity is regional overcapacity. Regional crises, such as the collapse of the Soviet Union in 1991, the Asian and Russian financial crises in 1997 to 1998 and intermittent Latin America debt and financial crises [1981, 1994 (Mexico), 1999 (Brazil), 2001 to 2002 (Argentina)]45 can affect regional capacity utilization ratios sharply. At times, the effects of these regional crises manifest themselves in the United States as steel import crises, in which rapid declines in steel consumption abroad make export markets attractive for foreign producers, at almost any price, in order to shed inventory and cover portions of their fixed costs. Imports become attractive in the United States when their price is $100 per ton less than the price of equivalent domestic production.46 These periodic, sharp reductions in consumption result in surplus production, which is then exported to eliminate inventory. The flood of imports reduces the domestic price of steel and affects domestic producers and workers, sometimes quite significantly. For example, in the immediate aftermath of the 1998 Asian financial crisis and the resulting steel import crisis in the United States, more than 40 domestic steel companies filed for bankruptcy protection, with at least six stopping business operations entirely, laying off at least 6,600 workers and risking the pension and healthcare benefits of another 100,000 current and retired steelworkers.47 From 2000 to 2014, the United States reduced capacity by 1.9 MT.
Among other traditional causes for excess capacity, the investment time-horizon of industries is an important factor. Investment decisions about capacity additions in capital-intensive industries are made with much longer time horizons than in labor-intensive industries because of the time it takes to
design, build, and place into operation new capacity. The tendency in many capital-intensive industries is to wait to make investment decisions until the capacity in place is stressed by current demand. When capacity is tight, multiple actors in the industry perceive the same investment opportunity and make simultaneous investment decisions. This leads to a situation characteristic of capital-intensive industries in which capacity investments are “lumpy”, and capacity is either a constraint or a burden for the industry.48 Other capital-intensive industries with perennial over- or undercapacity issues are airlines, shipping, and automobile manufacturing.49
At the plant level, overcapacity is quite common. The nameplate capacity rating on a plant is often greater than effective capacity due to normal maintenance requirements and seasonal production fluctuations. In addition, marginal improvements to the production process and the introduction of new technology may increase operational capacity above nameplate capacity, referred to in the industry as “capacity creep.” Overcapacity may also be used to meet increased demand for the firm’s products, which it can supply with production from unused capacity. Academic investigations have also hypothesized that excess capacity at the firm level may deter new entrants into a market. However, the balance of the evidence shows that firms hold excess capacity because of variable demand or because of the lumpy investment horizon in the industry.50
“Both sides recognize that excess capacity in steel and other sectors is a global issue.”– China Vice Premier Wang Yang, 2016 Strategic and
Economic Dialogue, June 5-7, 2016

22 Overcapacity in Steel: China’s Role in a Global Problem
3.2 Overcapacity caused by excessive supply (“structural overcapacity”)Understanding the structural causes for overcapacity requires an investigation into the difference between the production capacity needed to meet market demand, which is determined by price, and the additional capacity supplied due to non-price factors. The OECD finds that three general categories of non-price factors are creating global overcapacity in steel:
■ over-investment due to government actions, specifically incentives, subsidies, rebates, and other preferential treatment of the industry
■ exit barriers
■ investment barriers51
Subsidies and other financial incentives offered by governments to increase capacity contribute to structural overcapacity because steel producers seek to capture the financial rewards offered by the state, which are independent of the profits derived from market exchange. Examples of financial incentives provided by governments contributing to overcapacity are production subsidies, in which each unit of output receives a fixed financial bonus; and input subsidies, in which factors of production needed by an industry are subsidized by the government resulting in reduced input costs. The result of these non-price factors is a rightward shift in the supply curve whereby more units of a good (in this case, steel production capacity) are supplied than what the market alone would provide. See Figure 9.
Exit barriers contribute to overcapacity because more sellers remain in the market than an efficient market would allow. Examples of exit barriers include economic
Figure 9: The effect of state subsidies on steel production capacity
Source: Duke CGGC
Quantity
Pric
e
D
S
S1
P1
Q1
P2
Q2
State subsidies shift the supply curve from S to S1, increasing quantity supplied from Q1 to Q2, and reducing price from P1 to P2.

Overcapacity in Steel: China’s Role in a Global Problem 23
barriers, such as demolition, environmental, pension and labor costs associated with plant closures; and noneconomic barriers, such as governmental policies (anti-closing laws) or state ownership intended to maintain employment levels. Firms also face exit barriers when their liabilities, such as the burden of servicing debt, exceed assets, and markets for selling assets are weak due to unfavorable industry-wide price-to-book ratios.52 Exit barriers keep companies in an industry despite low or even negative returns on investment, hindering consolidations necessary for economically-sized assets, adopting new technologies, and/or shifting a firm’s strategic position to more profitable areas. Industries with exit barriers are characterized by high levels of excess capacity that is not retired because distressed firms do not exit the market, and price cutting becomes the dominant competitive behavior in the industry as firms try to fill their plants to achieve breakeven levels.53 Observers of the steel industry comment that the overcapacity problems experienced in the global industry are characteristic of high exit barriers.54
In addition, investment policies such as restrictions on foreign direct investment reduce the ability of foreign firms to create firms with competitive economies of scale and scope, the introduction of new more efficient production technologies, and the elimination of smaller, local firms possessing old assets.55 The investment climate in the industry, however, must be favorable to allow foreign direct investment to be an effective mechanism for upgrading an industry and reducing structural overcapacity.
Although structural overcapacity has occurred over the years in different regions, including Europe and Japan, overcapacity in the steel industry is today most significant in China, where we estimate that 336 MT — approximately half of global nominal overcapacity — existed in 2015.56 In the next section, we discuss the development of China’s steel sector and analyze the causes
of overcapacity in China before addressing policy responses in Section 4.
3.3 ChinaChina’s remarkable growth in steelmaking capacity has occurred since the early 1990s, when the sector became a “strategic” industry in national planning documents. As a targeted industry for growth, the industry received subsidies and other special incentives from the national government to encourage its development.57 The policies encouraged self-sufficiency in steelmaking capacity and resulted in turning China from a net importer into the largest steel exporter in the world.58
State direction, supplemented by state subsidies, incentives, and strong internal demand for steel, had an important role in developing China’s steelmaking capacity.59
Chinese demand for steel for domestic infrastructure, commercial, and residential construction was strong, as was demand for steel from manufacturing industries, particularly for machinery and automotive manufacturing. Existing demand (and future demand expectations) led to high capacity utilization rates and steel prices, which led both SOEs to expand steel production capacity and smaller steel companies to enter the market. However, as growth in domestic demand stabilized and export market demand reduced after the 2008 global financial crisis, overinvestment in Chinese steelmaking capacity became apparent. Nominal capacity utilization ratios declined from their high of 95 percent in 2002 to approximately 70.5 percent in 2015.60 See Figure 10.
A report for the EU Chamber of Commerce in China found that the main causes of overcapacity in the Chinese steel industry are:
■ The desire on the part of regions to be self-sufficient, leading to capacity duplication at the national level;61

24 Overcapacity in Steel: China’s Role in a Global Problem
■ Rising demand predictions based on overly optimistic forecasts to support China’s development and construction boom;
■ A combination of SOEs being insensitive to profit/loss and small, dirty, or inefficient steel mills that suspend activity when price dips and re-open when the market is more favorable;
■ Adverse effects of stimulus that encourages large mills to add capacity and makes the small- and medium-sized mills, which the national government wants to shutdown, profitable;
■ The provision of subsidized energy by regional governments.62
The report included a survey of its members, which are European businesses operating in China, about what macro- and microeconomic
reasons they perceived as contributing to overcapacity in their industry. (See Figure 11). Macroeconomic causes of overcapacity were most strongly attributed to local government policies seeking to attract investments (56 percent) and loose lending policies of the government (31 percent). Other financial-related causes were directed lending (19 percent), a tolerance for non-performing loans (19 percent), and low interest rates (6 percent). At the microeconomic (firm) level, the survey respondents associated the high growth expectations of companies (38 percent) as the most important cause of overcapacity across industries. Lax enforcement of environmental (25 percent), safety (19 percent), and health regulations (6 percent) were also seen as important. The market share philosophy (in contrast to return on investment) of Chinese companies (25 percent) and easy technological availability/low barriers to entry
Figure 10: Crude steel production and capacity utilization rates in China, 2000-2015
Note: figure illustrates production volumes and nominal capacity utilization in China from 2000-2015.Source: Duke CGGC, based on World Steel Association (production) and the German Steel Federation (capacity)
129152
182222
273
356
421
490512
577
639
702731
822 823 804
85.9%
94.8% 95.4%
79.9%
80.2%84.0%
86.2%83.2%
79.5% 80.4% 79.8% 81.3%
76.2%
74.3%72.2% 70.5%
0.0%
10.0%
20.0%
30.0%
40.0%
50.0%
60.0%
70.0%
80.0%
90.0%
100.0%
0
100
200
300
400
500
600
700
800
900
1,000 production (MT) capacity utilization
2015
2000
2001
2002
2003
2004
2005
2006
2007
2008
2009
2010
2011
2012
2013
2014

Overcapacity in Steel: China’s Role in a Global Problem 25
(25 percent) also were associated with causes for overcapacity.
China’s state capitalism model at times sits uneasily with the liberal market economies of Western developed countries. State capitalism is the “widespread influence of the government in the economy, either by owning majority or minority equity positions in companies and/or through the provision of subsidized credit and/or other privileges to private companies.”63 Concerns regarding the nature of political influence on the management of China’s SOEs, industry subsidies, and compliance with global trading rules are routinely raised. For example, in response to the 2007 USITC investigation into China’s practices and policies in the economy, the American Iron and Steel Institute and the Steel Manufacturers Association stated that “the following government policies and practices in China encourage steel production:
■ Central, provincial, and local government involvement in decision making in steel industries;
■ Preferential loans and directed credit;
■ Equity infusions and/or debt-to-equity swaps for Chinese steel companies;
■ Use of land at little or no cost;
■ Government-mandated mergers, permitting acquisitions at little or no cost;
■ Slow movement closure of uneconomic plants, with closure often just a reorganization of assets rather than an actual reduction in industry size; and
■ Direct cash grants for specific steel construction projects.”64
Figure 11: 2009 survey results regarding causes for overcapacity in China
Source: EU Chamber of Commerce in China (2009)
38% High growth expectations of companies
25% Lax enforcement of environment regulations
25% Market share philosophy of Chinese companies
21% Lax IPR enforcement on businesses
25% Easy technological availability and low barriers to entry
20% Lack of strong industry associations
19% Lax enforcement of safety regulations
13% Subsidized costs to producers
6% Lax enforcement of health regulations
6% Chinese consumer tendencies to save rather than spend
56%
31%
19%
19%
19%
6%
6%
6%
6%
6%
0%
0%
Local government policies aiming to attract investments
Loose lending policies of government
Directed lending (e.g. to SOEs)
Export-driven development model
Tolerance for non-performing loans
RMB 4 trillion stimulus package of 1008/2009
Lack of dividend policy at many companies
Need for “full emploment” to stave off social pressures
Low interest rates
High level of foreign exchange reserves
Export tariffs (raw materials)
Slow wage growth
“Which of the following macroeconomic reasons havestrong impact on overcapacity in your industry?”
“Which of the following microeconomic reasons havestrong impact on overcapacity in your industry?”

26 Overcapacity in Steel: China’s Role in a Global Problem
Similarly, a 2014 article (Du 2014) listed the following common practices by the Chinese government providing financial and regulatory advantages to SOEs that are not available to other companies. The practices in effect summarize China’s state capitalism model:
■ Tax reductions and exemptions — lower tax rates to incentivize SOEs and subsidiaries to invest and procure goods and services.
■ Direct subsidization — direct transfer of funds in the form of grants and other capital injections.
■ Low cost capital from state-controlled banks— state-owned commercial banks provide loans to SOEs at preferential terms and rates65, writing off loans, or continuously rolling over the principal, a practice that appears independent of creditworthiness.
■ Monopolies — businesses within “strategic” and “pillar” industries are protected from anti-trust enforcement, and limitations exist on the degree of foreign investment in these industries.
■ Captive equity — transfers of shares in state-owned firms are not enforceable or valid unless previous approval is received by the State Assets Supervision and Administration Commission (SASAC), even if it does not have veto power as a shareholder under Chinese Company Law. The inability to transfer ownership results in the ability of SOEs to generate losses for a long period without fear of bankruptcy, including the ability to engage in anti-competitive practices such as below-cost pricing without fear of falling equity prices or bankruptcy.66
■ Favorable dividend policy — China’s State Council in 1994 exempted its SOEs from paying dividends during the 1990s and 2000s. Low dividend requirements keep the cost of capital for SOEs low.67
■ Preferential access to raw materials and other inputs — the government ensures that SOEs and other domestic manufacturers have access to low-priced raw materials, often below market prices. This preferential access of raw materials results in Chinese companies having an unfair competitive advantage over non-SOEs and foreign firms, which Du (2014) notes is particularly true in the state dominated steel industry.68
■ Government procurement — the large state procurement market is used by the Chinese government to support SOEs and creates “national champions” in key industries. The government procurement market, which is 20 percent of GDP (~ U.S. $1 trillion) is closed to foreign firms by law.69
■ Informational benefits — Chinese SOEs have access to government information and data, which are not available to non-SOE companies or available to a limited extent.
Our review of subsequent publications and reports identifies three main categories of causes for persistent overcapacity in China’s steel industry: subsidies and loose lending policies leading to overinvestment, national-local dynamics, and high exit barriers. We discuss each of these findings below.
3.3.1 Subsidies and loose lending policiesThe Chinese steel industry receives input subsidies in the form of cheap energy, land, and financial capital from national and provincial governments. These subsidies contribute to the oversupply of steel production facilities in China and reduce the ability of the industry to reduce overcapacity.
Energy subsidies: A 2009 study on industrial overcapacity found that China’s gasoline, water, and industrial electricity rates are between 50 to 66 percent lower than world average prices and lower than in many

Overcapacity in Steel: China’s Role in a Global Problem 27
developing countries. It finds that although coal prices in China are somewhat sensitive to market dynamics, other energy prices, including prices for electric power, natural gas, and refined petroleum products are priced by the government, not the market.70
A 2013 study determined that subsidies for energy from 2000 to midyear 2007 reached $27.1 billion, $25 billion of which were provided after China’s WTO entry. (See Table 5). Subsidies for coal to the Chinese steel industry from 2000 to midyear 2007 reached $10.9 billion for thermal coal and $15.3 billion for coking coal. Electricity subsidies amounted to $916 million, and natural gas subsidies totaled $54 million. The authors note that subsidies for coal-fired electric power generation by the national government, which began in 2005 to mitigate the effects of increased coal prices, are not included in this calculation and “dwarf” the recorded provincial subsidies. 71
Land subsidies: A 2010 study conducted by two Chinese scholars found that land was being provided to Chinese steel companies by provincial governments at below market prices. Their case study of Jiangsu Tieben
Steel Ltd, a privately owned firm, found that it bought land from the local government at 28 percent of the prevailing market rate, equating to a RMB 2 billion ($322M) subsidy.72 The case is not an individual incident, but characteristic of a practice used by local governments to generate revenue. The sale of land by local governments displaced rural population, which has led to “significant unrest,” according to the study. The central government responded by putting in place new regulations limiting land use rights sales by local governments. The restrictions were effective, but local governments lost a major stream of income.73 The authors of the study recommended that local officials be evaluated on a more diverse set of indicators than simply local GDP growth, which led them to attract investment and business development at almost any cost.
Access to capital: The Chinese steel industry has received access to financial capital at extremely favorable terms. State credit subsidies have historically incentivized building added capacity in the steel industry. The RMB 4 trillion (~USD $600 billion) stimulus package in 2008 to 2009, coupled with increased demand for steel used in construction in 2009,
Table 5: Energy subsidies to Chinese steel, 2000-2007 (US$)Coking coal Thermal coal Electricity Natural gas Total
2000 551,246,600 (151,500,000) 1,638,432 - 401,385,032
2001 855,538,270 796,180,000 1,778,568 (12,635,220) 1,640,861,618
2002 1,147,718,590 (604,240,000) 2,024,079 (31,604,300) 513,898,369
2003 963,957,200 (991,200,000) 2,415,480 (984,520) (25,811,840)
2004 1,358,887,600 3,423,090,000 3,021,990 9,794,480 4,794,794,070
2005 3,932,915,270 1,772,030,000 304,193,760 91,783,920 6,100,922,950
2006 4,702,413,750 731,250,000 385,436,992 25,271,520 5,844,372,262
2007* 1,774,456,060 5,878,100,000 215,875,881 (27,510,200) 7,840,921,741
Total 15,287,133,340 10,853,710,000 916,385,182 54,115,680 27,111,344,202 Grand Total
Source: Haley and Haley (2013) Subsidies to Chinese industry: state capitalism, business strategy, and trade policy.

28 Overcapacity in Steel: China’s Role in a Global Problem
led large SOE steel producers in China to construct new lines, especially for new steel sheet production.74 The stimulus package also led smaller, privately owned mills to resume production after being idled during the dramatic reduction in demand during the third quarter of 2008. The EU Chamber of Commerce in China report covering the stimulus and its effects noted that pouring credit into the sector increased direct and indirect subsidies to the industry.
In addition, the ability of SOEs to finance capacity expansions from retained earnings rather than borrowing due to the historical prohibition of dividend payments to investors has made access to capital easy for state-owned steel companies. To the extent that borrowing from commercial banks occurs, major state-owned steelmakers have their loans rolled over or refinanced regardless of their financial health.75 Today, the Chinese steel industry has $480 billion in outstanding loans, half of which is held by banks.76 In addition, it is common practice for local officials to provide implicit lending guarantees to companies as a mechanism to attract investment without consideration for the existing overcapacity problem within the industry.77
In 2015 and 2016, a number of reports on “zombie companies” captured the dynamic of unprofitable and debt-laden enterprises continuing operations despite defaults on bond payments because of support by regional governments and investors. Mills with high debt levels continue to operate because they are allowed loan payments and rollovers.78 Despite statements that “we won’t let ‘zombie enterprises’ survive for long,”79 steel companies have remained intact rather than declaring bankruptcy because of efforts by China’s provincial and national authorities. The efforts include pressing creditors to accept a fraction of what they are owed, pressuring bondholders to accept larger equity stakes in the business, and allowing the remainder of the debt to remain.80 Debt-to-equity swaps, however, raise the risk that “zombie companies become zombie
banks,” avoiding the recognition of bad debts and allowing companies to save on interest expenses. The move is largely seen as motivated by the desire of the national and provincial governments to protect tax revenues, which are based on the value of companies.81
Consistent with long-term practices, support to SOEs also includes cash, subsided electricity, access to free or cheap land, among other benefits. A Wall Street Journal report noted that a court filing by U.S. Steel “found 44 separate subsidy programs, including seven that give Chinese steelmakers cheap or free land, iron ore, coal, and power, eight that offer discount loans [including subsidized export loans], 15 tax breaks, and 11 programs that give companies money directly.” 82 Similar findings of pervasive subsidies and access to cheap finance are reported by the 2016 EU Chamber of Commerce in China report on overcapacity and official U.S. documents, including the Commerce Department and USTR’s Subsidies Enforcement Annual Report to the Congress, which states:
China maintains a largely opaque industrial support system and appears to have employed numerous subsidies — some of which may be prohibited — as an integral part of industrial policies designed to promote or protect its SOEs and favored domestic industries. … It is clear, for example, that provincial and local governments play a key role in implementing many of China’s industrial policies, including subsidies policies. The magnitude of governmental support in pursuit of industrial policies at all levels of government can be seen in the funds allocated for implementation of China’s Twelfth Five-Year Plan, a blueprint for China’s industrial development which, by some accounts, amounts to over RMB 1.2 trillion (roughly $200 billion at the current exchange rate) [pp.13-14].

Overcapacity in Steel: China’s Role in a Global Problem 29
3.3.2 National-local dynamicsThe national government and the provinces differ on steel policies and goals, largely due to the incentive structure for local governments and local government officials. As pointed out by Pieter B. Bottelier in testimony before the USITC, “China is not controlled by Beijing, it’s controlled by provincial governments, county governments, municipal governments who may have an incentive framework and a set of objectives that doesn’t exactly coincide with the Beijing set of objectives.”83 We explore below two causes for industrial overcapacity in the steel sector due to the misalignment of objectives between the national and local government: the local government tax system and the career development incentives for local government officials.
Local tax system: The local tax system in China encourages companies to keep operating even if they are not creating profits. As explained by the 2009 and 2016 reports on overcapacity in China, local government revenues are much more dependent on a production-based value-added tax (VAT) and other business taxes generated than local governments in OECD countries because most of other tax revenues must be passed on to Beijing.84 Local governments receive the majority of their business tax revenues from a factory’s production, not on profit.85 Their reliance on these industrial taxes for revenue results in the encouragement of investments that maximize fiscal income regardless of overall market conditions.86
The present tax system also makes local governments reluctant to agree to mergers and acquisitions (M&As) as VAT revenues are based on the manufacturer’s location. When a company takes over a local player, the VAT income stream benefits another jurisdiction. The EU Chamber of Commerce in China report concludes that if the consumption tax were not the only source of fiscal income for local governments, they would probably
quickly lose interest in capital investments, that M&As in China might flourish after a shift from VAT on production to one on consumption, and it would help to further accelerate restructuring the economy and reduce overcapacity.87
Incentives of local officials: Haley and Haley (2013) find “extensive anecdotal evidence” 88
to support the provincial drive behind excess capacity in Chinese steel. Chinese steel mills across all provinces have aimed to increase their size and thereby increase their chances of survival. Aside from cost efficiencies and economies of scale, local governments have supported these expansions as they support provincial officials’ career advancements and perquisites, as large-scale steel operations can translate to higher employment and tax revenues for local authorities. As explained by Zhang and Zhang (2013):
The root cause of the excess capacity is the institutional structure and its governance. GDP-oriented performance assessment [of local officials] and slow fiscal decentralization have made local governments a major driving force for excess capacity…[Local governments] act like investment companies. These local governments manage capital on local financing platforms where the government is organized just like an enterprise and government officials are like executives in the enterprise. Their major task is to increase investment by any means to create higher GDP and more income for the government. It is in this way that governments get involved in microeconomic activities and become the main entity of market competition without bearing the consequences of this competition. … In the name of attracting investment, and by offering preferential treatment regarding land, taxes and resource allocation, local governments distort the market, facilitate unfair competition and exacerbate the problem of excess capacity.89

30 Overcapacity in Steel: China’s Role in a Global Problem
Haley and Haley note that future policy initiatives from both the United States and China regarding China’s steel exports and compliance with WTO standards may need to accommodate these provincial realities to enhance effectiveness (62).
A 2009 EU Chamber of Commerce in China report on industrial overcapacity identified similar dynamics regarding the incentives for local government officials and industrial overcapacity. It wrote that:
[L]ocal protectionism is a widespread problem in a continent-sized country like China, where the performance of local government officials is measured almost entirely on local GDP growth. … For a long time, an official’s career development was boosted by positive local GDP growth data. Top local officials were evaluated based on GDP growth, industrial production, and visible physical changes in cities. This manifests itself in many ways. Local government officials try to attract as much investment as possible and then they regulate local economic activities in ways that put non-local entities at a disadvantage. Company bankruptcies are avoided using local subsidies. Non-local competitors face additional fees for products that are produced in other regions of China. The VAT system certainly makes M&As difficult, but their popularity is also limited because of the ensuing loss of influence among local officials. Chinese provinces, under pressure to help out local firms, issued a series of “Buy Local” policies in 2009, and the 2008 stimulus package, which gave local governments huge amounts of money in early 2009 in an attempt to kick-start the economy, has probably worsened this trend at the local level.90
The authors argue that in order to reduce the incentive for local governments to offer subsidies, the central government should stop solely relying on GDP to evaluate economic
development, but should instead create a comprehensive evaluation system that takes into consideration local citizens’ overall satisfaction with local government services.
3.3.3 High exit barriersHigh exit barriers exist in the Chinese steel industry, which are likely to make reducing net capacity difficult. The exit barriers are not only the costs of eliminating capacity, which include the financial costs of abandoning investments and the demolition costs of physically dismantling mills, but the political and social effects of closing steel mills.
Morgan Stanley estimated in 2013 that the global steel industry employs approximately 6.9 million people, of which 4 million are in China. It estimates that removing an estimated 200 MT of overcapacity in China would result in job losses of 800,000 and a negative economic impact of U.S. $153 billion. It notes that given the state ownership of the largest steel producers such capacity reductions are unlikely.91
Privatization and Chinese state-mandated mergers and acquisitions to consolidate steelmaking capacity, if advanced too quickly, can lead to social unrest. China observers say “it is ‘likely’ that local governments would intervene to prevent any major closures even by privately owned steel companies in China.”92 The 2009 Tonggang incident is emblematic of social unrest caused by closing steel mills in China.93 In 2009, Jianlong — one of China’s largest steel producers — was authorized by SASAC to acquire a 67 percent share in Tonggang, an SOE steelmaker. Tonggang workers were concerned about losing jobs and SOE-related benefits, and responded by rioting, eventually killing Jianlong’s general manager. In a similar incident in 2014, hundreds of workers at Sichuan’s Pangang Group Xichang New Steel staged a strike after a Beijing-mandated closure contained an inadequate plan to compensate 3,000 workers at the state-owned steel mill.94 These incidents,

Overcapacity in Steel: China’s Role in a Global Problem 31
particularly Tonggang, are widely regarded as a setback for overcapacity reductions by the national government95 and an example of how high exit barriers, especially the social costs, in the industry limit the ability of consolidations and M&As to solve the overcapacity problem in the Chinese steel industry. As nicely summarized by an asset management expert in a recent article, “We believe the steel sector ‘playbook’ for the Chinese government is simple: curtail enough inefficient capacity to reduce pollution and prevent social unrest, yet allow enough steel mills to continue operating close to break-even to keep people employed.”96
Successfully addressing high exit barriers in China’s steel industry are essential to reducing overcapacity, yet industry observers note that current and announced policies likely do not go far enough in addressing them, even if implemented.97 Overcoming exit barriers requires policies permitting efficient reorganization and bankruptcies of companies, encouraging competitors of distressed companies to purchase excess capacity and destroy it, revaluing persistent excess capacity by a firm as holding only salvage value and taking the resulting periodic reductions in earnings on the company’s balance sheet, investing in employee training programs to facilitate employee transition out of the industry, and/ or using governmental agencies to assist firms with labor-related exit costs. Governmental assistance is particularly appropriate when an entire industry is affected, and national policies for addressing exit barriers can lead to programs increasing the competiveness of leading firms in the industry, while facilitating the exit of other firms trapped in distressed industries.98 Europe’s experience during 1977 to 1980 (Davignon phase 1) and 1980 to 1985 (Davignon phase 2), Japan’s experience in more private sector-led structural adjustment in the steel sector from 1978 to 1983 and again in 1987 to 1996, and even China’s own experience during the Asian Financial Crisis of the late 1990s — in which it closed down or privatized the worst performing
SOEs, provided funding to provincial and local governments as well as benefits for an estimated 28 million workers laid off between 1998 to 2003 — serve as potential models to facilitate the exit of firms with excess steel capacity.99 Observers of the steel industry indicate that to address the overcapacity in China today would likely require more substantial funding to local governments to offset reduced tax revenues from SOE bankruptcies and increased unemployment benefits to workers to mitigate the social costs of reducing capacity in China’s steel sector.100
3.4 ConclusionThe purpose of this section was to better understand the causes for overcapacity in the steel sector. We divided the causes of steel overcapacity into two areas: overcapacity caused by short-term variable demand, which we called “cyclical” overcapacity, and overcapacity caused by excessive supply, which we called “structural” overcapacity. Variable demand causes overcapacity because capacity is price insensitive in the short term due to high exit barriers in the steel industry. These sharp, periodic drops in demand cause ripple effects throughout the global economy as steel producers seek markets, almost at any price, for their inventory and can be particularly acute when coupled with existing structural overcapacity. Recently, this dynamic has manifested itself in the United States as a steel import crisis, dramatically reducing steel prices and affecting employment and the profits of domestic steel producers.
The second category of overcapacity is excessive supply in steelmaking capacity caused by overinvestment. Overinvestment can be caused by various mechanisms, including production subsidies and other public policies, which lead to a greater amount of capacity available for production than what price alone would support. We called these “structural” causes of overcapacity because

32 Overcapacity in Steel: China’s Role in a Global Problem
they are more enduring than overcapacity caused by temporary downturns in demand caused by regional or global economic crises. We then identified China as contributing the most to global overcapacity, and sought to better understand the causes of overcapacity in the country.
China’s overcapacity was identified as occurring due to its rapid development of the steel sector after 2000. Investment in steelmaking capacity throughout the first decade of the millennium, incentivized by production incentives, land and energy subsidies, and loose lending policies by both national and provincial governments led to massive increases in China’s steel production capacity throughout the decade. As domestic demand for steel slowed as a result of a moderation in China’s economic growth after 2009, and as foreign demand
for crude steel reduced due to the global financial crisis, excess capacity in China’s steel industry has become increasingly apparent. The section recounts how national-local dynamics, particularly the local tax system and the incentives of local officials, and high exit barriers, particularly the social costs of closures, make capacity reductions to address industrial overcapacity and pollution difficult.101 As industry observers have pointed out, addressing exit barriers in China’s steel industry are essential to reducing overcapacity, yet policies to date have not provided sufficient mechanisms for distressed firms to exit the market.
In the next section, we turn to the policy actions that China and the United States have undertaken to address overcapacity in the steel sector.
Large amounts of steel pipes are gathered together for exporting at a container terminal on December 8, 2015 in Lianyungang, Jiangsu Province of China. China’s steel overcapacity has created a global problem, despite repeated promises from Chinese leaders to reduce steel production. There are a variety of reasons for this, from local government dynamics to high exit barriers that make it difficult to address net capacity.

Overcapacity in Steel: China’s Role in a Global Problem 33
In the previous sections, we identified that overcapacity in the global steel sector grew from an average of 250 MT from 1980 to 2007 to 750 MT in 2015, and that China was the largest contributor to the growth in overcapacity after 2000. We identified the causes of overcapacity in China as due to subsidies and loose lending policies, national-local dynamics — particularly the local tax system and incentives of local officials — and high exit barriers in the steel industry.
In this section, we examine what policies China and the United States have committed to undertake to address overcapacity. While China has made several commitments in bilateral dialogues to address overcapacity, there has been limited progress in implementing those commitments. To frame the section on policy response, we will first discuss the commitments China has made through the bilateral U.S-China Strategic and Economic Dialogue (S&ED), examine the efforts China has made internally, and conclude with an analysis of the efforts and challenges facing the United States.
4.1 China’s commitments in bilateral dialoguesBilateral efforts to address overcapacity and its underlying causes have been raised in the eight U.S.-China S&EDs. Most notably, during 2016’s eighth S&ED meeting China stated that it would “adopt measures to strictly contain steel capacity expansion, reduce net steel capacity, eliminate outdated steel capacity, and urge the exit of steel production capacity that fall short of environment, energy consumption, quality or safety requirement standards…China is to actively and appropriate dispose of ’zombie enterprises’ through restructuring, debt restructuring, bankruptcy and liquidation.”102 The commitments reflect those made in 2014’s sixth S&ED meeting, in which China agreed “to establish mechanisms that strictly prevent the expansion of crude steelmaking capacity and that are designed to achieve, over the next five years, major progress in addressing excess production capacity in the steel sector.”103 Other commitments made during the S&ED meetings address equitable access to inputs, SOE reform, and financial reforms. We provide a summary of the most relevant commitments below.
4Policy Actions

34 Overcapacity in Steel: China’s Role in a Global Problem
Access to inputs, land and energy subsidies — At the fifth S&ED meeting in 2013, China stated that it “[…] remains committed to ensuring that economic entities under all forms of ownership have equal access to factors of production in accordance with the law, compete on a level playing field, and are treated equally by the law. China is to develop a mechanism for determining the prices of factors of production mainly by the market.” At the sixth S&ED meeting in 2014, China committed to “deepen economic system reform by allowing the market to play a decisive role in the allocation of resources…China is to accelerate the process of market-based price reforms in petroleum, electricity, and natural gas, to promote competition in energy markets, and to realize market-based prices in competitive sectors as soon as possible.” At the seventh S&ED meeting in 2015, China reaffirmed its commitment to “ensure that all economic entities under all forms of ownership have equal access to factors of production according to law.” The factors of production specifically mentioned are fuel and land. In regards to fuel, both the United States and China committed to “rationalize” and “phase out” fossil fuel subsidies. Regarding land, China committed to establish a central real estate registration system by 2017 to create a “unified urban-rural construction land market.” The registration system will allow “rural collectively owned profit-oriented construction land to be sold, leased and appraised as shares, on the premise that it conforms to planning and land use control, and ensure that it can enter the market with the same rights and at the same prices as state-owned land.”
SOE reform — At the second S&ED meeting in 2010, China stated that it “[…] will continue to reform its SOEs, and promote further investor diversification, including by issuing publicly traded shares and inviting strategic investors, including non-public and foreign investors, to take equity stakes.” At the fourth S&ED meeting in 2012, “China further improves the state-owned capital returns collection system, by steadily increasing the
dividend payout ratio of SOEs and increasing the number of both central and provincial SOEs that pay dividends to the government, and uniformly incorporating the state-owned capital management budget into the national budget system. China encourages all listed companies, including listed companies with the state as the controlling shareholder, to increase their dividend payouts. In addition, China encourages the increase of the average dividend payout levels of listed companies with the state as the controlling shareholder to be in line with average market levels of other publicly listed domestic companies.” At the fifth S&ED meeting in 2013 China reaffirmed its commitment to increase dividend payouts and to use dividend revenue to be spent on “social security and people’s welfare.” During the sixth meeting in 2014, China committed to “further deepen the reform of SOEs (including State-Invested Enterprises), improve and standardize modern corporate governance structure, and reasonably increase the proportion of market-based recruitment of management personnel for SOEs. In mixed ownership enterprises, China is to improve the process for nominating and selecting personnel to serve on Boards of Directors in accordance with the Company Law and corporate governance principles.”
Foreign Direct Investment (FDI) — China has committed gradually to increase foreign investor access to industries, including the steel industry. Some key commitments made by China during the fourth, fifth, and sixth S&ED meetings regarded FDI. During the fourth meeting in 2012, China committed “to provide fair treatment to foreign investors in China. China is to focus its security review over mergers and acquisitions by foreign capital solely on national security concerns and adhere to specific timelines and review standards. China is to continue to simplify its foreign investment approval system and enhance transparency on a step-by-step basis. During the 12th Five Year Plan period, China is to implement a more proactive opening-up strategy and expand the areas open to foreign investment and the degree

Overcapacity in Steel: China’s Role in a Global Problem 35
of openness.” During the fifth meeting in 2013 China reaffirmed its “commitment made in S&ED IV (2012) to implement a more proactive opening up strategy for foreign investment. … China is to gradually decrease and decentralize its foreign investment reviews and approvals as an important part of the reform. China is to minimize the scope for such reviews and approvals, promote independent investment decision making by enterprises and individuals, and further improve the level of investment facilitation.” During the sixth meeting in 2014, China committed that “[i]n any area open to foreign investment, consistent with Chinese law, China is to continue to improve procedures for foreign investment approval and record-filing by unifying domestic and foreign investment laws and regulations. To make it easier to invest, China is shifting from an approach of approval or verification to one based on record filing.”
Financial reforms — China has committed to increasing the openness of its financial sector to foreign investors and introducing market-based financial reforms. During the fifth S&ED meeting in 2013, China committed to “… assessing the outcome of opening up policies of its financial sector, and is to continue to improve the related regulations and prudential supervisory standards. Under these circumstances, China is to continue to further open up its financial sector to foreign participation.” During the sixth meeting in 2014, China committed to “… continue to advance market-based interest rate reform and to let the market play a decisive role in the allocation of financial resources. China is to promote the issuance of certificates of deposit to enterprises and individuals to gradually expand the range of liability products of financial institutions priced by the market, and to improve its market-based benchmark interest rate system … China is to complete the business tax to Value-Added Tax reform, in order to eliminate double taxation and promote economic transformation. … China commits to improve its Value Added Tax rebate system, including actively studying
international best practices, and to deepen communication with the United States on this matter, including regarding its impact on trade.” During the seventh meeting in 2015, China stated that it is “actively studying further opening up of the banking sector (including equity participation by foreign investors) and securities sector, based on ongoing assessment and improvement of the prudential regulatory framework.” Of special note is the creation in Shanghai of the “Shanghai Free Trade Zone pilot, which is to implement a new foreign capital administrative model on a trial basis, and create a market environment that provides equal access for all types of enterprises, domestic and foreign.” (2013 SE&D). It was authorized in 2014.104
In our view, the S&EDs have established a productive dialogue in which China and the United States are able to approach joint problems such as industrial overcapacity. The commitments by China to prevent further expansion of crude steelmaking capacity, address unequal access to inputs, land and energy subsidies, reform SOEs, FDI policies, and its financial sector are important steps to reducing trade frictions. However, the value of China’s commitments must be judged on the progress in achieving its stated goals, which to date, have not led to a significant reduction in steel overcapacity. In the next section, we examine the commitments China has made internally to address overcapacity in steel and reach a similar conclusion: commitments are welcome, but to date, they have not had an observable effect on the overcapacity problem in the steel sector.

36 Overcapacity in Steel: China’s Role in a Global Problem
4.2 China’s domestic policy commitments to address overcapacityChina has repeatedly stated publicly that it recognizes the problem of industrial overcapacity, and has announced policies designed to address industrial overcapacity, including in its steel industry. The most succinct statement about the dangers of China’s overcapacity problem across industrial sectors is perhaps made by He Yafei, former vice minister of the Overseas Chinese Affairs Office of the State Council and former vice minister at the Chinese Ministry of Foreign Affairs. In a recent article he writes that “[overcapacity] has resulted in a steep drop in profits, the accumulation of debt and near bankruptcy for many companies. If left unchecked, it could lead to bad loans piling up for banks, harming the ecosystem, and bankruptcy for whole sectors of industries that
would, in turn, affect the transformation of the growth model and the improvement of people’s livelihoods. It could even destabilize society.”105
Below, we discuss five categories of policies developed by China to address industrial overcapacity in its steel sector: 1) goals announced in its Five Year Plans and policies announced by China’s Ministry of Industry and Information Technology (MIIT), which we call “macro policies” to address overcapacity; 2) forced closures; 3) mergers and acquisitions; 4) foreign direct investment; and 5) its “going out” and new “One Belt, One Road” policy supported by the Asian Infrastructure Investment Bank (AIIB) and the multi-billion dollar Silk Road Fund. We conclude with remarks by China observers that, to date, the policies have not been effective in reducing overcapacity, nor are they likely to do so in the short term because they do not address land, energy, and water subsidies, access to cheap credit, and exit barriers prohibiting the closure of poorly functioning businesses.
Figure 12: China’s central government actions to curb overcapacity in steel, 2006-2015
Abbreviations: MIT: Ministry of Industry an Information technology; NDRC: National Development and Reform CommissionSource: EU Chamber of Commerce in China (2016), OVERCAPACITY IN CHINA: An Impediment to the Party’s Reform Agenda
Supply-sidereform
Capacity controlOutdated capacityelimination
Structural adjustment
Mar.2009
2006-2009 2009-2013 2014 2015
Oct.2009 Oct.2013
Steel
Dec. Apr. Oct. Apr. July
Guidance Policies from State Council Policies from Ministries under State Council (e.g. MIIT, NDRC, etc.)
12th Five-year plan Guidance policy
0
100
200
300
400
67.5 98.8132.0 140.9 161.6 161.3
228.9284.0
2006 2007 2008 2009 2010 2011 2012 2013 2014 2015
317.2 336.2Overcapacity (MT)

Overcapacity in Steel: China’s Role in a Global Problem 37
4.2.1 Macro policiesChina’s 11th, 12th, and 13th Five-Year Economic Plans include targets for reducing overcapacity in the steel sector. The Eleventh Five Year Plan (2004-2009) for National Economic and Social Development of the People’s Republic of China stated the principle of using central control to eliminate obsolete mills, to restructure, to upgrade industrial products, and to lower consumption of raw materials.106 The National Development and Reform Commission’s (NDRC) director in April 2007 announced that 10 provinces and municipalities had signed a first round of written commitments to shut down and to eliminate outdated iron-making capacity and obsolete steelmaking capacity of 40 million and 42 million tons respectively in the next five years; more than 20 million tons by the end of 2007. Five out of these steelmaking provinces — Hebei, Shanxi, Henan, Jiangsu, and Shandong — were responsible for 70 percent of the nation’s outdated iron-making capacity and 50 percent of obsolete steelmaking capacity.107 During the Twelfth Five Year Plan (2010 to 2015), MIIT issued a document in July 2011 requiring 154 iron and steel companies nationwide to eliminate combined outdated iron-making capacity of 31 million tons within the year. The 154 companies included 58 companies with 28 million tons of outdated steelmaking capacity.108 During the 13th five-year (2016 to 2020) economic development planning cycle, an official at MIIT stated that addressing overcapacity will be one of the key tasks of China’s next Five Year Plan.109
In March 2015, MIIT released its “Policy for the Restructuring of the Steel Industry,” which is an update to the “Steel Industry Development Policy” issued in 2005. The objectives of the policy are to restructure the industry and to help Chinese steel companies become more “environmentally friendly, innovative and internationally competitive by 2025.”110 The policy seeks increased domestic consolidation in the steel industry, allowing FDI into the Chinese steel industry, and
removing excess capacity, among other goals. The main points of the revised policy are:
■ Establish world-class steel companies by raising the combined crude steel output of the top 10 steel companies to over 60 percent of total output and establish three to five ultra-large steel conglomerates by 2025.
■ Support those competent steel companies to pursue mergers and acquisitions of steel businesses across nations in the world. Support steel companies to consolidate with upstream and downstream players.
■ Support the product development of new alloy material and high quality special steel. Promote applications of high-grade steel products, including high strength rebar, shipbuilding and ocean engineering steel, and steel for bridge, energy, automotive, and rail transit.
■ Remove restrictions on foreign investment in the Chinese steel industry.
■ Reduction of excess production capacity — alleviate the degree of overcapacity and increase capacity utilization ratio to 80 percent by 2017.111
The recent policy announcement is consistent with previous announcements by China’s central government to address overcapacity. In 2013, China released the “State Council Guiding Opinions on Resolving the Serious Excess Capacity Contradictions,” which included the steel industry.112 The State Council document outlined “supply-side,” “demand-side,” and other steps to curb overcapacity. Supply side policies to reduce overcapacity include “strict prohibitions” of new steel plants, and forcing “backward” enterprises to phase out production by raising the price of inputs such as power and water. Financial support to mitigate “difficulties” caused by capacity shutdowns and unemployment would be provided as part of supply side steps. Demand side policies include supporting the consumption of structural steel by the construction industry

38 Overcapacity in Steel: China’s Role in a Global Problem
and encouraging companies to increase overseas projects.113 In addition, the “Guiding Opinion” seeks a greater role for markets to allocate resources and to create fair, competitive markets over the longer term.114
4.2.2 Forced closuresIn February 2016, China announced that it would cut crude steel capacity by 100 to 150 MT within the next five years, ban new steel projects, and eliminate “zombie” mills by 2020.115 It pledged a portion of a 100 billion yuan (about $15.4 billion) fund set aside for employee compensation, social security payments, and plant closure incentives in the coal and steel sectors. Shortly after, Hebei Province announced in March 2016, that it would reduce 130 MT, or 60 percent, of its steelmaking capacity by 2020.116
The announcements, though welcome, should be understood in light of previous statements and results. In October 2013, the Chinese government issued a guideline requiring that steel capacity in China be reduced by 80 MT by 2018, about 10 percent of China’s 2013 production, and retire or upgrade another 15 MT.117 Similarly, in January 2009, MIIT’s “Steel Industry Adjustment and Revitalization Plan” sought to control steel production and eliminate obsolete capacity. According to the plan, about 150 MT of capacity was ‘illegal’, particularly in the thousand or so smaller mills in the country.118
The central government has had limited success in closing steel mills because of the national-local dynamic referenced in the third section of this report, namely that provincial governments and government officials have interests in keeping steel production in the local area due to three factors: maintaining local government revenue, maintaining local employment, and staff evaluations which are based on their contribution to GDP. This dynamic is especially strong in the interior provinces where few other major industrial employers exist to offset closures of steel mills.119
Still, provinces have made apparent efforts to comply with Beijing’s mandates to reduce capacity. In Henan Province, one of China’s largest steel producing regions, the provincial government ordered the closure in 2013 of blast furnaces by eight firms to reduce production capacity.120 In neighboring Hebei Province, which surrounds Beijing, the province staged in late 2013 “Operation Sunday” in which it demolished 6.8 MT of steelmaking capacity owned by 15 mills.121
Yet even in these apparent achievements, all is not what it seems. In a fascinating article in The Wall Street Journal detailing the dynamics between Beijing mandates and local resistance, it points out that the Hebei furnaces destroyed were so obsolete that the companies owning them didn’t consider them spare capacity. Thus, destroying them didn’t
Table 6: Chinese steel capacity, closures, and net capacity additions (in MT), 2010-2014Year Crude Steel Capacity Capacity Closures Net Gain (loss)
2010 800.3 41.0 82.3
2011 863.3 32.0 63.0
2012 959.9 11.0 96.6
2013 1,106.0 10.0 146.1
2014 1,140.0 20.0 34.0
Source: Duke CGGC, calculated from German Steel Federation (crude steel capacity 2010-2014); Ernst and Young Global Steel 2014 (capacity closures 2010-2014)

Overcapacity in Steel: China’s Role in a Global Problem 39
affect the province’s productive capacity at all, but rather, was staged to appear compliant with Beijing’s rules.122 The 2013 ruse was only the latest in the game between local politics and national policies. The article details how, since 2000, Beijing has pressed Hebei Province to reduce capacity in its steel sector, which were rebuffed by local officials. In 2009, when China’s planning agency ordered several blast furnaces to be closed, Hebei Tianzhu Iron and Steel Group received a U.S. $750,000 bonus for dismantling four furnaces, which it then used to build a larger blast furnace and expand production capacity.
Thus despite apparent achievements, regional governments in China have been slow to close steel mills, as it would remove sources of employment and other fiscal benefits. As an illustration of the problem, the national mandate to reduce 80 MT by 2018 requires that three-fourths of the capacity reductions come from Hebei Province. If it meets its target, it would eliminate 200,000 jobs and reduce tax receipts by 10 percent in Hebei.123 While some capacity has been closed, the overall net effect to date has been an increase in steelmaking capacity in China through 2014; 2015 could be the first year for net capacity reductions, if crude steel capacity estimates for China bear out.124 (See Table 6). However, whether capacity closures announced in 2015 will remain permanently offline remains uncertain, as a 2016 Chinese language report citing China’s National Bureau of Statistics found that crude steel production in Hebei, Jiangsu, and Shandong provinces increased because “steel profits were so high that many of the companies that were forced to shut down last year actually reopened and resumed production.”125
Put simply, China’s central government has to date not been successful in reducing capacity from steel mills, in part, due to resistance from local and provincial authorities seeking to maintain employment and revenue. Publicly released statements by the national government indicating a desire to reduce industrial overcapacity as a way to address
environmental pollution problems also face the challenging dynamic between subnational and national authorities, which we discuss below.
4.3.3 Improving environmental qualityRecent changes in environmental legislation and enforcement offer some hope for additional leverage by the national government vis-à-vis provincial governments and locally owned steel mills. The industry is increasingly interested in reducing the environmental externalities of steel production, due to new regulations put in place as of January 1, 2015 that hold officials “accountable for the entirety of their lives for pollution problems that occur on their watch. Officials who fail to prevent problems such as pollution of waterways or soil contamination cannot be promoted or hold other positions.”126 Twelve noncompliant steel mills were closed in March 2015 in Shandong Province, accounting for an estimated capacity reduction of 7 to 8 MT and affecting 100,000 workers.127 In July 2016, the Ministry of Environmental Protection announced that it would inspect and install monitoring equipment in major steel enterprises to ensure that they are complying with pollution regulations.128 Hebei Province in March 2016 re-announced plans to reduce capacity to 200 MT, or 60 percent of its capacity, by 2020. It first announced the plan in 2014 when it came under increased scrutiny to reduce air pollution from its industrial activities.129
However, shutting down obsolete or polluting plants falls under the jurisdiction of local governments, which are reluctant to close plants because of the ensuing unemployment. Environmental protection rests with some 2,500 Environmental Protection Boards (EPBs) responsible for monitoring and enforcing environmental laws and regulations within their jurisdiction. However, real decision-making power lies with the provincial governments, which fund the EPBs. A report noted that “[l]ocal EPBs, instead of being an
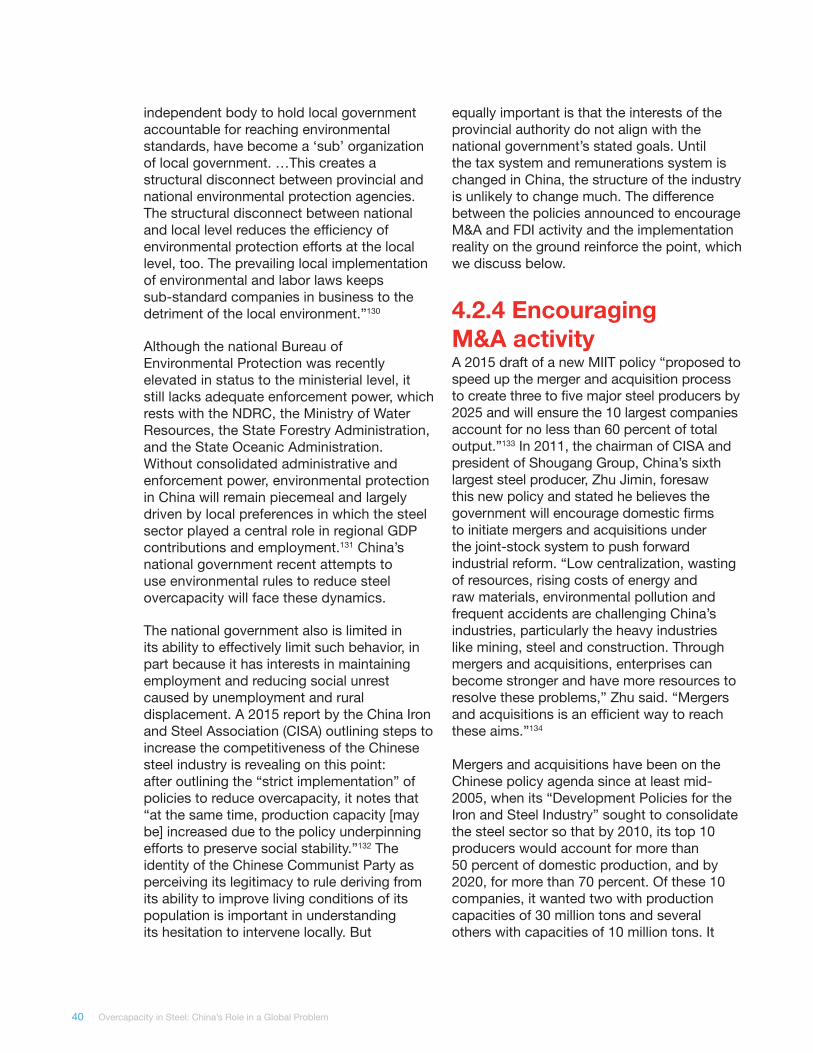
40 Overcapacity in Steel: China’s Role in a Global Problem
independent body to hold local government accountable for reaching environmental standards, have become a ‘sub’ organization of local government. …This creates a structural disconnect between provincial and national environmental protection agencies. The structural disconnect between national and local level reduces the efficiency of environmental protection efforts at the local level, too. The prevailing local implementation of environmental and labor laws keeps sub-standard companies in business to the detriment of the local environment.”130
Although the national Bureau of Environmental Protection was recently elevated in status to the ministerial level, it still lacks adequate enforcement power, which rests with the NDRC, the Ministry of Water Resources, the State Forestry Administration, and the State Oceanic Administration. Without consolidated administrative and enforcement power, environmental protection in China will remain piecemeal and largely driven by local preferences in which the steel sector played a central role in regional GDP contributions and employment.131 China’s national government recent attempts to use environmental rules to reduce steel overcapacity will face these dynamics.
The national government also is limited in its ability to effectively limit such behavior, in part because it has interests in maintaining employment and reducing social unrest caused by unemployment and rural displacement. A 2015 report by the China Iron and Steel Association (CISA) outlining steps to increase the competitiveness of the Chinese steel industry is revealing on this point: after outlining the “strict implementation” of policies to reduce overcapacity, it notes that “at the same time, production capacity [may be] increased due to the policy underpinning efforts to preserve social stability.”132 The identity of the Chinese Communist Party as perceiving its legitimacy to rule deriving from its ability to improve living conditions of its population is important in understanding its hesitation to intervene locally. But
equally important is that the interests of the provincial authority do not align with the national government’s stated goals. Until the tax system and remunerations system is changed in China, the structure of the industry is unlikely to change much. The difference between the policies announced to encourage M&A and FDI activity and the implementation reality on the ground reinforce the point, which we discuss below.
4.2.4 Encouraging M&A activity A 2015 draft of a new MIIT policy “proposed to speed up the merger and acquisition process to create three to five major steel producers by 2025 and will ensure the 10 largest companies account for no less than 60 percent of total output.”133 In 2011, the chairman of CISA and president of Shougang Group, China’s sixth largest steel producer, Zhu Jimin, foresaw this new policy and stated he believes the government will encourage domestic firms to initiate mergers and acquisitions under the joint-stock system to push forward industrial reform. “Low centralization, wasting of resources, rising costs of energy and raw materials, environmental pollution and frequent accidents are challenging China’s industries, particularly the heavy industries like mining, steel and construction. Through mergers and acquisitions, enterprises can become stronger and have more resources to resolve these problems,” Zhu said. “Mergers and acquisitions is an efficient way to reach these aims.”134
Mergers and acquisitions have been on the Chinese policy agenda since at least mid-2005, when its “Development Policies for the Iron and Steel Industry” sought to consolidate the steel sector so that by 2010, its top 10 producers would account for more than 50 percent of domestic production, and by 2020, for more than 70 percent. Of these 10 companies, it wanted two with production capacities of 30 million tons and several others with capacities of 10 million tons. It

Overcapacity in Steel: China’s Role in a Global Problem 41
designated Baosteel, Anben, and Wugang to lead the development of a more consolidated steel sector.135 The 2015 announcement by the MIIT (Policy for Restructuring of the Steel Industry) updated this policy to “raise the combined crude steel output of the top 10 steel companies to over 60 percent of total output and establish three to five ultra-large steel conglomerates by 2025, and to … support those competent steel companies to pursue mergers and acquisitions of steel businesses across nations in the world. Support steel companies to consolidate with upstream and downstream players.” Thus the new policy reduces the market consolidation target by 10 percent five years later than previously announced.
The reality of M&As in the Chinese steel sector is that they are having little effect on industry consolidation. An estimated 1,200
steel companies existed in 2014.136 The market share of the top 10 steel producers in the country increased from 35 percent in 2005 to 41 percent in 2010, but fell again to 34 percent in 2015 (see Figure 13). China’s top three producers in 2013 accounted for only 18 percent of the Chinese market, compared to 66 percent for Japan and 42 percent for Europe.137 So, in comparative terms, the Chinese steel market is still quite fragmented.
Further consolidation of the market must overcome both economic and political realities. On the economic front, mergers and acquisitions can remove overcapacity by closing inefficient facilities only if there are net positive gains between both companies that make the company significantly more efficient and profitable than its predecessors.138 Steel industry observers of the merger of Baosteel and Wuhan Iron and Steel announced in
Figure 13: Output of the top 10 steel groups in China, as percentage of total production
Note: 2009 and 2010 are unavailable due to differences in reporting by the World Steel Association during these years.Source: Duke CGGC, calculated from World Steel Association, World Steel in Figures 2007-2016
35% 35%
39% 40%
NA NA
41%39%
37% 37%34%
0%
10%
20%
30%
40%
50%
60%
70%
2005 2006 2007 2008 2009* 2010* 2011 2012 2013 2014 2015
35% 35%
39% 40%
NA NA
41%39%
37% 37%34%
0%
10%
20%
30%
40%
50%
60%
70%
2005 2006 2007 2008 2009* 2010* 2011 2012 2013 2014 2015

42 Overcapacity in Steel: China’s Role in a Global Problem
late June 2016 note that while consolidation may reduce the number of manufacturers it will not necessarily result in reduced steel capacity.139 Boston Consulting Group in 2014 noted that mergers that merely creating larger low-profit businesses could have a limited impact on profitability and overcapacity.140 Morgan Stanley in 2013 was less than optimistic about capacity reduction occurring as a result of market consolidation in China’s steel sector. “We see three major reasons why capacity reduction via consolidation will be difficult in China: 1) long transportation distances result in low incentive to consolidate regionally, 2) local governments are unlikely to shut down capacity after consolidation due to high employment in the steel industry (4 million people directly employed – we estimate a multiplier effect of 27x on the overall economy), and 3) weak profits since 2011 have resulted in cash constraints, so few players in the sector have the financial support to consolidate” (p. 8). The political realities are noted by a previous report on industrial overcapacity in China by the EU Chamber of Commerce in China. They point out that the VAT tax system makes local governments hesitant to endorse M&As, since local government revenues were based on the manufacturer’s location. M&A policies may work to incentivize local governments to fund the expansion and upgrading of provincial and locally owned steel mills to prevent their closure or consolidation by firms from other cities or provinces, and result in increased capacity rather than the rapid reductions intended.141 Until the VAT changes to a tax system based on consumption, the incentives of local governments to endorse M&A are unlikely to change.142 As noted by two Hong-Kong based economists, “Local governments have traditionally hindered administrative attempts to reduce overcapacity. It remains to be seen whether the central government’s current attempts will be more successful.”143
4.2.5 FDIChina sees FDI in the steel industry as one way to reduce overcapacity. Foreign investment in its steel sector had been banned since 2005.144 However, China has committed gradually to increase access to industries, including the steel industry, by foreign investors. The Wall Street Journal reported in January 2015 that “steel will be among industries opened to foreign ownership, the country’s National Development & Reform Commission, said. … The group’s officials have said allowing foreign investment could help calm external criticism of the industry.”145 Further discussion of China’s commitments on FDI is provided in section 4.1, but generally, it is too early to note any significant progress on reductions of China’s steel overcapacity due to FDI.
4.2.6 “One Belt, One Road”China’s “One Belt, One Road” policy seeks to develop a transportation infrastructure network of road, rail, pipelines, and ports stretching from Xi’an in central China, to Central Asia, and may ultimately reach Moscow, Rotterdam, and Venice.146 Although details of the policy are still emerging, it is clear from initial pronouncements that China sees expansion abroad as a way to manage domestic industrial overcapacity, including in the steel sector. The new AIIB and the $40 Billion Silk Road Fund will provide funds for the policy.147 He Yafei, former vice minister of the Overseas Chinese Affairs Office of the State Council and former vice minister at the Chinese Ministry of Foreign Affairs, wrote in a recent article that during the Communist Party’s third plenum it was agreed that the solution to the industrial overcapacity problem in China is to implement the “going out” strategy for Chinese enterprises, thus “moving out” the overcapacity and providing a basis for its development strategy and foreign policy.148 In regards to steel, Yafei writes that the glut of steel capacity in China contrasts starkly

Overcapacity in Steel: China’s Role in a Global Problem 43
with the market needs and potential in Africa and Southeast and Central Asia. “Chinese companies must seize the opportunities created by China’s policy to build a ‘new silk road on the sea’ and ‘economic belt of the silk road’ by joining the China-Africa cooperation initiative and upgrading the China-ASEAN free trade agreement by providing assistance and setting up joint ventures, process and distribution zones.”149 An official at China’s MIIT stated in another article that “for us there is overcapacity, but for the countries along the ‘One Road One Belt’ route, or for other BRIC nations, they don’t have enough and if we shift it out it will be a win-win situation.”150
The “shifting out” of production capacity to Africa and other Asian countries has already begun. Hebei Iron and Steel Group, one of China’s largest steel producers, has signed an agreement to develop 5 MT of steelmaking capacity in South Africa by 2019.151 The company will take a 51 percent ownership stake in the South African venture, with the Industrial Development Corp of South Africa and the China-Africa Development Fund as the minor investors. Although a domestic
asset manager in South Africa has called the venture “crazy” given that the size of the plant equates to two-thirds of South Africa’s production and a third of Africa’s output,152 the company sees it as a “rational choice” to adapt to changing market conditions.153 Shougang, another Chinese steelmaker, began steel production in Malaysia at a 3 MT capacity mill in February 2015.154 Other “going out” ventures have not been successful. Both Baosteel Group and Wuhan Iron and Steel dropped plans to build plants in Brazil due to high costs, and analysts have expressed doubt that developing steel production abroad by China’s SOEs would ease domestic overcapacity.155 “China would need $60 billion per year of extra demand to absorb excess capacity. … The economies of Central Asia are not that large.”156 In addition, lending from the AIIB may be sensitive for countries with geopolitical disputes with China, especially India, Vietnam, and the Philippines, but acceptable to other countries — who are also more likely to default on their loans including Cambodia, Laos, or Pakistan.157 Another analyst concluded that “transferring production abroad can’t be
U.S. President Barack Obama (L) and Chinese President Xi Jinping (R) hold a press conference at the Great Hall of the People in Beijing, China, on November 12, 2014.

44 Overcapacity in Steel: China’s Role in a Global Problem
the main solution to tackle overcapacity and would conflict with the government pledge to maintain social stability by keeping employment; success would “depend on how much capital is eventually engaged in helping Chinese firms go abroad.”158
4.2.7 Concluding thoughtsIn our analysis, any reasonable review of China’s stated policy objectives and policy goals would conclude that China recognizes that it has a problem with industrial overcapacity generally, and in the steel sector in particular.159 However, implementation has lagged behind these stated objectives and goals, and industry observers are increasingly concerned that the policies do not go far enough to address the overcapacity problems affecting the steel industry.
China has repeatedly announced policies from its highest levels to address overcapacity in steel and other sectors, including policies seeking to reduce additional domestic investment in steelmaking capacity, create consolidated steel production by encouraging mergers and acquisitions, modifying the foreign investment law to permit foreign direct investment in steel, and to shift overcapacity abroad by increasing demand through its “going out” and “One Belt, One Road” policy. China is also aware of other countries’ frustration with the lack of progress in China to address overcapacity in the steel industry, that China is perceived as “not doing enough” to curb production levels, and that anti-dumping duties set by other nations will affect China’s domestic producers.160
One difficulty has been effective implementation of its stated goals and policies. As Zhang and Zhang (2013) write with reference to the 2013 State Council Guiding Opinion on Resolving the Serious Excess Capacity Contradictions, “this strategy in essence is correct, but the key remains in its practice and implementation” (p.5).
Other China observers put the matter more pointedly: “The Chinese government has shown interest in stepping up its efforts to rein in steel overcapacity and to consolidate and restructure the steel industry. However, it remains to be seen if the government’s efforts and measures are to produce sufficient or meaningful results.”161 In addition to needed tax and remuneration reforms, we agree with these perspectives that a core challenge to addressing industrial overcapacity in China’s steel sector is effective implementation of its stated policies and commitments.
In addition, over the past year, a number of industry experts have expressed concern that China’s plan to reduce 100-150 MT of capacity will not be enough to address the overcapacity overhang characterizing the steel industry. “The plans are relatively timid and overcapacity is unlikely to be reduced sufficiently in the coming two years,” “stated one expert.162 A recent Wall Street Journal article reported that industry experts in China, the United States, and Europe state that 200 MT of capacity — about 20 percent of current capacity — should be removed to improve conditions.163 Presentations to the April 2016 OECD meeting by Etienne Davignon, the architect of Europe’s restructuring plan of the 1970s, recounted capacity in Europe was reduced by almost 20 percent over five years, resulting in significant improvements of capacity utilization rates and company profitability. The planned capacity reductions announced by China risk being “insufficient and/or too slow … especially if demand continues to decline.”164 Without similar rapid cuts, the likelihood that overcapacity will remain an issue for China’s steel industry for a number of years is increased. “Reducing China’s industrial overcapacity is going to be a process, not an event. Chinese policymakers feel they have the fiscal wherewithal to draw out and avoid short-term pain”, stated one industry observer.165 “They will find ways to smooth it out over time. We’re talking a minimum 10 years,” stated another.166

Overcapacity in Steel: China’s Role in a Global Problem 45
4.3 U.S. effortsThe USTR and the U.S. Department of Commerce released in February 2016 their annual joint report detailing U.S. trade subsidies enforcement.167 The report details the challenges faced by these organizations to encourage countries — especially China and to a lesser extent India — to comply with the WTO Subsidies Agreement and to increase the transparency of WTO members’ reporting obligations under the agreement. The report details actions the U.S. government has taken to address the “market-distorting trade practices in the steel industry” (pp. 8-9), notably subsidies and overcapacity, and provides details on the actions undertaken by the OECD, the North American Steel Trade Committee, the S&ED, the U.S.-China Joint Commission on Commerce and Trade, the USTR, and Department of Commerce to address trade frictions between the United States and China. In a particularly revealing section, titled “Chinese Government Subsidy Practices” (pp. 9-14), it notes that “the Chinese government has emphasized the state’s role in China’s economy, diverging from the path of economic reform that drove China’s accession to the WTO … [and] pursued new and more expansive industrial policies designed to limit market access for imported goods, foreign manufacturers and foreign service-suppliers, while offering substantial government guidance, regulatory support and resources, including subsidies, to Chinese industries, particularly industries dominated by SOEs” (p. 9). The report notes the designation of China as a non-market economy (NME) and WTO’s affirmation of Public Law 112-99 (commonly referred to as the GPX legislation) permitting the United States to countervail Chinese subsidies.168 The report summarizes the commitments undertaken by China in the S&ED dialogues, and the actions undertaken by the USTR to address subsidies and its non-compliance with WTO Dispute Resolution rulings. Similar reviews and findings about China’s compliance with WTO rulings may be found in the annual reports to Congress by the
U.S.-China Economic and Security Review Commission.169
So what to do about overcapacity? Overcapacity clearly has an impact on the profitability of the global steel sector. Yet within existing global trade rules, action on overcapacity has not occurred. This is because overcapacity, which, again, is productive capacity not utilized by current production, cannot be exported, and cases have only been brought to address production that has entered into the international trading system. The rules to address the production that has entered global markets have traditionally come in three forms:170 anti-dumping, which requires establishing that imports are sold at an unfair price171 and are harming or threatening to harm U.S. industry; countervailing duties, which requires establishing that subsidies are being used to artificially promote the industry and are harming or threatening to harm U.S. industry; and “Section 201” cases, which requires establishing a surge of imports in the domestic economy and harming or threatening to harm the competing U.S. industry.172 Enforcement of existing trade rules is certainly an important step to ensuring that overcapacity abroad does not harm U.S. steel producers. The joint report by the USTR and Department of Commerce discussed above (USTR/DOC 2016) provides details on the enforcement of those rules and laws by the U.S. Government.
However, one problem with the current approach to trade rules is that, like torts, they are generally reactive: evidence of harm must be established before remedy can be undertaken.173 “We have to bleed before we get any relief,” said a former executive at U. S. Steel in a recent Wall Street Journal article on the topic of China’s exports.174 Trade actions are not only reactive, but also expensive, costing between $1.5-2 million each.175
The topic of industrial overcapacity is a frustrating policy issue because the global trading system is premised on mutual gains

46 Overcapacity in Steel: China’s Role in a Global Problem
from trade, and if harm is alleged, to show the specific trade-related effects in the domestic industry. In an environment where industrial capacity is developed due to a foreign government’s goals other than profits, the remedy to compensate domestic producers upon finding specific evidence of harm may be inadequate because the existence of noneconomic capacity itself harms producers. The problem of overcapacity and its impact on free market principles requires new thinking. Existing concepts in international trade relating to “nullification and impairment” of trading rights and “serious prejudice” need to be evaluated in terms of addressing overcapacity and its impact.176 In addition, new tools might be appropriate, including:
■ changing the burden of proof upon a finding by the WTO dispute settlement panel of a prohibited trade-related practice, or non-compliance with previous rulings by the WTO;
■ greater support for multilateral environmental agreements with strict pollution limits with border adjustability mechanisms to ensure that those entities that comply are not at a disadvantage, which would expand the topic of debate from the traditional thinking about economic harm caused by overcapacity to the broader environmental harm it causes.
At the minimum, action on designating China as a market economy for purposes of the WTO and U.S. law, which would weaken current tools to combat structural overcapacity, should be delayed until China’s “state capitalism” model is demonstrably consistent with market principles as generally practiced.177 U.S. law includes specific criteria to determine whether market forces in a foreign country are sufficiently developed to permit the use of prices and costs in that country for purposes of the Department of Commerce’s antidumping analysis.178
To conclude, this report has investigated the topic of industrial overcapacity in the steel industry. Our summary assessment is that to date, existing policies have been ineffective in reducing global industrial overcapacity in the sector. The path forward requires addressing both demand and supply imbalances in the steel sector to return it to profitability. Demand side policies supporting a recovery of global economic conditions are necessary, yet regional solutions, specifically China’s “New Silk Road” policy, may further stimulate expansions of the sector due to a continuation of government policies rather than core profitability, and introduce other strategic challenges for the United States and western market economies. Supply reductions, as illustrated in this report, are hampered by misaligned incentives between state and local government authorities in China, and a political economy that values jobs and stability over profitability. Chinese policies intending to reduce capacity have sometimes worked in the wrong way, as forced closures of furnaces of a certain size or smaller have led firms to increase investments in larger furnaces, expansionary government policies have led to overinvestment in many sectors related to construction and real estate industries, local government officials support capacity expansion to enhance their position in the political system, and lenient energy efficiency and environmental standards keep barriers to entry low and facilitate the maintenance of inefficient or obsolete capacity. New goals to reduce environmental pollution in China offer some hope for reducing outdated and inefficient capacity in the steel sector, yet the implementation of environmental pollution efforts has to date been characteristically subject to national-local dynamics, resulting in a trial and error process. The core challenge, it appears to us, is to develop an international trading system recognizing that market and nonmarket economies follow different incentives and goals, and to find a basis for mutually beneficial exchange despite these differences.

Overcapacity in Steel: China’s Role in a Global Problem 47
1 Effective capacity typically is less than nameplate (or “nominal”) capacity, although operational capacity may exceed nameplate capacity due to optimization processes and technology improvements that accumulate over time. Referred to as “capacity creep”, it can mean that effective capacity can exceed nameplate capacity. OECD 2015 notes that measures of excess capacity cannot be simply calculated as the gap between nominal capacity and production due to seasonal variability and maintenance requirements in plants. Though true for monthly measures at the plant level, this objection to using nominal capacity is not true for yearly measures at the national level.
2 Nameplate capacity is also known as “nominal capacity.”
3 We recognize that consumption (apparent steel use) at times is used instead of production to calculate overcapacity measures, particularly at the regional level. However, at the global level, production and consumption are nearly identical. See for example, Ernst and Young (2015) “Global Steel Report 2015-2016” p.13
4 U.S. crude steel production was 78.8MT in 2015, the most recently available data (World Steel Association, World Steel in Figures 2016).
5 See also Figure 3 and Figure 4.
6 The five regions accounted for 78 percent of global crude steel production in 2015.
7 Estimates of overcapacity in China vary from 336 MT to 425 MT (see “Nine Steel Associations Release Statement on the Question of China’s Treatment as a Non-Market Economy”), with the upper range attributed to the American Iron and Steel Institute (see “AISI Chief Urges Action To Eliminate Global Steel Overcapacity
And Foreign Government Subsidies”). FSU countries are Russia, Ukraine, and Kazakhstan. Please note that the discussion refers to nominal, not effective, capacity. Some percentage of nominal overcapacity is characteristic of the industry, and — as in unemployment — expected due to factors discussed in Section 3 of the report.
8 OECD 2015 “Capacity Developments in the World Steel Industry” DSTI/SU/SC(2015)8/FINAL
9 OECD 2015 “Capacity Developments in the World Steel Industry” DSTI/SU/SC(2015)8/FINAL, 23
10 Ibid.
11 OECD 2015 “Capacity Developments in the World Steel Industry” Table 7. The table only details underway capacity.
12 OECD 2015 (p.9) notes that large steel importing countries are seeking greater self-sufficiency in order to reduce their dependence on imports, and despite market conditions, a large number of steel mills are being planned and constructed, contributing to increased global steelmaking capacity.
13 Readers in further information regarding this trend should see OECD 2015 “Capacity Developments in the World Steel Industry” pp. 15-24.
14 See table 5 (p.16) of OECD 2015 “Capacity Developments in the World Steel Industry” DSTI/SU/SC(2-15)8/Final
15 Morgan Stanley (2013) shares a similar perspective at pg. 18.
16 OECD 2015 “Capacity Developments in the World Steel Industry,” p. 24-25.
17 Ibid, 25.
18 Ibid, 20.
19 OECD (2015) “Steel Market Developments Q4 2015,” pp.18-21.
20 OECD (2015) “Economic Outlook,” Nov. 9, 2015.
21 China Iron and Steel Association (2015) “The Thirteenth Five Year Plan: How to improve the competiveness of the steel industry,” July 10.
22 Zhang Shuguang and Zhang Chi (2013) “Resolving Excess Capacity and Promoting Restructuring” Quarterly Economic Brief, Oct. 21. Medium-sized and large steel mills tracked by the China Iron and Steel Association posted a net profit margin of 0.41 percent. Excluding non-core operations, they lost 660 million yuan (~U.S. $103 million), according to Eric Ng (2014) “China’s Steel Industry burdened by overcapacity, workers baulk at shuttering plants” South China Morning Post, Aug. 11. Profit ratio of sales in the steel sector is 0.4 percent and loss incurring enterprises in the sector has reached 30 percent, up from 10 percent in 2011, according to the December 2015 presentation of Zhaoyuan Xu, Development Research Center of the State Council to the OECD Steel Committee.
23 See for example, Mark O’Hara (2015) “The Steel Industry’s Capacity Utilization Ratio Fell to A 3-Year Low” Market Realist, Feb 26.
24 Data from World Steel Association’s Crude Steel Production report, June 2016. Available at https://www.worldsteel.org/media-centre/press-releases/2016/June-2016-crude-steel-production0.html
25 See Tarr, D. G. (1988). The steel crisis in the United States and the European Community: causes and adjustments. In Issues in US-EC trade relations (pp. 173-200). University of Chicago Press.
26 OECD (2015) “Evaluating the financial health of the steel industry” DSTI/SU/SC(2015)12/FINAL, 18.
Endnotes

48 Overcapacity in Steel: China’s Role in a Global Problem
27 OECD (2013) “Evaluating the current state of the steel industry: work in progress,” presentation to the OECD Steel Committee, Paris, December 2013 DSTI/SU/SC (2013)19. We note the models reported do not include the price of steel as an explanatory variable. In correspondence with the analysts, the OECD notes that price and capacity utilization is highly correlated, and therefore would introduce multicollinearity if estimated in the same regression. Therefore, it is indeterminate whether capacity utilization or the price of steel affect company profitability more. One industry analyst we interviewed about the relationship stated that “overcapacity affects steel prices, and prices affect company profitability.”
28 OECD (2015) “Evaluating the financial health of the steel industry” DSTI/SU/SC(2015)12/FINAL, 25.
29 OECD (2016) “Outcomes from the high level symposium on excess capacity and structural adjustment in the steel sector” April 18, 2016.
30 OECD (2015b) “Excess Capacity in the Global Steel Industry: the current situation and ways forward”, DSTI/SU/SC(2014)15/FINAL, 6.
31 OECD (2015) “Evaluating the financial health of the steel industry” DSTI/SU/SC(2015)12/FINAL,26.
32 OECD (2015) “Evaluating the financial health of the steel industry” DSTI/SU/SC(2015)12/FINAL,28 (note 5). For details on how capacity utilization affects the European steel industry, consult BCG (2014) “Coping with Overcapacity: Navigating Steel’s Capacity Conundrum”. For the U.S., two-thirds (64.3 percent) of the variation in the U.S. steel industry’s profits for the 50 quarters between Q4 2000 and Q1 2013 are correlated with changes in the industry’s capacity utilization rates; see AISI/SMA (2013), Government Intervention and Overcapacity: Causes and Consequences for the Global Steel Industry, note 51.
33 U.S. Dept of Labor, Bureau of Labor Statistics, Current Employment Statistics, January 2015 - June 2016. Figures are seasonally adjusted figures for NAICS 313311 and 313312. Please note that the figures do not include job losses in mining operations that provide inputs to steel production. The United Steel Workers Union places the figure at 19,000 layoffs. See “Ruling levels playing field for USW members, companies in steel industry” United Steel Workers press release, Aug 8, 2016.
34 Testimony from Leo Gerard at the April 12-14, 2016 Steel Hearings. http://usw.to/a4.
35 OECD (2015) “Evaluating the financial health of the steel industry” DSTI/SU/SC(2015)12/FINAL, 25
36 Calculated from “major imports and exporters of steel” tables found in World Steel Association’s “World Steel in Figures”, 2006-2016.
37 OECD (2015b), 6.
38 Section 201 of the Trade Act of 1974, commonly referred to as a “Section 201” case. In such actions, the ITC must determine that the increased imports are a substantial cause of serious injury to a domestic industry. In the case of a finding of serious injury, the president has the discretion to decide whether to grant relief and what remedy to impose. See USITC “Global Steel Trade: Structural Problems and Future Solutions” July 2000, p 111. A concise history of the Section 201 of the Trade Act of 1974 action in 2001-2002 is provided here: https://www.asil.org/insights/volume/7/issue/4/us-provides-section-201-relief-american-steel-industry. Original findings related to the case are available at the USITC website here: https://www.usitc.gov/trade_remedy/publications/safeguard_pubs.htm
39 “G-20 says industrial overcapacity has put a dent in global trade” WSJ July 10, 2016.
40 “Saving steel jobs in Cleveland and beyond: Penny Pritzker,” The Plain Dealer, Aug. 12, 2016 http://www.cleveland.com/opinion/index.ssf/2016/08/saving_steel_jobs_in_cleveland.html
41 The final capacity figures for 2015 have not yet been released by the German Steel Federation as of report publication; however, we estimate capacity levels in China to be the same as those published in 2014, 1,140MT.
42 Ernst & Young (2014), 1 (profit margins); OECD (2015) Evaluating the financial health of the steel industry (trade friction); USTR (2016) “Fact Sheet: Addressing Steel Excess Capacity and Its Impacts” April 2016 (job losses).
43 Boston Consulting Group (2002)
44 The advent of electric arc furnace (EAF) mini-mills allows for more flexible production based on existing market demand. Since EAFs can be simply started and stopped on a regular basis, mini-mills can more closely follow the market demand for their products, operating on around-the-clock schedules when demand is high and cutting back production when sales are lower (see also https://www.steelmarketupdate.com/resources/steel-mills/furnace-status/electric-arc-furnace). However, the EAF mini-mill technology tends to be associated with newer steel production facilities, particularly in the United States. Large-scale integrated mills with blast furnaces and basic oxygen furnaces are the dominant technology in many parts of the world, particularly Asia (World Steel Association (2016) “World Steel in Figures 2015” p. 10.) These technologies exemplify the economics of steel production identified in the previous paragraph wherein it may be more economical to produce at lower levels than eliminate production capacity during recessions.
45 Damill, M., Frenkel, R., & Rapetti, M. (2013). Financial and currency crises in Latin America. The Handbook of the Political Economy of Financial Crises, 296.
46 Morgan Stanley 2013, 7.
47 Stephen Cooney, “The American Steel Industry: A Changing Profile” Congressional Research Service, RL 3148 (Nov. 10, 2003), summary. Direct employment effects are from USITC (2000) “Global Steel Trade: Structural Problems and Future Solutions” (July), note 6.
48 Lieberman, Marvin B. (1987) “Excess Capacity as a Barrier to Entry.” Journal of Industrial Economics 35, no.4: 607-627.
49 Boston Consulting Group (2014) “Coping with Overcapacity” draws lessons from overcapacity in the shipping, airline, paper, and the automotive sector for the steel industry. They point to increasing the efficiency of production, joint use of upstream

Overcapacity in Steel: China’s Role in a Global Problem 49
capacities, developing shared capacity, targeting profitable market niches, and avoiding commoditized markets as lessons from these industries. Tire manufacturing, aluminum smelting, and oil refining are also often mentioned as having overcapacity issues. For a recent article on the effects of overcapacity in the tire industry, see Linling Wei, Bob Davis and John Hilsenrath (2015) “Glut of Chinese Goods Pinches Global Economy,” The Wall Street Journal, June 2. Overcapacity in the airline industry is investigated by Wojahn, Oliver (2012) “Why does the airline industry over-invest?” Journal of Air Transport Management, 19: 1-8.
50 Lieberman (1987), “Excess Capacity as a Barrier to Entry”
51 As stated in a 2015 OECD report, “Specific concerns related to government steel policies include continued government subsidies (notably subsidies for the creation of new capacity or the maintenance of inefficient capacities) and continued approvals for new steel facilities. Governments have also noted that trade related measures, constraints on foreign investment, and the activities of government financial agencies are also contributing to global excess capacity and creating difficulties for the industry in addition to weak market conditions. And finally, policy measures which discourage ‘optimal’ exit of the least productive plants may also contribute to excess capacity.” (9).
52 The price-to-book ratio indicates the investment opportunity for a firm. If the ratio is above 1, companies can and should increase assets, while ratios below 1 indicate that liquidation would not meet the market value of the company. OECD 2015 estimates that price to book values for the steel industry are at very low levels and that companies are increasingly relying on short-term debt to maintain operations.
53 Kathryn Harrigan (2013) “Overcoming Exit Barriers” in Palgrave Encyclopedia of Strategic Management, ed. D. Teece and M. Augier, Palgrave Macmillan.
54 See for example, Ernst and Young (2015) “Global Steel 2015-2016: Globalize or customize” pp. 12-14.
55 Harrigan (2013).
56 Please refer to Figure 5 (p.9). The report discusses nominal overcapacity, which may be different than effective overcapacity. Published 2015 estimates of overcapacity in China range from 336-425 MT. See references in note 7.
57 On favorable policies by China to encourage steel production, see Rachel Tang (2010) “China’s Steel Industry and Its Impact on the United States: Issues for Congress” Congressional Research Service Report R4121, Sept. 21.
58 China’s crude steelmaking capacity grew from 150 MT in 2000 to 1,140 MT in 2015.
59 EU Chamber of Commerce in China (2009) “Overcapacity in China: Causes, Impacts and Recommendations,” 20.
60 EU Chamber of Commerce (2009) “Overcapacity in China: Causes, Impacts and Recommendations,” 20 notes that effective capacity utilization ratios declined from their high of 92 percent in 2004 to approximately 72 percent in 2009.
61 The so-called “wave-phenomenon” theory of Chinese investment posits that entrepreneurs and investors collectively form consensus about the next promising industry without knowledge of the total firms deciding to enter the industry. Thus, investment in promising industries by entrepreneurs occurs in waves, leading to overcapacity. See Yifu, L. J., Ho-Mou, W., & Yiqing, X. (2010). Wave Phenomena and Formation of Excess Capacity. Economic Research Journal, 10, p.2.
62 EU Chamber of Commerce in China (2009) “Overcapacity in China: Causes, Impacts and Recommendations”, 22-23. See also update to 2009 report cited as EU Chamber of Commerce in China (2016) “Overcapacity in China: An Impediment for the Party’s Reform Agenda.” Many of the issues identified in the 2009 report remain relevant in the 2016 update. It finds that overcapacity in the sectors covered are due to local protectionism and the fragmentation of industries driven by regionalism; weak enforcement of regulations; low input prices due to government policies; a fiscal system that encourages local government to attract excessive investment; widespread availability of inexpensive technology; environmental, health, and safety standards and laws that are not fully implemented; and a philosophy of market share v. profitability (4). For an accessible overview and discussion of the overcapacity problem in China, consult “The March of the Zombies” The Economist Feb. 27, 2016. Available at http://www.economist.com/news/business/21693573-chinas-excess-industrial-capacity-harms-its-economy-and-riles-its-trading-partners-march
63 Musacchio and Lazzarini (2012) “Leviathan in Business: Varieties of State Capitalism and their implications for economic performance.” For other definitions see Ming Du (2014) “China’s State Capitalism and World Trade Law” International and Comparative Law Quarterly Vol. 63 (April), pp. 409-448.
64 USITC (2007) “China: Description of Selected Government Practices and Policies Affecting Decision-Making in the Economy” USITC Publication397B (December), pp. 155-156.
65 As noted in Du 2014, a recent article [Wooldridge (2012) ‘The Visible Hand’ The Economist 4] found that Chinese SOEs borrowed at 1.6 percent compared to 4.7 percent for other companies. 85 percent of the $1.4 trillion in 2009 bank stimulus loans went to SOEs.
66 See TC Brightbill, Testimony before the US-China Economic and Security Review Commission (2012), as referenced in Du (2014), note 109.
67 Du (2014), 424. In 2007, the State Council instituted a policy to collect dividends from national SOEs and put them into a State Capital Management fund on an experimental basis.
68 See Du (2014), 424-425.
69 See Du (2014), 425.
70 EU Chamber of Commerce (2009)

50 Overcapacity in Steel: China’s Role in a Global Problem
71 Haley, U. C., & Haley, G. T. (2013). Subsidies to Chinese industry: state capitalism, business strategy, and trade policy. Oxford University Press. Ch. 3. An updated calculation of subsidies from the authors is not publicly available.
72 In 2002, Jiangsu Tieben Steel Ltd, a privately owned firm, was expanding production capacity and bought land from the local government at a price of RMB 110,000 per Mu, compared to a market price of RMB 400,000 per Mu at the time. Wang, Guoli and Rixu Zhang. “An Analysis of China’s Excess Capacity Problem Under Fiscal Decentralization – An Empirical Analysis of China’s Steel Industry.”(财政分权背景下的产能过剩问题研究—基于钢铁行业的实证分析), Research on Financial and Economic Issues, no.12, (December 2010).
73 EU Chamber of Commerce in China (2009).
74 EU Chamber of Commerce (2009)
75 Biman Mukherji, John W. Miller and Chuin-Wei Yap (2015) “Why Chinese Steel Exports Are Stirring Protests” Wall Street Journal March 15 (available at http://www.wsj.com/articles/why-chinese-steel-exports-are-stirring-protests-1426466068) “While there has been some tightening of new lending to Chinese industries that face overcapacity, major state-owned steel makers continue to have their loans rolled over or refinanced.”
76 Lingling Wei and Bob Davis (2014) “In China, Beijing Fights Losing Battle to Reign in Factory Production” WSJ, July 16. Authors note that debt has doubled in the past five years.
77 EU Chamber of Commerce (2009), 10.
78 EU Chamber of Commerce (2016), 17.
79 China’s Zombie Companies Stay Alive Despite Defaults” WSJ July 12, 2016.
80 China’s Zombie Companies Stay Alive Despite Defaults” WSJ July 12, 2016.
81 “China may swap zombie companies for zombie banks” Marketwatch, March 14, 2016.
82 China’s Zombie Companies Stay Alive Despite Defaults” The Wall Street Journal, July 12, 2016.
83 USITC (2007)“China: Description of Selected Government Practices and Policies Affecting Decision-making in the Economy” Publication 3978 (December), 154-155. Pieter Bottelier is a China expert at the Johns Hopkins School of Advanced International Studies.
84 EU Chamber of Commerce in China (2009), 11; EU Chamber of Commerce in China (2016), 4.
85 Lingling Wei and Bob Davis (2015) “In China, Beijing Fights Losing Battle to Rein in Factory Production” The Wall Street Journal, July 16.
86 Ibid. See also EU Chamber of Commerce in China (2009), 11.
87 EU Chamber of Commerce in China (2009), 11. Local government financing in China is a source of considerable concern and attention due to current debt levels, estimated at more than $3 trillion. Local governments in China, since 1994, do not have the authority to directly issue bonds, though companies set up by local governments, called local government financing vehicles (LGFV), can raise funds through bank loans, issuing bonds, and initial public offerings, “as well as shadow banking activities such as trust loans” Source: Zhang, Moran (2014) “China to allow deeply indebted local governments to issue new bonds, repay maturing debt” International Business Times, Jan 2. It is the quantity of debt held by LGFV that is causing significant concern among observers. See Moran Zhang (2013) “China Local Government Debt Soars to 3 Trillion, Financial Risk Building” International Business Times, Dec 30; Lingling Wei (2015) “China Backtracks on Local Government Debt” The Wall Street Journal, May 15.
88 Haley and Haley (2013), 63.
89 Zhang and Zhang, Quarterly Economic Brief, October 2013.
90 EU Chamber of Commerce in China (2009), 14.
91 Morgan Stanley (2013), 5-6. In 2016, China announced that its planned capacity cuts of between 100-150 MT in the steel sector would result in 500,000 workers losing their jobs, and designated an estimated 27 billion yuan ($4.24 billion) to compensate relocated workers laid off as a result of seeking to reduce overcapacity over the next two years. Source: “China expects to lay off 1.8 million workers in coal, steel sector,” Reuters Feb. 29, 2016. Steel capacity reduction source: 2016 S&ED Factsheet.
92 Morgan Stanley (2013), Global Steel: steeling for oversupply, 16.
93 Tong, Y., & Lei, S. (2013). Social Protest in Contemporary China, 2003-2010: Transitional Pains and Regime Legitimacy (Vol. 35), p. 75. Routledge. See also pp. 76-77 in Yang, M., & Yu, H. (2011). China’s industrial development in the 21st century (Vol. 27). World Scientific.
94 Ng, Eric (2014) “China’s Steel Industry burdened by overcapacity, workers baulk at shuttering plants,” South China Morning Post, Aug. 11.
95 See Yang & Yu (2011), 77.
96 Eric Ng (2014), as cited in note 93.
97 See “Comments on China’s Steel Industry Adjustment Policy (2015 Revision)” Steel Industry Associations of North America, Latin America, and Europe, April 20, 2015, 5.
98 Kathryn Harrigan (2013) “Overcoming Exit Barriers” in Palgrave Encyclopedia of Strategic Management, ed. D. Teece and M. Augier, Palgrave Macmillan.

Overcapacity in Steel: China’s Role in a Global Problem 51
99 The Davignon plans and Japan’s experience with structural adjustment in the steel sector were recently discussed at the OECD High Level Meeting in March, 2016. 28 million unemployment figure from “China expects to layoff 1.8 million workers in coal, steel sectors” Reuters Feb. 29, 2016.
100 “The March of the Zombies” The Economist, Feb. 27, 2016.
101 EU Chamber of Commerce (2016) holds a similar perspective regarding why overcapacity remains: local protectionism, the threat of social unrest, government’s current role in the Chinese economy (40).
102 2016 U.S.-China Strategic and Economic Dialogue Joint U.S.-China Fact Sheet – Economic Track. https://www.treasury.gov/press-center/press-releases/Pages/jl0484.aspx
103 Sixth Meeting of the U.S.-China Strategic and Economic Dialogue U.S. Fact Sheet – Economic Track http://www.treasury.gov/press-center/press-releases/Pages/jl2563.aspx
104 2014 SE&D
105 He Yafei (2014) “China’s overcapacity crisis can spur growth through overseas expansion” South China Morning Post, 7 Jan. http://www.scmp.com/comment/insight-opinion/article/1399681/chinas-overcapacity-crisis-can-spur-growth-through-overseas
106 Haley and Haley (2013), ch. 3.
107 Haley and Haley, 2013.
108 Ibid.
109 Reuters (2015) “Solution to China’s industrial overcapacity setting more factories overseas” (July 22).
110 South East Asia Iron and Steel Institute (2015) “Message from Secretary General_June 2015” (July 3) http://www.seaisi.org/news/news_view.asp?news_id=4365
111 Ibid. A previous MIIT document (“Plan of Backward Capacity Elimination” May 2014) sought more definite overcapacity reduction targets: 28.7 MT of steel capacity elimination, iron smelting reductions by 19 MT, and the elimination of “backward equipment.” The new policies should be understood in light of objectives announced in previous policies.
112 The others were concrete, electrolytic aluminum, plate glass, and ships and vessels. (Zhang & Zhang 2013).
113 China’s “One Belt, One Road” policy seeks to develop a transportation network of road, rail, pipelines, and ports stretching from Xi’an in central China, to Central Asia, which may ultimately reach Moscow, Rotterdam, and Venice (Scott Kennedy and David Parker (2015) “Building China’s One Belt, One Road” Center for Strategic and International Studies, April 3.). Members of China’s Central Party have opined that China’s overcapacity problems can be solved by overseas expansion and search for foreign customers (See Ha Yafei (2014) “China’s overcapacity crisis can spur growth through overseas expansion” South China Morning Post, Jan. 7, and (unauthored) 2015 “Solution to China’s industrial overcapacity setting up more factories overseas, says official” South China Morning Post, July 22.).
114 China’s “Guideline to Resolve Serious Overcapacity”—Issued by The State Council, Oct. 2013. Interested readers may also see also Zhang and Zhang 2013 for a description of the Guideline opinion.
115 China’s Hebei province aims to shut 60 per cent of steel mills by 2020. March 8, 2016 http://www.straitstimes.com/asia/east-asia/chinas-hebei-province-aims-to-shut-60-per-cent-of-steel-mills-by-2020
116 China’s Hebei province aims to shut 60 per cent of steel mills by 2020. March 8, 2016 http://www.straitstimes.com/asia/east-asia/chinas-hebei-province-aims-to-shut-60-per-cent-of-steel-mills-by-2020
117 OECD 2014.
118 The announced policy stated that there were about 1,200 registered steel companies in China, with the top 66 companies holding 80 percent of total capacity (EU Chamber, 2009). The plan also called upon the top 10 producers to boost their capacity, either through mergers and acquisitions or through organic capacity expansion. In August 2009, MIIT revealed that it was currently drafting guidelines to speed up mergers and acquisitions in the iron and steel industry, including VAT policies favoring SOEs.
119 Jarczyck (2010).
120 Economic Daily (Jingji ribao). “Li Yizhong: Establishing an Exit Mechanism to Solve the Excess Capacity Problem.” (李毅中:化解过剩过能要建好退出机制), (March 2014).
121 Wei, Lingling and Bob Davis (2014) “In China, Beijing Fights Logins Battle to Reign in Factory Production” July 16. http://www.wsj.com/articles/in-china-beijing-fights-losing-battle-to-rein-in-factory-production-1405477804
122 Ibid.
123 Ibid.
124 Morgan Stanley 2016 “China Reforges Steel Industry.” Ernst and Young (2014) note that anecdotal evidence suggests that some Chinese steel mills are upgrading to new technology thereby increasing the amount of investment at risk to avoid shutdown. In addition, stipulations to close furnaces of a given size or smaller have led some firms to increase capacity to remain within the threshold.
125 “Some companies actually resumed production,” July 5, 2016, http://www1.wisco.com.cn/phone/hyzx/9616.jhtml. See also “A Steel Mill Lives Again, in a Setback for China,” The New York Times, June 9, 2016.
126 http://english.caixin.com/2015-05-08/100807608.html. See also: http://www.bloombergview.com/articles/2015-05-14/china-decides-big-steel-is-too-big. Jan 1 date from http://china.org.cn/environment/2015-07/10/content_36026634.htm

52 Overcapacity in Steel: China’s Role in a Global Problem
127 http://www.reuters.com/article/us-china-steel-production-idUSKBN0M20GO20150306
128 “China sends environmental teams to inspect steel mill pollution” Reuters, July 25, 2016. https://www.yahoo.com/news/china-sends-environmental-teams-inspect-steel-mill-pollution-080836989.html
129 China’s Hebei province aims to shut 60 per cent of steel mills by 2020. March 8, 2016 http://www.straitstimes.com/asia/east-asia/chinas-hebei-province-aims-to-shut-60-per-cent-of-steel-mills-by-2020
130 EU Chamber of Commerce in China (2009), 16.
131 EU Chamber of Commerce in China (2009), 16.
132 CISA 2015, “Thirteenth Five Year Plan: How to improve the competitiveness of the steel industry.”Available at http://translate.google.com/translate?hl=en&sl=zh-CN&tl=en&u=http%3A%2F%2Fwww.chinaisa.org.cn%2Fgxportal%2FDispatchAction.do%3FefFormEname%3DECTM40%26key%3DUDMKNVswUTADYgQzVTJWNwFlzNWMgcxBDFSYARnBjcFFloVW0BXZ 1FADklfSFY0&sandbox=1
133 http://news.xinhuanet.com/english/2015-03/21/c_134086302.htm
134 Zhu’s company, Shougang, has boosted its production capacity by launching new projects and acquiring smaller mills in other provinces and autonomous regions, including Guizhou, Shanxi, Xinjiang, and Hebei to reach its target annual capacity of 30 million tons by 2012. “We plan to raise our core competitiveness by building new plants and merging regional companies. We will concentrate on a number of strategically vital products such as high-strength sheet steel for engineering and auto sheet,” Zhu added. Shougang’s latest acquisition of Shanxi-based Changzhi Iron & Steel is aimed at building the mill into a long steel products base. The company paid 500 million yuan for a 90 percent stake in Changzhi Iron & Steel, which has an annual production capacity of 3 million tons http://www.china.org.cn/china/NPC_CPPCC_2011/2011-03/13/content_22127012.htm
135 Xinzhen, Lan. 2009a. “Pumping Iron.” Beijing Review 52(9), see also Xinzhen, Lan 2009b. “Steel’s New Structure.” Beijing Review 52(16), p. 28.
136 Lingling Wei and Bob Davis (2014) “In China, Beijing Fights Losing Battle to Rein in Factory Production” The Wall Street Journal, July 16.
137 Morgan Stanley 2013 Global Steel Report
138 BCG (2014) Baosteel Group Corp., and Wuhan Iron & Steel Group Corp. will be merged into Southern China Steel Group
139 “Arranged marriage in China’s steel industry troubled from the start,” Reuters, July 26, 2016. http://economictimes.indiatimes.com/articleshow/53393085.cms?utm_source=contentofinterest&utm_medium=text&utm_campaign=cppst. Hebei Iron & Steel Group and Shougang Group will be combined into Northern China Steel Group; Shanghai’s Baosteel Group Corp., and Wuhan Iron & Steel Group Corp. will be merged into Southern China Steel Group, according to Bloomberg News.
140 BCG (2014)
141 Comments on China’s Steel Industry Adjustment Policy (2015 Revision). Steel Associations of North America, Latin America and Europe, April 20, 2015.
142 EU Chamber of Commerce in China (2009), 11.
143 Roberts, Dexter (2014) “China Vows to Tackle Overcapacity as Industries Suffer” Business Week, March 27,
144 http://www.pwc.com/en_US/us/industrial-products/publications/assets/pwc-metals-industry-mergers-acquisitions-q2-2014.pdf
145 Biman Mukherji (2015) “Ire Rises At China Over Glut Of Steel” The ll Street Journal, March 16.
146 Scott Kenedy and David Parker (2015) “Building China’s One Belt, One Road” Center for Strategic and International Studies, April 3.
147 Simon Denyer, Paula Bronson, Gene Thorp, Robert Davis and Jason Aldag (2015) “The Push and Pull of China’s Orbit” Washington Post, Sept. 5.
148 He Yafei (2014) “China’s overcapacity crisis can spur growth through overseas expansion” South China Morning Post, Jan. 7 http://www.scmp.com/comment/insight-opinion/article/1399681/chinas-overcapacity-crisis-can-spur-growth-through-overseas
149 Ibid.
150 Rueters (2015) “Solution to China’s industrial overcapacity setting up more factories overseas, says official” South China Morning Post, July 22.
151 “Steelmaker looks abroad” China Daily, Oct. 21, 2014. http://www.china.org.cn/business/2014-10/21/content_33820908.htm
152 Bloomberg (2014) “China steel capacity transfer is imaginary” Dec. 17 http://www.moneyweb.co.za/uncategorized/china-steel-capacity-transfer-is-imaginary/
153 “Steelmaker looks abroad” China Daily, Oct. 21, 2014
154 Ruby Lian and David Stanway (2015) “China steel firms turn overseas as domestic woes mount” Reuters, March 25. http://www.reuters.com/article/2015/03/25/us-china-steel-investment-idUSKBN0MJ0SY20150325
155 Ibid.
156 David Dollar (July 2015) China’s rise as a regional and global power: The AIIB and the ‘one belt, one road’. Brookings Institution. http://www.brookings.edu/research/papers/2015/07/china-regional-global-power-dollar

Overcapacity in Steel: China’s Role in a Global Problem 53
157 EU Chamber (2016) “Overcapacity in China: An Impediment to the Party’s Reform Agenda.”
158 Bloomberg (2014) “China steel capacity transfer is imaginary” Dec. 17
159 A recent CISA document stated that China’s barely 70 percent capacity utilization rate in the sector over the past four years is not sustainable, and that the 3 percent average profits in the industry are the lowest in China’s industrial sector [CISA (2015) Thirteenth Five Year Plan: How to improve competitiveness in the steel industry.] This assessment might be generous, as another account (Ng 2014) estimates profitability in the steel sector at less than half of 1 percent.
160 These conclusions are reached from reading over press releases and other announcements on the state-backed CISA website. A western perspective on the current overcapacity challenge is offered by Mukherji, Miller, and Yap (2015) “Why Chinese Steel Exports Are Stirring Protests” The Wall Street Journal, March 15.
161 Tang (2010) CRS 41421, Summary.
162 Fulco, Matthew (2016) “Solving the Prickly Problem of Overcapacity in China” June 14, 2016, pg.2.
163 “China Continues to Prop Up Its Ailing Factories, Adding to Global Glut” Wall Street Journal, May 9, 2016.
164 OECD (2016) “Reflections on restructuring of the Chinese steel industry” Presentation to the HIGH-LEVEL MEETIING: Excess Capacity and Structural Adjustment in the Steel Sector, April 18, 2016.
165 Fulco, Matthew (2016) “Solving the Prickly Problem of Overcapacity in China” June 14, 2016, pg.7
166 “China’s Zombie Companies Stay Alive Despite Defaults” Wall Street Journal, July 12, 2016.
167 USTR/USDOC (2016) “Subsidies Enforcement Annual Report to the Congress” Joint Report of the Office of the United States Trade Representative and the United States Department of Commerce, February.
168 In addition to the joint report cited above, readers interested in recent discussions about China-U.S. Trade issues should refer to Morrison, Wayne M. (2015) “China-U.S. Trade Issues” Congressional Research Service RL 33536 (March 17).
169 U.S.-China Economic and Security Review Commission and their annual reports are available at http://www.uscc.gov.
170 Other actions also exist within the trade rules to limit imports that harm U.S. industry. These could include enforcement of Article 23 of the General Agreement on Tariffs and Trade (GATT), which allows for cases where there has been “nullification and impairment” of trading rights (see www.wto.org/english/tratop_e/dispu_e/disp_settlement_cbt_e/c4s2p1_e.htm) , use of NME methodologies to ensure that, in steel, China’s policies and the impact on world markets can be actionable, and action on “downstream dumping” wherein steel produced with subsidies can be addressed when those inputs are used in other products, as for example, steel used in cars and white goods.
171 Defined as the cost of imported goods sold is less than the cost of production plus transportation.
172 Section 201 of the Trade Act of 1974 (P.L. 93-618) permits the President to grant temporary import relief, by raising import duties or imposing nontariff barriers on goods entering the United States that injure, or threaten to injure, domestic industries producing like goods. This provision is the analog of the 1994 GATT Article XIX, which allows relief from injurious competition when temporary protection (limited to 5 years) will enable the domestic industry to make adjustments to meet the competition (source: https://en.wikipedia.org/wiki/Section_201). The text of Article XIX is available here: https://www.wto.org/english/res_e/booksp_e/analytic_index_e/gatt1994_07_e.htm
173 Actionable subsidies must be “specific” (limited to a firm, industry, or group within a member state) and must be found to cause adverse trade effects (material injury or serious prejudice to the domestic industry) to a member state (see USTR/DOC (2015),1).
174 Mukherji, Miller, and Yap (2015) “Why Chinese Steel Exports Are Stirring Protests” The Wall Street Journal, March 15.
175 Leo Gerard, International President of USW, testimony in front of the 2016 steel hearings stated that $75 million to $100 million was spent in the 50 steel trade cases since 2011.
176 Under WTO rules, most subsidies, such as production subsidies, are not prohibited, but they are subject to challenge if they cause adverse effects to the interests of another WTO member. There are three types of adverse effects. “First, there is injury to a domestic industry caused by subsidized imports in the territory of the complaining Member. This is the sole basis for countervailing action. Second, there is serious prejudice. Serious prejudice usually arises as a result of adverse effects (e.g., export displacement) in the market of the subsidizing Member or in a third country market. Thus, unlike injury, it can serve as the basis for a complaint related to harm to a Member’s export interests. Finally, there is nullification or impairment of benefits accruing under the GATT 1994. Nullification or impairment arises most typically where the improved market access presumed to flow from a bound tariff reduction is undercut by subsidization. The creation of a system of multilateral remedies that allows Members to challenge subsidies which give rise to adverse effects represents a major advance over the pre-WTO regime. The difficulty, however, will remain the need in most cases for a complaining Member to demonstrate the adverse trade effects arising from subsidization, a fact-intensive analysis that panels may find difficult in some cases.” -- https://www.wto.org/english/tratop_e/scm_e/subs_e.htm
177 Expiration of Section 15(a)(ii) of China’s Dec. 11, 2001 WTO accession agreement is currently under debate. The US states that the section does not require countries to declare China a market economy automatically. China argues that regardless of status, countries must calculate anti-dumping duties based on Chinese company prices and costs rather than those of third countries. Source: “US, China clash over looping anti-dumping decision” July 14, 2016.
178 Section 771(18)(B) of the Tariff Act of 1930 (19 U.S.C. 1677(18)(B)) requires that a foreign country’s economy as a whole meet specific criteria in order to be granted treatment as a market economy country.

@KeepitMadeinUSA
facebook.com/AmericanManufacturing
711 D Street NW • 3rd flrWashington, D.C. 20004202-393-3430