Overall Efficiency Improvement of a Production Line by...
12
Proceedings of the International Conference on Industrial Engineering and Operations Management Paris, France, July 26-27, 2018 © IEOM Society International Overall Efficiency Improvement of a Production Line by Using Yamazumi Chart: A Case Study Subrata Talapatra Department of Industrial Engineering and Management Khulna University of Engineering and Technology Khulna 9203, Bangladesh [email protected] Sharif-Al-Mahmud Department of Industrial Engineering and Management Khulna University of Engineering and Technology Khulna 9203, Bangladesh [email protected] Imran Kabir Department of Industrial Engineering and Management Khulna University of Engineering and Technology Khulna 9203, Bangladesh [email protected] Abstract This paper presents a case study aims to redesign a hand bag assembly line to reach maximum line efficiency with an optimum number of workstation for a constant cycle time. Three heuristic assembly line balancing algorithms known as “Kilbridge and Wester Column”, “Rank Positional Weight” and “Largest Candidate Rule” are applied to design this single model assembly line. Yamazumi chart is used to the visual representation of workload on each workstation. Best two solution models are then simulated in Arena to check the feasibility. By comparing analytical and simulation report one best solution model is recommended to implement. The evaluation of the proposed solution model shows that the production line efficiency increased from 49 percent to 77 percent, number of manpower reduced from 23 workers to 16 workers and provides more balanced workload on each worker. Therefore, this paper can contribute to meet the same amount of customer demand with a minimized operator cost by higher utilization of worker. Keywords Line Balancing, Yamazumi Chart, Simulation, Arena, Line Efficiency. 1. Introduction An assembly line consisting a number of workstations where a group of task is performed to produces goods or product as it transfers successively from one workstation to the next station along the line (Avikal, Jain, Mishra & Yadav, 2013; Kara, Ozguven, Yalcin & Atasagun, 2011; Scholl & Boysen, 2009). A company must manage the production line very well and distribute workload in various workstations to obtain the maximum production line performance or efficiency. In this case, should be introduced, line balancing is a systematic technique or approach that is used effectively to distribute the total workload as evenly possible to the workstations (Kucukkoc, Karaoglan & Yaman, 2013; Tuncel & Topaloglu, 2013). Line balancing technique is able to increase the assembly line efficiency of a company. Yamazumi chart is used as a tool to proceed Kaizen for line balancing (Naufal, Jaffar, Noriah & Halim, 2013). Yamazumi chart is a man-machine bar chart that shows the total cycle time for each operation when performing their process in the production flow (Sabadka, Molnár, Fedorko & Jachowicz, 2017). It is a visual representation of workload on each station that shows how the production time is distributed over the line. The methods to formulate
Transcript of Overall Efficiency Improvement of a Production Line by...

Proceedings of the International Conference on Industrial Engineering and Operations Management
Paris, France, July 26-27, 2018
© IEOM Society International
Overall Efficiency Improvement of a Production Line by
Using Yamazumi Chart: A Case Study
Subrata Talapatra
Department of Industrial Engineering and Management Khulna University of Engineering and Technology
Khulna 9203, Bangladesh [email protected]
Sharif-Al-Mahmud
Department of Industrial Engineering and Management Khulna University of Engineering and Technology
Khulna 9203, Bangladesh [email protected]
Imran Kabir
Department of Industrial Engineering and Management Khulna University of Engineering and Technology
Khulna 9203, Bangladesh [email protected]
Abstract This paper presents a case study aims to redesign a hand bag assembly line to reach maximum line efficiency with an optimum number of workstation for a constant cycle time. Three heuristic assembly line balancing algorithms known as “Kilbridge and Wester Column”, “Rank Positional Weight” and “Largest Candidate Rule” are applied to design this single model assembly line. Yamazumi chart is used to the visual representation of workload on each workstation. Best two solution models are then simulated in Arena to check the feasibility. By comparing analytical and simulation report one best solution model is recommended to implement. The evaluation of the proposed solution model shows that the production line efficiency increased from 49 percent to 77 percent, number of manpower reduced from 23 workers to 16 workers and provides more balanced workload on each worker. Therefore, this paper can contribute to meet the same amount of customer demand with a minimized operator cost by higher utilization of worker. Keywords Line Balancing, Yamazumi Chart, Simulation, Arena, Line Efficiency.
1. Introduction An assembly line consisting a number of workstations where a group of task is performed to produces goods or product as it transfers successively from one workstation to the next station along the line (Avikal, Jain, Mishra & Yadav, 2013; Kara, Ozguven, Yalcin & Atasagun, 2011; Scholl & Boysen, 2009). A company must manage the production line very well and distribute workload in various workstations to obtain the maximum production line performance or efficiency. In this case, should be introduced, line balancing is a systematic technique or approach that is used effectively to distribute the total workload as evenly possible to the workstations (Kucukkoc, Karaoglan & Yaman, 2013; Tuncel & Topaloglu, 2013). Line balancing technique is able to increase the assembly line efficiency of a company. Yamazumi chart is used as a tool to proceed Kaizen for line balancing (Naufal, Jaffar, Noriah & Halim, 2013). Yamazumi chart is a man-machine bar chart that shows the total cycle time for each operation when performing their process in the production flow (Sabadka, Molnár, Fedorko & Jachowicz, 2017). It is a visual representation of workload on each station that shows how the production time is distributed over the line. The methods to formulate

Proceedings of the International Conference on Industrial Engineering and Operations Management
Paris, France, July 26-27, 2018
© IEOM Society International
the Yamazumi Chart are first, use the actual basic cycle time, found from the time measurement sheet. Secondly, construct bar chart from accumulated cycle time for one operator. The cycle time is plotted on the vertical axis and the talk time is plotted on a horizontal axis. The aim of applying Yamazumi chart is to balance the overall cycle time for all the workstation. This study involved applying the three heuristic algorithms to reduce the production time. They are used for selecting the best production line layout. The three assembly balancing methods are as follows: I. Kilbridge and Wester Column (KWC), and II. Ranked Positional Weight (RPW) III. Largest Candidate Rule (LCR) The research is focused on women hand bag semi-automated assemble production line at ‘Ventura Leatherware Mfy (bd) LTD’, Saidpur, Bangladesh. The goal of the research is to identify the current condition of the production line by determine the current efficiency and apply Line Balancing algorithms to improve the theoretical efficiency by eliminating unnecessary workstation and developing a simulation model to check feasibility. And finally, compare the efficiency of Line Balancing Algorithms and find the best model. The rest of the paper is arranged into six sections. The first section covers the literature review and research gaps relating Line balancing. The second section describes the problem statements. The third one provides methodology and steps of current research. The next section consists of data analysis and simulations. The fifth section discusses results and findings. Finally, in section sixth, limitations are summarized.
2. Literature review Following work has been done so far regarding Line Balancing for the different product shown in Table 1.
Table 1. Literature review SL. No
References Details
01 Nagi, Chen and Wan (2017)
They used pull simulation module to mimic a real engine assembly line where 144 different parts are being assembled. Recommended solutions have aided the engine assembly line to increase its production rate by 14%.
02 Adnan, Arbaai, and Ismail, (2006)
They Implemented Lean to regulate works on the floor to increase the manufacturing performance. Applied improvement steps are eliminating unnecessary activity, reducing cycle time, balancing workload using Yamazumi chart. The company has increased the efficiency of the production line to 77 percent, reduced number of manpower from 4 workers to 3 workers and more balanced the workload of each worker.
03 Mishan, and Tap (2015)
This paper presents a study that objectives to increase the throughput and efficiency of a food processing line in a company. The method used to improve this line is a combination of line balancing and work-study methods.
04 Rahman and Sabuj (2015)
They concerned with implementing a computer simulation model to a batch production system for process flow improvement. This study was based on balancing a UPS production flow line where the output is not at the satisfactory level compared to input. The modified system with the model developed had shown a significant decrease in average total transfer time that improves productivity from 33 pieces of UPS to 38 pieces of UPS per 3 days.
05 Naufal, Jaffar, Noriah and Halim (2013)
This paper used a series of kaizen activities that had been engaged in creating the continuous flow system at an identified assembly line. This was a case study conducted at a local auto-component company in Malaysia. Based on the obtained results, productivity at the workplace increased by 55%, space utilization was trimmed down by 34% and the number of workers was reduced by 33%.
06 Yuan, Zhang, Shao and Jiang (2015)
A novel hybrid honey bee mating optimization algorithm was proposed to solve the mixed-model two-sided assembly line balancing problem and the goal was to reduce the number of workstations. In order to validate the effectiveness of the applied algorithm, seven sets of situations were experienced, and the results were compared.
07 Kayar and Akalin (2016)
This study was to form an assembly line which has the highest line efficiency with minimum machine and operator using two different assembly line balancing methods (Hoffman method and simulation method).

Proceedings of the International Conference on Industrial Engineering and Operations Management
Paris, France, July 26-27, 2018
© IEOM Society International
2.1 Research Gap
From the previously mentioned works, it is seen that all of them used different tools, algorithms and simulation model to increase the throughput rate of products. For the improvement of production rate maximum available cycle time needed to be reduced. We have identified an important research gap. No study has been conducted to improve the line efficiency for a constant cycle time. So, to address the research gap, the goal of the case study is to develop an assembly line to reach maximum line efficiency by using an optimum worker for a constant cycle time for a Leatherware industry.
3. Problem statement
This research is based on an industry named Ventura Leatherware Mfy (bd) LTD’, which is a leading manufacturer of lather bag products. Form many lather bag products a type of women hand bag manufacturing assembly line is studied. There are 19 different processes as well as the workstation to complete a women hand bag. Based on a preliminary study of the current production line there exist a major problem. The line is experiencing low line efficiency. There is a blockage in the system because of imbalance in-line production cycle time. The current efficiency of the production line is about 49%. The workload is not distributed evenly through the production line. Some worker haves too much idle time while some worker can hardly complete the task within time. Labor cost is increasing day by day. Higher labor cost causes higher variable cost per unit of the bag. So unnecessary labor must be eliminated to meet customer demand in a cost-effective way.
4. Methodology
The whole process of study work can be shortly explained by the following flowchart:
Preparation of time study sheet for the women hand bag production
Development of precedence diagram and table
Calculate current labor and machine productivity and line efficiency.
Application of Line balancing Methods to find a new balanced model
Run the solution model on Arena simulation software to check the feasibility.
Compare the new labor and machine productivity and line efficiency with the existing line
Results and Recommendations
Figure 1. Steps in methodology

Proceedings of the International Conference on Industrial Engineering and Operations Management
Paris, France, July 26-27, 2018
© IEOM Society International
5. Analysis and Simulations
Cycle time is defined as the time it takes to do a process (Yamashita, 2004). It includes the time from when an operator starts a process until the work is ready to be passed on. Range= CT max-CT min (1) CT max= Cycle Time Maximum CT min= Cycle Time Minimum Work Element Time= CT min+ Allowance (Adnan et al., 2006) (2)
Takt time is the principle that all activity within a business is synchronized by a pulse, set by the customer demand (Strohmandl, Tomek, Šafařík & Málek, 2016; Rahani & Al-Ashraf, 2012; Simons & Zokaei, 2005). Takt time relates the customer demand to the time available. Takt time can be obtained by using the following formula (Duanmu & Taaffe, 2007; Adnan et al., 2006)
Takt Time = (3)
The theoretical manpower requirement in a production line can be determined by using the formula below (Groover, 2016; Adnan et al., 2006)
(4)
An important measure of performance for a production line is the system throughput such as the average number of jobs produced per hour. Efficiency is the proportion of the current productivity level to the best practice productivity level. Best practice is defined as the largest productivity achievable. The efficiency of the production line can be achieved by using following formula (Mishan et al., 2015; Stevenson, 2009).
Efficiency (Eb) = 100% (5)
Where, = Total work element time
n = Number of workstations C= Maximum available cycle time on the line.
5.1 Measurement of Work Station Time The cycle time for each workstation was measured from the start picking part until it has been put at the next workstation. The cycle time was measured and recorded based on work sequences determined during observation. To enhance the reliability of the data obtained, a video camera was used in recording. The camera was to capture video during the length of ten work cycle in each workstation. From the videos recorded, the cycle time for workstation has been calculated by using time measurement check sheet. The value of cycle time is calculated using Equation (1) and Equation (2). 5.2 Existing Factory Status Analysis
There are always some restrictions on the order of the process in which the work element can be performed. Some
work element or task must be done before other.
Figure 2. Precedence diagram of Existing Factory Status.

Proceedings of the International Conference on Industrial Engineering and Operations Management
Paris, France, July 26-27, 2018
© IEOM Society International
These requirements of the work sequence are called precedence constraints. The graphical representation of
precedence constraints is called precedence diagram. Figure 1 shows precedence diagram of our Existing Factory
Status. Our provided demand of bag is 6400 piece per month which can be converted to 266.67 pieces per day (24
working day in a month). Available working time in a day is 11 hour or 39600 seconds. So, Takt time is 148.5
second determined based on Equation (3). For 91% uptime efficiency maximum available service time (C) in line is
135 second. Plotting workstation cycle time value on the Yamazumi chart is done to describe current workload of a
worker per station. The Yamazumi chart for the current condition is shown in Figure 3. Based on the current
workload of the worker (see Figure 3), it is seen, the production line is not balanced.
Figure 3. Yamazumi Chart of Existing Factory Status
Calculating theoretical number of worker required based on takt time is carried out using Equation (4). From the Yamazumi chart obtained, the workload of each worker can be determined by total up the cycle time of each worker. Based on Equation. 4, only 9 man powers required to the production line rather than current condition 23 workers used (2 workers for each of station no 6,9,15,16 and 1 workers for each of the rest). The efficiency of the current assembly line is 49.16% determined by Equation (5). Therefore, improvement activity needs to be carried out to meet the target number of manpower. In the later portion of this paper only serial numbers are used to refer these workstations. 5.3 Kilbridge and Wester Column Solution Model
Kilbridge and Wester (column) method is a heuristic procedure that selects work elements for assignment to stations
according to their positions in the precedence diagram (Jaggi & Chaubey, 2015). Work elements that arranged in the
precedence diagram are divided into columns (Make & Faisae, 2017). The elements are then organized into a table
according to their columns, with an element in the first column with highest task time listed first. For assigning the
elements to the first station, the work is started at the top of the list, selecting the first feasible element for the
placement at the station. One that satisfies the precedence constraints is a feasible element, and finally, it does not
cause the sum of the task time at the station to exceed the maximum available cycle time, C. These steps are
repeated till the last station. Figure 3 shows assignment of the current station work element into new model
workstation according to Kilbridge and Wester Column method. Yamazumi chart, shown in Figure 4, illustrate the
deviation in the workstation cycle times is lower than the existing model. That means the production line will be
more balanced according to this model. Efficiency is increased to 77.83% determined by Equation (5) and number

Proceedings of the International Conference on Industrial Engineering and Operations Management
Paris, France, July 26-27, 2018
© IEOM Society International
of workers needed reduced to 16 (2 worker for each of station 3, station 4, station 10, station 11 and 1 worker for each of the rest) by this solution model.
Figure 4. New workstations according to Kilbridge and Wester Column method.
Figure 5. Yamazumi Chart for KWC solution model
5.4 Rank Positional Weight Solution Model
For applying this line balancing method, at first positional weight are determined for each work element in
precedence diagram. It is the total time on the longest path from the beginning of the process to the last process of
the network. Then the work element is ranked in a table in descending order according to their positional weight
(Kayar & Akyalçin, 2014; Fazlollahtabar, Hajmohammadi & Es’haghzadeh, 2011). For assigning the elements to
the station's same procedure is followed that KWC method does. Figure 5 shows the assignment of the current
station work element into new model workstation according to Rank Positional Weight method. A number of
workstation and worker remain same as the Kilbridge and Wester Column solution model. 77.83%-line efficiency is
found by the Equation (5). Yamazumi chart of this model solution is shown in Figure 7.
Figure 6. New workstations according to Rank Positional Weight solution model.
Proceedings of the International Conference on Industrial Engineering and Operations Management
Paris, France, July 26-27, 2018
© IEOM Society International
Figure 7. Yamazumi chart for RPW solution model
5.5 Largest Candidate Rule Solution Model
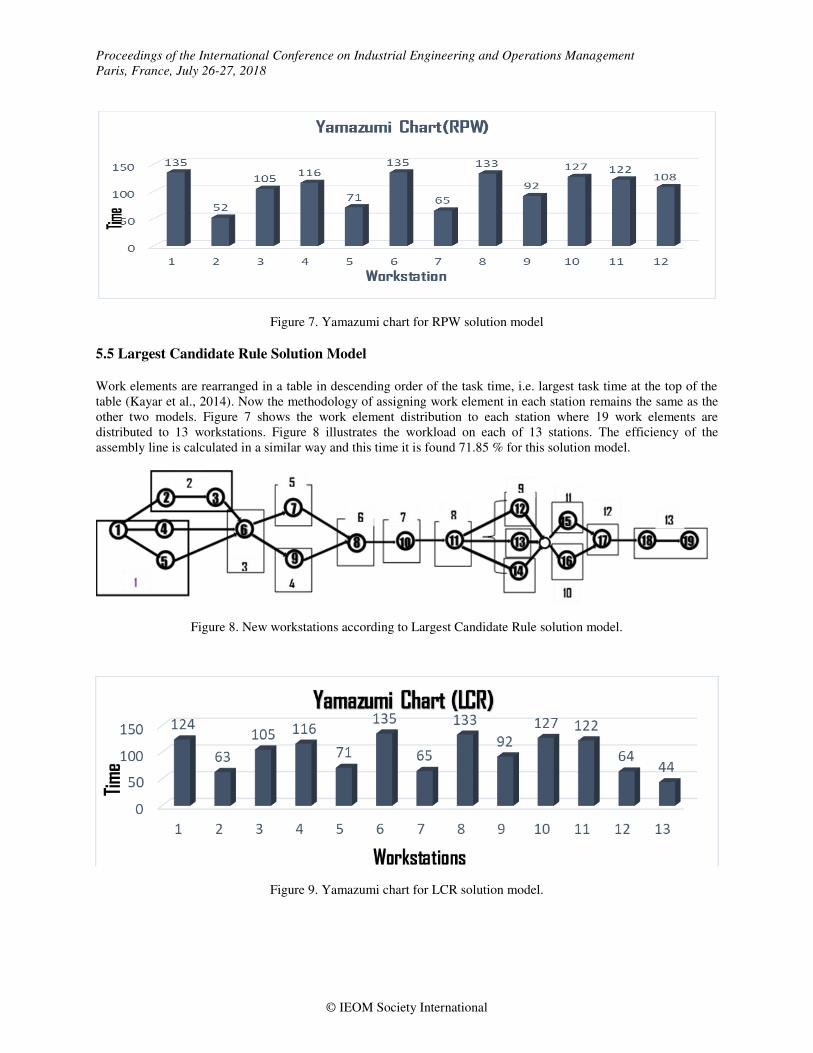
Work elements are rearranged in a table in descending order of the task time, i.e. largest task time at the top of the table (Kayar et al., 2014). Now the methodology of assigning work element in each station remains the same as the other two models. Figure 7 shows the work element distribution to each station where 19 work elements are distributed to 13 workstations. Figure 8 illustrates the workload on each of 13 stations. The efficiency of the assembly line is calculated in a similar way and this time it is found 71.85 % for this solution model.
Figure 8. New workstations according to Largest Candidate Rule solution model.
Figure 9. Yamazumi chart for LCR solution model.

Proceedings of the International Conference on Industrial Engineering and Operations Management
Paris, France, July 26-27, 2018
© IEOM Society International
5.6 Arena Simulations
As it is seen, two of our proposed solution model possess the maximum and equal line efficiency, it is required for
further analysis to find out the best feasible model. Rockwell Arena Software helped at this stage of analysis.
According to Wikipedia, Arena was developed in 2000 by System Modelling and acquired by Rockwell
Automation. The simulation was conducted upon Existing factory status, Kilbridge and Wester Column model and
Rank Positional Weight solution model to check their feasibility by comparing new models with existing factory and
find out the best solution with respect to worker utilization cost and a number of output per day.
Figure 10. Existing Factory Status while simulation running
Workstations are shown in process module and a number of workers, the wage of the worker per hour (300
BDT/day or 27.27 BDT/hour), name and number of machine needed, and corresponding workstation time were
inputted as a parameter.
After building Current Factory model on Arena, the simulation was to run for one day having 11 working hour.
Figure 9 shows a screenshot of simulation which was taken at a random time while simulation running. Before and
after workstation 8 (Drying) a batch module and a separate module is used as drying operation is done by batch with
10 work in progress bag. As it is seen, the red marked area from Figure 10 clearly shows the bottleneck stations.
For KWC solution model, the simulation was done according to data shown in Figure 5 where work elements are
allocated to 12 workstations. Figure 11 is a screenshot of KWC method simulation that was taken at a random time
while running. It is seen that the crowd on the workstation 6 (drying) and workstation 8 (final zipper setting) stations
are reduced compared to the Existing Factory Status and the bottleneck before the Drying station is balanced. A
similar procedure is done to simulate RPW solution model. Figure 12 shows the random timing screenshot of RPW
solution model while simulation was running. And it gives almost same results that KWC solution model does.
Figure 11. KWC solution model simulation while running

Proceedings of the International Conference on Industrial Engineering and Operations Management
Paris, France, July 26-27, 2018
© IEOM Society International
Figure 12. RPW solution model simulation while running
6.0 Results analysis
Comparison of efficiencies of this two solutions model and Existing Factory Status is shown in Figure 13. The
report after simulations from Arena is shown in Table 2.
Figure 13. Efficiency comparison of solution models and current status
There is a comparison bar chart drawn in Figure 13 to show the comparison among Existing Factory Status and two
solution models. It is seen that total worker cost per day is significantly decreased with this two solution model.
Table 2. Result found form simulation Report
Name of Model Idle Cost Busy Cost
Total Worker
Cost/day Number of OUTPUT/day
Current Factory Status 2434 4459 6892 269
KWC 1000 3793 4793 269
RPW 1150 3644 4794 267
6.1 Discussions and Recommendations
Implementing Line Balancing tool has proven to have produced a great impact on the manufacturing semi-
automated assembly line process stated in this study. The discrete- event simulation (Rockwell Arena) modeling was
an effective tool for validating results of line balancing. The factory can increase the efficiency of the production

Proceedings of the International Conference on Industrial Engineering and Operations Management
Paris, France, July 26-27, 2018
© IEOM Society International
line from 49.16% to 77.83% and reduce the number to the worker from 23 to 16 by using any of these solution
models. So total worker cost per day will be decreased by about 2100 BDT per day. Although the two solution
models give approximately same results, it is recommended that the ‘Ventura leatherwear Mfy (BD) LTD’ should
use the Kilbridge and Wester Column model solution workstation layout. As it is seen from Figure 3 and Figure 5,
there is not more than three task is allocated in a workstation by KWC model where RPW model does have more
work element in a workstation. So this model is more feasible than the other one and will be easy to implement.
Also from the result of the simulation, it is seen that idle cost for KWC model is lower than the RPW model and a
number of product output is larger by 2 unit per day. Idle cost for RPW model is higher than the KWC model
according to simulation results. After all the consideration Kilbridge and Wester Column solution model is
recommended to implement.
Figure 14. Comparison of simulation results
7.0 Conclusions
The efficiency is of the two solution model is empirically same. Although, in real life, the efficiency is slightly
lower as practical conditions are variable and unpredictable. The limitation of implementing these solution model
multi-skilled worker is highly required. So recruiting multi-skilled worker is recommended to a workstation when
implement KWC solution model.
References
Adnan, A. N., Arbaai, N. A., & Ismail, A. (2006). Improvement of overall efficiency of the production line by using line balancing. International Journal of Production Research, 40(2), 387-395.
Arena (software), Wikipedia, Available: https://en.wikipedia.org/wiki/Arena_(software), April 24, 2018. Avikal, S., Jain, R., Mishra, P. K., & Yadav, H. C. (2013). A heuristic approach for U-shaped assembly line
balancing to improve labor productivity. Computers & Industrial Engineering, 64(4), 895-901. Duanmu, J., & Taaffe, K. (2007, December). Measuring manufacturing throughput using takt time analysis and
simulation. In Proceedings of the 39th conference on Winter simulation: 40 years! The best is yet to come (pp. 1633-1640). IEEE Press.
Fazlollahtabar, H., Hajmohammadi, H., & Es’haghzadeh, A. (2011). A heuristic methodology for assembly line balancing considering stochastic time and validity testing. The International Journal of Advanced Manufacturing Technology, 52(1-4), 311-320.

Proceedings of the International Conference on Industrial Engineering and Operations Management
Paris, France, July 26-27, 2018
© IEOM Society International
Groover, M. P. (2016). Automation, production systems, and computer-integrated manufacturing. Pearson Education India.
Jaggi, A., Patra, S., & Chaubey, D. S. (2015). Application of Line-balancing to Minimize the Idle Time of Workstations in the Production Line with Special Reference to Automobile Industry. International Journal ofproductivity,10(3) 8-12.
Kara, Y., Özgüven, C., Yalçın, N., & Atasagun, Y. (2011). Balancing straight and U-shaped assembly lines with resource dependent task times. International Journal of Production Research, 49(21), 6387-6405.
Kayar, M., & Akalin, M. (2016). Comparing Heuristic and Simulation Methods Applied to the Apparel Assembly Line Balancing Problem. Fibres & Textiles in Eastern Europe, 2 (6), 131-137.
Kayar, M., & Akyalçin, Ö. C. (2014). Applying different heuristic assembly line balancing methods in the apparel industry and their comparison. Fibres & Textiles in Eastern Europe 20(3), 38-43..
Kucukkoc, I., Karaoglan, A. D., & Yaman, R. (2013). Using response surface design to determine the optimal parameters of genetic algorithm and a case study. International Journal of Production Research, 51(17), 5039-5054.
Make, M. R. A., & Faisae, M. F. (2017). Assembly Line Balancing using Heuristic Approaches in Manufacturing Industry.
Mishan, N. N., & Tap, M. M. (2015). Increasing line efficiency by using timestudy and line balancing in a food manufacturing company. Jurnal Mekanikal, 38, 32-43.
Nagi, M., Chen, F. F., & Wan, H. D. (2017). Throughput Rate Improvement in a Multiproduct Assembly Line Using Lean and Simulation Modeling and Analysis. Procedia Manufacturing, 11, 593-601.
Naufal, A. A., Jaffar, A., Noriah, Y., & Halim, N. H. A. (2013). Implementation of Continuous Flow System in manufacturing operation. In Applied Mechanics and Materials (Vol. 393, pp. 9-14). Trans Tech Publications.
Rahani, A. R., & Al-Ashraf, M. (2012). Production flow analysis through value stream mapping: a lean manufacturing process case study. Procedia Engineering, 41, 1727-1734.
RAHMAN, C. M., & SABUJ, S. U. (2015). PROCESS FLOW IMPROVEMENT PROPOSAL OF A BATCH MANUFACTURING SYSTEM USING ARENA SIMULATION MODELING. Review of General Management, 21(1).
Sabadka, D., Molnár, V., Fedorko, G., & Jachowicz, T. (2017). Optimization of Production Processes Using the Yamazumi Method. Advances in Science and Technology. Research Journal, 11(4), 175-182.
Scholl, A., & Boysen, N. (2009). Designing parallel assembly lines with split workplaces: Model and optimization procedure. International Journal of Production Economics, 119(1), 90-100.
Simons, D., & Zokaei, K. (2005). Application of lean paradigm in red meat processing. British Food Journal, 107(4), 192-211.
Stevenson, W.J. (2009). Operations Management. (10thed.) New York: McGraw- Hill. Strohmandl, J., Tomek, M., Šafařík, Z., & Málek, Z. (2016). SW to support the project management of conveyor
design and installation. In Vision 2020: Innovation Management, Development Sustainability, and Competitive Economic Growth-Proceedings of the 28th International Business Information Management Association Conference, IBIMA 2016. International Business Information Management Association (IBIMA).
Tuncel, G., & Topaloglu, S. (2013). Assembly line balancing with positional constraints, task assignment restrictions and station paralleling: A case in an electronics company. Computers & Industrial Engineering, 64(2), 602-609.
Yamashita, K. (2004). Implementation of lean manufacturing process to XYZ company in Minneapolis area. University of Wisconsin-Stout.
Yuan, B., Zhang, C., Shao, X., & Jiang, Z. (2015). An effective hybrid honey bee mating optimization algorithm for balancing mixed-model two-sided assembly lines. Computers & Operations Research, 53, 32-41.
Biographies
Subrata Talapatra, serving as an Assistant Professor in the Department of Industrial Engineering and Management of Khulna University of Engineering & Technology. He obtained his B.Sc. in Mechanical Engineering from Rajshahi University of Engineering & Technology and M.Sc. in Industrial Engineering and Management from Khulna University of Engineering & Technology. His areas of research are Statistical Quality Control, Ergonomics, Operation Research, and 3d-Drawing. He is also a member of Institution of Engineers (Bangladesh) and IEOM. Email: [email protected]

Proceedings of the International Conference on Industrial Engineering and Operations Management
Paris, France, July 26-27, 2018
© IEOM Society International
Sharif-Al-Mahmud obtained his B.Sc. in Industrial and Production Engineering form Khulna University of Engineering & Technology, Khulna. He is a member of IEOM and IMechE KUET chapter. His areas of research are Computer Integrated manufacturing and Industrial Automation. Email: [email protected]
Imran Kabir recently completed his B.Sc. in Industrial & Production Engineering from Khulna University of Engineering & Technology (KUET). Currently, he is working as vice precedent of Satkhira Association, KUET, Khulna. His areas of research are Line Balancing, Robotics & Automation system, Statistical quality control and Ergonomics. Email: [email protected]


![[XLS]A Revenue... · Web view40435 MD-HEVS Health Res & Outcomes Eval 110131 MD-HEVS Connors ARDS 110661 MD-HEVS Stukenborg AHRQ R01 Stukenborg, George J 110696 MD-HEVS Kilbridge](https://static.fdocuments.in/doc/165x107/5b2586e97f8b9a353f8b4fa8/xls-ampa-revenue-web-view40435-md-hevs-health-res-outcomes-eval-110131.jpg)