“outlook”,“guidance”,“target”, “forecast”,“assumption” · Adjusted EBITDA is...
47
Transcript of “outlook”,“guidance”,“target”, “forecast”,“assumption” · Adjusted EBITDA is...

Forward-looking statements are included in this presentation. These forward-looking statements are typically identified by the use of terms such as “outlook”, “guidance”, “target”,
“forecast”, “assumption” and other similar expressions or future or conditional terms such as "anticipate", "believe", "could", "estimate", "expect", "intend", "may", "plan", "predict",
"project", "will", "would", and “should”. Such statements may involve but are not limited to comments with respect to strategies, expectations, planned operations or future actions.
Forward-looking statements, by their nature, are based on assumptions and are subject to important risks and uncertainties. Any forecasts, predictions or forward-looking statements
cannot be relied upon due to, among other things, changing external events and general uncertainties of the business and its corporate structure. Results indicated in forward-looking
statements may differ materially from actual results for a number of reasons, including without limitation, dependency on significant Accumulation Partners and clients, reliance on
Redemption Partners, greater than expected redemptions for rewards, unfunded future redemption costs, supply and capacity costs, regulatory matters, failure to safeguard databases,
cyber security and consumer privacy, retail market/economic conditions, industry competition, Air Canada liquidity issues or air travel industry disruption, airline industry changes and
increased airline costs, changes to coalition loyalty programs, seasonal nature of the business, other factors and prior performance, reliance on key personnel, legal proceedings, foreign
operations, labour relations, pension liability, technological disruptions, inability to use third-party software and outsourcing, failure to protect intellectual property rights, conflicts of
interest, leverage and restrictive covenants in current and future indebtedness, uncertainty of dividend declarations and/or payments on either common shares or preferred shares,
interest rate and currency fluctuations, credit ratings, audit by tax authorities, as well as the other factors identified throughout this MD&A and throughout Aimia's public disclosure
records on file with the Canadian securities regulatory authorities. The forward-looking statements contained herein represent Aimia's expectations as of April 26, 2018, and are subject
to change after such date. However, Aimia disclaims any intention or obligation to update or revise any forward-looking statements whether as a result of new information, future events
or otherwise, except as required under applicable securities regulations.
In particular, slide 32 of this presentation contain certain forward-looking statements with respect to certain financial metrics in 2018. Aimia made a number of general economic and
market assumptions in making these statements, including assumptions regarding currencies, the performance of the economies in which the Corporation operates and market
competition and tax laws applicable to the Corporation’s operations. The Corporation cautions that the assumptions used to make these statements with respect to 2018, although
reasonable at the time they were made, may prove to be incorrect or inaccurate. In addition, these statements do not reflect the potential impact of any non-recurring or other special
items or of any new material commercial agreements, dispositions, mergers, acquisitions, other business combinations or transactions that may be announced or that may occur after
April 26, 2018. The financial impact of these transactions and non-recurring and other special items can be complex and depends on the facts particular to each of them. We therefore
cannot describe the expected impact in a meaningful way or in the same way we present known risks affecting our business. Accordingly, our actual results could differ materially from
the statements made on slide 32 of this presentation.
The forward-looking statements contained herein represent the Corporation’s expectations as of April 26, 2018 and are subject to change. However, Aimia disclaims any intention or
obligation to update or revise any forward-looking statements whether as a result of new information, future events or otherwise, except as required under applicable securities
regulations.
This presentation contains both IFRS and non-GAAP financial measures. Non-GAAP financial measures are defined and reconciled to the most comparable IFRS measures,
if applicable, in our MD&A and at slides 3, 4, and 6. See caution regarding Non-GAAP financial measures on slide 3.
FORWARD-LOOKING AND CAUTIONARY STATEMENTS
2
Aimia uses the following non-GAAP financial measures which it believes provides investors and analysts with additional information to better understand results as well as assess its potential. GAAP means generally accepted accounting principles
in Canada and represents International Financial Reporting Standards (“IFRS”). For a reconciliation of non-GAAP financial measures to the most comparable GAAP measure, please refer to the section entitled “Performance Indicators (including
certain non-GAAP financial measures)” in our Management Discussion & Analysis on pages 7 to 11 for the three months ended March 31, 2018 which can be accessed here: https://www.aimia.com/en/investors/quarterly-reports.html. For ease of
reference, we have also included a reconciliation table to the most directly comparable GAAP measure, if any, on slides 5 and 7.
Adjusted EBITDA
Adjusted EBITDA is not a measurement based on GAAP, is not considered an alternative to operating income or net earnings in measuring performance, and is not comparable to similar measures used by other issuers. We do not believe that
Adjusted EBITDA has an appropriate directly comparable GAAP measure. As an alternative, we do however provide a reconciliation to operating income in our MD&A and on slide 5 in this presentation. Adjusted EBITDA is used by
management to evaluate performance, and to measure compliance with debt covenants. Management believes Adjusted EBITDA assists investors in comparing the Corporation’s performance on a consistent basis without regard to depreciation
and amortization and impairment charges, which are non-cash in nature and can vary significantly depending on accounting methods and non-operating factors such as historical cost. Adjusted EBITDA is operating income adjusted to exclude
depreciation, amortization and impairment charges, as well as adjusted for certain factors particular to the business, such as changes in deferred revenue and Future Redemption Costs. Adjusted EBITDA also includes distributions and dividends
received or receivable from equity-accounted investments. Adjusted EBITDA should not be used as an exclusive measure of cash flow because it does not account for the impact of working capital growth, capital expenditures, debt repayments and
other sources and uses of cash, which are disclosed in the statements of cash flows.
Free Cash Flow
Free Cash Flow is not a measurement based on GAAP and is unlikely to be comparable to similar measures used by other issuers. Management believes Free cash flow (“Free Cash Flow”) provides a consistent and comparable measurement of
cash generated from operations and is used as an indicator of financial strength and performance. Free Cash Flow is defined as cash flows from operating activities, as reported in accordance with GAAP, less: (a) total capital expenditures as
reported in accordance with GAAP; and (b) dividends paid. For a reconciliation of Free Cash Flow before Dividends Paid to cash flows from operations (GAAP), please see slide 5 in this presentation.
Free Cash Flow before Dividends Paid and Free Cash Flow before Dividends Paid per Common Share
Free Cash Flow before Dividends Paid are non-GAAP measures and are not comparable to similar measures used by other issuers. They are used in order to provide a consistent and comparable measurement of cash generated from operations
and used as indicators of financial strength and performance. Free Cash Flow before Dividends Paid is defined as cash flows from operating activities as reported in accordance with GAAP, less capital expenditures as reported in accordance with
GAAP. Free Cash Flow before Dividends Paid per Common Share is a measurement of cash flow generated from operations on a per share basis. It is calculated as follows: Free Cash Flow before dividends paid minus dividends paid on preferred
shares and non-controlling interests over the weighted average number of common shares outstanding. For a reconciliation of Free Cash Flow before Dividends Paid and Free Cash Flow before Dividends Paid per Common Share to the
most directly comparable GAAP measure, if any, please see slide 5 in this presentation.
ROIC
Return on invested capital (“ROIC”) is not a measurement based on GAAP and is not comparable to similar measures used by other issuers. ROIC is used by management to assess the efficiency with which it allocates its capital to generate
returns. ROIC is calculated as adjusted operating income after taxes expressed as a percentage of the average invested capital. Adjusted operating income after taxes is Adjusted EBITDA less depreciation and amortization, tax effected at the
Canadian statutory rate, on a rolling twelve-month basis. A description of Adjusted EBITDA as well as its reconciliation to operating income is presented in the preceding section. Invested capital is the sum of total equity, deferred revenue margin
(calculated as deferred revenue less future redemption cost liability, tax effected at the Canadian statutory rate), accumulated amortization of Accumulation Partners' contracts and customer relationships, and net debt (calculated as long-term debt,
including the current portion, less cash and cash equivalents, net of any contractually required redemption reserve amount included in cash and cash equivalents), averaged between the beginning and ending balance over a rolling twelve-month
period. For a reconciliation of ROIC to the most directly comparable GAAP measure, if any, please see slide 7 in this presentation.
Constant Currency
Because exchange rates are an important factor in understanding period to period comparisons, management believes that the presentation of various financial metrics on a constant currency basis or after giving effect to foreign exchange
translation, in addition to the reported metrics, helps improve the ability to understand operating results and evaluate performance in comparison to prior periods. Constant currency information compares results between periods as if exchange rates
had remained constant over the periods. Constant currency is derived by calculating current-year results using prior-year foreign currency exchange rates. Results calculated on a constant currency basis should be considered in addition to, not as a
substitute for, results reported in accordance with GAAP and may not be comparable to similarly titled measures used by other companies.
NON-GAAP FINANCIAL MEASURES
3
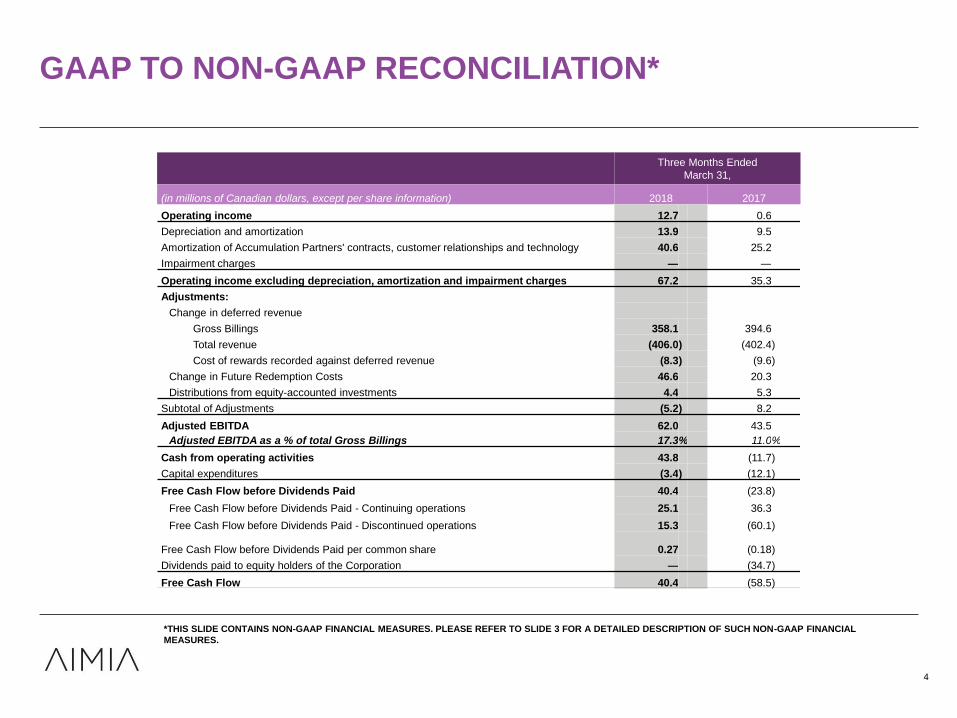
GAAP TO NON-GAAP RECONCILIATION*
4
*THIS SLIDE CONTAINS NON-GAAP FINANCIAL MEASURES. PLEASE REFER TO SLIDE 3 FOR A DETAILED DESCRIPTION OF SUCH NON-GAAP FINANCIAL
MEASURES.
Three Months Ended
March 31,
(in millions of Canadian dollars, except per share information) 2018 2017
Operating income 12.7 0.6
Depreciation and amortization 13.9 9.5
Amortization of Accumulation Partners' contracts, customer relationships and technology 40.6 25.2
Impairment charges — —
Operating income excluding depreciation, amortization and impairment charges 67.2 35.3
Adjustments:
Change in deferred revenue
Gross Billings 358.1 394.6
Total revenue (406.0) (402.4)
Cost of rewards recorded against deferred revenue (8.3) (9.6)
Change in Future Redemption Costs 46.6 20.3
Distributions from equity-accounted investments 4.4 5.3
Subtotal of Adjustments (5.2) 8.2
Adjusted EBITDA 62.0 43.5
Adjusted EBITDA as a % of total Gross Billings 17.3% 11.0%
Cash from operating activities 43.8 (11.7)
Capital expenditures (3.4) (12.1)
Free Cash Flow before Dividends Paid 40.4 (23.8)
Free Cash Flow before Dividends Paid - Continuing operations 25.1 36.3
Free Cash Flow before Dividends Paid - Discontinued operations 15.3 (60.1)
Free Cash Flow before Dividends Paid per common share 0.27 (0.18)
Dividends paid to equity holders of the Corporation — (34.7)
Free Cash Flow 40.4 (58.5)

Q1 2018 INCOME STATEMENT
5
Three Months Ended
March 31,
(in millions of Canadian dollars, except per share
amounts)2018 2017
Revenue $ 406.0 $ 402.4
Cost of sales
Cost of rewards and direct costs 246.7 229.6
Depreciation and amortization 13.9 9.5
Amortization of accumulation partners' contracts,
customer relationships and technology 40.6 25.2
301.2 264.3
Gross margin 104.8 138.1
Operating expenses 92.1 137.5
Operating income 12.7 0.6
Loss on disposal of businesses and other assets (5.3) —
Financial income 2.2 2.9
Financial expenses (4.7) (7.5)
Fair value gain on investments in equity instruments 6.3 —
Net financial income (expenses) 3.8 (4.6)
Share of net earnings of equity-accounted
investments 9.6 11.7
Earnings before income taxes 20.8 7.7
Income tax expense (7.0) (4.8)
Net Earnings from continuing operations $ 13.8 $ 2.9
Net earnings from discontinued operations 7.6 6.7
Net Earnings 21.4 9.6

ROIC RECONCILIATION*
6
*THIS SLIDE CONTAINS NON-GAAP FINANCIAL MEASURES. PLEASE REFER TO SLIDE 3 FOR A DETAILED DESCRIPTION OF SUCH NON-GAAP FINANCIAL
MEASURES.
Twelve Months Ended
March 31,
(in millions of Canadian dollars unless otherwise noted) 2018 2017
Calculation of adjusted operating income after taxes
Operating loss (47.0) (125.2)
Depreciation, amortization & impairment charges 199.1 229.3
Operating income excluding depreciation, amortization and impairment charges 152.1 104.1
Adjustments:
Change in deferred revenue
Gross Billings 1,520.2 1,794.6
Total revenue (1,474.9) (1,702.8)
Cost of rewards recorded against deferred revenue
(33.4) (9.6)
Change in Future Redemption Costs 24.2 (30.9)
Distributions from equity-accounted investments 19.7 19.6
Subtotal of Adjustments 55.8 70.9
Adjusted EBITDA 207.9 175.0
Depreciation and amortization (41.5) (47.0)
Tax (44.2) (34.0)
Adjusted operating income after taxes 122.2 94.0
Calculation of invested capital
Net equity:
Total equity (206.0) 114.7
Net liabilities (assets) of discontinued operations — (81.6)
Deferred revenue margin from continuing operations:
Deferred revenue 2,951.4 2,946.1
Future Redemption Cost liability - Unbroken Loyalty Units (1,956.9) (2,007.3)
Tax (263.9) (249.5)
Accumulated amortization of accumulation partners' contracts and customer
relationships related to continuing operations 996.1 841.9
Net debt:
Long-term debt (including current portion) 349.4 448.6
Cash and cash equivalents (271.9) (230.0)
Total Invested capital 1,598.2 1,782.9
Average Invested capital 1,690.6 1,855.7
ROIC 7.2% 5.1%

Three Months Ended March 31,
Coaltions ILS Consolidated
2018 2017 2018 2017 2018 2017
2017
(excl. Other
Businesses)(1)
YoY %
YoY %
(excl. Other
Businesses)(1)
Gross Billings 316.8 315.8 41.6 47.7 358.1 394.6 363.2 -9.2% -1.4%
Total revenue 370.9 331.4 35.4 41.9 406.0 402.4 373.0 0.9% 8.8%
Cost of rewards and direct costs 243.0 223.1 4.0 6.7 246.7 229.6 229.6 7.4% 7.4%
Total operating expenses 54.1 67.8 38.0 41.6 92.1 137.5 109.3 -33.0% -15.7%
Total operating expenses before restructuring 53.3 67.7 37.8 41.2 91.1 136.8 108.8 -33.4% -16.3%
Adjusted EBITDA 69.6 47.8 -7.6 -7.5 62.0 43.5 40.3 42.5% 53.8%
Adjusted EBITDA margin % 22.0% 15.1% -18.3% -15.7% 17.3% 11.0% 11.1% 630 bps 620 bps
Adjusted EBITDA before restructuring 70.4 47.9 -7.4 -7.1 63.0 44.2 40.8 42.5% 54.4%
Adjusted EBITDA margin % (before restructuring) 22.2% 15.2% -17.8% -14.9% 17.6% 11.2% 11.2% 640 bps 640 bps
Included in Adjusted EBITDA:
Change in Future Redemption Costs 45.5 18.4 1.1 1.9 46.6 20.3 20.3 ** **
Cost of rewards recorded against deferred revenue - - -8.3 -9.6 -8.3 -9.6 -9.6 -13.5% -13.5%
Distributions from equity-accounted investments 4.4 4.5 - 0.8 4.4 5.3 5.3 -17.0% -17.0%
Free Cash Flow before Dividends Paid 25.1 36.3 23.3 -30.9% 7.7%
Free Cash Flow before Dividends Paid
(before restructuring and taxes) 29.3 42.9 28.0 -31.7% 4.6%
Restructuring expenses - divisional structure 0.8 0.1 0.2 0.4 1.0 0.7 0.5 ** **
Restructuring payments - divisional structure 4.2 3.2 1.9 ** **
Taxes paid 0.0 3.4 2.8 ** **
Q1 2018 VS 2017 FINANCIAL SUMMARY (POST IFRS 15)
7
** means not meaningful
(1) Consolidated results less Other Businesses. Other Businesses include the results of the U.S. Channel and Employee Loyalty (“CEL”) business, the New Zealand business and
the royalty revenue related to the Canadian Air Miles trademarks, until their respective disposals.
*THIS SLIDE CONTAINS NON-GAAP FINANCIAL MEASURES. PLEASE REFER TO SLIDE 3 FOR A DETAILED DESCRIPTION OF SUCH NON-GAAP FINANCIAL
MEASURES.

Q1 2018 HIGHLIGHTS
April 26, 2018

TODAY’S SPEAKERS
9
• David Johnston, Group Chief Executive
• Mark Grafton, Chief Financial Officer

AGENDA
10
• Introductions
• Q1 highlights
• Financial highlights
• Key takeaways

Q1 HIGHLIGHTS
DAVID JOHNSTON

• Progressing key strategic and commercial
partnerships for Aeroplan
• Ongoing business simplification and acceleration
of cost savings
• Preserving a strong cash and liquidity position
KEY AREAS OF FOCUS
12
Continuing to
execute against
strategic
priorities
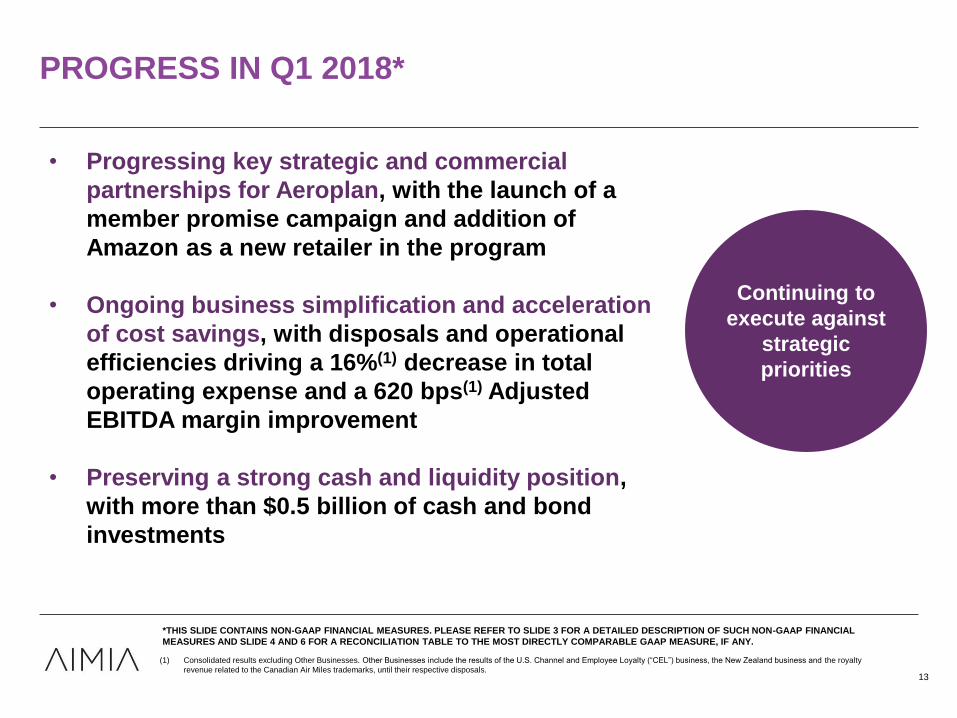
• Progressing key strategic and commercial
partnerships for Aeroplan, with the launch of a
member promise campaign and addition of
Amazon as a new retailer in the program
• Ongoing business simplification and acceleration
of cost savings, with disposals and operational
efficiencies driving a 16%(1) decrease in total
operating expense and a 620 bps(1) Adjusted
EBITDA margin improvement
• Preserving a strong cash and liquidity position,
with more than $0.5 billion of cash and bond
investments
PROGRESS IN Q1 2018*
13
Continuing to
execute against
strategic
priorities
*THIS SLIDE CONTAINS NON-GAAP FINANCIAL MEASURES. PLEASE REFER TO SLIDE 3 FOR A DETAILED DESCRIPTION OF SUCH NON-GAAP FINANCIAL
MEASURES AND SLIDE 4 AND 6 FOR A RECONCILIATION TABLE TO THE MOST DIRECTLY COMPARABLE GAAP MEASURE, IF ANY.
(1) Consolidated results excluding Other Businesses. Other Businesses include the results of the U.S. Channel and Employee Loyalty (“CEL”) business, the New Zealand business and the royalty
revenue related to the Canadian Air Miles trademarks, until their respective disposals.
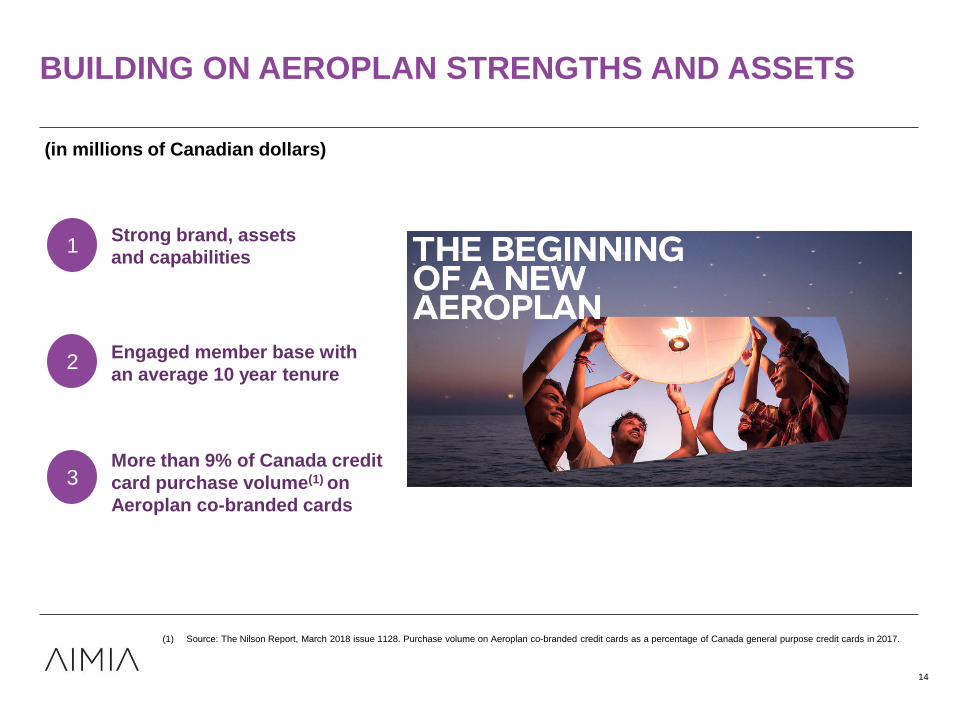
BUILDING ON AEROPLAN STRENGTHS AND ASSETS
14
(in millions of Canadian dollars)
1Strong brand, assets
and capabilities
2Engaged member base with
an average 10 year tenure
3More than 9% of Canada credit
card purchase volume(1) on
Aeroplan co-branded cards
(1) Source: The Nilson Report, March 2018 issue 1128. Purchase volume on Aeroplan co-branded credit cards as a percentage of Canada general purpose credit cards in 2017.

MEMBER PROMISE CAMPAIGN LAUNCHED
4
THE POWER TO REACH YOUR
TRAVEL PLANS FASTER
A COMPLETE TRAVEL OFFERING
IN ONE PLACE
UNMATCHED FLEXIBILITY
AND CONVENIENCE
A MORE PERSONALIZED
JOURNEY
AN ALTOGETHER TRANSFORMED
USER EXPERIENCE
1
5
2
6
3
THE FREEDOM TO CHOOSE ANY SEAT
ON MORE OF YOUR FAVOURITE AIRLINES
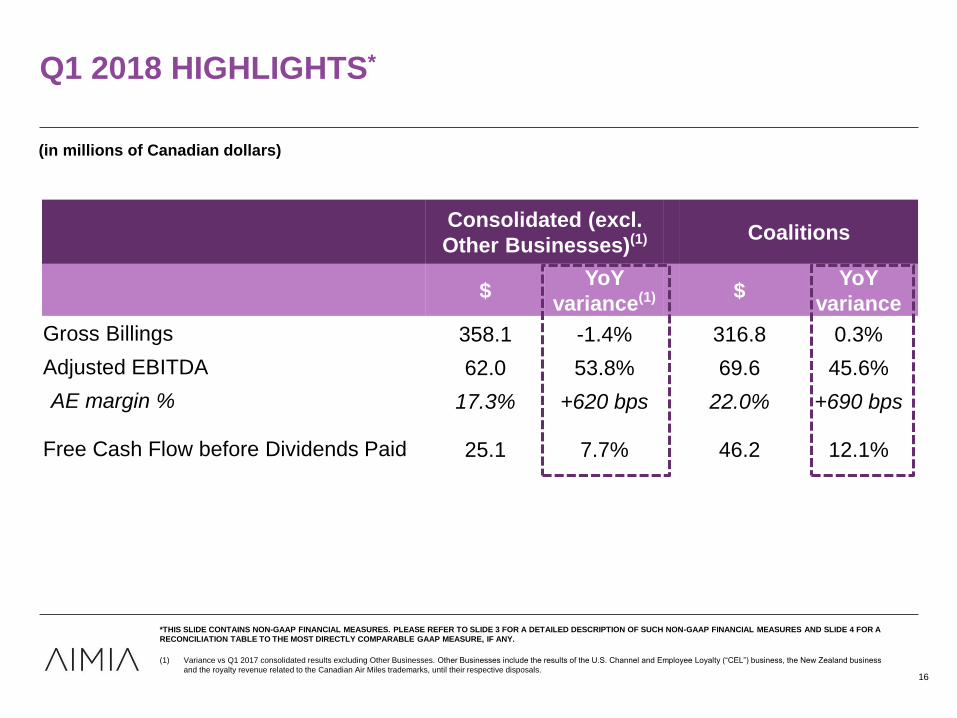
Q1 2018 HIGHLIGHTS*
16
(in millions of Canadian dollars)
*THIS SLIDE CONTAINS NON-GAAP FINANCIAL MEASURES. PLEASE REFER TO SLIDE 3 FOR A DETAILED DESCRIPTION OF SUCH NON-GAAP FINANCIAL MEASURES AND SLIDE 4 FOR A
RECONCILIATION TABLE TO THE MOST DIRECTLY COMPARABLE GAAP MEASURE, IF ANY.
(1) Variance vs Q1 2017 consolidated results excluding Other Businesses. Other Businesses include the results of the U.S. Channel and Employee Loyalty (“CEL”) business, the New Zealand business
and the royalty revenue related to the Canadian Air Miles trademarks, until their respective disposals.
Consolidated (excl.
Other Businesses)(1) Coalitions
$YoY
variance(1) $YoY
variance
Gross Billings 358.1 -1.4% 316.8 0.3%
Adjusted EBITDA 62.0 53.8% 69.6 45.6%
AE margin % 17.3% +620 bps 22.0% +690 bps
Free Cash Flow before Dividends Paid 25.1 7.7% 46.2 12.1%

CONTINUED MARGIN IMPROVEMENT*
11.1%(1)
17.3%
Q1 2017 Q1 2018
Consolidated AE margin
*THIS SLIDE CONTAINS NON-GAAP FINANCIAL MEASURES. PLEASE REFER TO SLIDE 3 FOR A DETAILED DESCRIPTION OF SUCH NON-GAAP FINANCIAL
MEASURES AND SLIDE 4 AND 6 FOR A RECONCILIATION TABLE TO THE MOST DIRECTLY COMPARABLE GAAP MEASURE, IF ANY.
Significant
increase in AE
margin mainly
driven by lower
costs in the
Coalitions
business
(1) Consolidated results excluding Other Businesses. Other Businesses include the results of the U.S. Channel and Employee Loyalty (“CEL”) business, the New Zealand business and the royalty
revenue related to the Canadian Air Miles trademarks, until their respective disposals.17

FINANCIAL HIGHLIGHTS
MARK GRAFTON
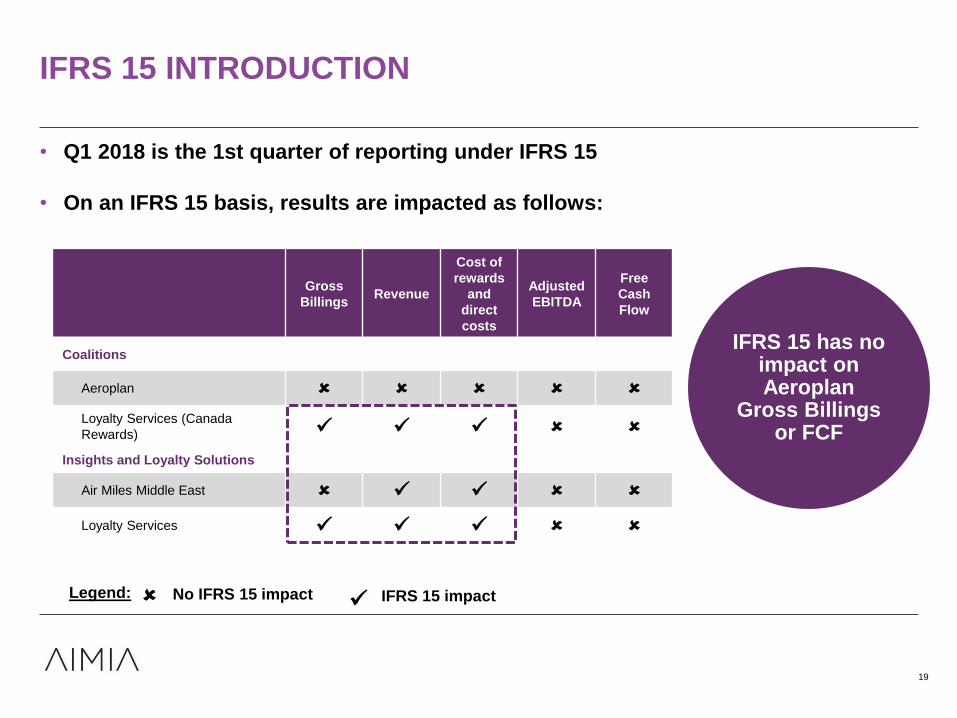
IFRS 15 INTRODUCTION
19
• Q1 2018 is the 1st quarter of reporting under IFRS 15
• On an IFRS 15 basis, results are impacted as follows:
IFRS 15 has no impact on Aeroplan
Gross Billings or FCF
Gross
BillingsRevenue
Cost of
rewards
and
direct
costs
Adjusted
EBITDA
Free
Cash
Flow
Coalitions
Aeroplan
Loyalty Services (Canada
Rewards) ✓ ✓ ✓
Insights and Loyalty Solutions
Air Miles Middle East ✓ ✓
Loyalty Services ✓ ✓ ✓
✓No IFRS 15 impact Legend: IFRS 15 impact
Q1 2018
Coalitions ILSConsolidated excl. Other
Businesses(1)
Pre
IFRS 15
Post
IFRS 15 Impact
Pre
IFRS 15
Post
IFRS 15 Impact
Pre
IFRS 15
Post
IFRS 15 Impact
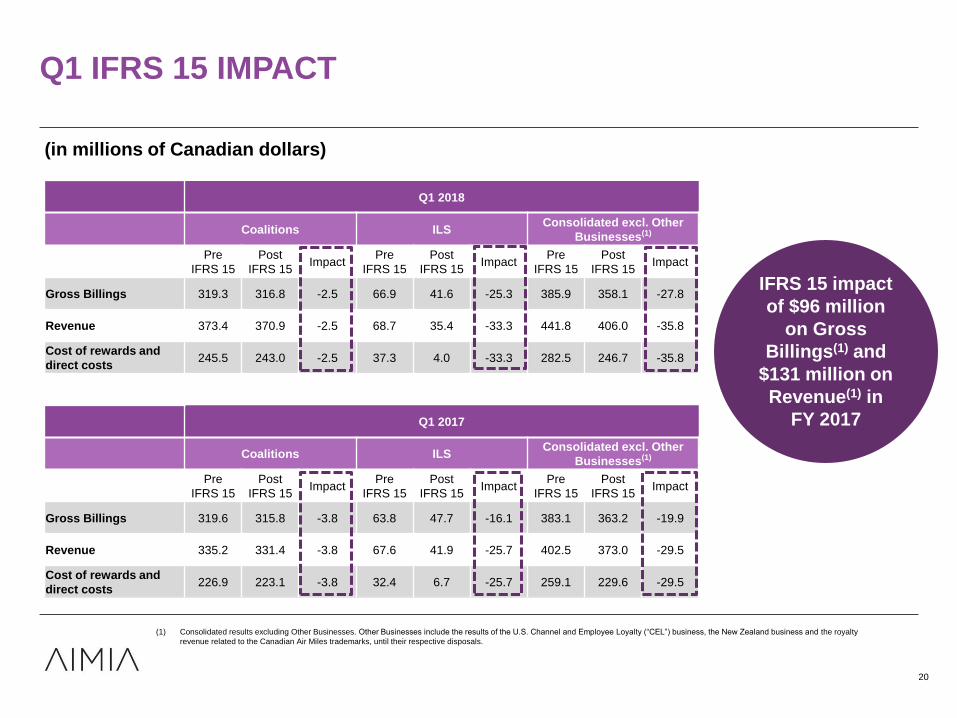
Gross Billings 319.3 316.8 -2.5 66.9 41.6 -25.3 385.9 358.1 -27.8
Revenue 373.4 370.9 -2.5 68.7 35.4 -33.3 441.8 406.0 -35.8
Cost of rewards and
direct costs245.5 243.0 -2.5 37.3 4.0 -33.3 282.5 246.7 -35.8
Q1 2017
Coalitions ILSConsolidated excl. Other
Businesses(1)
Pre
IFRS 15
Post
IFRS 15 Impact
Pre
IFRS 15
Post
IFRS 15 Impact
Pre
IFRS 15
Post
IFRS 15 Impact
Gross Billings 319.6 315.8 -3.8 63.8 47.7 -16.1 383.1 363.2 -19.9
Revenue 335.2 331.4 -3.8 67.6 41.9 -25.7 402.5 373.0 -29.5
Cost of rewards and
direct costs226.9 223.1 -3.8 32.4 6.7 -25.7 259.1 229.6 -29.5
Q1 IFRS 15 IMPACT
IFRS 15 impact
of $96 million
on Gross
Billings(1) and
$131 million on
Revenue(1) in
FY 2017
20
(in millions of Canadian dollars)
(1) Consolidated results excluding Other Businesses. Other Businesses include the results of the U.S. Channel and Employee Loyalty (“CEL”) business, the New Zealand business and the royalty
revenue related to the Canadian Air Miles trademarks, until their respective disposals.
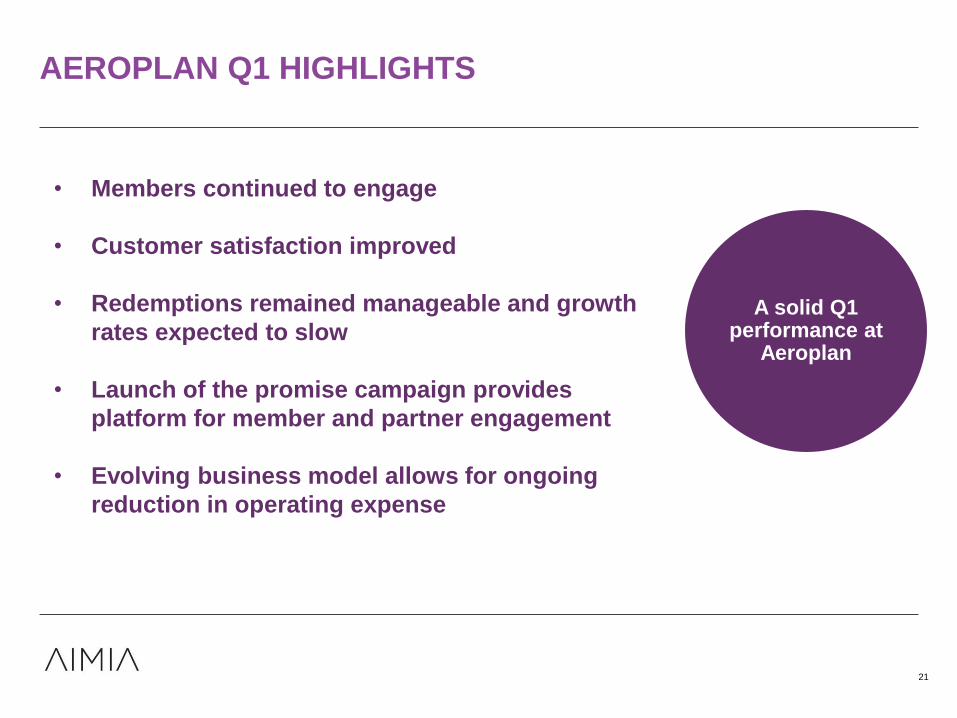
• Members continued to engage
• Customer satisfaction improved
• Redemptions remained manageable and growth
rates expected to slow
• Launch of the promise campaign provides
platform for member and partner engagement
• Evolving business model allows for ongoing
reduction in operating expense
AEROPLAN Q1 HIGHLIGHTS
21
A solid Q1 performance at
Aeroplan

COALITIONS GROSS BILLINGS* BROADLY STABLE
22
*THIS SLIDE CONTAINS NON-GAAP FINANCIAL MEASURES. PLEASE REFER TO SLIDE 3 FOR A DETAILED DESCRIPTION OF SUCH NON-GAAP FINANCIAL
MEASURES AND SLIDE 4 AND 6 FOR A RECONCILIATION TABLE TO THE MOST DIRECTLY COMPARABLE GAAP MEASURE, IF ANY.
(in millions of Canadian dollars)
Q1 2017 Q1 2018
Aeroplan - Financial partners Aeroplan - Other partners
Loyalty Services and Other
Air Canada + retail YoY
decline of (2)%
Financial card
YoY growth of +1%
Stable YoY
Growth in financial cards
reflecting successful conversion campaign
315.8 316.8
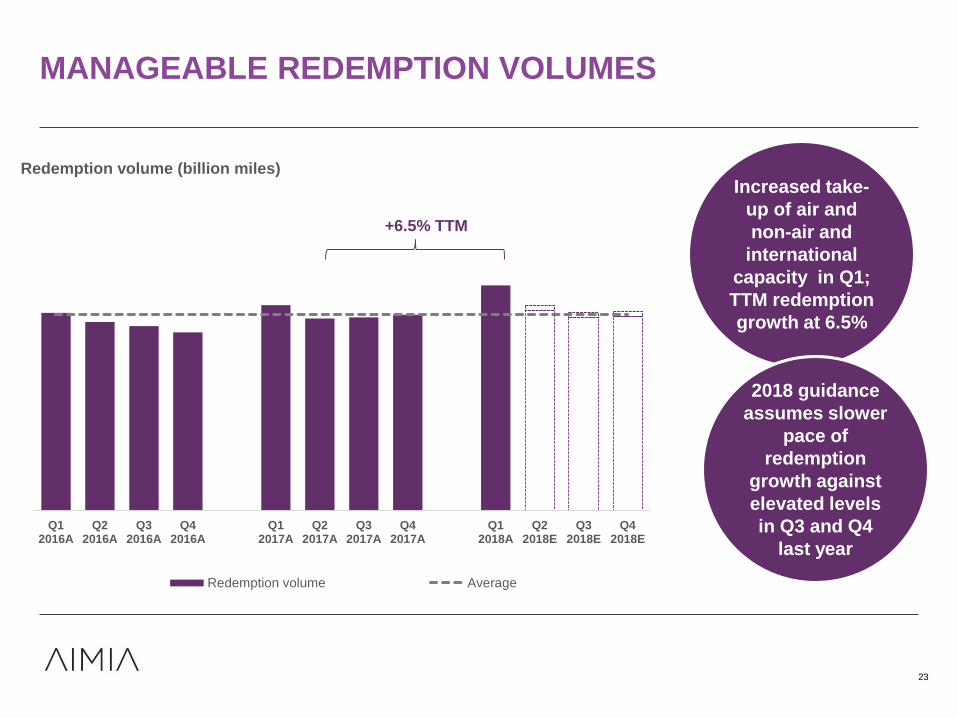
MANAGEABLE REDEMPTION VOLUMES
Favourable cost per mile trend
23
0.0
5.0
10.0
15.0
20.0
25.0
30.0
Q12016A
Q22016A
Q32016A
Q42016A
Q12017A
Q22017A
Q32017A
Q42017A
Q12018A
Q22018E
Q32018E
Q42018E
Redemption volume (billion miles)
Redemption volume Average
Increased take-
up of air and
non-air and
international
capacity in Q1;
TTM redemption
growth at 6.5%
2018 guidance
assumes slower
pace of
redemption
growth against
elevated levels
in Q3 and Q4
last year
+6.5% TTM
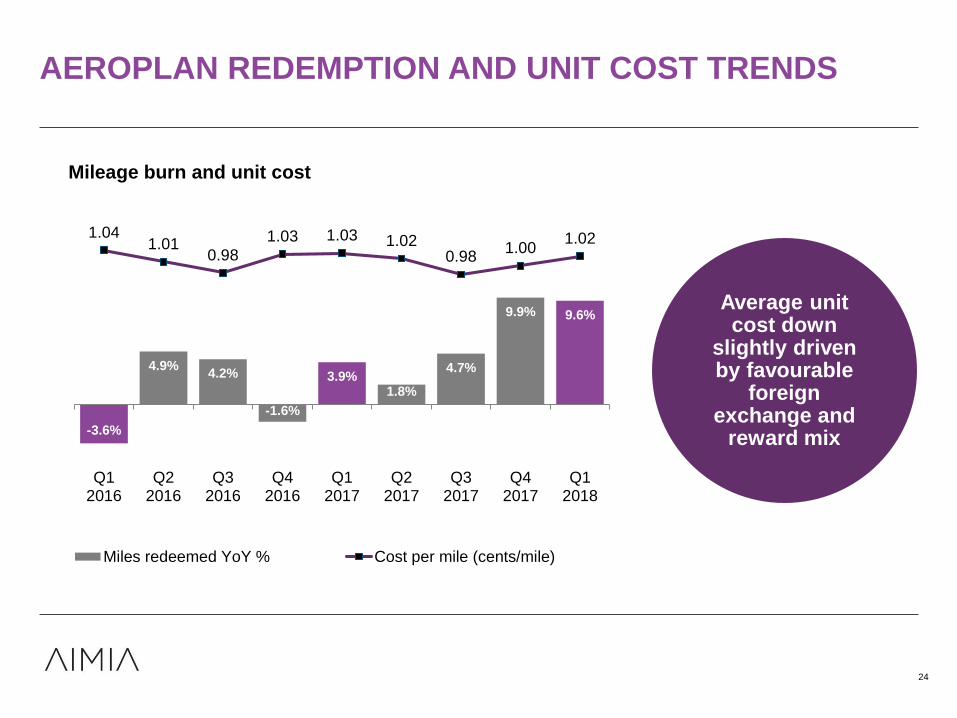
-3.6%
4.9%4.2%
-1.6%
3.9%1.8%
4.7%
9.9% 9.6%
1.041.01
0.98
1.03 1.03 1.020.98
1.001.02
-5.0%
-3.0%
-1.0%
1.0%
3.0%
5.0%
7.0%
9.0%
11.0%
13.0%
15.0%
Q12016
Q22016
Q32016
Q42016
Q12017
Q22017
Q32017
Q42017
Q12018
Mileage burn and unit cost
Miles redeemed YoY % Cost per mile (cents/mile)
AEROPLAN REDEMPTION AND UNIT COST TRENDS
Favourable cost per mile trend
Average unit cost down
slightly driven by favourable
foreign exchange and
reward mix
24

Q1 2018 GB TO FCF BRIDGE*
25
*THIS SLIDE CONTAINS NON-GAAP FINANCIAL MEASURES. PLEASE REFER TO SLIDE 3 FOR A DETAILED DESCRIPTION OF SUCH NON-GAAP FINANCIAL
MEASURES AND SLIDE 4 AND 6 FOR A RECONCILIATION TABLE TO THE MOST DIRECTLY COMPARABLE GAAP MEASURE, IF ANY.
Q1 2017: $363.2 ($229.6) ($105.1) $5.3 ($3.4) ($4.1) ($10.5) $7.6 $23.4
25.1
(246.7)
(94.1)
(3.4)4.4 0.0 0.56.3
358.1
Gross Billings Cost of rewardsand direct costs
Operatingexpenses*
Distribution fromequity-accounted
investment
Cash taxespaid, net
Cash interestpaid, net
Capex (continuingoperations)
Workingcapital
and other
Free CashFlow (continuing
operations)
Higher Aeroplan
redemption
volumes
Execution on
operational
efficiencies
$3M one-off
sale received in
the Coalitions
division
(in millions of Canadian dollars)
Variance: ($5.1) $17.1 ($11.0) ($0.9) ($3.4) ($4.6) ($7.1) ($1.3) $1.7
Positive FCF
generation in the
quarter
Impact of rent
prepayment
related the
Nectar
transaction
(1)
(1) Consolidated results excluding Other Businesses. Other Businesses include the results of the U.S. Channel and Employee Loyalty (“CEL”) business, the New Zealand business and the royalty
revenue related to the Canadian Air Miles trademarks, until their respective disposals.
(1)
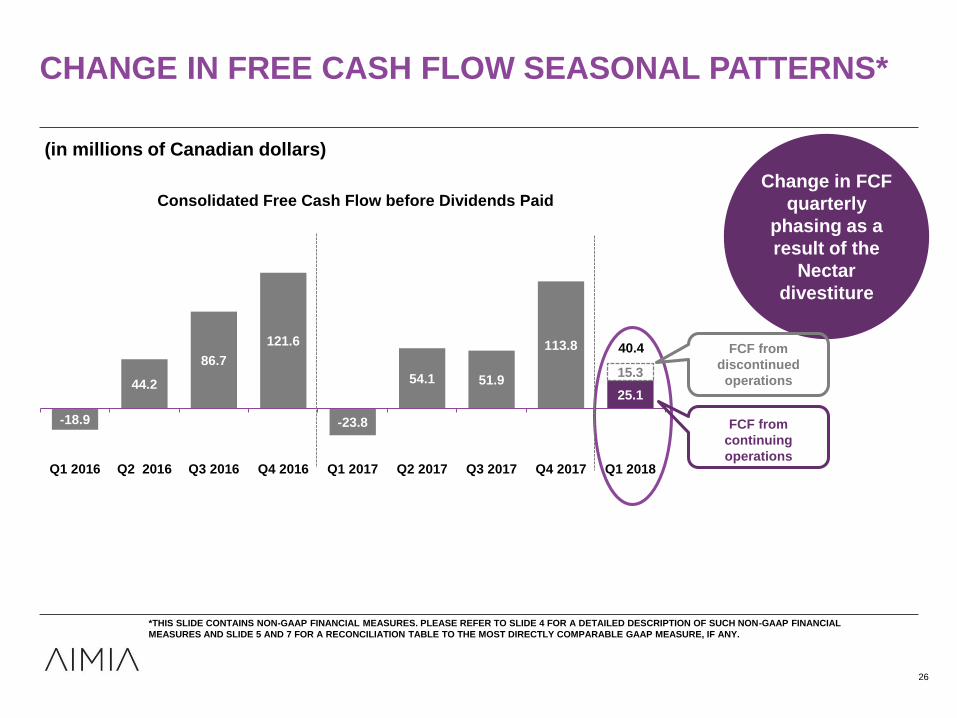
-18.9
44.2
86.7
121.6
-23.8
54.1 51.9
113.8
25.1
15.3
Q1 2016 Q2 2016 Q3 2016 Q4 2016 Q1 2017 Q2 2017 Q3 2017 Q4 2017 Q1 2018
Consolidated Free Cash Flow before Dividends Paid
CHANGE IN FREE CASH FLOW SEASONAL PATTERNS*
*THIS SLIDE CONTAINS NON-GAAP FINANCIAL MEASURES. PLEASE REFER TO SLIDE 4 FOR A DETAILED DESCRIPTION OF SUCH NON-GAAP FINANCIAL
MEASURES AND SLIDE 5 AND 7 FOR A RECONCILIATION TABLE TO THE MOST DIRECTLY COMPARABLE GAAP MEASURE, IF ANY.
Change in FCF
quarterly
phasing as a
result of the
Nectar
divestiture
26
(in millions of Canadian dollars)
FCF from
discontinued
operations
FCF from
continuing
operations
40.4

Q1 2018 OPERATING EXPENSES*
*THIS SLIDE CONTAINS NON-GAAP FINANCIAL MEASURES. PLEASE REFER TO SLIDE 3 FOR A DETAILED DESCRIPTION OF SUCH NON-GAAP FINANCIAL MEASURES AND SLIDE 4 FOR A
RECONCILIATION TABLE TO THE MOST DIRECTLY COMPARABLE GAAP MEASURE, IF ANY.
(1) Total operating expenses excluding Other Businesses. Other Businesses include the results of the U.S. Channel and Employee Loyalty (“CEL”) business, the New Zealand business and the royalty
revenue related to the Canadian Air Miles trademarks, until their respective disposals.
67.854.1
41.6
38.0
Q1 2017 Q1 2018
Operating expenses(1)
Coalitions ILS
109.3
92.1ILS OPEX down
9% YoY due to
operational
efficiencies
Coalitions OPEX down 20% YoY
including operational
efficiencies but benefited from
lower compensation and timing
of marketing spend
OPEX down 16% YoY(1)
(in millions of Canadian dollars)
On track to deliver $70M cost savings
target
27

CAPEX TRENDS
FY 2016A FY 2017A FY 2018E
Coalitionsothercapex
Coalitionsexpansioncapex
ILStotalcapex
Reorienting capex to new
products
59.9
(in millions of Canadian dollars)
37.8
30 - 35
28
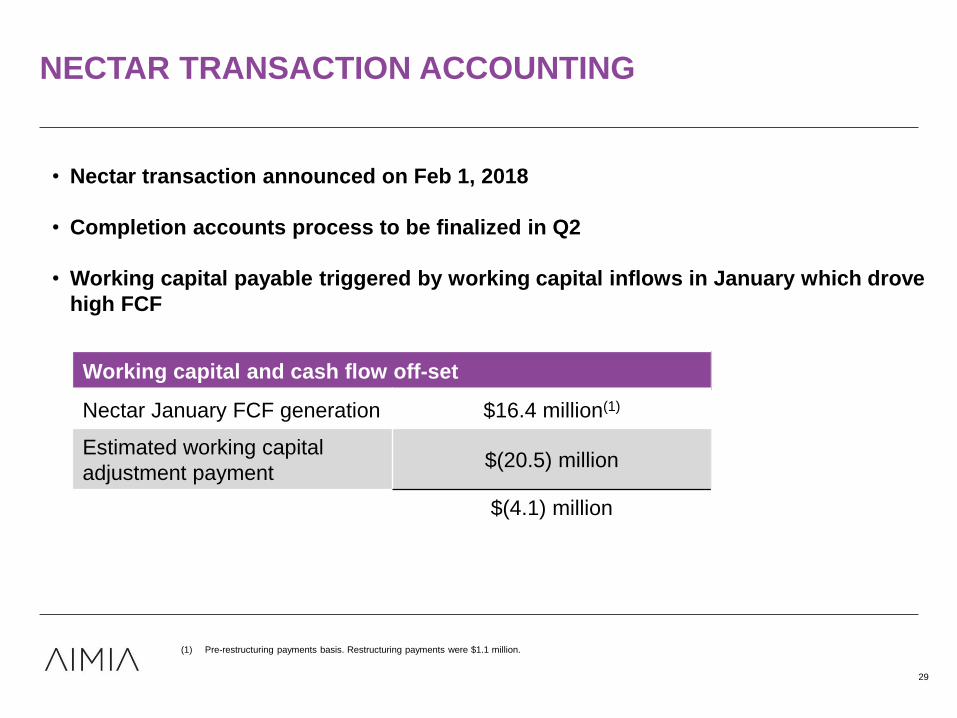
NECTAR TRANSACTION ACCOUNTING
• Nectar transaction announced on Feb 1, 2018
• Completion accounts process to be finalized in Q2
• Working capital payable triggered by working capital inflows in January which drove
high FCF
Working capital and cash flow off-set
Nectar January FCF generation $16.4 million(1)
Estimated working capital
adjustment payment$(20.5) million
$(4.1) million
29
(1) Pre-restructuring payments basis. Restructuring payments were $1.1 million.
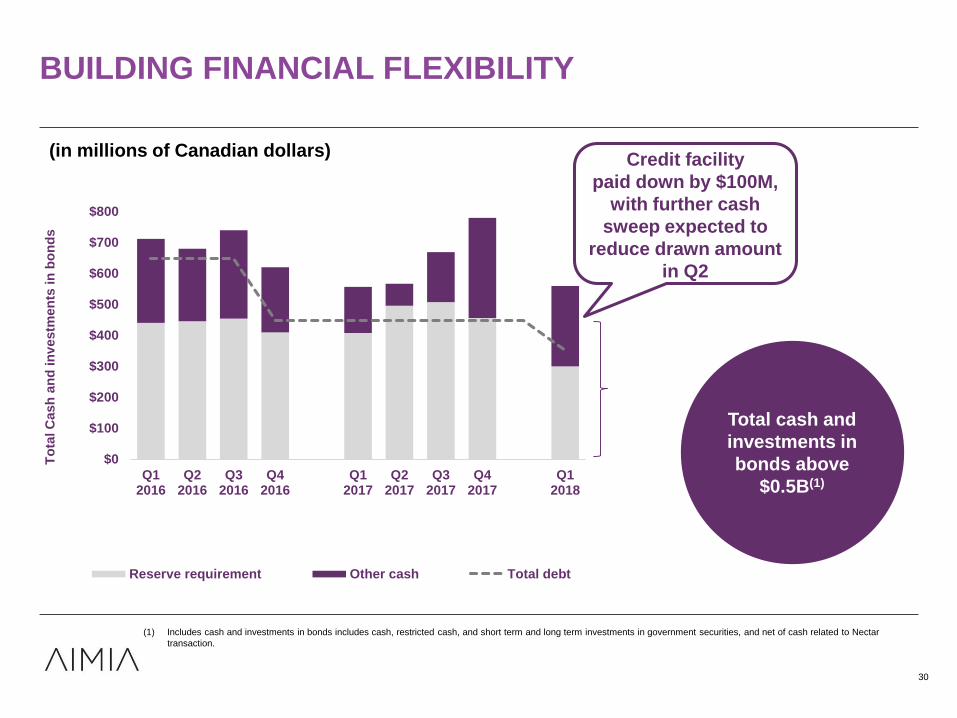
BUILDING FINANCIAL FLEXIBILITY
$0
$100
$200
$300
$400
$500
$600
$700
$800
Q12016
Q22016
Q32016
Q42016
Q12017
Q22017
Q32017
Q42017
Q12018
To
tal C
ash
an
d in
vestm
en
ts i
n b
on
ds
Reserve requirement Other cash Total debt
(in millions of Canadian dollars)
30
(1) Includes cash and investments in bonds includes cash, restricted cash, and short term and long term investments in government securities, and net of cash related to Nectar
transaction.
Credit facility
paid down by $100M,
with further cash
sweep expected to
reduce drawn amount
in Q2
Total cash and
investments in
bonds above
$0.5B(1)
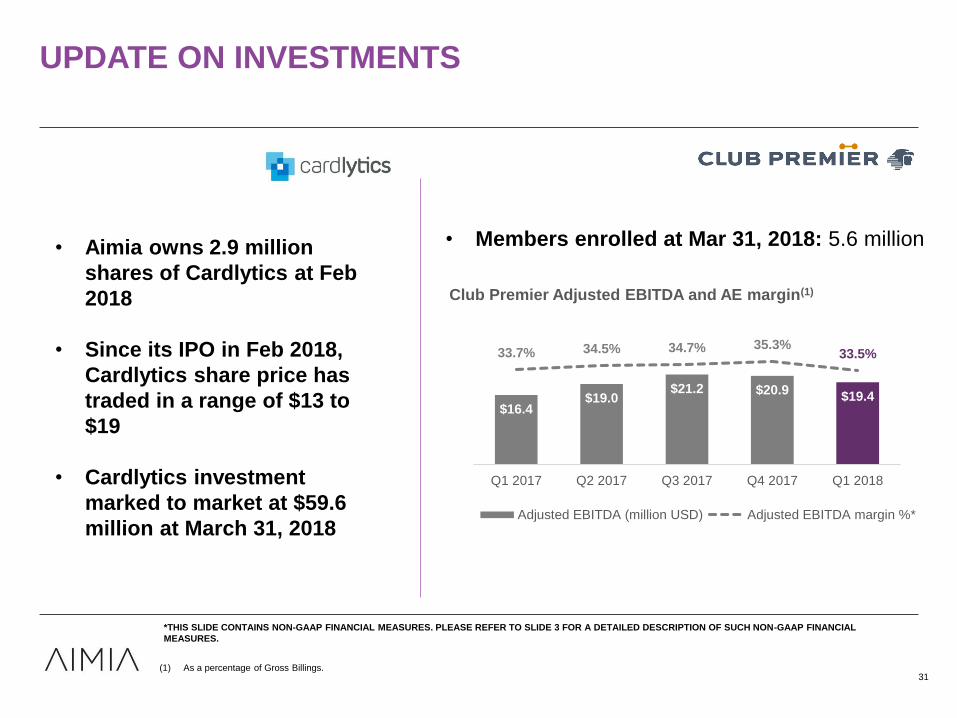
UPDATE ON INVESTMENTS
• Members enrolled at Mar 31, 2018: 5.6 million
31(1) As a percentage of Gross Billings.
*THIS SLIDE CONTAINS NON-GAAP FINANCIAL MEASURES. PLEASE REFER TO SLIDE 3 FOR A DETAILED DESCRIPTION OF SUCH NON-GAAP FINANCIAL
MEASURES.
$16.4$19.0
$21.2 $20.9$19.4
33.7% 34.5% 34.7% 35.3%33.5%
15.0%
20.0%
25.0%
30.0%
35.0%
40.0%
0
5
10
15
20
25
30
Q1 2017 Q2 2017 Q3 2017 Q4 2017 Q1 2018
Club Premier Adjusted EBITDA and AE margin(1)
Adjusted EBITDA (million USD) Adjusted EBITDA margin %*
• Aimia owns 2.9 million
shares of Cardlytics at Feb
2018
• Since its IPO in Feb 2018,
Cardlytics share price has
traded in a range of $13 to
$19
• Cardlytics investment
marked to market at $59.6
million at March 31, 2018
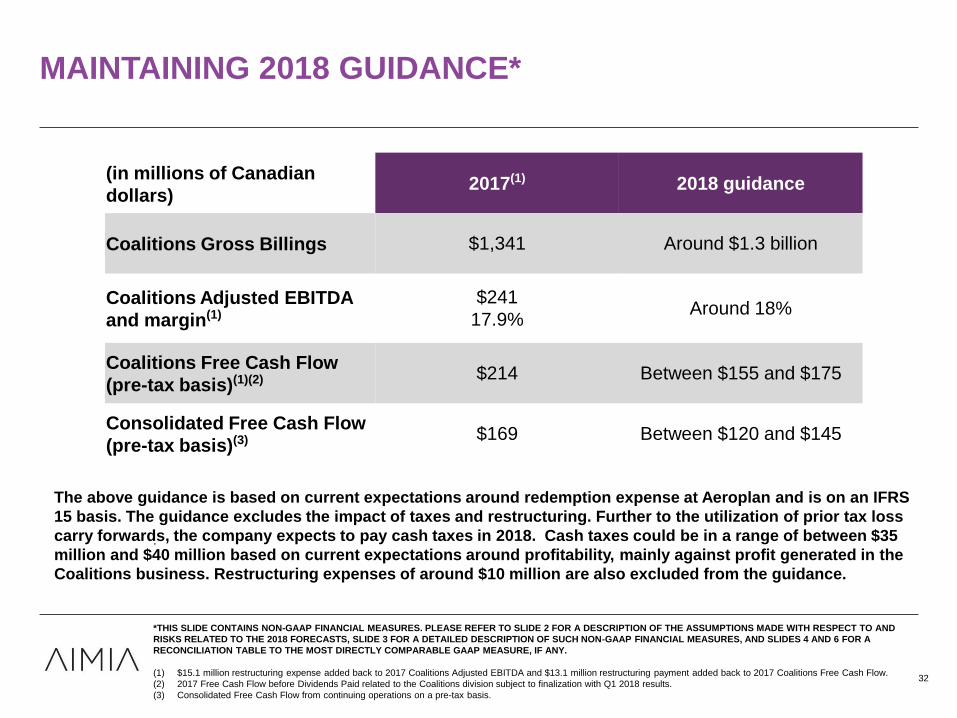
MAINTAINING 2018 GUIDANCE*
(in millions of Canadian
dollars)2017(1) 2018 guidance
Coalitions Gross Billings $1,341 Around $1.3 billion
Coalitions Adjusted EBITDA
and margin(1)
$241
17.9% Around 18%
Coalitions Free Cash Flow
(pre-tax basis)(1)(2) $214 Between $155 and $175
Consolidated Free Cash Flow
(pre-tax basis)(3) $169 Between $120 and $145
32
.
The above guidance is based on current expectations around redemption expense at Aeroplan and is on an IFRS
15 basis. The guidance excludes the impact of taxes and restructuring. Further to the utilization of prior tax loss
carry forwards, the company expects to pay cash taxes in 2018. Cash taxes could be in a range of between $35
million and $40 million based on current expectations around profitability, mainly against profit generated in the
Coalitions business. Restructuring expenses of around $10 million are also excluded from the guidance.
*THIS SLIDE CONTAINS NON-GAAP FINANCIAL MEASURES. PLEASE REFER TO SLIDE 2 FOR A DESCRIPTION OF THE ASSUMPTIONS MADE WITH RESPECT TO AND
RISKS RELATED TO THE 2018 FORECASTS, SLIDE 3 FOR A DETAILED DESCRIPTION OF SUCH NON-GAAP FINANCIAL MEASURES, AND SLIDES 4 AND 6 FOR A
RECONCILIATION TABLE TO THE MOST DIRECTLY COMPARABLE GAAP MEASURE, IF ANY.
(1) $15.1 million restructuring expense added back to 2017 Coalitions Adjusted EBITDA and $13.1 million restructuring payment added back to 2017 Coalitions Free Cash Flow.
(2) 2017 Free Cash Flow before Dividends Paid related to the Coalitions division subject to finalization with Q1 2018 results.
(3) Consolidated Free Cash Flow from continuing operations on a pre-tax basis.

KEY TAKEAWAYS
DAVID JOHNSTON

KEY Q1 TAKEAWAYS
34
• Aeroplan performance demonstrated continued
stability and redemption growth expected to slow
• Execution against cost savings and simplification
of the business driving margin improvement and
positive cash generation
• Balance sheet remains strong with over $0.5
billion at the end of March
• Launch of the promise campaign building on
strong assets and capabilities
Expect continued
progress against
priorities in 2018

Q&A

-0.1%
4.1%4.8%
0.8%
5.4%
1.2%2.0%
-0.9%
-2.8%
-0.4%
1.9%
3.9%
1.5%
5.6%
2.9% 3.3%
1.6%
-0.8%
Q12016
Q22016
Q32016
Q42016
Q12017
Q22017
Q32017
Q42017
Q12018
Miles accumulated y/y%
Miles accumulated Miles accumulated (ex-promo)
AEROPLAN ACCUMULATION PATTERN
36
Miles accumulated
broadly stable excluding
impact of lower promotional
miles
FY 2017 1.8%
Ex-promo: 3.3%
FY 2016: 2.4%
Ex-promo: 1.7%
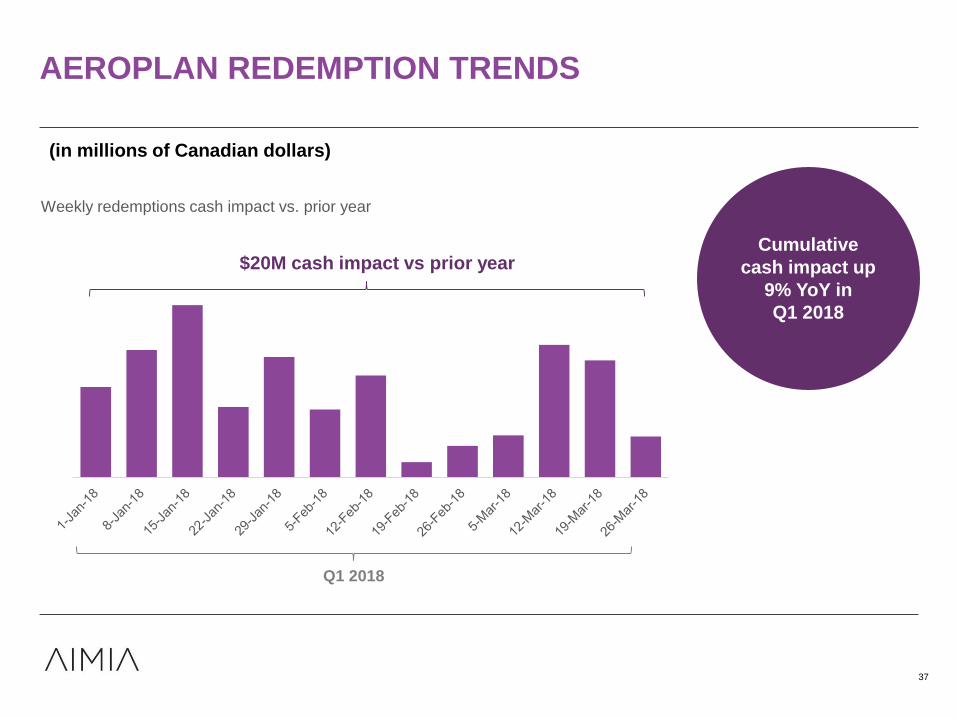
AEROPLAN REDEMPTION TRENDS
37
Weekly redemptions cash impact vs. prior year
(in millions of Canadian dollars)
Cumulative
cash impact up
9% YoY in
Q1 2018
$20M cash impact vs prior year
Q1 2018

Improving accumulation trend
98%
84% 84%
79%
97%
84%86% 87%
109%
60%
70%
80%
90%
100%
110%
120%
Q1 2016 Q2 2016 Q3 2016 Q4 2016 Q1 2017 Q2 2017 Q3 2017 Q4 2017 Q1 2018
Burn/earn ratio*
Burn earn %
AEROPLAN BURN/EARN RATIO
FY 2017: B/E 88%FY 2016: B/E 86%
38
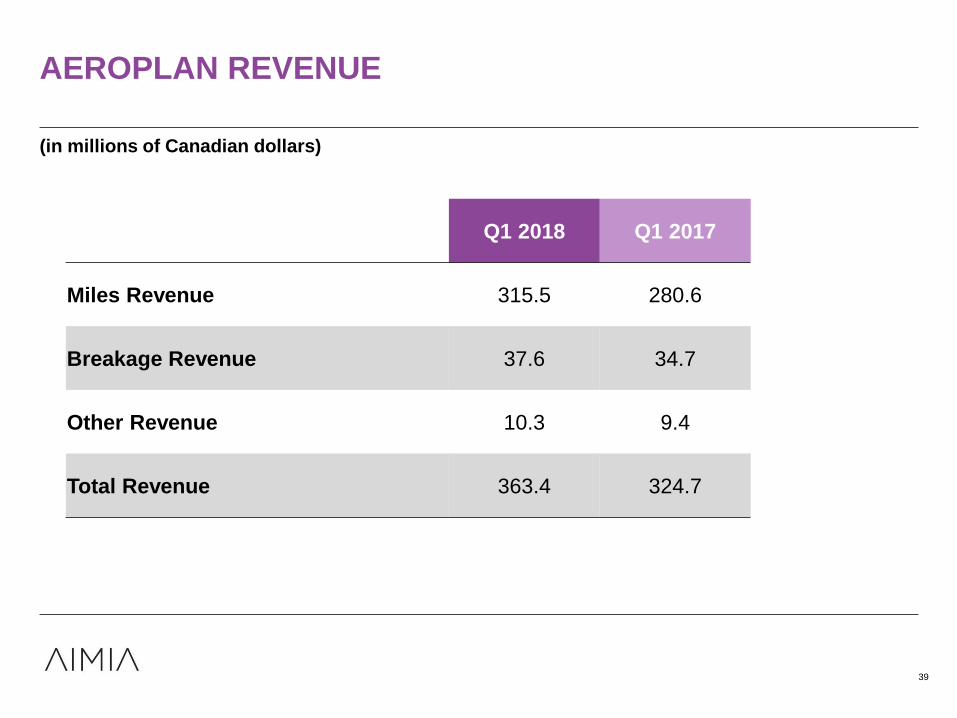
AEROPLAN REVENUE
39
Q1 2018 Q1 2017
Miles Revenue 315.5 280.6
Breakage Revenue 37.6 34.7
Other Revenue 10.3 9.4
Total Revenue 363.4 324.7
(in millions of Canadian dollars)

43.3 49.4 55.0 60.6 65.24.5
4.64.2
4.4 4.415.0%
16.0%
17.5%
18.9%
21.8%
15.1%(1)
16.0%(1)
17.6%(1)
19.0%(1)
22.0%(1)
10.0%
12.0%
14.0%
16.0%
18.0%
20.0%
22.0%
0.0
20.0
40.0
60.0
80.0
100.0
120.0
140.0
160.0
180.0
200.0
Q1 2017 Q2 2017 Q3 2017 Q4 2017 Q1 2018
Coalitions AE (excluding PLM distribution) PLM distribution
Coalitions AE margin % (pre IFRS 15) Coalitions AE margin % (post IFRS 15)
COALITIONS ADJUSTED EBITDA MARGIN*
(in millions of Canadian dollars, except percentages)
(1) IFRS 15 impact on Coalitions Gross Billings were $(3.8) million in Q1 2017, $(1.7) million in Q2 2017, $(2.0) million in Q3 2017, $(2.7) million in Q4 2017, and $(2.5) million
in Q1 2018.
*THIS SLIDE CONTAINS NON-GAAP FINANCIAL MEASURES. PLEASE REFER TO SLIDE 3 FOR A DETAILED DESCRIPTION OF SUCH NON-GAAP FINANCIAL
MEASURES AND SLIDE 4 AND 6 FOR A RECONCILIATION TABLE TO THE MOST DIRECTLY COMPARABLE GAAP MEASURE, IF ANY.
FY 2017(post-IFRS 15): 16.9%(1)
FY 2017 (pre-IFRS 15): 16.8%
40
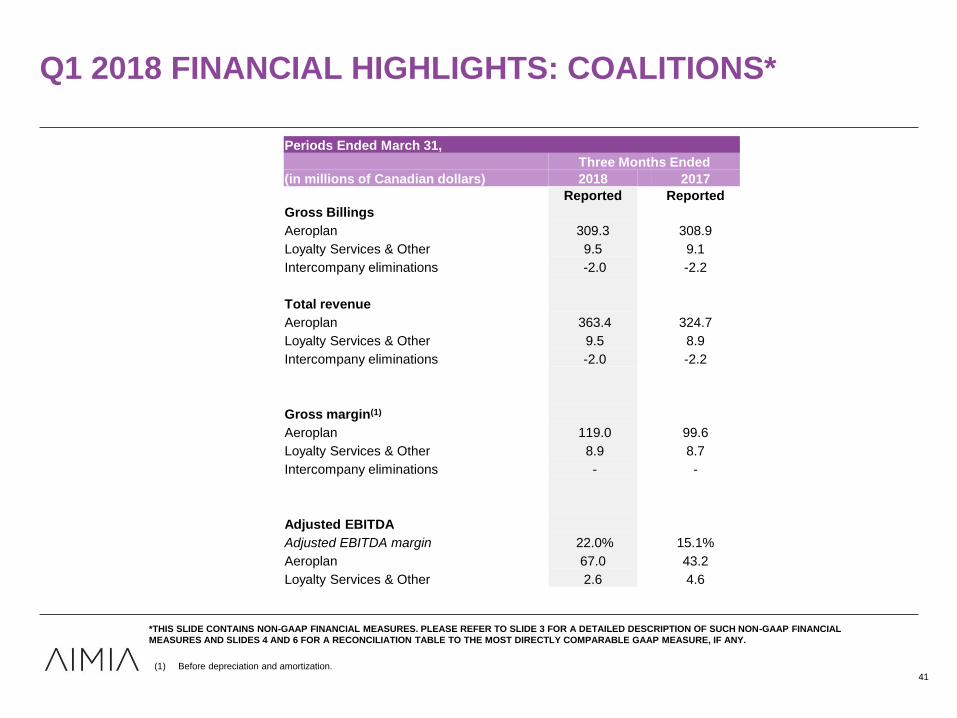
Q1 2018 FINANCIAL HIGHLIGHTS: COALITIONS*
41(1) Before depreciation and amortization.
*THIS SLIDE CONTAINS NON-GAAP FINANCIAL MEASURES. PLEASE REFER TO SLIDE 3 FOR A DETAILED DESCRIPTION OF SUCH NON-GAAP FINANCIAL
MEASURES AND SLIDES 4 AND 6 FOR A RECONCILIATION TABLE TO THE MOST DIRECTLY COMPARABLE GAAP MEASURE, IF ANY.
Periods Ended March 31,
Three Months Ended
(in millions of Canadian dollars) 2018 2017
Reported Reported
Gross Billings
Aeroplan 309.3 308.9
Loyalty Services & Other 9.5 9.1
Intercompany eliminations -2.0 -2.2
Total revenue
Aeroplan 363.4 324.7
Loyalty Services & Other 9.5 8.9
Intercompany eliminations -2.0 -2.2
Gross margin(1)
Aeroplan 119.0 99.6
Loyalty Services & Other 8.9 8.7
Intercompany eliminations - -
Adjusted EBITDA
Adjusted EBITDA margin 22.0% 15.1%
Aeroplan 67.0 43.2
Loyalty Services & Other 2.6 4.6
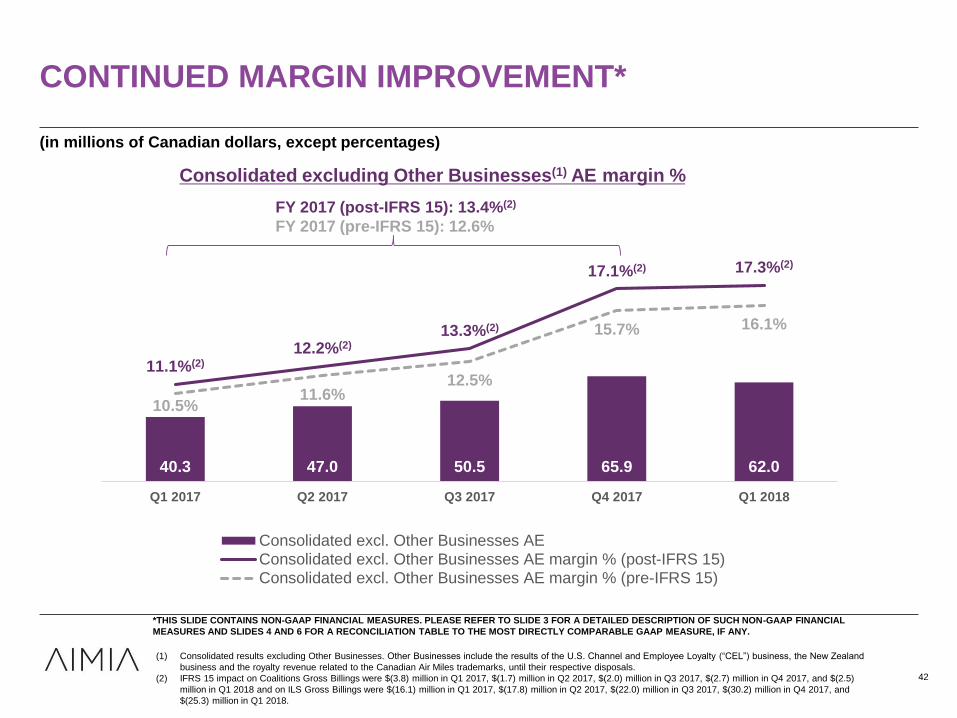
40.3 47.0 50.5 65.9 62.0
11.1%(2)
12.2%(2)
13.3%(2)
17.1%(2) 17.3%(2)
10.5%11.6%
12.5%
15.7% 16.1%
5.0%
7.0%
9.0%
11.0%
13.0%
15.0%
17.0%
19.0%
21.0%
23.0%
25.0%
0.0
20.0
40.0
60.0
80.0
100.0
120.0
140.0
160.0
180.0
200.0
Q1 2017 Q2 2017 Q3 2017 Q4 2017 Q1 2018
Consolidated excl. Other Businesses AE
Consolidated excl. Other Businesses AE margin % (post-IFRS 15)Consolidated excl. Other Businesses AE margin % (pre-IFRS 15)
CONTINUED MARGIN IMPROVEMENT*
(in millions of Canadian dollars, except percentages)
*THIS SLIDE CONTAINS NON-GAAP FINANCIAL MEASURES. PLEASE REFER TO SLIDE 3 FOR A DETAILED DESCRIPTION OF SUCH NON-GAAP FINANCIAL
MEASURES AND SLIDES 4 AND 6 FOR A RECONCILIATION TABLE TO THE MOST DIRECTLY COMPARABLE GAAP MEASURE, IF ANY.
FY 2017 (post-IFRS 15): 13.4%(2)
FY 2017 (pre-IFRS 15): 12.6%
42
Consolidated excluding Other Businesses(1) AE margin %
(1) Consolidated results excluding Other Businesses. Other Businesses include the results of the U.S. Channel and Employee Loyalty (“CEL”) business, the New Zealand
business and the royalty revenue related to the Canadian Air Miles trademarks, until their respective disposals.
(2) IFRS 15 impact on Coalitions Gross Billings were $(3.8) million in Q1 2017, $(1.7) million in Q2 2017, $(2.0) million in Q3 2017, $(2.7) million in Q4 2017, and $(2.5)
million in Q1 2018 and on ILS Gross Billings were $(16.1) million in Q1 2017, $(17.8) million in Q2 2017, $(22.0) million in Q3 2017, $(30.2) million in Q4 2017, and
$(25.3) million in Q1 2018.
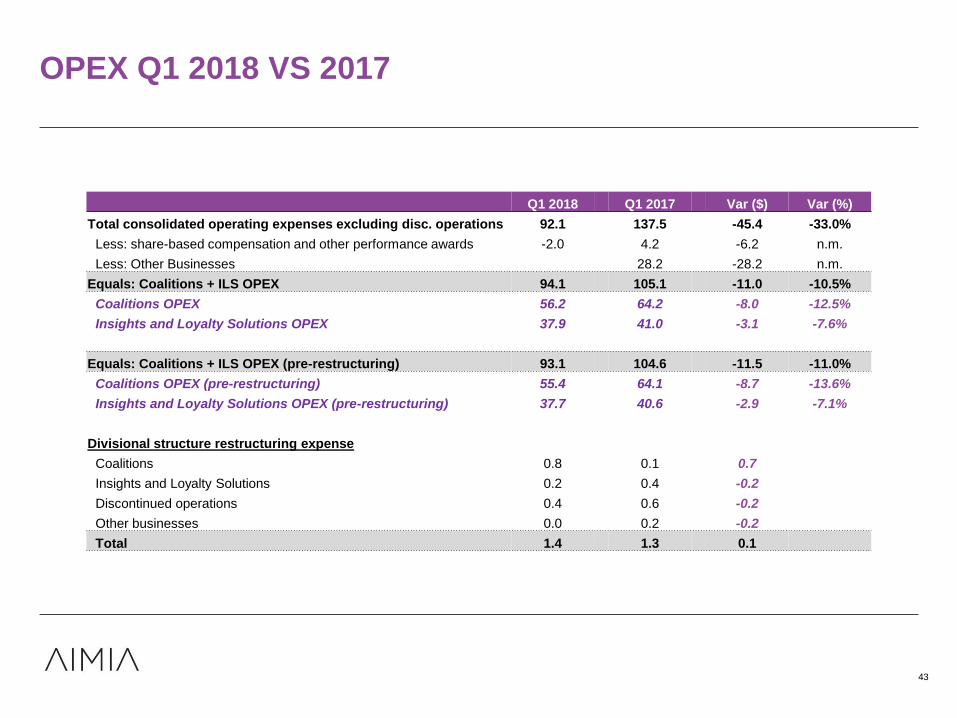
OPEX Q1 2018 VS 2017
43
Q1 2018 Q1 2017 Var ($) Var (%)
Total consolidated operating expenses excluding disc. operations 92.1 137.5 -45.4 -33.0%
Less: share-based compensation and other performance awards -2.0 4.2 -6.2 n.m.
Less: Other Businesses 28.2 -28.2 n.m.
Equals: Coalitions + ILS OPEX 94.1 105.1 -11.0 -10.5%
Coalitions OPEX 56.2 64.2 -8.0 -12.5%
Insights and Loyalty Solutions OPEX 37.9 41.0 -3.1 -7.6%
Equals: Coalitions + ILS OPEX (pre-restructuring) 93.1 104.6 -11.5 -11.0%
Coalitions OPEX (pre-restructuring) 55.4 64.1 -8.7 -13.6%
Insights and Loyalty Solutions OPEX (pre-restructuring) 37.7 40.6 -2.9 -7.1%
Divisional structure restructuring expense
Coalitions 0.8 0.1 0.7
Insights and Loyalty Solutions 0.2 0.4 -0.2
Discontinued operations 0.4 0.6 -0.2
Other businesses 0.0 0.2 -0.2
Total 1.4 1.3 0.1
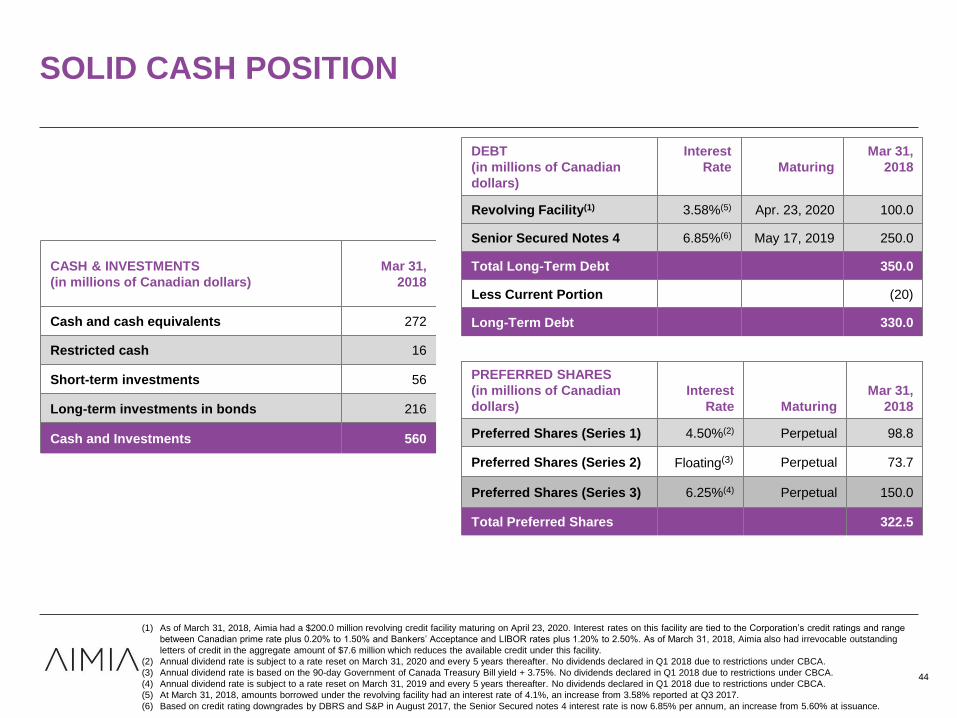
SOLID CASH POSITION
44
CASH & INVESTMENTS
(in millions of Canadian dollars)
Mar 31,
2018
Cash and cash equivalents 272
Restricted cash 16
Short-term investments 56
Long-term investments in bonds 216
Cash and Investments 560
DEBT
(in millions of Canadian
dollars)
Interest
Rate Maturing
Mar 31,
2018
Revolving Facility(1) 3.58%(5) Apr. 23, 2020 100.0
Senior Secured Notes 4 6.85%(6) May 17, 2019 250.0
Total Long-Term Debt 350.0
Less Current Portion (20)
Long-Term Debt 330.0
(1) As of March 31, 2018, Aimia had a $200.0 million revolving credit facility maturing on April 23, 2020. Interest rates on this facility are tied to the Corporation’s credit ratings and range
between Canadian prime rate plus 0.20% to 1.50% and Bankers’ Acceptance and LIBOR rates plus 1.20% to 2.50%. As of March 31, 2018, Aimia also had irrevocable outstanding
letters of credit in the aggregate amount of $7.6 million which reduces the available credit under this facility.
(2) Annual dividend rate is subject to a rate reset on March 31, 2020 and every 5 years thereafter. No dividends declared in Q1 2018 due to restrictions under CBCA.
(3) Annual dividend rate is based on the 90-day Government of Canada Treasury Bill yield + 3.75%. No dividends declared in Q1 2018 due to restrictions under CBCA.
(4) Annual dividend rate is subject to a rate reset on March 31, 2019 and every 5 years thereafter. No dividends declared in Q1 2018 due to restrictions under CBCA.
(5) At March 31, 2018, amounts borrowed under the revolving facility had an interest rate of 4.1%, an increase from 3.58% reported at Q3 2017.
(6) Based on credit rating downgrades by DBRS and S&P in August 2017, the Senior Secured notes 4 interest rate is now 6.85% per annum, an increase from 5.60% at issuance.
PREFERRED SHARES
(in millions of Canadian
dollars)
Interest
Rate Maturing
Mar 31,
2018
Preferred Shares (Series 1) 4.50%(2) Perpetual 98.8
Preferred Shares (Series 2) Floating(3) Perpetual 73.7
Preferred Shares (Series 3) 6.25%(4) Perpetual 150.0
Total Preferred Shares 322.5
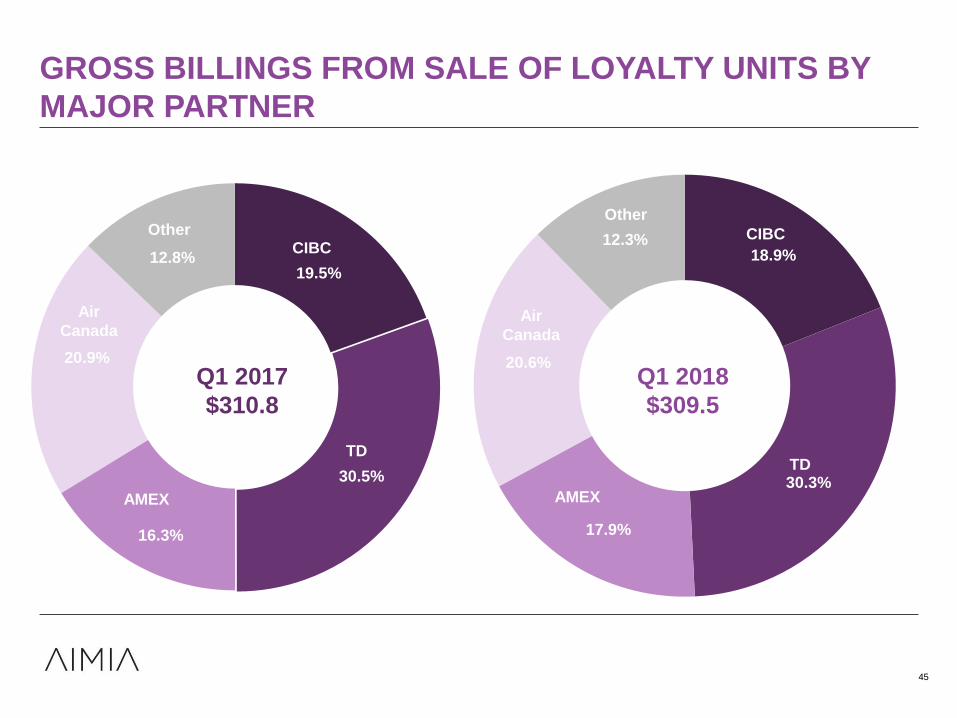
GROSS BILLINGS FROM SALE OF LOYALTY UNITS BY
MAJOR PARTNER
45
18.9%
30.3%
17.9%
20.6%
12.3%
AMEX
CIBC
TD
Air
Canada
Other
CIBC
Sainsbury’s
Air Canada
Other
Q1 2018
$309.5
AMEX
TD
19.5%
30.5%
16.3%
20.9%
12.8%
AMEX
Q1 2017
$310.8
CIBC
TD
Air
Canada
Other
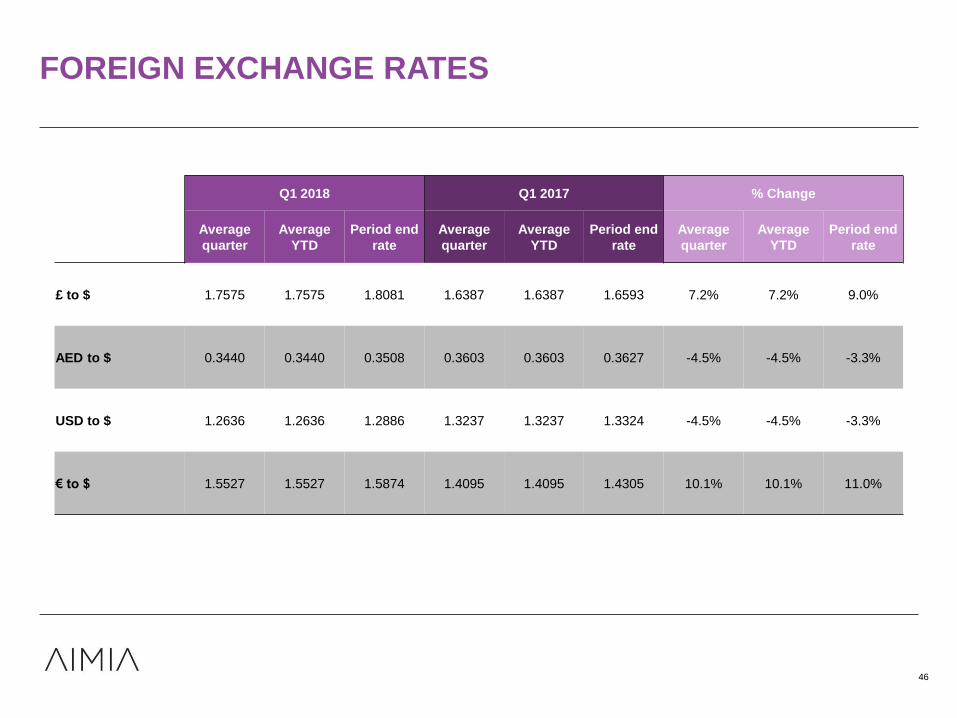
FOREIGN EXCHANGE RATES
46
Q1 2018 Q1 2017 % Change
Average
quarter
Average
YTD
Period end
rate
Average
quarter
Average
YTD
Period end
rate
Average
quarter
Average
YTD
Period end
rate
£ to $ 1.7575 1.7575 1.8081 1.6387 1.6387 1.6593 7.2% 7.2% 9.0%
AED to $ 0.3440 0.3440 0.3508 0.3603 0.3603 0.3627 -4.5% -4.5% -3.3%
USD to $ 1.2636 1.2636 1.2886 1.3237 1.3237 1.3324 -4.5% -4.5% -3.3%
€ to $ 1.5527 1.5527 1.5874 1.4095 1.4095 1.4305 10.1% 10.1% 11.0%
46

ACCOUNTING: KEY THINGS TO REMEMBER*
Gross Billings from the sale of Loyalty Units:
• Recognize upon issuance of Loyalty Units
• Key indicator of top line growth
Liabilities Recognition:
• Deferred revenue on the Balance Sheet represents
the accumulated unredeemed Loyalty Units valued at
their weighted average selling price and unrecognized
breakage
• As part of external disclosure, the total estimated
consolidated future redemption cost liability of
unredeemed Loyalty Units is disclosed in the MD&A
under the Redemption Reserves section and is
calculated at the TTM average cost of rewards per
Loyalty Unit redeemed
47
Revenue Recognition:
• Recognize upon redemption of Loyalty Units
Breakage Recognition:
• Recognize upon redemption of Loyalty Units
Cost of Rewards Recognition:
• Recognize upon redemption of Loyalty Units
Adjusted EBITDA:
• Key indicator of operating profit performance
Free Cash Flow:
• Key indicator of cash generation
47
*THIS SLIDE CONTAINS NON-GAAP FINANCIAL MEASURES. PLEASE REFER TO SLIDE 3 FOR A DETAILED DESCRIPTION OF SUCH NON-GAAP FINANCIAL
MEASURES AND SLIDES 4 AND 6 FOR A RECONCILIATION TABLE TO THE MOST DIRECTLY COMPARABLE GAAP MEASURE, IF ANY.