OUTLOOK FOR US DRIED FRUIT & TREE NUTS ......OUTLOOK FOR US DRIED FRUIT & TREE NUTS: CONSUMPTION &...
44
OUTLOOK FOR US DRIED FRUIT & TREE NUTS: CONSUMPTION & EXPORT TRENDS DFA OF CALIFORNIA AND SPECIALTY CROP TRADE COUNCIL 2012 ANNUAL CONFERENCE: BEYOND GRAVITY, CATCH FIRE
Transcript of OUTLOOK FOR US DRIED FRUIT & TREE NUTS ......OUTLOOK FOR US DRIED FRUIT & TREE NUTS: CONSUMPTION &...

© Euromonitor International
1
OUTLOOK FOR US DRIED FRUIT & TREE NUTS: CONSUMPTION & EXPORT TRENDS
DFA OF CALIFORNIA AND SPECIALTY CROP TRADE COUNCIL 2012 ANNUAL
CONFERENCE: BEYOND GRAVITY, CATCH FIRE

© Euromonitor International
2
About Euromonitor International
Global & Regional Market Overview
US Exports & Opportunity Zones
Drivers, Constraints & Trends

© Euromonitor International
3
EUROMONITOR INTERNATIONAL OVERVIEW
Business information provider since 1972
Global strategic information tools and services to understand industry performance trends, drivers and market opportunities
World’s leading governments, manufacturers, academic institutions, retailers, banks, and suppliers among our clients
Cover 205 markets with 1400+ employees and on-the-ground research teams in 80 countries
Award-winning online databases, market reports, statistical reference books, and custom information tools and research services
Offices in London, Chicago, Santiago, Singapore, Shanghai, Vilnius, Cape Town, Dubai, Tokyo, Bangladesh and Sydney

© Euromonitor International
4
About Euromonitor International
Global Market Overview
US Exports & Opportunity Zones
Drivers, Constraints & Trends

© Euromonitor International
5
KEY FACTS
GLOBAL OVERVIEW
Market performance
• The global processed food market approached $3.4 trillion in 2011; global consumer foodservice is estimated to have topped $2.3 trillion.
• US tree nut exports neared $5 billion, while dried fruit exports approached $710 million.
• Consumption generally climbing with populations, rising disposable incomes, and desires for increased health & wellness, convenience and indulgence.
• Developing regions with rising populations, GDP, and shifting per capita consumption are helping to drive significant growth.
Largest Categories • Almonds
• Walnuts
• Pistachios
• Grapes, Dried
• Prunes
Historical US growth categories • Almonds
• Pistachios
• Walnuts
• Grapes, Dried
• Mixtures of Nuts
Fastest growing US exports • Brazil Nuts (no shell)
• Macadamia Nuts
• Cashew Nuts (in shell)
• Walnuts (in shell)
• Almonds (in shell)
Largest US export sectors

© Euromonitor International
6
PROCESSED FOOD: GLOBAL RETAIL VALUE PERFORMANCE
Processed food consumption neared $3.4 trillion in 2011 – many of food categories within Packaged Food utilize tree nuts / dried fruits as inputs.
Global value growth from 2011-2015 of $890 billion is expected, representing a 27% surge from 2011 levels -- this is expected to vary widely by region and country.
BROAD CATEGORY RETAIL SALES

© Euromonitor International
7
WORLDWIDE RETAIL SALES BY PACKAGED FOOD CATEGORY
CATEGORIES INCLUDING STAPLES, INDULGENCE, CONVENIENCE AND

© Euromonitor International
8
MAJOR GROWTH CONTRIBUTORS: DEVELOPING REGIONS
Asia-Pacific, Western Europe, and Latin America with largest value growth since 2007; North America trails most other regions in value growth.
Asia-Pacific & Latin American combined for 44% of global value growth since 2007; Asia-Pacific’s value growth for the period is expected to be more than twice that of North America by year’s end.
The same regions also showed the greatest growth in volume terms -- marking them as potential opportunity zones for US exports.
ASIA-PACIFIC AND LATIN AMERICA NOTABLE

© Euromonitor International
9
FUTURE GROWTH TIED MOSTLY TO DEVELOPING REGIONS
Western Europe represents the largest sales with $605 billion in 2011.
But greatest percentage and “absolute” value growth is coming from developing regions.
North America and Western Europe are expected to grow by 11% in value terms, while all other regions are growing at 2-5 times that rate.
FORECASTS FURTHER EMPHASIZE IMPORTANCE OF DEVELOPING REGIONS
0%
10%
20%
30%
40%
50%
60%
$0$100$200$300$400$500$600$700$800
Regional Packaged Food Value Sales: 2011-15 & Growth Rate - US$ bn - Fixed 2011 Ex. Rates
2011
2015
% Growth

© Euromonitor International
10
VOLUME EXPANSION ALSO IN DEVELOPING MARKETS
SIZEABLE GAINS IN VOLUME
Asia-Pacific, Middle East & Africa and Latin America are expected to combine for approximately 83% global volume growth in packaged foods from 2011-2015.
Asia-Pacific is expected to be 54% of total global volume growth during this period.
Western Europe and North America are projected to be 7% and 3% of global volume growth and are experiencing flat (or diminishing) per capita consumption.

© Euromonitor International
11
COUNTRY CAGR: PACKAGED FOODS FORECAST
DEVELOPING MARKETS ARE KEY TO GLOBAL GROWTH IN PROCESSED PRODUCTS

© Euromonitor International
12
ANTICIPATED VOLUME GROWTH IN PACKAGED FOOD
CHINA EATING UP COMMANDING SHARE IN PACKAGED FOOD

© Euromonitor International
13
ASIA PACIFIC CONSUMES MOST OF WORLD’S FRESH FOOD
Global consumption of fresh foods reached 1.85 billion tonnes in 2010.
Asia Pacific consumed 65% of the global total and, on a per capita basis, 16% more than those in North America.
ASIA PACIFIC PUSHING UP GLOBAL DEMAND
Asia Pacific 65%
Latin America 8%
Middle East and Africa 8%
Western Europe 8%
Eastern Europe 6%
North America 5% Australasia
0%
2010 World Fresh Food Consumption by Region
Asia Pacific
Latin America
Middle East and Africa
Western Europe
Eastern Europe
North America
Australasia
© Euromonitor International
14
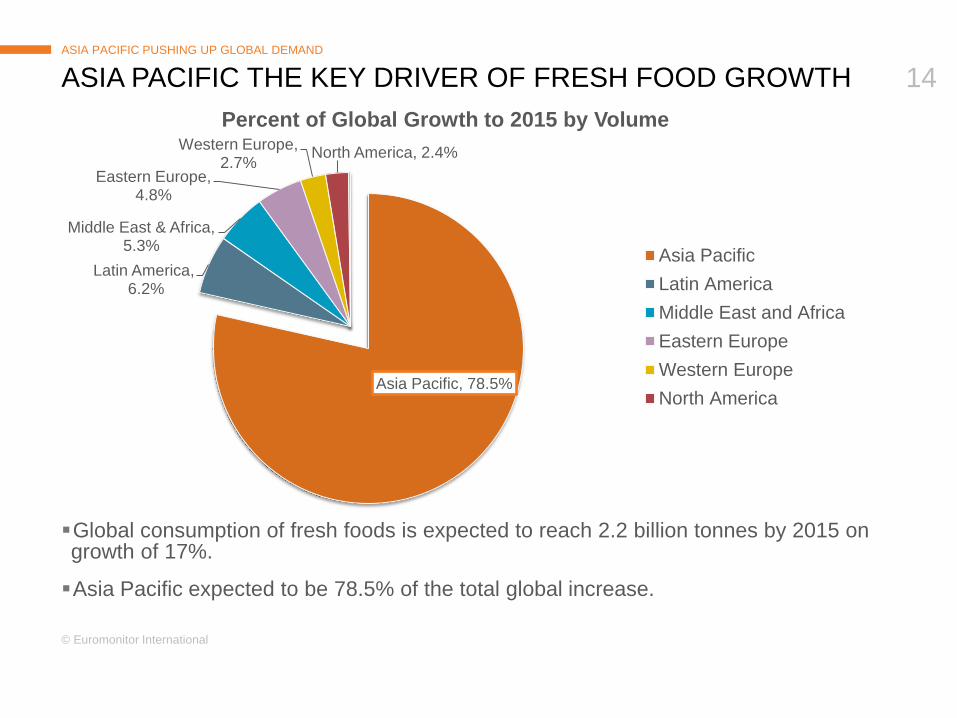
ASIA PACIFIC THE KEY DRIVER OF FRESH FOOD GROWTH
Global consumption of fresh foods is expected to reach 2.2 billion tonnes by 2015 on growth of 17%.
Asia Pacific expected to be 78.5% of the total global increase.
ASIA PACIFIC PUSHING UP GLOBAL DEMAND
Asia Pacific, 78.5%
Latin America, 6.2%
Middle East & Africa, 5.3%
Eastern Europe, 4.8%
Western Europe, 2.7%
North America, 2.4%
Percent of Global Growth to 2015 by Volume
Asia Pacific
Latin America
Middle East and Africa
Eastern Europe
Western Europe
North America

© Euromonitor International
15
LEADING MARKETS FOR CONSUMPTION OF FRESH FOOD
Developing markets are eyeing 10-48% growth, while developed markets seeing 3-7% growth.
China and India dominant drivers in global growth of fresh foods.
By 2015, China and India will represent 50% of total global consumption of fresh foods.
STAPLE FRESH FOOD PRODUCTS GROWING
0%
10%
20%
30%
40%
50%
60%
0100,000200,000300,000400,000500,000600,000700,000800,000
Top Fresh Food Markets: 2010-15 Consumption in ‘000 of Tonnes
Yr 2010
Yr 2015
% Growth

© Euromonitor International
16
Global consumer foodservice estimated to have topped $2.3 trillion in 2011.
The global foodservice industry saw a return to growth in 2010, following a miserable 2009.
Growth was far from evenly distributed, with strong growth in Asia Pacific and Latin America offset by continued weakness in North America and Western Europe.
Relatively strong growth in quick-service categories, like fast food and street stalls/kiosks, as consumer desire for value and convenience remained strong.
Growth in Western Europe, above all, is expected to remain weak amid continued talk of austerity, with further government budget cuts expected to act as a brake on overall demand.
A TENTATIVE RETURN TO GROWTH IN 2010
CONSUMER FOODSERVICE: GLOBAL PERFORMANCE
© Euromonitor International
17
A RETURN TO GROWTH IN 2010
CONSUMER FOODSERVICE: GLOBAL PERFORMANCE
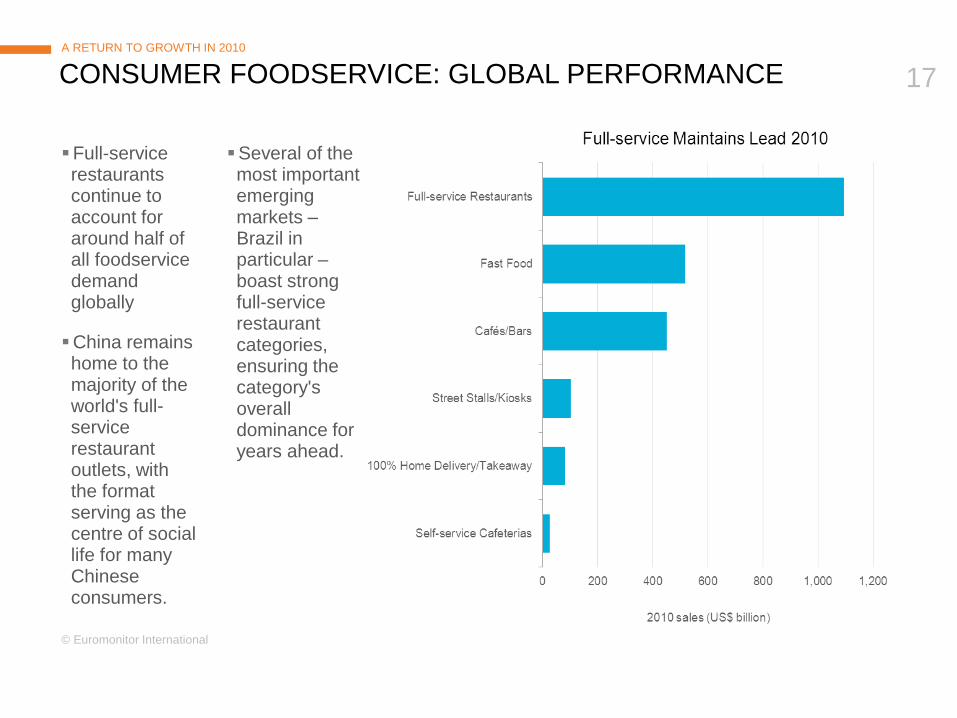
Full-service restaurants continue to account for around half of all foodservice demand globally
China remains home to the majority of the world's full-service restaurant outlets, with the format serving as the centre of social life for many Chinese consumers.
Several of the most important emerging markets – Brazil in particular – boast strong full-service restaurant categories, ensuring the category's overall dominance for years ahead.

© Euromonitor International
18
Asia Pacific accounted for around 40% of global foodservice spending in 2010, and saw rapid growth in that year.
China, India and Indonesia continue to expand in step with rising disposable incomes.
While both North America and Western Europe remain large, many operators cut back on outlet growth in favour of measures designed to increase same-store sales and eating frequency.
GLOBAL PERFORMANCE ASIA PACIFIC DOMINANT BY WIDE MARGIN

© Euromonitor International
19
Asia Pacific had four markets in the global top 10 in 2010, the same as Western Europe, with growth rates far in excess of any major European market.
Emerging markets have become well-established as key global markets.
China is now firmly entrenched as the world's number two consumer foodservice market.
Latin America also continues to see significant growth
Brazil, Argentina and Colombia now the key growth markets on the continent, spurred by a combination of growing consumer spending and relative financial stability on the continent.
Asian Markets Now Key 2010
Market 2010 sales (US$ billion)
US 436.9
China 333.4
Japan 240.5
Brazil 128.2
Spain 110.5
Italy 101.8
India 87.4
UK 83.4
France 62.1
South Korea 58.9
EMERGING MARKETS CONTINUE TO TAKE SHARE
ASIA PACIFIC AND LATIN AMERICA CONTINUE TO RESHAPE LANDSCAPE

© Euromonitor International
20
About Euromonitor International
Global Market Overview
US Exports & Opportunity Zones
Drivers, Constraints & Trends

© Euromonitor International
21
US PROCESSED PRODUCT EXPORTS SET RECORD IN 2011
US PROCESSED PRODUCT EXPORTS SEEING REMARKABLE GROWTH
US processed product exports topped US$58 billion in 2011.
This represents growth of nearly 80% within the five-year period from 2006-2011.

© Euromonitor International
22
EXPORT VOLUME IS ALSO GROWING – BUT NOT AS QUICKLY
VOLUME TRAILS
The upward trend from 2006-2011 result in overall volume growth of 16%.
Through February 2012, volume is up this year by 16% over last year.

© Euromonitor International
23
THE STORY SHOWN IN EXPORTS
STAPLES, CONVENIENCE, INDULGENCE, HEALTH…
0%
20%
40%
60%
80%
100%
120%
$0
$2,000,000
$4,000,000
$6,000,000
$8,000,000
$10,000,000
$12,000,000
$14,000,000
2006-2010: US Exports in ‘000 Dollars and Growth
Yr 2006
Yr 2010
% Growth2006-10

© Euromonitor International
24
EXPORTS TO DEVELOPING MARKETS HAVE LEAPED AHEAD
DEVELOPED VS. DEVELOPING MARKETS
$0
$5,000,000
$10,000,000
$15,000,000
$20,000,000
$25,000,000
$30,000,000
Yr 2006 Yr 2010
2006 & 2010: US Exports of Processed Food Products - Developing vs. Developed Economies in US$ ‘000
Developing Economies
Developed Economies
Overall exports to developing markets
grew 67%, while those to developed
markets grew 37%.

© Euromonitor International
25
SURGING EXPORT GROWTH IN DEVELOPING REGIONS
PROCESSED FOOD PRODUCTS
-20%
0%
20%
40%
60%
80%
100%
120%
140%
$-
$2,000,000
$4,000,000
$6,000,000
$8,000,000
$10,000,000
$12,000,000
$14,000,000
$16,000,000
$18,000,000
$20,000,000
2006-2010: US Exports of Processed Food Products
Yr 2006
Yr 2010
% Growth

© Euromonitor International
26
EXPORTS IN DRIED HAVE SURGED AS WELL
DRIED GROWING AT ALL BROAD LEVELS
0%
10%
20%
30%
40%
50%
60%
70%
80%
90%
$0
$1,000,000
$2,000,000
$3,000,000
$4,000,000
$5,000,000
$6,000,000
Nuts Dried Fruit Dried Vegetables
2007-2011: US Exports of Tree Nuts & Dried Products – US$ ‘000 & Growth Rate
Yr 2007
Yr 2011
% Growth
NOTE: “Nuts” excludes Coconuts, Brazilian and Cashew Nuts
© Euromonitor International
27
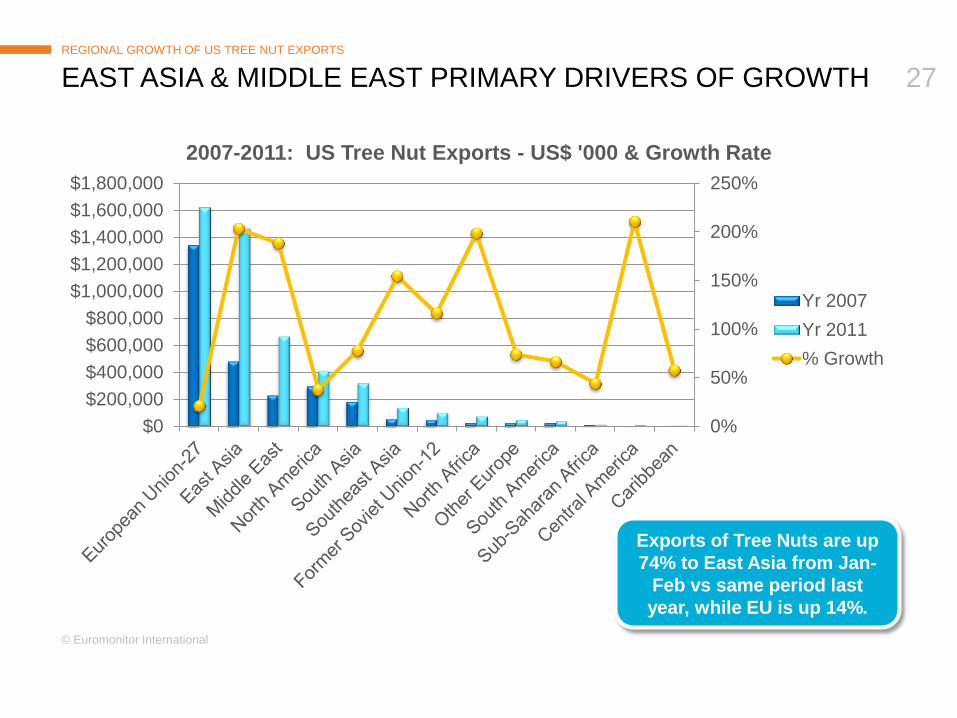
EAST ASIA & MIDDLE EAST PRIMARY DRIVERS OF GROWTH
REGIONAL GROWTH OF US TREE NUT EXPORTS
0%
50%
100%
150%
200%
250%
$0
$200,000
$400,000
$600,000
$800,000
$1,000,000
$1,200,000
$1,400,000
$1,600,000
$1,800,000
2007-2011: US Tree Nut Exports - US$ '000 & Growth Rate
Yr 2007
Yr 2011
% Growth
Exports of Tree Nuts are up
74% to East Asia from Jan-
Feb vs same period last
year, while EU is up 14%.

© Euromonitor International
28
MAJOR TREE NUT EXPORTS SEEING SOLID GROWTH
EXPORT TOTALS HAVE SURGED FOR MOST TREE NUTS WITH ALMONDS LEADING
0%
50%
100%
150%
200%
250%
300%
$0
$500,000
$1,000,000
$1,500,000
$2,000,000
$2,500,000
2007-2011: Leading US Tree Nut Exports – US$ ‘000 & Growth Rate
Yr 2007
Yr 2011
% Growth

© Euromonitor International
29
HONG KONG KEY MARKET, SEEN RE-EXPORTING TO CHINA
EXPORT SURGE TIED PRIMARILY TO ASIA PACIFIC MARKETS
0%
50%
100%
150%
200%
250%
300%
350%
400%
450%
$0
$100,000
$200,000
$300,000
$400,000
$500,000
$600,000
$700,000
$800,000
$900,000H
on
g K
on
g
Spain
Ge
rma
ny
India
Ca
na
da
Un
ite
d A
rab
Em
ira
tes
Ja
pa
n
Tu
rke
y
Ne
the
rla
nd
s
Ch
ina
Ko
rea
, S
ou
th
Ita
ly
Me
xic
o
Be
lgiu
m-L
uxe
mb
ou
rg
Un
ite
d K
ing
do
m
Fra
nce
Isra
el
Ru
ssia
Vie
tnam
Au
str
alia
2007-2011: Top Markets for US Tree Nut Exports – US$ '000 & Growth Rates
Yr 2007
Yr 2011
% Growth

© Euromonitor International
30
EXPORT VOLUME GAINS DRIVEN BY DEVELOPING MARKETS
VOLUME IN TREE NUTS
-50%
0%
50%
100%
150%
200%
250%
300%
350%
400%
450%
0
20,000
40,000
60,000
80,000
100,000
120,000
140,000
160,000
180,000
200,000H
on
g K
on
g
Spain
Ind
ia
Ge
rma
ny
Tu
rke
y
Un
ite
d A
rab
Em
ira
tes
Ch
ina
Ca
na
da
Ja
pa
n
Ita
ly
Ne
the
rla
nd
s
Ko
rea
, S
ou
th
Me
xic
o
Be
lgiu
m-L
uxe
mb
ou
rg
Vie
tna
m
Fra
nce
Ru
ssia
Un
ite
d K
ing
do
m
Isra
el
Au
str
alia
2007-2011: US Volume Exports of Tree Nuts in Metric Tonnes
Yr 2007
Yr 2011

© Euromonitor International
31
EXPORTS TO EAST ASIA TO ECLIPSE EUROPEAN UNION
REGIONAL GROWTH OF DRIED FRUIT EXPORTS
0%
50%
100%
150%
200%
250%
300%
350%
400%
$0
$50,000
$100,000
$150,000
$200,000
$250,000
2007-2011: US Dried Fruit Exports – US$ ‘000 & Growth
Yr 2007
Yr 2011
% Growth
Exports of Dried Fruit are up
7% to East Asia from Jan-
Feb vs same period last
year, while EU is up 2%.

© Euromonitor International
32
DRIED FRUITS POSITIVE BUT NOT WITHOUT CHALLENGES
RAISINS REMAIN SIGNIFICANT GROWTH FACTOR FOR THE CATEGORY
-50%
0%
50%
100%
150%
200%
250%
300%
$0
$50,000
$100,000
$150,000
$200,000
$250,000
$300,000
$350,000
$400,000
$450,000
2007-2011: Leading US Dried Fruit Export Categories – US$ '000 & Growth Rate
Yr 2007
Yr 2011
% Growth
Cult. Blueberries:
7800% growth from
$0 to $7.8 mn.

© Euromonitor International
33
VALUE UP IN MOST LEADING MARKETS
VALUE GROWTH WIDELY SEEN
-50%
0%
50%
100%
150%
200%
250%
300%
$0
$10,000
$20,000
$30,000
$40,000
$50,000
$60,000
$70,000
$80,000
$90,000
$100,000
Ja
pa
n
Canada
Ge
rma
ny
Un
ite
d K
ing
do
m
Au
str
alia
Ko
rea
, S
ou
th
Ch
ina
Me
xic
o
Ma
laysia
Sw
ed
en
Ho
ng
Ko
ng
Ta
iwa
n
Isra
el
Sw
itze
rla
nd
De
nm
ark
Ru
ssia
No
rwa
y
Ne
the
rla
nd
s
Italy
Sa
udi A
rab
ia
2007-2011: Top Markets for US Exports of Dried Fruit – US$ '000 & Growth Rate
Yr 2007
Yr 2011
% Growth

© Euromonitor International
34
VOLUME GROWTH LARGELY IN DEVELOPING MARKETS
VOLUME SHIFTING
-40%-20%0%20%40%60%80%100%120%140%160%
0
5,000
10,000
15,000
20,000
25,000
30,000
35,000
Ja
pa
n
Ca
na
da
Ge
rma
ny
United K
ingdom
Ko
rea
, S
ou
th
Au
str
alia
Me
xic
o
Ch
ina
Ma
laysia
Ho
ng
Ko
ng
Sw
ed
en
Ta
iwa
n
Ru
ssia
Sw
itze
rla
nd
Isra
el
De
nm
ark
Sa
udi A
rab
ia
Ne
the
rla
nd
s
No
rwa
y
New
Zeala
nd
2007-2011: Top Markets and Growth Rates for US Dried Fruit Exports by Volume (Metric Tonnes)
Yr 2007
Yr 2011
% Growth

© Euromonitor International
35
About Euromonitor International
Global Market Overview
US Exports & Opportunity Zones
Drivers, Constraints & Trends

© Euromonitor International
36
GROWTH IN DISPOSABLE INCOME PLAYING A ROLE
DEVELOPING MARKETS WITH MORE MONEY
18% 14%
33%
40%
26%
35%
17%
Per capita disposable income of developing markets is greatly below that of developed.
An increase of $823 per capita in disposable income is expected in Asia-Pacific by 2015.
Asia-Pacific’s total disposable expected to eclipse all other regions by 2013.
© Euromonitor International
37
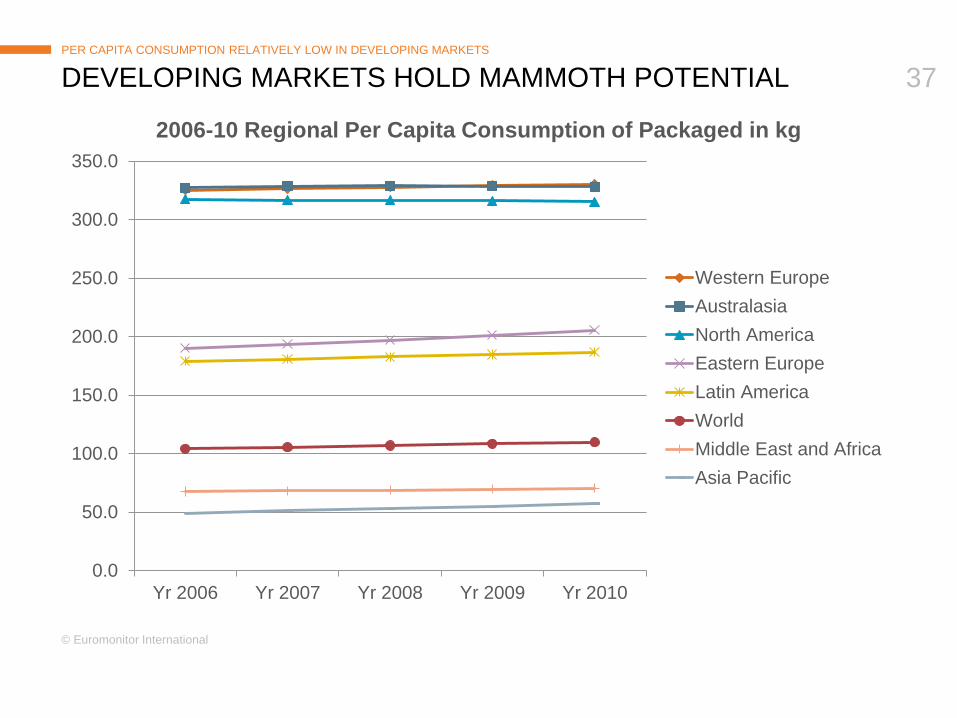
DEVELOPING MARKETS HOLD MAMMOTH POTENTIAL
PER CAPITA CONSUMPTION RELATIVELY LOW IN DEVELOPING MARKETS
0.0
50.0
100.0
150.0
200.0
250.0
300.0
350.0
Yr 2006 Yr 2007 Yr 2008 Yr 2009 Yr 2010
2006-10 Regional Per Capita Consumption of Packaged in kg
Western Europe
Australasia
North America
Eastern Europe
Latin America
World
Middle East and Africa
Asia Pacific

© Euromonitor International
38
AP & MEA’S POPULATION TO EXPAND BY OVER 633 MILLION
SIGNIFICANT POPULATION SHIFTS
Population expansion of nearly 350 million is forecasted for Asia-Pacific from 2010-20.
Middle East & Africa is expected to expand by nearly 275 million during the same period.
Eastern Europe is expected to post a loss of nearly 5 million.

© Euromonitor International
39
Asia-Pacific is predicted to add 184 million people to the global population between 2010 and 2015, followed by the Middle East and Africa at 139 million over the same period.
Asia-Pacific’s population growth is predicted to stem entirely from urban areas, while Middle East & Africa’s will be 35% rural growth.
Asia-Pacific’s extraordinary urban population growth should result in strong consumer demand for processed food in the short to medium term.
Greater spending power among middle-income consumers in countries such as China and India will also underpin strong growth in fresh meat consumption and associated foods.
Eastern Europe’s population is projected to fall by 3.3 million, due to emigration and cases of falling life expectancies but will still see value and volume increases.
POPULATION GROWTH UNDERPINS DEMAND FOR COMMODITIES
URBANIZATION TO FURTHER SUPPORT CONSUMPTION

© Euromonitor International
40
Strong urban population growth in Asia-Pacific will boost demand for processed food staples, with the region accounting for 77% and 54%, respectively, of global processed rice and dairy growth between 2010 and 2015.
Middle East and Africa’s population growth will be a major contributor to growth in baked goods, particularly unpackaged/artisanal bread with growth of 3.7 million tonnes between 2010 and 2015.
Strongly growing demand is projected for fresh and processed meat in Latin America and Asia-Pacific.
Note: Total volumes include retail and foodservice sales
BAKED GOODS, DAIRY, RICE AND FRESH MEAT
URBAN GROWTH URBAN GROWTH DRIVING A VARIETY OF CATEGORIES

© Euromonitor International
41
PACKAGED FOOD PRODUCTS GROWING IN ALL CATEGORIES
INCOMES, HEALTH, CONVENIENCE AND INDULGENCE
Dairy to add over $85 billion in growth through 2015.
Bakery, confectionery, chilled/dried/ and frozen processed foods to see growth ranging from 3-5% in value terms.
Growth is being led by increased desire for staple food products, food safety, indulgence, convenience.

© Euromonitor International
42
Industry prediction:
Exceptionally slow
economic recovery
European markets are now facing significant public spending cuts and the USA
continues to struggle with 8-9% unemployment.
Industry response:
Emerging markets and
‘hot’ growth prospects
To stave off the constraining effects of economic uncertainty in increasingly mature
developed packaged food markets, aggressive and sustained expansion into
emerging markets, especially Asia-Pacific, will be essential to future success.
Industry prediction:
Commodity prices
Commodity prices face volatility, which will put pressure on manufacturers and the
broader supply chain. However, a repeat of the rapid food price inflation seen from
mid-2007 to mid-2008 remains unlikely.
Industry response:
Managing volatile
commodity prices
Nevertheless, manufacturers that anticipate any increases to commodity costs will be
in a stronger position, especially as cost savings and effective supply chain
management become more important in the face of mounting retailer consolidation.
Industry prediction:
Innovation
Packaged food manufacturers will increase investment in new product developments
in light of better economic prospects, particularly in fast-growing regions such as
Asia-Pacific. Innovation crucial to staving off private label encroachment.
Industry response: Don’t
stop adding value
Manufacturers must become bolder and even more compelling in adding value to
their new product launches, while resisting the temptation to retreat into a single-
minded value-for-money proposition as they try to compete against private label.
Industry prediction:
Private label
Even though economic prospects are gradually improving, there is no guarantee that
consumers, especially those in developed markets, will return en masse to branded
products, especially now that private label has become more adept at adding value.
FINAL CONCLUSIONS
INDUSTRY DRIVERS & CONSTRAINTS CONTINUED
DEALING WITH CHALLENGING FACTORS

© Euromonitor International
43
Convenience remained one of the key consumer drivers in 2010, as consumers sought cost-effective alternatives to eating out.
Value for money, traditionally a prime concern for most consumers, has also become more important given lingering economic uncertainty. Still, premium products benefitted from a decline in foodservice expenditure.
Health considerations remain another key factor -- the use of “all natural” ingredients is expanding to emerging regions such as Eastern Europe and is underpinned by the growing number of middle-class consumers developing preferences close to those
that are already firmly established in mature economies. That said, health alone is not enough to increase consumer demand for established brands. Manufacturers are thus opting to advertise new offerings as meals offering both health and indulgence.
From a strategic point of view, food manufacturers are focusing their efforts on growth niches, especially in emerging economies. This trend is particularly relevant to Asia-Pacific and Latin America, where some chilled processed lines and other packaged food categories are being introduced for the very first time.
Convenience
Price / Value for Money
Health
Indulgence
KEY TRENDS AND DEVELOPMENTS
CONSUMERS DRIVERS

© Euromonitor International
44
THANK YOU FOR YOUR ATTENTION.
Matt Tripodi Government & Trade Relations Manager Phone: +1 312-922-1115 x 8205 [email protected]